evaluation of gantry angle optimization for imrt treatment
TRANSCRIPT

1
Master’s science Thesis
Evaluation of gantry angle optimization for IMRT treatment
planning systems using the Pareto front approach
Maria Thor
Supervisors: Anna Karlsson1, Claus Behrens
1, Per Engström
2, Crister Ceberg
3 and
Tommy Knöös2
1 Herlev University Hospital, Denmark
2 Lund University Hospital, Sweden
3 Lund University, Sweden
Medical Physics
Clinical Sciences, Lund
Lund University, spring 2009
2
Contents
1. Introduction ...................................................................................................................... 3
1.1 Purpose ......................................................................................................................... 3
1.2 Background .................................................................................................................. 3
1.3 Inverse dose planning ................................................................................................... 4
1.4 Optimization ................................................................................................................. 4
1.5 Sliding windows for Dynamic Delivery (DMLC) ....................................................... 5
1.6 Step and shoot for Segmented Delivery (SMLC) ........................................................ 5
1.7 Inverse dose planning in Eclipse and OMP ................................................................. 5
1.8 Gantry Angle Optimization (GAO) .............................................................................. 7
1.9 Trade-offs ..................................................................................................................... 7
1.10 Pareto evaluation ........................................................................................................ 8
2. Material and methods ................................................................................................... 9
2.1 General work flow ........................................................................................................ 9
2.2 IMRT inverse dose planning ...................................................................................... 10
2.2.1 Eclipse ..................................................................................................................... 10
2.2.2 OMP ........................................................................................................................ 11
2.3 Gantry Angle Optimization (GAO) ............................................................................ 11
2.3.1 Eclipse ..................................................................................................................... 11
2.3.2 OMP ........................................................................................................................ 11
2.4 Case 1 ....................................................................................................................... 111
2.5 Case 2 ......................................................................................................................... 12
2.6 Case 3 ......................................................................................................................... 13
3. Results ............................................................................................................................. 14
3.1 Pareto fronts ............................................................................................................... 14
3.1.1 Case 1 ...................................................................................................................... 14
3.1.2 Case 2 ...................................................................................................................... 15
3.1.3 Case 3 ...................................................................................................................... 17
3.2 Number of Monitor Units, #MUs ............................................................................... 19
3.3 GAO, Beam Geometry ............................................................................................... 20
4. Discussion ...................................................................................................................... 21
4.1. Case 1 ........................................................................................................................ 21
4.2. Case 2 ........................................................................................................................ 21
4.3. Case 3 ........................................................................................................................ 22
5. Conclusions ................................................................................................................... 23
5.1. General conclusions .................................................................................................. 23
5.2. Future aspects ............................................................................................................ 23
6. Acknowledgements .................................................................................................... 24
7. References ...................................................................................................................... 24
3
1. Introduction
1.1 Purpose
The aim of this study was to compare two inverse Treatment Planning Systems (TPSs);
Eclipse IMRT external beam planning system Version 8.5.0 (Eclipse), Varian Medical
systems, USA and Elekta’s Oncentra Masterplan 3.1 SP3 (OMP), Nucletron, The
Netherlands. These two systems constituted dynamic and segmented delivery technique. The
comparison was carried out by using the Pareto front approach. More specifically, the purpose
was to investigate IMRT with seven equally spaced beams with the most optimal seven gantry
angles generated by using Gantry Angle Optimization (GAO).
The evaluation was undertaken for three head and neck (H & N) cancer cases and was
based on the comparison of Pareto fronts generated by data extracted from the dose statistics
in the calculated Dose Volume Histograms (DVHs). The study intended to investigate the
trade-off between the average absorbed dose to the parotid gland that was overlapping with at
least one of the Planning Target Volumes (PTVs) and the dose coverage of that PTV.
1.2 Background
Each day, 20 000 people die as a consequence of cancer. Cancer has become one of the most
common reasons of death worldwide: it is the second most common reason of death in the
industrial countries and the third most common in the less developed countries [1, 2]. Cancer
has been treated using several methods. One reliable technique is external radiotherapy with
photons. Delanay et al. [3] has calculated that it would be beneficial for 52 % of all the cancer
patients to receive radiotherapy at some point during their illness. Beneficial for a palliative
intention is synonymous with easing the pain and for a curative intention it is equal to cure the
patient from the cancer. The aim with radiotherapy is to annihilate tumour structure, while
keeping the absorbed dose to normal structure as low as possible. This can also be translated
with achieving dose conformity in the PTV while keeping the absorbed dose to Organs at
Risk (OARs) low.
According to the International Commission on Radiation Units and measurements
(ICRU), heterogeneity between +7% and -5% of the prescribed dose in the PTV is acceptable
[4]. One of the limits with conventional radiotherapy concerns dose conformity, especially to
concave parts of the PTV that surrounds an inner sensitive structure, which in turn limits the
absorbed dose. The reason for this unconformity outside the PTV is due to the unmodulted
beams’ lack of ability to enclose the target volume and see the 3-D shape of it from each
direction [5]. Dose conformity in the PTV along with simultaneously maintenance of low
dose to a certain OAR is equivalent to an increase of the therapeutic ratio (TR) [5, 6]. The TR
measures how well tumour control Probability (TCP) and normal tissue complication
probability (NTCP) are maintained and is defined as the separation of the TCP and NTCP.
The work by Brahme et al. [7] concerning inverse dose planning of the optimum shape of
the dose distribution for each gantry position is considered as the starting-point for the present
Intensity Modulated Radiation Therapy (IMRT) techniques and has brought the development
of the radiotherapy to a new level [6, 8]. IMRT is an advanced method of conformal
radiotherapy and permits optimal dose distribution to the target volume while preserving
surrounding normal tissues [9]. The fluence in each beam is modulated by utilizing the Multi
Leaf Collimators (MLCs) and can either be delivered with segmented technique i.e. the dose
is only delivered while the leaves are being stationary by combining small elementary static
fields [9, 10], or dynamically where the beam is on during the movement of the leaves [5].
IMRT allows sparing of critical normal structures in e.g. the H & N region without
compromising dose to the tumour and is therefore desirable for several clinical applications
and essential in some [5, 11 and 12]. Further, H & N cancer is well suited and challenging for

4
IMRT since it includes many OARs [13], such as the spinal cord as well as the parotid glands.
Apart from this, the fact that superior target coverage compared to that of conformal
radiotherapy still remains [5, 14 and 15].
1.3 Inverse dose planning
The fluences to be delivered with the technique of IMRT are created by inverse treatment
planning which is an iterative process, created from the preferred dose distribution. The
operator put demands on minimum and maximum dose to the PTV and dose restrictions to
critical structures as well. An objective function for every structure of interest is introduced in
the optimization algorithm, which makes it possible to measure the progress in reaching the
desired solution [5].
In inverse treatment planning, the desired demands i.e. the objectives in a certain
treatment plan are first specified to generate a set of intensity modulated fluences from which
the dose distribution is calculated [16]. The main difference compared to traditional forward
planning lies in these demands rather than denoting the forward planning as a trial and error
process since the inverse planning also performs many trials or iterations. The capacity to
distinguish the three-dimensional (3D) shape of the target volume for each desired angle of
the inverse planning add up to a much more conformal dose distribution than that of the
unmodulated beams in the forward planning [5] (Figure 1).
Figure 1. The figure illustrates higher dose conformity while using inverse planning (B) for a defined target
compared to that of using traditional forward planning (A) e.g. by Courtesy of Varian Medical systems [16].
1.4 Optimization
As the optimization takes part, objective functions for every desired structure is introduced to
measure how far the result is from the desired solution. Often an overall voxel-by-voxel based
problem and a quadratic objective function is used [5] which includes a weighted sum of the
squared difference between the desired and the actual dose. The desired dose for the ith
voxel
can be denoted as des
id , id as the actual dose and the penalty for deviating from the desired
dose as is for N considered voxels. The objective function can then be defined by F (Eq. 1).
N
i
des
iii ddsF1
2 (Eq. 1)
The goal is to gradually achieve a dose distribution similar to that of the specified and desired
dose distribution. In some TPSs the penalties are user-defined by type as hard or soft
5
constraints for the targets and structures. Moreover, the penalties work outside the specified
dose goals for the target and the OAR [5].
To achieve an absorbed dose close to the specified dose distribution, the beam let weights
can be changed in a deterministic manner. The gradient technique is based on the calculated
changes in the beam lets and is such a minimizing process where the value of the objective
function is reduced until no alteration exists [5].
1.5 Sliding windows for Dynamic Delivery (DMLC)
The purpose of the adjacent high-density attenuating MLC is to protect areas outside the PTV
from irradiation in analogy with the used shielding blocks in conventional radiotherapy [5].
What is designated as Sliding windows or Dynamic MLC (DMLC) is that the opening, which
is formed by the pair of opposing MLC leaves, moves over the PTV as the beam is on [5]. In
DMLC, the leaves’ velocity can obtain various values anywhere between 0 up to the
maximum leaf speed [13].
The technique of the DMLC is dependant of the properties of the MLCs [5]. IMRT
delivered with DMLC requires a conversion of the radiation intensity map into a leaf
sequence which in turn controls the movement of the MLCs as the beam is on [17]. This
means that the delivery might be affected of the mechanical limits and irregularities of the
MLCs. When including this in the optimization chain it comes clear that the final actual dose
calculation may differ from that of the desired dose [5, 16]. The limits are especially grounded
on the rounded leaf ends that will result in a dose increase more than what is expected as a
consequence of the leaf transmission [5].
1.6 Step and shoot for Segmented Delivery (SMLC)
Segmented delivery technique (SMLC) means that the absorbed dose only is delivered while
the leaves are being stationary i.e. no dose is delivered as the leaves move to the next segment
position [5]. SMLC is often referred to as an extreme case of the DMLC [5]. Hence, the
leaves’ velocity is either zero or that of the maximum speed which leads to a minor degree of
freedom than that for the DMLC [13]. With SMLC the dose is delivered by several segments
and the aim of this segmentation is to reconstruct individual fluence distributions for each
beam as closely as possible by determining the properties of the MLC segments [18]. The
MLC segments are limited to a number of fluence levels among the beams where each level is
dissolved into smaller elements that each represents the opening for a leaf pair [18]. With a
large number of levels, SMLC approaches DMLC but this requires many segments of short
beam-on-times which may introduce a stability problem for some linear accelerators. The
openings of each leaf-pair are organized into segments and depend on the complexity of the
fluence [18]. The segments include properties like leaf position bounds, leaf over travel,
minimum gaps for opposing adjacent leaves and leaf separation for adjacent leaves within
each leaf bank as well [18].
A disadvantage of SMLC, when compared to DMLC, is that the intensity profile requires
the desired fluence intensity profile to be approximated by discrete levels of intensity [5]. The
leaf sequence is designed to deliver such a discrete profile.
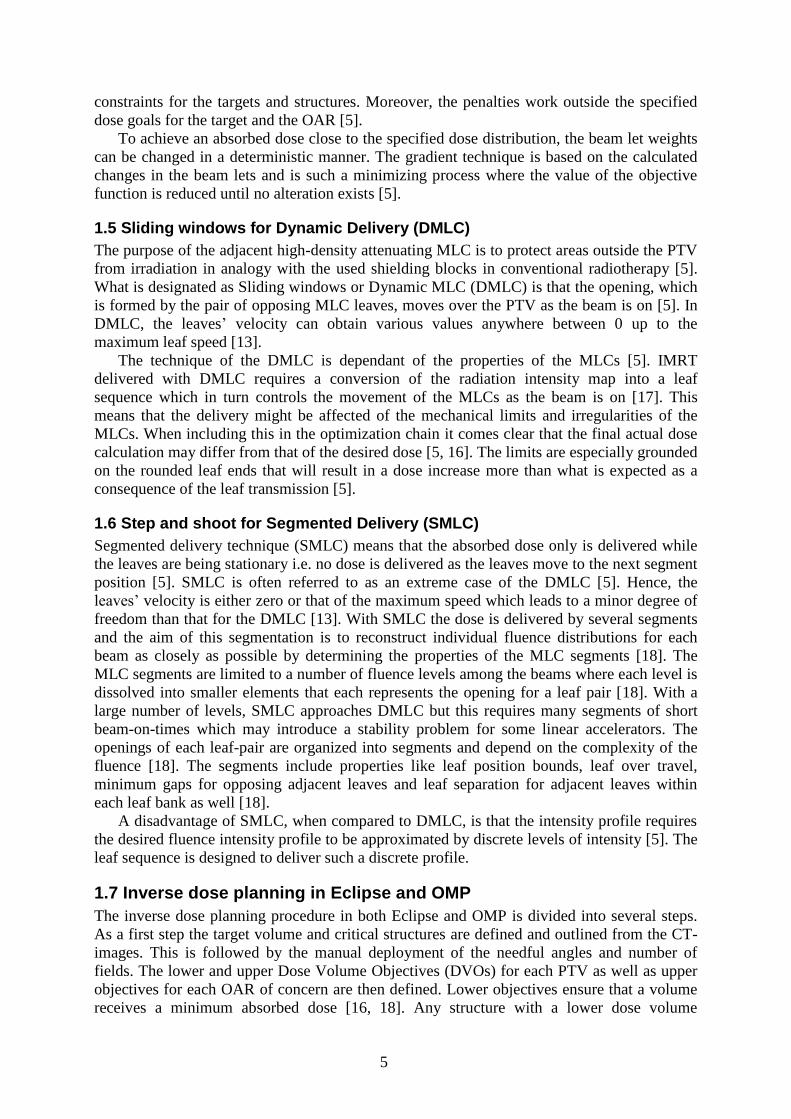
1.7 Inverse dose planning in Eclipse and OMP
The inverse dose planning procedure in both Eclipse and OMP is divided into several steps.
As a first step the target volume and critical structures are defined and outlined from the CT-
images. This is followed by the manual deployment of the needful angles and number of
fields. The lower and upper Dose Volume Objectives (DVOs) for each PTV as well as upper
objectives for each OAR of concern are then defined. Lower objectives ensure that a volume
receives a minimum absorbed dose [16, 18]. Any structure with a lower dose volume

6
objective is treated as a target [16, 18]. Upper objectives limit the absorbed dose to any
structure [16, 18 and 19] and can be used to enhance dose uniformity in target volumes. All
defined DVOs are weighted together and composite one objective function that is minimized
during the optimization. The specified geometry concludes the degree of dependence between
the objective functions during the optimization procedure [19].
In Eclipse, the DVOs, and their importance as well, are possible to alter during the entire
optimization until the prescribed dose objectives of the treatment plan are satisfied. The
iterations can be interrupted at any time during the optimization process, or can be left to
terminate on its own [16]. In OMP, the final importance is defined in advance along with a
stop criterion that commands the optimization process to stop after a defined number of
iterations [19].
The fluences in Eclipse are generated in two steps; the optimal fluences and the actual
fluences. The optimal fluences are an ideal modulation of the fields with lack of respect to
physical and mechanical limits of the MLCs [16, 18]. The optimal fluences are created by
adjusting the ray weights using a gradient optimization where each beam is divided into
elementary pencil beams and its dose contribution to the voxels in the target and critical
organs are calculated. As the optimal fluences are impossible to deliver, the conversion to an
actual fluence is necessary [16]. In Eclipse, the actual fluences include the limitations of the
leaf motions which are calculated through the Leaf Motion Calculator (LMC). This is an
iterative process where the actual fluence is estimated from the DMLC sequence until suited
agreement between the actual fluence and optimal fluence is achieved. To create a 3D
absorbed dose distribution for further evaluation, the final dose calculation might be
accomplished with the algorithm of Pencil Beam Convolution Version 8.1.14 (PBC) [16, 18].
The sparing of the normal tissues in the inverse treatment planning is considered different
in the TPSs. In Eclipse, a Normal Tissue Objective Parameter (NTOP) can be implicated into
the optimization. This especially prevents hot spots in the normal tissues and result in a sharp
dose gradient around the targets [16]. The shape of the NTOP is calculated as a function of
the distance from the target border. A priority on the NTOP determines the relative
importance of the normal tissue objective in relation to other optimization objectives and is
similar to that in the dose volume objectives. The NTOP is calculated for all body voxels. If
the plan contains several targets, the NTOP for a specific body point is calculated from all
targets, and the highest one is used in the optimization. Apart from the dosimetric properties
of the plan, the X- and Y fluence priorities of the smoothing objective function are defined.
These make it particularly possible to achieve more deliverable DMLC sequences [16]. The
degree of the modulation of the fluence intensity is always reduced when fluence smoothing
is applied [16]. Smoothing in the X-direction affects the separation between the two MLC
banks and smoothing in the Y-direction helps minimize tongue and groove effects since it
synchronises each bank’s MLCs.
OMP uses Direct Step-and-Shoot (Direct S & S) delivery. Direct denotes that the settings
for the MLCs are incorporated into the optimization process in agreement to satisfy the
defined objectives [20]. As the first number of iterations elapse, an ideal fluence distribution
is determined iteratively, followed by a conversion from the fluence distribution into MLC
segments. The optimization is carried out on the MLC positions directly [19]. Optimization
with Direct S & S requires two actions: the fluence optimization and the final absorbed dose
calculation [18]. The optimization can be repeated several times, with each repetition carried
out with new adjusted objectives, to achieve a better result and eventually an optimal solution
[19].
To be able to run the MLC segmentation in OMP, the maximum number of segments is
specified together with the additional settings, as for example minimum allowed segment area
and minimum number of open MLC leaves per segment. The segments not fulfilling these

7
requirements are rejected [18]. The process of creating segments is repeated with an adjusted
number of initial fluence levels until the desired number of segments are accomplished [18].
The accurate absorbed dose calculation is undertaken as the objective function does not
change much per iteration. This is exclusively performed in the first section of the specified
stop criterion for the number of iterations [18]. The optimization continues from the current
solution and subsequent iterations determine corrections to the fluence. As the stop criterion
for the number of iterations has been reached, the final absorbed dose calculation is carried
out with the PBC algorithm [18].
1.8 Gantry Angle Optimization (GAO)
In Eclipse, the GAO starts by generating the new angles. The goal is to find the optimal set
and position of angles [16]. This is performed, in accordance to the fluence optimization, by
iteratively optimizing the beam angles to satisfy the set of user defined DVOs. The GAO in
Eclipse is divided into two steps: global and local optimization. The global optimization
creates new coplanar or non-coplanar field geometries [16]. It originates from a set of
uniformly distributed beams to successively reach the number of beams that best fulfils the
defined objectives. The number of fields is then decreased by an iterative ranking that
excludes the number of fields of least relative importance. The local optimization commences
as the global optimization stops. This optimization only tries combinations of gantry angles
and do not change the number of fields. The local optimization can run without first running
the global optimization. However, the most profitable results from GAO are achieved by
running both the global and the local optimization [16].
Only local optimization is available in OMP [18]. This means that the GAO proceeds
from the originally beam geometry i.e. those angles used for the fluence optimization with the
procedure of the equidistant beam geometry. Though, the aim is still to receive a treatment
plan with more beneficial gantry angels with regard to the importance of the defined
objectives, compared to the beam geometry with equally spaced beams. The gantry angles are
updated during the optimization to improve the plan [19, 20]. When the gantry angles are
optimized, an approximate dose calculation is used to reduce the time needed [18]. Therefore
it is advocated to run the optimization process twice and in the latter process without selecting
the angle optimization option. The new gantry angles are generated from the first optimization
as the second optimization process is performed and the final absorbed dose is calculated, in
agreement with that of the fluence optimization in OMP, by using beam lets [18]. The final
dose calculation for GAO in Eclipse and OMP is again applying the PBC algorithm [16, 18].
1.9 Trade-offs
The parotid glands represent the comprehensive organ for the salivary production [21] and the
most prevalent late side effect after receiving radiation in the H & N region is total mouth
dryness i.e. Xerostomia [22]. A comparison between conventional radiotherapy techniques
and IMRT has proved a significantly higher incidence of Xerostomia for those patients treated
with conventional radiotherapy [23]. By exploring the relationships between dose
distributions in the parotid glands and the preservation of the salivary flow after radiation
therapy, a dose threshold for Xerostomia might be investigated. Such a study has been
performed by Eisbruch et al. [24] where an average absorbed dose threshold of 26 Gy (for the
ipsilateral parotid gland) and 24 Gy (for the contra lateral parotid gland) was found. The dose
threshold for the ipsilateral gland is also what is recommended as dose threshold for the
parotid glands in the clinical dose protocol, DAHANCA [25].
As the inverse dose planning is a compromise in accomplishing the desired prescribed
absorbed dose to the PTV and reducing high absorbed doses to the normal structures [5, 6 and
8], it is of interest to investigate this trade-off. Focusing on H & N cancer, a common situation
8
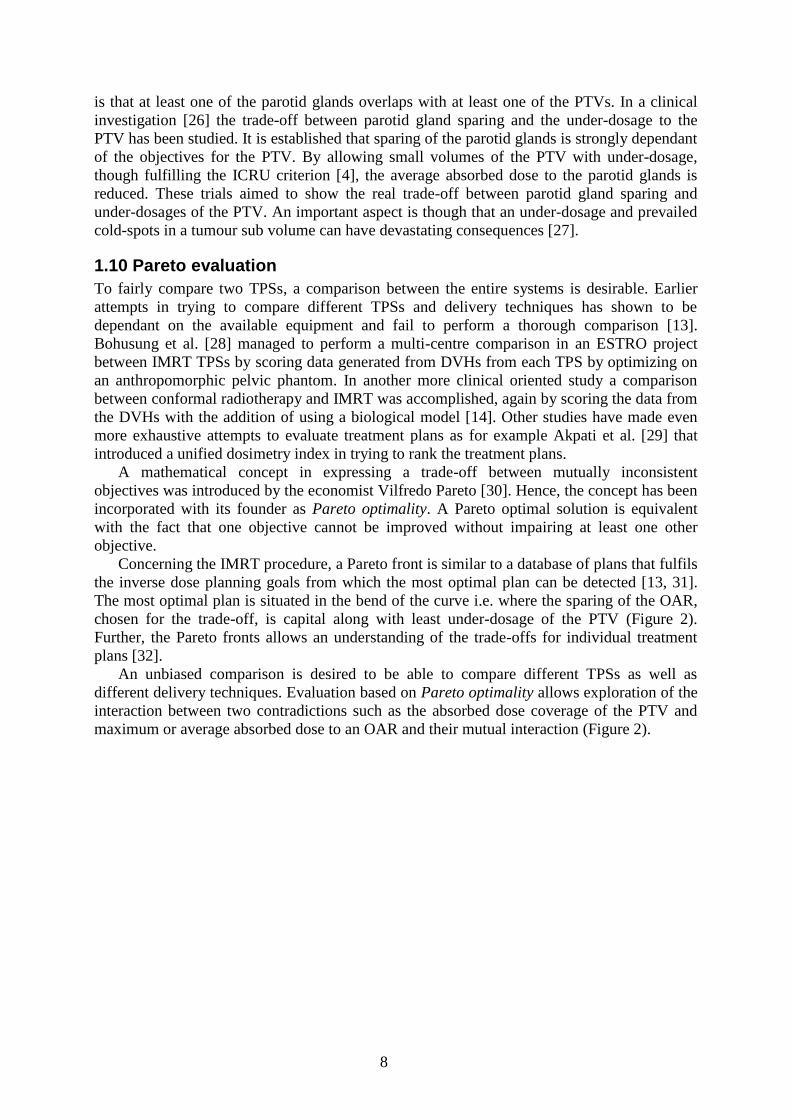
is that at least one of the parotid glands overlaps with at least one of the PTVs. In a clinical
investigation [26] the trade-off between parotid gland sparing and the under-dosage to the
PTV has been studied. It is established that sparing of the parotid glands is strongly dependant
of the objectives for the PTV. By allowing small volumes of the PTV with under-dosage,
though fulfilling the ICRU criterion [4], the average absorbed dose to the parotid glands is
reduced. These trials aimed to show the real trade-off between parotid gland sparing and
under-dosages of the PTV. An important aspect is though that an under-dosage and prevailed
cold-spots in a tumour sub volume can have devastating consequences [27].
1.10 Pareto evaluation
To fairly compare two TPSs, a comparison between the entire systems is desirable. Earlier
attempts in trying to compare different TPSs and delivery techniques has shown to be
dependant on the available equipment and fail to perform a thorough comparison [13].
Bohusung et al. [28] managed to perform a multi-centre comparison in an ESTRO project
between IMRT TPSs by scoring data generated from DVHs from each TPS by optimizing on
an anthropomorphic pelvic phantom. In another more clinical oriented study a comparison
between conformal radiotherapy and IMRT was accomplished, again by scoring the data from
the DVHs with the addition of using a biological model [14]. Other studies have made even
more exhaustive attempts to evaluate treatment plans as for example Akpati et al. [29] that
introduced a unified dosimetry index in trying to rank the treatment plans.
A mathematical concept in expressing a trade-off between mutually inconsistent
objectives was introduced by the economist Vilfredo Pareto [30]. Hence, the concept has been
incorporated with its founder as Pareto optimality. A Pareto optimal solution is equivalent
with the fact that one objective cannot be improved without impairing at least one other
objective.
Concerning the IMRT procedure, a Pareto front is similar to a database of plans that fulfils
the inverse dose planning goals from which the most optimal plan can be detected [13, 31].
The most optimal plan is situated in the bend of the curve i.e. where the sparing of the OAR,
chosen for the trade-off, is capital along with least under-dosage of the PTV (Figure 2).
Further, the Pareto fronts allows an understanding of the trade-offs for individual treatment
plans [32].
An unbiased comparison is desired to be able to compare different TPSs as well as
different delivery techniques. Evaluation based on Pareto optimality allows exploration of the
interaction between two contradictions such as the absorbed dose coverage of the PTV and
maximum or average absorbed dose to an OAR and their mutual interaction (Figure 2).

9
Figure 2. The Pareto optimality is illustrated by the dots and triangles situated on the two solid lines. The Pareto
concept is applied to a typical IMRT situation: a contradiction between an objective to an OAR and an objective
for the target. The plus sign denotes a more advantageous situation. Two TPSs are taken into account to visualize
the possibility of distinguish between Pareto fronts from different TPSs.
A more optimal treatment plan than the one first generated may exist (Figure 2). Hence, by
only comparing individual plans the comparison might be subjective. To avoid this fact,
several treatment plans could be generated to represent one TPS. Craft and Bortfeld [33]
inferred that N+1 treatment plans (where N is the number of objectives) is enough to sample a
Pareto front. Rather than comparing individual treatment plans, a comparison between the
Pareto fronts (Figure 2) may be employed as a potential tool when comparing different TPSs
and delivery techniques and by that evading the fact of a subjective judgement. Furthermore,
by exploring the interaction between the objectives, the operator receives the opportunity to
choose the most clinically relevant compromise between the two contradictions [15, 32].
Considering a comparison based upon Pareto evaluation, one successful example is the
comparison between IMRT and Intensity Modulated Proton Therapy (IMPT) by Steneker M
et al. [34].
2. Material and methods The initial work flow considers the inverse dose planning procedure in Eclipse and OMP. It
should be pointed out that the dose planning in OMP was performed by another fellow
Medical Physics student at Lund University Hospital. More specific optimization procedure
follows afterwards and concerns Eclipse and OMP separately. It should be pointed out that
this comparison was performed in the manner of enforcing a satisfactory coverage of the
target and simultaneously maintain the regulations according to DAHANCA [25].
2.1 General work flow
The comparison between Eclipse and OMP was carried out as a “black box comparison” i.e.
exclusively parameters were kept equal. Furthermore, the comparison was based upon three
10
different H & N cases: 1, 2 and 3. The cases were based on CT-data from three oropharynx
cancer patients, previously treated at Lund University Hospital (Case 1) and Herlev
University Hospital (case 2 and 3). Dose restrictions to all outlined structures were held
according to what is stated in the DAHANCA protocol [25]. In this study, every high-lighted
treatment plan met all the dose restrictions except for the parotid gland of interest. The
maximum desired average absorbed dose to the parotid gland was, according to these
regulations, 26 Gy with the end-point Xerostomia and the under-dosage to the PTV was
defined as more than 1 % of the relative volume receiving less than 95 %, but more than 90
%, of the prescribed dose [25]. The tumours (T) were classified according to an established
classification system [35]. This classification system has been updated to include
absence/presence of disease in regional lymph nodes (N) and absence/presence of distal
metastases (M) and is denoted as the TNM classification system [36].
The beam geometry was constituted of seven coplanar equidistant angles spread over 360°
(0°, 51.4°, 102.9°, 154.3°, 205.7°, 257.1° and 308.6°) with the equidistant beam geometry and
with those seven generated from GAO. The collimator angle was set to 2°. The dose per
fraction was 2 Gy with a total absorbed dose of 68 Gy for the first case and 66 Gy in the
remaining cases. If using a total absorbed dose of 68 Gy, the tumour extent is required to be 4
cm in some direction [25]. Photons with energy of 6 MV were used for all cases. Two linear
accelerators were utilized: one at Lund University Hospital and one at Herlev University
Hospital. The absorbed dose was calculated utilizing the PBC.
The average absorbed dose to the parotid gland in the trade-off was finally plotted as a
function of the under-dosage to the PTV. The under-dosage and the average absorbed dose
were received by extracted dosimetric data from the generated DVHs. These two parameters,
for the equidistant beam geometry and GAO, constituted one dot in the Pareto space.
However, treatment plans not fulfilling the clinical dose protocol, except for the overlapping
parotid gland, [25] were not considered. The number of treatment plans was likely to differ
between the cases due to the complexity in each case. The sufficient number of treatment
plans to sample a Pareto front was seldom N+1 (where N denotes the number of objectives) as
has been stated by Craft and Bortfeld [33].
2.2 IMRT inverse dose planning
2.2.1 Eclipse
Initially, an objective function for the PTVs was introduced. The objectives for the parotid
gland chosen for the trade-off were not yet applied. Though, this structure and other OARs
were already partially regarded with the NTOP. The optimization was ceased as the objective
function did not alter from iteration to iteration. Eventually, the LMC and the final absorbed
dose calculation were accomplished.
The treatment plan described above constituted the original plan from which all the other
plans were created. The plan was copied and the constraints for the PTVs were unmodified.
An upper objective function to the right parotid gland that was involved in the trade-off was
introduced. Additionally, what in Eclipse is entitled as, a spline [16] was applied for the
parotid gland of interest. The spline consisted of five objectives with different volume criteria.
In summary, six objectives were applied for the parotid gland of interest. The volume criteria
were set in order to manoeuvre the parotid average absorbed dose by only altering the
importance. The importance of the objectives for the parotid gland chosen for the trade-off
was varied in a systematically procedure in the creation of new treatment plans. The
objectives for the PTVs and the remaining OARs for every new treatment plan were identical
to the objectives in the original plan. The importance denotes the criteria for the DVOs that
are regarded when computing the modulated field fluences that are converted into deliverable

11
DMLC sequences [16]. Hence, all DVOs are weighted together and composite one objective
function that is minimized during the optimization to gradually achieve a dose distribution
similar to that of the specified and desired dose distribution [5].
2.2.2 OMP
In OMP Direct S & S was used. The optimization procedure in OMP began likewise that in
Eclipse by the definition of upper and lower objectives for the PTV with the designated
relative importance. Since OMP had no corresponding of the Eclipse NTOP, to e.g. suppress
hot-spots in the normal tissues, all the normal tissues were included in the beginning. This
was done by dedicating importance on their defined upper objectives. At this point the parotid
gland of interest was given a low importance. As an optional mode, a subtraction between the
outlined body part and the PTV was made in trying to mimic the Eclipse NTOP.
The optimization ran for a preset number of iterations. The maximum number of segments
along with the minimum allowed segment area and minimum number of open MLC leaves
per segment were adjusted before running the optimization. After receiving a satisfying
coverage of the PTV, the relative importance of the parotid gland was modified. The
importance to the remaining structures was unchanged.
2.3 Gantry Angle Optimization (GAO)
2.3.1 Eclipse
The original treatment plan settings, applied for the plans generated from the equidistant beam
geometry, were used to generate treatment plans with GAO as well. The GAO was performed
with the local and the global optimization procedure with the same objectives and relative
importance as for the equally spaced beams. The most adequate angle combination,
considering the importance of the objectives, was generated. The GAO started with a preset
number of angles of seven which was the desired number. As the optimal angles were evoked,
a new fluence optimization was carried out followed by the final absorbed dose calculation.
2.3.2 OMP
The GAO commenced by choosing the dedicated algorithm. All the treatment plans with
seven equally spaced beams were re-optimized with GAO. In analogy with GAO in Eclipse, a
standard optimization had to be performed with the new beam angles. Unlike Eclipse, OMP
only used local GAO. The last step after GAO included the final absorbed dose calculation.
2.4 Case 1
The first case that was used for the evaluation between Eclipse and OMP was based on CT-
data from a patient diagnosed with oropharynx cancer (Figure 3). The prescribed dose was 68
Gy to PTV-T and 50 Gy to PTV-E. The tumour was defined as a T4 and the nodule spread
was of N1 extent. This very first case represented a trade-off between the right parotid gland
and PTV-T. PTV-E was just on the border of the right parotid gland and was therefore not
taken into account in the trade-off. Case 1 included several different OARs apart from the
right parotid gland: left and right lens, optic nerves, the front and the back of the eye, orbit
and inner ear as well as the optic chiasm, brainstem, spinal cord, larynx and the left parotid
gland.

12
Figure 3. An original transverse CT-image section of case 1. The image high-lights the overlap between the
right parotid gland and the PTV-T. Apart from the overlap, PTV-E, the left parotid gland and the spinal cord are
showed as well.
2.5 Case 2
The second case was another oropharynx H & N cancer case, treated according to the
DAHANCA protocol [25] with a prescribed dose of 66 Gy to the PTV-T. This case included
several particular target structures with varying dose levels: PTV-T and PTV-N were
supposed to receive 66 Gy, PTV-E 60 60 Gy and PTV-E 50 50 Gy. The tumour was defined
as T2 and the nodule spread was of N1 extent. Optic chiasm and the right inner ear were also
outlined. Since they were far away from to the trade-off region they were not included in the
following illustration (Figure 4).

13
Figure 4. An original transverse CT-image section of the second H & N case, case 2. The image illustrates the
overlap between the right parotid gland, PTV-T, PTV-E 50 and PTV-E 60. The PTV-N is also visible along with
the spinal cord and the left parotid gland.
The trade-off in this case was between the right parotid gland and the target volumes; PTV-T,
PTV-E 60 and PTV-E 50. The contour of PTV-N was just on the border of the right parotid
gland. It was not necessary to put upper objectives on neither the left parotid gland nor the
optic chiasm or the right inner ear since these structures already fulfilled the regulations
according to DAHANCA [25] because of the geometry.
2.6 Case 3
The third and also the last case used in the evaluation was, in analogy with case 2 diagnosed
with oropharynx cancer with a prescribed dose to the PTV-T of 66 Gy (Figure 5) and treated
with the DAHANCA regulations [25]. This case included several other PTVs: PTV-N which
was supposed to receive 66 Gy as well and right and left PTV-E 50 that should be covered
with 50 Gy each. The tumour was defined as T2 and the nodule spread was N2B.
The overlap and therefore also the trade-off was constituted mostly by the left parotid
gland and the PTV-N and was hence taken into account in the optimization procedure. There
was also an overlap, though minor, between the right parotid gland and the right PTV-E 50.

14
Figure 5. An original transverse CT-image section for case 3. Note the overlap between the left parotid gland,
and PTV-N as well as the overlap between the same parotid gland and PTV E-50 left. The spinal cord, PTV-T
and the overlap between the right parotid gland and the right PTV-E 50 are illustrated as well.
3. Results
3.1 Pareto fronts
3.1.1 Case 1
In the following figures, of the generated Pareto fronts, the average absorbed dose to the
parotid gland of interest is plotted as a function of the under-dosage to the overlapping PTV.
The Pareto fronts that were produced from several treatment plans for case 1 are illustrated in
Figure 6. The case is further described in Material and methods in section 2.4.
15
Case 1, PTV-T
20
25
30
35
40
45
50
55
60
0 2 4 6 8 10
VPTV,D<95% [%]
<D> p
aro
tid
gla
nd
R [G
y]
ECLIPSE
ECLIPSE GAO
OMP
OMP GAO
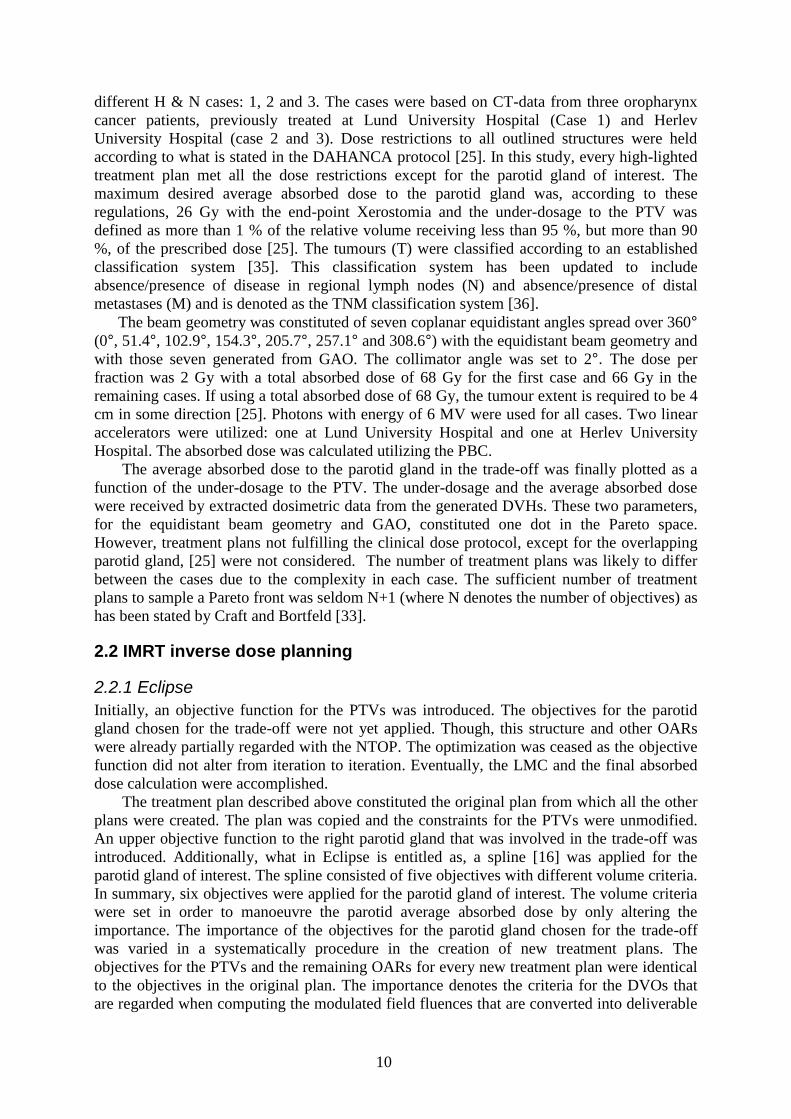
Figure 6. The figure illustrates the average absorbed dose to the right parotid gland as a function of the under-
dosage to PTV-T for case 1with equidistant beam geometry and GAO in Eclipse and OMP.
The figure above (Figure 6) indicates that every treatment plan followed the concept for a
Pareto evaluation, i.e. coverage of the PTV-T decreased while improving sparing of the OAR
chosen for the trade-off which i.e. the right parotid gland. The figure strengthens that it is
possible to distinguish between Pareto fronts from different TPSs. It also visualizes the
possibility to separate Pareto fronts with and without GAO.
3.1.2 Case 2
The Pareto fronts that were built out of numerous treatment plans for case 2 are visualized in
Figure 7. The case is described more in detail in Material and methods in section 2.5.

16
Case 2, PTV-T
20
25
30
35
40
45
50
55
60
0 2 4 6 8 10
VPTV,D<95% [%]
<D> p
aro
tid
gla
nd
R [G
y] ECLIPSE
ECLIPSE GAO
OMP
OMP GAO
Figure 7. The figure visualizes the average absorbed dose to the right parotid gland as a function of the under-
dosage to the PTV-T for case 2 with equidistant beam geometry and GAO in Eclipse and OMP.
The illustration (Figure 7) indicates that all the treatment plans followed the concept for a
Pareto evaluation i.e. coverage of the PTV-T again decreased while improving sparing of the
right parotid gland. It also strengthens the possibility to discriminate between Pareto fronts
generated from different TPSs and also elucidates that it is possible to separate Pareto fronts
with and without GAO. The following plots (Figure 8) are the result of decreased coverage of
the remaining PTVs (PTV-E 60, PTV-E 50 and PTV-N) while sparing of the right parotid
gland is improving which indicate that the remaining PTVs follow the concept for a Pareto
evaluation to a much lower extent (Figure 8).

17
Case 2, PTV-T
2025303540
45505560
0 2 4 6 8 10
VPTV,D<95% [%]
<D> p
aro
tid
gla
nd
R [
Gy]
ECLIPSE
ECLIPSE GAO
OMP
OMP GAO
Case 2, PTV-N
20
25
30
35
40
45
50
55
60
0 2 4 6 8 10
VPTV,D<95% [%]
<D> p
aro
tid
gla
nd
R [
Gy]
ECLIPSE
ECLIPSE GAO
OMP
OMP GAO
Case 2, PTV-E 60
20
25
30
35
40
45
50
55
60
0 2 4 6 8 10
VPTV,D<95% [%]
<D> p
aro
tid
gla
nd
R [
Gy] ECLIPSE
ECLIPSE GAO
OMP
OMP GAO
Case 2, PTV-E 50
20
25
30
35
40
45
50
55
60
0 2 4 6 8 10
VPTV,D<95% [%]
<D> p
aro
tid
gla
nd
R [
Gy] ECLIPSE
ECLIPSE GAO
OMP
OMP GAO
Figure 8. The four plots above visualize the average absorbed dose to the right parotid gland as a function of the
under-dosage to the PTV-E 60, PTV-E 50, PTV-T again and PTV-N for case 2with equidistant beam geometry
and GAO in Eclipse and OMP.
3.1.3 Case 3
The Pareto fronts for the last case, case 3, that were created from several treatment plans are
elucidated in Figure 9. The fronts represent the trade-off between the left parotid gland and
the under-dosage to PTV-N. This case was, in analogy with case 1 and 2, used for comparing
OMP and Eclipse with equidistant beam geometry and GAO and is explained more in
Material and methods in section 2.6.
18
Case 3, PTV-N
20
25
30
35
40
45
50
55
60
0 2 4 6 8 10
VPTV,D<95% [%]
<D> P
aro
tid
gla
nd
L [G
y] ECLIPSE
ECLIPSE GAO
OMP
OMP GAO
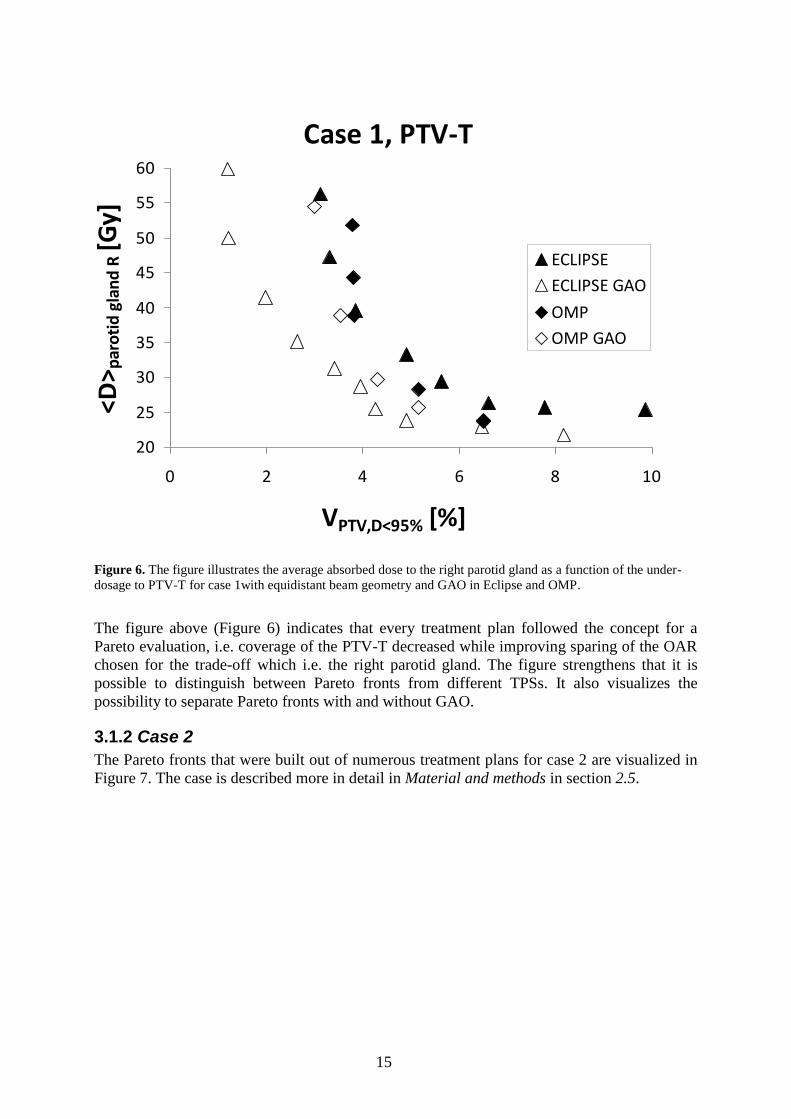
Figure 9. The figure illustrates the average absorbed dose to the left parotid gland as a function of the under-
dosage to the PTV-N for case 3 with equidistant beam geometry and GAO in Eclipse and OMP.
In Figure 9 all treatment plans again seemed to follow the concept for a Pareto evaluation, i.e.
coverage of the PTV-N decreased while improving sparing of the left parotid gland. The
figure once again states that it is possible to distinguish between Pareto fronts from different
TPSs and strengthen the possibility to separate Pareto fronts with and without GAO. Figure
10 includes the plots that are the effect of decreased coverage of the remaining PTVs (again
PTV-N, PTV-E dx, PTV-E sin and PTV-T) while improving sparing of the left parotid gland.
The majority of these PTVs did not follow the concept for a Pareto front evaluation.

19
Case 3, PTV-N
20
25
30
35
40
45
50
55
60
0 2 4 6 8 10
VPTV,D<95% [%]
<D>
Par
oti
d g
lan
d L
[G
y] ECLIPSE
ECLIPSE GAO
OMP
OMP GAO
Case 3, PTV-E dx
20
25
30
35
40
45
50
55
60
0 2 4 6 8 10VPTV,D<95% [%]
<D> P
aro
tid
gla
nd
L [
Gy]
ECLIPSE
ECLIPSE GAO
OMP
OMP GAO
Case 3, PTV-E sin
20
25
30
35
40
45
50
55
60
0 2 4 6 8 10
VPTV,D<95% [%]
<D> P
aro
tid
gla
nd
L [
Gy]
ECLIPSE
ECLIPSE GAO
OMP
OMP GAO
Case 3, PTV-T
20
25
30
35
40
45
50
55
60
0 2 4 6 8 10
VPTV,D<95% [%]
<D> P
aro
tid
gla
nd
L [
Gy]
ECLIPSE
ECLIPSE GAO
OMP
OMP GAO
Figure 10. The figures visualize the average absorbed dose to the left parotid gland as a function of the under-
dosage to the PTV-N again, PTV-E dx, PTV-E sin and PTV-T for case 3 with equidistant beam geometry and
GAO in Eclipse and OMP.
3.2 Number of Monitor Units
Apart from the Pareto fronts, the number of monitor units (MUs) was studied for the dynamic
(Eclipse) and the segmented (OMP) delivery technique separately. These are summarized in
Table 1-3. The number of MUs is summarized as an average value for all the created
treatment plans in each case. The tables visualize the number of MUs for each case for
Eclipse and OMP with the equidistant beam geometry and GAO, as well as the decrease
expressed in per cent, in number of MU using GAO.
Case 1
MUs OMP Eclipse
Equidistant 629 1082

20
GAO 620 916
Decrease [%] 1.5 15.4
Table 1. The number of MUs for Eclipse and OMP for case 1 with the equally spaced beams and GAO together
with the decrease, expressed in per cent, in number of MUs using GAO.
Case 2
MUs OMP Eclipse
Equidistant 493 728
GAO 421 683
Decrease [%] 14.6 6.1
Table 2. The number of MUs for Eclipse and OMP for case 2 with the equally spaced beams and GAO together
with the decrease, expressed in per cent, in number of MUs using GAO.
Case 3
MUs OMP Eclipse
Equidistant 604 1083
GAO 566 775
Decrease [%] 6.3 28.4
Table 3. The number of MUs for Eclipse and OMP for case 3 with the equidistant beam geometry and GAO and
the decrease, expressed in per cent, in number of MUs using GAO.
The tables above suggest that GAO lowers the number of MUs for both Eclipse and OMP for
all treated cases. The number of MUs required to create a treatment plan was, in an analogy
with what has been stated in earlier studies [10, 37], much fewer for the SMLC (OMP).
3.3 GAO, Beam Geometry
Since this Master’s thesis primarily focused on comparison between different TPSs and
different delivery techniques and mostly between equally spaced beams and GAO, the
generated beam geometries for case 1-3 were studied in more detail. The beam geometries
were represented by an average value of all of the treatment plans in every case for each TPS.
Apart from the beam geometries generated from GAO, the equally spaced beams were
included to be able to high-light the difference in the angle settings. The equidistant beam
geometry (solid grey line), the beam geometry from OMP (dots) and the beam geometry from
Eclipse (shaded lines) were applied to an original transverse CT-image (Figure 13).

21
Figure 11. The figure indicates the different beam geometries generated from OMP (dots) and Eclipse (shaded
line) along with the equidistant beam geometry (sold grey) for, from left to right, case 1, 2 and 3.
The beam geometries (Figure 11) imply that OMP and Eclipse generated different beam
geometries. For example the beam geometry from Eclipse for case 2 avoids the right parotid
gland to a higher extent than OMP. For case 3 it is stated that Eclipse increase sparing of the
left parotid gland more than OMP since the beam setting again avoids placing beams on the
gland in the trade-off. For case 1 only OMP differ from the equidistant angle settings.
4. Discussion
4.1. Case 1
This H & N case indicates the ability of distinguish between Pareto fronts from different TPSs
with different delivery techniques and more particular between the GAO and equidistant
beam geometry (Figure 6). The separation of the four Pareto fronts confirms that the systems
studied are rather similar. Thus, the performance is improved considerably by using GAO.
What also is notable is that the Pareto fronts that originate from Eclipse are lower situated.
This indicates that the Pareto fronts from Eclipse are more favourable since the dose coverage
of the PTV is maintained to a higher extent as higher importance is applied to the right parotid
gland. The most preferable front, comparing all the fronts, is the one generated using GAO in
Eclipse.
The fronts originating from Eclipse seem to appear in a more structured pattern than those
from OMP. Though, the under-dosage of the PTV is almost of the same extent for the Pareto
fronts, except for the lower average absorbed dose to the right parotid gland which indicates a
more favourable front.
The number of MUs is lowered while introducing GAO and the most obvious decrease is
visible when utilizing GAO in Eclipse. Additionally, using GAO result in different beam
geometries to that of the equidistant beam settings. This appearance is most legible for OMP.
The decrease was around 2 % for OMP and 15 % for Eclipse. Further, the number of MUs
demanded for creating a treatment plan was much fewer for SMLC (OMP) which is has been
stated earlier by others [10, 37].
4.2. Case 2
Also case 2 (Figure 7) strengthens that it is possible to distinguish between Pareto fronts from
different TPSs with different delivery techniques and more particular between GAO and

22
equally spaced beams. The systems studied are of rather similar character which is provided
by the separation of the four Pareto fronts, thus utilizing GAO contributes to an ameliorated
performance. The Pareto fronts that originate from GAO in Eclipse are more preferable than
those from GAO in OMP since the dose coverage of the PTV is maintained to a higher extent
as higher importance is applied to the right parotid gland. With equidistant beam geometry the
same behaviour appears in the beginning of the fronts. Though, the bend of the Pareto front
from OMP is situated more advantageous. Nevertheless, using GAO with Eclipse again
results in the most adequate front. This case (Figure 7) is an example of a slight more
complex case considering all the existing PTVs that are likely to have influence in the trade-
off. Apart from the highlighted PTV (PTV-T), the remaining PTVs do not always follow the
concept for a Pareto evaluation.
Besides the fact with more favourable fronts from GAO, the decrease in number of MUs
is revealed: around 14 % for OMP and 6 % for Eclipse. Though, the necessary number of
MUs for one treatment plan was much fewer for SMLC (OMP) which is a rather well known
appearance [10, 37].
When comparing the beam geometries generated from GAO for Eclipse and OMP it is
elucidated that the systems generate different beam geometries. In this case Eclipse appears to
be the more advantageous TPS while considering the sparing of the right parotid gland.
4.3. Case 3
The results from the generated Pareto fronts (Figure 9) declare that also case 3 followed the
concept for a Pareto evaluation and suggesting TPSs of rather similar character, even though
GAO seems to be more advantageous. Likewise what did appear for the earlier cases and
worth pointing out is that the Pareto fronts generated from GAO in Eclipse are more
preferable than GAO in OMP. With equally spaced beams the same behaviour was observed
in the beginning of the fronts. Though, the front from OMP is situated more desirable in the
bend. The most preferable front, if comparing all the fronts, is again the one generated using
GAO in Eclipse.
With this case Eclipse was having problems in accomplishing the desired clinical goal of
an average absorbed dose to the left parotid gland of 26 Gy [25]. This could presumably be
supplied with higher importance on the parotid gland. The current case (Figure 9) is a more
complex case than both Case 1 (Figure 6) and Case 2 (Figure 7) since all the TPSs have
difficulties in accomplishing a desirable average absorbed dose of 26 Gy [25] to the parotid
gland of interest. This is also visualized by the steepness in the Pareto fronts (Figure 9).
Though, due to the overlap and the existing hierarchy for the PTVs and OARs [25] one would
not be able to spare this parotid gland clinically.
All the Pareto fronts for the PTVs (Figure 10) do not follow the concept for an evaluation
grounded on the Pareto concept. It might depend on that they actually are affected by
objectives on other adjacent structures as for example: the right PTV-E 50 is included in a
trade-off between the right parotid gland.
In accordance with the results for case 1 and 2, the number of MUs for creating a
treatment plan decrease by utilizing GAO. The decrease for OMP is about 6 % and for Eclipse
around 28 %. The number of MUs demanded for creating a treatment plan is, in
correspondence with what has been concluded before, much fewer for SMLC (OMP) [10, 36].
The TPSs produce different beam geometries. Again Eclipse is the most favourable
system with the beam angle settings if regarding sparing of the left parotid gland.
This advantage would probably be confirmed in a more convenient manner for Eclipse if
higher importance is applied to the left parotid gland.
23
5. Conclusions
5.1. General conclusions
A comparison between different TPSs and different delivery techniques has appeared to be
possible with a comparison represented by the Pareto front approach. Hence, Pareto
evaluation is evidently a feasible comparison method. These findings correspond well to the
aim of this study which partially was to compare two inverse TPSs.
Overall, the sparing of the parotid gland of interest can not be improved without target
coverage being compromised. These two criteria represent two conflicting goals which is the
investigating aim of the Pareto concept. The interaction between these criteria is thus high-
lighted by the entire database of all of the treatment plans i.e. the Pareto fronts.
Apparently the under-dosage is of quite same extent between the modalities for each
specific case but with the difference of more sparing of the parotid gland in the trade-off
which results in a superior Pareto front. The tendencies are expected to be the same if
applying the Pareto concept to other cases where the trade-off concerns different sensitive
structures. The treated cases represent different extent of complexity as visualized by both the
steepness in the Pareto fronts and the difficulties in reaching a desirable average absorbed
dose, without loosing target coverage, of 26 Gy to the parotid gland of interest [25].
The evaluation has verified that GAO contributes to plans with least under-dosage to the
overlapping PTV together with the lowest absorbed dose to the parotid gland of interest i.e.
the performance is improved by using GAO. The second part of the aim, i.e. to investigate
IMRT with seven equally spaced beams with the most optimal seven gantry angles generated
by using GAO, is also fulfilled. Besides, the GAO brings lowered number of MUs. Eclipse
and OMP result in varied beam geometries when allowing them to generate seven gantry
angles. The variations are of different character in the treated cases. A small difference from
that of the equidistant beam geometry still results in a visible separation between the Pareto
fronts.
5.2. Future aspects
For further investigation when comparing between different TPSs and delivery techniques it
is possible to study the amount of sparing of sensitive structures in the previous trade-offs and
in what extent it is done. It would also be interesting to focus on other end-points apart from
Xerostomia which was studied in the current cases. The amount of sparing together with
various end-points could possibly be studied by including biological models. One such model
is the EUD-based model proposed by Niemierko et al. [38] that suggest a tool to be able to
calculate the NTCP, and the TCP as well, for a particular treatment plan. The Pareto concept
along with more specific data concerning the NTCP for the parotid gland and the TCP for the
tumour might be promising in the development of the comparison.
In addition, the Pareto approach may also be applied for the same accelerators along with,
for example, the implementation of one TPS’s beam geometry into another to reduce the
number of degrees of freedom. This idea can be strengthen by a study by V Marchesi et al. [9]
where the modulation of SMLC and DMLC for the same accelerator was examined.
Similar cases with equal anatomy overlap and number of OARs could be used to study the
reproducibility. Hence, different type of cases may be of more interest to illustrate the
broadness in the comparison. In conclusion, more cases are demanded to confirm the findings
in this Thesis. The broadness in the comparison may also be favoured by implementing other
OARs in the trade-off. This could be performed to evaluate the assumption of similar
tendencies between the Pareto fronts. In this first comparison this was not yet done since
generating only one Pareto front is extremely time-consuming.

24
6. Acknowledgements I would like to bring out my greatest thanks to the people involved in this Master’s thesis
cooperation between Herlev University Hospital and Lund University Hospital. At first, my
colleague in Lund i.e. the other involved Master’s Thesis student, Hunor Benedek, should be
mentioned since he was the one that assisted me with the results from OMP. The supervisors
in Herlev, Anna Karlsson and Claus Behrens, deserve a thanks for all the support, backing-up
and guidance in Eclipse on location. Last, though not least, I am grateful for the feed-back,
ideas and guidance during meetings and while being in Lund from the supervisors there: Per
Engström, Crister Ceberg and Tommy Knöös.
7. References [1] American Cancer Society, Global Cancer Facts & Figures 2007, Estimated Number of
New Cancer Cases by World Area, Legal Department of the American Cancer Society, 250
Williams St., NW, Atlanta, GA 30303-1002, pp.1-7, 2007
[2] www.socialstyrelsen.se, Socialstyrelsens statistikdatabas, dödsorsaksstatistik, antal döda
[3] Delaney G et al. The role of radiotherapy in cancer treatment: Estimating optimal
utilization from a review of evidence-based clinical guidelines, Collaboration for Cancer
Outcomes Research and Evaluation (CCORE), Liverpool Hospital, Sydney, Australia,
Vol.107, No. 3, pp.660, 2006
[4] Griem L. M, Prescribing, recording and reporting photon beam therapy by International
Commission on Radiation Units and Measurements (ICRU), ICRU Report
50, Division of
Radiation Biophysics Department of Radiation Oncology Massachusetts General Hospital
Boston, MA 02114, Radiation research, Vol.138, No.1, pp.146-147, 1994
[5] Metcalfe P et al. The physics of radiotherapy X-rays and electrons, Medicals physics
publishing, Madison Wisconsin, pp.472-492, 2007
[6] Hall J et al. Radiobiology for the radiologist 6th
edition, Lippincott Williams & Wilkins,
Philadelphia, 2006, pp.303-304
[7] Brahme A et al. Optimization of stationary and moving beam radiation therapy
techniques, Department of Radiation Physics, The Karolinska Institute and University of
Stockholm, Box 60204. S-104 01 Stockholm, Radiotherapy and Oncology, Vol.12, No.2, pp.
129-140, 1988
[8] Intensity Modulated Radiation Therapy Collaborative Working Group, Intensity-
modulated radiotherapy: current status and issues of interest, International Journal of
radiation Oncology*Biology*Physics, Vol.51, No. 4, pp.880-914, 2001
[9] V Marchesi et al. abstract in English: Comparative dosimetry study of two methods of
intensity modulation performed on the same accelerator, Unité de radiophysique, CRLCC
Alexis-Vautrin, avenue de Bourgogne, 54511 Vandoeuvre-lès-Nancy cedex, France,
Cancer/Radiotherapy, Vol. 4, No.6, pp. 443-454, 2000

25
[10] Chui C.S et al. Delivery of intensity-modulated radiation therapy with a multileaf
collimator: comparison of step-and-shoot and dynamic leaf motion methods, Department of
Medical Physics, Memorial Sloan-Kettering Cancer Center, New York, NY 1002 1 USA
Engineering in Medicine and Biology Society, 2000: Proceedings of the 22nd Annual
International Conference of the IEEE , Vol.1, pp.460-462, 2000
[11] Porceddu S et al. Radiation Oncology Intensity-modulated radiotherapy: Examples of its
utility in head and neck cancer, Division of Radiation Oncology, Peter MacCallum Cancer
Centre, Melbourne, Australia, Australasian Radiology, Vol. 48, No.1, pp 51–57, 2004
[12] Ding M et al. Dosimetric comparison between 3DCRT and IMRT Using Different
Multileaf Collimators in the Treatment of Brain Tumours, Radiation Oncology Department,
University of Colorado Heath Science Centre, Aurora, CO, Medical Dosimetry, Vol. 34, No.
1, pp. 1-8, 2009
[13] Jatinder R. Palta and Rockwell M. T, Intensity-Modulated Radiation Therapy, The State
of the Art, American association of Physicists in Medicine, Medical Physics Publishing,
Madison, Wisconsin, 2003
[14] Cozzi L et al. Three dimensional conformal vs. Intensity-modulated radiotherapy in
head-and-neck cancer patients: comparative analysis of dosimetric and technical parameters,
pp.7-9, Medical physics unit, oncology institute of southern Switzerland, Bellinzona,
Switzerland, Vol.58, No.2, pp.617-624, 2004
[15] Thieke C et al. A new concept for interactive radiotherapy planning with multicriteria
optimization: first clincal evaluation, Department of Radiation Oncology, Deutches
Krebsforschungszentrum, Heidelberg, Germany, Vol. 85, No.2, pp.292.-298, 2007
[16] Varian Medical systems, Eclipse IMRT external beam planning system version 8.5.0,
Copyright © 2008
[17] Kamath S et al. Algorithms for optimal sequencing of dynamic multileaf collimators,
Department of Computer and Information Science and Engineering, University of Florida,
Gainesville, FL, USA, Phys. Med. Biol, Vol. 49, No.1, pp. 33–54, 2004
[18] Nucletron, Oncentra® MasterPlan v.3.1 SP3, Physics and Algorithms
[19] Nucletron, Oncentra® MasterPlan v3.1 SP3, Help
[20] Nucletron, Oncentra® MasterPlan v3.1 SP3, User Manual
[21] Cooper J.S et al. Late effects of radiation therapy in the head and neck region, NYU
Medical Centre, New York, NY, International Journal of Radiation
Oncology*Biology*Physics, Vol.67, No.31, pp.1141-1164, 1995
[22] Harrison LB et al. Detailed quality of life assessment in patients treated with primary
radiotherapy for cancer of the base of the tongue, Brachytherapy Service, Department of
Radiation Oncology, The Memorial Sloan-Kettering Cancer Centre, 1275 York Avenue, New
York, New York 10021, John Wiley & Sons, Inc. Head Neck, Vol.19, No.3, pp.169-175,
1997

26
[23] Chao C K. S et al. Protection of Salivary Function by Intensity-Modulated Radiation
Therapy in Patients With Head and Neck Cancer, Radiation Oncology Centre, Washington
University, School of Medicine, St Louis, MO Seminars in Radiation Oncology, Vol. 12, No
1, pp. 20-25, 2002
[24] Eisbruch A et al. Dose, volume, and function relationships in parotid salivary glands
following conformal and intensity-modulated irradiation of head and neck cancer - The
critical volume model, Departments of *Radiation Oncology, Pathology, and Oncology,
University of Michigan, Ann Arbor, MI, International Journal of Radiation
Oncology*Biology*Physics, Vol.45, No.3, pp.577-587, 1999
[25] http://www.dahanca.dk/get_media_file.php?mediaid=57, DAHANCA 2004
Retningsliner for strålbehandling af hoved-hals cancer (Cavum Oris, Pharynx, Larynx)
inklusiv IMRT vejledning
[26] Wilhelmius J.M DE Kruijf et al. Quantification of the trade-off between parotid gland
sparing and planning target volume under dosages in clinically node-negative head-and neck
intensity modulated radiotherapy, Department of Radiation Oncology, Erasmus MC-Daniël
den Hoed, Rotterdam, The Netherlands, International Journal of Radiation
Oncology*Biology*Physics, Vol.68, No.1, pp.136-143, 2007
[27] Tomé WA et al. On cold spots in tumour sub volumes, Department of Human oncology,
University of Wisconsin Medical School, Madison, Wisconsin, Med Phys, Vol.29, No. 7,
pp.1590-1598, 2002
[28] Bohsung J et al. ESTRO project, IMRT Treatment planning: A comparative inter-system
and inter-centre planning exercise of the QUASIMODO group, Department of Radiotherapy,
Charité Campus Mitte, Berlin, Germany, Vol.76, No.3, pp.354-361, 2005
[29] Akpati H et al. Unified dosimetry index (UDI): a figure of merit for ranking treatment
plans, Department of Radiation Oncology, Stony Brook University School of Medicine,
Stony Brook New York, U.S.A, Journal of Applied Clinical Medical Physics, Vol.9, No.3,
Summer 2008
[30] Pareto V, Cours d’Économie Politique, F.Pichou, Lausanne and Paris, Vol.2, 1897
[31] Hong T.S et al. Multicriteria Optimization in Intensity-Modulated Radiation Therapy
Treatment Planning for Locally Advanced Cancer of the Pancreatic Head, International
Journal of Radiation Oncology*Biology*Physics, Vol. 72, No.4, 2008
[32] Craft D et al. Exploration of tradeoffs in intensity-modulated radiotherapy, Department
of Radiation Oncology, Massachusetts General Hospital and Harvard Medical School,
Boston, MA02114, Vol.50, No.24, pp.5857-5868, 2005
[33] Craft D and Bortfeld T, How many treatment plans are needed in an IMRT multi
objective plan database? Department of Radiation Oncology, Massachusetts General Hospital
and Harvard Medical School, Boston, MA 02114, USA, Phys Med Biol, Vol.53, pp.2785-
2796, 2008
27
[34] Steneker M et al. Intensity modulated photon and proton therapy for the treatment of
head and neck tumours, Department of Radiation Medicine, Paul Scherrer Institute, Villigen,
Switzerland, Radiation and Oncology, Vol. 80, No.2, pp.263-267, 2006
[35] Hermanek P and Sobin LH, TNM classification of malignant tumours, 4th
ed. Ed.
International Union Against Cancer (UICC), Berlin, Heidelberg, New York Springer Verlag,
1992
[36] Hermanek P, Hutter RVP, Sobin LH et al., TNM Atlas. Illustrated guide to the
TNM/pTNM Classification of Malignant Tumours, Heidelberg:Springer-Verlag Berlin
Heidelberg, 1997
[37] Alaei P et al. Comparison of dynamic and step-and-shoot intensity-modulated radiation
therapy planning and delivery, University of Minnesota, Minneapolis, MN USA, Medical
Dosimetry, Vol. 29, No. 1, pp. 1-6, 2004
[38] Niemierko A et al. A free program for calculating EUD-based NTCP and TCP in
external beam radiotherapy, Department of Radiation Oncology, Massachusetts General
Hospital, Boston, MA, USA, Physica Medica, Vol.23, No.3-4, pp.115-125, 2007