evaluation of full brain parcellation schemes using the neurovault database of statistical maps
TRANSCRIPT

EVALUATION OF FULL BRAIN PARCELLATION SCHEMES
USING THE NEUROVAULT DATABASE OF STATISTICAL MAPS
Krzysztof J. Gorgolewski, Arielle Tambini, Joke Durnez, Vanessa V. Sochat, Joe Wexler, Russell A. Poldrack


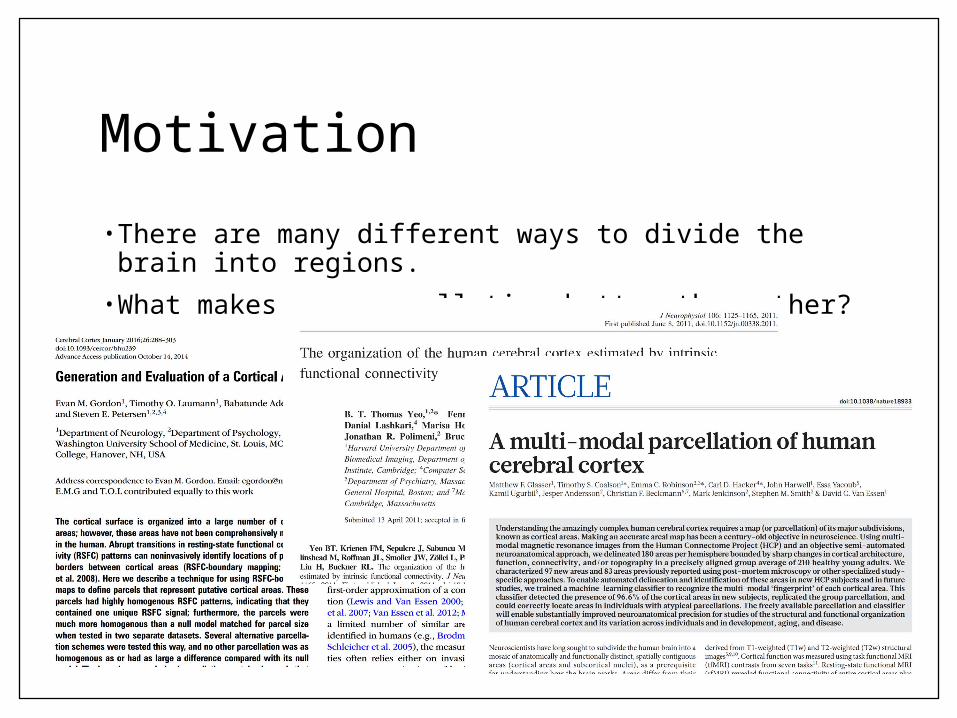
Motivation•There are many different ways to divide the brain into regions.
•What makes one parcellation better than other?

Evaluate different parcellation scheme using
task fMRI activation patterns
Goal

Methods: Included atlases
Name Number of parcels
Coverage Properties
Gordon et al. 333 cortical asymmetricalAAL 116 cortical +
subcorticalasymmetrical
Collins et al. 9 cortical + subcortical
symmetrical
Yeo et al. 7 or 17 cortical symmetrical networks
Glasser et al. 180 or 360 cortical symmetrical or asymmetrical
Harvard-Oxford 58 cortical + subcortical
symmetrical
Brainnetome 246 cortical + subcortical
asymmetrical

Methods: Metrics• A good parcellation should accurately delineate activation patterns from task fMRI
• Variance of T/Z values within parcels should be minimized
• Homogenous brain areas should be covered by minimal number of parcels

Methods: Procedure1. Gather a large collection of statistical
maps2. For each map:
1. Calculate mean within parcel variance2. Calculate between parcel variance3. Between/within parcel variance ratio
should be higher for better parcellations

Methods: Statistical maps• Inclusion criteria:
• From a published study• In MNI space• Unthresholded• Task fMRI
Final collection:• 625 statistical maps from 79 papers• Representing 87 different tasks

Methods: Included statistical maps

Methods: Confounds and how to deal with themConfounds:1. Parcellation with more regions have smaller parcels
and thus lower within parcel variance2. Each input map has different smoothness
Instead of asking: How well does this parcellation represent this activation pattern?
Ask:How this parcellation represents this activation pattern in contrast to a random pattern?

Methods: Null distributionFor each statistical map:1. Estimate smoothness 2. Shuffle values3. Smooth4. Repeat x1000
Example statistical map
Randomized statistical map with matched smoothness

Within parcel variance
big parcels small parcels

Normalizationbefore after

Normalized between/within parcel variance

Top symmetricalName Between/within parcel
variance [z-score]Within parcel variance[z-score]
Yeo et al. (17) 25.84 -5.43
Yeo et al. (7) 24.19 -2.77
Glasser et al. (180) 22.62 -7.89
Harvard-Oxford 14.80 -5.04
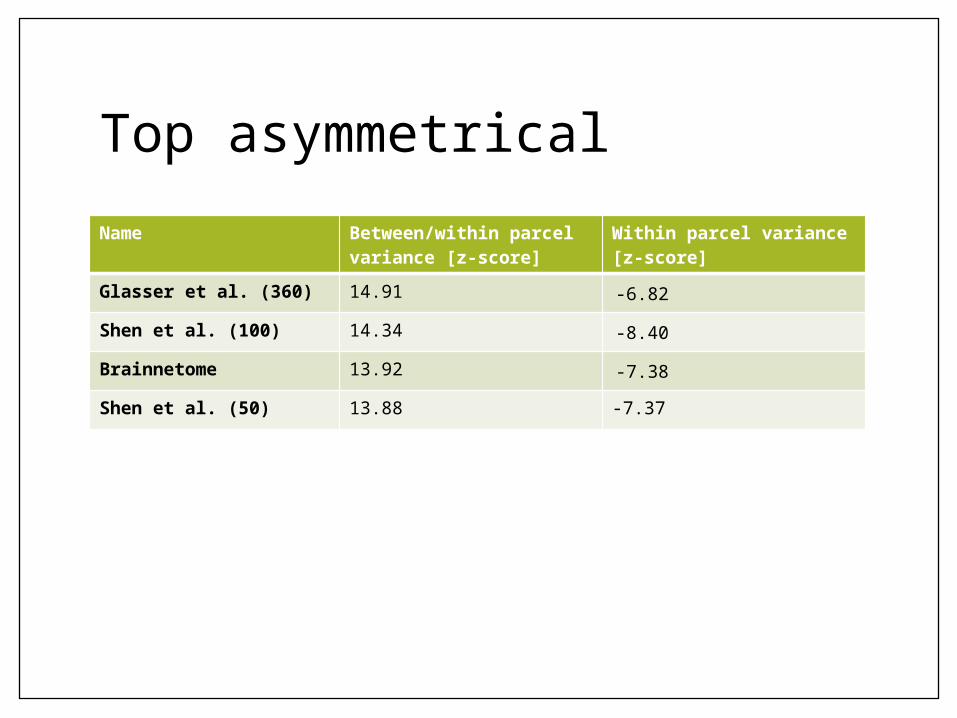
Top asymmetricalName Between/within parcel
variance [z-score]Within parcel variance [z-score]
Glasser et al. (360) 14.91 -6.82
Shen et al. (100) 14.34 -8.40
Brainnetome 13.92 -7.38
Shen et al. (50) 13.88 -7.37

Conclusions• Most parcellations perform well above chance
• Symmetrical parcellation do better
• Yeo networks perform particularly well
• There is no clear winner

Future directions• Surface based comparison• Subcortical only comparison• Improve manual quality control

