evaluation of follow-on companion diagnostics …€¦ · evaluation of follow-on companion...
TRANSCRIPT

Evaluation of follow-on companion diagnostic assays: bridge from the clinical trial assay to a follow-on
assay via external concordance data
Jingjing Ye, Gene Pennello Food and Drug Administration (FDA)
May 19, 2015 MBSW
1

Outline
• Companion Diagnostics • Follow-on companion diagnostics
– Scenarios for evaluation
• Proposed approach • Results • Discussion
2

Companion Diagnostics
• FDA guidance (2014) defines that – an IVD companion diagnostics device is an in vitro
diagnostics device that provides information that is essential for the safe and effective use of a corresponding therapeutic product.
– allows the therapeutic product’s benefits to exceed its risks
3
http://www.fda.gov/ucm/groups/fdagov-public/@fdagov-meddev-gen/documents/document/ucm262327.pdf

Companion Diagnostics
• Safety and effectiveness – Identify patients most likely benefit from the
therapeutic product – Identify patients likely to be at increased risk for
serious adverse reactions from the therapeutic product
– Monitor response to treatment for the purpose of adjusting regimens such as schedule, dose or discontinuation
4

Study Design for Companion Diagnostics
• Retrospective analysis of all-comer randomized clinical trial (RCT)
• Enrichment design
5

Retrospective analysis of all-comer randomized clinical trial (RCT)
• Apply Dx to stored specimens • Evaluate treatment effect in marker subgroups (– , +)
6

Enrichment Design
• Specimens in marker – may or may not be stored
7
FDA Guidance, Draft. Enrichment Strategies for Clinical Trials to Support Approval of Human Drugs and Biological Products, December 2012.

Follow-on Companion Diagnostics
• Test 1: FDA-approved companion diagnostic for a therapeutic product; select a subset for a drug
• Test 1 approved with a therapeutic clinical trial; drug efficacy (e.g. HR) for outcome Y available
• Test 2 (follow-on): New manufacture intended for the same therapeutic indication
8
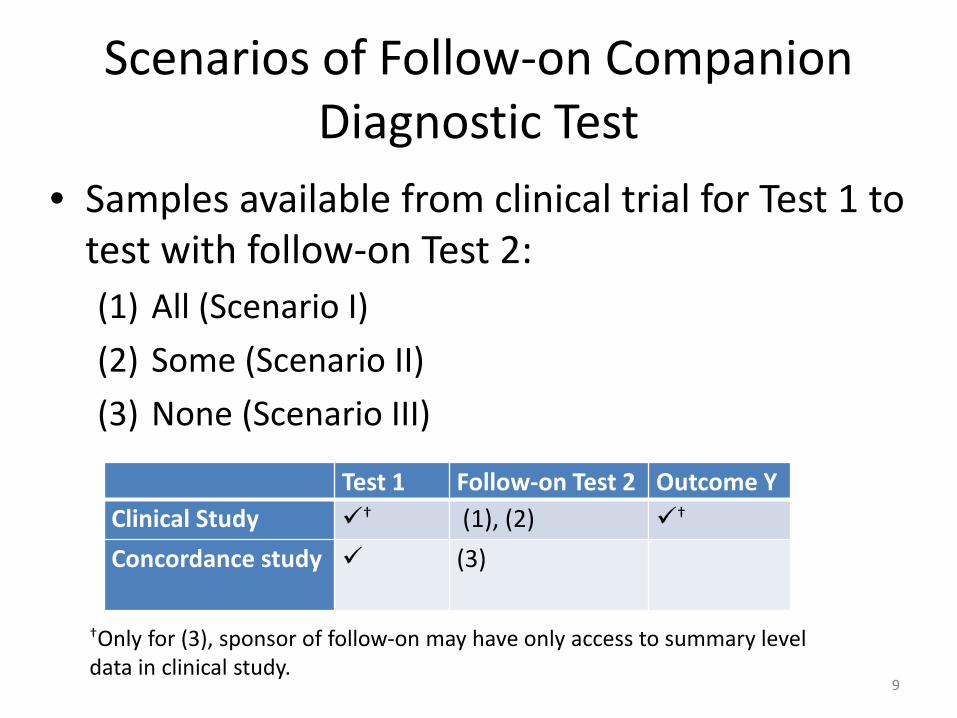
Scenarios of Follow-on Companion Diagnostic Test
• Samples available from clinical trial for Test 1 to test with follow-on Test 2: (1) All (Scenario I) (2) Some (Scenario II) (3) None (Scenario III)
9
Test 1 Follow-on Test 2 Outcome Y Clinical Study † (1), (2) †
Concordance study (3)
†Only for (3), sponsor of follow-on may have only access to summary level data in clinical study.

Evaluation of Follow-on Companion Diagnostic Test
• Analytical studies: – LoB, LoD, repeatability, reproducibility, cross reactivity – Performance on archived samples should also be
evaluated
• Clinical studies – Clinical Study of Test 1 for Outcome Y – Agreement study of follow-on Test 2 (𝑇2) with
approved Test 1 (𝑇1) – E(Y |𝑇2 +)= E(Y|𝑇2+, 𝑇1+ )*P(𝑇1+|𝑇2+)+
E(Y|𝑇2+,𝑇1 −)*P(𝑇1 − |𝑇2+) 10

Scenario I, All available
• All-comers study design – Clinical trial of Test 1 (𝑇1) – Retest clinical trial samples with follow-on Test 2
(𝑇2)
E(Y |𝑇2 +) can be evaluated
11
𝑇1 𝑇2 Outcome Y
Clinical Study (Concordance study)

Scenario I, All available (cont’d) • Enrichment design
– Clinical trial on patients who were Test 1 + (𝑇1+) – Retest samples with follow-on Test 2 for
agreement with Test 1 and clinical performance E(Y |𝑇2 +, 𝑇1+ )
– Subjects who are 𝑇1 − do not have outcome and samples may not be available to re-test.
– May need to evaluate banked samples for 𝑇2+, 𝑇1 − and sensitivity analysis on E(Y|𝑇2+, 𝑇1 −)
12
𝑇1 𝑇2 Outcome Y Clinical Study (concordance)𝑇1+ Concordance Study𝑇1 −

Scenario II, Some available
• Specimens missing due to lack of consent, inadequate sample volume, insufficient samples quality, etc.
• Intended to Diagnose (ITD) • Impute missing test results
13

Scenario II, Some available
• All-comers study design – Clinical trial of Test 1 (𝑇1) – Retest clinical trial samples with follow-on Test 2
(𝑇2)
E(Y |𝑇2 +)= E(Y|𝑇2+, 𝑇1+ )*P(𝑇1+ |𝑇2+)+ E(Y|𝑇2+, 𝑇1 −)*P(𝑇1 − |𝑇2+)
14
𝑇1 𝑇2 Outcome Y
Clinical Study (concordance): 𝒏𝟏 Clinical Study: 𝒏𝟐

Scenario II, Some available (cont’d)
• Enrichment design – Clinical trial on patients who were Test 1 + (𝑇1+) – Retest samples with follow-on Test 2 for
agreement with Test 1 and clinical performance E(Y |𝑇2 +, 𝑇1+ )
– Samples with 𝑇1 − do not have outcome and not all may be available to re-test.
– Sensitivity analysis on E(Y|𝑇2+, 𝑇1 −)
15
𝑇1 𝑇2 Outcome Y Clinical Study (concordance) 𝑇1 + Clinical Study 𝑇1 + Clinical Study(concordance) 𝑇1−

16 16
Intent to Diagnose (ITD) • In statistical analysis, include all patients on
whom a diagnosis could have been attempted: – Report number (percent) of subjects without
results (invalid, unevaluable, etc.). – Report number (percent) of subjects with
equivocal result – When appropriate, consider imputation of missing
test results. FDA Statistical Guidance on Reporting Results from Studies Evaluating Diagnostic Tests, Final 2007. http://www.fda.gov/MedicalDevices/DeviceRegulationandGuidance/GuidanceDocuments/default.htm
Campbell, Pennello, and Yue, 2011, Missing Data in the Regulation of Medical Devices, J Biopharm Stat, 21(2), 180-195
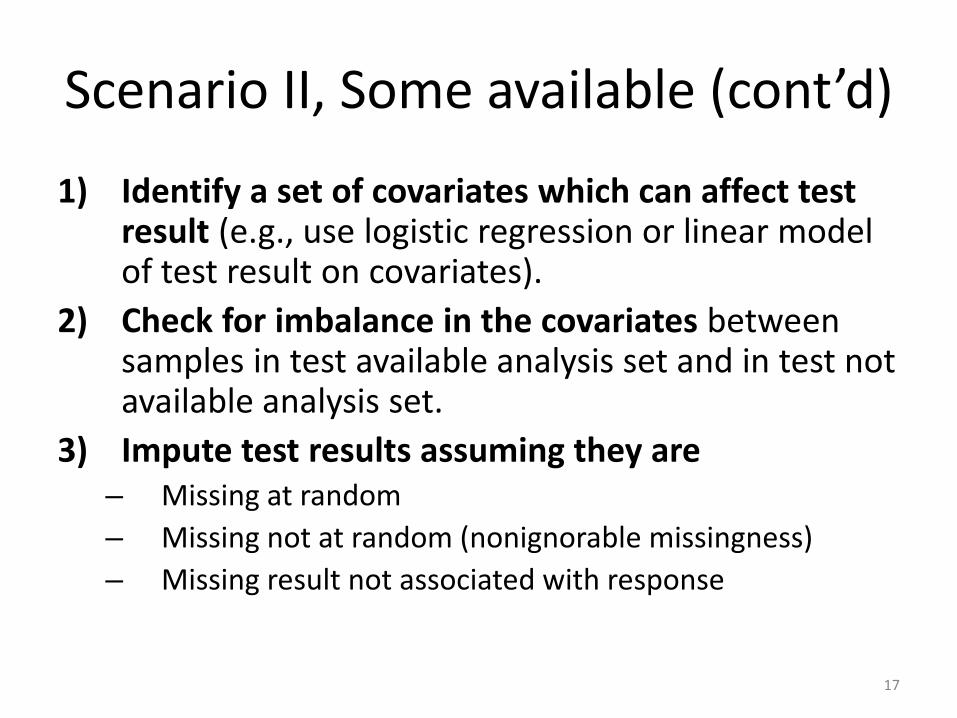
Scenario II, Some available (cont’d)
1) Identify a set of covariates which can affect test result (e.g., use logistic regression or linear model of test result on covariates).
2) Check for imbalance in the covariates between samples in test available analysis set and in test not available analysis set.
3) Impute test results assuming they are – Missing at random – Missing not at random (nonignorable missingness) – Missing result not associated with response
17

Variables
• Patient Characteristics
• Disease characteristics
• Handling and processing factors
• Specimen Characteristics
• Outcome
18

Patient characteristics
• Gender • Race • Age • Baseline ECOG PS • Baseline weight • Marker status by reference method
19

Disease characteristics
• Months from first histological diagnosis to randomization
• Number of disease sites • Presence of metastases (yes or no) • Number of previous therapies • Prior therapy (yes or no)
20

Handling, processing factors
• Enrollment site • Region (e.g., Canada, Non-Canada) • Age of sample at testing • Sampling method (biopsy, resection)
21

Characteristics of sample
• Tumor type (primary or metastatic) • If metastatic, then site of metastasis • Area of tumor tissue (mm²) • Tumor content in sample (%) • Macro-dissection of sample (yes or no) • Necrosis score in tumor area (0, 1, 2 or 3) • H&E staining slide evaluable (yes or no)
22

Tipping point analysis 𝑇2
Result
𝑇1 Result Total 𝑇1 − 𝑇1+
𝑇2 −
N00
N01
N00+ N01
𝑇2 + N10
N11 N10+ N11
Total
N00+ N01 N01+ N11
N
23
k k
Denne, J.S., Pennello, G., Zhao, L., Chang, S.C., Althouse, S. Identifying a subpopulation for a tailored therapy: Bridging clinical efficacy from a laboratory-developed assay to a validated in vitro diagnostic test kit. Statistics Biopharm Res, 2014; 6(1): 78-88.
The number k was increased until a tipping point was reached at which the result of clinical performance became insignificant

Scenario III, None available
• All-comers study design – Clinical trial of Test 1 (𝑇1) – External concordance data between 𝑇2 and 𝑇1
• Goal: infer clinical outcome Y on 𝑇2
24
𝑇1 𝑇2 Outcome Y
Clinical Study Concordance study
Line-data?
No

KRAS IVD Companion Diagnostic
• Population: Colorectal cancer patients • Drug: BMS Lilly Cetuximab • CoDx: Qiagen therascreen® KRAS RGQ PCR
Kit • Pivotal Clinical Study, Drug: CRYSTAL RCT • Pivotal Clinical Study, Device: NCIC CA225-025
572 subjects in All Randomized population – 394 (68.9%) evaluated by bi-directional Sequencing. – 484 (84.6%) had tissue available for re-testing. – 453 (79.2%) evaluated by Qiagen therascreen®.
25
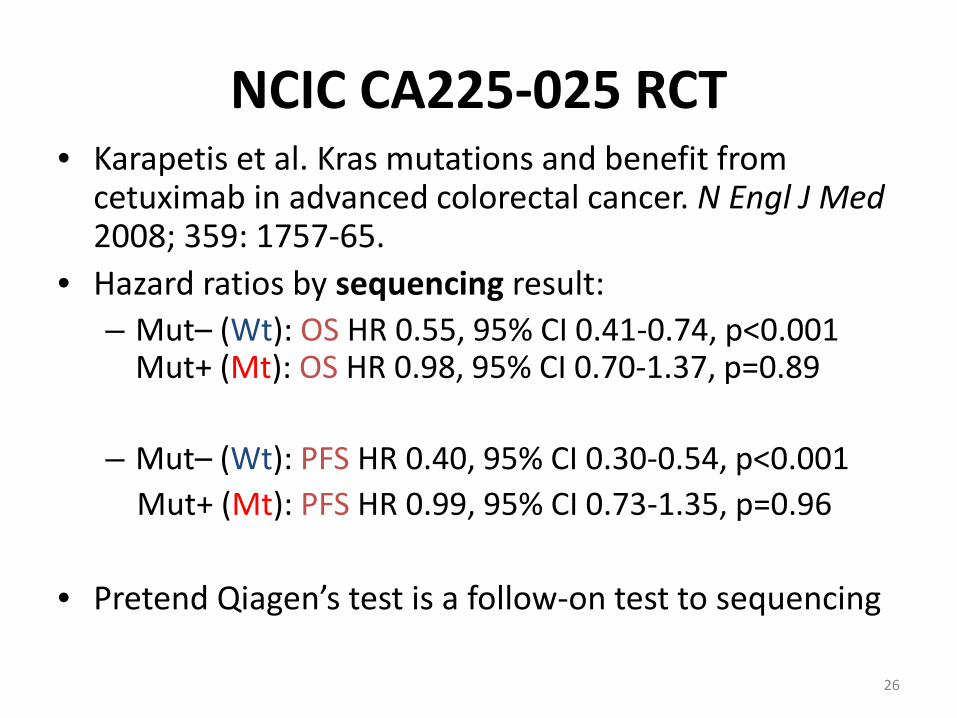
NCIC CA225-025 RCT • Karapetis et al. Kras mutations and benefit from
cetuximab in advanced colorectal cancer. N Engl J Med 2008; 359: 1757-65.
• Hazard ratios by sequencing result: – Mut– (Wt): OS HR 0.55, 95% CI 0.41-0.74, p<0.001
Mut+ (Mt): OS HR 0.98, 95% CI 0.70-1.37, p=0.89
– Mut– (Wt): PFS HR 0.40, 95% CI 0.30-0.54, p<0.001 Mut+ (Mt): PFS HR 0.99, 95% CI 0.73-1.35, p=0.96
• Pretend Qiagen’s test is a follow-on test to sequencing
26

27

28

Model Parameters • Clinical Outcome Study
• External Concordance (EC) Study
• Goal: Estimate 29
S=0 S=1
Count m.0 m.1 Hazard=h(Y) h.0 h.1
)1Pr( == Sτ
. .( | )s sE h S sδ = =
S=0 S=1
Q=0 n00 n01 Q=1 n10 n11
Pr( 1| )sp Q S s= = =
. .( | )q qE h Q qδ = =

Non-Differential Misclassification
• Assume misclassification of S by Q is non-differential to Y, that is,
• Equivalently,
• That is, given test result S, follow-on test result Q is uninformative for outcome Y (e.g., hazard ratio)
• That is, Q and Y are conditionally independent given S.
30
=| , |Q S Y Q S
=| , |Y Q S Y S

Non-differential Misclassification
• Hazard ratios by Q, S:
• Under non-differential misclassification error (NDME), the hazard ratios become
31
S=0 S=1 Q=0
Q=1
S=0 S=1 Q=0
Q=1

Non-differential Misclassification
• Under NDME, hazard ratios for Q are
Where 𝜋1 = Pr 𝑆 = 1 𝑄 = 1 = 𝑃𝑃𝑃 = 𝜏𝑝1(𝜏𝑝1 + 1 − 𝜏 𝑝0)−1
32
. 0 1(1 )δ δ π δ π= − +q q q q q
.0 .1(1 )δ π δ π= − +q qNDME
𝜋0 = Pr 𝑆 = 1 𝑄 = 0 = 1 − 𝑁𝑃𝑃 = 𝜏(1 − 𝑝1)(𝜏 1 − 𝑝1 + (1 − 𝜏)(1 − 𝑝0))−1

NDME Attenuation Result • NDME is a conservative assumption:
• i.e., 𝛿0. − 𝛿1. = (𝛿.0 − 𝛿.1 )(𝜋1 − 𝜋0)
• That is, the difference in hazard ratio between subsets defined by Q is attenuated relative to the corresponding difference for S†.
33
( | 0) ( | 1)= − =E h Q E h Q[ ] [ ]( | 0) ( | 1) 1E h S E h S NPV PPV= = − = × + −
†Provided PPV ≥ 1 – NPV , i.e., Q not negatively informative for S, so that 0 ≤ PPV + NPV – 1 ≤ 1. (Pennello, Clin Trials 2013 Oct;10(5):666-76 .)

Cox Model • For treatments T = 0, 1, hazard model for S is
34
0( | , ) ( ) STy S T y eβλ λ=log hazard ratio for s S sβ = =
{ }( | , ) | , ,E y S T Q T Y yλ= ≥
{ }0 ( ) | , ,STy E e Q T Y yβλ= ≥ { }0 ( ) | ,STy E e Q Tβλ≅
( )0 010 ( ) T TT
qy e e eβ ββλ π = + −
0 10 ( ) (1 ) T T
q qy e eβ βλ π π = − +
{ }( | , ) ( | , , ) | , ,y Q T E y Q S T Q T Y yλ λ= ≥NDME
Rare Disease

Cox Model
• Same approximate attenuation holds for log hazard ratio difference.
• Approximation is OK for rare enough outcome. More investigation is needed.
• Prentice, 1982. Pepe, Self, Prentice, 1989. 35
( )0 010( | , ) ( ) T TT
qy Q T y e e eβ ββλ λ π ≅ + −
( | 1, 1) ( | 0, 1)y Q T y Q Tλ λ= = − = =
( )( )010 1 0( )y e eββλ π π= − −
[ ]( )1 0( | 1, 1) ( | 0, 1)Y S T Y S Tλ λ π π= = = − = = −

Bayesian Model
• EC data
• Outcome Data
36
S=0 S=1
Q=0 n00 n01 Q=1 n10 n11
S=0 S=1
Count m.0 m.1 Hazard=h(Y) h.0 h.1
Parameters )1Pr( == Sτ . .( | )s sE h S sδ = =
Pr( 1| )sp Q S s= = =
Data Model
Priors
1 ~ ( , )τ• ••m Bin m 1 ~ ( , )•s s sn Bin n p
( )2log( ) ~ log( ), (log( ))δ• • •s s sh N se h
, ~ (0.5,0.5)τ sp Beta( )log( ) ~ 0,1000δ•s N

Gibbs Sampler • Full Conditional Posteriors
• Monitor
37

38
Parametric Bootstrap
• Clinical Study External Concordance
S=0 S=1
Count m.0 m.1 Hazard=Y h.0 h.1
S=0 S=1
Q=0 n00 n01 Q=1 n10 n11
)1Pr( == Sτ . .( | )s sE h S sδ = = Pr( 1| )sp Q S s= = =
*1 1ˆ ˆ~ ( , ), /m Bin m m mτ τ• •• • ••=
*1 1ˆ ˆ~ ( , ), /s s s s s sn Bin n p p n n• •=
( )* 2log( ) ~ log( ), (log( ))• • •s s sh N h se h

39
Data for Model to Estimate HRs for Test Q, OS.
• NCIC 225-025 Study OS, S=0 (Wt), S=1 (Mt), NEJM data
• External Concordance Data (PMA SSED)
S=0 S=1 Count 230 164
Hazard ratio (95% CI) 0.55 (0.41,0.74) 0.98 (0.70,1.37)
S=0 S=1 S=NE Q=0 80 2 0 Q=1 3 52 1
Q=NE 5 0 0 Total 88 54 1

HR Results for OS
Test Estimate N Wt Mt Trt Diff Attenuation+ S Observed 394 0.55(0.41,0.74) 0.98(0.70,1.37) -0.58 Q Observed 453 0.63(0.47,0.84) 0.91(0.67,1.24) -0.37 0.65 Q Model 394 0.57(0.42,0.75) 0.96(0.69,1.3) -0.52 0.9
40

41
Data for Model to Estimate HRs for Test Q, PFS.
• NCIC 225-025 Study PFS, S=0 (Wt), S=1 (Mt), NEJM data
• External Concordance Data (PMA SSED)
S=0 S=1 Count 230 164
Hazard ratio (95% CI) 0.40 (0.30,0.54) 0.99 (0.73,1.35)
S=0 S=1 S=NE Q=0 80 2 0 Q=1 3 52 1
Q=NE 5 0 0 Total 88 54 1
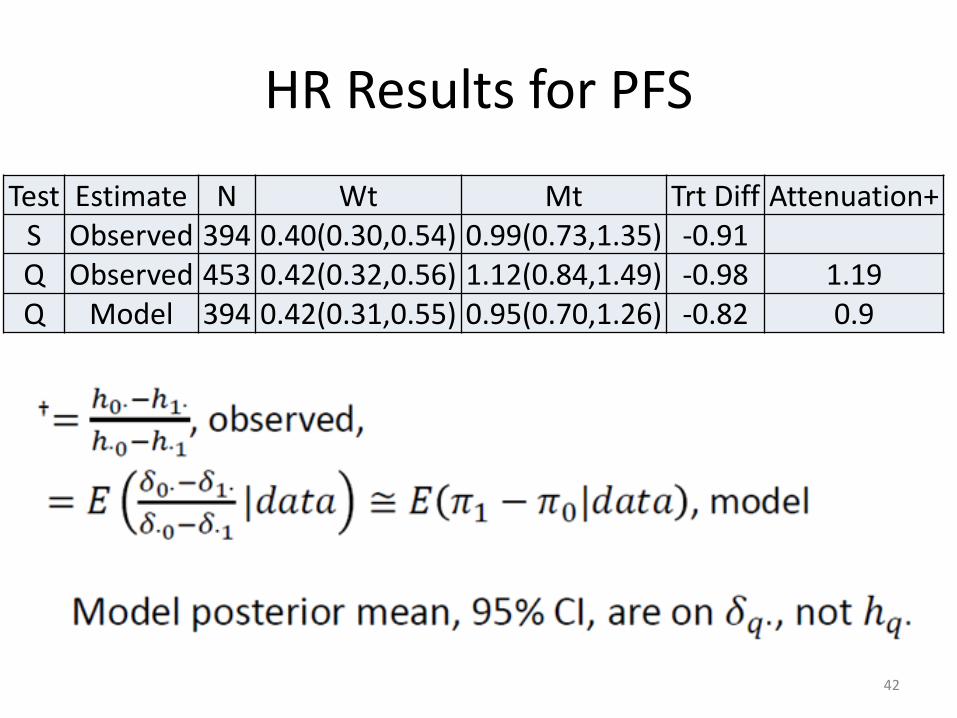
HR Results for PFS
Test Estimate N Wt Mt Trt Diff Attenuation+ S Observed 394 0.40(0.30,0.54) 0.99(0.73,1.35) -0.91 Q Observed 453 0.42(0.32,0.56) 1.12(0.84,1.49) -0.98 1.19 Q Model 394 0.42(0.31,0.55) 0.95(0.70,1.26) -0.82 0.9
42

Simulation
43

Simulation Results, OS,
PPA NPA Coverage Prob. Q=0
Mean Est. OS Q=0
True OS Q=0
Coverage Prob. Q=1
Mean Est. OS Q=1
True OS Q=1
95% 95% 98% 0.577 0.562 96% 0.962 0.942 90% 94% 0.584 0.562 93% 0.934 0.91 85% 97% 0.573 0.563 96% 0.892 0.883 80% 95% 0.577 0.564 92% 0.870 0.859
90% 95% 97% 0.585 0.573 89% 0.963 0.94 90% 93% 0.586 0.574 92% 0.924 0.907 85% 97% 0.589 0.575 94% 0.899 0.878 80% 96% 0.593 0.577 92% 0.876 0.854
44
𝛿𝑞.

Simulation Results, OS,
PPA NPA
Coverage Prob. Q=0
Mean Est. OS Q=0
True OS Q=0
Coverage Prob. Q=1
Mean Est. OS Q=1
True OS Q=1
85% 95% 95% 0.597 0.583 93% 0.955 0.938 90% 97% 0.597 0.585 91% 0.916 0.903 85% 96% 0.598 0.587 95% 0.886 0.874 80% 98% 0.602 0.589 98% 0.861 0.849
80% 95% 97% 0.604 0.593 92% 0.946 0.935 90% 95% 0.607 0.595 95% 0.904 0.899 85% 96% 0.608 0.598 92% 0.879 0.869 80% 97% 0.615 0.6 97% 0.854 0.844
45
𝛿𝑞.

Simulation Results, PFS,
PPA NPA Coverage Prob. Q=0
Mean Est. PFS Q=0
TruePFS Q=0
Coverage Prob. Q=1
Mean Est. PFS Q=1
True PFS Q=1
95% 95% 96% 0.423 0.413 98% 0.940 0.93 90% 94% 0.425 0.414 93% 0.894 0.881 85% 98% 0.425 0.415 100% 0.855 0.84 80% 95% 0.427 0.416 98% 0.813 0.805
90% 95% 97% 0.438 0.426 92% 0.937 0.927 90% 96% 0.441 0.428 95% 0.891 0.876 85% 95% 0.436 0.429 95% 0.847 0.834 80% 97% 0.442 0.431 97% 0.813 0.798
46
𝛿𝑞.
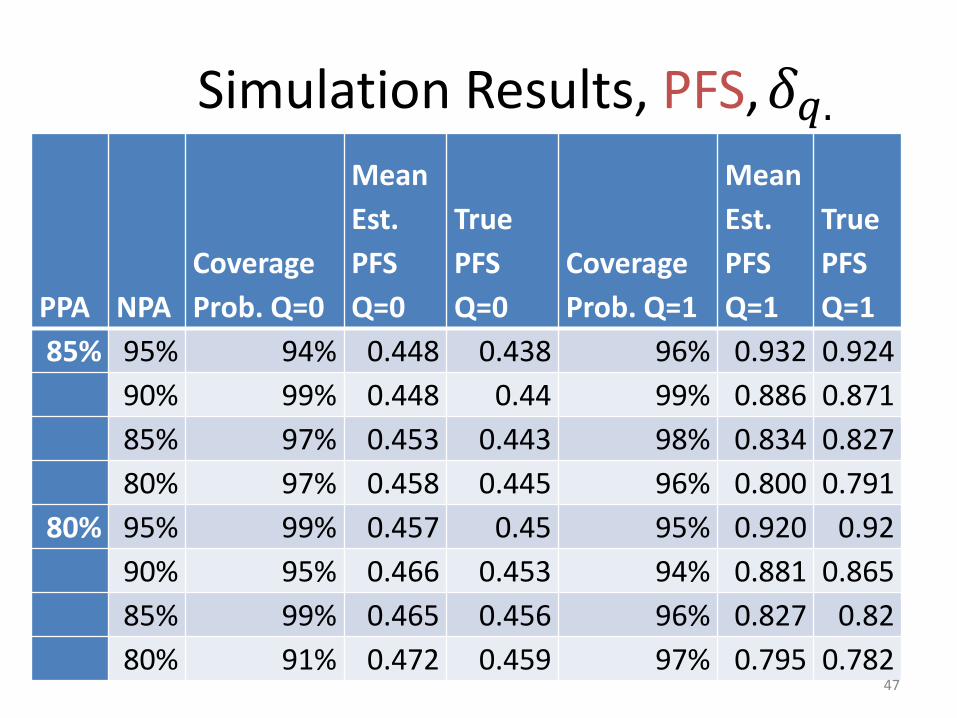
Simulation Results, PFS,
PPA NPA Coverage Prob. Q=0
Mean Est. PFS Q=0
True PFS Q=0
Coverage Prob. Q=1
Mean Est. PFS Q=1
True PFS Q=1
85% 95% 94% 0.448 0.438 96% 0.932 0.924 90% 99% 0.448 0.44 99% 0.886 0.871 85% 97% 0.453 0.443 98% 0.834 0.827 80% 97% 0.458 0.445 96% 0.800 0.791
80% 95% 99% 0.457 0.45 95% 0.920 0.92 90% 95% 0.466 0.453 94% 0.881 0.865 85% 99% 0.465 0.456 96% 0.827 0.82 80% 91% 0.472 0.459 97% 0.795 0.782
47
𝛿𝑞.

48
Pros, Cons of Proposed Approach • Pros
– Sponsor does not need a new trial, which is often impractical, infeasible (Major advantage)
– Model uses only summary data from RCT. – Well-understood mathematical model – NDME is a conservative assumption. Imputation of new test
result is assumed non-informative for the outcome given reference test result.
– NDME assumption may hold approximately if marker / drug target biology is well understood and reference test is best available method (measures analyte with least error).
• Cons – NDME is not worst-case scenario:
Assumes 𝛿0𝑠 = 𝛿1𝑠 = 𝛿. 𝑠, not that 𝛿0𝑠 > 𝛿. 𝑠 > 𝛿1𝑠. – Unverified assumptions: NDME, EC transportability.

Transportability • Distribution Q|S is assumed transportable from
external concordance study to clinical study. • Covariate which have effects on concordance and
outcome may have different distributions in the two studies.
• Types of covariates – Patient characteristics (gender, age, race, ECOG) – Disease characteristics (# disease sites, previous therapy) – Handling, processing factors (site, region, sample age,
sampling method) – Sample characteristics (tumor type, volume, content) 49

50
Bayesian Sensitivity Analysis-Relax NDME assumption

Relax NDME assumption • If NDME, 𝑙0𝑠 = 𝑙1𝑠 • Relaxing NDME, 𝑙0𝑠 ≠ 𝑙1𝑠
51

Relax NDME-Qiagen
• 𝑝1=96.3% (52/54) • 1 − 𝑝0=96.4% (80/83) • Under relaxing NDME, 𝜑𝑠 = 580% when
clinical outcome OS became insignificant in wild-type subgroup
52
S=0 S=1 S=NE Q=0 80 2 0 Q=1 3 52 1
Q=NE 5 0 0 Total 88 54 1
%NE=3.5% (5/143)

Tipping Point-Qiagen
• Tipping point k=13 when clinical outcome OS in KRAS mutated group changed to statistically significant
53
S=0 S=1 S=NE Q=0 80 2 0 Q=1 3 52 1
Q=NE 5 0 0 Total 88 54 1
k k
Performance Measures • HR in subset statistically and clinically significant
– Easy to show if HR is significant overall (a randomly selected subset would do).
• HR in complement subset clinically non-significant – Influence condition: Overall significance not limited to
subset (Millen, Dmitrienko, Ruberg, Shen. A Statistical Framework for Decision Making in Confirmatory Multi-population Tailoring Clinical Trials, DIJ 2012).
• New assay preserves a large fraction of effect on HR that was seen with the clinical trial assay. Under NDME, fraction = PPV + NPV – 1.
54

Related FDA Guidance • In Vitro Companion Diagnostic Devices, Final 2014
http://www.fda.gov/medicaldevices/deviceregulationandguidance/guidancedocuments/ucm262292.htm
• Clinical Pharmacogenomics: Premarket Evaluation in Early-Phase Clinical Studies and Recommendations for Labeling, Final 2013. http://www.fda.gov/MedicalDevices/DeviceRegulationandGuidance/GuidanceDocuments/default.htm
• Reporting Results from Studies Evaluating Diagnostic Tests, Final 2007. http://www.fda.gov/medicaldevices/deviceregulationandguidance/guidancedocuments/ucm071148.htm
• Campbell, Pennello, Yue, Missing Data in the Regulation of Medical Devices, J Biopharm Stat 2011;21,180-195. 55

References • Denne JS, Pennello G, Zhao L, Chang SC, Althouse S. Identifying a
subpopulation for a tailored therapy: Bridging clinical efficacy from a laboratory-developed assay to a validated in vitro diagnostic test kit. Stat Biopharm Res 2014; 6(1):78-88.
• Guo Y, Little RJ, McConnell DS. On Using Summary Statistics From an External Calibration Sample to Correct for Covariate Measurement Error. Epidemiology 2012; 23: 165–174.
• Li, M. (2012), “Study Design Issues and Statistical Challenges in Personalized Medicine Bridging Studies [Abstract],” in Joint Statistical Meetings 2013, abstract 648. http://www.amstat.org/meetings/jsm/2012/onlineprogram/AbstractDetails.cfm?abstractid=304452
• Pennello G. Analytical and clinical evaluation of biomarkers assays: When are biomarkers ready for prime time? Clinical Trials 2013; 10(5):666-676. 56

References
• Carroll RJ, Ruppert D, Stefanski LA, Crainiceanu CM, Measurement Error in Nonlinear Models: A Modern Perspective, 2nd ed. Chapman & Hall / CRC, 2006.
• Gustafson P. Measurement Error and Misclassification in Statistics and Epidemiology: Impacts and Bayesian Adjustments, Chapman & Hall / CRC, 2003.
57