evaluation of environmentally optimal descent and take … · the a320-232 and steeper takeoffs...
TRANSCRIPT

Evaluation of environmentally optimal descentand take-off slopes for existing and novel aircraft
Athanasios SynodinosWood, 12th Floor, 25 Canada Square, Canary Wharf, London E14 5LQ.
Rod Self, Antonio TorijaISVR, University of Southampton, Southampton, SO17 1BJ, UK.
SummaryDescent and takeoff slopes of civil aircraft influence the associated noise and emissions impact aroundairports. Steep take-off and approach procedures are expected to reduce the noise footprint aroundairports whereas they could offer local air quality benefits as well. This paper appraises the optimaldescent and take-off slopes in terms of noise and emissions for existing civil aircraft, as well as fora future blended wing-body (BWB) concept aircraft. The effect of the interdependencies betweennoise and emissions is demonstrated, whereas estimated Noise-Power-Distance (NPD) curves for thesteep operations are presented. It is shown that a common optimum slope for both environmentalconcerns is unlikely to occur and that generally, noise benefits come to the expense of increased fuelconsumption. However, it is also highlighted that new, more flexible ways of expressing the noise andemissions interdependencies may be required in order to determine optimum slopes more realistically.
PACS no. xx.xx.Nn, xx.xx.Nn
1. Introduction
Forecasts from global air transport stakeholders fore-see a significant air traffic grow over the forthcomingyears [1, 2]. To compensate for the resulting potentialincrease of aviation environmental impact [3] ambi-tious interim-to-long term noise and emissions reduc-tion targets have been set by organisations worldwidelike ACARE [4]. Delivering these targets requires notonly introducing novel aircraft designs e.g. blendedwing-body (BWB) aircraft, and technologies e.g. dis-tributed electric propulsion (DEP), but also contem-porary operations, such as steeper approach and take-off procedures that are anticipated as promising waysof exposing less populated areas to aircraft noise [6, 7].
Steep takeoffs at John Wayne airport in Californiais a representative example of noise abatement take-off procedures. Likewise, Heathrow airport has carriedout trials for exploring the effects of a 3.2° slope ap-proach [8], which is slightly steeper than the conven-tional 3° approach angle; whereas London City airportalready includes a glide slope of 5.5° in their 2013 -2018 noise action plan [9]. However, as discussed inSection 2.1, high glide slopes impose aircraft perfor-mance restrictions that limit the types of aircraft thatcan use airports adopting them.
(c) European Acoustics Association
Normally, mitigation strategies have a simultane-ous impact on noise and emissions. Noise impact pre-diction tools often tend to overlook the interdepen-dencies between the two environmental concerns. Itis nowadays acknowledged that accounting for theseinterdependencies is crucial for effective planning anddecision making. Hence, not only does this paper in-vestigate the noise impact of steeper operations, but italso illustrates the concurrent variation of noise andemissions impact with operation angle. It is impor-tant to note that the purpose of the presented studyis not to exactly predict absolute optimum slope an-gles values; rather the aim is to provide good esti-mates of the impact values and capture the associatedtrends and interdependencies. Another essential out-put of the study is estimated Noise-Power-Distance(NPD) curves for steeper operations as derived by in-putting the estimated noise values into the frameworkproposed by Synodinos et al. [10]. Included in this pa-per are representative steep operations NPD curves.
The aircraft models chosen for this study are theAirbus A320-232 and a larger aircraft, the Boeing 777-300. Due to space constraints, this paper only presentstwo representative cases, i.e. steeper approaches forthe A320-232 and steeper takeoffs for the 777-300.Nevertheless the paper additionally presents early es-timations for the potential steep approach perfor-mance of an hypothetical future BWB aircraft featur-ing similar mission characteristics as the A320-232.
Copyright © 2018 | EAA – HELINA | ISSN: 2226-5147 All rights reserved
- 177 -

2. Methodology
Noise calculations are performed using the noise pre-diction framework for novel aircraft proposed by Syn-odinos et al. [10]. The framework has already beenused to estimate the noise impact of novel DEP [5]and BWB aircraft [10]. In summary, the frameworkestimates aircraft noise variation arising from opera-tional and/or technological changes with respect to abaseline scenario for which community noise is known.As specified in [10], this is done by first estimating thelevel change of each aircraft noise source using respec-tive, publicly available noise prediction methods.
The noise prediction methods used in this studyare Heidmann’s [11] for the fan, Lighthill’s acousticanalogy [12] for the jet, and Fink’s for the airframenoise [13]. Other methods (e.g. newer) could have beenused instead. The baseline scenarios are the defaultapproach and takeoff fight profiles for the A320-232and the 777-300 respectively. Noise data for the de-fault profiles are publicly available (e.g. in the ANPdatabase [14]). Lastly, the operational and/or tech-nological changes are the trajectory variations alongwith the associated thrust and high-lift device settingsvariations that are required for fulfilling the variousoperations, as specified later in this Section.
2.1. Steep approach
Assessing the steeper approach noise impact is notstraightforward. Although at first sight it may seemthat doubling the descent angle and thus the distancebetween aircraft path and receiver can lead to a SPLreduction of almost 6 dB, steep approaches are likelyto be accompanied by noise at source increases dueto several intermingling factors: Firstly, fulfilling thesteep approach requires additional drag (or more gen-erally, altered aircraft lift-to-drag ratio L/D) [6, 7].For instance, flight-tests in [6] reveal that steep de-scent of a Boeing 737-800 requires increased flap de-flection angles, whereas flyability tests for various air-craft in [7] show that steep approach is associatedwith deployed landing gears that provide additionaldrag. To prevent aircraft stalls, the additional dragmust be compensated by additional thrust, i.e. in-creased engine power, which results in increased en-gine noise. Secondly, increasing flap deflection angleraises airframe noise. Moreover, to fullfil steep ap-proaches, some aircraft may need to be equipped withspecial devices, such as microdrag generators that in-crease drag, clam shells that enable the aircraft todescend at a faster rate and ventral airbrakes thatserve at maintaining the appropriate approach speed[15, 16]. Due to their high-lift nature these special de-vices are likely to raise airframe noise. To complicatethe situation even further, Mollwitz et al. [7] suggestthat steep approach decreased airspeed is controlledby spoilers, at least for some flap deflection angles.
18 14 610 2 0Distance to airport (km)
0
200
400
600
800
1000
Alti
tude
(m)
LAQ limit
(W , V0)
(W’ = W + ΔW, V’0)
CP
S
E
Figure 1. Vertical approach profiles at different slopes forthe A320-232. CP is the approach certification point.
So, airframe noise benefits from decreasing airspeedcould be outweighed by the noise of spoilers.
Clearly a key point for achieving accurate predic-tion of the steep approach noise impact is to reliablyestimate the associated noise change at source, i.e. theacoustic power change, ∆W . Indeed, this is performedthrough the framework by Synodinos et al. [10].
The approach angle range examined is from 3° to 6°.This derived based on flyability tests in [6, 7]; furthersteep approaches concerns like the provision for pilots’training were ignored. Figure 1 portrays the varioussteep profiles for the A320-232, as obtained throughthe SAE-AIR 1845 [17] aircraft performance proce-dure using publicly available data (from e.g. [14], man-ufacturers websites, etc.) and assuming continuous de-scent approaches (CDA), as well as a fixed descentrate to satisfy safety and passenger comfort demands.For comparisons to be objective, all approaches areevaluated from a common start point S to the airport(point E). However, the horizontal cruise phase is onlysignificant when assessing emissions.
Table I summarises the configurations, airspeed andthrust variation necessary to fulfil CDA descents atseveral steep slopes with the test A320-232. The no-tation ‘FULL+’ represents hypothetical flap settingsfor the A320-232 associated with descent slopes higherthan 5°, for which appropriate L/D coefficients are ob-tained through linear extrapolation on the values forthe conventional flap settings found in [14].
2.2. Steep takeoff
The environmental impact of steep takeoff is investi-gated for the Boeing 777-300. Typically, takeoff oper-ation is split into three segments; the ground roll, theinitial climb and the continuing climb. Figure 2 givesa visual representation of the examined takeoff pro-files, up to the common mission point, E, as derivedfrom the SAE-AIR 1845 [17] aircraft performance pro-cedure. In-detail description of the SAE-AIR 1845
Euronoise 2018 - Conference Proceedings
- 178 -

Table I. Airbus A320-232 configuration for various CDAdescent slopes.
Angle Gear Flaps Av. airs. Dur. ∆Thr.(deg) ID (kt) (s) (kN)
3° Down 3D 144.89 243.3 03.5° Down 3D 143.37 209.7 0.454° Down 3D 141.84 184.6 0.944.5° Down FULL 140.31 165.0 1.455° Down FULL 138.78 149.39 2.015.5° Down FULL+ 137.25 136.61 2.596° Down FULL+ 135.72 125.97 3.20
0 4 8 12 16Distance to airport (km)
0
400
800
1200
1600
Alti
tude
(m)
LAQ limit
(W , V0)
(W’ = W + ΔW, V’0)
Thrustcutback
Initial climb
Groundroll
Contin.climb
CPS
E
Figure 2. Vertical takeoff profiles at different slopes for the777-300.
Table II. Takeoff angle and airspeed variation due to dif-ferent 777-300 configurations at the initial climb segment.
Prof. Flaps ∆Thr. Airsp. Dur. AngleID ID (kN) (kt) (s) (deg)
1 L_30_D -27.40 167.13 47.94 4.242 L_25_D -13.70 178.30 33.83 5.63
3 (def.) T_20_U 0.00 189.22 21.91 8.214 T_15_U 13.70 199.88 18.61 9.165 T_05_U 27.40 210.29 16.21 10.006 T_00_U 41.10 220.44 13.71 11.30
procedure implementation for deriving the flightpathscan be found in [20]. Nevertheless, it is worth men-tioning that aircraft configurations and performanceparameters for the three takeoff segments (listed inTables II – IV) are evaluated by starting from theinitial climb, which essentially establishes the initialclimb speed that in turn determines the ground rolldistance. Also, in contrast to the steep approach case,takeoff angle value is not a direct input, but is deter-mined by the combination of thrust and flap setting.
2.3. Noise-emissions interdependencies
To implement the interdependencies plots, noise andemissions changes are normalised to unity. It must
Table III. Variation of ground rolling parameters withtakeoff profile.
Profile Roll. dist. Av. roll. speed Roll. dur.ID (m) (kt) (s)
1 2115 83.56 49.202 2247 89.15 48.99
3 (default) 2375 94.61 48.804 2500 99.94 48.625 2802 105.14 51.806 2922 110.22 51.53
Table IV. 777-300 configurations and flight details for eachsteep takeoff profile at the continuing climb segment.
Prof. Flaps ∆Thr. Av. airsp. Dur. AngleID ID (kN) (kt) (s) (deg)
1 ZERO 3.48 187.85 62.60 5.782 ZERO 1.72 196.23 60.61 5.72
3 (def.) ZERO 0.00 204.41 58.84 5.654 ZERO -1.68 212.41 57.26 5.595 ZERO -3.32 220.21 55.83 5.536 ZERO -4.92 227.83 54.56 5.47
be noted that normalisation to unity may not be theoptimum way of comparing the effects of noise andemissions. Other existing metrics (e.g. related to costor annoyance) and/or new ones may express trade-offeffects more realistically. Also, it must be consideredthat the environmental impact of mitigation strate-gies is to some extent airport-specific; for instance,their effectiveness depends on factors related to thepopulation around an airport, e. g. the number of res-idents and the location of residential areas. Hence,weightings expressing the effect of such factors couldalso facilitate a more objective comparison betweenthe impact of noise and emissions.
2.4. Novel aircraft
As mentioned in Section 1, along with contemporaryoperations, novel aircraft concepts are indispensablefor achieving the aggressive long-term environmentaltargets for aviation. This paragraph investigates thepotential noise benefits of steeper approaches whenperformed by a hypothetical BWB aircraft that hasequivalent thrust requirements as the A320-232 andhence features the A320-232 turbofan engines.
It is assumed that the hypothetical BWB aircraftis configured with projected 4 dB airframe noise re-duction technologies [10, 21]. Engine noise reductiondue to shielding effects of the airframe is ignored inthis paper because these effects are likely to be signif-icant only at takeoff [20]. The effects of shielding aredemonstrated in [10]. Airframe noise is also assumedto reduce due to the high-lift capability of the BWBthat could not only eliminate conventional high-liftdevices that significantly contribute to airframe noise,but also provide the short takeoff and landing (STOL)
Euronoise 2018 - Conference Proceedings
- 179 -
capabilities, i.e. allow steeper procedures (e.g. about10° approach angles) at lower airspeed. It is remindedthat airframe noise scales with the 5th power of air-speed [13]. For including the slower approach effect, a10% approach speed reduction is assumed.
3. Results
3.1. Steep approach - Airbus 320-232
3.1.1. Noise assessmentThe aircraft (i.e. engine and airframe) acoustic powerchange (∆W in Figure 1), due to the steep approachconfigurations (i.e. changes in thrust, flap settings,airspeed) is estimated with Synodinos’s framework[10]. To reduce complexity, landing gears are consid-ered to be deployed at the same horizontal distancefrom the airport independently of descent angle andthus, their noise impact remains fixed for all profiles.Extraction at different lateral distances would inducea new configuration change between standard andsteeper descent and an additional noise level changeobtainable through e.g. Fink’s method. Also, airframenoise variation due to attitude change is ignored.
The left plot of Figure 3 depicts the noise at sourcevariation with approach angle and the noise bene-fits from increasing the aircraft-receiver distance. Thenoise increase at source at slopes steeper than 4° is aresult of the increased flap deflection angles at theseflight profiles. The right plot of the Figure gives theoverall noise impact per approach angle; it shows themaximum instantaneous noise level change, ∆LA,max,and exposure level change, ∆SEL, at the approachcertification point (CP). Clearly, the noise impact de-creases with slope angle. Yet, a more holistic impactassessment requires to also include the emissions im-pact of the steeper approaches, as shown next. Inte-grated plots containing noise and emissions impact forthe cases examined are summarised in Section 3.4.
3.1.2. Emissions assessmentThe typically used methodology in the UK for assess-ing civil aircraft emissions is the one recommendedby DEFRA [18]. Parameters required are the enginepower setting, the time period operating at that set-ting, as well as the associated fuel flow, engine SFCand the NOx Emissions Indices (EI). These param-eters are publicly available, e.g. in the ICAO data-bank [19] for the default operating modes, i.e. for theconventional approach/takeoff conditions. Values forunconventional operating modes are obtained throughinterpolation as described in [20]. Table V lists the re-sulting NOx EIs corresponding to the thrust settingsused in the steeper CDA approach profiles in Table I.
Figure 4 depicts the fuel consumption and emissionsimpact of various steep approach profiles for the A320-232. While fuel consumption increases with approachangle, descent at 5° seems to optimise NOx emission.
Table V. Estimated NOx EIs per descent angle, for theA320-232 engine.
App. angle 3° 3.5° 4° 4.5° 5° 5.5° 6°
EINOx (g/kg) 5.9 6.0 6.2 6.4 6.6 6.8 7.0
The dashed red line represents the NOx estimationsif the ICAO NOx EI is used for all approach angles,revealing the importance of accounting for the varia-tion of EI with engine power. The impact in terms ofboth noise and emissions is shown in Section 3.4.
3.2. Steep takeoff - Boeing 777-300
3.2.1. Noise assessmentThe noise impact is extracted by examining the take-off operation from the start of the ground roll (i.e.the brake release point) until climbing to an alti-tude where the SPL becomes lower than 20 dB fromthe maximum experienced SPL. The maximum noiselevel experienced is the maximum among all segments,whereas SEL derives through logarithmic addition ofthe segments’ noise exposure levels. Figure 5 depictsthe noise at source variation with takeoff angle andthe noise influence from varying the aircraft - CP dis-tance, for the two climb segments. Noise at sourcevaries in accordance with the flap settings and thrustrequirements listed in Tables II, IV.
Also, it is interesting to notice that the aircraft - CPdistance is smaller in the 12° takeoff trajectory thanin the default one. This is a result of both the addi-tional ground roll distance and the milder continuousclimb angle associated with the 12° profile (it mustbe underlined that this is true for the specific profilesused in this study. Other circumstances could havebeen assumed and used in the SAE-AIR 1845 calcu-lations, e.g. a variable thrust cutback height or otherflap/thrust settings, that would have led to differentprofiles and hence to different noise at CP. Neverthe-less, profile optimisation is out of the scope of thisstudy). Figure 6 illustrates the corresponding noiseplot implying that steeper takeoff slopes (at around9° – 10°) than the default offer small noise benefits.
3.2.2. Emissions assessmentEmissions impact assessment requires including dif-ferent takeoff segments and sub-segments. Fuel con-sumption requires not only including the ground-roll,which differs among takeoff profiles, but also settingfixed start and end mission points for all profiles, toensure objective comparison. Hence, the accountedtakeoff period starts from the start of roll and ends ata common point, E, of 2. Likewise, NOx emissions es-timation starts from the brake release point, but endsat the LAQ emissions altitude limit, i.e. 3000 ft.
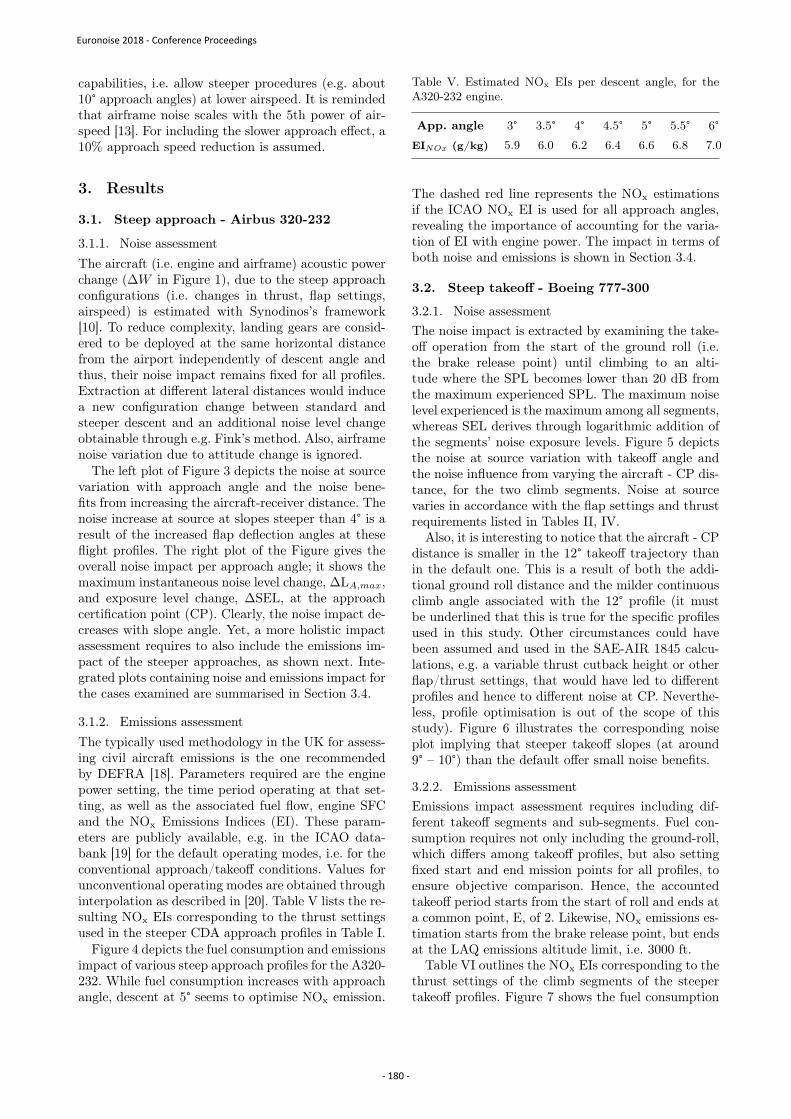
Table VI outlines the NOx EIs corresponding to thethrust settings of the climb segments of the steepertakeoff profiles. Figure 7 shows the fuel consumption
Euronoise 2018 - Conference Proceedings
- 180 -

3 3.5 4 4.5 5 5.5 6Approach Angle (Degrees)
-6
-7
-8
-5
-4
-3
-2
-1
0
Noi
se le
vel d
iffer
ence
(dB
)
∆ LA ma x ∆ SEL∆ LA , BWBmax ∆ SEL, BWB
A320-232 - Approach
3 3.5 4 4.5 5 5.5 6Approach Angle (Degrees)
-6
-8
-4
-2
0
2
4
6Le
vel d
iffer
ence
(dB
)Distance term, ∆ 20log(R)Noise at source term, ∆10log(W)Noise at source term, ∆10log(W), BWB
A320-232 - Approach
Figure 3. Left: Level difference due to variation of noise at source and of the distance between aircraft and CP withapproach angle. Right: Noise level difference at the approach CP between conventional and steeper approach profiles.
3 3.5 4 4.5 5 5.5 6Approach Angle (Degrees)
0
5
10
15
20
25
Fuel
con
sum
ptio
n di
ffere
nce
(kg)
3 3.5 4 4.5 5 5.5 6Approach Angle (Degrees)
0
10
20
30
40
50
60
70
80
90
CO 2 E
mis
sion
diff
eren
ce (k
g)
-0.18
-0.16
-0.14
-0.12
-0.1
-0.08
-0.06
-0.04
-0.02
0.02
0
NO
x Em
issi
on d
iffer
ence
(kg)
CO2
CO2, BWB
NOx, BWBNOx
NOx, Constant EI
A320-232 - Approach A320-232 - Approach
Figure 4. Variation of fuel consumption (left) and emitted amount of CO2 and NOx among different steep CDA approachprofiles for the A320-232. Crosses and circles represent BWB emission differences from the default A320-232 procedure.
Table VI. Estimated NOx EIs per takeoff profile for theBoeing 777-300 engine at the takeoff climb segments.
Prof. ID Seg. 1 2 3 4 5 6
EINOx In. 39.8 41.5 43.3 45.1 46.8 48.6(g/kg) C. 24.6 24.5 24.3 24.1 23.9 23.8
and emissions impact of various steep approach pro-files for the 777-300, implying that the default takeoffprofile is optimised in terms of fuel consumption.
3.3. Novel aircraft
The blue horizontal dotted lines in the left plot ofFigure 3 show the noise at source level difference be-tween the A320-232 at conventional 3° approach con-
figuration and the hypothetical BWB aircraft at vari-ous steeper descent configurations. Since it is assumedthat the BWB aircraft has no high-lift devices, theslight noise at source increase with slope angle resultssolely from increases in thrust requirements.
The grey and blue horizontal dotted lines in theright plot of Figure 3 represent the ∆LA,max and the∆SEL between the A320-232 conventional approachcase and the BWB steeper approach profiles. Clearly,noise benefits increase with approach angle. Consid-ering that BWB aircraft types could reach approachangles of around 10° this could lead to SEL reductionsof at least 5 dB at the takeoff CP. Besides, the smallLA,max noise benefits due to reducing the approachspeed were found meaningless in terms of SEL due tothe resulting elongation of the approach duration.
Euronoise 2018 - Conference Proceedings
- 181 -

4 5 6 7 8 9 10 11 12Takeoff Angle (Degrees)
-10
-5
0
5
10
Leve
l diff
eren
ce (d
B)
Initial climb - 777300
Distance term, Δ 20log(R)Noise at source term, Δ10log(W)
4 5 6 7 8 9 10 11 12Takeoff Angle (Degrees)
-10
-5
0
5
10
Leve
l diff
eren
ce (d
B)
Cont. climb - 777300
Distance term, Δ 20log(R)Noise at source term, Δ10log(W)
Figure 5. Level difference due to variation of noise at source and of aircraft to CP distance for the 777-300 at takeoff.
777300 - Takeoff
4 5 6 7 8 9 10 11 12Takeoff Angle (Degrees)
-15
-10
-5
0
5
10
15
Noi
se le
vel d
iffer
ence
(dB
)
LAmax SEL
Figure 6. Variation of noise level at the takeoff CP fordifferent steep takeoff profiles for the Boeing 777-300.
Figure 4 shows fuel consumption and emissions dif-ferences between the default A320-232 approach caseand the BWB profiles. The fuel consumption increaseis due to the slower approach and the assumption thatthe BWB uses conventional engines. Certainly, BWBconcepts will be equipped with novel propulsion so-lutions e.g. DEP [22], which combined with aerody-namic improvements and optimised (steeper than 6°)profiles are likely to notably reduce emissions impact.
3.4. Noise-emissions interdependencies
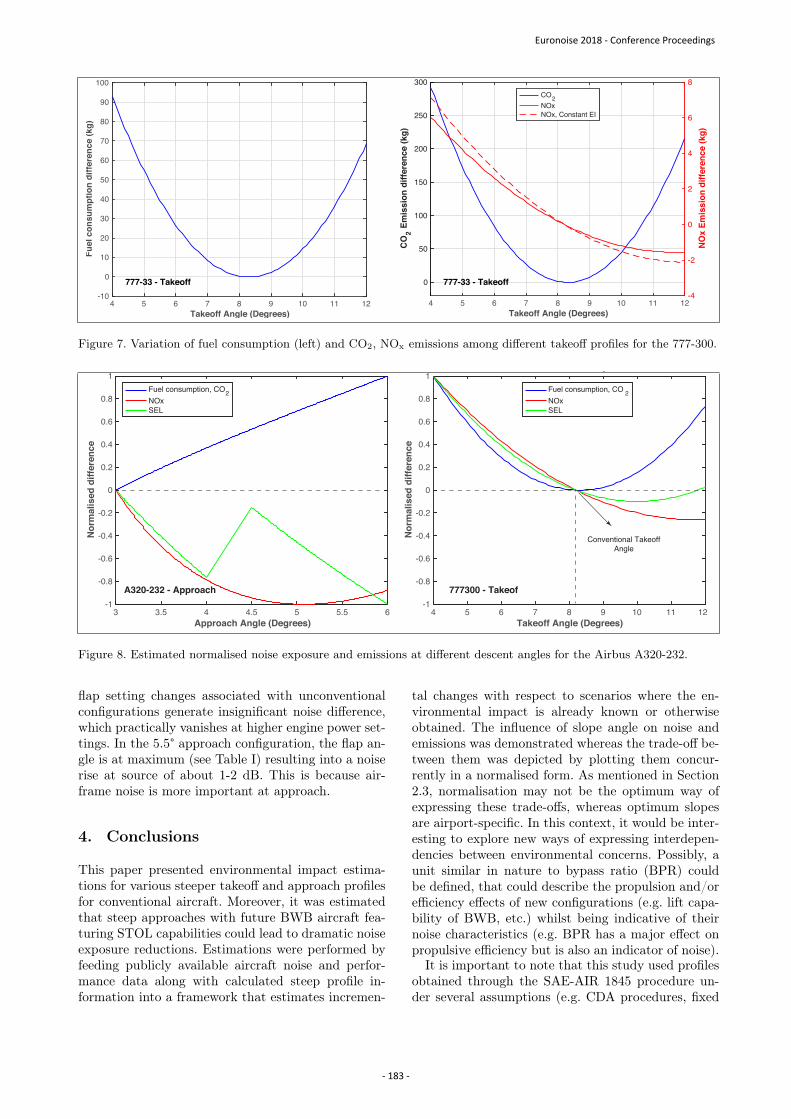
In Figure 8 the blue and red curves respectively depictthe estimated CO2 and NOx variation with operationangle, while the green curve represents the noise expo-sure impact. Generally, it is observed that noise bene-fits are ‘paid’ with increased fuel consumption. In theA320-232 approach case, both SEL and NOx decreasewith slope angle but at the expense of increased CO2
emissions. The abrupt SEL increase occurring at 4.5°results from the high flap settings used at approachessteeper than 4°. Similarly, the 777-300 takeoff SELimpact can be improved by 10% at takeoff angles ofaround 10°. Although this also results into a 20% NOx
emissions reduction, it comes at the expense of a 20%increase of fuel consumption. Hence, the default take-off configuration can be roughly characterised as theenvironmentally-optimum one, since it offers a bal-anced trade-off between noise and emissions impact.Similar behaviour is observed for the A320-232 takeoffand the 777-300 approach cases (see [20]).
3.5. NPD curves
A critical feature of the noise prediction frameworkby Synodinos et al. is its capability of computation-ally estimating NPD curves as analytically describedin [10]. In summary, NPD curves provide the rela-tionship between the noise level (in different singleevent noise metrics) of a given aircraft at a referenceflight speed and atmosphere, and the slant distancefrom the flight path at a number of engine power set-tings. They are the main input to tools that generatenoise exposure contour maps around airports, suchas FAA’s AEDT [23]. Typically, NPD curves derivethrough aircraft flyover noise measurements and aretherefore available only for existing aircraft and op-erations. Computationally derived NPD curves allowassessing the potential benefit of unconventional (e.g.steeper) operations and future aircraft concepts (i.e.for scenarios for which empirical data are unavailable)in terms of noise exposure reduction around airports.
Figure 9 shows estimated SEL NPD curves for tworepresentative cases: 5.5° approach for the A320-232,and 11° takeoff for the 777-300. Each curve representsa different engine power setting, F . Dashed lines de-pict NPD curves for the respective conventional op-erations. At takeoff, where engine noise dominates,
Euronoise 2018 - Conference Proceedings
- 182 -
4 5 6 7 8 9 10 11 12Takeoff Angle (Degrees)
0
50
100
150
200
250
300
CO
2 Em
issi
on d
iffer
ence
(kg)
-4
-2
0
2
4
6
8
NO
x Em
issi
on d
iffer
ence
(kg)
CO2NOxNOx, Constant EI
4 5 6 7 8 9 10 11 12Takeoff Angle (Degrees)
-10
0
10
20
30
40
50
60
70
80
90
100Fu
el c
onsu
mpt
ion
diffe
renc
e (k
g)
777-33 - Takeoff 777-33 - Takeoff
Figure 7. Variation of fuel consumption (left) and CO2, NOx emissions among different takeoff profiles for the 777-300.
3 3.5 4 4.5 5 5.5 6Approach Angle (Degrees)
-1
-0.8
-0.6
-0.4
-0.2
0
0.2
0.4
0.6
0.8
1
Nor
mal
ised
diff
eren
ce
Fuel consumption, CO2NOxSEL
4 5 6 7 8 9 10 11 12Takeoff Angle (Degrees)
-1
-0.8
-0.6
-0.4
-0.2
0
0.2
0.4
0.6
0.8
1
Nor
mal
ised
diff
eren
ce
777300 - Takeof
f
Fuel consumption, CO 2NOxSEL
Conventional TakeoffAngle
A320-232 - Approach
Figure 8. Estimated normalised noise exposure and emissions at different descent angles for the Airbus A320-232.
flap setting changes associated with unconventionalconfigurations generate insignificant noise difference,which practically vanishes at higher engine power set-tings. In the 5.5° approach configuration, the flap an-gle is at maximum (see Table I) resulting into a noiserise at source of about 1-2 dB. This is because air-frame noise is more important at approach.
4. Conclusions
This paper presented environmental impact estima-tions for various steeper takeoff and approach profilesfor conventional aircraft. Moreover, it was estimatedthat steep approaches with future BWB aircraft fea-turing STOL capabilities could lead to dramatic noiseexposure reductions. Estimations were performed byfeeding publicly available aircraft noise and perfor-mance data along with calculated steep profile in-formation into a framework that estimates incremen-
tal changes with respect to scenarios where the en-vironmental impact is already known or otherwiseobtained. The influence of slope angle on noise andemissions was demonstrated whereas the trade-off be-tween them was depicted by plotting them concur-rently in a normalised form. As mentioned in Section2.3, normalisation may not be the optimum way ofexpressing these trade-offs, whereas optimum slopesare airport-specific. In this context, it would be inter-esting to explore new ways of expressing interdepen-dencies between environmental concerns. Possibly, aunit similar in nature to bypass ratio (BPR) couldbe defined, that could describe the propulsion and/orefficiency effects of new configurations (e.g. lift capa-bility of BWB, etc.) whilst being indicative of theirnoise characteristics (e.g. BPR has a major effect onpropulsive efficiency but is also an indicator of noise).
It is important to note that this study used profilesobtained through the SAE-AIR 1845 procedure un-der several assumptions (e.g. CDA procedures, fixed
Euronoise 2018 - Conference Proceedings
- 183 -

0 1000 2000 3000 4000 5000 6000 7000 8000Distance (m)
40
50
60
70
80
90
100SE
L (d
BA
)
Approach - A320232
F= 8896.4 NF= 12010.1 NF= 26689.2 N
5.5o ConfigurationTypical Configuration
Linetypes:
Line colours:
0 1000 2000 3000 4000 5000 6000 7000 8000Distance (m)
50
60
70
80
90
100
110
120
SEL
(dB
A)
Takeoff - 777300
F= 142342.4 NF= 186824.4 NF= 231306.4 NF= 275788.4 NF= 320270.4 NF= 355856.0 N
11o ConfigurationTypical Configuration
Linetypes:
Line colours:
Engine power
Engine power
Figure 9. Estimated SEL NPD curves for the A320-232 at steep descent (left) and the 777-300 at steep takeoff configu-ration. Dashed lines represent published NPDs for the conventional operations. F denotes thrust setting.
thrust cutback height, landing gears deployment atfixed distance from the airport, etc.). Profiles canbe optimised for steep operations leading to differ-ent results. Finally it is reminded that steep opera-tions combined with technological advances (e.g. newaircraft concepts, propulsive efficiency improvements,quieter engines/airframe, etc.) could lead to furtherreductions of the civil aviation environmental impact.
Dedication
This paper is dedicated to my wonderful mother,Sophia Synodinou, and my beloved father Panagio-tis Synodinos, who passed away on 22 February 2018.
References
[1] Airbus Global Market Forecast: Growing Horizons2017-2036, (2017).
[2] International Civil Aviation Organization (ICAO):Global Air Transport Outlook To 2030 And TrendsTo 2040 (2016).
[3] NASA: Global Climate Change. Vital Signs of thePlanet. [Online] http://climate.nasa.gov.
[4] European Commission (EC): Flightpath 2050 (2011).[5] A.P. Synodinos, R.H. Self, A.J. Torija: Noise assess-
ment of aircraft with distributed electric propulsionusing a new noise estimation framework. Proc. ICSV24 (2017).
[6] H.H. Toebben, V. Mollwitz, et al.: Flight testing ofnoise abating required navigation performance proce-dures and steep approaches. Journal of Aerospace En-gineering 228 (2013) 1586-1597.
[7] V. Mollwitz, B. Korn: Steep segmented approaches foractive noise abatement - A flyability study. Proc. ICNS2014.
[8] J. Henderson, E. Boorman, et al.: Slightly Steeper Ap-proach Trial Report (2016).
[9] London City Airport: Noise Action Plan 2013 - 2018(2014).
[10] A.P. Synodinos, R.H. Self, A.J. Torija: Frameworkfor Predicting Noise-Power-Distance Curves for NovelAircraft Designs. Journal of Aircraft 55 (2018) 781-791.
[11] M. F. Heidmann: Interim Prediction Method for Fanand Compressor Source Noise (1979).
[12] M. J. Lighthill: On sound generated aerodynami-cally I. General theory. Proc. Royal Society of London(1952), 564-587.
[13] M. R. Fink: Airframe Noise Prediction Method, Tech-nical Report FAA- RD-77-29 (1977).
[14] Eurocontrol: The Aircraft Noise andPerformance (ANP) Database. [Online]http://www.aircraftnoisemodel.org (2018).
[15] S. Bauer: An aerodynamic assessment of micro-draggenerators (MDGs). Proc. 16th AIAA Applied Aero-dynamics Conference, 1998.
[16] N. E. Antoine, I. M. Kroo: Aircraft Optimization forMinimal Environmental Impact. Journal of Aircraft 41(2004) 790-797.
[17] SAE International: Procedure for the Calculation ofAircraft Noise in the Vicinity of Airports, TechnicalReport SAE AIR1845A, (2012).
[18] DEFRA Global Atmosphere Division: Revision to theMethod of Estimating Emissions from Aircraft in theUK Greenhouse Gas Inventory, (2004).
[19] EASA: ICAO Aircraft Engine Emissions Data-bank. [Online] http://easa.europa.eu/document-library/icao-aircraft-engine-emissions-databank,(2018).
[20] A.P. Synodinos: A new framework for estimatingnoise impact of novel aircraft. PhD Thesis, Universityof Southampton, (2017).
[21] Y. Guo, C. L. Burley, R. H. Thomas: On Noise As-sessment for Blended Wing Body Aircraft. Proc. 52ndAerospace Sciences Meeting, 2014.
[22] E. M. Greitzer, et al.: N+3 Aircraft Concept Designsand Trade Studies. Volume 1, (2010).
[23] J. Koopmann, A. Hansen, S. Hwang, et al.: AviationEnvironmental Design Tool (AEDT) Version 2d Tech-nical Manual, FAA, (2017).
Euronoise 2018 - Conference Proceedings
- 184 -