evaluation of downtime in milling system with approach to failure...
TRANSCRIPT
International Journal of Engineering & Technology IJET-IJENS Vol:17 No:01 1
173001-2626-IJET-IJENS © February 2017 IJENS
I J E N S
Evaluation of Downtime in Milling System
with Approach to Failure Reporting Analysis
and Corrective Action System
Tri Susanto, Aurino RA Djamaris, Mirsa D. Novianti, Fidya Ayumi
Tri Susanto: Department Of Industrial Engineering, Universities Bakrie, Indonesia ([email protected]) Aurino RA Djamaris: Department of Management, Universities Bakrie, Indonesia ([email protected])
Mirsa D. Novianti: Department of Industrial Engineering, Universities Bakrie, Indonesia. ([email protected])
Fidya Ayu Saomi: Department Of Industrial Engineering, Universities Bakrie, Indonesia. ([email protected])
Abstract— Poor implementation of tracking failure, analysis
root of the problem, and verify the corrective action which takes
place continuously, will increase the failure. Corrective
implementation action which only the failure symptoms handles
and doesn't really fix the root problem of failure. Note that the
Milling System Area is the area most often repeated failure, so
the exact failure identification to prevent any failure that occurs
and preventive actions have to be done so that the machine can
still reliable. Based on Pareto analysis obtained level of downtime
that occurs in the area of the largest Milling System i.e. i.e.
37.5%, caused by damage to the cement mill with the kind of
common problems, such as spilling material on inlet process
prior to grinding mill (grinding). Efforts to address the failure on
the machine with the use of the FRACAS (Failure Reporting,
Analysis and Corrective Action System), which includes the
observation of failures that occur, and then documented the
symptoms of failure that occurs. After verifying that the failure
of the items fail performs failure analysis using the form
FRACAS, looking at the history of similar failure then
determining corrective action based on the results of the analysis.
Index Term— component; failure, corrective action, failure
reporting, downtime.
I. INTRODUCTION Companies in doing business with the use of production
assets is not reliable, then failure in carrying out its functions,
so that the targets set previously not achieved optimally It
would result in operational costs and maintenance costs
become greater than had been planned previously. At the
moment there are not many companies in Indonesia which
gave serious attention in preparing for production planning,
so it takes a good maintenance activities and routine
operational activities taking place at the time to keep the
availability of such assets [1]. The more also occurred at a
cement factory PT X, a less noticed production planning
correctly, tool to document, implement, and associate the
FRACAS as a major element to achieve success in the
program reliability.
Failure to operate the equipment in production with a
recurring right in PT X, then is drawn the conclusion that the
level of analysis of the root of the problem in PT X still less
appropriate. Poor implementation of tracking failure, analysis
of the root of the problem, and verification of corrective
action that keeps happening, would boost failure. The
implementation of the corrective action which only handles
the failure symptoms only and does not really solve the root
problem of failure [2], is also the cause of the failure is often
repetitive. Therefore, the need for comprehensiveness in
defining a formal process for reporting failures and corrective
actions in order to encourage improvement in the field of
reliability, availability, and maintenance [3]
The need for comprehensiveness in the defining failure of
much needed given that the main engine used PT X is a
machine that comes from Switzerland that has been operating
for about 40 years. The length of the machine age are
increasingly encouraged to do a comprehensive system
design, integrative, effective and efficient so that the level of
reliability of the machine. This is not just a process of failure
identification completeness alone but is also required in order
for the preventive actions of the advice company party is
ready to tackle the downtime that may occur and the machine
did not experience downtime is getting worse.
In the Journal's Process-Oriented Development of Failure
Reporting, Analysis and Corrective Action System that
FRACAS is known as a tool to document, implement, and
associate the FRACAS as a major element to achieve success
in the program reliability. Eliminating the main cause of the
problem to increase the reliability of the product/service and
get the satisfaction of customers with timely delivery. On
early improvement, as it is known that implementation and
verification in corrective action more difficult and expensive
especially when the products have entered the age of mature.
II. LITERATURE REVIEW
According to [4], maintenance is an activity that is done
repeatedly with the goal of keeping the equipment always has
the same state conditions first. Maintenance is also done to
keep equipment remain in conditions that can be received by
users. Maintenance is an activity that is done deliberately to a
facility with a specific systematics embraced to achieve a
predetermined result [5]. Essentially, the maintenance is a
human activities conducted to maintain or take care of an
object/hardware so that it can continue to be used.
Referring to the strategy, in this case the repair will be
made after the failure of the equipment/termination or at the
time of the occurrence of severe performance degradation.

International Journal of Engineering & Technology IJET-IJENS Vol:17 No:01 2
173001-2626-IJET-IJENS © February 2017 IJENS
I J E N S
This strategy is widely applied in manufacturing industries
before 1950. At this stage, the engine served when needed
major improvement. This concept has weaknesses with the
termination of the operation was not planned before, the
damage repeatedly, the problem of spare parts, repair costs,
waiting time and troubleshooting the higher [6]
Preventive Maintenance
This concept is explaining to do physical examinations over
the equipment to prevent damage and prolong the age of
service equipment within a certain period or duration of the
operation of the machine [7]. During this period, the
maintenance functions implemented and time-based care
activities (Time based Maintenance – TBM) customarily done
Paid (1997) (as cited in [8]). Preventive Maintenance is
carried out on the basis of the estimated probability that
equipment will experience a decrease in performance or
damage at the specified interval. Preventative maintenance
performed includes lubrication, cleaning equipment, spare
part replacement, adjustment and inspection.
Predictive Maintenance
Predictive maintenance is often also referred to as
maintenance based on condition (Condition Based
Maintenance – CBM). In this strategy, the action taken in
response to the treatment condition of certain equipment or
when the equipment experiencing the declining of
performance. Diagnostic techniques are used to measure the
condition of physical equipment such as engine temperature,
noise, vibration, lubrication and corrosion. When one or more
of these indicators reach a predetermined threshold,
maintenance initiatives underway to develop equipment to the
desired conditions. This means that the equipment is removed
from the production line only if there is direct evidence that
there has been noticeable performance deterioration.
Predictive maintenance based on the same principle of
preventative maintenance even though it uses different
criteria to determine a specific maintenance needs. Another
plus is that the need to perform maintenance occurs only
when the need is real, and not after the passage of a certain
period [7].
Corrective Maintenance
Introduced in 1957, in which the concept to avoid equipment
failure equipment reliability improvement being expanded so
that equipment failure can be removed (increased reliability),
and equipment can be easily maintained (maintenance of
equipment upgrade). The main difference between corrective
and preventive maintenance is that the problem should exist
before any corrective action taken [8]. The purpose of
corrective treatment is improving the reliability of the
equipment, the ability of the maintenance, design flaws
(material, shape), equipment undergoing structural reform,
reduce damage and failure, and the aim has been achieved the
condition maintenance-free tools.
Reliability Centred Maintenance (RCM)
The reliability of a product or system to convey the concept
of reliable or the system successfully operates in the absence
of failure. Reliability is also defined as the probability of an
item, be it goods or intermediate goods, which will be used at
the next stage without experiencing failure in a specific time
period. The concept of reliability is a type of engineering
application in creates a risk [4].
On the concept of reliability, reliability concept involves a lot
more, among others, the following:
a. Reliability Prediction or predicted reliability, basically the
type of reliability concepts this is kind of related to the use
of models, the past history of the same product in an
attempt to predict reliability and products in the design
phase. The process can be updated on the next step in the
effort to predict reliability.
b. Reliability assessment or the assessment of reliability, it is
associated with the estimation of reliability based on
actual data, which may be in the form of test data,
operational data, and so on. The system involves
modelling, goodness of fit for a probability distribution,
and related analysis.
c. Reliability optimization covers many areas and related to
the achievement of a suitable trade-off between various
competing objectives such as performance, cost, and so
on.
d. Reliability test design or reliability test design with regard
to the method for obtaining the validity, reliability and
accurate data.
e. Reliability Data Analysis or the reliability of the analysis
can be related to parameter estimation, selection
distributions, and many other aspects.
High cost motivated engineers to find a solution to the
problem of reliability in reducing expenses, increasing the
production quality, timely order delivery by means of
increasing the availability of the equipment, and reduces
problems arising from products that failed and costs are cheap
and easy. In the context of the calculation of financial
management, measurement of reliability in a system or
equipment by calculating the annual fee which will be
removed from the equipment. When assets are used in the
placement of high reliability it will reduce the cost of failure
of equipment. Reliability is often formulated as follows:
(1)
Reliability system with many components is defined as
follows:
R= Rcomp.A + Rcomp.B + …+ Rcomp.N (2)
While the general reliability calculation based on
consideration of mode against early failure, which can be

International Journal of Engineering & Technology IJET-IJENS Vol:17 No:01 3
173001-2626-IJET-IJENS © February 2017 IJENS
I J E N S
referred to as figures of early failures (decrease in failure
rates that will come over time) or wear the usage mode (i.e.
the increasing failure over time). The main parameters that
describe the reliability are:
a. Mean Time To/Between Failure i.e. the average distance
between each time failings
b. Mean Time To Repair (MTTR) i.e. an average distance
of time used to make improvements
c. Mean Life to Component i.e., the average age of
component
d. Failure Rate i.e. the average equipment failure at a given
unit of time
E. Maximum Number of Failure i.e. maximum equipment
failure at a specific time
Probability here contains the notion that quantitative in
nature because it usually will be revealed with the quantitative
values is a number in the form of a percentage or a decimal.
The value of reliability is between 0-1, a value of 0 means
very low reliability and component cannot be used. Whereas a
value of 1 indicates high reliability. To determine the
reliability in connection operational required a more specific
definition. The first is a description of a well-defined failure
so it is not confusing and it can be observed. The second is the
identification of the unit of time (in units of the machine
cycles or calendar time).
Weibull distribution
Weibull Distribution the empirical distribution is the most
widely used and most appear on all the characteristics of the
failure of the product due to the third phase includes the
damage that may have occurred in the distribution of damage.
The two parameters used in this distribution are called with
parameter θ scale (scale parameter) and β is referred to as
parameter form (shape parameter). Reliability function
contained in the Weibull distribution [10]:
Reliability Function:
R(t) =
(3)
Ɵ > 0, β>0, and t > 0
In the Weibull distribution to determine the extent of
damage from a data pattern that is formed is a parameter.
Change the values of the parameter form (β) which shows the
rate of damage can be seen in the following table. If the
parameter β is affecting the rate of damage then θ parameter
affects the central values of data.
TABLE I
WEIBUL DISTRIBUTION SHAPE PARAMETER
VALUES
Value Rate Of Damage
0 < β < 1 Deceasing failure rate ( DFR)
β = 1 Constant failure rate (CFR)
Exponential Distribution
1 < β < 2 Increasing failure rate (IFR)
Concave-shaped curves
β =2 Linier Failure Rate (LFR)
Rayleigh Distribution
β > 2 Increasing failure rate (IFR)
Convex-shaped curves
3 < β < 4 Increasing failure rate (IFR)
Symmetrical shaped curve
Normal distribution
Source: Ebelling, 1997.
Reliability with Preventive Maintenance
Increased reliability is preventive maintenance. With
preventive maintenance then the influence of the wear out the
engine or component can be reduced and shows significant
results against the age of the system. Reliability can be
expressed as follows:
Rm(t) = R(t) for 0 ≤ t < T (4)
Rm(t) = R(T).R(t-T) for T ≤ t < 2T (5)
Note:
t = Time
T = Time interval replacement of damage prevention
R(t) = Reliability system without preventive
R(T) = The odds of reliability between time t-T after the
system is restored from the initial conditions at time T
Rm(t) = Reliability of a system with preventive maintenance
In General its equation is:
(6)
n = 1,2,3,…
Description:
N = the number of treatments
Rm(t) = reliability of a system with preventive maintenance
R(T)n = probability reliability up to n time lapse
R(t-nT) = Probability reliability for time t n T from the last
act of preventive maintenance
For constant damage rate
International Journal of Engineering & Technology IJET-IJENS Vol:17 No:01 4
173001-2626-IJET-IJENS © February 2017 IJENS
I J E N S
(7)
Based on the formula above prove that the exponential
distribution which has a constant rate of damage, when
carried out preventive maintenance will not produce any
impact. Thus, there is no increase in reliability as expected
because the Rm(t) = R(t). However, if the value is not
constant breakage rate enables preventive maintenance do not
increase the reliability of the equipment. At that point the
solution used is better is the replacement of an engine [11].
Background of FRACAS
Reliability is one of the major dimensions of the quality
performance of a machine or components and can be defined
as the ability of a component or system works in accordance
with its functions based on the needs in accordance with the
time period specified [12]. FRACAS is the management tools
with the aim of identifying and correcting deficiencies that
exist to prevent the problem reoccur [13]; [14] provides
historical data for statistical analysis [12] and improve the
quality and performance of a machine or components.
FRACAS may also be defined as a system that ensures all
failures and damage reported, analysed, and fixed by
corrective actions to prevent a similar failure occurs
repeatedly.
In the past, the U.S. Department of Defence (DOD)
implement the system reliability in the supply of guns with
the standard military official to determine "what" and "how"
it was run. The importance of FRACAS, it has been widely
known in various studies, the FRACAS was known as a tool
to document, implement, and associate the FRACAS as a
major element to achieve success in the program reliability.
Eliminating the main cause of the problem to increase the
reliability of the product/service and get the satisfaction of
customers with timely delivery. More emphasis on the use of
the FRACAS early improvement, as it is known that
implementation and verification in the corrective action more
difficult and expensive especially when the products have
entered the age of mature.
The importance of process failures by using the FRACAS,
because of the needs of the completeness of the
documentation as a guide in defining large problems to
achieve a reliability program running smoothly. In addition,
the effectiveness of this FRACAS in line with program
requirements needed to perform the corrective action which is
composed on ISO 9000 "Quality Management Standards".
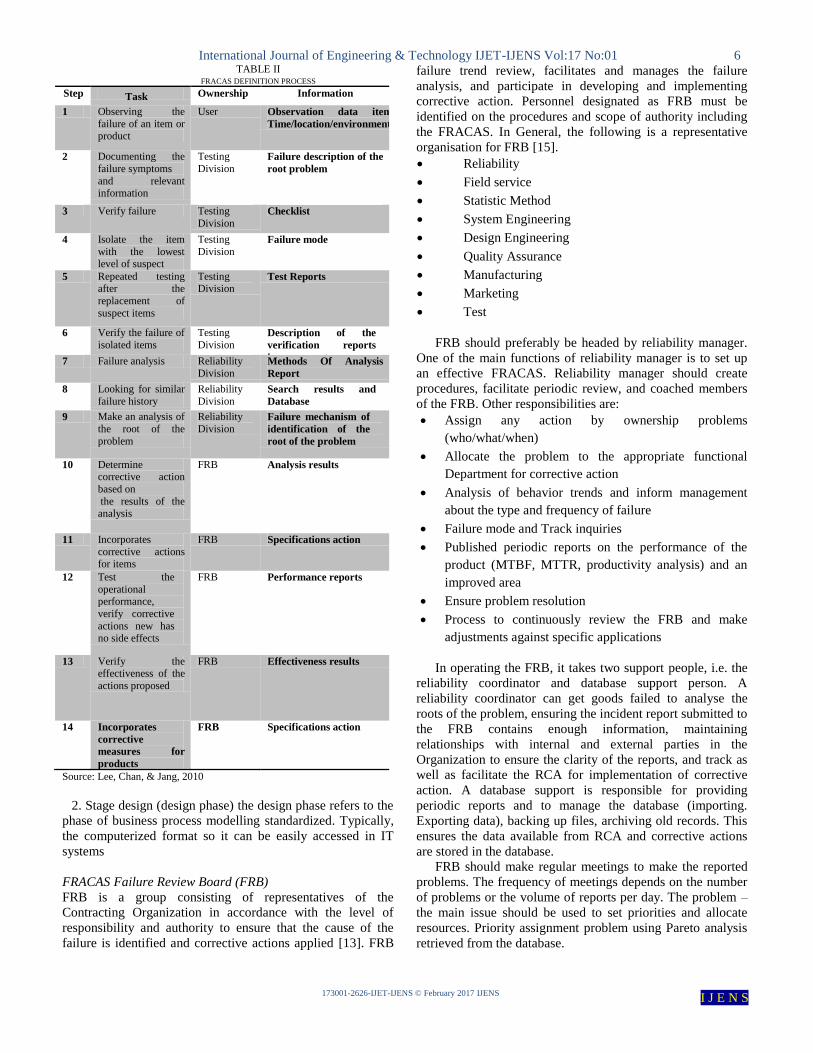
Table 2 shows the relationship between ISO 9000 and
FRACAS.
Figure 2 shows that the FRACAS was a closed-loop
system that involves all stakeholders. With the FRACAS
can be guaranteed that the entirety of the data retrieved
efficiently and process analysis of the root of the problem
is obtained in an effective manner.
III. METHODOLOGY
FRACAS Process
The use of the FRACAS is already heavily used in some
industries, for example in the military industry, railways, and
the semiconductor industry. In RAC, mentioning some of the
fundamental characteristics of the FRACAS, i.e.
Record and catch all the failures and problems related to
the components, processes, on the stage of development
and delivery of a product or service
Identify, select, and prioritize the failures and problems
to be analyzed and determined the roots of the problem
Identify, implement and verify corrective actions to
prevent the recurrence of the failure of the root causes or
issues
Providing all personnel with access to all information
about the failure analysis and corrective actions to
support the development of reliability and proactive
decisions to prevent a repeat of the same mistake later
on
FRACAS underscores the need to document the
guidelines relating to the definition, implementation, and
customization of FRACAS as a major element to achieve the
success of the program reliability. FRACAS basing on the
fact that the initial cause of the failure is identified and
corrective measures are implemented, the sooner the
manufacturer and users aware of the advantage against a
reduction in the occurrence of the failure factory or field. The
output of the information obtained from the FRACAS,
namely identify and verify the explanations of the correct and
accurate so that corrective actions can be taken appropriately
to prevent failure occurred again.
FRACAS Failure Process Analysis
Analysis of the failure is a condition in the roots of the
problem identification stage. Each failure must be verified
until the found factors cause the occurrence of failure [15]. In
the process of data collection, a lot of problems occur is
unknown due to the insufficiency of information available.
There are three main causes of the loss of important data, i.e.:
Inspection and testing that began before the existence of
the procedure of reporting failures.
Reporting Form that is difficult to use
Patroller/inspector who fill out the form of the failure is
not yet fully familiar with the goals and purpose of
making the form
In the reporting form of charging failure, the inspector or
the operator normally be first in identifying problems,
therefore, they should get the training well in advance in
order to capture all the information needed in reporting the
incident [15].
The analysis process consists of:
detailed Inspection reports from the field
Collecting historical data from the database pertaining to
or have the same failure
International Journal of Engineering & Technology IJET-IJENS Vol:17 No:01 5
173001-2626-IJET-IJENS © February 2017 IJENS
I J E N S
Determine the parties responsible for the action of the
root problem analysis
Develop corrective actions put together a broken item
for analysis of the root of the problem report analysis
Problem analysis report (PAR) and if necessary report
the disposition of materials/material disposition report
(MDR).
The Process Analysis of the Root Problem
The process analysis of the root problem is one of the
important process in determining the success of the
deployment FRACAS, this is due to any corrective action
taken be correct if the process of problem identification and
analysis of failure are also appropriate. Searches the root of
this issue aim to uncover the underlying reason or cause of
error corrective action taken so that it can fix the failures that
existed and to prevent the recurrence of the failure for a
repeat in the future. The effectiveness of the FRACAS was
limited to the accuracy of the data entered at the time of the
initial report. At least the reporting failure to contain
information that is most basic
Who is find the failure damaged
What (and what specific indications of failure)
Failures occur when the failure happening
How the condition can happen
FRACAS Framework
FRACAS is used by many functional disciplines including
reliability, design, testing, factories, quality control, and
maintenance. In order to overcome the barriers between
organizations, established a methodology in developing the
FRACAS. The reason why the FRACAS has the process in
the form of close loop i.e. so that engineers can monitor and
analyse your products/services on an ongoing basis in
improving the reliability of components or machines. A
circle formed provides programs to increase reliability
through repeated reporting process and the planned corrective
actions. With FRACAS provides information about system
failure, how and why failure can occur, and how to prevent
the fiasco happen again in the future. Documentation of
quality in determining the effectiveness of FRACAS in
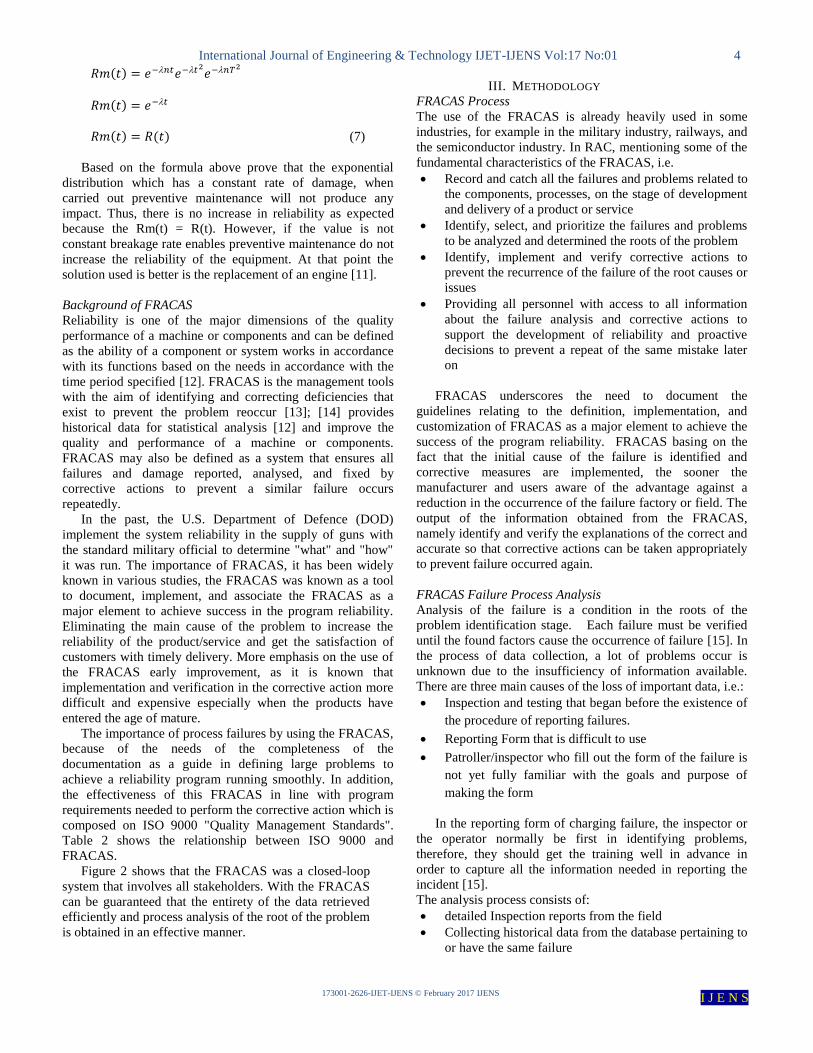
generating an acceptable solution [12]; [2].
Source: Lee, Chan, & Jang, 2010
Fig. 1. Close Looped Failure Reporting, Analysis and Corrective Action
System
Close Looped Failure Reporting, Analysis and Corrective
Action System
There are two phases in the FRACAS made it a business
process [12]:
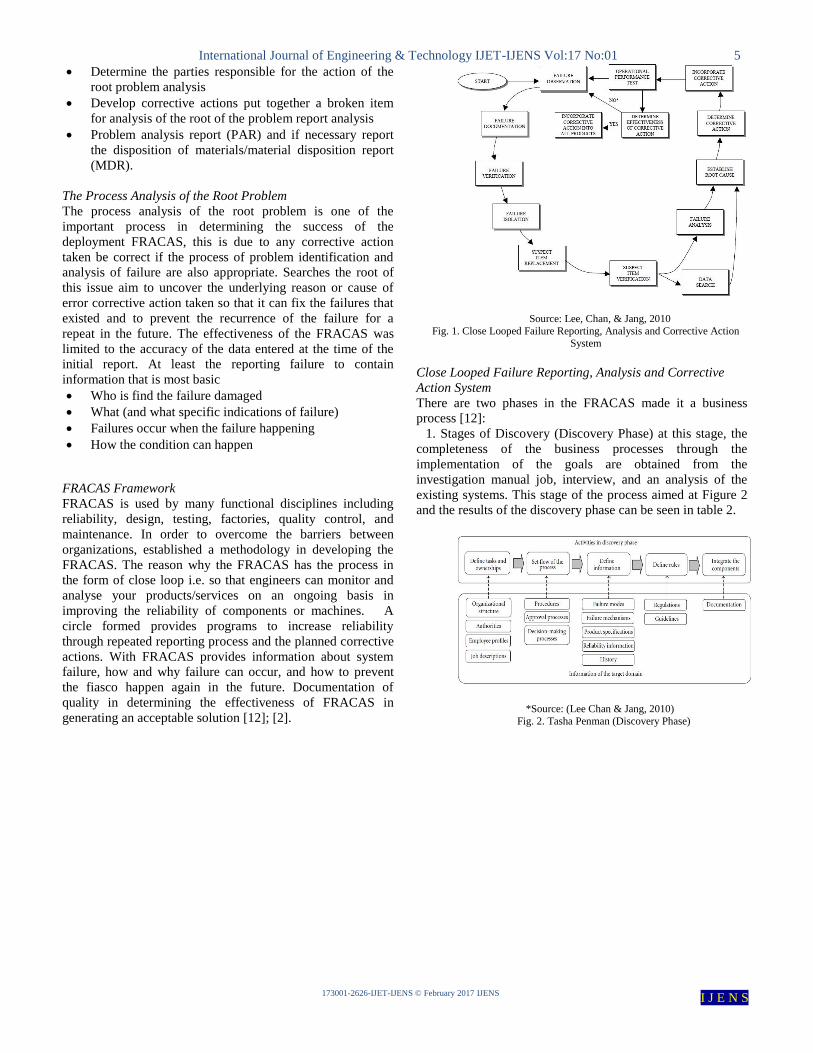
1. Stages of Discovery (Discovery Phase) at this stage, the
completeness of the business processes through the
implementation of the goals are obtained from the
investigation manual job, interview, and an analysis of the
existing systems. This stage of the process aimed at Figure 2
and the results of the discovery phase can be seen in table 2.
*Source: (Lee Chan & Jang, 2010)
Fig. 2. Tasha Penman (Discovery Phase)
International Journal of Engineering & Technology IJET-IJENS Vol:17 No:01 6
173001-2626-IJET-IJENS © February 2017 IJENS
I J E N S
TABLE II FRACAS DEFINITION PROCESS
Step Ownership Information
1 Observing the
failure of an item or product
User Observation data item
Time/location/environment
2 Documenting the
failure symptoms
and relevant information
Testing
Division Failure description of the
root problem
3 Verify failure Testing
Division Checklist
4 Isolate the item
with the lowest level of suspect
Testing
Division Failure mode
5 Repeated testing after the
replacement of
suspect items
Testing Division
Test Reports
6 Verify the failure of
isolated items
Testing
Division Description of the
verification reports
improvements 7 Failure analysis Reliability
Division Methods Of Analysis
Report
8 Looking for similar
failure history
Reliability
Division Search results and
Database
9 Make an analysis of
the root of the
problem
Reliability
Division Failure mechanism of
identification of the
root of the problem
10 Determine corrective action
based on
the results of the analysis
FRB Analysis results
11 Incorporates
corrective actions
for items
FRB Specifications action
12 Test the
operational performance,
verify corrective
actions new has no side effects
FRB Performance reports
13 Verify the effectiveness of the
actions proposed
FRB Effectiveness results
14 Incorporates
corrective
measures for
products
FRB Specifications action
Source: Lee, Chan, & Jang, 2010
2. Stage design (design phase) the design phase refers to the
phase of business process modelling standardized. Typically,
the computerized format so it can be easily accessed in IT
systems
FRACAS Failure Review Board (FRB)
FRB is a group consisting of representatives of the
Contracting Organization in accordance with the level of
responsibility and authority to ensure that the cause of the
failure is identified and corrective actions applied [13]. FRB
failure trend review, facilitates and manages the failure
analysis, and participate in developing and implementing
corrective action. Personnel designated as FRB must be
identified on the procedures and scope of authority including
the FRACAS. In General, the following is a representative
organisation for FRB [15].
Reliability
Field service
Statistic Method
System Engineering
Design Engineering
Quality Assurance
Manufacturing
Marketing
Test
FRB should preferably be headed by reliability manager.
One of the main functions of reliability manager is to set up
an effective FRACAS. Reliability manager should create
procedures, facilitate periodic review, and coached members
of the FRB. Other responsibilities are:
Assign any action by ownership problems
(who/what/when)
Allocate the problem to the appropriate functional
Department for corrective action
Analysis of behavior trends and inform management
about the type and frequency of failure
Failure mode and Track inquiries
Published periodic reports on the performance of the
product (MTBF, MTTR, productivity analysis) and an
improved area
Ensure problem resolution
Process to continuously review the FRB and make
adjustments against specific applications
In operating the FRB, it takes two support people, i.e. the
reliability coordinator and database support person. A
reliability coordinator can get goods failed to analyse the
roots of the problem, ensuring the incident report submitted to
the FRB contains enough information, maintaining
relationships with internal and external parties in the
Organization to ensure the clarity of the reports, and track as
well as facilitate the RCA for implementation of corrective
action. A database support is responsible for providing
periodic reports and to manage the database (importing.
Exporting data), backing up files, archiving old records. This
ensures the data available from RCA and corrective actions
are stored in the database.
FRB should make regular meetings to make the reported
problems. The frequency of meetings depends on the number
of problems or the volume of reports per day. The problem –
the main issue should be used to set priorities and allocate
resources. Priority assignment problem using Pareto analysis
retrieved from the database.
Task

International Journal of Engineering & Technology IJET-IJENS Vol:17 No:01 7
173001-2626-IJET-IJENS © February 2017 IJENS
I J E N S
Business Process Maintenance Corrective FRACAS
FRACAS is the tools used to identify and correct deficiencies
in a system or component, with FRACAS is believed to
process evaluation of downtime can run effectively and
prevent the failure being repeated again. The purpose of the
FRACAS as the provision of Engineering data that can be
used for corrective activity so that the data will be retrieved
historical reliability (Mean Time between Failure, Mean Time
to recover, availability, etc.), the development of something
that was still lacking and the provision of data for statistical
analysis. Basically, the use of the FRACAS has two main
perspectives, reliability-related information and operational
tasks. The information in the form of field data, report failure,
product specifications or part, and a profile that is associated
with the Engineer. Handling failure basically starting from the
data collection process is a failure; it is intended to failure
quickly handled.
One method that can be applied in dealing with the
downtime at Company PT X i.e. deployment FRACAS.
Deployment further FRACAS in the industry followed with
(1) the level of reliability and its attributes (in due dates,
ownership, and responsibility) that should be clearly clarified
and have been standardized; (2) the handling of Functionality
must be supported with the automation of tasks and
controlling processes. Corrective maintenance business
process description with FRACAS serves to provide an
explanation about the working of the system in terms of the
implementation of maintenance equipment factory in dealing
with the downtime that occurs. This procedure applies not
only at the Department of Mechanical environment PT X
only, but also include other stakeholders i.e. supplier, QA,
Dept. of production and management.
Source: Vila court & Govil.1993-1994. Failure Reporting, Analysis, and
Corrective Action System, SEMATECH Inc.
Fig. 3. FRACAS Process
IV. ANALYSIS AND RESULTS
Analysis of Downtime with Deployment FRACAS PT X
Any failures that occur during the inspection and testing
process reported in accordance with the applicable procedures
including in terms of gathering information and data recap
and time recorded. The data includes a reports must be
verified and then collect in the form of a simple (easy to use
form). In accordance with the structure of the organization
that is run at PT X has a Department of Mechanical
Maintenance as a special Department to perform maintenance
on the machine – a machine that exists. The magnitude of the
downtime that occurs in the Area of 561, resulting in reduced
productivity in producing cement Milling System in PT X.
failure happened caused by the subsystem of Milling System
is experiencing a reduction in reliability.
Milling System (MECAREA II) on PT X is the central area
of the production process are performed, so the parties often
seek to add to the design development on these areas to create
better production processes. Execution of development in this
area began in 2006; with the construction of the first phase is
done starting from the construction of the area of the Packer
which serves as packaging area, then to increase competitive
advantage in domestic cement industry development coupled
with the Milling area System as areas of grinding the material
up to now. Milling System consists of 5 subsystems which
were influential in the process of making cement. In Figure 4
shows the subsystems of the Milling System in cement
grinding process performed in PT X.
*Source: Company Data in 2012
Fig. 4. Milling System PT X (MECAREA II)
5 Subsystem in Milling System include:
1. Machine of Cement Mill
2. Bucket Elevator
3. Separator
4. Bag Filter
5. Air Slide
Downtime that occurred at PT X for example on the type
of failure that occurs in the Area of 561 i.e. use of Milling
System is not optimal, resulting in engine Cement Mill often

International Journal of Engineering & Technology IJET-IJENS Vol:17 No:01 8
173001-2626-IJET-IJENS © February 2017 IJENS
I J E N S
experience trip, besides grinding fresh material to overload
and resulting output does not match the standard. If the failure
is left continually impacted the reliability of machines
declined, which resulted in the appearance of defects that can
be detrimental to a company party. Therefore, in handling this
downtime required evaluation a thorough evaluation of each
stakeholder so that downtime with the same case doesn't
happen again and reliability as well as the resulting output
quality in compliance with the standard.
Corrective maintenance of the appropriate document Format
FRACAS
According to the vision to become a major player in national
economy, supported by an excellent workforce, quality
products, best service and integrated systems, required
evaluation of downtime are increasing from year to year. The
document reporting the failure (Failure Reporting Document)
that strongly supports the complete company party to achieve
the desired vision.
Collection and sharing of data through a report of the
incident became important in the deployment FRACAS,
either between the supplier and the company. There are main
elements in the reporting failures (when failure occurs, what
items are experiencing failure, etc.) that can be analysed the
failures experienced by the company and the supplier. The
other main information includes the duration of the failure,
the time used for repair and type matrixes used (time).
Each data sheet was very helpful. On the use of the
FRACAS, the supplier is requested to get detail information
from reports the failure on the part of the equipment. This can
help to determine the shape of the operation before and after
failure and also to determine the root of the failure of the
equipment effectively and efficiently. The table shows the
type of proposal form proposal form of failure that can be used
by the Inspector and Draft man in Milling System failures
reported to the Supplier. With the form, the company may use
the data to evaluate management tools and resources that are
required to determine the value of their effectiveness in the
deliberations of the evaluation at the time of the meeting.
TABLE III PROPOSED SYSTEM FAILURE DATA FORM AS AN EVALUATION
RESOURCESCAS DEFINITION PROCESS
Event Report Fields E
x
a
m
p
l
e
Description
Serial number
561 - BM
Identification location
system failure
Date and Ti me of Event 07.12.15 Info of event
Duration of Event
(downtime)
3.25h Duration of failure
Failed Item Description inlet head mil
couldn't fill all material
grid nidi ng process s
Description of failure
Reliability/Fault Code of
known Problems
BM - Inlet - 01 Failure code
Downtime Category
(Maintenance a cti on)
Unscheduled Failure category
Opera tor's name Mr. Ha mi d Those who reported
Event
(Problem Description)
Cement mill has
been
blocking a t inlet
mill and tri p
because of mi l overhead t
Description of failure
Document corrective action
PT X has document corrective action in the form of a
notification and Finding a List then processed into document
MUWOS/MUWOL. Figure 4.9 shows a sample Notification
creation and Finding Lists that have been applied in PT X. in
reporting the failure as in the picture above, the findings
obtained does not contain elements of the analysis, as the
analysis process is not well documented such as the rule-
making process of the FRACAS.
Component on Finding List obtained in the form of:
A description of the failed items that must be improved,
Improvement, priority Number Estimation of material
used,
The number of the item to be replaced,
Man power in charge of fixing, and the types of damage
are written in the column remarks.
While in the notification form, existing components, namely:
Title notification date and time the notification priority
Types
Repair (urgent/preventive/long shutdown)
Repair location/Area name request work
name work received responsible Department
In making the documentation for corrective actions starting
from the Notification List/Finding finally processed into work
orders. In making a work order will be published
MUWOS/MUWOL to run the maintenance process. The thing
that differentiates with FRACAS is making process after he
made work orders created documentation failure report
includes documentation of root cause analysis and storage of
International Journal of Engineering & Technology IJET-IJENS Vol:17 No:01 9
173001-2626-IJET-IJENS © February 2017 IJENS
I J E N S
photographic file as evidence of failure that occurs. With the
use of a FRACAS in identifying the cause of the failure,
causing the need for adjustments to the standard Procedure
between PT X with FRACAS. Evaluation process downtime
done PT X using FRACAS (Failure Reporting, Analysis and
Corrective Action System) has the stages that in accordance
with a procedure to be executed.
Evaluation of failure on downtime by using a method
proposed by FRACAS form Problem Analysis Report (PAR),
in the form of this action will be carried out of the
investigation regarding the problems occurred.
1. Error code is filled in accordance with the number of
errors occurred, if an error has been occurred previously,
the inspector who filled it can write in accordance with
the previous code, but if not, the inspector can write new
code for the type of failure. Writing error code is useful
for measuring the effectiveness of corrective measures
after implementation.
2. Problem title is filled with the type of failure that occurs.
3. FRB member, filled with the party which found the
failure and will analyse the failure
4. Assignee, filled with parties that find and analyse the
failures occur.
5. Type of Problem, this column is divided between two
options, namely the common and unique. The company
can provide party checklist if the problems occurred are
common in the common column, and can affix checklist
in column unique if the problems occurred are new.
6. Category, in this column also gives the option. If the
type of error that occurred interferes with the working of
the machine at the time of operation, the company can
provide a checklist on this column, if the type of error
that occurred related to conditions in the warehouse, the
company can provide a checklist in the proc, and if an
error occurs is the category of the design of the
machines, the company can provide a checklist on the
category design times.
7. Date info, shows the date found problems.
8. Definition of the problem, in this column describes the
main conditions relating to the problems occurred and
how inspector categorizes that problems occur on
objects that are found.
9. Chronology, explained the chronology of failure that
occurs. Failure events are explained in clear and
coherently in order for failure can be identified by
either.
10. Root cause analysis, explaining the roots of the
problems occurred.
11. Action suggestion for no repetition, those suggestion
actions taken is determined from the results of the
analysis of the root of the problem. The overall cause of
the failure is discussed to determine long-term solutions
that might be applied so that the problem doesn't happen
again.
12. Constraints, obstacles that are obtained when need to do
repairs.
13. Action done & action plan including PIC, an action that
has been made in addressing the problem and planning
further action 2.
14. Approved by, is the column an endorsement signed by
Mechanical Dept. Head as party boss who agree about
problems that occur and agree to do corrective action as
well as the signature of planner as the parties agree to
promptly scheduled corrective actions in handling the
issue.
15. Prepared by, filled by parties that finds and analyse
problems
. Data Processing Time After Malfunction in a subsystem can
affect the reliability of the testing distribution is done then
every subsystem. The reason that he did the testing distribution
due to data that is used there is a variable time to change
continuously (continuous). So the prediction engine
maintenance can actually condition approaching then
performed testing the distribution of data – data damage. There
are two phases in determining the distribution of failure,
namely:
a. The identification of the/index distribution of candidates
fit distribution (exponential test, Weibull, lognormal and
normal).
b. Hypothesis Test (Goodness of fit test)
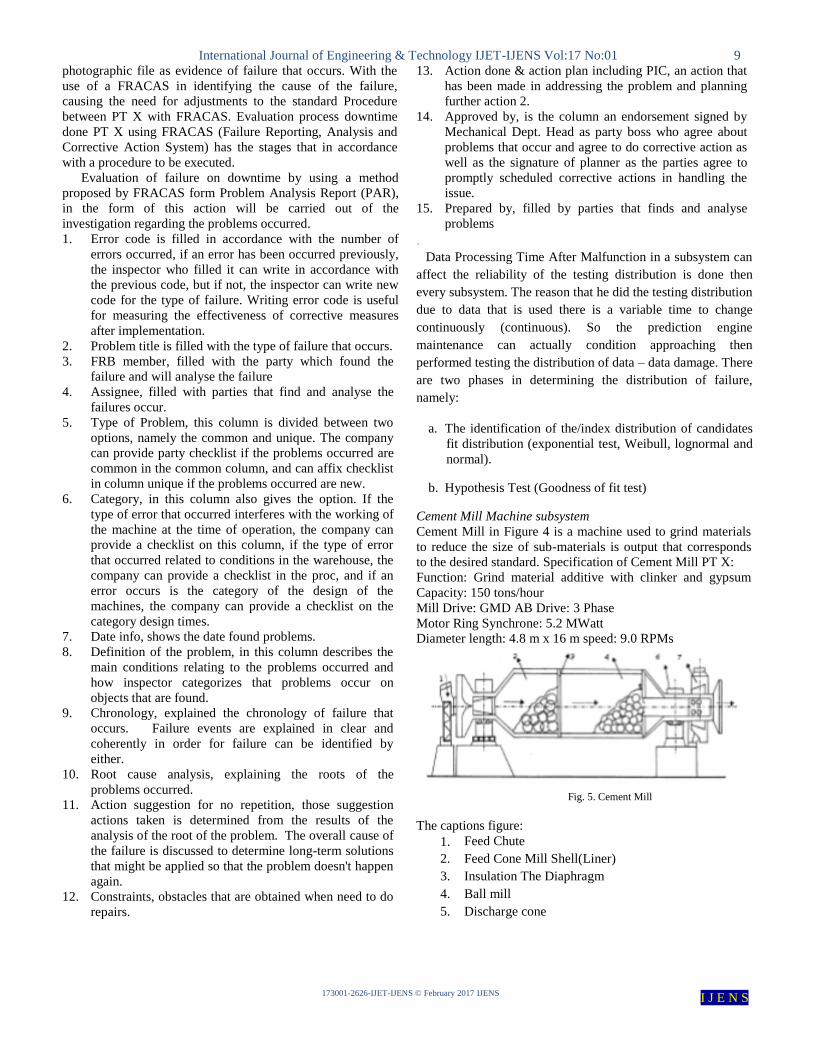
Cement Mill Machine subsystem
Cement Mill in Figure 4 is a machine used to grind materials
to reduce the size of sub-materials is output that corresponds
to the desired standard. Specification of Cement Mill PT X:
Function: Grind material additive with clinker and gypsum
Capacity: 150 tons/hour
Mill Drive: GMD AB Drive: 3 Phase
Motor Ring Synchrone: 5.2 MWatt
Diameter length: 4.8 m x 16 m speed: 9.0 RPMs
Fig. 5. Cement Mill
The captions figure:
1. Feed Chute
2. Feed Cone Mill Shell(Liner)
3. Insulation The Diaphragm
4. Ball mill
5. Discharge cone

International Journal of Engineering & Technology IJET-IJENS Vol:17 No:01 10
173001-2626-IJET-IJENS © February 2017 IJENS
I J E N S
This machine is used to perform the mixing process of
grinding clinker and gypsum additive material with others.
This grinding process is generated by products in the form of
cement with the desired fineness. Cement mill made of steel
with a horizontal shape consisting of 2 chambers. On the
inside of the inlet, there is a mill called the shell with a liner
that has a composition made of steel cast mounted the wall
attached to the cement mill. Its function is to keep the
collision of ball mill with shell mill, resulting in usage of
cement mill into a more durable and not quickly broken when
grinding process is done. In addition the function of the liner
also helps in the process of grinding. With its wide array of
ball mill can be helpful in destroying the existing material.
On cement mill there are 2 different compartments, with
this type of liner and size of ball mill. Between the two was
divided into 2 compartment bulkhead with an open diaphragm.
After the material was destroyed in the first disc compartment
will enter a compartment both through the diaphragm to the
boundary of mashed again. After smoothing is done, the fan
and the Damper serves to attract material that has a subtle
heading separator, while the coarse material was taken using
bucket elevators to do the separation heading separator, after
the separation of the material has done fine will be taken to a
temporary shelter as a silo prior to packaging, while still rough
going at the recycle return to cement mill for grinding back in
accordance with the desired specifications.
TABLE IV
THE DISTRIBUTION OF CEMENT MILL MACHINE
Exponential Weibull Normal Lognormal
0.848652245 0.8313009 0.979638695 0.740026929
Recap of Least Square
Based on the calculation of index of fit has done then retrieved
the value of r is the largest in a Normal distribution. Because
the value of r is the correlation values shows a trend of data following the distribution of damage, one that needs to be
done for testing goodness of fit test using Minitab to see its
discrepancies with calculation using software.
Goodness of Fit Test
The steps do testing on Minitab 16 is on the menu Stat >
Reliability/Survival > Distribution Anaysis (Right Censoring)
> ID Distribution Plot. Subsystem failure data of Cement Mill
obtained results in Figure 6. The suitability of the distribution
can be seen from how data fit with straight lines on each
distribution. The closer the distance data with lines even ter-
plot line, the more suitable the distribution data. Software
minitab also provides other parameters for goodness-of-fit
like the value of Anderson's Darling and Corelation.
Corelation's shows the relationships between the data. The
higher the value is then deemed to be the better the
relationships between the data so that the values in the
distribution of the more appropriate. The test results of
Goodness-of-fit it using Minitab can be seen in the value of
the AD (Anderson Darling) is the smallest.
Fig. 6. Goodness of Fit Subsystem Cement Mill with Correlative's
Fig. 7. Goodness of Fit
On the probability plot and image value Anderson Darling
shows most data in accordance with the Normal distribution.
Reliability calculation of engine
Reliability is affected on the reliability components that work
in it. The engine in the industry is very important in
supporting the passage of the production process so that the
establishment must be kept. The value of the reliability of the
machine can give you an idea of how reliable the machine
working so can be determined actions to maintain or increase
reliability. In calculating the reliability using data damage any
component of the machine and examined its use in
determining the parameters of the MTTF and reliability.
In carrying distribution test, it has been gained the proper
distribution to Cement Mill subsystem which is a normal
distribution. Therefore, the calculation of its parameters is
done with normal distribution. Here the steps for calculating it
by using Minitab 16 software:
Stat > Reliability/ Survival > Distribution Analysis (Right
Censoring) > Parametric Distribution Analysis.
Subsystem failure data of Cement Mill obtained results as
Figure 6.
Parameters σ = 1130.65
Parameters μ = 3004.02
MTTF = 3004.02

International Journal of Engineering & Technology IJET-IJENS Vol:17 No:01 11
173001-2626-IJET-IJENS © February 2017 IJENS
I J E N S
To calculate a reliability subsystem Cement Mill,
using the parameters – parameters has been obtained, by
using t = 2995.09, so obtained:
R (t) = 1- ɸ
((t-μ)/σ………………………………….. (8)
= 50 %
Maintenance Interval determination
Based on the reliability of the subsystem Cement Mill can be
calculated interval the subsystem should undergo treatment.
To achieve reliability average with a target of 80% then it can
be made with maintenance interval simulation 6264. The
desired reliability is of 80%, whereas before implementing
Preventive Maintenance, reliability that can be reached is 50%
at the moment to achieve 3004.02 hours (MTTF).
Fig. 8. Parametric Subsystem Cement Mill
Therefore, the need for action to improve the situation.
Based on the simulation contained an attachment retrieved
intervals of treatments done is every 2016 hours once (2.8
months). By doing preventive maintenance with an interval of
2016 hours on 3004.02 hour Cement mill has opportunities for
time t reliability – not of actions of preventive maintenance,
R (t-nT) or (t- n T) = 1 - ɸ ((t – n T)-μ)/σ
………………………… (9)
R(988) = 0.9625
So the chances of the reliability of the system conducted
preventive maintenance Rm(t) by
Rm (3004) = R(2016)1
x R (988) = (0.5) x
(0.9625) = 0.7775
Increased reliability = 77.75%-50% = 29
Figure 7 shows comparison chart of reliability before and after
the proposed preventive maintenance:
Fig. 9. Graphics Subsystem Reliability Improvement of Cement Mill
V. Conclusion
1. Note that the Milling System Area is often repeated
failure, so proper identification failure to correct any
failure that occurs and preventive action so that the
machine can reliable. Based on Pareto analysis obtained
level of downtime that occurs in the area of 561 Milling
System i.e. 37.5% of downtime is due to damage of
cement mill with the kind of general problems often
experienced that is spilling material on inlet process prior
to grinding mill.
2. Failure on the machine with the use of the FRACAS
(Failure Reporting, Analysis and Corrective Action
System) involves a process that includes observations of
failures that occur, and then documented the symptoms of
failure that occurs. After verifying that the failure of the
items fail performs failure analysis using the form
FRACAS, looking at the history of similar failure then
determining corrective action based on the results of the
analysis.
3. At the end of the use of the FRACAS, to reduce the risk of
failure to return at a later date, risk mitigation done by
calculating the right maintenance interval design for
Milling System are: Decreasing the risk of failure of the
Cement Mill with increased reliability of 29%, preferably
carried out preventive maintenance intervals with interval
of 2016 hours
Advice
1. Expected with the use of the FRACAS, the company may
record the kind of damage that occurs more detail so that it
can facilitate The Mechanical in doing treatments
specifically for the creation of proper maintenance
schedule.
2. Expected to be part of the inspector who identified
problems are often given training about data, in order to
better understand the intent and purpose of the making of
the FRACAS form.
REFERENCES
[1] A. E. Rahma, "Perancangan Sistem Pemeliharaan Korektif dengan
International Journal of Engineering & Technology IJET-IJENS Vol:17 No:01 12
173001-2626-IJET-IJENS © February 2017 IJENS
I J E N S
Menggunakan Failure Reporting, Analysis and Corrective Action System (FRACAS)," Jurnal Ilmiah Universitas Bakrie, vol. 3, no. 03,
Agustus 2015.
[2] M. Banghart and D. Nicholls, "An Improved FRACAS/DCACAS Implementation Model.," The Journal of Reliability, Maintainability, &
Supportability in Systems Engineering, vol. Summer 2012, pp. 10-15,
2012.
[3] C. M. Gustafsson and J. Ullberg, "Failure handling in product
development- A study within Volvo GTT Powertrain Engineering
(Master’s Thesis)," Department of Technology Management and Economics, Göteborg, Sweden:, 2012.
[4] L. R. Higgins, R. K. Mobley and D. W. , Maintenance Engineering Handbook, 7th Edition,, McGraw Hill Professional , 2008.
[5] Sisjono and I. Koswara, Pemeliharaan dan Perbaikan Komponen-
komponen Alat . Edisi Revisi, Jakarta: Erlangga, 2004.
[6] A. Telang, "Preventive maintenance," in Proceedings of the National
Conference on Maintenance and Condition Monitoring, Hissur, India,,
14 February 1998.
[7] F. Herbaty, Handbook of maintenance management: Cost-effective
practices., Park Ridge, N.J., U.S.A: Noyes Publications. , 1990).
[8] I. Ahuja and J. Khamba, "Total productive maintenance: literature review and directions," International Journal of Quality & Reliability
Management, vol. 25 , no. 7, pp. 709 - 756, 2008.
[9] E. T. Higgins, "Knowledge activation: Accessibility, applicability, and salience.," in Social psychology: Handbook of basic principles, E. T.
Higgins & A. W. Kruglanski (Eds.), Ed., New York: Guilford Press.,
New York: Guilford Press., 1995, pp. 133 - 168.
[10] C. E. Ebeling, An Introduction to Reliability and Maintainability
Engineering,, Singapore: McGraw Hill Book Co, 1997.
[11] E. E. Lewis, Introduction to Reliability Engineering, 2nd Edition., Evanstons, Illinois: John Wiley & Sons, Inc, July 1994.
[12] J. H. Lee, S. Chan and J. S. Jang, "Process-Oriented Development of
Failure Reporting, Analysis, and Corrective Action System,," International Journal of Quality, Statistics and Reliability., vol. Volume
2010, no. Article ID 213690, p. 8 pages, 2010.
[13] M. Pechta, D. Dasa and A. Ramakrishnan, "The IEEE standards on
reliability program and reliability prediction methods for electronic
equipment," Micro Electronics Reliability, vol. 42, no. Invited Paper,
pp. 1259-1266, 2002.
[14] ". i. M. G. Pecht and F. R. Nash, "Predicting the reliability of electronic
equipment [and prolog],," in Proceedings of the IEEE, Jul 1994.
[15] M. Villacourt and P. Govil, FAILURE REPORTING, ANALYSIS, AND CORRECTIVE ACTION SYSTEM, Austin, Texas 78741:
Sematech, 1993.
Tri Susanto received his master degree in industrial engineering from
Bandung Institute of Technology (ITB). Currently, he is a lecturer in
Industrial Engineering of Universities Bakrie, Indonesia. He taught several
courses such as Theory of Probablity, Industrial Statistics, Operation
Research, Project Management. Aurino RA Djamaris is a lecturer of Management Department of
Universities Bakrie, Indonesia. He taught several courses such as applied
business computation, Maths and Statistics, Decision Modelling, Logistics &
Supply Chain, Production and Operation Management.
Mirsa D. Novianti received her undergraduate and master degree in Industrial
Engineering from University of Indonesia. Currently, she is a lecturer in
Industrial Engineering of Universities Bakrie, Indonesia. A number of courses
that she taught are Layout, and Quality Control.
Fidya Ayu Saomi is a student of Industrial Engineering at Universities
Bakrie, Indonesia.