evaluation of different indicators of oil biodegradation ... · pdf fileevaluation of...
TRANSCRIPT

Evaluation of Different Indicators of Oil Biodegradation in Naturally Attenuated Soil
Andréa Camardella de Lima Rizzo (CETEM / MCT, Rio de Janeiro, Brazil)
Maria Clara Telhado (EQ / UFRJ, Rio de Janeiro, Brazil) Rodrigo Gouvêa Taketani (CNPMA / EMBRAPA, Jaguariúna, SP, Brazil)
Adriana Ururahy Soriano ( CENPES/PETROBRAS, RJ, Brazil) Danielle Reichwald (CETEM / MCT, Rio de Janeiro, Brazil)
Natalia Franco Taketani (Doctorate student, ANP fellow, EQ / UFRJ, Rio de Janeiro, Brazil EQ / UFRJ) Selma Gomes Ferreira Leite (EQ / UFRJ, Rio de Janeiro, Brazil) Alexandre Soares Rosado (IMPPG/UFRJ, Rio de Janeiro, Brazil)
Cláudia Duarte da Cunha ([email protected]) (CETEM / MCT, Rio de Janeiro, Brazil ABSTRACT: The present study evaluated the process of monitored natural attenuation of a soil from the northeast region of Brazil contaminated with different concentrations of crude oil (5,000 mg/Kg soil, 25,000 mg/Kg soil and 50,000 mg/Kg soil), simulating a real condition that may to occur in an adjacent area of petroleum exploration. HDPE boxes were used and the systems were left in the open subject to weather for a period of 18 months. Enzymatic activity and counts of heterotrophic and oil-degrading microorganisms were measured at regular time intervals, and the correlations with the levels of hydrocarbon concentration (TPH) in soil were investigated. The molecular fingerprinting performed with 16S-PCR analysis associated with DGGE was used to evaluate changes in the pattern of the bacterial community for all experimental conditions tested. It was possible to verify that both the results of total heterotrophic and oil-degrading bacteria count, dehydrogenase activity and TPH removal values are directly associated with rainfall measured. From 4 months, when starting the period with higher rainfall, there was an increase in enzymatic and microbial activity. At the end of the experiment (18 months) the percentage of TPH removal in the amendments with crude oil concentration of 5000, 25000 and 50000 mg/Kg of soil was 60%, 63.8% and 51.1%, respectively. Analysis of DGGE band patterns in different sampling time revealed that the bacterial community has shown only minor changes during the initial 30 days, after which the most intense changes could be observed on all treatments.
INTRODUCTION Bioremediation is an attractive alternative to treat soils contaminated with
petroleum hydrocarbons yet effectiveness of biological processes is often ruled by the native microbial population’s ability to absorb and metabolize the contaminant. In practice, however, it is usually observed biodegradation rates lower than those estimated in laboratory tests (HAWS et al., 2006). In general the problem lies in the difference of the microbial activity found in the scale up as well as in the decrease of contaminants’ bioavailability over time. As a consequence, the determination of the substrates’ bioavailability, and not only the biodegradation intrinsic potential, is an important factor in estimating the maximum degradation that can be achieved in an impacted area.

Usually, confirmation of the effectiveness on the implementation of a bioremediation process occurs through the evaluation results obtained in the quantification of chemical and/or physicochemical parameters pre-established in laws and regulations, such as the residual concentration of oil and/or metals. However, the analytical methodologies associated with quantifying these values involved, mostly, at least one step of intensive chemical extraction so that the compound can pass to a liquid phase in which it is quantified. This process through which the solid, or semi-solid, sample is subjected to not often represents the real extraction condition (leaching and/or solubility) which that sample will undergo in the environment. When measured this way, a bioremediation process is not often considered efficient since the pollutant’s residual concentration is likely to remain above the benchmarks set out in the relevant environmental legislation. Furthermore, this residual concentration may represent only the contaminant’s non-bioavailable fraction, i.e., the recalcitrant fraction difficult to eliminate through biological processes.
Understanding the limitations associated with the contaminants’ bioavailability in impacted soils is nowadays considered an essential step to determine the effectiveness of a bioremediation process application (HAWS et al.,2006) and to understand the limitations related to the pollutant’s degradation over time.
Several authors have highlighted the importance of practical estimates of the contaminant’s bioavailable fraction as part of preliminary studies to the application stage of a bioremediation process. Such estimates are useful not only to quantify the contaminant’s fraction that will actually be susceptible to microbial attack, but also as a tool to be associated with risk assessment studies (HAWS et al. ,2006).
Currently, different methodologies have been studied in order to estimate the actual bioavailable fraction of organic and/or inorganic compounds present in samples of impacted soils (EHLERS and LUTHY, 2003; SABATÉ et al., 2005;). Some of the methodologies evaluated included the application of alternative chemical tests based on non-exhaustive extraction techniques (using different kinds of extractants as mixtures of solvents, surfactants, cyclodextrins) as well as protocols/ trials involving the exposure of organisms from different trophic levels (microorganisms, earthworms, vegetables) to contaminated samples and the verification of the response to this exposure; the use of molecular biology techniques as a way to observe the change in soil microbial community structure and diversity after the application of a remediation technology and comparison with the condition shortly after contamination.
The objective of this work was to evaluate the Monitored Natural Attenuation (MNA) systems in soil containing different concentrations of the contaminant (0.5%, 2.5% and 5% w/w of crude oil) through the use of different indicators during 18 months.
MATERIALS AND METHODS Systems set-up and sample collection
MNA systems were set up with soil from Sergipe, Brazil, contaminated with the following concentrations of crude oil, originating from the same region: 0.5%; 2.5%; 5% (w/w) besides a control (uncontaminated soil) to investigate the effect of natural attenuation on bioavailability. The systems were set up in duplicate for each

concentration, high-density polyethylene (HDPE) bottom perforated boxes (volume of 36 L and soil volume of about 15 L) (FIGURE 1A). The boxes were mounted in an open area on the premises of CETEM’s pilot plant and were subject to weather for a period of 18 months (FIGURE 1B).
FIGURE 1. Monitored Natural Attenuation Systems (A) HDPE bottom perforated box on a
colletcting box. (B) Boxes containing soil with different concentrations of crude oil (0,5%, 2,5% and 5,0% w/w). 1.Uncontaminated soil (control); 2 and 3.- 0,5% oil contaminated soil; 4 and 5 – 2,5% oil
contaminated soil; 6 and 7 – 5,0% oil contaminated soil.
Samples were randomly collected at the following times: T(0) initial, T 1/2 (15
days), T1 (1 month), T2 (2 months), T3 (3 months), T4 (4 months), T6 (6 months) , T8 (8 months), T10 (10 months), T12 (12 months) and T18 (18 months) and stored in a cold chamber at 4°C for further analysis.
Methodologies for the Natural Attenuation Monitoring
Microbial community evaluation
Quantification of both total heterotrophic and crude oil degrading microorganisms as well as molecular techniques to monitor the bioremediation process and the possible changes in the total bacterial population were used.
Quantification of total heterotrophic microorganisms was carried out through plating by using the Pour plate technique on TSA medium. Quantification of the crude oil degrading microbial population was performed using the Most Probable Number (MPN) technique described by Cunha et al. (2006). The bacterial community profile was assessed through the PCR-DGGE technique using markers for Bacteria.
Analysis of Total Petroleum Hydrocarbons concentration
In order to monitor the oil concentration in the MNA systems, the total petroleum hydrocarbons analysis was performed by infrared spectroscopy through the Infracal equipment, model HART-T, Wilks Enterprise.
A B

Evaluation of soil dehydrogenase activity
Soil dehydrogenase activity was measured according to the modified protocol described by Schinner et al. (1996) through the conversion of TTC into TPF. 5 g of soil were added to 5 mL of a TTC solution (1.5% W/V) in Tris-base, adjusting the pH to 7.0 with HCl 1M. The vials were sealed with rubber stoppers and statically incubated for 24h at 30°C. After this time, acetone was used to extract the TPF formed. The absorbance at 546 nm of extracts of the triphenylformazan (TPF) produced was then measured, using acetone as a blank. The activity of the dehydrogenase was expressed as µg TPF/(g·h) dry soil.
RESULTS AND DISCUSSION The Systems monitoring
Figures 2, 3 and 4 present the results for enzymatic activity (dehydrogenase in µgTPF. g of soil-1 in 24 h) and count of total heterotrophic bacteria and oil degrading microorganisms, respectively, during 18 months of monitoring.
FIGURE 2. Dehydrogenase activity for each sampling date.
The dehydrogenase activity (DHA) reflects the total oxidative activity of soil
microbiota, and can act as a good indicator of the microbial activity present and may be correlated with other data. Several studies assess the enzyme activity in soils contaminated with petroleum and heavy metals and describe a positive correlation between dehydrogenase activity and hydrocarbons degradation (Al-Saleh & Obuekwe 2005; Namkoong et al. 2002; Lee et al. 2007).
In order to contribute to the characterization of the environmental conditions to which the monitored natural attenuation systems (MNA) were subjected to, rainfall data in the study area was evaluated during the testing time, as illustrated in FIGURE 3. The data correspond to the rainfall during the period of the test run at the “Ilha do

Governador Station”, an island located in Ilha do Governador, the nearest station to Ilha do Fundão, as part of the Program "Alerta Rio", from the Foundation Institute for Geotechnique of the Municipality of Rio de Janeiro (Geo - Rio).
FIGURE 3. Aerobic heterotrophic bacteria count in different systems during 18 months of
sampling.
FIGURE 4. Oil degradading bacteria count in different systems during 18 months of sampling.
It is verified that both the results for microbial quantification and enzymatic activity
in the MNA systems are associated with rainfall values. In drier periods, there was little dehydrogenasic activity as well as a variation of oil degrading microorganisms. From the third month on, as rainfall increases, there was a raise in the number of oil degrading microorganisms, especially in the soil contaminated with 5% of oil.

Through Figure 3, it can be observed that there was no significant variation in the population of total heterotrophic microorganisms once. For all oil concentrations tested, the microbial density was around 107 CFU/g of soil. A different behavior was observed in the population of degrading microorganisms (Figure 4), where a significant variation occurred mainly between 3 and 4 months which is highly correlated with an increase in the soil’s moisture content. Especially in this period, there was an increase of about three orders of magnitude for the conditions of 2.5% and 5% of contamination.
Microbial quantification (total heterotrophic microorganisms and crude oil degrading bacteria) as well as microbial activity (dehydrogenasic) were assessed along with physicochemical parameters, such as the quantification of the soil’s TPH fraction (FIGURE 5) in order to facilitate understanding and try to correlate the data. The results obtained clearly show a positive correlation between moisture content and the increase of TPH removal from the systems due to a raise in the microbial activity, being this correlation more evident for dehydrogenase.
FIGURE 5. TPH removal (%) of all MNA systems during 18 months of sampling.
It is verified that TPH removal increases for all systems, especially after the fourth month, for those which contained the highest contamination levels. This is probably due to the effective adaptation of the native microbiota to the contaminant’s presence. Stabilization of the degradation rate for all the systems seem to occur in approximately eight months, considering the deviations obtained, when it reaches: 60, 63,8 and 51,1% for the 0.5% 2.5% and 5% systems, respectively.
Analysis through Molecular Biology
During monitoring, changes were also evaluated in the profile of the bacterial community through the analysis by gel electrophoresis with denaturing gradient (DGGE) of the gene coding for 16S rRNA (FIGURE 6).
Visual analysis of the gels indicates that after contamination, all systems showed changes in the bacterial community compared with the initial sample (T=0). In addition, all treatments had very similar profiles during the first 3 months. After that time, the profiles of the different systems began to differ from those observed in the first 90 days.

It is worth mentioning that, after 18 months, the samples obtained for the control system (FIGURE 6-A) began to show profiles quite similar to time 0h (T0).
FIGURE 6. DGGE fingerprints of 16S rDNA fragments in soil samples treated with different
amounts of TPH. 0,5% -soil contaminated with 0,5% w/w of oil; 2,5% -soil contaminated with 2,5%w/w of oil; 5% -soil contaminated with 5% w/w of oil; Ctrl -uncontaminated soil; T15 d-sample collected at day 15; T30 d-
sample collected at a month; T90 d– sample collected at 3 months; T180d- sample collected at 6 months; T365d – sample collected at 12 months; T450d – sample collected at 18 months.
Thus, in order to assess the correlation among the samples, a principal component
analysis was performed (FIGURE 7). FIGURE 7-A shows that the samples from the control systems and containing 0.5% of oil were the most differentiated at 6 months and 12 months whereas the samples at 15, 30 and 90 days differed little. With respect to those systems with 2.5% and 5.0% of contamination (FIGURE 7-B), there is an apparent divergence between the samples at the initial time (central area of the graph) and at later times (peripheral area) thus indicating that there were changes between the different systems

FIGURE 7. Principal components analysis (PCA) of samples compared through systems (different oil concentration). 0,5%-soil contaminated with 0,5%(w/w) of oil; 2,5%-soil contaminated with 2,5%(w/w) of oil; 5%-soil contaminated with 5%(w/w) of oil; Ctrl-uncontaminated soil; T15 -sample collected at day 15; T30 -sample
collected at a month; T90 – sample collected at 3 months; T6m- sample collected at 6 months; T12m – sample collected at 12 months; T18m – sample collected at 18 months.
The principal component analysis of the samples grouped according to the sampling
time shows how contaminated and control systems differed (FIGURE 8). FIGURE 8-A shows the principal components analysis for the samples at zero, 15 and 30 days. The samples for T0 were omitted from the graphic since they distanced themselves from the others in the PC1 making it difficult to analyze. Little distinction of the samples is observed in this period. The samples collected at 90 days and at 6 months presented a clear time distinction: in 90 days, they showed rather similar profiles whereas in six months the profiles of the samples differed. The same differentiation by time of collection was observed among the samples collected at 12 and 18 months (FIGURE 8-C).
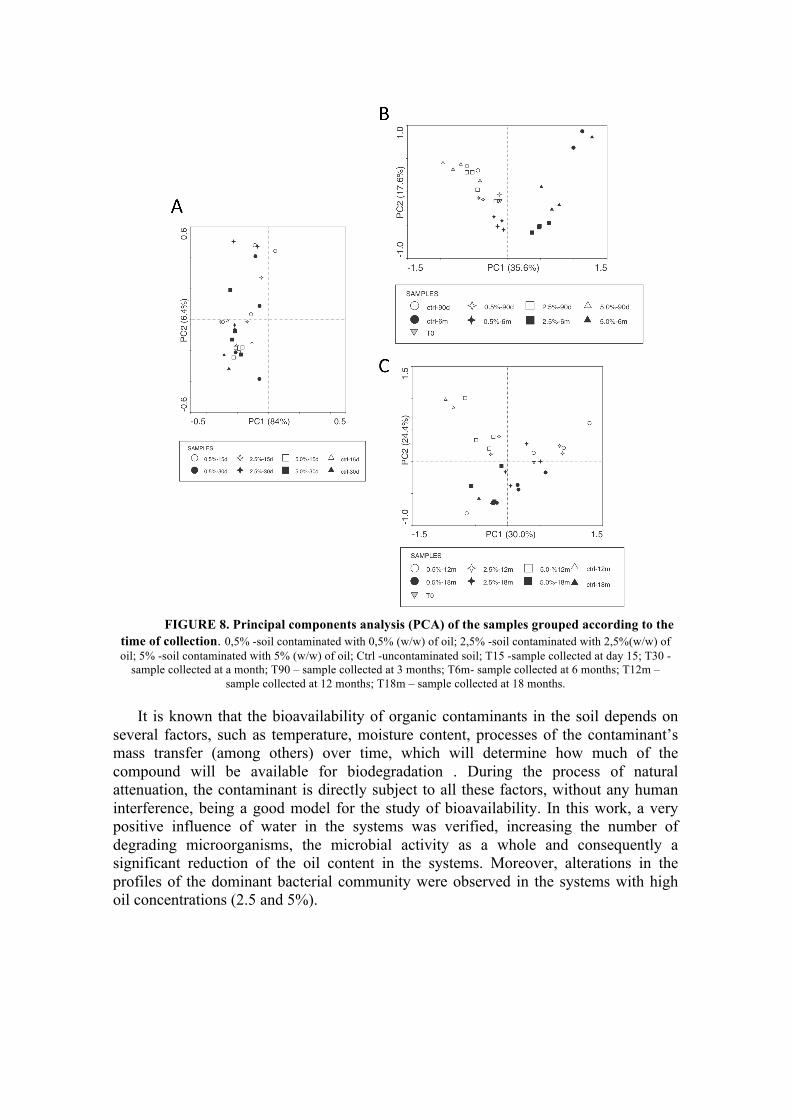
FIGURE 8. Principal components analysis (PCA) of the samples grouped according to the time of collection. 0,5% -soil contaminated with 0,5% (w/w) of oil; 2,5% -soil contaminated with 2,5%(w/w) of oil; 5% -soil contaminated with 5% (w/w) of oil; Ctrl -uncontaminated soil; T15 -sample collected at day 15; T30 -
sample collected at a month; T90 – sample collected at 3 months; T6m- sample collected at 6 months; T12m – sample collected at 12 months; T18m – sample collected at 18 months.
It is known that the bioavailability of organic contaminants in the soil depends on
several factors, such as temperature, moisture content, processes of the contaminant’s mass transfer (among others) over time, which will determine how much of the compound will be available for biodegradation . During the process of natural attenuation, the contaminant is directly subject to all these factors, without any human interference, being a good model for the study of bioavailability. In this work, a very positive influence of water in the systems was verified, increasing the number of degrading microorganisms, the microbial activity as a whole and consequently a significant reduction of the oil content in the systems. Moreover, alterations in the profiles of the dominant bacterial community were observed in the systems with high oil concentrations (2.5 and 5%).

CONCLUSIONS • The removal of total petroleum hydrocarbons (TPH) reached in 8 months 60, 63.8 and 51.1% for the 0.5%, 2.5% and 5% systems, respectively. • There was no significant variation in the total heterotrophic microorganisms population as for oil degrading microorganisms. • The soil dehydrogenase activity reflected directly in the removal of TPH from the systems and is associated with the rainfall values measured. • The analysis performed through Molecular techniques showed a difference in the behavior of the soil’s dominant bacterial communities of samples contaminated with 0.5% compared with those contaminated with 2.5% and 5%. In the samples with 0.5%, the most significant changes occurred in 6 and 12 months, period in which no significant changes happened in the degradation of TPH. In the 2.5% and 5% systems, changes in the communities occurred from the initial time, especially in 90 days, demonstrating a direct influence of the contaminant on these dominant populations. ACKNOWLEDGMENTS
To CETEM / MCT for the infrastructure and Petrobras for financial support of the Project. REFERENCES Al-Saleh, E. S.; Obuekwe, C. 2005. Inhibition of hydrocarbon bioremediation by lead in
a crude oil-contaminated soil. International Biodeterioration & Biodegradation, 56:1–7.
Cunha, C. D.; Rosado, A. S.; Sebastián, G. V.; Seldin, L.; von der Weid, I. 2006. Oil biodegradation by Bacillus strains isolated from the rock of an oil reservoir located in a deep-water production basin in Brazil. Appl. Microbiol. Biotechnol. 73:49–959.
Ehlers, L. J. e Luthy, R. G. 2003. Contaminat Bioavailability in Soil and Sediment. Environ. Sci. Technol., 37: 295A – 302A.
Haws, N. W., Ball, W. P. E Bouwer, E. J. 2006. Modeling and interpreting bioavailability of organic contaminant mixtures in subsurface environments. Journal of Contaminant Hydrology, 82: 255-292.
Lee, S-H.; S-H.; Oh, B-I.; Kim, J-G. 2008. Effect of various amendments on heavy mineral oil bioremediation and soil microbial activity. Bioresource Technology, 99:2578–2587.
Namkoonga, W.; Hwangb, E-Y.; Parka, J-S.; Choic, J-Y. 2002. Bioremediation of diesel-contaminated soil with composting. Environmental Pollution, 119:23–31.
Sabaté, J.; Vinas, M. e Solanas, A. M. 2005. Bioavailability assessment and environmental fate of polycyclic aromatic hydrocarbons in biostimulated creosote-contaminated soil. Chemosphere, 63:2648-1659.
Schinner, F.; Ohlinger, R.; Kandeler, E.; Margesin, R. (Eds.). 1996. Methods in soil biology. Springer, Germany, 426 p.