evaluation of cost-effectiveness and value-for-money of
TRANSCRIPT

Evaluation of Cost-Effectiveness and Value-for-Money of DCP-DN Pavement Design Method for Low-Volume Roads in Comparison with Conventional Designs
Final Report
Authors: M I Pinard, G van Zyl and J Hongve
ReCAP Project Reference Number. RAF 2128A
March 2019
Infra Africa Consultants Gaborone, Botswana

Evaluation of Cost-Effectiveness and Value-for-Money of DCP-DN Design Method
Page 2
The views in this document are those of the authors and they do not necessarily reflect the views of the Research for Community Access Partnership (ReCAP), Cardno Emerging Markets (UK) Ltd for whom the document was prepared
Cover Photo: Authors
Quality assurance and review table
Inception Report Author(s) Reviewer(s) Date
Version 1 M I Pinard and G van Zyl N Leta 9th January 2018
L Sampson 16th January 2018
Version 2 M I Pinard and G van Zyl 23 January 2018
Preliminary Evaluation Report
Version 1 M I Pinard, G van Zyl and J Hongve 31st March, 2018
N Leta 26 April 2018
L Sampson 29 April 2018
Draft Final Evaluation Report
M I Pinard, G van Zyl and J Hongve 17 May 2018
Final Evaluation Report M I Pinard, G van Zyl and J Hongve 24 July, 2018
N Leta 25 July, 2018
25 July, 2018
Final Evaluation Report M I Pinard, G van Zyl and J Hongve 14 December, 2018
N Leta 03 January, 2019
J Cook 03 January, 2019
Final Evaluation Report Ver 4
M I Pinard, G van Zyl and J Hongve 21 January, 2019
Final Evaluation Report Ver 5
M I Pinard, G van Zyl and J Hongve 05 March, 2019
N Leta 06 March, 2019

Evaluation of Cost-Effectiveness and Value-for-Money of DCP-DN Design Method
Page 3
ReCAP Project Management Unit Cardno Emerging Market (UK) Ltd Oxford House, Oxford Road Thame OX9 2AH United Kingdom
Evaluation of Cost-Effectiveness and Value-for-Money of DCP-DN Design Method
Page 4
Key words Low-volume roads, pavement design, Dynamic Cone Penetrometer, cost-benefit analysis, life-cycle cost.
RESEACH FOR COMMUNITY ACCESS PARTNERSHIP (ReCAP)
Safe and sustainable transport for rural communities
ReCAP is a research programme, funded by UK Aid, with the aim of promoting safe and sustainable transport for rural communities in Africa and Asia. ReCAP comprises the Africa Community Access Partnership (AfCAP) and the Asia Community Access Partnership (AsCAP). These partnerships support knowledge sharing between participating countries in order to enhance the
uptake of low cost, proven solutions for rural access that maximise the use of local resources. The ReCAP programme is managed by Cardno Emerging
Markets (UK) Ltd.
See www.research4cap.org

Evaluation of Cost-Effectiveness and Value-for-Money of DCP-DN Design Method
Page 5
Acronyms, Units and Currencies AASHTO American Association of State and Highway Transport Officials AfCAP Africa Community Access Partnership CBA Cost-Benefit Analysis CBR California Bearing Ratio DCP Dynamic Cone Penetrometer DFID Department for International Development DN The average penetration rate in mm/blow of the DCP in a pavement layer EMC Equilibrium Moisture Content EOD Environmentally Optimised Design LCC Life-cycle costs MESA Million Equivalent Standard Axles OMC Optimum Moisture Content PMU Project Management Unit ReCAP Research for Community Access Partnership SEACAP South East Asia Community Access Programme TLC Traffic Loading Class ToR Terms of Reference TPA Transvaal Provincial Administration TRL Transport Research Laboratory UK United Kingdom (of Great Britain and Northern Ireland) UKAid United Kingdom Aid (Department for International Development, UK) VFM Value for Money
Terminology
Components of a low volume sealed road
Evaluation of Cost-Effectiveness and Value-for-Money of DCP-DN Design Method
Page 6
Contents Key words 4 Acronyms, Units and Currencies 5 Terminology 5
Executive summary ........................................................................................................ 10 1 Introduction .................................................................................................... 14
1.1 Background 14 1.2 Motivation for Project 14 1.3 Purpose and Scope 15 1.4 Final Evaluation Report 16
2 Approach and Methodology ............................................................................. 17
2.1 General 17 2.2 Hypothetical Approach 17 2.3 Selection and Requirement of Design Methods 17
2.3.1 Selection of design methods 17 2.3.2 Applicability of DCP Methods of Design 17 2.3.3 Input requirements 18 2.3.4 DCP-DN method 18 2.3.5 DCP-CBR method 19 2.3.6 TRH4 method 19 2.3.7 ORN31 method 20
2.4 Design Assumptions 20 2.4.1 Drainage 20 2.4.2 Maintenance and overload control 21 2.4.3 Terrain 21 2.4.4 Materials compliance 21 2.4.5 Representative DN Values 21 2.4.6 Conversion from DN to CBR 22 2.4.7 Conversion from in-situ DCP CBR to laboratory soaked CBR values 22
2.5 Field Visits and Data Collection 22 2.5.1 General 22 2.5.2 Construction costs 23 2.5.3 Maintenance costs 24 2.5.4 Performance of Trial Sections 24
3 LCC Evaluation Procedure ................................................................................ 25
3.1 General 25 3.2 Comparative Cost Evaluation 25
3.2.1 General approach 25 3.2.2 Life-cycle cost components 25 Agency costs 26 Construction and rehabilitation costs 26 Maintenance costs 26 Road user costs 26 Salvage costs 26 3.2.3 Life-cycle cost analysis 26 3.2.4 Hypothetical life-cycle cost evaluation 27 3.2.5 Cost-effectiveness of design methods 27
3.3 Hypothetical Designs 28 3.3.1 General 28 3.3.2 Design matrix 28 3.3.3 Determination of typical pavement structures 29

Evaluation of Cost-Effectiveness and Value-for-Money of DCP-DN Design Method
Page 7
3.3.4 Pavement construction costs 31 3.3.5 Determination of pavement structure costs 31 3.3.6 Comparison of total pavement costs/km 32 3.3.7 Comparison of total pavement cost ratios 33 3.3.8 Comparison of total project costs/km 33 3.3.9 Comparison of project cost ratios for low and high design traffic 34 3.3.10 Comparison of project cost savings/km for low and high design traffic 35 3.3.11 General comparative cost trends 36
3.4 In-Situ Designs 42 3.4.1 General 42 3.4.2 Design inputs 42 3.4.3 DCP-DN design method 42 3.4.4 TRH4 design method 43 3.4.5 ORN31 design method 43 3.4.6 DCP-CBR design method 43 3.4.7 Determination of pavement structure 44 3.4.8 Determination of pavement structure costs 45 3.4.9 Pavement cost ratios 46 3.4.10 Project costs 48 3.4.11 Project cost ratios 48 3.4.12 Project cost differences 49
3.5 Hypothetical versus In-Situ Designs 49 3.5.1 Hypothetical designs 49 3.5.2 In-situ designs 49 3.5.3 Comparison of hypothetical and in-situ situ designs 49 3.5.4 Implications of EMC selection 50
4 Evaluation of Value for Money ......................................................................... 51
4.1 General 51 4.2 Framework for VFM analysis 51 4.3 Evaluation of VFM 52
4.3.1 Cost-effectiveness 52 4.3.2 Outcome (uptake) 53 4.3.3 Potential impact: 54
5 Summary of Key Findings and Conclusions........................................................ 55
5.1 Key Findings 55 5.1.1 Cost Evaluation 55 5.1.2 Value for Money 55
5.2 Main Conclusions 57 5.3 Way Forward 57
6 References ...................................................................................................... 59 LIST OF FIGURES Figure 1 : Procedure for determining cost-effectiveness of various LVR design methods ..... 27 Figure 2: LCC evaluation procedure ........................................................................................ 28 Figure 3: Pavement costs (Wet environment) – Zero versus Medium haul distance ............. 38 Figure 4: Pavement costs (Mod-Dry environment) – Zero versus Medium haul distance ..... 39 Figure 5: Project costs (Wet environment) – Zero versus Medium haul distance .................. 40 Figure 6: Project costs (Moderate-Dry environment) - Zero versus Medium haul distance .. 41 Figure 7: Comparison of pavement structures by design methods for TLC 0.1 & NG3 .......... 45 Figure 8: Pavement cost ratios 'R'/km per TLC........................................................................ 47

Evaluation of Cost-Effectiveness and Value-for-Money of DCP-DN Design Method
Page 8
Figure 9: Kukurantumi - Asafo pavement structures by TLCs for different design methods .. 47 Figure 10: Framework for VFM analysis (DFID, 2011) ............................................................. 51 Figure 11 km cost, 0.1 MESA, Wet, Medium haul ................................................................. 80 Figure 12 km cost, 0.3 MESA, Wet, Medium haul ................................................................. 80 Figure 13 km cost, 1 MESA, Wet, Medium haul .................................................................... 80 Figure 14 km cost, 0.1 MESA, Dry-Moderate, Medium haul .................................................. 81 Figure 15 km cost, 0.3 MESA, Dry-Moderate, Medium haul .................................................. 81 Figure 16 km cost, 1.0 MESA, Dry-Moderate, Medium haul .................................................. 81 LIST OF TABLES Table 1: Dependence of design subgrade values on design traffic class (DCP-CBR method) . 21 Table 2: Relationship between in-situ DCP CBR and soaked CBR (Paige-Green et al, 1999) .. 22 Table 3: Road sections to be evaluated................................................................................... 23 Table 4: Material unit costs ..................................................................................................... 23 Table 5: Material haulage costs ............................................................................................... 24 Table 6: Example of design and pavement structure cost matrix ........................................... 29 Table 7: TRH4 Class D pavement structure for 0.3 MESA ....................................................... 30 Table 8: Reference cell in pavement cost structure matrix .................................................... 30 Table 9: Pavement layer costs (USD/m3) ................................................................................. 31 Table 10: Pavement layer costs (USD/m3) per layer (TRH4 method, <0.1 MESA only) ........... 32 Table 11: Total pavement costs/km per design method per scenario (USD/km) (example) .. 32 Table 12: Pavement cost ratios of alternative design methods (< 0.1 MESA) ........................ 33 Table 13: Total project costs/km (USD) of alternative design methods (< 0.1 MESA) ............ 34 Table 14: Project cost ratios of alternative design methods (< 0.1 MESA) ............................. 34 Table 15: Project costs ratios of alternative design methods (0.3 – 1.0 MESA) ..................... 35 Table 16: Project cost savings/km (< 0.1 MESA) ..................................................................... 35 Table 17: Project cost savings/km (0.3 – 1.0 MESA) ............................................................... 36 Table 18: Pavement structure costs based on Zambian cost data .......................................... 45 Table 19: In-situ pavement cost ratios .................................................................................... 46 Table 20: In-situ pavement cost ratios for different TLCs ....................................................... 46 Table 21: Material haulage scenarios ...................................................................................... 48 Table 22: Project costs/km (USD) for various haulage scenarios ............................................ 48 Table 23: Project costs ratios for various haulage scenarios .................................................. 48 Table 24: Project costs differences/km (USD) for various haulage scenarios ......................... 49 Table 25: Comparison of pavement cost ratios (Project versus Hypothetical) ....................... 50 Table 26 DCP-DN required pavement structure (DN values) ................................................. 71 Table 27 DCP-DN required pavement structure (Field CBR values) ....................................... 71 Table 28 Required pavement structure in terms of soaked CBR (Based on Emery) ............. 72 Table 29 Required pavement structure in terms of soaked CBR (Based on Paige-Green) .... 72 Table 30 Required pavement structure if base and subbase operate at OMC ...................... 73 Table 31 Required pavement structures for a range of in-situ subgrades ............................. 73 Table 32 Material, haul and processing costs (Rand) ............................................................. 74 Table 33 Layer cost for a 150mm layer (soaked CBR=45) ...................................................... 74 Table 34 Costs of different layers in the required pavement structure (DCP-DN)................. 74 Table 35 Required pavement structure according to TRH4 design ........................................ 75 Table 36 Costs of different layers in the required pavement structure (TRH4) ..................... 75 Table 37 Required pavement structure according to DCP-CBR design .................................. 76 Table 38 Costs of different layers in the required pavement structure (DCP-CBR) ............... 76 Table 39 Required pavement structure according to ORN31 design ..................................... 77 Table 40 Costs of different layers in the required pavement structure (ORN31) ................. 77 Table 41 Summary of pavement layer cost in Rand per m2 .................................................... 78 Table 42 Summary of pavement layer costs in USD per km .................................................. 78
Evaluation of Cost-Effectiveness and Value-for-Money of DCP-DN Design Method
Page 9
Table 43 Cost items additional to pavement layers ............................................................... 79 Table 44 Summary of project costs per km ............................................................................ 79 Table 45 Project cost ratios .................................................................................................... 82 Table 46 Project cost savings per km ..................................................................................... 82 LIST OF ANNEXES Annex A – DCP-DN Structural Design Catalogue ...................................................................... 63
Annex B – DCP-CBR (TRL) Structural Design Catalogue (Dry-Moderate region) ...................... 64
Annex C – TRH4 Structural Design Catalogue (dry-Moderate region) ..................................... 65
Annex D – ORN31 Structural Design Catalogue ...................................................................... 66
Annex E – Equilibrium to optimum moisture content ratio (Emery, 1985) ............................. 67
Annex F – Road section details and outcome of visual condition surveys ............................... 68
Annex G – Cost comparisons of LVR design methods .............................................................. 72
Annex H – Pavement cost/cost ratios, Project costs/cost ratios, Project cost savings/km ..... 84
Annex I – Pavement structures and costs by TLC for different design methods ..................... 94

Evaluation of Cost-Effectiveness and Value-for-Money of DCP-DN Design Method
Page 10
Executive summary ReCAP has supported the enhancement of a method of pavement design for low volume roads (LVRs) based on the use of the Dynamic Cone Penetrometer (DCP) (AfCAP, 2013) as an alternative to the more traditional methods based on the use of the California Bearing Ratio (CBR). Despite the perceived advantages of this relatively new method of design, they are yet to be fully quantified in practice. This has prompted the letting of a project pertaining to the “Evaluation of cost-effectiveness and value-for-money of the DCP-DN pavement design method for low-volume roads in comparison with traditional designs”. The main purpose of the project is to evaluate, in terms of cost-effectiveness (upfront cost savings and life-cycle costs) and value-for-money, a number of unpaved road sections located in selected African countries that were upgraded to a paved standard using the DCP-DN method. This has entailed the collection and analysis of road cost data for these road sections in order to
determine their life-cycle costs in comparison with the same section of unpaved1 (gravel) road
upgraded to a paved standard using traditional, CBR-based pavement design methods for low volume roads (TRH4, DCP-CBR and ORN31). Additional objectives are to evaluate the outcome (uptake) and potential impact of the DCP-DN method. As part of the evaluation procedure, 36 “in-situ” designs were undertaken based on actual design information from 10 road sections located in countries in west, east and southern Africa. These in-situ designs were supplemented by a relatively large number of “hypothetical” designs, some 2304 in all, which were based on a wide range of road environmental conditions likely to be encountered in practice (3 traffic classes, 4 in-situ subgrade conditions, 2 climatic zones, 6 material types and 3 haul distances). Thus, it is practicable only to present the global cost trends for the various design methods that were evaluated in terms of the following:
• pavement cost and pavement cost ratios (DCP-DN versus other design methods).
• total project cost and project cost ratios (DCP-DN versus other design methods).
• total project cost savings/km (DCP-DN versus other design methods). In view of the fact that the roads are all relatively new and without a performance history that would allow end of design life roughness values, and hence VOCs to be determined, as well as maintenance cost interventions and residual values, the cost comparison boiled down just to pavement construction costs. In keeping with the above approach, the key findings of the analyses emanating from the hypothetical designs, which have been found to be reflective of the outcome of the in-situ designs, are presented in Section 3 and may be summarized as follows:
(1) At design traffic loading up to about 0.7 MESA, and for a wide range of subgrade strengths and climatic zones, the DCP-DN design method will, in the majority of cases, provide pavement construction cost savings in the range of USD 10,000 -20,000 per km, and in many cases in excess of USD20,000/km when compared against all other methods. These costs savings are reduced by about 30 to 60% for the zero-haulage scenario.
(2) The pavement construction cost savings offered by the DCP-DN method occur to a lesser extent in the higher Traffic Loading Classes (TLCs) (0.7 MESA and above) when, in some cases, other design methods, particularly ORN31, are more cost-effective in this higher traffic range.
1 The terms paved and unpaved are referred to in some countries as sealed/surfaced and unsealed/ unsurfaced roads respectively. These terms mean essentially the same thing, i.e. an unpaved/ unsealed/ unsurfaced road is one without a permanent waterproof surface and may consist of locally available earth/sand or imported gravel material. In contrast, a paved/sealed/surfaced road is one in which the surface has been permanently paved/sealed/surfaced by the use of a wide range of surfacing types made from bitumen, concrete, clay bricks, etc. The terms paved and unpaved are used in this report.

Evaluation of Cost-Effectiveness and Value-for-Money of DCP-DN Design Method
Page 11
In general terms, the difference in pavement construction costs per km for the various design methods, and the pavement construction cost efficiency of the DCP-DN design method, relative to the other design methods, decreases with higher quality subgrades and higher TLCs. Also, for the specific set of environmental conditions considered, there is no major difference in the trends between Wet and Dry-Moderate environments. The conclusion to be drawn from the very wide range of design evaluations is that, in general, the DCP-DN method is the most cost-effective design option at relatively low TLCs, up to about 0.7 MESA and across all subgrade strengths. However, at TLCs above 0.7 MESA the method gradually becomes less cost effective than the other methods, particularly ORN31, which become more cost-effective in many situations. The pavement costs derived for the hypothetical and in-situ designs mirrored each other closely, and the resulting trends for pavement construction cost as well as total project construction cost differences/km, were similar. However, it should be noted that there would be potentially larger project construction cost differences in countries with higher material costs compared to those in South Africa. It is also interesting to note that ORN31 has been shown to be generally more cost-effective than its successor for LVR design, the DCP-CBR method, in all design environments. This may be partly explained by two reasons:
(1) ORN31, together with the DCP-DN method, and in contrast to the DCP-CBR and TRH4 design methods, allows for the use of unsoaked subgrades which offer scope for using relatively thinner/less costly pavement structures.
(2) The adopted soaked/unsoaked subgrade CBR ratio for the DCP-CBR method appears to be very conservative compared to that adopted in the DCP-DN and ORN31 methods. This results in the need for relatively thicker/more costly, pavement layers.
One of the major benefits of the hypothetical evaluation spreadsheets is that they can be used by practitioners to determine the likely costs of their designs in a particular set of road environment conditions, and which is the most appropriate design method to use. The spreadsheets also offer the potential for being developed as an application tool for undertaking LVR design based on a set of input parameters. Based on a visual condition survey of four of the DCP-designed roads that have been in service from 6 – 28 years, and are located in both dry-moderate and wet climatic zones, they are all rated to be in fair-good condition. However, lack of future maintenance could jeopardise their long-term performance. In terms of Value for Money (VFM), the DCP-DN method has been evaluated in terms of the following:
(1) Cost-effectiveness: The outcome of the various cost evaluations undertaken and summarised above illustrate the general cost-effectiveness of the DCP-DN method in the lower traffic ranges up to about 0.7 MESA against the other design methods.
Given that many countries in Africa have embarked on programmes for improving basic access in rural areas by upgrading gravel roads to a paved standard, typically of the order of 100 – 150 km/annum, the potential benefits of adopting the DCP-DN method over a 5-year planning horizon, could result in cost savings of the order of USD60 – 180 million, depending on the extent of the upgrading programme and the road environment conditions. When extrapolated to all 46 Sub-Saharan countries, this figure is estimated at USD 2.7 – 18 billion. Such an upgrading policy would also conserve large quantities of higher quality material for future use as the need for stronger pavements increases.

Evaluation of Cost-Effectiveness and Value-for-Money of DCP-DN Design Method
Page 12
(2) Outcome (uptake) and knowledge: This has been assessed in terms of the following: a. Sustainability: This has been demonstrated in terms of the following typical
examples:
i. Seminars, workshops and meetings aimed at knowledge sharing between participating ReCAP countries and their wider community of practitioners.
ii. Establishment of Working Groups or Steering Committees with the objective of discussing intensively issues associated with the environmentally optimised design of LVRs.
iii. Construction and long-term monitoring of demonstration or trial sections designed on the basis of the DCP-DN method.
iv. Contributions in kind from partner Governments in terms of staff time and funding/co-funding with bi-lateral partners.
v. The holding of basic and advanced training courses in the DCP-DN method of design for engineers and technicians in a number of African and Asian countries that have led to the certification of four AfCAP Level 1 Trainers which qualifies them to undertake such training nationally or internationally.
(b) Uptake: This has been manifested as follows:
i. ReCAP country partner financing of the DCP-DN design method in three countries so far.
ii. Incorporation of the DCP-DN design method requirements in local standards and specifications in at least four countries so far, and on-going revisions in at least another five countries.
(c) Quality of DCP-DN research: This has been manifested as follows:
I. Production of at least one internationally peer-reviewed paper on the DCP-DN method of design in the research proceedings of a major civil engineering institution in the UK
II. Production and presentation of at least 7 papers on the DCP-DN method of design in a number of regional and international conferences.
(d) Knowledge of the DCP-DN method. This has been manifested as follows:
i. An increase in the knowledge base for the DCP-DN method of pavement design which is gradually increasing in terms of the following:
▪ The number of certified trainers who have themselves applied the method in practice in at least three countries.
▪ Incorporation in at least one international course in Rural Roads for Development held at the University of Birmingham, UK.
(3) Potential impact: Although it may be too soon to start quantifying the impact of
introducing the DCP-DN method of design for the more recently constructed trial sections, or of adopting any DCP-related method of design for future LVRs, such impacts are likely to be a factor within the causal package leading to:
a. Reduced cost/increased cost-effectiveness of LVR provision.
b. Optimum use of non-renewable gravel resources.
c. Improved transport services at cheaper costs.
d. Increase in agricultural production and productivity due to more reliable, all-season access to market places.

Evaluation of Cost-Effectiveness and Value-for-Money of DCP-DN Design Method
Page 13
e. Improvements in education and health due to communities being able to access such facilities in all seasons.
f. Increased resilience to climate impacts due to more durable paved road surfaces.
g. Ultimately, poverty reduction in the vicinity of the project due to improvements in community livelihoods.
In summary, the use of the DCP-DN method and, indeed other methods such as ORN31 when applied to relatively high design traffic loadings (>0.7 MESA) in some road environments, is expected to provide Value for Money in terms of the following:
a. Cost-effectiveness. b. Outcome (uptake) and knowledge. c. Potential impact.
In terms of the way forward, and based on the many lessons learnt during the course of undertaking this project, the following recommendations are made:
(1) A practitioner’s workshop should be held to discuss and disseminate the findings of this report.
(2) As part of the on-going ReCAP project on Long Term Pavement Performance (LTPP) monitoring of trial sections in a number of partner countries, measurement of in-situ moisture in the pavement layers and subgrade, and across the horizontal profile of the sections, should be given high priority in order to validate the assumptions made on this parameter in all the design methods.
(3) In order to embed in practice the potential benefits to be derived from the use of the DCP-DN method, a generic guideline on the Design of Low Volume Roads should be produced so as to provide practitioners with another choice of design method for their consideration.
(4) The Regional Research Centres should undertake a similar data collection exercise to the one initiated under this project, in say 5 years time, so as to consolidate on the preliminary results of the VFM exercise initiated under this project.
(5) Consideration should be given to developing the spreadsheets prepared under this project as an application tool for undertaking LVR design based on any set of input parameters to determine what are the likely costs of their designs in a particular set of road environment conditions, and which is the most appropriate design method to use.
(6) Consider the following topics for further research to enhance the efficacy and applicability of the DCP-DN design method
a. Determine the precision limits of the DCP-DN measurement as against the CBR measurement as adopted by other LVR design methods.
b. Compare the designs produced by the DCP-DN and other design approaches (DCP-CBR, TRH4 and ORN31) with an analytical approach.
c. Use suitably calibrated road investment appraisal models such as HDM-4 or the World Bank’s Roads Economic Development Model (RED) to appraise robustly the LCCs of the DCP-DN and other design approaches.

Evaluation of Cost-Effectiveness and Value-for-Money of DCP-DN Design Method
Page 14
1 Introduction
1.1 Background
One of the key goals of the DFID-supported Research for Community Access Partnership (ReCAP) is to promote safe and sustainable rural access in Africa and Asia through research and knowledge sharing between participating countries and the wider community. In this regard, the Programme focuses on conducting high quality, applied research that will assist Low Income Countries (LICs) to increase all-weather rural access to poor communities. It builds on the strengths of AfCAP and SEACAP in working alongside partner Governments to encourage high levels of research uptake. The expected outcome of the Programme is “Sustained increase in the evidence base for more cost effective and reliable low volume rural road and transport services, promoted and influencing policy and practice in Africa and Asia”. A key aspect of the attainment of this outcome is the cost-effective provision of low volume roads (LVRs) based on the use of appropriate pavement design methods. To this end, ReCAP has supported the enhancement of a method of pavement design based on the use of the Dynamic Cone Penetrometer (DCP) as an alternative to the more traditional California Bearing Ratio (CBR)-based design methods. Both methods are based on measurement of a proxy for the in-situ shear strength of a material. In the case of the DCP-DN method, it is the resistance to penetration of a material by a DCP cone - the DN value (mm/blow) whilst, in the case of the DCP-CBR method, it is the ratio of the force per unit area per minute required to penetrate a soil mass, to the force required for a similar penetration of a standard crushed rock material – the CBR value (%).
1.2 Motivation for Project
For a variety of perceived advantages, there is, in a number of countries in Africa and Asia, an increasing uptake of the DCP-DN method of design, as against the more traditional CBR-based approaches to the design of LVR pavements (Rolt and Pinard, 2016). The main advantages of the DCP-DN method and, indeed, all other DCP-related methods of design, are that it:
• Involves the use of relatively low cost, robust apparatus that is quick and simple to use (approx. 30 minutes per test). This allows many measurements of pavement layer thicknesses and strengths to be obtained to provide a comprehensive characterization of the in-situ road conditions. This provides a strong statistical basis for design, minimizing the risks of under- or over-design inherent in any method that does not provide sufficient information for a proper statistical analysis.
• Provides improved precision limits compared to the CBR test (Smith and Pratt, 1983). The strength (DN) values obtained in the field or the laboratory are inherently more accurate because the DCP provides a virtually continuous strength profile throughout the layer being tested (+/- 150 mm) whereas a CBR test is naturally biased towards the ends of the test mould at a penetration depth of 2.5 or 5.0 mm. Moreover, it has been shown that with reasonable care taken to control testing errors, DCP data can be treated as representative of in-situ materials characteristics (Roy, 2007).
• Involves testing actual subgrade strength using the DCP at multiple points along the road at the time of the year when subgrades are weakest as well as under multiple seasonal scenarios in contrast to CBR-testing which is relatively costly and time consuming to carry out, requiring a large amount of material for laboratory testing at relatively large spacing – typically every 500 to 1000 metres. Moreover, the entire subgrade to a depth of 800 mm is assessed in-situ by the DCP in 150 mm layers, as opposed to the more traditional approach in which composite samples are typically taken from the top 300 – 500 mm of the subgrade for CBR testing to determine a

Evaluation of Cost-Effectiveness and Value-for-Money of DCP-DN Design Method
Page 15
representative subgrade design CBR to define uniform sections. However, when the materials differ significantly in the top 500 mm (a common occurrence), the design CBR from a composite sample can be misleading.
• Provides a standalone means of improving the quality control of compacted materials from density-based methods, which tend to be slow, potentially hazardous (nuclear gauges) and of uncertain accuracy, particularly where there is a variation in site materials along any tested section (Livneh and Livneh, 2013; Hongve and Pinard, 2016) to stiffness/strength-based methods which allows direct comparison to be made between design and achieved strengths on site (Siekmeier et al, 2009).
• Offers a holistic approach to the provision of LVRs in that the DCP test can be used for field investigations, pavement design, laboratory testing and compaction quality and layer thickness control.
In the case of the DCP-DN method only:
• Avoids the need to convert the DCP-DN values to equivalent CBR values at any stage of the design process which would incur errors due to the relatively poor correlation between DCP and CBR measurements with material specific correlation coefficients ranging from 0.67 – 0.79 (Sampson and Netterberg, 1990).
The main limitations of using the DCP device, in conjunction with any DCP-related method of design, include the following (Rolt and Pinard, 2016):
• If the existing pavement contains material that is very coarse the DCP probe may ‘hit’ a large stone or be deflected sideways creating friction on the shaft resulting in incorrect readings. This may require some DCP tests to be abandoned or repeated.
• If the pavement contains a cemented layer the DCP may not be able to penetrate. To obtain information about the underlying structure a suitable sized hole may have to be drilled through the cemented layer without using water for lubrication. Similarly, if carried out on an existing road, the drilled hole will need to be made good in such a manner as to not affect the integrity of the road and lead to future water ingress.
• The DCP tests may be performed poorly (e.g. hammer not falling the full distance, non-vertical DCP, excessive movement of the depth measuring rod, use of a blunt cone, etc.). Any test can be poorly executed and therefore this is not a particular limitation of the DCP test. However, the DCP test is less operator susceptible than many other tests thus reducing the risk of measurement error (Livneh and Ishai, 1987).
In addition to the above, the DCO approach is empirically founded with the associated caveats of extrapolating empirical procedures to other environments. Despite the perceived advantages of the DCP-DN method of pavement design, they are yet to be fully quantified. This has prompted the letting of a ReCAP project pertaining to the “Evaluation of cost-effectiveness and value-for-money of DCP-DN pavement design method for low-volume roads in comparison with traditional designs”.
1.3 Purpose and Scope
The main purpose of the project is to evaluate, in terms of cost-effectiveness and value-for-money, a number of unpaved road sections located in selected African countries that were upgraded to a paved standard using the DCP-DN method. This has entailed the collection and analysis of the construction costs of these road sections in order to determine their life-cycle costs in comparison with the same sections of roads upgraded to a paved standard using traditional, CBR-based pavement designs. In addition, the project has also evaluated the outcome (uptake) of the DCP-DN method and knowledge as well as its potential impact.
Evaluation of Cost-Effectiveness and Value-for-Money of DCP-DN Design Method
Page 16
As indicated in the Terms of Reference (ToR), the scope of work associated with the attainment of the above objectives was as follows: 1. Stage 1: Undertaking of a desk study of the design, construction and maintenance activities
that have been carried out on each road section. This was based on design reports, completion reports (as-built information), monitoring reports, where available, as well as other sources.
2. Stage 2: Visiting some of the roads in each country to get an appreciation of their in-service
performance and current condition. 3. Stage 3: Holding meetings with relevant authorities in-country to familiarise them with the
objectives of the study.
4. Stage 4: Compiling information on construction costs, maintenance costs and computing life-cycle costs for each road section.
5. Stage 5: Preparing an evaluation report providing a comparison of the pavement costs, total project costs and project cost difference per km of the three typical, traditional design methods against the DCP-DN design method as well as the cost-effectiveness and value-for-money aspects of the EOD approach incorporating the DCP-DN design method.
Following completion of Stage 1 of the project – a desk study of alternative methods of pavement design for LVRs - which was reported upon in the Inception Report, the subsequent stages of the project have included the following: (1) Field visits and data collection in the various countries involved in the project with the
objective of compiling information on construction and maintenance costs as well as undertaking a qualitative assessment of the performance of these roads
(2) Determination of the pavement structures derived from application of four design
methods (DCP-DN, DCP-CBR, ORN31 and TRH4) based on actual input data pertaining to the design traffic loading, in-situ subgrade strength and climatic environment pertaining to the ten road sections located in the various countries.
(3) Determination of the pavement structures derived from application of the four design
methods based on a “hypothetical” approach involving a relatively wide range of input factors in terms of traffic loading, in-situ subgrade strength and climatic environment.
(4) Application of the construction cost data to the various pavement structures as a basis
for determining the LCC for each design method (both in-situ and hypothetical) and, subsequently the pavement cost ratios, total project cost ratios and total project cost difference per km for the four design methods evaluated.
(5) Preparation of an Evaluation Report including the outcome of the LCC analyses and the
determination of Value-for-Money aspects of the DCP-DN design method.
1.4 Final Evaluation Report
This Final Evaluation Report is structured as follows: An Executive Summary that summarises the main findings of the report.
Section 1 (this section): A brief introduction to the project including its purpose and scope.
Section 2: The approach and methodology for undertaking the life-cycle cost analyses.
Section 3: The LCC evaluation procedure and key outcomes.
Section 4: The evaluation of value-for-money pertaining to the use of the DCP-DN design method.
Section 5: A summary of key findings and conclusions of the project.

Evaluation of Cost-Effectiveness and Value-for-Money of DCP-DN Design Method
Page 17
2 Approach and Methodology
2.1 General
The ToR required the Consultant to focus on 10 road sections in 5 countries, namely: Malawi, Zambia, Ghana, Tanzania and Kenya. However, since the design traffic loading on these roads is all relatively low (up to 0.3 MESA), the range was extended by inclusion of two road sections from South Africa, one of which has carried an estimated 0.8 – 1.0 MESA).
Based on the above, the number of design scenarios for a particular road section is relatively limited in that it would have produced only 36 designs (4 design methods x 1 traffic class x 1 subgrade strength x 1 climatic zone x 3 material types x 3 borrow pit haulage distances) from which to draw conclusions relating to the cost-effectiveness of the DCP-DN against the other CBR-based methods. This number of “in-situ” designs was considered to be too few to draw definitive conclusions on the cost-effectiveness of the various design methods that, in practice, could be applied to a much larger number of design scenarios. As a result, a “hypothetical” approach also had to be considered as described below.
2.2 Hypothetical Approach
In view of the above, it became necessary to also include a “hypothetical” approach for evaluating the cost-effectiveness of the various design methods. This approach allows a much larger number of design scenarios to be considered in a wide range of road environments, some 2304 in all (4 design methods x 3 traffic classes x 4 subgrade strengths x 2 climatic zones x 6 material types x 4 borrow pit
haulage distances2). The design matrix for the hypothetical approach is discussed further in Section 4.
2.3 Selection and Requirement of Design Methods
2.3.1 Selection of design methods The criteria that were used to select the LVR design methods for comparison with the DCP-DN method
are as follows:
• Developed specifically for LVRs
• Developed for generic rather than country-specific application
• Widely used in the African region
Based on the above criteria, the design methods that were selected for comparison with the DCP-DN
method are as follows:
• ORN31
• TRH4
• DCP-CBR (TRL)
2.3.2 Applicability of DCP Methods of Design DCP-based methods of design, such as the DCP-DN, DCP-CBR and ORN31 design methods, if appropriately applied in line with their stipulated design catalogues and procedures, can be applied to most design situations found in practice in tropical and sub-tropical regions of the world. It should be noted, however, that the DCP method cannot be used directly if the proposed road is in cut or on fill, where the final formation level of the alignment would be outside the influence zone of an existing alignment DCP survey. In such cases, the material to be used for the embankment would need to be tested to determine its properties at varying densities and moisture contents. Fills can then be
2 Three haulage scenarios were originally considered in the hypothetical approach for evaluating the cost-effectiveness of the various design methods – low: 1 - 10 km, medium: 10 – 30 km and high: 30 – 100 km. However, a request was made for consideration to be also given to a zero-haulage scenario. The implications of this are discussed on page 37.
Evaluation of Cost-Effectiveness and Value-for-Money of DCP-DN Design Method
Page 18
designed in accordance with the relevant catalogue to ensure that all the layers comply with the specifications of the respective design method. This will allow designers to go straight to design catalogues for contractual quantities. In areas of significant widening, the approach would be as described above, depending on whether the widening would involve a cut or fill situation.
2.3.3 Input requirements As with all empirical methods of pavement design, the four main requirements of the design procedure are generally as follows (Rolt and Pinard, 2016):
• Assessment of subgrade strength.
• Assessment of design traffic loading.
• Selection of pavement materials.
• Determination of pavement layer requirements (thickness and/or strength).
Apart from the determination of traffic loading, which is generally quite straight forward, the other aspects of the design procedure all vary quite significantly between the methods under consideration and, as a result, must be fully understood in order to produce credible designs. For this reason, a brief description of the key features of the four design methods is provided below: 2.3.4 DCP-DN method The DCP-DN design method is empirical in nature and the findings are currently based on measurements and observations on a range of soil types and environmental conditions prevailing in South Africa. The method is now being commonly and effectively used in a number of countries in Africa, including Malawi, Tanzania, Ghana and Kenya and could be effectively used in geotechnical environments similar to those countries. In dissimilar environments, further verification and performance monitoring may be required. Details of the development and application of this design method have been summarised in the Inception Report and are documented in other literature (e.g. Kleyn, 1984; Paige-Green and Van Zyl, 2018). Assessment of subgrade strength: This is based on the strength (DN value) of the subgrade layer at the anticipated long-term equilibrium moisture content (EMC) of the road after it has been upgraded or rehabilitated to a paved standard. Depending on environmental conditions, the EMC in the subgrade may be expected to equilibrate above, at or below OMC when compacted to the highest practicable field density, i.e. refusal density or “compaction to refusal” which is a specific feature of the DCP-DN method. Selection of pavement materials: This is based on the following procedure: (a) The evaluation of earthworks, subgrade and pavement materials on the basis of their
characterisation as defined by relevant materials testing in terms of grading, plasticity, deleterious inclusions (e.g. organics) or other specific properties such as swell, erodibility or collapse potential.
(b) The selection of materials in terms of acceptability for specific use is then based on judgment related to a combination of specified criteria allied to engineering judgment, bearing in mind the preference for local material use on LVRRs.
(c) Once acceptability is agreed, the use of DCP-DN procedures to select and control the use of materials that have been previously defined as acceptable.
Testing to ascertain the durability properties of the material is undertaken separately from the DCP-DN test based on appropriate durability testing.

Evaluation of Cost-Effectiveness and Value-for-Money of DCP-DN Design Method
Page 19
Determination of pavement layer requirements: This is specified in a single DCP-DN structural catalogue (Annex A) that prescribes the pavement layer thicknesses and strengths in 150 mm increments to a depth of 800 mm, i.e. the required strength profile. The layer strengths are varied in relation to traffic loading and increase (decreasing DN value) gradually in relation to an increase in design traffic loading. The design method can be adapted for any selected layer thicknesses or materials available. The catalogue is based on the DCP assessment and performance of more than a thousand road sections carried out in the 1970s (Kleyn and van Zyl, 1989) and subsequent investigations (Paige-Green, 1994).
2.3.5 DCP-CBR method
Details of the development and application of this design method have been summarised in the Inception Report and documented in other literature (e.g. Gourley and Greening, 1999). Assessment of subgrade strength: This is based on the in-situ worst-case long term conditions similar to that obtained in the laboratory soaked CBR test. However, in a dry/moderate climate it is assumed that the subgrade CBR strength value is halved which is equivalent to a shift upwards of one subgrade class (Gourley, 2002). The DN values are converted to CBR values, based on the TRL (as distinct from the Kleyn) DCP-CBR correlation, for input into a CBR catalogue. It should be noted, however, that the ratio between soaked and unsoaked CBRs is significantly less than the research-based ratios developed by both Emery (Emery, 1985) and Paige-Green (Paige-Green et al, 1999). This is likely to lead to the use of higher quality/thicker/more costly pavement layers. Selection of pavement materials. This is based on the laboratory soaked CBR test, regardless of climate, and at a specified density likely to be attained in the field. Requirements are placed on the allowable plasticity and grading of the material, the limits of which are related to the class of material, i.e. the higher the class, the more stringent the limits and the type of material, i.e. different for pedogenic and non-pedogenic materials. Determination of pavement requirements (thickness and/or strength): This is based on the use of two structural design catalogues, one for dry-moderate climates (N-value > 4) and one for wet climates (N-value < 4). (Annex B). Pavement layer thicknesses are variable and range from 120 mm to 275 mm. For a given traffic loading, layer strengths and/or thicknesses are higher/greater in the wet zone than in the dry/moderate zone.
2.3.6 TRH4 method
Details of the development and application of this design method have been summarised in the Inception Report and documented in other literature (e.g. COLTO, 1996). Assessment of subgrade strength: This is based on the soaked CBR value, regardless of climatic zone. A minimum CBR value of 3% at 95% Mod. AASHTO is assumed for design purposes, but lower layers in the catalogue may be omitted if the subgrade CBR strength is higher than 3% or, conversely, added if the subgrade CBR strength is lower than 3% Selection of pavement materials. This is based on the soaked CBR value. In addition, requirements are placed on the allowable plasticity and grading of the material, the limits of which are related to the class of the material, i.e. the higher the class, the more stringent the limits as stipulated in TRH4 (CSRA, 1985). Determination of pavement requirements (thickness and/or strength: This is based on the use of two structural design catalogues, one for dry-moderate climates (N-value > 2) and one for wet climates (N-value <2) (Annex C). Pavement layer thickness varies between 100 and 200 mm and layer strengths are varied in relation to the geo-climatic zones – dry/moderate (Weinert N value > 2) and wet (Weinert N value < 2). Thus, for a given traffic loading, layer strengths are higher in the wet zone than in the dry/moderate zone.

Evaluation of Cost-Effectiveness and Value-for-Money of DCP-DN Design Method
Page 20
2.3.7 ORN31 method Details of the development and application of this design method have been summarised in the Inception Report and documented in other literature (TRL, 1993). Assessment of subgrade strength: This is based on the moisture content equal to the wettest moisture condition likely to occur in the subgrade after the road is opened to traffic, i.e. the long-term, in-service, equilibrium moisture content. Three categories of subgrade condition are assessed:
(1) Category 1 Subgrade where the water table is sufficiently close to the ground surface to control the subgrade moisture content. In this case, the moisture content is determined from similar roads in the vicinity or from a knowledge of the relationship between suction and moisture content for the subgrade soil. In practice, this moisture content is likely to be at or above OMC.
(2) Category 2 Subgrade with deep water tables and where rainfall is sufficient (> 250mm) to produce significant changes in moisture conditions under the road. The moisture condition for design purposes can be taken as the optimum moisture content given by the BS Standard (Light) Compaction Test (2.5 kg rammer method).
(3) Category 3 Subgrade in areas with no permanent water table and where the climate is dry throughout most of the year (annual rainfall 250 mm or less). For design purposes a value of 0.80 OMC obtained in the BS Standard (light) Compaction test (2.5 kg rammer method).
Selection of pavement materials. This is based on the soaked CBR of 80% for the basecourse and 30% for the subbase, regardless of climatic zone. Requirements are placed on the allowable plasticity and grading of the pavement materials, the limits of which are related to the design traffic class and moisture regime, i.e. the higher the class and the wetter the anticipated moisture regime, the more stringent the limits. Determination of pavement requirements (thickness and/or strength): This is based on the use of one structural design catalogue (Annex D). Pavement layer thickness varies between 100 and 350 mm and layer strengths are varied as discussed above. The layer strengths are varied in relation to traffic loading and increase (decreasing DN value) gradually in relation to an increase in design traffic loading.
2.4 Design Assumptions
A number of key assumptions underlie the application of all four design methods discussed above, as follows: 2.4.1 Drainage Drainage is undoubtedly one of the most important factors that affects the long-term performance of a LVR, given adequate construction practice, maintenance attention and control of overloading. Thus, the assumed long-term equilibrium moisture content (EMC) is critical in that it affects the strength of the material in the pavement layers and the subgrade. For purposes of the pavement design and LCC analyses, it has been assumed that, for all four design methods under consideration, adequate drainage prevails. In terms of currently recommended practice, this means that the level difference between the crown of the road and the invert of the drain (gradient dependent), should be about 0.75 m on relatively flat ground and slightly less on steeper ground) and, where feasible, the level distance between the original ground level and the underside of the subbase layer should be about 0.15 m. If these requirements are achieved in practice, then from research findings (Emery,1985) it can be expected with a high degree of probability that:
• The EMC in the subgrade equilibrates below OMC in dry climates (annual rainfall < 500 mm) or at, or below, OMC in wet climates (annual rainfall > 500mm) (Annex E).
• The EMC in the pavement layers is independent of climate with the average moisture content equilibrating below OMC (0.63 OMC in the base and 0.78 in the subbase (Annex E).

Evaluation of Cost-Effectiveness and Value-for-Money of DCP-DN Design Method
Page 21
For the in-situ designs, the implications of the above findings are that where adequate drainage prevails, and where the entire width of the road is sealed to the front slope of the side drain (a design requirement) then pavement layers and the subgrade are assumed to operate in an unsoaked condition, i.e. at or below OMC, irrespective of climatic zone. However, for the DCP-DN design method, it has been assumed, conservatively, that the in-situ moisture content will be equivalent to OMC. Soaked designs for the pavement and subgrade could, of course, be warranted, due to poor drainage, high water tables, occurrence of flood plains, etc., but these scenarios would require special design considerations which, in any case, would be over-ridden by the assumptions adopted for the road designs, as indicated above, and do not feature in the pavement structures subjected to LCC analyses for the in-situ or hypothetical designs. 2.4.2 Maintenance and overload control For purposes of the LCC analysis, it is assumed that adequate maintenance and overload control prevail and apply equally to all four design methods under consideration. As regards the former factor, the required periodic maintenance interventions and their timing are assumed to be broadly similar for a well-constructed, appropriate surfacing type placed on pavement structures of similar bearing capacity. However, as indicated in Section 3.2.3-Life Cycle cost analysis, in the absence of a performance history of the road sections, the LCC analysis has boiled down to a comparison of initial construction costs only.
2.4.3 Terrain It is assumed that the in-situ designs for the 10 road sections apply to situations where the road is located in either flat or rolling terrain (max. gradient < 8%), and not for steep or very steep gradients where structural surfacings would be required, such as concrete slabs (reinforced/unreinforced), concrete blocks, etc. may be required. In these situations, design methods, other than those being considered in this project, would be required and are outside the scope of this project.
2.4.4 Materials compliance Although not always necessarily the case, it is assumed for the purposes of the LCC analyses that the materials located from the borrow pits are compliant with the requirements of the particular design method. In practice, this may not be the case and the material may either be rejected or possibly mechanically modified at some additional costs to meet simultaneously the specification requirements in terms of strength (CBR), grading and plasticity. 2.4.5 Representative DN Values In practice, many methods rely on the use of the DCP to determine uniform sections of the road under design by undertaking a CUSUM analysis of the range of values within that uniform section as follows:
(a) DCP-DN: Uses the 80th, 50th or 20th percentile of the range of values depending on whether the anticipated long-term EMC in the pavement is respectively wetter than, the same or drier than at the time of the DCP survey.
(b) TRH4: Uses the 90th/10th percentile of the range of CBR/DN values found along the road, as determined from a DCP survey.
(c) DCP-CBR: Uses the mean, lower quartile or lower decile value of the range of CBR/DN values
as in Table 1 below (Gourley and Greening, 1999):
Table 1: Dependence of design subgrade values on design traffic class (DCP-CBR method)
Design traffic class Design CBR/DN
< 0.3 MESA 0.3 – 0.5 MESA 0.5 – 1.0 MESA
Mean CBR 75th/25th percentile 90th/10th percentile

Evaluation of Cost-Effectiveness and Value-for-Money of DCP-DN Design Method
Page 22
(d) ORN31: Use the 90th/10th percentile of the range of CBR/DN values within a uniform section as determined from a DCP survey.
The above percentile values for the different design methods were used in the determination of the design subgrade strength in a uniform section of road for pavement design purposes. 2.4.6 Conversion from DN to CBR The following relationships were used to convert DN values to CBR values as developed by Kleyn (Kleyn, 1984) and TRL (Samuel and Done, 2005).
(1) Kleyn: CBR = 410 x DN1.27 (2) TRL: DN = 10^ (2.48 – Log CBR)/1.057
It should be appreciated however, that the conversion from DCP-DN values to equivalent CBR values at any stage of the design process will introduce errors due to the relatively poor correlation between DCP and CBR measurements (material specific correlation coefficients range from 0.67 – 0.79; Sampson and Netterberg, 1990).
2.4.7 Conversion from in-situ DCP CBR to laboratory soaked CBR values A key requirement for comparing the pavement structures derived from the various pavement design methods is to convert the in-situ DCP-CBR values to equivalent laboratory soaked CBR values for use in the DCP-CBR, TRH4 and ORN31 methods. This was achieved by using the relationship between soaked CBR values and field DCP-CBR values as developed by Paige-Green et al (1999) from their LVR database (see Table 2).
Table 2: Relationship between in-situ DCP CBR and soaked CBR (Paige-Green et al, 1999)
Relationship between DCP CBR and G class for unsealed roads
Material classification
Soaked CBR Approximate field DCP-CBR: Unsealed road
Subgrade Wearing Coarse
Wet Dry Very dry Dry Moderate Damp
G4 or NG80 80 - - 260 205 151 96
G5 or NG45 45 - - 188 148 109 69
G6 or NG25 25 56 66 146 115 85 54
G7 or G/S15 15 52 62 137 108 79 50
G8 or G/S10 10 39 46 101 80 59 37
G9 or G/S7 7 38 44 - - - -
G10 or G/S3 3 35 41 - - - - Note: Very dry = 0.25 OMC, Dry = 0.5 OMC, Moderate = 0.75 OMC and Damp = OMC By way of example, a wearing course material with a DCP CBR value of 54 at OMC would be equivalent to a soaked CBR value of 25.
2.5 Field Visits and Data Collection 2.5.1 General Field visits were made to the countries listed in Table 3, except for Kenya, for the purpose of obtaining information on construction and maintenance costs as well as for undertaking a qualitative assessment of the performance of some of these roads. The cost information for Kenya was not suitable as the construction included widening of the road which could not be disaggregated from the pavement construction costs.

Evaluation of Cost-Effectiveness and Value-for-Money of DCP-DN Design Method
Page 23
Table 3: Road sections to be evaluated
Country Road Name Length
(km)
Date of
constr.
Type of
Surfacing
Ghana Akyem Kukurantumi – Asafo (Eastern Region) 1 Not yet started -
Malawi Kasinje-Kandau (Ntcheu District) 8.5 2016 Cape Seal
Mwanza-Kunenekude (Mwanza District) 8 2016 Cape Seal
Parachute Batallion-Lifuwu (Salima District) 8 2016 Cape Seal
Linthipe-TC-Lobi 5 Not yet started -
Kenya D379-Wamwangi-Karatu 0.45 2012 CMA
Tanzania Lawate- Kibongote (Siha District) 14 2012 DSD
S. Africa Danger Point road 4019 (Western Cape) 6.5 2003 SSD + SS
Nelshoogte road (R38 – Nelshoogte Sawmill) 6.5 1991 DSD
Zambia T2 – Waitwika – D1 (Nakonde District) 1 Not yet started -
During the country visits meetings were held with the AfCAP national coordinator and road agency personnel in order to inform them to the objectives of the project. Visits were also made to some of the road sections in Malawi, Tanzania and South Africa where the roads had already been constructed, and discussions held with the local communities to try and obtain some idea of the impact of these paved roads on their livelihoods.
2.5.2 Construction costs
The unit construction cost information required for applying to the different pavement structures determined from both the in-situ and hypothetical designs included the following:
• Cost of material, stockpiled at borrow pits and crushers, ready for loading.
• Load plus free haul of 1km.
• Haul costs per four range distances, including a zero-haulage scenario.
• In-situ rip and recompact costs.
• Plant and labour costs to construct different layer thicknesses.. The format for collecting the cost information from the various countries is presented in Table 4 below which includes typical costs obtained from South African contractors, converted to US dollars (USD/ZAR = 12).
Table 4: Material unit costs
Layer
Quality
Material Unit Costs (USD/m3)
Crusher-Bin
Commercial
Borrow pit –
Bin natural
Plant and Labour Costs by Layer Thickness
100 mm 120 mm 125 mm 150 mm 175 mm 200 mm
NG3 1.67 6.92 5.98 5.50 4.58 3.85 3.16
NG7 1.67 6.92 5.98 5.50 4.58 3.85 3.16
NG10 1.67 7.37 6.22 5.88 4.50 4.00 3.28
NG15 12.92 1.67 8.13 6.95 6.50 5.42 4.50 3.75
NG25 12.92 1.67 8.13 6.95 6.50 5.42 4.50 3.75
NG30 12.92 1.67 8.13 6.95 6.50 5.42 4.50 3.75
NG45 14.63 1.67 9.38 8.02 7.50 6.25 5.17 4.23
NG55 16.99 1.79 9.91 8.48 7.93 6.61 5.46 4.47
NG65 19.36 1.90 10.45 8.94 8.36 6.96 5.76 4.71
NG80 22.92 2.08 11.25 9.63 9.00 7.50 6.20 5.08
Crushed>100 29.58 2.08 12.50 10.70 10.00 8.33 6.89 5.64
Note: NG3 = Natural gravel with a soaked CBR of 3.
Evaluation of Cost-Effectiveness and Value-for-Money of DCP-DN Design Method
Page 24
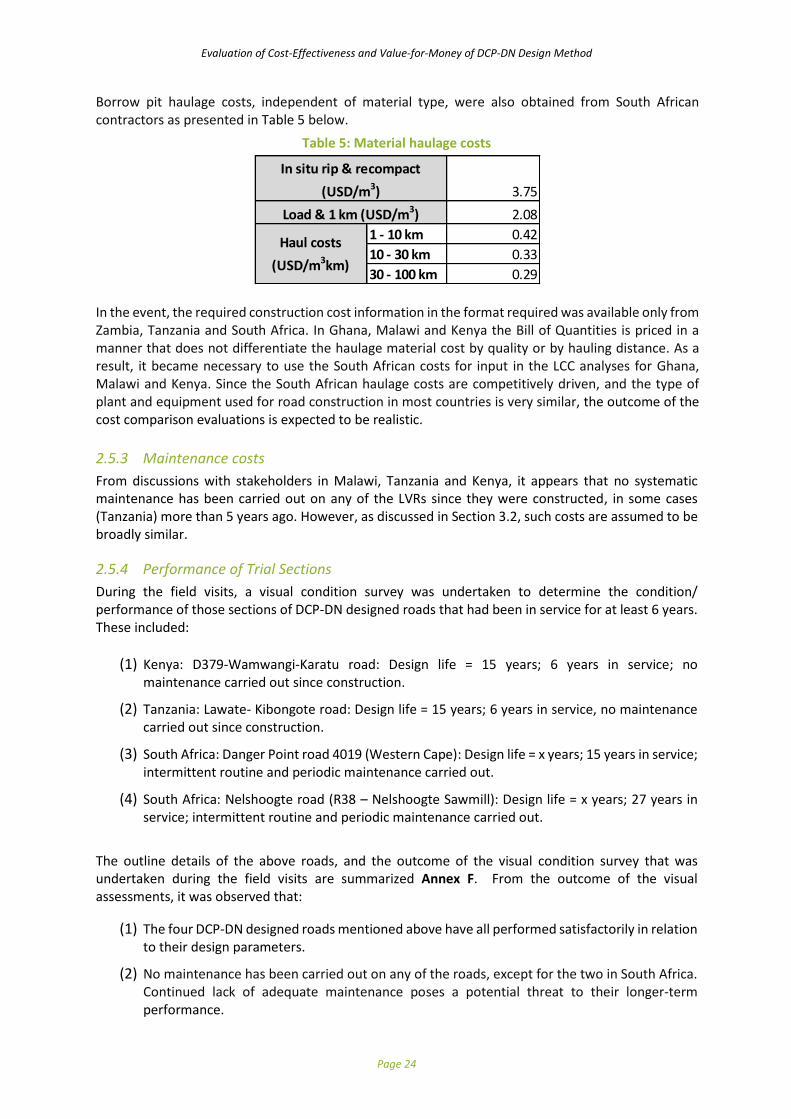
Borrow pit haulage costs, independent of material type, were also obtained from South African contractors as presented in Table 5 below.
Table 5: Material haulage costs
In the event, the required construction cost information in the format required was available only from Zambia, Tanzania and South Africa. In Ghana, Malawi and Kenya the Bill of Quantities is priced in a manner that does not differentiate the haulage material cost by quality or by hauling distance. As a result, it became necessary to use the South African costs for input in the LCC analyses for Ghana, Malawi and Kenya. Since the South African haulage costs are competitively driven, and the type of plant and equipment used for road construction in most countries is very similar, the outcome of the cost comparison evaluations is expected to be realistic.
2.5.3 Maintenance costs
From discussions with stakeholders in Malawi, Tanzania and Kenya, it appears that no systematic maintenance has been carried out on any of the LVRs since they were constructed, in some cases (Tanzania) more than 5 years ago. However, as discussed in Section 3.2, such costs are assumed to be broadly similar.
2.5.4 Performance of Trial Sections
During the field visits, a visual condition survey was undertaken to determine the condition/ performance of those sections of DCP-DN designed roads that had been in service for at least 6 years. These included:
(1) Kenya: D379-Wamwangi-Karatu road: Design life = 15 years; 6 years in service; no maintenance carried out since construction.
(2) Tanzania: Lawate- Kibongote road: Design life = 15 years; 6 years in service, no maintenance carried out since construction.
(3) South Africa: Danger Point road 4019 (Western Cape): Design life = x years; 15 years in service; intermittent routine and periodic maintenance carried out.
(4) South Africa: Nelshoogte road (R38 – Nelshoogte Sawmill): Design life = x years; 27 years in service; intermittent routine and periodic maintenance carried out.
The outline details of the above roads, and the outcome of the visual condition survey that was undertaken during the field visits are summarized Annex F. From the outcome of the visual assessments, it was observed that:
(1) The four DCP-DN designed roads mentioned above have all performed satisfactorily in relation to their design parameters.
(2) No maintenance has been carried out on any of the roads, except for the two in South Africa. Continued lack of adequate maintenance poses a potential threat to their longer-term performance.
3.75
2.08
1 - 10 km 0.42
10 - 30 km 0.33
30 - 100 km 0.29
Haul costs
(USD/m3km)
In situ rip & recompact
(USD/m3)
Load & 1 km (USD/m3)
Evaluation of Cost-Effectiveness and Value-for-Money of DCP-DN Design Method
Page 25
3 LCC Evaluation Procedure
3.1 General
A fair, equitable and transparent approach to undertaking the evaluation of cost-effectiveness of the DCP-DN method of pavement design for LVRs in comparison with traditional design methods is essential, if the outputs are to be credible. To this end, this section presents the following:
• The method of life-cycle cost analysis considered appropriate for use on the project.
• The principles that will be applied for determining the cost-effectiveness of the various LVR design methods under consideration.
3.2 Comparative Cost Evaluation
3.2.1 General approach
The approach envisaged in the ToR for undertaking a comparative cost evaluation of the alternative
methods of pavement design for upgrading from an unpaved (gravel) road standard to a paved
standard is as follows:
1) Determine construction costs as well as life-cycle costs (LCC) of upgrading from an unpaved (gravel) road to a paved road based on:
(a) the use of the DCP-DN method, and
(b) the use of selected, traditional CBR-based design methods.
2) Compare the LCC derived from (a) and (b).
3.2.2 Life-cycle cost components
In general, a LCC analysis includes consideration of all costs anticipated over the life (or analysis period) of the road. The principal components of such an analysis typically includes the following:
• agency costs
• initial construction and rehabilitation costs
• maintenance costs over the design period
• benefits due to savings in user costs over the analysis period
• salvage costs. In order to convert all the costs and benefits that may occur throughout the life of each road option, a discounted cash flow technique may be used to determine the Net Present Value (NPV) of each option on which basis the preferred option can be determined from the following relationship:
NPV = C + ∑Mi (1 + r)-Xi - S(1 + r)-Z
Where: NPV = present worth of costs C = present cost of initial construction Mi = cost of the ith maintenance and/or rehabilitation measure r = real discount rate Xi = number of years from the present to the ith maintenance and/or rehabilitation measure within the analysis period Z = analysis period S = salvage value of the pavement at the end of the analysis period expressed in terms of present values

Evaluation of Cost-Effectiveness and Value-for-Money of DCP-DN Design Method
Page 26
Agency costs Agency costs include those costs incurred by the agency in undertaking the planning, design and administration aspects of implementing a road project. They have been excluded from the LCC analysis as they are assumed to be broadly similar for all the design options. Construction and rehabilitation costs For a given road with a specific design traffic loading that is located in a particular road environment (terrain, subgrade conditions, moisture and temperature regimes, etc.), the unit cost of construction will depend primarily on the type of pavement structure required by the particular design method in terms of quality/thickness of the pavement layers. It is assumed that, over the design life of the LVRs under consideration, major rehabilitation would not be required.
Maintenance costs The maintenance required on a LVR is a function of the rate and nature of road deterioration which will be dependent on pavement composition, traffic loading and environmental influences. An assessment needs to be made of future annual routine maintenance requirements, periodic treatments, such as reseals, and rehabilitation such as structural overlay. Road user costs Road user costs are those costs incurred by road users travelling on the road and are typically an aggregation of three separate components: Vehicle Operating Costs (VOC), which are influenced by the roughness of the road, Traffic Accident Costs and User Delay Costs.
Salvage costs The salvage value of the pavement at the end of the analysis period depends on the extent to which it can be utilized in any future upgrading. For example, where the predicted condition of the pavement at the end of the analysis period is such tat the base layer could serve as the subbase layer for the subsequent project, then the salvage value would be equal to the cost in current value terms for construction in future to subbase level discounted to the evaluation year. 3.2.3 Life-cycle cost analysis The ToR require an evaluation to be carried out of the cost-effectiveness of the DCP-DN pavement design method with a view to assess the benefits/cost savings accruing to Road Authorities, in terms of both the upfront cost savings and life-cycle costs, as a result of adopting the method in comparison with the more traditional, CBR-based design methods. Whereas the former requirement is possible due to the availability of reliable construction costs data, the latter requirement would only be possible if all the 10 roads/trial sections being evaluated were:
• founded on a similar strength subgrade
• located in the same road environment with replication of the trials in a variety of road environments.
• properly constructed and adequately maintained over their design life
• monitored at least at the end of their design life in terms of the total traffic carried since construction (in MESAs), roughness cracking, rutting, etc. so as to be able to determine relative benefits due to savings in user costs over the analysis period and their relative salvage values.
In fact, most of the road sections being evaluated are either not yet constructed or, those that have,
are less than 6 years old. Thus, there is no performance history of these road sections that can be used
in a typical LCC analysis as described above. As a result, the cost evaluation boils down essentially to a
comparison of initial construction costs rather than overall life-cycle costs with the former being
related to the type of pavement structure (layer strength/quality and thickness) dictated by the design
method adopted.
Evaluation of Cost-Effectiveness and Value-for-Money of DCP-DN Design Method
Page 27
3.2.4 Hypothetical life-cycle cost evaluation
Notwithstanding the above, it should be noted that the structural capacities (based on DSN800) of the
pavement structures produced by the four design methods are broadly similar with the structural
capacity of the DCP-DN method being very similar to all of the other design catalogues up to about 0.1
MESA, after which it becomes slightly more conservative (Paige-Green and van Zyl, 2018). This being
the case, it would seem not unreasonable to assume that:
• the pavement structures would be expected to deteriorate in a broadly similar manner under
a given traffic loading and road environment.
• the cost of the periodic maintenance interventions for the roads/trial sections would be
broadly similar and, when discounted to the base year, would be relatively small in comparison
with the construction costs (the non-traffic related routine maintenance costs are assumed to
be the same for all the roads/trial sections).
• the roughness generated by a relatively small number of commercial vehicles on the
roads/trial sections, and hence the related VOCs, would be broadly similar and, when
discounted to the base year, the difference in VOC savings would be relatively small in
comparison with the construction costs. Most roughness variations on new LVRs are built-in
during construction and are not traffic related.
Based on the above assumptions, the outcome of the cost comparison, based on initial construction
cost, would seem likely to be reflected in the outcome of a more traditional LCC analysis based on
actual performance history data, had such data been available for inclusion in the analysis.
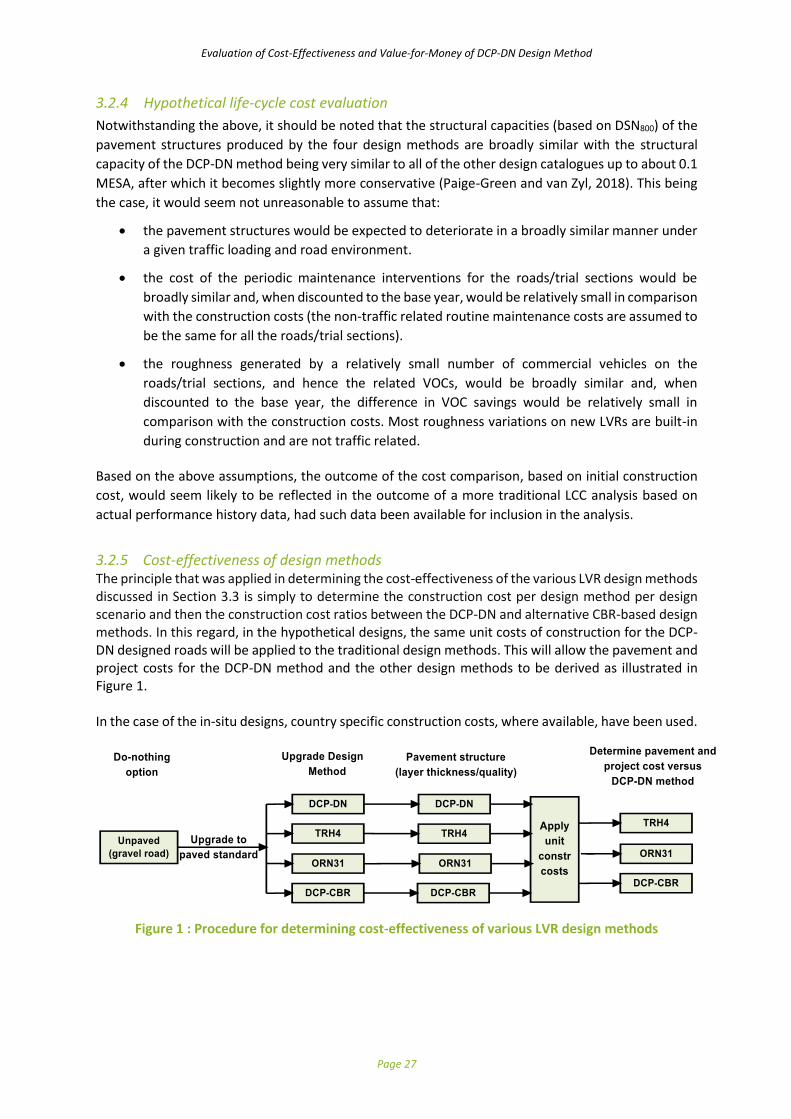
3.2.5 Cost-effectiveness of design methods The principle that was applied in determining the cost-effectiveness of the various LVR design methods discussed in Section 3.3 is simply to determine the construction cost per design method per design scenario and then the construction cost ratios between the DCP-DN and alternative CBR-based design methods. In this regard, in the hypothetical designs, the same unit costs of construction for the DCP-DN designed roads will be applied to the traditional design methods. This will allow the pavement and project costs for the DCP-DN method and the other design methods to be derived as illustrated in Figure 1. In the case of the in-situ designs, country specific construction costs, where available, have been used.
Figure 1 : Procedure for determining cost-effectiveness of various LVR design methods

Evaluation of Cost-Effectiveness and Value-for-Money of DCP-DN Design Method
Page 28
3.3 Hypothetical Designs 3.3.1 General The flow chart for undertaking the hypothetical cost evaluation of the pavement structures derived from the various design methods is illustrated in Figure 2.
Figure 2: LCC evaluation procedure
3.3.2 Design matrix
The design matrix variables for the hypothetical evaluation incorporates the following variables:
• Traffic (MESA) o Low: < 0.1 o Medium: 0.1 – 0.3 o High: 0.3 – 1.0
• In-situ subgrade (quality of the existing gravel road upper layers (300 mm) in three quality ranges defined as follows):
o Very Good: CBR 25/30 o Good: Soaked CBR = 16 - 24 o Fair: Soaked CBR = 8 - 15 o Poor: Soaked CBR = 3 - 7
• Climatic zone o Dry – moderate: TRH4: N > 2; DCP-CBR: N > 4) o Wet: TRH4: N < 2; DCP-CBR: N < 4
• Material Quality (as specified in the structural catalogues of the different design methods).
o CBR 15, CBR 25, CBR 25/30, CBR 45, CBR 55, CBR 65, CBR 80.
Evaluation of Cost-Effectiveness and Value-for-Money of DCP-DN Design Method
Page 29
• Borrow pit haulage
o Zero haulage o 1 – 10 km o 10 – 30 km o 30 – 100 km
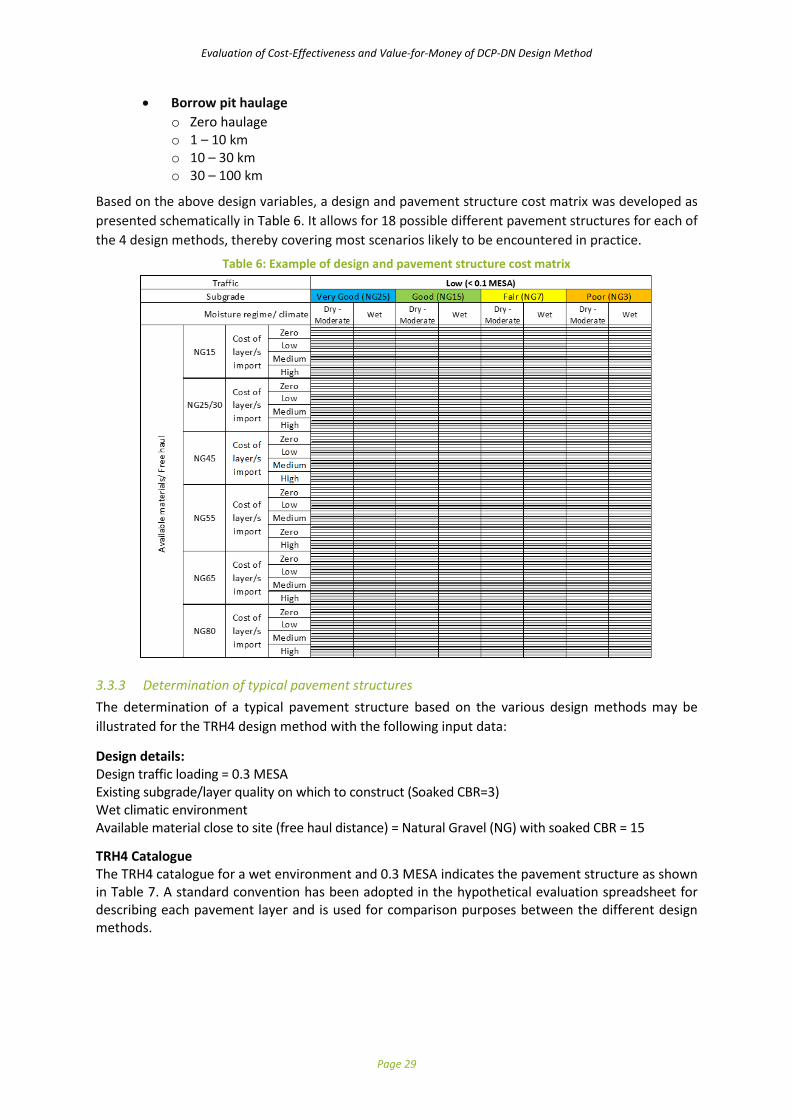
Based on the above design variables, a design and pavement structure cost matrix was developed as
presented schematically in Table 6. It allows for 18 possible different pavement structures for each of
the 4 design methods, thereby covering most scenarios likely to be encountered in practice.
Table 6: Example of design and pavement structure cost matrix
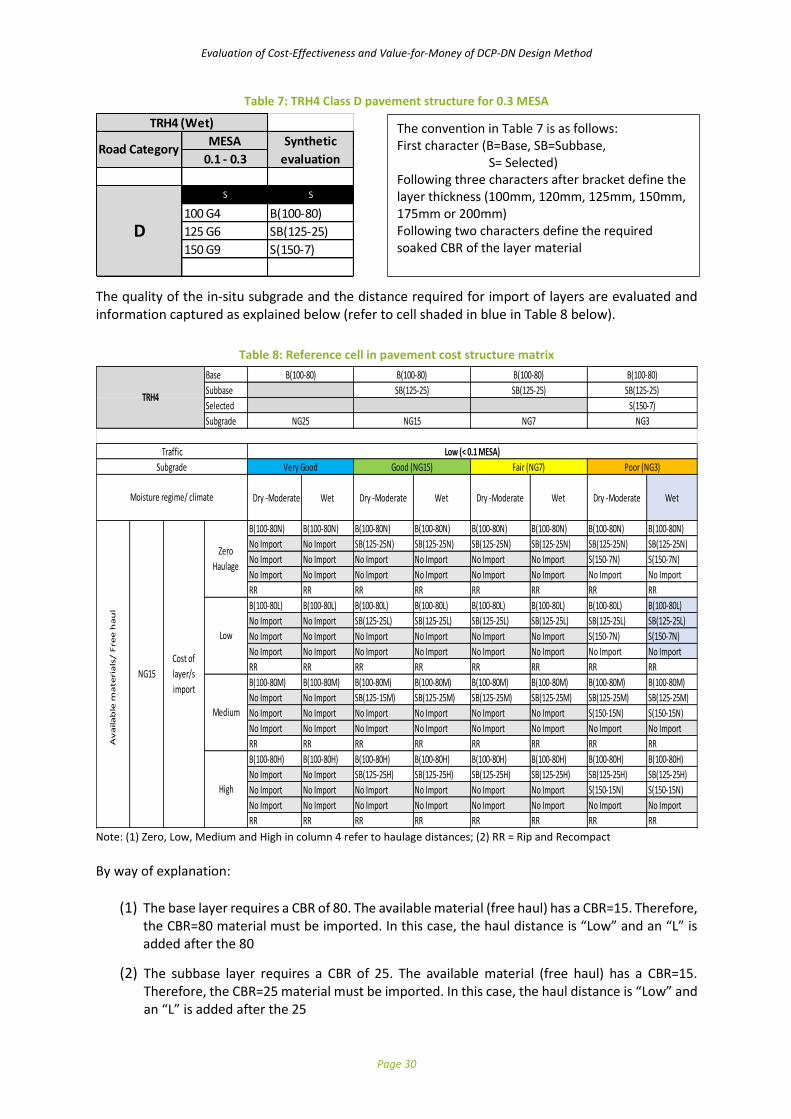
3.3.3 Determination of typical pavement structures
The determination of a typical pavement structure based on the various design methods may be
illustrated for the TRH4 design method with the following input data:
Design details: Design traffic loading = 0.3 MESA Existing subgrade/layer quality on which to construct (Soaked CBR=3) Wet climatic environment Available material close to site (free haul distance) = Natural Gravel (NG) with soaked CBR = 15
TRH4 Catalogue The TRH4 catalogue for a wet environment and 0.3 MESA indicates the pavement structure as shown in Table 7. A standard convention has been adopted in the hypothetical evaluation spreadsheet for describing each pavement layer and is used for comparison purposes between the different design methods.
Evaluation of Cost-Effectiveness and Value-for-Money of DCP-DN Design Method
Page 30
Table 7: TRH4 Class D pavement structure for 0.3 MESA
The quality of the in-situ subgrade and the distance required for import of layers are evaluated and information captured as explained below (refer to cell shaded in blue in Table 8 below).
Table 8: Reference cell in pavement cost structure matrix
Note: (1) Zero, Low, Medium and High in column 4 refer to haulage distances; (2) RR = Rip and Recompact
By way of explanation:
(1) The base layer requires a CBR of 80. The available material (free haul) has a CBR=15. Therefore, the CBR=80 material must be imported. In this case, the haul distance is “Low” and an “L” is added after the 80
(2) The subbase layer requires a CBR of 25. The available material (free haul) has a CBR=15. Therefore, the CBR=25 material must be imported. In this case, the haul distance is “Low” and an “L” is added after the 25
MESA
0.1 - 0.3
S S
100 G4 B(100-80)
125 G6 SB(125-25)
150 G9 S(150-7)
TRH4 (Wet)
Road CategorySynthetic
evaluation
D
Base
Subbase
Selected
Subgrade
Dry -Moderate Wet Dry -Moderate Wet Dry -Moderate Wet Dry -Moderate Wet
B(100-80N) B(100-80N) B(100-80N) B(100-80N) B(100-80N) B(100-80N) B(100-80N) B(100-80N)
No Import No Import SB(125-25N) SB(125-25N) SB(125-25N) SB(125-25N) SB(125-25N) SB(125-25N)
No Import No Import No Import No Import No Import No Import S(150-7N) S(150-7N)
No Import No Import No Import No Import No Import No Import No Import No Import
RR RR RR RR RR RR RR RR
B(100-80L) B(100-80L) B(100-80L) B(100-80L) B(100-80L) B(100-80L) B(100-80L) B(100-80L)
No Import No Import SB(125-25L) SB(125-25L) SB(125-25L) SB(125-25L) SB(125-25L) SB(125-25L)
No Import No Import No Import No Import No Import No Import S(150-7N) S(150-7N)
No Import No Import No Import No Import No Import No Import No Import No Import
RR RR RR RR RR RR RR RR
B(100-80M) B(100-80M) B(100-80M) B(100-80M) B(100-80M) B(100-80M) B(100-80M) B(100-80M)
No Import No Import SB(125-15M) SB(125-25M) SB(125-25M) SB(125-25M) SB(125-25M) SB(125-25M)
No Import No Import No Import No Import No Import No Import S(150-15N) S(150-15N)
No Import No Import No Import No Import No Import No Import No Import No Import
RR RR RR RR RR RR RR RR
B(100-80H) B(100-80H) B(100-80H) B(100-80H) B(100-80H) B(100-80H) B(100-80H) B(100-80H)
No Import No Import SB(125-25H) SB(125-25H) SB(125-25H) SB(125-25H) SB(125-25H) SB(125-25H)
No Import No Import No Import No Import No Import No Import S(150-15N) S(150-15N)
No Import No Import No Import No Import No Import No Import No Import No Import
RR RR RR RR RR RR RR RR
Zero
Haulage
Cost of
layer/s
import
NG15
Av
aila
ble
ma
teri
als
/ F
ree
ha
ul
S(150-7)
SB(125-25) SB(125-25) SB(125-25)
B(100-80) B(100-80) B(100-80)
Good (NG15) Fair (NG7) Poor (NG3)Subgrade
Low
Medium
High
NG15
Traffic
Moisture regime/ climate
TRH4
Very Good
NG25
B(100-80)
Low (< 0.1 MESA)
NG7 NG3
The convention in Table 7 is as follows: First character (B=Base, SB=Subbase, S= Selected) Following three characters after bracket define the layer thickness (100mm, 120mm, 125mm, 150mm, 175mm or 200mm) Following two characters define the required soaked CBR of the layer material

Evaluation of Cost-Effectiveness and Value-for-Money of DCP-DN Design Method
Page 31
(3) Note: It is acknowledged that the haul distances of the CBR=80 and CBR=25 material could be different. Although the spreadsheet allows the user to enter any distance notation, each variation results in doubling the number of situations for comparison
(4) The in-situ material has a CBR = 3 and requires importation of a material for the selected layer with CBR=15. The only available material (free haul) has a CBR = 15. Therefore, the CBR=15 material must be imported, but without haulage costs. In this case, the additional haul distance is “None” and an “N” is added after the 15
(5) No capping layer or earth works required. Therefore “No import” of an additional layer/s is required.
Pavement structures for the other design methods were also derived, based on the specific requirements of each of these methods.
3.3.4 Pavement construction costs
Utilising the unit construction costs presented in Table 4 above, the total cost of each possible pavement layer for all design methods may be calculated as illustrated in Table 9.
Table 9: Pavement layer costs (USD/m3)
3.3.5 Determination of pavement structure costs
Using a “Look-up” function, the cost of each layer in the pavement structure, as determined from Table 9, may be obtained and the total cost of each pavement structure, per design method, can be calculated as shown in Table 10 in terms of the total costs per layer (USD/m3) based on the material unit construction costs.
12.00
1km free 1-10km 10-30km 30-100km
Ex
BB/Crusher0 0.4167 0.3333 0.2917
per m3 0 5 20 65 Base Subbase Sel/Fill Rip&Comp
B(100-55H) 3.07 0.1 1.79 0.00 0.00 0.00 18.96 9.91 0.00 0.00 0.00
B(100-55L) 1.59 0.1 1.79 2.08 0.00 2.08 0.00 0.00 9.91 0.00 0.00 0.00
B(100-55M) 2.04 0.1 1.79 2.08 0.00 0.00 6.67 0.00 9.91 0.00 0.00 0.00
B(100-55N) 1.38 0.1 1.79 2.08 0.00 0.00 0.00 0.00 9.91 0.00 0.00 0.00
B(100-65H) 3.34 0.1 1.90 2.08 0.00 0.00 0.00 18.96 10.45 0.00 0.00 0.00
B(100-65L) 1.65 0.1 1.90 2.08 0.00 2.08 0.00 0.00 10.45 0.00 0.00 0.00
B(100-65M) 2.11 0.1 1.90 2.08 0.00 0.00 6.67 0.00 10.45 0.00 0.00 0.00
B(100-65N) 1.44 0.1 1.90 2.08 0.00 0.00 0.00 0.00 10.45 0.00 0.00 0.00
B(100-80H) 3.44 0.1 2.08 2.08 0.00 0.00 0.00 18.96 11.25 0.00 0.00 0.00
B(100-80L) 1.75 0.1 2.08 2.08 0.00 2.08 0.00 0.00 11.25 0.00 0.00 0.00
B(100-80M) 2.21 0.1 2.08 2.08 0.00 0.00 6.67 0.00 11.25 0.00 0.00 0.00
B(100-80N) 1.54 0.1 2.08 2.08 0.00 0.00 0.00 0.00 11.25 0.00 0.00 0.00
B(120-45H) 3.69 0.12 1.67 2.08 0.00 0.00 0.00 18.96 8.02 0.00 0.00 0.00
B(120-45L) 1.66 0.12 1.67 2.08 0.00 2.08 0.00 0.00 8.02 0.00 0.00 0.00
B(120-45M) 2.21 0.12 1.67 2.08 0.00 0.00 6.67 0.00 8.02 0.00 0.00 0.00
B(120-45N) 1.41 0.12 1.67 2.08 0.00 0.00 0.00 0.00 8.02 0.00 0.00 0.00
B(120-55H) 3.76 0.12 1.79 2.08 0.00 0.00 0.00 18.96 8.48 0.00 0.00 0.00
B(120-55L) 1.73 0.12 1.79 2.08 0.00 2.08 0.00 0.00 8.48 0.00 0.00 0.00
Haul (m3km) per distance category
LayerTotal cost/
m2
Layer
Thickness
(m)
Load &
1km
freehaul
Construction (Plant & Labour)/m3
Exch. rate Rand -USD
Ba
se
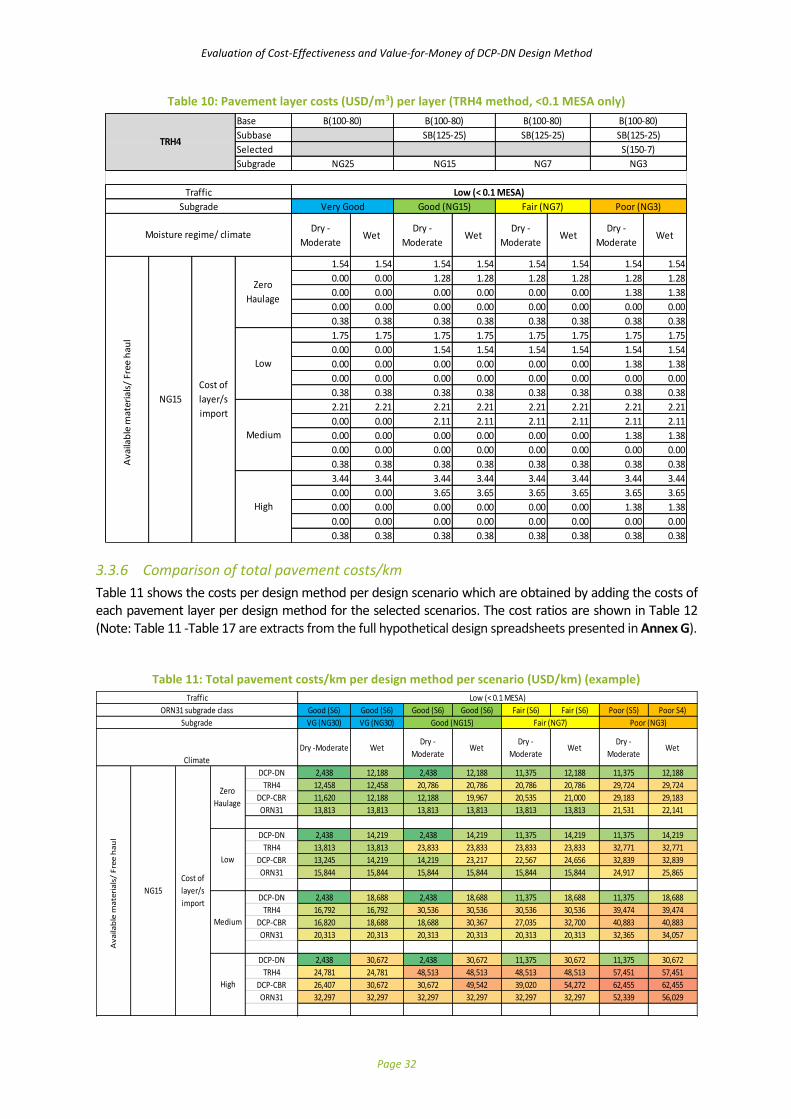
Evaluation of Cost-Effectiveness and Value-for-Money of DCP-DN Design Method
Page 32
Table 10: Pavement layer costs (USD/m3) per layer (TRH4 method, <0.1 MESA only)
3.3.6 Comparison of total pavement costs/km
Table 11 shows the costs per design method per design scenario which are obtained by adding the costs of each pavement layer per design method for the selected scenarios. The cost ratios are shown in Table 12 (Note: Table 11 -Table 17 are extracts from the full hypothetical design spreadsheets presented in Annex G).
Table 11: Total pavement costs/km per design method per scenario (USD/km) (example)
Base
Subbase
Selected
Subgrade
Dry -
ModerateWet
Dry -
ModerateWet
Dry -
ModerateWet
Dry -
ModerateWet
1.54 1.54 1.54 1.54 1.54 1.54 1.54 1.54
0.00 0.00 1.28 1.28 1.28 1.28 1.28 1.28
0.00 0.00 0.00 0.00 0.00 0.00 1.38 1.38
0.00 0.00 0.00 0.00 0.00 0.00 0.00 0.00
0.38 0.38 0.38 0.38 0.38 0.38 0.38 0.38
1.75 1.75 1.75 1.75 1.75 1.75 1.75 1.75
0.00 0.00 1.54 1.54 1.54 1.54 1.54 1.54
0.00 0.00 0.00 0.00 0.00 0.00 1.38 1.38
0.00 0.00 0.00 0.00 0.00 0.00 0.00 0.00
0.38 0.38 0.38 0.38 0.38 0.38 0.38 0.38
2.21 2.21 2.21 2.21 2.21 2.21 2.21 2.21
0.00 0.00 2.11 2.11 2.11 2.11 2.11 2.11
0.00 0.00 0.00 0.00 0.00 0.00 1.38 1.38
0.00 0.00 0.00 0.00 0.00 0.00 0.00 0.00
0.38 0.38 0.38 0.38 0.38 0.38 0.38 0.38
3.44 3.44 3.44 3.44 3.44 3.44 3.44 3.44
0.00 0.00 3.65 3.65 3.65 3.65 3.65 3.65
0.00 0.00 0.00 0.00 0.00 0.00 1.38 1.38
0.00 0.00 0.00 0.00 0.00 0.00 0.00 0.00
0.38 0.38 0.38 0.38 0.38 0.38 0.38 0.38
Ava
ilab
le m
ater
ials
/ Fr
ee h
aul
NG15
Cost of
layer/s
import
Zero
Haulage
Low
Medium
High
Traffic Low (< 0.1 MESA)
Subgrade Very Good Good (NG15) Fair (NG7) Poor (NG3)
Moisture regime/ climate
TRH4
B(100-80) B(100-80) B(100-80) B(100-80)
SB(125-25) SB(125-25) SB(125-25)
S(150-7)
NG25 NG15 NG7 NG3
Good (S6) Good (S6) Good (S6) Good (S6) Fair (S6) Fair (S6) Poor (S5) Poor S4)
VG (NG30) VG (NG30)
Dry -Moderate WetDry -
ModerateWet
Dry -
ModerateWet
Dry -
ModerateWet
DCP-DN 2,438 12,188 2,438 12,188 11,375 12,188 11,375 12,188
TRH4 12,458 12,458 20,786 20,786 20,786 20,786 29,724 29,724
DCP-CBR 11,620 12,188 12,188 19,967 20,535 21,000 29,183 29,183
ORN31 13,813 13,813 13,813 13,813 13,813 13,813 21,531 22,141
DCP-DN 2,438 14,219 2,438 14,219 11,375 14,219 11,375 14,219
TRH4 13,813 13,813 23,833 23,833 23,833 23,833 32,771 32,771
DCP-CBR 13,245 14,219 14,219 23,217 22,567 24,656 32,839 32,839
ORN31 15,844 15,844 15,844 15,844 15,844 15,844 24,917 25,865
DCP-DN 2,438 18,688 2,438 18,688 11,375 18,688 11,375 18,688
TRH4 16,792 16,792 30,536 30,536 30,536 30,536 39,474 39,474
DCP-CBR 16,820 18,688 18,688 30,367 27,035 32,700 40,883 40,883
ORN31 20,313 20,313 20,313 20,313 20,313 20,313 32,365 34,057
DCP-DN 2,438 30,672 2,438 30,672 11,375 30,672 11,375 30,672
TRH4 24,781 24,781 48,513 48,513 48,513 48,513 57,451 57,451
DCP-CBR 26,407 30,672 30,672 49,542 39,020 54,272 62,455 62,455
ORN31 32,297 32,297 32,297 32,297 32,297 32,297 52,339 56,029
Av
aila
ble
ma
teri
als
/ F
ree
ha
ul
NG15
Cost of
layer/s
import
Zero
Haulage
Climate
Low
Poor (NG3)
Medium
High
Traffic Low (< 0.1 MESA)
ORN31 subgrade class
Subgrade Good (NG15) Fair (NG7)
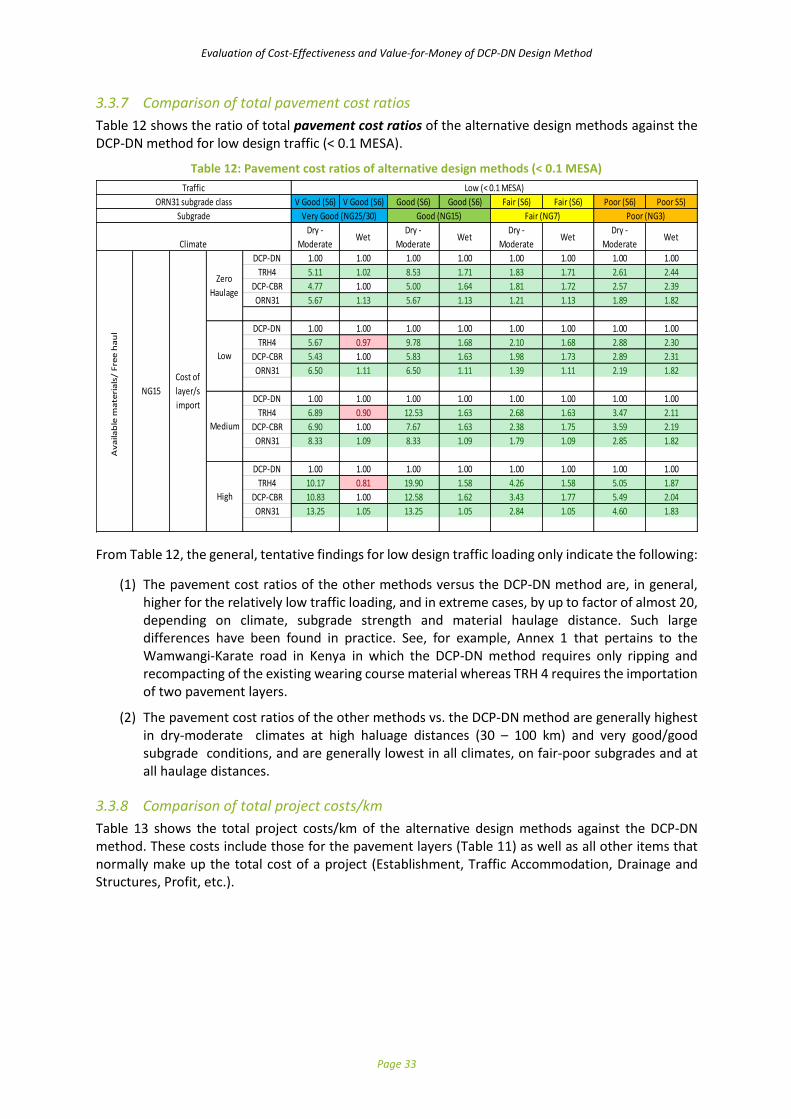
Evaluation of Cost-Effectiveness and Value-for-Money of DCP-DN Design Method
Page 33
3.3.7 Comparison of total pavement cost ratios
Table 12 shows the ratio of total pavement cost ratios of the alternative design methods against the DCP-DN method for low design traffic (< 0.1 MESA).
Table 12: Pavement cost ratios of alternative design methods (< 0.1 MESA)
From Table 12, the general, tentative findings for low design traffic loading only indicate the following:
(1) The pavement cost ratios of the other methods versus the DCP-DN method are, in general, higher for the relatively low traffic loading, and in extreme cases, by up to factor of almost 20, depending on climate, subgrade strength and material haulage distance. Such large differences have been found in practice. See, for example, Annex 1 that pertains to the Wamwangi-Karate road in Kenya in which the DCP-DN method requires only ripping and recompacting of the existing wearing course material whereas TRH 4 requires the importation of two pavement layers.
(2) The pavement cost ratios of the other methods vs. the DCP-DN method are generally highest in dry-moderate climates at high haluage distances (30 – 100 km) and very good/good subgrade conditions, and are generally lowest in all climates, on fair-poor subgrades and at all haulage distances.
3.3.8 Comparison of total project costs/km
Table 13 shows the total project costs/km of the alternative design methods against the DCP-DN method. These costs include those for the pavement layers (Table 11) as well as all other items that normally make up the total cost of a project (Establishment, Traffic Accommodation, Drainage and Structures, Profit, etc.).
V Good (S6) V Good (S6) Good (S6) Good (S6) Fair (S6) Fair (S6) Poor (S6) Poor S5)
Dry -
ModerateWet
Dry -
ModerateWet
Dry -
ModerateWet
Dry -
ModerateWet
DCP-DN 1.00 1.00 1.00 1.00 1.00 1.00 1.00 1.00
TRH4 5.11 1.02 8.53 1.71 1.83 1.71 2.61 2.44
DCP-CBR 4.77 1.00 5.00 1.64 1.81 1.72 2.57 2.39
ORN31 5.67 1.13 5.67 1.13 1.21 1.13 1.89 1.82
DCP-DN 1.00 1.00 1.00 1.00 1.00 1.00 1.00 1.00
TRH4 5.67 0.97 9.78 1.68 2.10 1.68 2.88 2.30
DCP-CBR 5.43 1.00 5.83 1.63 1.98 1.73 2.89 2.31
ORN31 6.50 1.11 6.50 1.11 1.39 1.11 2.19 1.82
DCP-DN 1.00 1.00 1.00 1.00 1.00 1.00 1.00 1.00
TRH4 6.89 0.90 12.53 1.63 2.68 1.63 3.47 2.11
DCP-CBR 6.90 1.00 7.67 1.63 2.38 1.75 3.59 2.19
ORN31 8.33 1.09 8.33 1.09 1.79 1.09 2.85 1.82
DCP-DN 1.00 1.00 1.00 1.00 1.00 1.00 1.00 1.00
TRH4 10.17 0.81 19.90 1.58 4.26 1.58 5.05 1.87
DCP-CBR 10.83 1.00 12.58 1.62 3.43 1.77 5.49 2.04
ORN31 13.25 1.05 13.25 1.05 2.84 1.05 4.60 1.83
Av
aila
ble
ma
teri
als
/ F
ree
ha
ul
Zero
Haulage
Good (NG15)
Low
Medium
High
Climate
Fair (NG7) Poor (NG3)Very Good (NG25/30)
NG15
Cost of
layer/s
import
Traffic
ORN31 subgrade class
Subgrade
Low (< 0.1 MESA)
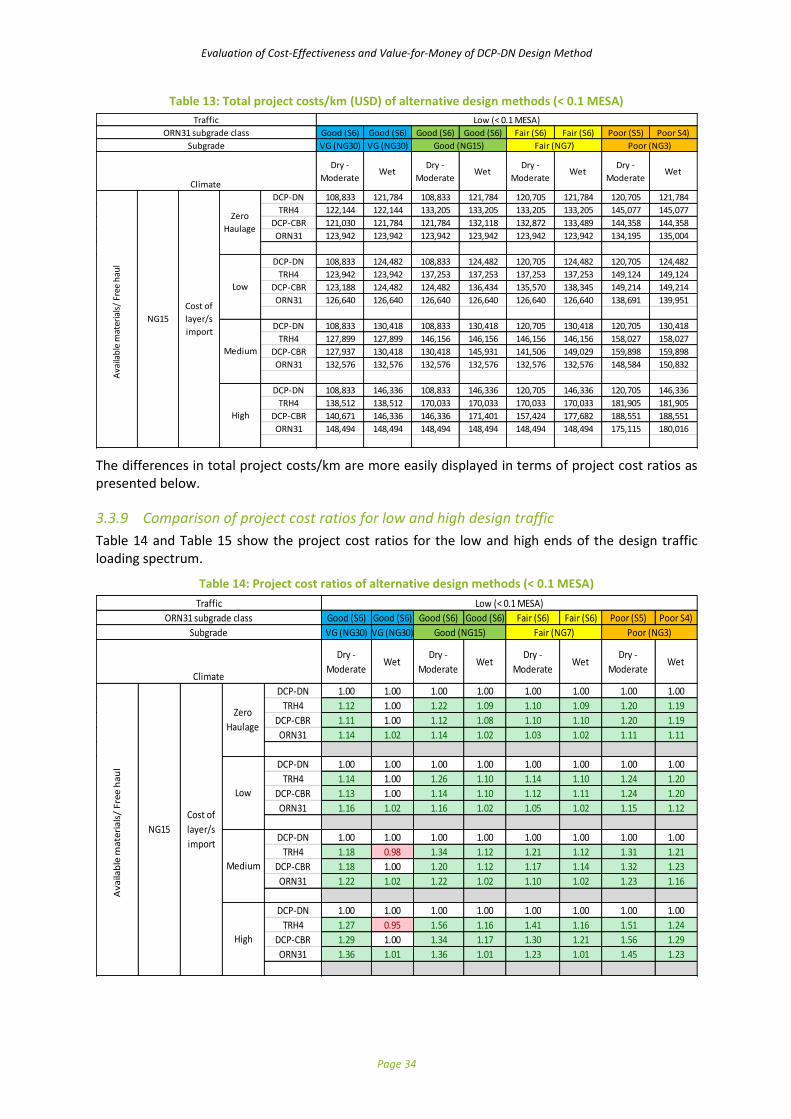
Evaluation of Cost-Effectiveness and Value-for-Money of DCP-DN Design Method
Page 34
Table 13: Total project costs/km (USD) of alternative design methods (< 0.1 MESA)
The differences in total project costs/km are more easily displayed in terms of project cost ratios as presented below.
3.3.9 Comparison of project cost ratios for low and high design traffic
Table 14 and Table 15 show the project cost ratios for the low and high ends of the design traffic loading spectrum.
Table 14: Project cost ratios of alternative design methods (< 0.1 MESA)
Good (S6) Good (S6) Good (S6) Good (S6) Fair (S6) Fair (S6) Poor (S5) Poor S4)
VG (NG30) VG (NG30)
Dry -
ModerateWet
Dry -
ModerateWet
Dry -
ModerateWet
Dry -
ModerateWet
DCP-DN 108,833 121,784 108,833 121,784 120,705 121,784 120,705 121,784
TRH4 122,144 122,144 133,205 133,205 133,205 133,205 145,077 145,077
DCP-CBR 121,030 121,784 121,784 132,118 132,872 133,489 144,358 144,358
ORN31 123,942 123,942 123,942 123,942 123,942 123,942 134,195 135,004
DCP-DN 108,833 124,482 108,833 124,482 120,705 124,482 120,705 124,482
TRH4 123,942 123,942 137,253 137,253 137,253 137,253 149,124 149,124
DCP-CBR 123,188 124,482 124,482 136,434 135,570 138,345 149,214 149,214
ORN31 126,640 126,640 126,640 126,640 126,640 126,640 138,691 139,951
DCP-DN 108,833 130,418 108,833 130,418 120,705 130,418 120,705 130,418
TRH4 127,899 127,899 146,156 146,156 146,156 146,156 158,027 158,027
DCP-CBR 127,937 130,418 130,418 145,931 141,506 149,029 159,898 159,898
ORN31 132,576 132,576 132,576 132,576 132,576 132,576 148,584 150,832
DCP-DN 108,833 146,336 108,833 146,336 120,705 146,336 120,705 146,336
TRH4 138,512 138,512 170,033 170,033 170,033 170,033 181,905 181,905
DCP-CBR 140,671 146,336 146,336 171,401 157,424 177,682 188,551 188,551
ORN31 148,494 148,494 148,494 148,494 148,494 148,494 175,115 180,016
Ava
ilab
le m
ater
ials
/ Fr
ee h
aul
NG15
Cost of
layer/s
import
Zero
Haulage
Climate
Low
Medium
High
Traffic Low (< 0.1 MESA)
ORN31 subgrade class
Subgrade Good (NG15) Fair (NG7) Poor (NG3)
Good (S6) Good (S6) Good (S6) Good (S6) Fair (S6) Fair (S6) Poor (S5) Poor S4)
VG (NG30) VG (NG30)
Dry -
ModerateWet
Dry -
ModerateWet
Dry -
ModerateWet
Dry -
ModerateWet
DCP-DN 1.00 1.00 1.00 1.00 1.00 1.00 1.00 1.00
TRH4 1.12 1.00 1.22 1.09 1.10 1.09 1.20 1.19
DCP-CBR 1.11 1.00 1.12 1.08 1.10 1.10 1.20 1.19
ORN31 1.14 1.02 1.14 1.02 1.03 1.02 1.11 1.11
DCP-DN 1.00 1.00 1.00 1.00 1.00 1.00 1.00 1.00
TRH4 1.14 1.00 1.26 1.10 1.14 1.10 1.24 1.20
DCP-CBR 1.13 1.00 1.14 1.10 1.12 1.11 1.24 1.20
ORN31 1.16 1.02 1.16 1.02 1.05 1.02 1.15 1.12
DCP-DN 1.00 1.00 1.00 1.00 1.00 1.00 1.00 1.00
TRH4 1.18 0.98 1.34 1.12 1.21 1.12 1.31 1.21
DCP-CBR 1.18 1.00 1.20 1.12 1.17 1.14 1.32 1.23
ORN31 1.22 1.02 1.22 1.02 1.10 1.02 1.23 1.16
DCP-DN 1.00 1.00 1.00 1.00 1.00 1.00 1.00 1.00
TRH4 1.27 0.95 1.56 1.16 1.41 1.16 1.51 1.24
DCP-CBR 1.29 1.00 1.34 1.17 1.30 1.21 1.56 1.29
ORN31 1.36 1.01 1.36 1.01 1.23 1.01 1.45 1.23
NG15
Av
aila
ble
ma
teri
als
/ F
ree
ha
ul
Cost of
layer/s
import
Zero
Haulage
ORN31 subgrade class
Subgrade Good (NG15) Fair (NG7) Poor (NG3)
Traffic Low (< 0.1 MESA)
Climate
Low
Medium
High

Evaluation of Cost-Effectiveness and Value-for-Money of DCP-DN Design Method
Page 35
Table 15: Project costs ratios of alternative design methods (0.3 – 1.0 MESA)
From Table 14 and Table 15, general, tentative findings for low and high traffic loading scenarios can
be drawn, as follows:
(1) In low design traffic situations (Table 14), the project costs of the DCP-DN method are generally lower than the other methods, by 14% to 56% in dry-moderate climates at high haulage situations (30 – 100 km) and poor subgrade conditions.
(2) In high design traffic situations (Table 15), the project costs of the DCP-DN method are generlly higher than the other design methods in wet climates across all haulage and subgrade conditions. In contrast, in dry-moderate climates and across all haulage and subgrade conditions, the other design methods generally exhibit higer project cost ratios.
3.3.10 Comparison of project cost savings/km for low and high design traffic
Table 16 and Table 17 show the project cost savings/km, which are generarlly of most interest to clients, for the low and high ends of the design traffic loading spectrum.
Table 16: Project cost savings/km (< 0.1 MESA)
Good (S6) Good (S6) Good (S6) Good (S6) Fair (S6) Fair (S6) Poor (S5) Poor S4)
VG (NG30) VG (NG30)
Dry -
ModerateWet
Dry -
ModerateWet
Dry -
ModerateWet
Dry -
ModerateWet
DCP-DN 0 0 0 0 0 0 0 0
TRH4 13,310 360 24,372 11,422 12,501 11,422 24,372 23,293
DCP-CBR 12,196 0 12,950 10,334 12,167 11,705 23,653 22,574
ORN31 15,109 2,158 15,109 2,158 3,238 2,158 13,490 13,220
DCP-DN 0 0 0 0 0 0 0 0
TRH4 15,109 -540 28,419 12,771 16,548 12,771 28,419 24,642
DCP-CBR 14,355 0 15,648 11,953 14,865 13,863 28,509 24,732
ORN31 17,807 2,158 17,807 2,158 5,936 2,158 17,987 15,469
DCP-DN 0 0 0 0 0 0 0 0
TRH4 19,066 -2,518 37,322 15,738 25,451 15,738 37,322 27,610
DCP-CBR 19,103 0 21,584 15,514 20,801 18,612 39,194 29,481
ORN31 23,742 2,158 23,742 2,158 11,871 2,158 27,879 20,415
DCP-DN 0 0 0 0 0 0 0 0
TRH4 29,678 -7,824 61,200 23,698 49,329 23,698 61,200 35,569
DCP-CBR 31,838 0 37,502 25,065 36,719 31,346 67,846 42,215
ORN31 39,661 2,158 39,661 2,158 27,789 2,158 54,410 33,680
Ava
ilab
le m
ate
ria
ls/
Fre
e h
au
l
NG15
Cost of
layer/s
import
Traffic Low (< 0.1 MESA)
ORN31 subgrade class
Subgrade Good (NG15) Fair (NG7) Poor (NG3)
Low
Medium
High
Climate
Zero
Haulage

Evaluation of Cost-Effectiveness and Value-for-Money of DCP-DN Design Method
Page 36
Table 17: Project cost savings/km (0.3 – 1.0 MESA)
From Table 16 and Table 17, general, tentative findings for low and high traffic loading scenarios can
be drawn, as follows:
(1) In low design traffic situations, the project costs/km of the DCP-DN method are, in general,
almost always lower, to varying extents, than the other design methods except in a few cases
in wet climates across all haulage situations.
(2) In high design traffic situations, the project costs/km of the DCP-DN method are generally only
lower than the other methods in dry-moderate climates across all haulage and subgrade
situtions.
The above examples illustrate the procedure adopted to develop the hypothetical designs and, in so doing, they allow a few snap-shot conclusions to be drawn based on a very limited number of design scenarios. For illustration purposes, a full example is provided (Annex G) of the process followed to determine initially the project costs per km when designed using the different methods, and then the pavement cost ratios, total project cost ratios and total project cost difference per km.
3.3.11 General comparative cost trends
The full range of some 2304 design scenarios that could be encountered in practice is presented in the spreadsheets included in Annex G in terms of the following:
1. Pavement cost 2. Pavement cost ratios (DCP-DN versus other design methods) 3. Project costs 4. Project cost ratios (DCP-DN versus other design methods) 5. Project cost savings per km (DCP-DN versus other design methods)
For these analyses a pavement width of 6.50 m has been used to establish trends in the data for different traffic load classes, moisture environments and subgrade classes. Hypothetical designs have been carried out, using four different design methods and costs calculated
for three different design traffic scenarios (0.1, 0.3 and 1.0 MISA), in moderate to dry and wet
environments, for four different subgrade conditions (In-situ subgrade CBRs of 3, 7, 15 and 25), for

Evaluation of Cost-Effectiveness and Value-for-Money of DCP-DN Design Method
Page 37
three different haul distances (low = 5km, medium = 20km and long = 65km) if only material of a
specific quality is available i.e. CBR of 15, 30, 45, 55, 65 and 80. A zero haulage scenario was added for
all combinations, assuming that all required materials are available within a free-haulage distance.
Graphical displays of the zero-haul distance costs (for all materials) and medium haul distance costs
(assuming all materials better than CBR=15 must be imported) are provided adjacent to each other
(see Figures 3 to 6) for the following situations namely:
• Pavement costs in the wet environment (Figure 3)
• Pavement costs in the moderate – dry environment (Figure 4)
• Project costs in the wet environment (Figure 5)
• Project costs in the moderate – dry environment (Figure 6)
Important notes on the zero-haulage scenario
As higher quality materials often have to be imported, provision was made to evaluate the cost of
material haulage at three distances i.e. Low (5km), Medium (20km) and Long (65km).
The inclusion of the zero-haulage cost scenario effectively means that all materials required for any
pavement structure are available within a free haulage distance (typically 1 km).
Cognizance should be taken that this scenario is considered unrealistic in most cases as suitable base
quality materials e.g. CBR =80 for ORN31 and TRH4, even for very low volume roads, are normally not
available close by. Moreover, for a LVR project of any significant length, say 10 km, it would be
necessary to open 5 borrow pits immediately adjacent to the road at regular intervals, say at km 2, 4,
6, 8 and 10, in order not to exceed the free haul distance. This is practically unrealistic and would be
environmentally unacceptable.
Furthermore, it should be noted that if provision is not made in a tender for haulage of different
quality materials, the contractor will incorporate the haulage costs in the tendered unit cost. This
means that the costs (Ex borrow pit or crusher) as obtained from contractors and incorporated in the
hypothetical designs are actually not valid for the zero-haulage scenario.

Evaluation of Cost-Effectiveness and Value-for-Money of DCP-DN Design Method
Page 38
Figure 3: Pavement costs (Wet environment) – Zero versus Medium haul distance
In terms of pavement costs in the wet environment, DCP-DN is generally the most cost-effective for
design traffic less than 1 MESA, on all but the strongest subgrades (CBR 25%), and regardless of the
hauling distance. However, the relative difference in pavement costs between the DCP-DN and other
design methods, is less with the zero-haulage scenario. For the 1 MESA scenario, ORN31 is generally
the most cost-effective on all but the strongest (CBR 25%) subgrades for which TRH4 is the most cost-
effective.

Evaluation of Cost-Effectiveness and Value-for-Money of DCP-DN Design Method
Page 39
Figure 4: Pavement costs (Mod-Dry environment) – Zero versus Medium haul distance
In terms of pavement costs in the moderate to dry environment and medium haul distance, DCP-DN
is generally the most cost-effective for all design traffic classes up to 1 MESA. For the zero-haul
distance, DCP-DN is generally the most cost-effective for design traffic classes less than 1 MESA.
However, the relative difference in pavement costs between the DCP-DN and other design methods,
is less with the zero-haulage scenario. For the zero-haul distance and 1 MESA design traffic ORN31 is
more cost-effective for fair to poor subgrades and DCP-DN more cost-effective for good quality
subgrades.

Evaluation of Cost-Effectiveness and Value-for-Money of DCP-DN Design Method
Page 40
Figure 5: Project costs (Wet environment) – Zero versus Medium haul distance
In terms of project costs in the wet environment, DCP-DN is generally the most cost-effective for
design traffic less than 1 MESA and on poor-fair subgrades, regardless of the hauling distance.
However, the relative difference in project costs between the DCP-DN and other design methods, is
less with the zero-haulage scenario. ORN31 is generally the most cost-effective for the 1 MESA
scenario, except for the strong subgrades (CBR 25%).

Evaluation of Cost-Effectiveness and Value-for-Money of DCP-DN Design Method
Page 41
Figure 6: Project costs (Moderate-Dry environment) - Zero versus Medium haul distance
In terms of project costs in the moderate to dry environment, DCP-DN is generally the most cost-
effective for design traffic less than 1 MESA, regardless of the hauling distance. However, the relative
difference in project costs between the DCP-DN and other design methods, is less with the zero-
haulage scenario. ORN31 is generally the most cost-effective for the 1 MESA scenario.

Evaluation of Cost-Effectiveness and Value-for-Money of DCP-DN Design Method
Page 42
3.4 In-Situ Designs 3.4.1 General The approach to the design of the road sections in the various countries differs between the four methods being considered. Thus, a typical design example is presented below to illustrate how the same input design data has been applied to all four design methods.
3.4.2 Design inputs The design details are for the Zambia Katonga-Waitwika Trial Section and are as follows:
• Traffic (MESA) o Low: < 0.1 (TLC0.1)
• In-situ subgrade
o In-situ moisture at time of survey (wet season): ▪ 0 – 150 mm = OMC ▪ 150 – 300 mm = 1.2 OMC ▪ 300 – 450 mm = 1.35 OMC
• Climatic zone o Wet (N < 2) (annual rainfall 1050 mm)
3.4.3 DCP-DN design method
Details of this design method are outlined in Section 2.3.4 above. As indicated therein, the strength of the pavement layers and subgrade are all assessed at the anticipated long-term equilibrium moisture content (EMC). The representative subgrade strength in a uniform section is based on the 80th, 50th or 20th percentile value of the range of DCP measurements along that section of the road being upgraded depending on whether the EMC is likely, respectively, to be wetter, about the same or drier than at the time of the DCP survey. In the design example, it is assumed that after upgrading of the road, provision of adequate drainage and surfacing from shoulder breakpoint to shoulder breakpoint, the relative moisture content in the top three layers of the existing road will equilibrate at or below OMC (Ref. Section 2.4.5 based on Emery, 1985 – Annex E).
• Design On the basis of the above assumption, the DN values for design were adjusted as follows:
o 0-150 mm DN(50P) = 16 (moisture in layer remaining at OMC)
o 150-300 mm DN (20P) = 26 (moisture in layer decreasing)
o 300-450 mm DN (20P) = 37 (moisture in layer decreasing)
• Material Quality The material quality requirements are specified in the DCP structural design catalogue for TLC 0.1 as follows:
o Base: DN ≤ 4 at long-term EMC o Subbase: DN ≤ 9 at long-term EMC o Subgrade: DN ≤ 19 at long-term EMC
• Pavement structure The pavement structure requirements for the upgraded road are presented in Figure 7.

Evaluation of Cost-Effectiveness and Value-for-Money of DCP-DN Design Method
Page 43
3.4.4 TRH4 design method Details of this design method are outlined in Section 2.3.6 above. As indicated therein, the strength of the pavement layers and subgrade materials are all assessed in their soaked condition, but the pavement structure requirements are less demanding in dry-moderate climates. The representative subgrade strength in a uniform section is based on the 90th percentile value of the range of CBR or, more likely, the 10th percentile DCP values obtained from a survey along the section of the road being upgraded.
• In-situ subgrade o 0-150 mm: Weighted Average DN = 16 at OMC. For input into the TRH4 design, this value
must be converted to an equivalent soaked CBR value using the 10th percentile DN value.
• Design
o Based on the Kleyn DCP-CBR correlation and the use of Table 2, DN = 16 at OMC converts to a soaked CBR value of < 3 (< NG3). This strength of subgrade requires the use of an overlying capping layer.
• Material Quality
The material quality requirements are specified in the TRH4 structural design catalogue for TLC 0.1 as follows:
o Base: soaked CBR ≥ 80 o Subbase: soaked CBR ≥ 25 o Capping layer: soaked CBR ≥ 7
• Pavement structure
The pavement structure requirements for the upgraded road are presented in Figure 7
3.4.5 ORN31 design method Details of this design method are outlined in Section 2.3.7 above. As indicated therein, the strength of the pavement layers and subgrade materials are all assessed in their soaked condition, and the pavement structure requirements are the same, regardless of climatic zone. However, the subgrade strength may be assessed in the soaked state (Category 1), at OMC (Category 2) or below OMC (Category 3), depending on the proximity of the water table to the subgrade and the annual rainfall ( > 250 mm for Category 2 subgrades and < 250 mm for Category 3 subgrades). The representative subgrade strength in a uniform section is based on the 90th percentile value of the range of CBR or, more likely, DCP measurements along that section of the road being upgraded.
• In-situ subgrade o Assumed to be Category 2, based on a low water table and annual rainfall of 1050 mm.
• Design
o On the basis of the above assumption, the DN values for design are converted to CBR values based on the TRL correlation between DCP and CBR. ▪ The DN(10P) = 20 at OMC corresponds to CBROMC = 14. ▪ Subgrade Class: S4
• Material Quality
The material quality requirements are specified in the ORN31 structural design catalogue for TLC 0.1 as follows:
o Base: soaked CBR ≥ 80 o Subbase: soaked CBR ≥ 25
• Pavement structure
The pavement structure requirements for the upgraded road are presented in Figure 7DCP-CBR design method

Evaluation of Cost-Effectiveness and Value-for-Money of DCP-DN Design Method
Page 44
Details of this design method are outlined in Section 2.3.5 above. As indicated therein, the strength of the pavement layers and subgrade materials are all assessed in their soaked condition. However, the pavement structure requirements are less demanding in dry-moderate climates. For TLC < 0.3 MESA, the representative subgrade strength in a uniform section is based on the mean value of the range of CBR or, more likely, DCP measurements obtained from a survey along the section of the road being upgraded.
• In-situ subgrade o 0-150 mm: DN = 16 at OMC. For input into the DCP-CBR design, this value must be
converted to an equivalent soaked CBR value. Based on the TRL DCP-CBR correlation
and the use of Table 2, DN = 16 at OMC converts to a soaked CBR value of < 3 (as per
ORN31). This strength of subgrade requires the use of an overlying capping layer.
• Design
o Based on the TRL DCP-CBR correlation and the use of Table 2, DN = 16 at OMC converts
to a soaked CBR value of <3. This strength of subgrade requires the use of an overlying
capping layer.
• Material Quality The material quality requirements are specified in the DCP-CBR structural design catalogue for TLC 0.3 MESA as follows:
o Base: soaked CBR ≥ 55 o Subbase: soaked CBR ≥ 30 o Capping layer: soaked CBR ≥ 15
• Pavement structure
The pavement structure requirements for the upgraded road are presented in Figure 7
3.4.6 Determination of pavement structure The pavement structures derived from the same input data applied to the four design methods described above are presented in Figure 7. These structures are based on the use of the same design input information that, in part, has been adjusted for the subgrade strength requirements (soaked/unsoaked) and representative percentile-related strength values, as required by the various methods. Similar pavement structures and related pavement costs have been derived for all road sections and are presented in Annex I.

Evaluation of Cost-Effectiveness and Value-for-Money of DCP-DN Design Method
Page 45
Figure 7: Comparison of pavement structures by design methods for TLC 0.1 & NG3
3.4.7 Determination of pavement structure costs
For illustrative purposes, Zambian cost data was applied to the pavement structures presented in Figure 7 as shown in Table 18.
Table 18: Pavement structure costs based on Zambian cost data
Site Avg. DN DCP-DN TRH4 ORN31 DCP-CBR
New base
New base 150 mm
100 mm
CBRsoaked=80
New base NG80 CBRsoaked=55
150 mm New subbase New base NG55
DN≤4 125 mm 150 mm New subbase
CBROMC≥70 120 mm
CBRsoaked≥45 CBRsoaked=25
NG45 NG25 CBRsoaked=80 CBRsoaked=30
New subbase Capping NG80 NG30
150 mm 150 mm New subbase Capping
DN≤9 125 mm 120 mm
CBROMC≥25
CBRsoaked≥3 CBRsoaked=7 CBRsoaked=30 CBRsoaked=15
NG3 NG7 NG30 NG15
150 mm
DN=16 DN<16 DN(90P)=20 DN(90P)=20 CBROMC=18
@RMC≈OMC CBROMC=9 CBROMC=14 CBRsoaked<3
CBROMC=12 CBRsoaked<3
CBRsoaked<3
SG4 Subgrade S4 Subgrade S1
Zambia: Kantongo - Waitwika TLC 0.1
32520 38796
5 20 65 5 20 65
5 36 517 39 978 51 630 5 42 793 46 254 57 906
20 39 978 43 440 55 091 20 46 254 49 716 61 367
65 51 630 55 091 66 742 65 57 906 61 367 73 018
42305 47949
5 20 65 5 20 65
5 47 302 49 610 57 377 5 53 145 56 607 68 258
20 53 648 55 955 63 723 20 58 683 62 145 73 796
65 75 008 77 316 85 083 65 77 325 80 787 92 438
ORN31
Base 150 mm NG55
Avg. haul km
Zero haulage
Base 150 mm NG80
Avg. haul km
Zero haulage
Base 150 mm NG25
Avg. haul km
USD/km
DCP-DN
Cost for 6.5 m wide pavement incl. 100 mm rip, shape and recompact of in situ wearing course
Subbase 150 mm
G10
120 mm NG15 +
Subbase
120 mm NG30
DCP-CBR
Zero haulage
TRH4
Zero haulage
Avg. haul km
150 mm NG7 +
Subbase
125 mm NG25
Subbase
150 mm NG30
Base 100 mm NG80

Evaluation of Cost-Effectiveness and Value-for-Money of DCP-DN Design Method
Page 46
3.4.8 Pavement cost ratios
Table 19 and Table 20 show the pavement cost ratios for the different design methods and TLCs. As mentioned above, Zambian cost data are used for the Zambia example. However, South African costs data were used for Ghana and Kenya due to the lack of disaggregated material costs for these countries. Table 19 shows the pavement cost ratios for three actual projects designed for TLC 0.1. The large differences in the cost ratios are mainly due to the assessment of the subgrade strength as prescribed for the different design methods. Whereas TRH4 and ORN31 prescribe the use of the 90th percentile of the subgrade strength within the section, DCP-DN and DCP-CBR require the use of the mean value. ORN31 also allows the subgrade strength to be assessed at OMC which results in the ORN31 design being almost on par with the DCP-DN design.
Table 19: In-situ pavement cost ratios
Table 20 shows the pavement costs ratios for the Ghana project for the TLC classes in the range 0.3 to 1.0 MESA. The results corroborate the overall trends from the hypothetical analysis discussed above with the cost ratios generally decreasing for increasing TLCs.
Table 20: In-situ pavement cost ratios for different TLCs
As shown in Figure 8: Pavement cost ratios 'R'/km per TLC and Figure 9, the pavement cost ratios vs. the DCP-DN method are highest for the lower (TLCs 0.1 - 0 0.3 MESA) and begin to gradually decrease up to about 0.7 MESA, after which other design methods, particularly ORN31, become more cost-effective.
Subgrade Subgrade Subgrade
Base
5 20 65 5 20 65 5 20 65
5 1,00 1,00 1,00 5 1,00 1,00 1,00 5 1,00 1,00 1,00
20 1,00 1,00 1,00 20 20
65 1,00 1,00 1,00 65 65
5 1,44 1,32 1,12 5 2,39 1,98 1,47 5 9,78 11,00 14,28
20 1,50 1,39 1,19 20 2,97 2,42 1,73 20 11,00 12,53 15,81
65 1,60 1,51 1,33 65 4,51 3,59 2,45 65 15,40 16,63 19,90
5 1,10 1,08 1,06 5 1,11 1,17 1,31 5 5,67 6,89 10,17
20 1,06 1,05 1,04 20 20
65 0,99 0,99 0,99 65 65
5 1,47 1,39 1,28 5 1,54 1,33 1,07 5 1,00 1,00 1,00
20 1,49 1,42 1,31 20 1,80 1,53 1,19 20
65 1,52 1,47 1,37 65 2,50 2,06 1,52 65
Sub
bas
e &
Cap
pin
g la
yer
BaseBase Average
haul (km)
Average
haul (km)
DCP-DN
TRH4
ORN31
DCP-CBR
Design
method
Climate
Wet
NG7 NG45
Ghana Kenya
Climate
Wet
Climate
Wet
Average
haul (km)
Sub
bas
e &
Cap
pin
g la
yer
< NG3
Zambia
TLC 0.1
Cost ratios USD/km for 6.5 m wide pavementSu
bb
ase
& C
app
ing
laye
r
Key: Ratio < 1 Ratio = 1 1 < Ratio ≤ 2 2 < Ratio ≤ 5 5 < Ratio ≤ 10 Ratio > 10
Subgrade Subgrade Subgrade
5 20 65 5 20 65 5 20 65
5 1,00 1,00 1,00 5 1,00 1,00 1,00 5 1,00 1,00 1,00
20 20 20 1,00 1,00 1,00
65 65 65 1,00 1,00 1,00
5 2,46 1,91 1,26 5 2,33 1,89 1,33 5 1,38 1,32 1,23
20 3,04 2,31 1,47 20 2,90 2,30 1,55 20 1,47 1,41 1,31
65 4,58 3,39 2,04 65 4,41 3,39 2,15 65 1,62 1,56 1,45
5 1,11 1,08 1,04 5 1,00 1,00 1,00 5 0,62 0,70 0,83
20 20 20
65 65 65
5 1,82 1,53 1,17 5 1,78 1,55 1,24 5 1,05 1,09 1,16
20 2,07 1,71 1,26 20 2,06 1,76 1,36 20 1,04 1,08 1,14
65 2,75 2,18 1,51 65 2,81 2,30 1,65 65 1,03 1,06 1,11
Cost ratios USD/km for 6.5 m wide pavement
Design
method
Sub
bas
e &
Cap
pin
g la
yer
Sub
bas
e &
Cap
pin
g la
yer
Average
haul (km)
Ghana Ghana
Sub
bas
e &
Cap
pin
g la
yer
TLC 0.3 TLC 0.7
Average
haul (km)
Ghana
BaseAverage
haul (km)
NG7 NG7
ORN31
DCP-CBR
Climate
Wet
Climate
Wet
Base
NG7
TLC 1.0
Base
DCP-DN
TRH4
Climate
Wet
Key: Ratio < 1 Ratio = 1 1 < Ratio ≤ 2 2 < Ratio ≤ 5 5 < Ratio ≤ 10 Ratio > 10
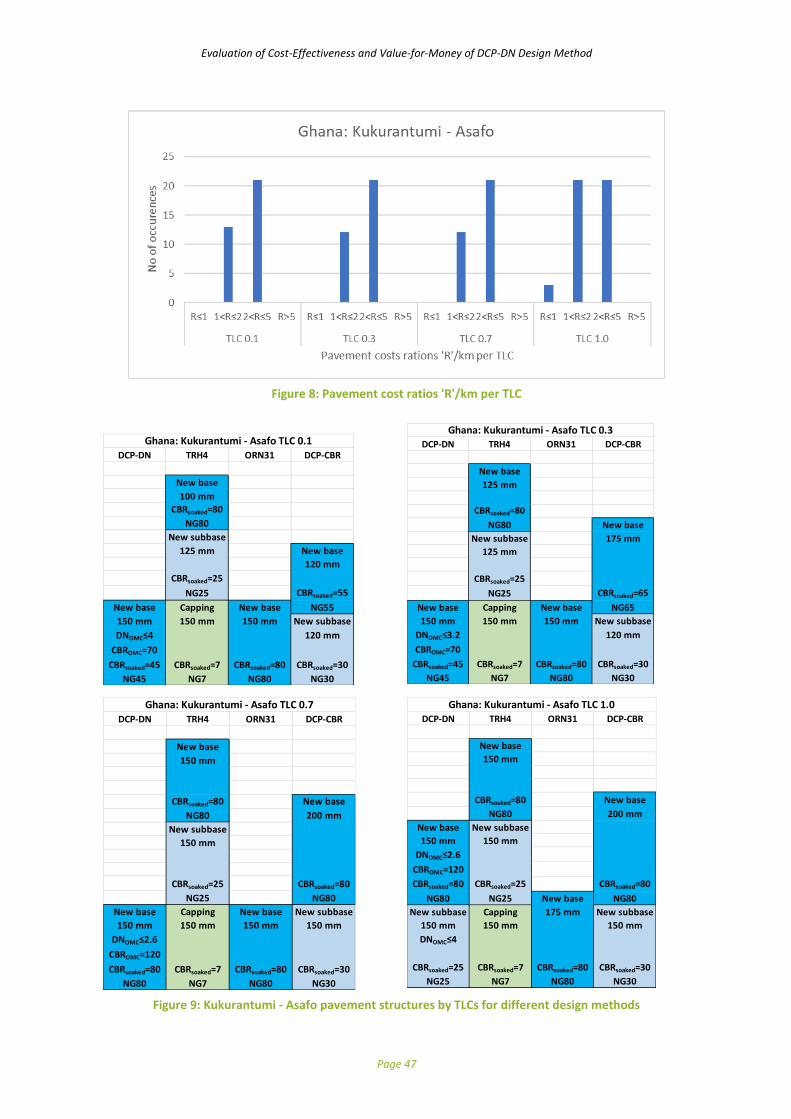
Evaluation of Cost-Effectiveness and Value-for-Money of DCP-DN Design Method
Page 47
Figure 8: Pavement cost ratios 'R'/km per TLC
Figure 9: Kukurantumi - Asafo pavement structures by TLCs for different design methods
DCP-DN TRH4 ORN31 DCP-CBR
New base
100 mm
CBRsoaked=80
NG80
New subbase
125 mm New base
120 mm
CBRsoaked=25
NG25 CBRsoaked=55
New base Capping New base NG55
150 mm 150 mm 150 mm New subbase
DNOMC≤4 120 mm
CBROMC=70
CBRsoaked=45 CBRsoaked=7 CBRsoaked=80 CBRsoaked=30
NG45 NG7 NG80 NG30
Ghana: Kukurantumi - Asafo TLC 0.1 DCP-DN TRH4 ORN31 DCP-CBR
New base
125 mm
CBRsoaked=80
NG80 New base
New subbase 175 mm
125 mm
CBRsoaked=25
NG25 CBRsoaked=65
New base Capping New base NG65
150 mm 150 mm 150 mm New subbase
DNOMC≤3.2 120 mm
CBROMC=70
CBRsoaked=45 CBRsoaked=7 CBRsoaked=80 CBRsoaked=30
NG45 NG7 NG80 NG30
Ghana: Kukurantumi - Asafo TLC 0.3
DCP-DN TRH4 ORN31 DCP-CBR
New base
150 mm
CBRsoaked=80 New base
NG80 200 mm
New subbase
150 mm
CBRsoaked=25 CBRsoaked=80
NG25 NG80
New base Capping New base New subbase
150 mm 150 mm 150 mm 150 mm
DNOMC≤2.6
CBROMC=120
CBRsoaked=80 CBRsoaked=7 CBRsoaked=80 CBRsoaked=30
NG80 NG7 NG80 NG30
Ghana: Kukurantumi - Asafo TLC 0.7DCP-DN TRH4 ORN31 DCP-CBR
New base
150 mm
CBRsoaked=80 New base
NG80 200 mm
New base New subbase
150 mm 150 mm
DNOMC≤2.6
CBROMC=120
CBRsoaked=80 CBRsoaked=25 CBRsoaked=80
NG80 NG25 New base NG80
New subbase Capping 175 mm New subbase
150 mm 150 mm 150 mm
DNOMC≤4
CBRsoaked=25 CBRsoaked=7 CBRsoaked=80 CBRsoaked=30
NG25 NG7 NG80 NG30
Ghana: Kukurantumi - Asafo TLC 1.0

Evaluation of Cost-Effectiveness and Value-for-Money of DCP-DN Design Method
Page 48
3.4.9 Project costs
The project costs were derived from the Zambian project by using the most likely haulage scenarios as per Table 18 (yellow cells) and as explained in Table 21, while keeping all other cost factors constant.
Table 21: Material haulage scenarios
The resulting project costs for the various haulage scenarios are shown in Table 22. In practice, for the long/long haul scenarios, some form of material improvement (chemical stabilisations, blending etc.), for the base only or for all pavement layers may provide more cost-effective solutions. However, this option is beyond the scope of these analyses.
Table 22: Project costs/km (USD) for various haulage scenarios
3.4.10 Project cost ratios
The resulting project cost ratios in Table 23 show that for all haulage scenarios, the DCP-DN design method comes out cheaper than TRH4 and DCP-CBR with a margin of 2-12%. The ORN31 design is just marginally more expensive for all scenarios except for the medium/medium where it is on par with DCP-DN and the long/long combination in which it is marginally cheaper (see red cell).
Table 23: Project costs ratios for various haulage scenarios
Project cost ratios Kantogo – Waitwika, Zambia
Haul scenarios DCP-DN TRH4 ORN31 DCP-CBR
Short/short 1.00 1.05 1.00 1.05
Short/medium 1.00 1.04 1.03 1.08
Short/long 1.00 1.03 1.03 1.07
Medium/medium 1.00 1.05 1.00 1.05
Medium/long 1.00 1.04 1.03 1.08
Long/long 1.00 1.08 1.00 1.08
Haulage scenario Explanation
Short/short Both Capping/Subbase and Base within average haul of 5 km
Short/medium Capping/subbase at average haul of 5 km, base at average haul of 20 km
Short/Long Capping/subbase at average haul of 5 km, base at average haul of 65 km
Medium/medium Both Capping/subbase and base at average haul of 20 km
Medium/long Capping/subbase at average haul of 20 km, base at average haul of 65 km
Long/long Both Capping/subbase and base at average haul of 65 km
Haul scenarios DCP-DN TRH4 ORN31 DCP-CBR
Short/short 281 087 294 296 281 087 294 296
Short/medium 277 495 289 784 285 503 298 713
Short/long 292 362 299 696 300 370 313 580
Medium/medium 289 920 305 779 289 920 305 779
Medium/long 296 778 307 793 304 787 320 646
Long/long 319 654 344 433 319 654 344 433
Project costs (USD) Kantogo - Waitwika, Zambia

Evaluation of Cost-Effectiveness and Value-for-Money of DCP-DN Design Method
Page 49
3.4.11 Project cost differences
Table 24 shows that, based on the Zambia pavement and project costs, the DCP-DN design method offers considerable project cost savings/km in all haulage scenarios compared to TRH4 and DCP-CBR. ORN 31 is marginally more expensive in five of the haulage scenarios but offers slight project costs/km savings in the long/long haulage scenario.
Table 24: Project costs differences/km (USD) for various haulage scenarios
3.5 Hypothetical versus In-Situ Designs
3.5.1 Hypothetical designs
The hypothetical approach offers the possibility of determining the likely pavement and project cost ratios as well as the total project cost difference/km arising from the use of the various design methods when applied in a variety of situations pertaining to a range of design traffic loadings, subgrade strengths, climatic zones material haulage distances etc. Thus, it covers virtually all possible scenarios that could be met in practice. The materials costs and materials haulage rates have been obtained from contractors operating in a competitive environment in South Africa and provide a realistic basis for determining both the pavement layer costs and the related pavement structure costs from which the total project cost per design scenario and project cost difference/km have been derived. The pavement and project cost ratio trends, as well as the total project cost difference/km for the various design methods provide valuable information in terms of which design method is best suited for application in particular road environment situation.
3.5.2 In-situ designs
The in-situ designs are based on actual design information pertaining to the 10 road sections located in six countries in west, east and southern Africa. For cost comparison with the hypothetical designs, the same cost information has been used, i.e. as obtained from South African contractors. However, where the information was available in the required format (Zambia, Tanzania and South Africa), cost ratios using the country-specific information were also calculated. Not surprisingly, since the same costs have been applied to the different design methods, this did not change the cost-ratio trends determined from the South African costs data.
3.5.3 Comparison of hypothetical and in-situ situ designs
Comparison of the pavement structure costs and related cost ratios for the 36 in-situ designs with those derived for the same road environmental conditions in the hypothetical cost matrix are generally similar, and a perfect match in cases where the in-situ conditions of projects are exactly the same as evaluated in the hypothetical designs. Table 25 provides evidence of such a case, with cost ratios similar for different traffic design loading and haul distances.
Haul scenarios DCP-DN TRH4 ORN31 DCP-CBR
Short/short - 13 209 - 13 209
Short/medium - 12 290 8 008 21 218
Short/long - 7 334 8 008 21 218
Medium/medium - 15 859 - 15 859
Medium/long - 11 014 8 008 23 868
Long/long - 24 780 - 24 780
Project costs differences (%) Kantogo - Waitwika, Zambia

Evaluation of Cost-Effectiveness and Value-for-Money of DCP-DN Design Method
Page 50
Table 25: Comparison of pavement cost ratios (Project versus Hypothetical)
As discussed in Section 3.5.2 above, the cost ratio trends derived from the in-situ designs have also been corroborated by the trends derived from the hypothetical design evaluations.
3.5.4 Implications of EMC selection
The type of pavement structure resulting from the application of the DCP-DN method is highly dependent on the designer’s assumptions regarding the expected equilibrium moisture content of the pavement layers and the subgrade. As indicated in the penultimate paragraph of Section 2.4.1, it has been assumed conservatively that, even though the EMC in the pavement layers and subgrade could be expected to equilibrate below OMC (Emery, 1985), for design purposes the OMC has been adopted. The implication of this assumption is that there would be a built-in factor of safety in the design to cater for less than adequate maintenance of side drains that might result in slightly increased moisture contents in the subgrade and pavement layers. Should this not be a concern, then EMC design could be adopted that would result in thinner/less costly pavements, albeit with some degree of additional risk.
Danger Point TLC
Climate
Subgrade CBR0.75OMC=110 CBRsoaked=40 SG class S6 SG class S6 CBR0.75OMC=110 CBRsoaked=40 SG class S6 SG class S6 CBR0.75OMC=110CBRsoaked=40 SG class S6 SG class S6
DCP-DN TRH4 ORN31 DCP-CBR DCP-DN TRH4 ORN31 DCP-CBR DCP-DN TRH4 ORN31 DCP-CBR
Pavement cost ratio 1.00 5.67 6.50 5.43 1.00 6.08 6.50 5.62 1.00 0.98 1.10 1.05
Synthetic ratio 1.00 5.67 6.50 5.43 1.00 6.08 6.50 5.62 1.00 0.98 1.10 1.05
DCP-DN TRH4 ORN31 DCP-CBR DCP-DN TRH4 ORN31 DCP-CBR DCP-DN TRH4 ORN31 DCP-CBR
Pavement cost ratio 1.00 6.89 8.33 6.90 1.00 7.61 8.33 7.09 1.00 0.95 1.11 1.08
Synthetic ratio 1.00 6.89 8.33 6.90 1.00 7.61 8.33 7.09 1.00 0.95 1.11 1.08
DCP-DN TRH4 ORN31 DCP-CBR DCP-DN TRH4 ORN31 DCP-CBR DCP-DN TRH4 ORN31 DCP-CBR
Pavement cost ratio 1.00 10.17 13.25 10.83 1.00 11.71 13.25 11.02 1.00 0.90 1.13 1.11
Synthetic ratio 1.00 10.17 13.25 10.83 1.00 11.71 13.25 11.02 1.00 0.90 1.13 1.11
0.1 MESA
Moderate/Dry
Short haul
Medium haul
Long haul
0.3 MESA
Moderate/Dry
Short haul
Medium haul
Long haul
1.0 MESA
Moderate/Dry
Short haul
Medium haul
Long haul

Evaluation of Cost-Effectiveness and Value-for-Money of DCP-DN Design Method
Page 51
4 Evaluation of Value for Money
4.1 General
The UK Department for International Development (DFID) defines Value for Money (VFM) as “maximising the impact of each pound spent to improve poor people’s lives” (DFID, 2011). This echoes the UK National Audit Office’s definition which defines VFM as being “the optimal use of resources to achieve intended outcomes”. A key element in both definitions is to make the best use of available resources to achieve sustainable outputs and outcomes.
4.2 Framework for VFM analysis
The VFM conceptual framework is based on a logical “results chain” which explicitly sets out the results to be achieved by a given programme or project. Error! Reference source not found. presents the five main elements of this results chain and shows where the four main dimensions of VFM can be measured.
Figure 10: Framework for VFM analysis (DFID, 2011)
The five main elements of the VFM framework are as follows (DFID, 2011):
1) Inputs – the resources used, in terms of finance and staff time (capital and labour).
2) Process – the process by which inputs are transformed into results.
3) Outputs – the direct deliverables of the project.
4) Outcomes - resulting from the outputs
5) Impacts - the longer-term impact of the project. In essence, the elements represent a chain of events through time, given that these different types of results would usually, but not always, take place sequentially. The causal links between these different types of results need to be informed by evidence, however, as a sustained actual outcome or an impact in the programme area may be influenced by factors outside the programme. The main dimensions of the VFM framework are as follows (DFID, 2011):
(a) Economy: Relates to the price at which inputs are purchased. For example, are DFID’s agents
buying inputs (e.g. consultancy services) at the appropriate quality and the right price?
(b) Efficiency: Relates to how well inputs are converted into a specific output, i.e. the results
delivered by DFID’s agents to an external party such as a partner country.
(c) Effectiveness: Relates to how well outputs from an intervention are converted into sustained
outcomes and achievement of the ultimate desired outcome on poverty reduction. Note: In
contrast to outputs, the implementer does not exercise direct control over whether actual
outcomes materialise and whether they can be sustained.
Inputs Process Output Outcome Impact
Efficiency Effectiveness
Cost Effectiveness
Economy

Evaluation of Cost-Effectiveness and Value-for-Money of DCP-DN Design Method
Page 52
(d) Cost-effectiveness: Relates to the cost of achieving intended project actual outcomes. This
can be used to compare the cost of alternative ways of producing the same or similar
outcomes.
In practice, in order to obtain value-for-money on any project it would be necessary to maximise its
effectiveness, efficiency and economy (the 3 Es) as well as the strength of the links in the results chain.
The issue of equity also needs to be considered to make sure that the outcomes of the project are not
only sustainable but, importantly, they are targeted at the poorest and include sufficient gender
targets.
4.3 Evaluation of VFM
In accordance with the ToR, a key requirement of the project is to evaluate road sections designed using the DCP-DN method in terms of the following aspects:
• cost-effectiveness
• outcome (uptake) and knowledge
• potential impact. The outcome of this evaluation is presented below.
4.3.1 Cost-effectiveness
The cost-effectiveness of the DCP-DN method of design, as against other typical methods of design (TRH4, DCP-CBR and ORN31) may be evaluated on the basis of the following:
• Pavement cost ratios
• Total project cost ratios
• Total project cost difference/km The outcome of the above measures of cost-effectiveness has been presented in Section 3 for both
the hypothetical and in-situ designs. In terms of project cost differences/km, which are of most interest
to road agencies, and based on the wide range of design scenarios (1728) considered in the
hypothetical approach, the DCP-DN design method will, in the majority of the cases, provide savings
in the range of USD 10,000 -20,000 per km, and in many cases more than USD20,000/km. These savings
occur to a lesser extent in the higher TLCs (0.7 – 1.0 MESA) and, in some cases of this traffic range
close to 1.0 MESA, other design methods, particularly ORN31, are more cost-effective than the DCP-
DN design method. These figures illustrate the general cost-effectiveness of the DCP-DN methods
against the other design methods.
In light of the above findings, it is noteworthy that in many African countries the continued use of
gravel as a road surfacing material is unsustainable. This fact, coupled with the relatively low traffic
thresholds for justifying economically the upgrading of gravel roads to a paved standard (often < 100
vpd, depending on road environment conditions (Morusuik et al, 2000)), makes such upgrading a very
attractive option. Given that many countries in Africa have embarked on programmes for improving
basic access in rural areas by providing paved roads, typically of the order of 100 – 150 km/annum,
the benefits of adopting an appropriate pavement design method, such as the DCP-DN method, at
traffic levels up to about 0.7 MESA over a 10 – 15 year design life, are substantial. For example, for the
twelve African countries participating in ReCAP, over a 5-year planning horizon, and based on the
extreme scenarios indicated above, the savings would be of the order of USD 60 – 180 million. When
extrapolated to all 46 countries in Sub-Saharan Africa, this figure would be of the order of USD 2.7 –
18 billion depending on the extent of the upgrading programmes in these countries.

Evaluation of Cost-Effectiveness and Value-for-Money of DCP-DN Design Method
Page 53
4.3.2 Outcome (uptake)
In line with one of the key aims of ReCAP, the project outcome is expected to promote sustained increase in the evidence base for more cost effective and reliable provision of LVRs as well as to influence policy and practice in Africa and Asia. Thus, the outcome of the project can be assessed in relation to such factors as:
(1) Sustainability
a. There has been active and sustained engagement of ReCAP consultants with practitioners in all the AfCAP countries and some AsCAP countries with the aim of fostering a deeper understanding of what can be done to provide more cost-effective and sustainable LVRs. This has been achieved through a variety of measures including the following: i. Seminars, workshops and meetings aimed at promoting safe and sustainable rural access
in Africa and Asia through research and knowledge sharing between participating countries and the wider community.
ii. Establishment of project Working Groups or Steering Committees comprised of key practitioners involved in the design of LVRs. This has provided fora for discussing a wide range of issues associated with the environmentally optimised design of LVRs, including the use of appropriate, cost-effective design methods.
iii. Construction and long-term monitoring of a number of demonstration or trial sections to verify the soundness of the DCP-DN design method.
b. There has been a strong contribution in kind from partner Governments in a number of countries (e.g. Ghana, Zambia) in terms of staff time and funding/co-funding of construction of trial sections, sometimes with other bi-lateral donors.
c. A number of basic and advanced training courses in the DCP-DN method of design have been held for engineers and technicians in a number of both AfCAP (Kenya, Tanzania, Malawi, Ghana), and AsCAP countries (Nepal) where trainees from other countries were hosted. As a result of such training, there is now a cadre of trained and motivated practitioners, some 146 engineers and 64 technicians, many of whom will be in a position to mainstream the DCP-DN method of design in their organisations. Four such trained practitioners have been certified as AfCAP Level 1: Lead Trainers which qualifies them to undertake such training in their countries or abroad.
(2) Uptake
a. The uptake of the DCP-DN method of design has been manifested as follows: I. Partner country financing of LVRs based on the DCP-DN method in some countries
including, so far, Malawi, Ghana and Zambia.
II. Local standards and specifications have been revised to allow the option of using the DCP-DN method in a number of countries, including Ethiopia, South Sudan, Tanzania, and Mozambique. Such revision is also on-going in a number of other countries including Malawi, Zambia, Ghana, Sierra Leone and Liberia
(3) Quality of DCP-DN research a. The quality of DCP-DN research has manifested itself as follows:
I. An internationally peer reviewed paper on the DCP-DN pavement design method has been published in the UK ICE Proceedings (Rolt and Pinard, 2016).
II. Numerous papers on the DCP-DN design method have been presented at a number of international and regional conferences (e.g. Klein and Savage, 1982; Kleyn and Van Heerden, 1987; Kleyn and Van Zyl, 1987; De Beer, 1991; Paige-Green, 2011; Paige-Green and Pinard, 2012; Pinard and Paige-Green, 2013; Pinard et al, 2015).
Evaluation of Cost-Effectiveness and Value-for-Money of DCP-DN Design Method
Page 54
(4) Knowledge of the DCP-DN method a. The knowledge base for the DCP-DN method of pavement design is gradually increasing in
terms of the following: i. The number of certified trainers who have themselves applied the method in practice
in their countries. This includes, so far, countries such as Ghana, Zambia and Malawi. ii. Incorporation in curriculum of tertiary institutions including universities and technical
colleges is currently under consideration by ReCAP.
4.3.3 Potential impact:
The longer-term potential impact of the sustained use of the DCP-DN method of pavement design or,
indeed, any DCP-related method of design, for upgrading unpaved roads to a paved standard, would
be a contributory factor in: (1) Reduced costs/increased cost-effectiveness of LVR provision
With the increasing uptake and mainstreaming of the DCP-DN method and other DCP-related
methods of pavement design, there is now significant scope for reducing costs/increasing the
cost-effectiveness of LVR provision.
(2) Optimum use of non-renewable resources
The provision of a LVSR compared to a gravel road, will obviate the need for continual regravelling of LVRs and, in so doing, lead to optimum use non-renewable gravel resources.
(3) Improved transport services at cheaper costs
The reduction in vehicle operating costs experienced on a sealed, compared to a gravel, road,
largely through the difference of roughness/riding quality of their surfaces, can be significant.
For example, the roughness, in IRI terms, of a gravel road can range between 5 – 15 m/km
compared to an old paved road (3 – 7 m/km) and a new paved road (2 – 3.5 m/km). Thus, as
vehicle operating costs reduce, there is likely to be improved transport services at cheaper costs.
(4) Increase in agricultural production and productivity due to more reliable, all-season access to
market places.
(5) Improvements in education and health due to communities being able to access such facilities in all seasons.
(6) Increased resilience to climate impacts due to the provision of more durable road surfaces.
(7) Ultimately, poverty reduction in the vicinity of the project area due to improvements in community livelihoods.
It must be stressed, however, that since most of the oldest DCP-DN designed sections have been in service for only about 6 years, and some of the others not even constructed, it is most unlikely that in such a relatively short time there would be any discernible, quantifiable impacts of any kind. Nonetheless, it may be possible to provide a qualitative indication of some of the potential impacts listed above from interviews with local communities. Notwithstanding the above, the project could be the foundation upon which Regional Research Centres (RRCs) become involved in the VFM process throughout the design life (10 – 15 years) of the road sections. Thus, a similar data collection exercise, including maintenance costs, could be undertaken say after 5 years which would provide valuable information on the extent to which they provide VFM as discussed above.

Evaluation of Cost-Effectiveness and Value-for-Money of DCP-DN Design Method
Page 55
5 Summary of Key Findings and Conclusions
5.1 Key Findings
5.1.1 Cost Evaluation
The key findings of the analyses emanating from the hypothetical designs, which have been found to be reflective of the outcome of the in-situ designs, are shown in Figures 3 to 6 In Section 3.3.11 from which general conclusions may be drawn:
(1) At design traffic loading up to about 0.7 MESA, and for a wide range of subgrade strengths and climatic zones, the DCP-DN design method will, in the majority of cases, provide pavement construction cost savings in the range of USD 10,000 -20,000 per km, and in many cases in excess of USD20,000/km when compared against the selected methods. These costs savings are reduced by about 30 to 60% for the zero-haulage scenario.
(2) The pavement construction cost savings offered by the DCP-DN method occur to a lesser extent in the higher Traffic Loading Classes (TLCs) (0.7 MESA and above) when, in some cases, other design methods, particularly ORN31, are more cost-effective in this higher traffic range.
In general terms, the difference in pavement construction costs per km for the various design methods, and the pavement construction cost efficiency of the DCP-DN design method, relative to the other design methods, decreases with higher quality subgrades and higher TLCs. Also, for the specific set of environmental conditions considered, there is no major difference in the trends between Wet and Dry-Moderate environments.
5.1.2 Value for Money
In terms of Value for Money (VFM), the DCP-DN method has been evaluated in terms of the following:
(1) Cost-effectiveness: The outcome of the various cost evaluations undertaken and summarised above illustrate the general cost-effectiveness of the DCP-DN method against the other design methods.
Given that many countries in Africa have embarked on programmes for improving basic access in rural areas by upgrading gravel roads to a paved standard, typically of the order of 100 – 150 km/annum, the potential benefits of adopting the DCP-DN method over a 5-year planning horizon, could result in cost savings of the order of USD60 – 180 million, depending on the extent of the upgrading programme and the road environment conditions. When extrapolated to all 46 Sub-Saharan countries, this figure is estimated at USD 2.7 – 18 billion.
(2) Outcome (uptake) and knowledge: This has been assessed in terms of the following: a. Sustainability: This has been demonstrated in terms of the following typical examples:
i. Seminars, workshops and meetings aimed at knowledge sharing between participating ReCAP countries and their wider community of practitioners.
ii. Establishment of Working Groups or Steering Committees with the objective of discussing intensively issues associated with the environmentally optimised design of LVRs.
iii. Construction and long-term monitoring of demonstrating or trial sections designed on the basis of the DCP-DN method.
iv. Contributions in kind from partner Governments in terms of staff time and funding/co-funding with bi-lateral partners
v. The holding of basic and advanced training courses in the DCP-DN method of design for engineers and technicians that have led to the certification of four AfCAP Level 1
Evaluation of Cost-Effectiveness and Value-for-Money of DCP-DN Design Method
Page 56
Trainers which qualifies them to undertake such training nationally or internationally. Once such trainer has already been involved in an international DCP training programme.
(b) Uptake: This has been manifested as follows:
i. ReCAP country partner financing of the DCP-DN design method in three countries so far.
ii. Inclusion of DCP-DN requirements in local standards and specifications of at least four countries so far, and on-going revisions in at least another five countries.
(c) Quality of DCP-DN research: This has been manifested as follows:
I. Production of at least one internationally peer-reviewed paper on the DCP-DN method of design in the research proceedings of a major civil engineering institution I the UK
ii. Production and presentation of at least 7 peer reviewed papers on the DCP-DN method of design in a number of regional and international conferences (Kleyn and Savage, 1982; Kleyn and Van Heerden, 1983; Kleyn and Van Zyl, 1987; Paige-Green, 2011; Paige-Green and Pinard, 2012; Pinard and Paige-Green, 2013; Pinard et al, 2015).
(d) Knowledge of the DCP-DN method. This has been manifested as follows:
i. An increase in the knowledge base for the DCP-DN method of pavement design which is gradually increasing in terms of the following:
a. The number of certified trainers who have themselves applied the method in practice in at least three countries.
b. Incorporation in at least one international course in Rural Roads for Development held at the University of Birmingham, UK.
c. Involvement of university lecturers as trainee trainers in the use of the DCP-DN method for LVR pavement design.
(3) Potential impact: Although it may be too soon to start quantifying the impact of introducing
the DCP-DN method of design for the more recently constructed trial sections, or of adopting any DCP-related method of design for future LVRs, such impacts are likely to be a factor within the causal package leading to:
a. Reduced cost/increased cost-effectiveness of LVR provision.
b. Optimum use of non-renewable gravel resources.
c. Improved transport services at cheaper costs.
d. Increase in agricultural production and productivity due to more reliable, all-season access to market places.
e. Improvements in education and health due to communities being able to access such facilities in all seasons.
f. Increased resilience to climate impacts due to more durable paved road surfaces.
g. Ultimately, poverty reduction in the vicinity of the project due to improvements in community livelihoods.
In summary, the use of the DCP-DN method and, indeed other methods such as ORN31 in some road environment situations, is expected to provide Value for Money in terms of the following:
a. Cost-effectiveness. b. Outcome (uptake) and knowledge. c. Potential impact.

Evaluation of Cost-Effectiveness and Value-for-Money of DCP-DN Design Method
Page 57
5.2 Main Conclusions
The main conclusion to be drawn from the very wide range of design evaluations is that, in general, the DCP-DN method is the most cost-effective design option at relatively low TLCs, up to about 0.7 MESA and across all subgrade strengths. However, at TLCs above 0.7 MESA the method gradually becomes less cost effective than the other methods, particularly ORN31, which become more cost-effective in many situations.
It is also interesting to note that ORN31 has been shown to be generally more cost-effective than its successor for LVR design, the DCP-CBR method, in all design environments. This may be partly explained by two reasons:
(1) ORN31, together with the DCP-DN method, and in contrast to the DCP-CBR and TRH4 design methods, allows for the use of unsoaked subgrades which offer scope for using relatively thinner/less costly pavement structures.
(2) The adopted soaked/unsoaked subgrade CBR ratio for the DCP-CBR method appears to be very conservative compared to that adopted in the DCP-DN and ORN31 methods.
One of the major benefits of the hypothetical evaluation spreadsheets is that they can be used by practitioners to determine what are the likely costs of their designs in a particular set of road environment conditions, and which is the most appropriate design method to use. The spreadsheets also offer the potential for being developed as an application tool for undertaking LVR design based on a set of input parameters.
5.3 Way Forward
In terms of the way forward, and based on the many lessons learnt during the course of undertaking this project, the following recommendations are made:
(1) A practitioner’s workshop should be held to discuss and disseminate the findings of this report.
(2) As part of the on-going ReCAP project on Long Term Pavement Performance (LTPP) monitoring of trial sections in a number of partner countries, measurement of in-situ moisture in the pavement layers and subgrade, and across the horizontal profile of the sections, should be given high priority in order to validate the assumptions made on this parameter in all the design methods.
(3) In order to embed in practice the potential benefits to be derived from the use of the DCP-DN method, a generic guideline on the Design of Low Volume Roads should be produced so as to provide practitioners with another choice of design method for their consideration.
(4) The Regional Research Centres should undertake a similar data collection exercise to the one initiated under this project, in say 5 years’ time, so as to consolidate on the preliminary results of the VFM exercise initiated under this project. This should also include performance data e.g. road roughness measurements to incorporate vehicle operating costs/benefits in the LCC analysis for comparison of design method cost-effectiveness.
(5) Consideration should be given to improving, and possible extending the spreadsheets developed under this project as an application tool for undertaking LVR design based on any set of input parameters to determine what are the likely costs of their designs in a particular set of road environment conditions, and which is the most appropriate design method to use.
(6) Consider the following topics for further research to enhance the efficacy and applicability of the DCP-DN design method a. Determine the precision limits of the DCP-DN measurement as against the CBR
measurement as adopted by other LVR design methods.

Evaluation of Cost-Effectiveness and Value-for-Money of DCP-DN Design Method
Page 58
b. Compare the designs produced by the DCP-DN and other design approaches (DCP-CBR, TRH4 and ORN31) with an analytical approach.
c. Use suitably calibrated road investment appraisal models such as HDM-4 or the World Bank’s Roads Economic Development Model (RED) to appraise robustly the LCCs of the DCP-DN and other design approaches.
Evaluation of Cost-Effectiveness and Value-for-Money of DCP-DN Design Method
Page 59
6 References AfCAP (2016). Design Manual for Low Volume Sealed Roads Using the DCP Design Method. Ministry of Transport and Public Works, Malawi, Sept. 2013.
Committee of Land Transport Officials (COLTO) (1996). Structural Design of flexible pavements for interurban and rural roads. TRH 4, COLTO, Pretoria, South Africa.
De Beer M (1991). Use of the Dynamic Cone Penetrometer (DCP) in the design of road structures. Proc 10th Reg Conf Africa on Soil Mechanics and Foundation Engineering, Maseru, Lesotho. Department for International Development (2011). DFID’s Approach to Value-for-Money (VFM). DFID, July 2011. (https://www.gov.uk/government/publications/dfids-approach-to-value-for-money-vfm)
Emery S J (1985). Prediction of Moisture Content for Use in Pavement Design. PhD Thesis, University of Witwatersrand, Johannesburg, South Africa. Gourley C S (2002). Background to the development of structural design charts for low volume sealed roads in the SADC region. TRL, Crowthorne RG45 6AU, UK.
Gourley C S and PAK Greening (1999). Performance of low volume sealed roads: results and recommendations from studies in Southern Africa. TRL Project Report PR/OSC/167/99. Transport Research Laboratory, Crowthorne RG45 6AU. UK.
Hongve J and M I Pinard (2016). Guideline, for Compaction Quality Control Using the DCP. AfCAP Project Report Ref. MAL 2007B.
Kleyn EG and P F Savage (1982). The application of the pavement DCP to determine the bearing properties and performance of road pavements. Proc Int Symp on Bearing Capacity of Roads and Airfields, Trondheim, Norway, 1982. Kleyn EG and M J J Van Heerden (1983). Using DCP soundings to optimise pavement rehabilitation. Proc Annual Transportation Convention, Johannesburg. Kleyn E G (1984). Aspects of pavement evaluation and design as determined with the aid of the Dynamic Cone penetrometer. (In Afrikaans), M Eng. Thesis, University of Pretoria, South Africa.
Kleyn E G and G van Zyl (1987). Application of the Dynamic Cone Penetrometer to light pavement design. Transvaal Provincial Administration, Pretoria, Laboratory Report L4/87.
Livneh M and I Ishai (1987). Pavement and Material Evaluation by A Dynamic Cone Penetrometer. Proc. 6th Int. Conf. on Structural Design of Asphalt Pavements, Univ. of Michigan, Ann Arbor, Michigan, USA, pp 665-676. Livneh M and N Livneh (2013). The Use of the Dynamic Cone Penetrometer for Quality Control of Compaction Operations. International Journal of Engineering Research in Africa Vol. 10 (2013) pp 49-64 Morusuik G, Toole T, Gourley CS and JL Hine (2000). Whole life performance of low volume sealed roads in Southern Africa. TRL Annual research Review 1999, pp. 25-32.
Paige-Green, P (1994). Recommendations on the use of marginal base course materials in low volume roads in South Africa. Pretoria. Department of Transport, Research Report RR 91/201.
Paige-Green P (2011). Applying the Dynamic Cone Penetrometer (DCP) design method to low volume roads. Proc 15th Africa Regional Conference on Soil Mechanics and Geotechnical Engineering, (ARC), Maputo, 2011, pp 422-430. Paige-Green P and M I Pinard (2012). Optimum design of sustainable sealed low volume roads using the dynamic cone penetrometer (DCP). 25th ARRB Conference, Perth, Australia. Sept 2012.

Evaluation of Cost-Effectiveness and Value-for-Money of DCP-DN Design Method
Page 60
Paige-Green and van Zyl (2018). Development of the DCP-DN Design Method. ReCAP report.
Pinard M I and P Paige-Green (2013). A new approach for the optimum design of low volume sealed roads using the Dynamic Cone Penetrometer. Proc Africa T2 Conference, Gaborone, Botswana, March 2013, pp187 – 194. Pinard M I, Paige-Green P and J Hongve (2015). A New Approach to the Upgrading of Gravel Roads to Low Volume Sealed Roads Based on Dynamic Cone Penetrometer testing. Transportation Research Record (J of Transportation Research Board), 2474 (2), pp 136-146. Roy B K (2007). New Look at DCP Test with a Link to the AASHTO SN Design Concept. Journal of Transportation Engineering, Vol. 133, No. 4, April 1, 2007.
Sampson L R and F Netterberg (1990). Effect of material quality on the relationship between DCP-DN value and CBR. 1990 Annual Transportation Convention, Pretoria.
Siekmeier J et al, (2009). Using the Dynamic Cone Penetrometer and Light Weight Deflectometer for Construction Quality Assurance. Office of Materials and Road Research Minnesota Department of Transportation. Final report MN/RC 2009-12
Smith RB and D N Pratt (1983). A field study of in-situ California Bearing Ratio and dynamic cone penetrometer testing for road subgrade investigations. Australian Road Research, 13, No. 4, 1983, 285-94. ARRB, Australia.
Paige-Green P, Lea J and C Barnado (1999). Relationship between in-situ DCP strength and soaked CBR. Technical Report TR-99/003. Division of Roads and Transport Technology, CSIR, Pretoria.
Samuel P and S Done (2005). DCP analysis and design of low volume roads by the new TRL software UK-DCP. Sustainable Access and Local Resource Solutions. PIARC. Paris, France.
Transport Research Laboratory (TRL) (1993). A Guide to the Structural Design of Bitumen-Surfaced Roads in Tropical and Sub-Tropical Countries. TRL Crowthorne, Berkshire RG45 6AU.

Evaluation of Cost-Effectiveness and Value-for-Money of DCP-DN Design Method
Page 61
Annexes

Evaluation of Cost-Effectiveness and Value-for-Money of DCP-DN Design Method
Page 62
Annex A – DCP-DN Structural Design Catalogue
Traffic Class
E80 x 106
0.01
0.003 – 0.01
0.03
0.01 – 0.03
0.1
0.03 – 0.10
0.3
0.10 – 0.30
0.7
0.30 – 0.70
1.0
0.70 – 1.0
0- 150mm Base ≥ 98% Mod. AASHTO
DN ≤ 8
DN ≤ 5.9
DN ≤ 4
DN ≤ 3.2
DN ≤ 2.6
DN ≤ 2.5
150-300 mm Subbase ≥ 95% Mod. AASHTO
DN ≤ 19
DN ≤ 14
DN ≤ 9
DN ≤ 6
DN ≤ 4.6
DN ≤ 4.0
300-450 mm subgrade ≥ 95% Mod. AASHTO
DN ≤ 33
DN ≤ 25
DN ≤ 19
DN ≤ 12
DN ≤ 8
DN ≤ 6
450-600 mm In-situ material
DN ≤ 40 DN ≤ 33 DN ≤ 25 DN ≤ 19 DN ≤ 14 DN ≤ 13
600-800 mm In-situ material
DN ≤ 50 DN ≤ 40 DN ≤ 39 DN ≤ 25 DN ≤ 24 DN ≤ 23
DSN 800 ≥ 39 ≥ 52 ≥ 73 ≥ 100 ≥ 128 ≥ 143

Evaluation of Cost-Effectiveness and Value-for-Money of DCP-DN Design Method
Page 63
Annex B – DCP-CBR Structural Design Catalogue (N > 4)
Key
Subgrade strength classes (CBR%)
S2 = 3-4 S3 = 5 – 7 S4 = 8 – 14 S5 = 15 – 29 S6 = 30+

Evaluation of Cost-Effectiveness and Value-for-Money of DCP-DN Design Method
Page 64
Annex C – TRH4 Structural Design Catalogue (Dry-Moderate Region)

Evaluation of Cost-Effectiveness and Value-for-Money of DCP-DN Design Method
Page 65
Annex D – ORN31 Design catalogue
Chart 1 – Granular Road base/Surface Dressing

Evaluation of Cost-Effectiveness and Value-for-Money of DCP-DN Design Method
Page 66
Annex E - Equilibrium to Optimum moisture content ratios (Emery, 1985)
Subgrade Subbase Base
Mean SD N Mean SD N Mean SD n
Arid
0.71 0.34 131 0.70 0.26 19 0.53 0.24 26
Cape (winter rain)
0.75 0.45 81 0.78 0.28 17 0.63 0.16 16
Cape (all year rain)
0.98 0.31 98 0.83 0.28 20 0.57 0.17 19
Transvaal (Im < 0)
0.94 0.29 894
Transvaal (Im > 0)
0.96 0.29 178
Natal (Im > 0)
1.05 0.34 52
Weighted Mean
0.92 0.75 0.58
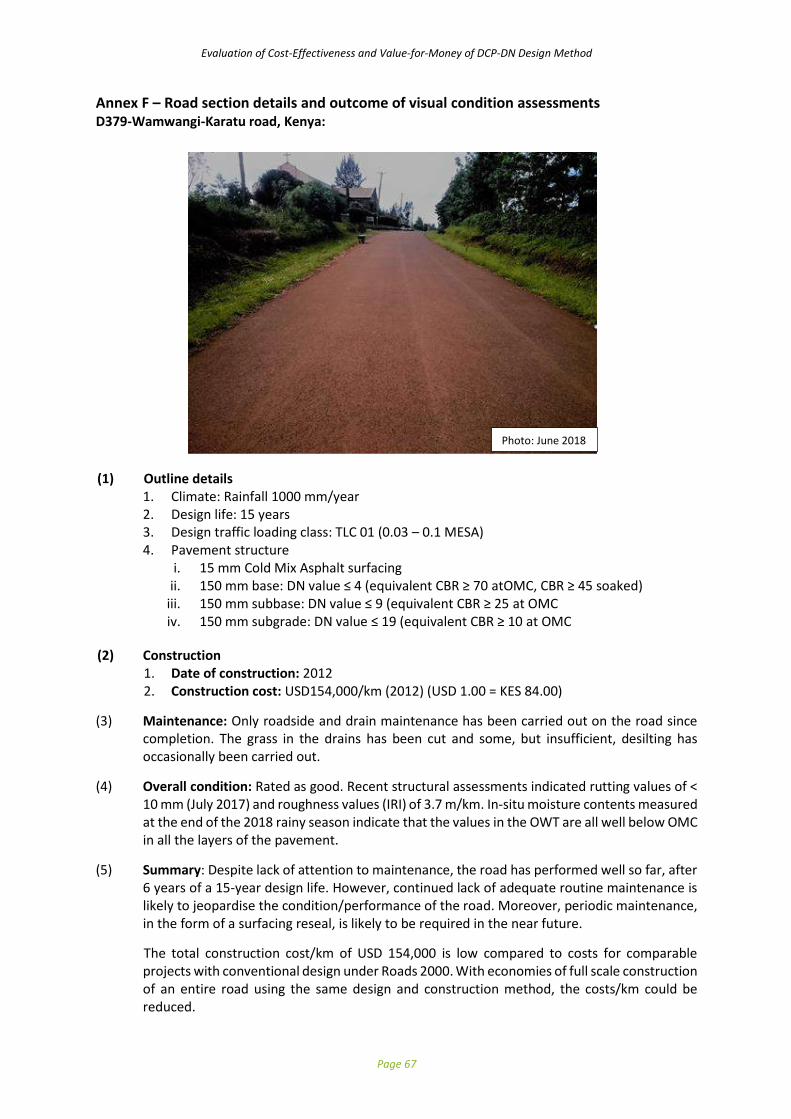
Evaluation of Cost-Effectiveness and Value-for-Money of DCP-DN Design Method
Page 67
Annex F – Road section details and outcome of visual condition assessments D379-Wamwangi-Karatu road, Kenya:
(1) Outline details 1. Climate: Rainfall 1000 mm/year 2. Design life: 15 years 3. Design traffic loading class: TLC 01 (0.03 – 0.1 MESA) 4. Pavement structure
i. 15 mm Cold Mix Asphalt surfacing ii. 150 mm base: DN value ≤ 4 (equivalent CBR ≥ 70 atOMC, CBR ≥ 45 soaked)
iii. 150 mm subbase: DN value ≤ 9 (equivalent CBR ≥ 25 at OMC iv. 150 mm subgrade: DN value ≤ 19 (equivalent CBR ≥ 10 at OMC
(2) Construction 1. Date of construction: 2012 2. Construction cost: USD154,000/km (2012) (USD 1.00 = KES 84.00)
(3) Maintenance: Only roadside and drain maintenance has been carried out on the road since
completion. The grass in the drains has been cut and some, but insufficient, desilting has occasionally been carried out.
(4) Overall condition: Rated as good. Recent structural assessments indicated rutting values of < 10 mm (July 2017) and roughness values (IRI) of 3.7 m/km. In-situ moisture contents measured at the end of the 2018 rainy season indicate that the values in the OWT are all well below OMC in all the layers of the pavement.
(5) Summary: Despite lack of attention to maintenance, the road has performed well so far, after
6 years of a 15-year design life. However, continued lack of adequate routine maintenance is likely to jeopardise the condition/performance of the road. Moreover, periodic maintenance, in the form of a surfacing reseal, is likely to be required in the near future. The total construction cost/km of USD 154,000 is low compared to costs for comparable projects with conventional design under Roads 2000. With economies of full scale construction of an entire road using the same design and construction method, the costs/km could be reduced.
Photo: June 2018

Evaluation of Cost-Effectiveness and Value-for-Money of DCP-DN Design Method
Page 68
Lawate - Kibongoto road, Tanzania
(1) Outline details
1. Climate: Wet - Rainfall > 1000 mm/year 2. Design life: 15 years 3. Design traffic loading class: TLC 0.03 (0.01 – 0.03 MESA) 4. Pavement structure
i. 19/9.5 mm Double Surface Dressing ii. 150 mm base: DN value ≤ 5.9 (equivalent CBR ≥ 25 atOMC)
iii. 150 mm subbase: DN value ≤ 14 (equivalent CBR ≥ 15 at OMC) iv. 150 mm subgrade: DN value ≤ 25 (equivalent CBR ≥ 7 at OMC)
(2) Construction 1. Date of construction: September, 2012. 2. Construction cost: USD 45,125/km/4m wide carriageway. Construction entailed
scarification and re-compaction of the existing gravel wearing course and importation of a base layer only. The equivalent cost based on the traditional design approach stipulated in the Tanzania Pavement and Materials Design manual was USD 61,125/km/4 m wide carriageway.
(3) Maintenance: Practically no maintenance has been carried out since construction of the road. This has resulted in significant vegetation growth in the drains and adjacent to the paved carriageway.
(4) Overall condition: Rated good. Structural assessments of the road indicated rutting values of
< 8 mm (April 2014) and roughness values (IRI) of 3.7 m/km (April, 2014.
(5). Summary: Despite lack of attention to maintenance, the road has performed well so far, after almost 6 years of a 15-year design life. However, continued lack of adequate routine maintenance is likely to jeopardise the condition/performance of the road. Moreover, periodic maintenance, in the form of a surfacing reseal, is likely to be required in the near future.
The average cost saving/km based on the DCP-DN method was of the order of USD 16,000/km/ 4m wide carriageway.
Photo: June 2018

Evaluation of Cost-Effectiveness and Value-for-Money of DCP-DN Design Method
Page 69
Danger Point road 4019, Western Cape, South Africa
(1) Outline details
1. Climate: Dry-Moderate: Rainfall < 1000 mm/year 2. Design life: 20 years 3. Design traffic loading class: TLC 0.3 (0.10- 0.30 MESA) 4. Pavement structure
i. 10 mm Single Surface Dressing + Sand Seal ii. 150 mm base: DN value ≤ 3.2 (equivalent CBR ≥ 90 at 0.75 OMC)
iii. 150 mm subbase: DN value ≤ 6 (equivalent CBR ≥ 45 at 0.75 OMC iv. 150 mm subgrade: DN value ≤ 12 (equivalent CBR ≥ 12 at 0.75 OMC
(2) Construction
1. Date of construction: May 2003 2. Construction cost: Rand 241,530 (USD 32,250)/km/5m wide carriageway. Construction
entailed scarification and re-compaction of the existing gravel wearing course (soaked CBR 45) and then sealing the surface.
(3) Maintenance: Adequate routine maintenance has been carried out since construction of the
road. Periodic maintenance included a 7 mm Single Surface Dressing in 2014. (4) Overall condition: fair – Good based on a Visual Condition Survey carried out in 2015. (5). Summary: With adequate routine and periodic maintenance having being carried out since
construction, the road has performed well after 15 years of its 20-year design life. It is expected to easily be able to carry the design traffic 0.3 MESA without any significant failures in service.
Photo: June 2018

Evaluation of Cost-Effectiveness and Value-for-Money of DCP-DN Design Method
Page 70
Nelshoogte (R38 to Nelshoogte Sawmill)
(1) Outline details
1. Climate: Wet - Rainfall > 1000 mm/year 2. Design life: 20 years 3. Traffic loading class: 0.7 (0.30 – 0.70 MESA) 3. Pavement structure
i. 19/9.5 mm Double Surface Dressing ii. 150 mm base: DN value ≤ 2.6 (equivalent CBR ≥ 120 atOMC) iii. 150 mm subbase: DN value ≤ 4.6 (equivalent CBR ≥ 60 at OMC iv. 150 mm subgrade: DN value ≤ 8 (equivalent CBR ≥ 20 at OMC
(2) Construction 1. Date of construction: 1990 2. Construction cost: Rand 60,000/km (USD 22,960.00). Construction entailed scarification
and re-compaction of the existing gravel wearing course (soaked CBR 45) and importation of base layer as above.
(3) Maintenance: Practically no maintenance has been carried out since construction of the road.
This has resulted in significant vegetation growth in the drains and adjacent to the paved carriageway.
(4) Overall condition: Good (5). Summary: After more than 27 years in service, the road has performed remarkably well. It has
carried an estimated 0.8 – 1.0 MESA which is in excess of its design traffic loading of 0.7 MESA and has served well in excess of its design life of 20 years.
Photo: June 2018
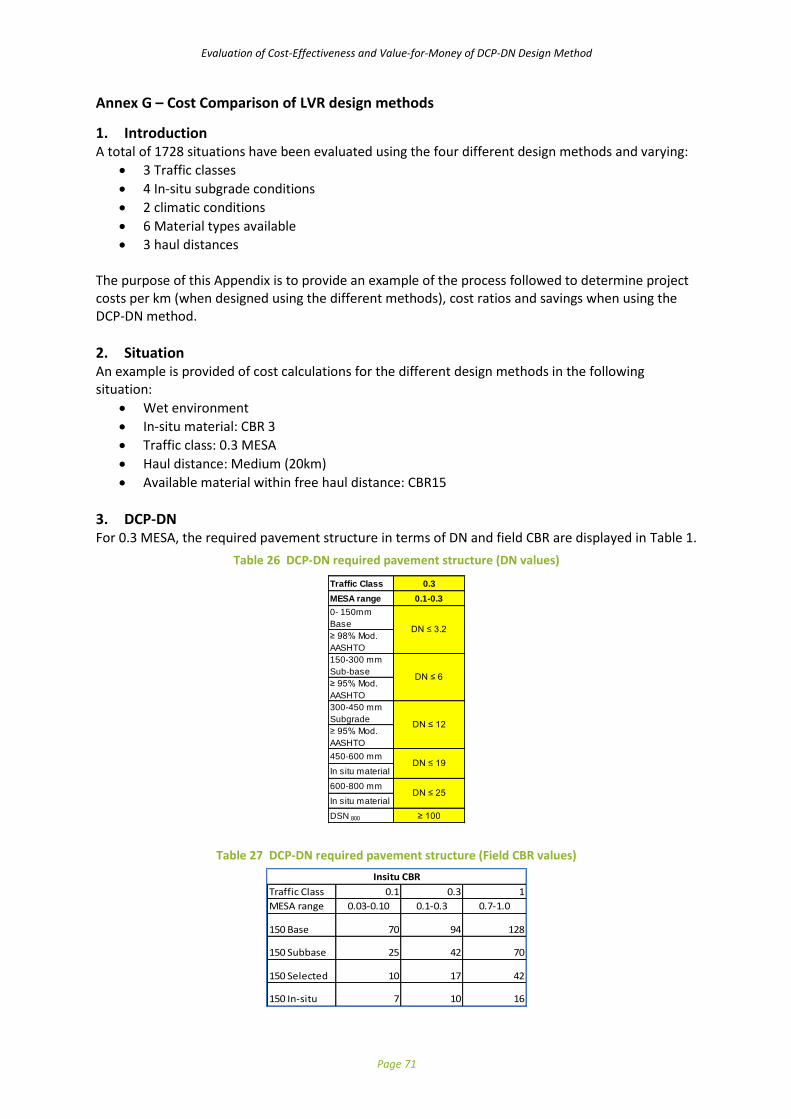
Evaluation of Cost-Effectiveness and Value-for-Money of DCP-DN Design Method
Page 71
Annex G – Cost Comparison of LVR design methods
1. Introduction A total of 1728 situations have been evaluated using the four different design methods and varying:
• 3 Traffic classes
• 4 In-situ subgrade conditions
• 2 climatic conditions
• 6 Material types available
• 3 haul distances The purpose of this Appendix is to provide an example of the process followed to determine project costs per km (when designed using the different methods), cost ratios and savings when using the DCP-DN method.
2. Situation An example is provided of cost calculations for the different design methods in the following situation:
• Wet environment
• In-situ material: CBR 3
• Traffic class: 0.3 MESA
• Haul distance: Medium (20km)
• Available material within free haul distance: CBR15
3. DCP-DN For 0.3 MESA, the required pavement structure in terms of DN and field CBR are displayed in Table 1.
Table 26 DCP-DN required pavement structure (DN values)
Table 27 DCP-DN required pavement structure (Field CBR values)
Traffic Class 0.3
MESA range 0.1-0.3
0- 150mm
Base
≥ 98% Mod.
AASHTO
150-300 mm
Sub-base
≥ 95% Mod.
AASHTO
300-450 mm
Subgrade
≥ 95% Mod.
AASHTO
450-600 mm
In situ material
600-800 mm
In situ material
DSN 800 ≥ 100
DN ≤ 19
DN ≤ 25
DN ≤ 6
DN ≤ 12
DN ≤ 3.2
Traffic Class 0.1 0.3 1
MESA range 0.03-0.10 0.1-0.3 0.7-1.0
150 Base 70 94 128
150 Subbase 25 42 70
150 Selected 10 17 42
150 In-situ 7 10 16
Insitu CBR

Evaluation of Cost-Effectiveness and Value-for-Money of DCP-DN Design Method
Page 72
For purposes of cost calculation and comparison with other design methods, the required material for each layer in terms of soaked CBR is determined after estimating the moisture content under which the layer will operate. From Emery, 1985, the base will operate at approximately 0.63 of OMC and the subbase, with adequate drainage at close to 0.75 of OMC.
If a slightly conservative approach is adopted, it could be assumed that both the base and subbase will operate at approximately 0.75 of OMC. The subgrade varies between 0.75 of OMC and OMC, which relates to the “Dry condition” in Emery’s table. Converting the required field CBR at 0.75 OMC to the estimated soaked CBR values, using Emery’s conversion table, results in the pavement structure (soaked CBR) as shown in Error! Reference source not found..
Table 28 Required pavement structure in terms of soaked CBR (Based on Emery)
DCP-DN (Wet)
Moisture % Required Soaked CBR
Class OMC Layer 0.1 0.3 1
Moderate 0.75 150 Base 150 G13 150 G24 150 G47
Moderate 0.75 150 Subbase 150 G5 150 G13
Dry 150 Selected 150 G10
Using the Paige-Green and Lea conversion table (Paige-Green et al, 1999) results in a more conservative (stronger) pavement structure, as shown in Table 29.
Table 29 Required pavement structure in terms of soaked CBR (Based on Paige-Green)
DCP-DN (Wet)
Moisture % Required Soaked CBR
Class OMC Layer 0.1 0.3 1
Moderate 0.75 150 Base 150 G15 150 G31 150 G60
Moderate 0.75 150 Subbase 150 G5 150 G15
Dry 150 Selected 150 G12

Evaluation of Cost-Effectiveness and Value-for-Money of DCP-DN Design Method
Page 73
Taking an even more conservative approach and assuming that both the base and subbase layers will operate at OMC results in much stronger pavement structures as shown in Table 30.
Table 30 Required pavement structure if base and subbase operate at OMC
In this particular case, for 0.3 MESA and the existing subgrade material being CBR=3, two layers must be imported namely:
a) 150mm subbase layer of minimum CBR=14. Available within free-haul distance is a material with soaked CBR=15
b) 150mm base layer of minimum CBR=76. Medium haul distance of material with soaked CBR of 80 selected
Table 31 Required pavement structures for a range of in-situ subgrades
The costs per layer, incorporating material (ex borrow pit), load and 1km free haul, haul costs (20km in this case) and processing for each layer are calculated. Note: the cost values are in South African Rand and only converted to USD for final reporting.
Moisture %
Class OMC Layer 0.1 0.3 1
Damp 1 150 Base 150 G47 150 G76 150 G123
Damp 1 150 Subbase 150 G5 150 G14 150 G47
Wet 150 Selected 150 G12
DCP-DN (Wet)
Required Soaked CBR
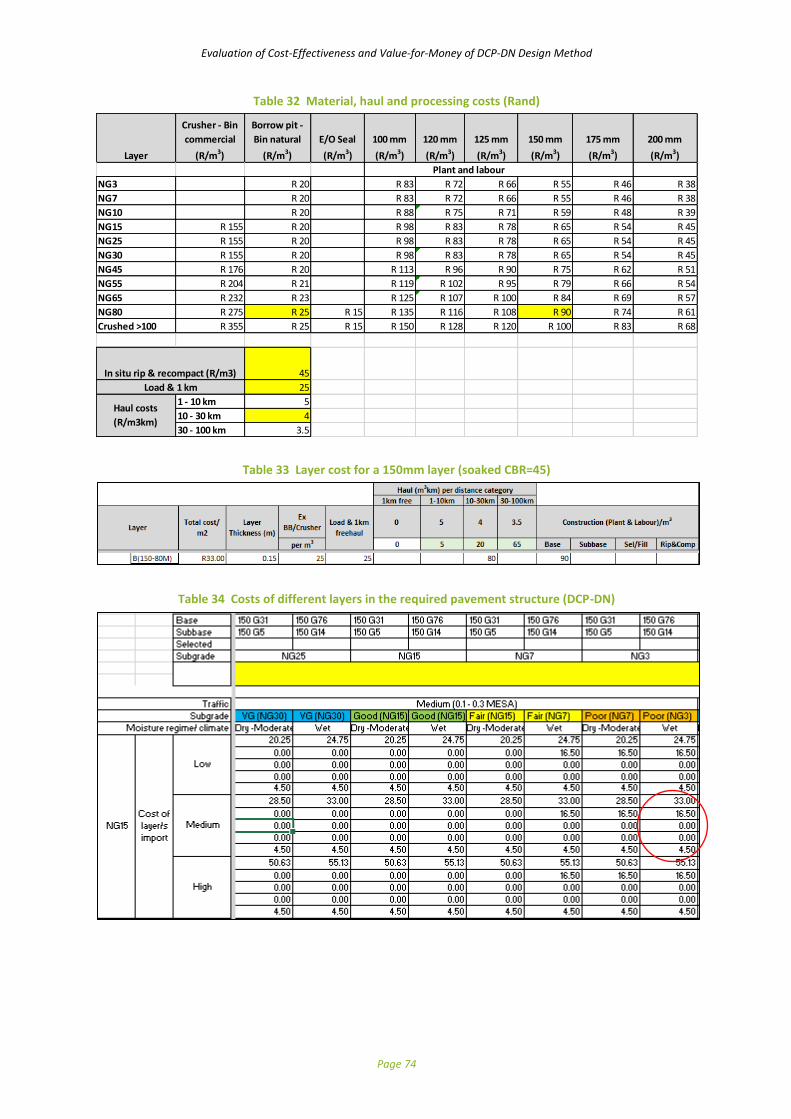
Evaluation of Cost-Effectiveness and Value-for-Money of DCP-DN Design Method
Page 74
Table 32 Material, haul and processing costs (Rand)
Table 33 Layer cost for a 150mm layer (soaked CBR=45)
Table 34 Costs of different layers in the required pavement structure (DCP-DN)
Layer
Crusher - Bin
commercial
(R/m3)
Borrow pit -
Bin natural
(R/m3)
E/O Seal
(R/m3)
100 mm
(R/m3)
120 mm
(R/m3)
125 mm
(R/m3)
150 mm
(R/m3)
175 mm
(R/m3)
200 mm
(R/m3)
NG3 R 20 R 83 R 72 R 66 R 55 R 46 R 38
NG7 R 20 R 83 R 72 R 66 R 55 R 46 R 38
NG10 R 20 R 88 R 75 R 71 R 59 R 48 R 39
NG15 R 155 R 20 R 98 R 83 R 78 R 65 R 54 R 45
NG25 R 155 R 20 R 98 R 83 R 78 R 65 R 54 R 45
NG30 R 155 R 20 R 98 R 83 R 78 R 65 R 54 R 45
NG45 R 176 R 20 R 113 R 96 R 90 R 75 R 62 R 51
NG55 R 204 R 21 R 119 R 102 R 95 R 79 R 66 R 54
NG65 R 232 R 23 R 125 R 107 R 100 R 84 R 69 R 57
NG80 R 275 R 25 R 15 R 135 R 116 R 108 R 90 R 74 R 61
Crushed >100 R 355 R 25 R 15 R 150 R 128 R 120 R 100 R 83 R 68
45
25
1 - 10 km 5
10 - 30 km 4
30 - 100 km 3.5
Plant and labour
Haul costs
(R/m3km)
In situ rip & recompact (R/m3)
Load & 1 km

Evaluation of Cost-Effectiveness and Value-for-Money of DCP-DN Design Method
Page 75
4. TRH4 The pavement structure for the given traffic class and wet environment is selected from the TRH4 catalogue as shown in Table 35.
Table 35 Required pavement structure according to TRH4 design
Similar to the process described under DN-DCP, the cost for each layer is calculated.
Table 36 Costs of different layers in the required pavement structure (TRH4)
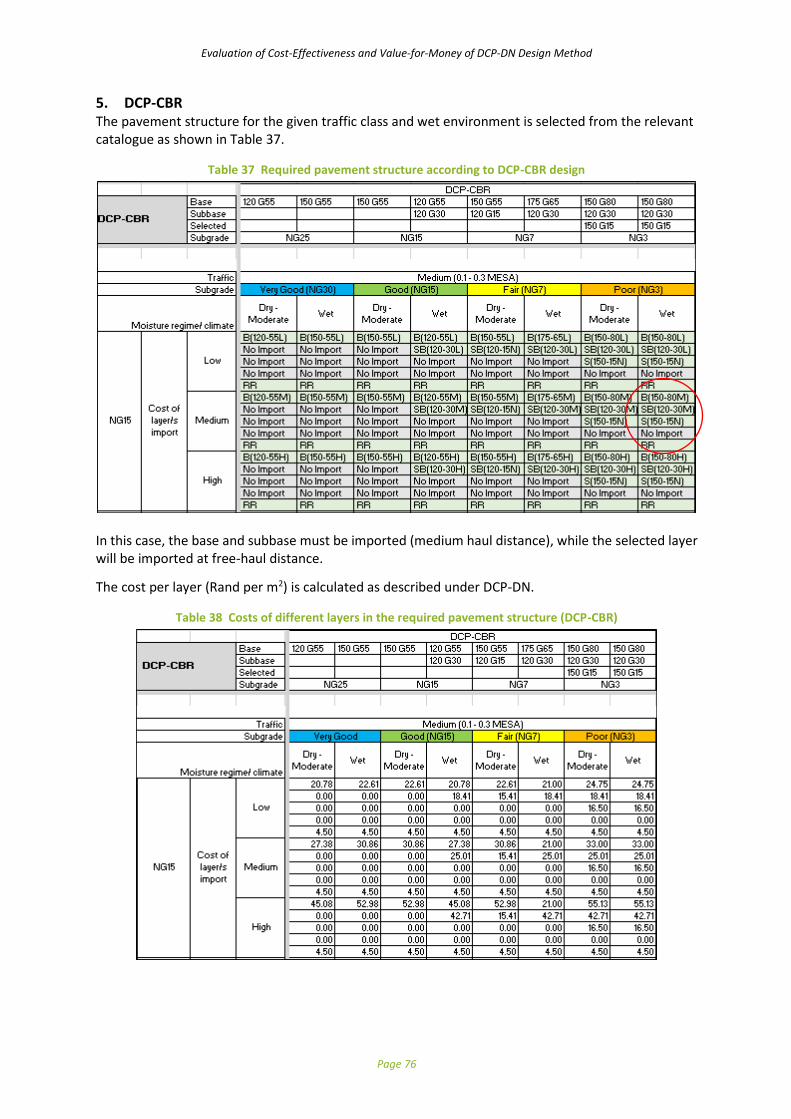
Evaluation of Cost-Effectiveness and Value-for-Money of DCP-DN Design Method
Page 76
5. DCP-CBR The pavement structure for the given traffic class and wet environment is selected from the relevant catalogue as shown in Table 37.
Table 37 Required pavement structure according to DCP-CBR design
In this case, the base and subbase must be imported (medium haul distance), while the selected layer will be imported at free-haul distance. The cost per layer (Rand per m2) is calculated as described under DCP-DN.
Table 38 Costs of different layers in the required pavement structure (DCP-CBR)

Evaluation of Cost-Effectiveness and Value-for-Money of DCP-DN Design Method
Page 77
6. ORN31 In the case of ORN31, the required pavement structure is dependent on the selected subgrade class. The required pavement structures for 0.3 MESA and layer costs are shown in Table 39
Table 39 Required pavement structure according to ORN31 design
Table 40 Costs of different layers in the required pavement structure (ORN31)

Evaluation of Cost-Effectiveness and Value-for-Money of DCP-DN Design Method
Page 78
7. Cost comparison
a) Pavement layer costs The total pavement layer costs are calculated for each design method as shown in Table 41.
Table 41 Summary of pavement layer cost in Rand per m2
All costs are then converted to USD as shown inTable 42.
Table 42 Summary of pavement layer costs in USD per km
b) Project costs Total project costs comprise several additional items in addition to the pavement layer costs. The costs of the additional items, as estimated and shown in Table 43, are added to the pavement layer costs to obtain the total project costs as shown in Table 44.

Evaluation of Cost-Effectiveness and Value-for-Money of DCP-DN Design Method
Page 79
Table 43 Cost items additional to pavement layers
Table 44 Summary of project costs per km
The information for the wet environment is presented in a graphical format for different traffic classes and subgrade conditions in Figure 11, Figure 12 and Figure 13. The information for the dry-moderate environment is presented in a graphical format for different traffic classes and subgrade conditions in Figure 14, Figure 15 and Figure 16.
Establishment 8,200
Traffic accommodation 2,000
Clear & Grub 4,100
Earthworks 30,000
Drainage & structures 12,000
Pavement layers
Surfacing 15,000
Ancillary works 8,200
79,500
Profit add 5% 3,975 83,475
Contingencies add 10% 8,348 91,823
VAT add 15% 13,773
Total excluded Pavement layers 105,596
Project cost calculation
Cost of pavement layers plus profit, contingecies and VAT added to this total to obtain values in "Project Cost" spreadsheet
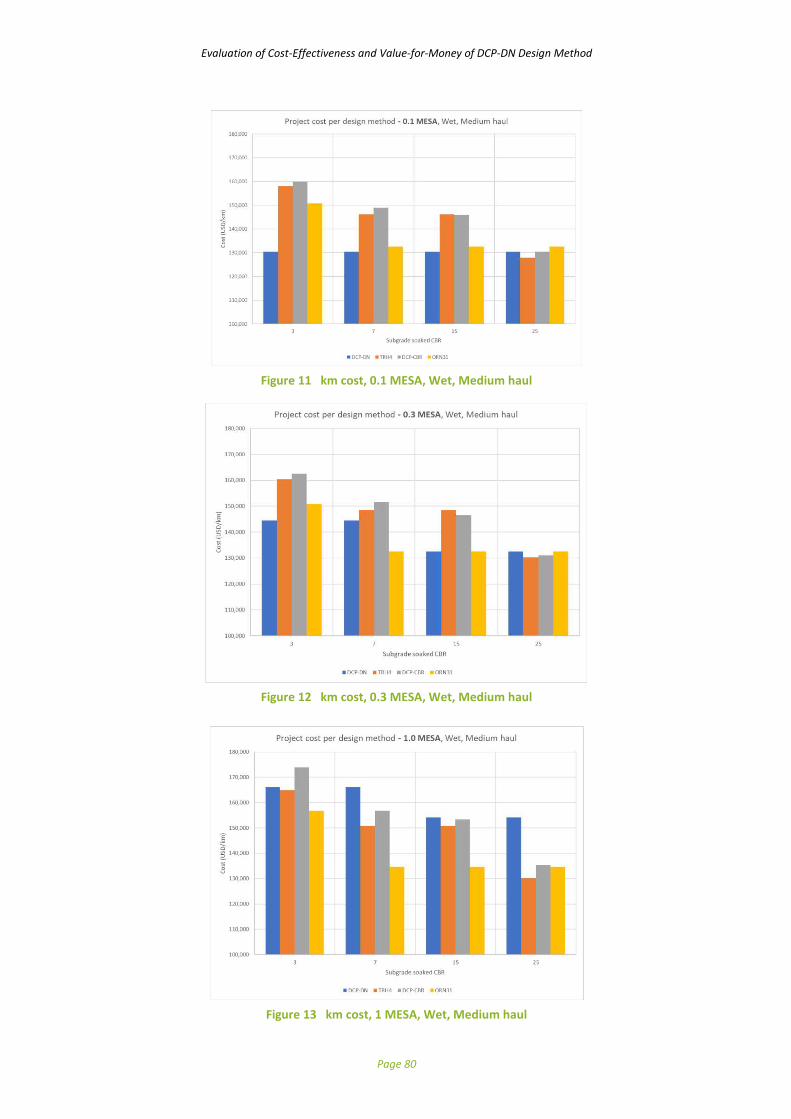
Evaluation of Cost-Effectiveness and Value-for-Money of DCP-DN Design Method
Page 80
Figure 11 km cost, 0.1 MESA, Wet, Medium haul
Figure 12 km cost, 0.3 MESA, Wet, Medium haul
Figure 13 km cost, 1 MESA, Wet, Medium haul

Evaluation of Cost-Effectiveness and Value-for-Money of DCP-DN Design Method
Page 81
Figure 14 km cost, 0.1 MESA, Dry-Moderate, Medium haul
Figure 15 km cost, 0.3 MESA, Dry-Moderate, Medium haul
Figure 16 km cost, 1.0 MESA, Dry-Moderate, Medium haul

Evaluation of Cost-Effectiveness and Value-for-Money of DCP-DN Design Method
Page 82
c) Cost ratios The ratio, relative to the project costs (as per DCP-DN design) is calculated for each scenario as shown in Table 45. For the particular scenario, ORN31 results in 4% additional costs whereas TRH4 and DCP-CBR result respectively in 11% and 12% additional costs
Table 45 Project cost ratios
d) Cost savings Project cost savings by using the DCP-DN design method have been calculated, based on the calculated pavement layer costs and estimated additional cost items as discussed under Section b). (See Table 46)
Table 46 Project cost savings per km

Evaluation of Cost-Effectiveness and Value-for-Money of DCP-DN Design Method
Page 83
Annex H – Pavement Costs and Cost Ratios, Project Cost and Cost ratios and Project Cost Savings/km)
(1) Pavement Costs
Good (S6) Good (S6) Good (S6) Good (S6) Fair (S6) Fair (S6) Poor (S5) Poor S4) Good (S6) Good (S6) Good (S6) Good (S6) Fair (S6) Fair (S6) Poor (S5) Poor S4) Good (S6) Good (S6) Good (S6) Good (S6) Fair (S6) Fair (S6) Poor (S5) Poor S4)
VG (NG30) VG (NG30) VG (NG30) VG (NG30) VG (NG30) VG (NG30)
Dry -Moderate Wet Dry -Moderate Wet Dry -Moderate Wet Dry -Moderate Wet Dry -Moderate Wet Dry -Moderate Wet Dry -Moderate Wet Dry -Moderate Wet Dry -Moderate Wet Dry -Moderate Wet Dry -Moderate Wet Dry -Moderate Wet
DCP-DN 2 438 12 188 2 438 12 188 11 375 12 188 11 375 12 188 11 375 13 813 11 375 13 813 11 375 22 750 20 313 22 750 13 116 23 563 13 116 23 563 22 054 32 500 30 991 32 500
TRH4 12 458 12 458 20 786 20 786 20 786 20 786 29 724 29 724 13 135 13 135 21 464 21 464 21 464 21 464 30 401 30 401 13 135 13 135 22 073 22 073 22 073 22 073 31 010 31 688
DCP-CBR 11 620 12 188 12 188 19 967 20 535 21 000 29 183 29 183 12 070 12 652 12 652 20 418 21 000 21 870 31 098 31 098 13 116 13 749 21 464 22 097 22 054 23 390 35 212 35 212
ORN31 13 813 13 813 13 813 13 813 13 813 13 813 21 531 22 141 13 813 13 813 13 813 13 813 13 813 13 813 21 531 22 141 14 229 14 229 14 229 14 229 14 229 14 229 21 948 23 390
DCP-DN 2 438 14 219 2 438 14 219 11 375 14 219 11 375 14 219 13 406 15 844 13 406 15 844 13 406 24 781 22 344 24 781 15 147 27 625 15 147 27 625 24 085 36 563 33 022 36 563
TRH4 13 813 13 813 23 833 23 833 23 833 23 833 32 771 32 771 14 828 14 828 24 849 24 849 24 849 24 849 33 786 33 786 14 828 14 828 25 797 25 797 25 797 25 797 34 734 35 750
DCP-CBR 13 245 14 219 14 219 23 217 22 567 24 656 32 839 32 839 13 695 14 683 14 683 23 668 23 031 25 865 34 754 34 754 15 147 16 458 25 120 26 430 26 116 28 130 40 290 40 290
ORN31 15 844 15 844 15 844 15 844 15 844 15 844 24 917 25 865 15 844 15 844 15 844 15 844 15 844 15 844 24 917 25 865 16 599 16 599 16 599 16 599 16 599 16 599 25 672 28 130
DCP-DN 2 438 18 688 2 438 18 688 11 375 18 688 11 375 18 688 17 875 20 313 17 875 20 313 17 875 29 250 26 813 29 250 19 616 36 563 19 616 36 563 28 554 45 500 37 491 45 500
TRH4 16 792 16 792 30 536 30 536 30 536 30 536 39 474 39 474 18 552 18 552 32 297 32 297 32 297 32 297 41 234 41 234 18 552 18 552 33 990 33 990 33 990 33 990 42 927 44 688
DCP-CBR 16 820 18 688 18 688 30 367 27 035 32 700 40 883 40 883 17 270 19 152 19 152 30 818 27 500 34 654 42 798 42 798 19 616 22 416 33 164 35 964 35 054 38 557 51 462 51 462
ORN31 20 313 20 313 20 313 20 313 20 313 20 313 32 365 34 057 20 313 20 313 20 313 20 313 20 313 20 313 32 365 34 057 21 813 21 813 21 813 21 813 21 813 21 813 33 865 38 557
DCP-DN 2 438 30 672 2 438 30 672 11 375 30 672 11 375 30 672 29 859 32 297 29 859 32 297 29 859 41 234 38 797 41 234 31 600 60 531 31 600 60 531 40 538 69 469 49 475 69 469
TRH4 24 781 24 781 48 513 48 513 48 513 48 513 57 451 57 451 28 539 28 539 52 271 52 271 52 271 52 271 61 208 61 208 28 539 28 539 55 961 55 961 55 961 55 961 64 898 68 656
DCP-CBR 26 407 30 672 30 672 49 542 39 020 54 272 62 455 62 455 26 857 31 136 31 136 49 993 39 484 58 223 64 370 64 370 31 600 38 395 54 736 61 530 59 022 66 520 81 423 81 423
ORN31 32 297 32 297 32 297 32 297 32 297 32 297 52 339 56 029 32 297 32 297 32 297 32 297 32 297 32 297 52 339 56 029 35 794 35 794 35 794 35 794 35 794 35 794 55 836 66 520
DCP-DN 2 438 12 188 2 438 12 188 11 375 12 188 11 375 12 188 11 375 13 813 11 375 13 813 11 375 22 750 20 313 22 750 13 116 23 563 13 116 23 563 22 054 32 500 30 991 32 500
TRH4 12 458 12 458 20 786 20 786 20 786 20 786 29 724 29 724 13 135 13 135 21 464 21 464 21 464 21 464 30 401 30 401 13 135 13 135 22 073 22 073 22 073 22 073 31 010 31 688
DCP-CBR 11 620 12 188 12 188 19 967 20 535 21 000 29 183 29 183 12 070 12 652 12 652 20 418 21 000 21 870 31 098 31 098 13 116 13 749 21 464 22 097 22 054 23 390 35 212 35 212
ORN31 13 813 13 813 13 813 13 813 13 813 13 813 21 531 22 141 13 813 13 813 13 813 13 813 13 813 13 813 21 531 22 141 14 229 14 229 14 229 14 229 14 229 14 229 21 948 23 390
DCP-DN 2 438 14 219 2 438 14 219 11 375 14 219 11 375 14 219 11 375 15 844 11 375 15 844 11 375 24 781 20 313 24 781 15 147 27 625 15 147 27 625 24 085 36 563 33 022 36 563
TRH4 13 813 13 813 22 141 22 141 22 141 22 141 31 078 31 078 14 828 14 828 23 156 23 156 23 156 23 156 32 094 32 094 14 828 14 828 23 766 23 766 23 766 23 766 32 703 33 719
DCP-CBR 13 245 14 219 14 219 21 592 22 567 23 031 31 214 31 214 13 695 14 683 14 683 22 043 23 031 24 240 33 129 33 129 15 147 16 458 23 495 24 805 24 085 26 099 37 920 37 920
ORN31 15 844 15 844 15 844 15 844 15 844 15 844 23 563 24 172 15 844 15 844 15 844 15 844 15 844 15 844 23 563 24 172 16 599 16 599 16 599 16 599 16 599 16 599 24 318 26 099
DCP-DN 2 438 18 688 2 438 18 688 11 375 18 688 11 375 18 688 11 375 20 313 11 375 20 313 11 375 29 250 20 313 29 250 19 616 36 563 19 616 36 563 28 554 45 500 37 491 45 500
TRH4 16 792 16 792 25 120 25 120 25 120 25 120 34 057 34 057 18 552 18 552 26 880 26 880 26 880 26 880 35 818 35 818 18 552 18 552 27 490 27 490 27 490 27 490 36 427 38 188
DCP-CBR 16 820 18 688 18 688 25 167 27 035 27 500 35 683 35 683 17 270 19 152 19 152 25 618 27 500 29 454 37 598 37 598 19 616 22 416 27 964 30 764 28 554 32 057 43 879 43 879
ORN31 20 313 20 313 20 313 20 313 20 313 20 313 28 031 28 641 20 313 20 313 20 313 20 313 20 313 20 313 28 031 28 641 21 813 21 813 21 813 21 813 21 813 21 813 29 531 32 057
DCP-DN 2 438 30 672 2 438 30 672 11 375 30 672 11 375 30 672 11 375 32 297 11 375 32 297 11 375 41 234 20 313 41 234 31 600 60 531 31 600 60 531 40 538 69 469 49 475 69 469
TRH4 24 781 24 781 33 109 33 109 33 109 33 109 42 047 42 047 28 539 28 539 36 867 36 867 36 867 36 867 45 805 45 805 28 539 28 539 36 867 36 867 36 867 36 867 45 805 49 563
DCP-CBR 26 407 30 672 30 672 34 755 39 020 39 484 47 667 47 667 26 857 31 136 31 136 35 205 39 484 43 435 49 582 49 582 31 600 38 395 39 948 46 743 40 538 48 036 59 858 59 858
ORN31 32 297 32 297 32 297 32 297 32 297 32 297 40 016 40 625 32 297 32 297 32 297 32 297 32 297 32 297 40 016 40 625 35 794 35 794 35 794 35 794 35 794 35 794 43 513 48 036
DCP-DN 2 438 12 188 2 438 12 188 11 375 12 188 11 375 12 188 11 375 13 813 11 375 13 813 11 375 22 750 20 313 22 750 13 116 23 563 13 116 23 563 22 054 32 500 30 991 32 500
TRH4 12 458 12 458 20 786 20 786 20 786 20 786 29 724 29 724 13 135 13 135 21 464 21 464 21 464 21 464 30 401 30 401 13 135 13 135 22 073 22 073 22 073 22 073 31 010 31 688
DCP-CBR 11 620 12 188 12 188 19 967 20 535 21 000 29 183 29 183 12 070 12 652 12 652 20 418 21 000 21 870 31 098 31 098 13 116 13 749 21 464 22 097 22 054 23 390 35 212 35 212
ORN31 13 813 13 813 13 813 13 813 13 813 13 813 21 531 22 141 13 813 13 813 13 813 13 813 13 813 13 813 21 531 22 141 14 229 14 229 14 229 14 229 14 229 14 229 21 948 23 390
DCP-DN 2 438 14 219 2 438 14 219 11 375 14 219 11 375 14 219 11 375 15 844 11 375 15 844 11 375 24 781 20 313 24 781 15 147 27 625 15 147 27 625 24 085 36 563 33 022 36 563
TRH4 13 813 13 813 22 141 22 141 22 141 22 141 31 078 31 078 14 828 14 828 23 156 23 156 23 156 23 156 32 094 32 094 14 828 14 828 23 766 23 766 23 766 23 766 32 703 33 719
DCP-CBR 11 620 12 188 12 188 19 967 20 535 23 031 31 214 31 214 13 695 14 683 14 683 22 043 23 031 24 240 33 129 33 129 15 147 16 458 23 495 24 805 24 085 26 099 37 920 37 920
ORN31 15 844 15 844 15 844 15 844 15 844 15 844 23 563 24 172 15 844 15 844 15 844 15 844 15 844 15 844 23 563 24 172 16 599 16 599 16 599 16 599 16 599 16 599 24 318 26 099
DCP-DN 2 438 18 688 2 438 18 688 11 375 18 688 11 375 18 688 11 375 20 313 11 375 20 313 11 375 29 250 20 313 29 250 19 616 36 563 19 616 36 563 28 554 45 500 37 491 45 500
TRH4 16 792 16 792 25 120 25 120 25 120 25 120 34 057 34 057 18 552 18 552 26 880 26 880 26 880 26 880 35 818 35 818 18 552 18 552 27 490 27 490 27 490 27 490 36 427 38 188
DCP-CBR 11 620 12 188 12 188 19 967 20 535 27 500 35 683 35 683 17 270 19 152 19 152 25 618 27 500 29 454 37 598 37 598 19 616 22 416 27 964 30 764 28 554 32 057 43 879 43 879
ORN31 20 313 20 313 20 313 20 313 20 313 20 313 28 031 28 641 20 313 20 313 20 313 20 313 20 313 20 313 28 031 28 641 21 813 21 813 21 813 21 813 21 813 21 813 29 531 32 057
DCP-DN 2 438 30 672 2 438 30 672 11 375 30 672 11 375 30 672 11 375 32 297 11 375 32 297 11 375 41 234 20 313 41 234 31 600 60 531 31 600 60 531 40 538 69 469 49 475 69 469
TRH4 24 781 24 781 33 109 33 109 33 109 33 109 42 047 42 047 28 539 28 539 36 867 36 867 36 867 36 867 45 805 45 805 28 539 28 539 36 867 36 867 36 867 36 867 45 805 49 563
DCP-CBR 11 620 12 188 12 188 19 967 20 535 39 484 47 667 47 667 26 857 31 136 31 136 35 205 39 484 43 435 49 582 49 582 31 600 38 395 39 948 46 743 40 538 48 036 59 858 59 858
ORN31 32 297 32 297 32 297 32 297 32 297 32 297 40 016 40 625 32 297 32 297 32 297 32 297 32 297 32 297 40 016 40 625 35 794 35 794 35 794 35 794 35 794 35 794 43 513 48 036
High
Summary of pavement costs
Traffic
Fair (NG7) Poor (NG3) Good (NG15) Fair (NG7) Poor (NG3)
Low (< 0.1 MESA) Medium (0.1 - 0.3 MESA) High (0.3 - 1.0 MESA)
ORN31 subgrade class
Subgrade Good (NG15) Fair (NG7)
Climate
Low
NG15
Cost of
layer/s
import
Zero
Haulage
NG25/30
Cost of
layer/s
import
Zero
Haulage
NG45
Cost of
layer/s
import
Zero
Haulage
Medium
USD per km of 6.5m wide
Ava
ilab
le m
ater
ials
/ Fr
ee h
aul
Low
Poor (NG3) Good (NG15)
High
Medium
High
Low
Medium

Evaluation of Cost-Effectiveness and Value-for-Money of DCP-DN Design Method
Page 84
(2) Pavement Costs (Cont’d)
Good (S6) Good (S6) Good (S6) Good (S6) Fair (S6) Fair (S6) Poor (S5) Poor S4) Good (S6) Good (S6) Good (S6) Good (S6) Fair (S6) Fair (S6) Poor (S5) Poor S4) Good (S6) Good (S6) Good (S6) Good (S6) Fair (S6) Fair (S6) Poor (S5) Poor S4)
VG (NG30) VG (NG30) VG (NG30) VG (NG30) VG (NG30) VG (NG30)
Dry -Moderate Wet Dry -Moderate Wet Dry -Moderate Wet Dry -Moderate Wet Dry -Moderate Wet Dry -Moderate Wet Dry -Moderate Wet Dry -Moderate Wet Dry -Moderate Wet Dry -Moderate Wet Dry -Moderate Wet Dry -Moderate Wet
DCP-DN 2 438 12 188 2 438 12 188 11 375 12 188 11 375 12 188 11 375 13 813 11 375 13 813 11 375 22 750 20 313 22 750 13 116 23 563 13 116 23 563 22 054 32 500 30 991 32 500
TRH4 12 458 12 458 20 786 20 786 20 786 20 786 29 724 29 724 13 135 13 135 21 464 21 464 21 464 21 464 30 401 30 401 13 135 13 135 22 073 22 073 22 073 22 073 31 010 31 688
DCP-CBR 11 620 12 188 12 188 19 967 20 535 21 000 29 183 29 183 12 070 12 652 12 652 20 418 21 000 21 870 31 098 31 098 13 116 13 749 21 464 22 097 22 054 23 390 35 212 35 212
ORN31 13 813 13 813 13 813 13 813 13 813 13 813 21 531 22 141 13 813 13 813 13 813 13 813 13 813 13 813 21 531 22 141 14 229 14 229 14 229 14 229 14 229 14 229 21 948 23 390
DCP-DN 2 438 12 188 2 438 12 188 11 375 12 188 11 375 12 188 11 375 15 844 11 375 15 844 11 375 24 781 20 313 24 781 15 147 25 594 15 147 25 594 24 085 34 531 33 022 34 531
TRH4 13 813 13 813 22 141 22 141 22 141 22 141 31 078 31 078 14 828 14 828 23 156 23 156 23 156 23 156 32 094 32 094 14 828 14 828 23 766 23 766 23 766 23 766 32 703 33 719
DCP-CBR 11 620 12 188 12 188 19 967 20 535 21 000 31 214 31 214 12 070 12 652 12 652 20 418 21 000 24 240 33 129 33 129 15 147 16 458 23 495 24 805 24 085 26 099 37 920 37 920
ORN31 15 844 15 844 15 844 15 844 15 844 15 844 23 563 24 172 15 844 15 844 15 844 15 844 15 844 15 844 23 563 24 172 16 599 16 599 16 599 16 599 16 599 16 599 24 318 26 099
DCP-DN 2 438 12 188 2 438 12 188 11 375 12 188 11 375 12 188 11 375 20 313 11 375 20 313 11 375 29 250 20 313 29 250 19 616 30 063 19 616 30 063 28 554 39 000 37 491 39 000
TRH4 16 792 16 792 25 120 25 120 25 120 25 120 34 057 34 057 18 552 18 552 26 880 26 880 26 880 26 880 35 818 35 818 18 552 18 552 27 490 27 490 27 490 27 490 36 427 38 188
DCP-CBR 11 620 12 188 12 188 19 967 20 535 21 000 35 683 35 683 12 070 12 652 12 652 20 418 21 000 29 454 37 598 37 598 19 616 22 416 27 964 30 764 28 554 32 057 43 879 43 879
ORN31 20 313 20 313 20 313 20 313 20 313 20 313 28 031 28 641 20 313 20 313 20 313 20 313 20 313 20 313 28 031 28 641 21 813 21 813 21 813 21 813 21 813 21 813 29 531 32 057
DCP-DN 2 438 12 188 2 438 12 188 11 375 12 188 11 375 12 188 11 375 32 297 11 375 32 297 11 375 41 234 20 313 41 234 31 600 42 047 31 600 42 047 40 538 50 984 49 475 50 984
TRH4 24 781 24 781 33 109 33 109 33 109 33 109 42 047 42 047 28 539 28 539 36 867 36 867 36 867 36 867 45 805 45 805 28 539 28 539 36 867 36 867 36 867 36 867 45 805 49 563
DCP-CBR 11 620 12 188 12 188 19 967 20 535 21 000 47 667 47 667 12 070 12 652 12 652 20 418 21 000 43 435 49 582 49 582 31 600 38 395 39 948 46 743 40 538 48 036 59 858 59 858
ORN31 32 297 32 297 32 297 32 297 32 297 32 297 40 016 40 625 32 297 32 297 32 297 32 297 32 297 32 297 40 016 40 625 35 794 35 794 35 794 35 794 35 794 35 794 43 513 48 036
DCP-DN 2 438 12 188 2 438 12 188 11 375 12 188 11 375 12 188 11 375 13 813 11 375 13 813 11 375 22 750 20 313 22 750 13 116 23 563 13 116 23 563 22 054 32 500 30 991 32 500
TRH4 12 458 12 458 20 786 20 786 20 786 20 786 29 724 29 724 13 135 13 135 21 464 21 464 21 464 21 464 30 401 30 401 13 135 13 135 22 073 22 073 22 073 22 073 31 010 31 688
DCP-CBR 11 620 12 188 12 188 19 967 20 535 21 000 29 183 29 183 12 070 12 652 12 652 20 418 21 000 21 870 31 098 31 098 13 116 13 749 21 464 22 097 22 054 23 390 35 212 35 212
ORN31 13 813 13 813 13 813 13 813 13 813 13 813 21 531 22 141 13 813 13 813 13 813 13 813 13 813 13 813 21 531 22 141 14 229 14 229 14 229 14 229 14 229 14 229 21 948 23 390
DCP-DN 2 438 12 188 2 438 12 188 11 375 12 188 11 375 12 188 11 375 15 844 11 375 15 844 11 375 24 781 20 313 24 781 13 116 25 594 13 116 25 594 22 054 34 531 30 991 34 531
TRH4 13 813 13 813 22 141 22 141 22 141 22 141 31 078 31 078 23 156 23 156 23 156 23 156 23 156 23 156 32 094 32 094 14 828 14 828 23 766 23 766 23 766 23 766 32 703 33 719
DCP-CBR 11 620 12 188 12 188 19 967 20 535 21 000 29 183 29 183 12 070 12 652 12 652 20 418 21 000 21 870 33 129 33 129 13 116 13 749 21 464 22 097 22 054 26 099 37 920 37 920
ORN31 15 844 15 844 15 844 15 844 15 844 15 844 23 563 24 172 15 844 15 844 15 844 15 844 15 844 15 844 23 563 24 172 16 599 16 599 16 599 16 599 16 599 16 599 24 318 26 099
DCP-DN 2 438 12 188 2 438 12 188 11 375 12 188 11 375 12 188 11 375 20 313 11 375 20 313 11 375 29 250 20 313 29 250 13 116 30 063 13 116 30 063 22 054 39 000 30 991 39 000
TRH4 16 792 16 792 25 120 25 120 25 120 25 120 34 057 34 057 18 552 18 552 26 880 26 880 26 880 26 880 35 818 35 818 18 552 18 552 27 490 27 490 27 490 27 490 36 427 38 188
DCP-CBR 11 620 12 188 12 188 19 967 20 535 21 000 29 183 29 183 12 070 12 652 12 652 20 418 21 000 21 870 37 598 37 598 13 116 13 749 21 464 22 097 22 054 32 057 43 879 43 879
ORN31 20 313 20 313 20 313 20 313 20 313 20 313 28 031 28 641 20 313 20 313 20 313 20 313 20 313 20 313 28 031 28 641 21 813 21 813 21 813 21 813 21 813 21 813 29 531 32 057
DCP-DN 2 438 12 188 2 438 12 188 11 375 12 188 11 375 12 188 11 375 32 297 11 375 32 297 11 375 41 234 20 313 41 234 13 116 42 047 13 116 42 047 22 054 50 984 30 991 50 984
TRH4 24 781 24 781 33 109 33 109 33 109 33 109 42 047 42 047 28 539 28 539 36 867 36 867 36 867 36 867 45 805 45 805 28 539 28 539 36 867 36 867 36 867 36 867 45 805 49 563
DCP-CBR 11 620 12 188 12 188 19 967 20 535 21 000 29 183 29 183 12 070 12 652 12 652 20 418 21 000 21 870 49 582 49 582 13 116 13 749 21 464 22 097 22 054 48 036 59 858 59 858
ORN31 32 297 32 297 32 297 32 297 32 297 32 297 40 016 40 625 32 297 32 297 32 297 32 297 32 297 32 297 40 016 40 625 35 794 35 794 35 794 35 794 35 794 35 794 43 513 48 036
DCP-DN 2 438 12 188 2 438 12 188 11 375 12 188 11 375 12 188 11 375 13 813 11 375 13 813 11 375 22 750 20 313 22 750 13 116 23 563 13 116 23 563 22 054 32 500 30 991 32 500
TRH4 12 458 12 458 20 786 20 786 20 786 20 786 29 724 29 724 13 135 13 135 21 464 21 464 21 464 21 464 30 401 30 401 13 135 13 135 22 073 22 073 22 073 22 073 31 010 31 688
DCP-CBR 11 620 12 188 12 188 19 967 20 535 21 000 29 183 29 183 12 070 12 652 12 652 20 418 21 000 21 870 31 098 31 098 13 116 13 749 21 464 22 097 22 054 23 390 35 212 35 212
ORN31 13 813 13 813 13 813 13 813 13 813 13 813 21 531 22 141 13 813 13 813 13 813 13 813 13 813 13 813 21 531 22 141 14 229 14 229 14 229 14 229 14 229 14 229 21 948 23 390
DCP-DN 2 438 12 188 2 438 12 188 11 375 12 188 11 375 12 188 11 375 13 813 11 375 13 813 11 375 24 781 20 313 24 781 13 116 23 563 13 116 23 563 22 054 32 500 30 991 32 500
TRH4 12 458 12 458 21 599 21 599 21 599 21 599 30 536 30 536 13 135 13 135 22 276 22 276 22 276 22 276 31 214 31 214 13 135 13 135 22 885 22 885 22 885 22 885 31 823 32 500
DCP-CBR 11 620 12 188 12 188 19 967 20 535 21 000 29 183 29 183 12 070 12 652 12 652 20 418 21 000 21 870 31 098 31 098 13 116 13 749 21 464 22 097 22 054 23 390 35 212 35 212
ORN31 13 813 13 813 13 813 13 813 13 813 13 813 21 531 22 141 13 813 13 813 13 813 13 813 13 813 13 813 21 531 22 141 14 229 14 229 14 229 14 229 14 229 14 229 24 318 26 099
DCP-DN 2 438 12 188 2 438 12 188 11 375 12 188 11 375 12 188 11 375 13 813 11 375 13 813 11 375 29 250 20 313 29 250 13 116 23 563 13 116 23 563 22 054 32 500 30 991 32 500
TRH4 12 458 12 458 21 599 21 599 21 599 21 599 30 536 30 536 13 135 13 135 22 276 22 276 22 276 22 276 31 214 31 214 13 135 13 135 22 885 22 885 22 885 22 885 31 823 32 500
DCP-CBR 11 620 12 188 12 188 19 967 20 535 21 000 29 183 29 183 12 070 12 652 12 652 20 418 21 000 21 870 31 098 31 098 13 116 13 749 21 464 22 097 22 054 23 390 35 212 35 212
ORN31 13 813 13 813 13 813 13 813 13 813 13 813 21 531 22 141 13 813 13 813 13 813 13 813 13 813 13 813 21 531 22 141 14 229 14 229 14 229 14 229 14 229 14 229 21 948 23 390
DCP-DN 2 438 12 188 2 438 12 188 11 375 12 188 11 375 12 188 11 375 13 813 11 375 13 813 11 375 41 234 20 313 41 234 13 116 23 563 13 116 23 563 22 054 32 500 30 991 32 500
TRH4 12 458 12 458 21 599 21 599 21 599 21 599 30 536 30 536 22 276 22 276 22 276 22 276 22 276 22 276 31 214 31 214 13 135 13 135 22 885 22 885 22 885 22 885 31 823 32 500
DCP-CBR 11 620 12 188 12 188 19 967 20 535 21 000 29 183 29 183 12 070 12 652 12 652 20 418 21 000 21 870 31 098 31 098 13 116 13 749 21 464 22 097 22 054 23 390 35 212 35 212
ORN31 13 813 13 813 13 813 13 813 13 813 13 813 21 531 22 141 13 813 13 813 13 813 13 813 13 813 13 813 21 531 22 141 14 229 14 229 14 229 14 229 14 229 14 229 21 948 23 390
Summary of pavement costs
Traffic
Fair (NG7) Poor (NG3) Good (NG15) Fair (NG7) Poor (NG3)
Low (< 0.1 MESA) Medium (0.1 - 0.3 MESA) High (0.3 - 1.0 MESA)
ORN31 subgrade class
Subgrade Good (NG15) Fair (NG7)
Low
Medium
High
Climate
Low
Medium
High
NG55
Cost of
layer/s
import
Zero
Haulage
NG65
Cost of
layer/s
import
Zero
Haulage
NG80
Cost of
layer/s
import
Low
Medium
High
Zero
Haulage
USD per km of 6.5m wide
Poor (NG3) Good (NG15)
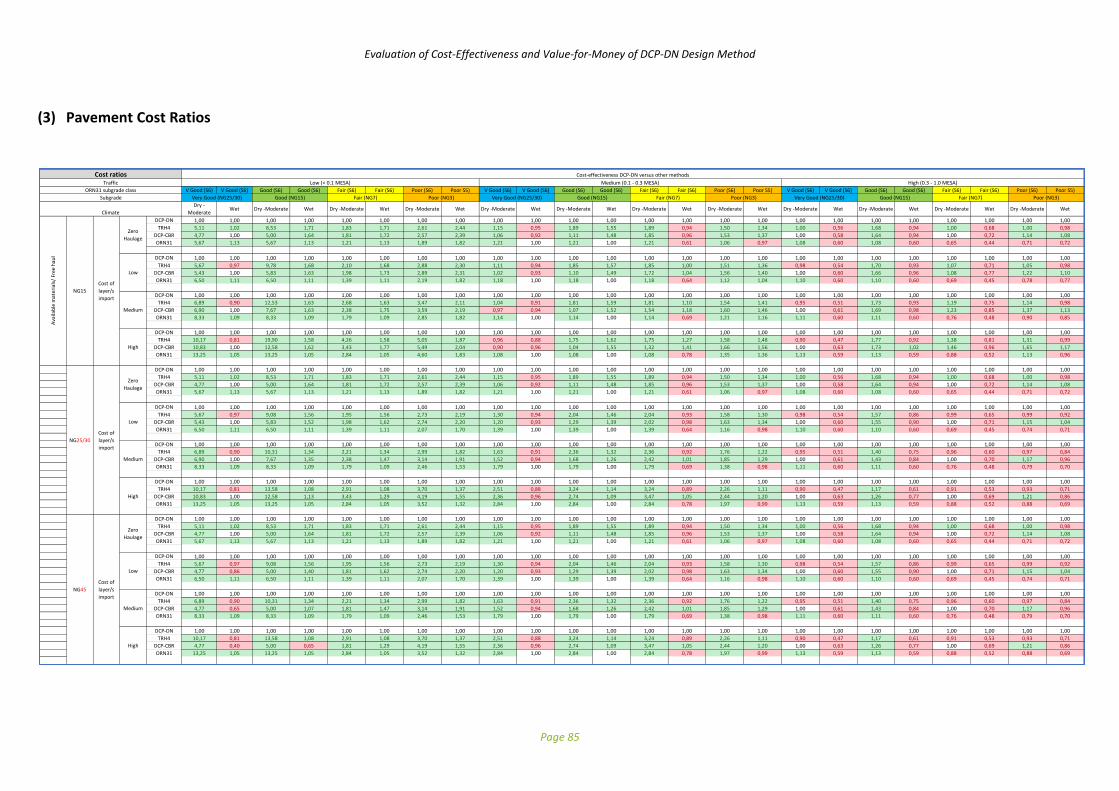
Evaluation of Cost-Effectiveness and Value-for-Money of DCP-DN Design Method
Page 85
(3) Pavement Cost Ratios
V Good (S6) V Good (S6) Good (S6) Good (S6) Fair (S6) Fair (S6) Poor (S6) Poor S5) V Good (S6) V Good (S6) Good (S6) Good (S6) Fair (S6) Fair (S6) Poor (S6) Poor S5) V Good (S6) V Good (S6) Good (S6) Good (S6) Fair (S6) Fair (S6) Poor (S6) Poor S5)
Dry -
ModerateWet Dry -Moderate Wet Dry -Moderate Wet Dry -Moderate Wet Dry -Moderate Wet Dry -Moderate Wet Dry -Moderate Wet Dry -Moderate Wet Dry -Moderate Wet Dry -Moderate Wet Dry -Moderate Wet Dry -Moderate Wet
DCP-DN 1,00 1,00 1,00 1,00 1,00 1,00 1,00 1,00 1,00 1,00 1,00 1,00 1,00 1,00 1,00 1,00 1,00 1,00 1,00 1,00 1,00 1,00 1,00 1,00
TRH4 5,11 1,02 8,53 1,71 1,83 1,71 2,61 2,44 1,15 0,95 1,89 1,55 1,89 0,94 1,50 1,34 1,00 0,56 1,68 0,94 1,00 0,68 1,00 0,98
DCP-CBR 4,77 1,00 5,00 1,64 1,81 1,72 2,57 2,39 1,06 0,92 1,11 1,48 1,85 0,96 1,53 1,37 1,00 0,58 1,64 0,94 1,00 0,72 1,14 1,08
ORN31 5,67 1,13 5,67 1,13 1,21 1,13 1,89 1,82 1,21 1,00 1,21 1,00 1,21 0,61 1,06 0,97 1,08 0,60 1,08 0,60 0,65 0,44 0,71 0,72
DCP-DN 1,00 1,00 1,00 1,00 1,00 1,00 1,00 1,00 1,00 1,00 1,00 1,00 1,00 1,00 1,00 1,00 1,00 1,00 1,00 1,00 1,00 1,00 1,00 1,00
TRH4 5,67 0,97 9,78 1,68 2,10 1,68 2,88 2,30 1,11 0,94 1,85 1,57 1,85 1,00 1,51 1,36 0,98 0,54 1,70 0,93 1,07 0,71 1,05 0,98
DCP-CBR 5,43 1,00 5,83 1,63 1,98 1,73 2,89 2,31 1,02 0,93 1,10 1,49 1,72 1,04 1,56 1,40 1,00 0,60 1,66 0,96 1,08 0,77 1,22 1,10
ORN31 6,50 1,11 6,50 1,11 1,39 1,11 2,19 1,82 1,18 1,00 1,18 1,00 1,18 0,64 1,12 1,04 1,10 0,60 1,10 0,60 0,69 0,45 0,78 0,77
DCP-DN 1,00 1,00 1,00 1,00 1,00 1,00 1,00 1,00 1,00 1,00 1,00 1,00 1,00 1,00 1,00 1,00 1,00 1,00 1,00 1,00 1,00 1,00 1,00 1,00
TRH4 6,89 0,90 12,53 1,63 2,68 1,63 3,47 2,11 1,04 0,91 1,81 1,59 1,81 1,10 1,54 1,41 0,95 0,51 1,73 0,93 1,19 0,75 1,14 0,98
DCP-CBR 6,90 1,00 7,67 1,63 2,38 1,75 3,59 2,19 0,97 0,94 1,07 1,52 1,54 1,18 1,60 1,46 1,00 0,61 1,69 0,98 1,23 0,85 1,37 1,13
ORN31 8,33 1,09 8,33 1,09 1,79 1,09 2,85 1,82 1,14 1,00 1,14 1,00 1,14 0,69 1,21 1,16 1,11 0,60 1,11 0,60 0,76 0,48 0,90 0,85
DCP-DN 1,00 1,00 1,00 1,00 1,00 1,00 1,00 1,00 1,00 1,00 1,00 1,00 1,00 1,00 1,00 1,00 1,00 1,00 1,00 1,00 1,00 1,00 1,00 1,00
TRH4 10,17 0,81 19,90 1,58 4,26 1,58 5,05 1,87 0,96 0,88 1,75 1,62 1,75 1,27 1,58 1,48 0,90 0,47 1,77 0,92 1,38 0,81 1,31 0,99
DCP-CBR 10,83 1,00 12,58 1,62 3,43 1,77 5,49 2,04 0,90 0,96 1,04 1,55 1,32 1,41 1,66 1,56 1,00 0,63 1,73 1,02 1,46 0,96 1,65 1,17
ORN31 13,25 1,05 13,25 1,05 2,84 1,05 4,60 1,83 1,08 1,00 1,08 1,00 1,08 0,78 1,35 1,36 1,13 0,59 1,13 0,59 0,88 0,52 1,13 0,96
DCP-DN 1,00 1,00 1,00 1,00 1,00 1,00 1,00 1,00 1,00 1,00 1,00 1,00 1,00 1,00 1,00 1,00 1,00 1,00 1,00 1,00 1,00 1,00 1,00 1,00
TRH4 5,11 1,02 8,53 1,71 1,83 1,71 2,61 2,44 1,15 0,95 1,89 1,55 1,89 0,94 1,50 1,34 1,00 0,56 1,68 0,94 1,00 0,68 1,00 0,98
DCP-CBR 4,77 1,00 5,00 1,64 1,81 1,72 2,57 2,39 1,06 0,92 1,11 1,48 1,85 0,96 1,53 1,37 1,00 0,58 1,64 0,94 1,00 0,72 1,14 1,08
ORN31 5,67 1,13 5,67 1,13 1,21 1,13 1,89 1,82 1,21 1,00 1,21 1,00 1,21 0,61 1,06 0,97 1,08 0,60 1,08 0,60 0,65 0,44 0,71 0,72
DCP-DN 1,00 1,00 1,00 1,00 1,00 1,00 1,00 1,00 1,00 1,00 1,00 1,00 1,00 1,00 1,00 1,00 1,00 1,00 1,00 1,00 1,00 1,00 1,00 1,00
TRH4 5,67 0,97 9,08 1,56 1,95 1,56 2,73 2,19 1,30 0,94 2,04 1,46 2,04 0,93 1,58 1,30 0,98 0,54 1,57 0,86 0,99 0,65 0,99 0,92
DCP-CBR 5,43 1,00 5,83 1,52 1,98 1,62 2,74 2,20 1,20 0,93 1,29 1,39 2,02 0,98 1,63 1,34 1,00 0,60 1,55 0,90 1,00 0,71 1,15 1,04
ORN31 6,50 1,11 6,50 1,11 1,39 1,11 2,07 1,70 1,39 1,00 1,39 1,00 1,39 0,64 1,16 0,98 1,10 0,60 1,10 0,60 0,69 0,45 0,74 0,71
DCP-DN 1,00 1,00 1,00 1,00 1,00 1,00 1,00 1,00 1,00 1,00 1,00 1,00 1,00 1,00 1,00 1,00 1,00 1,00 1,00 1,00 1,00 1,00 1,00 1,00
TRH4 6,89 0,90 10,31 1,34 2,21 1,34 2,99 1,82 1,63 0,91 2,36 1,32 2,36 0,92 1,76 1,22 0,95 0,51 1,40 0,75 0,96 0,60 0,97 0,84
DCP-CBR 6,90 1,00 7,67 1,35 2,38 1,47 3,14 1,91 1,52 0,94 1,68 1,26 2,42 1,01 1,85 1,29 1,00 0,61 1,43 0,84 1,00 0,70 1,17 0,96
ORN31 8,33 1,09 8,33 1,09 1,79 1,09 2,46 1,53 1,79 1,00 1,79 1,00 1,79 0,69 1,38 0,98 1,11 0,60 1,11 0,60 0,76 0,48 0,79 0,70
DCP-DN 1,00 1,00 1,00 1,00 1,00 1,00 1,00 1,00 1,00 1,00 1,00 1,00 1,00 1,00 1,00 1,00 1,00 1,00 1,00 1,00 1,00 1,00 1,00 1,00
TRH4 10,17 0,81 13,58 1,08 2,91 1,08 3,70 1,37 2,51 0,88 3,24 1,14 3,24 0,89 2,26 1,11 0,90 0,47 1,17 0,61 0,91 0,53 0,93 0,71
DCP-CBR 10,83 1,00 12,58 1,13 3,43 1,29 4,19 1,55 2,36 0,96 2,74 1,09 3,47 1,05 2,44 1,20 1,00 0,63 1,26 0,77 1,00 0,69 1,21 0,86
ORN31 13,25 1,05 13,25 1,05 2,84 1,05 3,52 1,32 2,84 1,00 2,84 1,00 2,84 0,78 1,97 0,99 1,13 0,59 1,13 0,59 0,88 0,52 0,88 0,69
DCP-DN 1,00 1,00 1,00 1,00 1,00 1,00 1,00 1,00 1,00 1,00 1,00 1,00 1,00 1,00 1,00 1,00 1,00 1,00 1,00 1,00 1,00 1,00 1,00 1,00
TRH4 5,11 1,02 8,53 1,71 1,83 1,71 2,61 2,44 1,15 0,95 1,89 1,55 1,89 0,94 1,50 1,34 1,00 0,56 1,68 0,94 1,00 0,68 1,00 0,98
DCP-CBR 4,77 1,00 5,00 1,64 1,81 1,72 2,57 2,39 1,06 0,92 1,11 1,48 1,85 0,96 1,53 1,37 1,00 0,58 1,64 0,94 1,00 0,72 1,14 1,08
ORN31 5,67 1,13 5,67 1,13 1,21 1,13 1,89 1,82 1,21 1,00 1,21 1,00 1,21 0,61 1,06 0,97 1,08 0,60 1,08 0,60 0,65 0,44 0,71 0,72
DCP-DN 1,00 1,00 1,00 1,00 1,00 1,00 1,00 1,00 1,00 1,00 1,00 1,00 1,00 1,00 1,00 1,00 1,00 1,00 1,00 1,00 1,00 1,00 1,00 1,00
TRH4 5,67 0,97 9,08 1,56 1,95 1,56 2,73 2,19 1,30 0,94 2,04 1,46 2,04 0,93 1,58 1,30 0,98 0,54 1,57 0,86 0,99 0,65 0,99 0,92
DCP-CBR 4,77 0,86 5,00 1,40 1,81 1,62 2,74 2,20 1,20 0,93 1,29 1,39 2,02 0,98 1,63 1,34 1,00 0,60 1,55 0,90 1,00 0,71 1,15 1,04
ORN31 6,50 1,11 6,50 1,11 1,39 1,11 2,07 1,70 1,39 1,00 1,39 1,00 1,39 0,64 1,16 0,98 1,10 0,60 1,10 0,60 0,69 0,45 0,74 0,71
DCP-DN 1,00 1,00 1,00 1,00 1,00 1,00 1,00 1,00 1,00 1,00 1,00 1,00 1,00 1,00 1,00 1,00 1,00 1,00 1,00 1,00 1,00 1,00 1,00 1,00
TRH4 6,89 0,90 10,31 1,34 2,21 1,34 2,99 1,82 1,63 0,91 2,36 1,32 2,36 0,92 1,76 1,22 0,95 0,51 1,40 0,75 0,96 0,60 0,97 0,84
DCP-CBR 4,77 0,65 5,00 1,07 1,81 1,47 3,14 1,91 1,52 0,94 1,68 1,26 2,42 1,01 1,85 1,29 1,00 0,61 1,43 0,84 1,00 0,70 1,17 0,96
ORN31 8,33 1,09 8,33 1,09 1,79 1,09 2,46 1,53 1,79 1,00 1,79 1,00 1,79 0,69 1,38 0,98 1,11 0,60 1,11 0,60 0,76 0,48 0,79 0,70
DCP-DN 1,00 1,00 1,00 1,00 1,00 1,00 1,00 1,00 1,00 1,00 1,00 1,00 1,00 1,00 1,00 1,00 1,00 1,00 1,00 1,00 1,00 1,00 1,00 1,00
TRH4 10,17 0,81 13,58 1,08 2,91 1,08 3,70 1,37 2,51 0,88 3,24 1,14 3,24 0,89 2,26 1,11 0,90 0,47 1,17 0,61 0,91 0,53 0,93 0,71
DCP-CBR 4,77 0,40 5,00 0,65 1,81 1,29 4,19 1,55 2,36 0,96 2,74 1,09 3,47 1,05 2,44 1,20 1,00 0,63 1,26 0,77 1,00 0,69 1,21 0,86
ORN31 13,25 1,05 13,25 1,05 2,84 1,05 3,52 1,32 2,84 1,00 2,84 1,00 2,84 0,78 1,97 0,99 1,13 0,59 1,13 0,59 0,88 0,52 0,88 0,69
High (0.3 - 1.0 MESA)
Good (NG15) Fair (NG7) Poor (NG3)Good (NG15) Fair (NG7) Very Good (NG25/30)Fair (NG7) Poor (NG3)Very Good (NG25/30) Very Good (NG25/30)
NG15
Cost of
layer/s
import
Traffic
ORN31 subgrade class
Subgrade
Low (< 0.1 MESA) Medium (0.1 - 0.3 MESA)
Cost ratios
Low
Medium
High
Climate
Zero
Haulage
NG25/30
Cost of
layer/s
import
Zero
Haulage
NG45
Cost of
layer/s
import
Zero
Haulage
Good (NG15)
Low
Medium
High
Low
Medium
High
Poor (NG3)
Cost-effectiveness DCP-DN versus other methods
Ava
ilab
le m
ater
ials
/ Fr
ee h
aul

Evaluation of Cost-Effectiveness and Value-for-Money of DCP-DN Design Method
Page 86
(4) Pavement Cost Ratios (Cont’d)
V Good (S6) V Good (S6) Good (S6) Good (S6) Fair (S6) Fair (S6) Poor (S6) Poor S5) V Good (S6) V Good (S6) Good (S6) Good (S6) Fair (S6) Fair (S6) Poor (S6) Poor S5) V Good (S6) V Good (S6) Good (S6) Good (S6) Fair (S6) Fair (S6) Poor (S6) Poor S5)
Dry -
ModerateWet Dry -Moderate Wet Dry -Moderate Wet Dry -Moderate Wet Dry -Moderate Wet Dry -Moderate Wet Dry -Moderate Wet Dry -Moderate Wet Dry -Moderate Wet Dry -Moderate Wet Dry -Moderate Wet Dry -Moderate Wet
DCP-DN 1,00 1,00 1,00 1,00 1,00 1,00 1,00 1,00 1,00 1,00 1,00 1,00 1,00 1,00 1,00 1,00 1,00 1,00 1,00 1,00 1,00 1,00 1,00 1,00
TRH4 5,11 1,02 8,53 1,71 1,83 1,71 2,61 2,44 1,15 0,95 1,89 1,55 1,89 0,94 1,50 1,34 1,00 0,56 1,68 0,94 1,00 0,68 1,00 0,98
DCP-CBR 4,77 1,00 5,00 1,64 1,81 1,72 2,57 2,39 1,06 0,92 1,11 1,48 1,85 0,96 1,53 1,37 1,00 0,58 1,64 0,94 1,00 0,72 1,14 1,08
ORN31 5,67 1,13 5,67 1,13 1,21 1,13 1,89 1,82 1,21 1,00 1,21 1,00 1,21 0,61 1,06 0,97 1,08 0,60 1,08 0,60 0,65 0,44 0,71 0,72
DCP-DN 1,00 1,00 1,00 1,00 1,00 1,00 1,00 1,00 1,00 1,00 1,00 1,00 1,00 1,00 1,00 1,00 1,00 1,00 1,00 1,00 1,00 1,00 1,00 1,00
TRH4 5,67 1,13 9,08 1,82 1,95 1,82 2,73 2,55 1,30 0,94 2,04 1,46 2,04 0,93 1,58 1,30 0,98 0,58 1,57 0,93 0,99 0,69 0,99 0,98
DCP-CBR 4,77 1,00 5,00 1,64 1,81 1,72 2,74 2,56 1,06 0,80 1,11 1,29 1,85 0,98 1,63 1,34 1,00 0,64 1,55 0,97 1,00 0,76 1,15 1,10
ORN31 6,50 1,30 6,50 1,30 1,39 1,30 2,07 1,98 1,39 1,00 1,39 1,00 1,39 0,64 1,16 0,98 1,10 0,65 1,10 0,65 0,69 0,48 0,74 0,76
DCP-DN 1,00 1,00 1,00 1,00 1,00 1,00 1,00 1,00 1,00 1,00 1,00 1,00 1,00 1,00 1,00 1,00 1,00 1,00 1,00 1,00 1,00 1,00 1,00 1,00
TRH4 6,89 1,38 10,31 2,06 2,21 2,06 2,99 2,79 1,63 0,91 2,36 1,32 2,36 0,92 1,76 1,22 0,95 0,62 1,40 0,91 0,96 0,70 0,97 0,98
DCP-CBR 4,77 1,00 5,00 1,64 1,81 1,72 3,14 2,93 1,06 0,62 1,11 1,01 1,85 1,01 1,85 1,29 1,00 0,75 1,43 1,02 1,00 0,82 1,17 1,13
ORN31 8,33 1,67 8,33 1,67 1,79 1,67 2,46 2,35 1,79 1,00 1,79 1,00 1,79 0,69 1,38 0,98 1,11 0,73 1,11 0,73 0,76 0,56 0,79 0,82
DCP-DN 1,00 1,00 1,00 1,00 1,00 1,00 1,00 1,00 1,00 1,00 1,00 1,00 1,00 1,00 1,00 1,00 1,00 1,00 1,00 1,00 1,00 1,00 1,00 1,00
TRH4 10,17 2,03 13,58 2,72 2,91 2,72 3,70 3,45 2,51 0,88 3,24 1,14 3,24 0,89 2,26 1,11 0,90 0,68 1,17 0,88 0,91 0,72 0,93 0,97
DCP-CBR 4,77 1,00 5,00 1,64 1,81 1,72 4,19 3,91 1,06 0,39 1,11 0,63 1,85 1,05 2,44 1,20 1,00 0,91 1,26 1,11 1,00 0,94 1,21 1,17
ORN31 13,25 2,65 13,25 2,65 2,84 2,65 3,52 3,33 2,84 1,00 2,84 1,00 2,84 0,78 1,97 0,99 1,13 0,85 1,13 0,85 0,88 0,70 0,88 0,94
DCP-DN 1,00 1,00 1,00 1,00 1,00 1,00 1,00 1,00 1,00 1,00 1,00 1,00 1,00 1,00 1,00 1,00 1,00 1,00 1,00 1,00 1,00 1,00 1,00 1,00
TRH4 5,11 1,02 8,53 1,71 1,83 1,71 2,61 2,44 1,15 0,95 1,89 1,55 1,89 0,94 1,50 1,34 1,00 0,56 1,68 0,94 1,00 0,68 1,00 0,98
DCP-CBR 4,77 1,00 5,00 1,64 1,81 1,72 2,57 2,39 1,06 0,92 1,11 1,48 1,85 0,96 1,53 1,37 1,00 0,58 1,64 0,94 1,00 0,72 1,14 1,08
ORN31 5,67 1,13 5,67 1,13 1,21 1,13 1,89 1,82 1,21 1,00 1,21 1,00 1,21 0,61 1,06 0,97 1,08 0,60 1,08 0,60 0,65 0,44 0,71 0,72
DCP-DN 1,00 1,00 1,00 1,00 1,00 1,00 1,00 1,00 1,00 1,00 1,00 1,00 1,00 1,00 1,00 1,00 1,00 1,00 1,00 1,00 1,00 1,00 1,00 1,00
TRH4 5,67 1,13 9,08 1,82 1,95 1,82 2,73 2,55 2,04 1,46 2,04 1,46 2,04 0,93 1,58 1,30 1,13 0,58 1,81 0,93 1,08 0,69 1,06 0,98
DCP-CBR 4,77 1,00 5,00 1,64 1,81 1,72 2,57 2,39 1,06 0,80 1,11 1,29 1,85 0,88 1,63 1,34 1,00 0,54 1,64 0,86 1,00 0,76 1,22 1,10
ORN31 6,50 1,30 6,50 1,30 1,39 1,30 2,07 1,98 1,39 1,00 1,39 1,00 1,39 0,64 1,16 0,98 1,27 0,65 1,27 0,65 0,75 0,48 0,78 0,76
DCP-DN 1,00 1,00 1,00 1,00 1,00 1,00 1,00 1,00 1,00 1,00 1,00 1,00 1,00 1,00 1,00 1,00 1,00 1,00 1,00 1,00 1,00 1,00 1,00 1,00
TRH4 6,89 1,38 10,31 2,06 2,21 2,06 2,99 2,79 1,63 0,91 2,36 1,32 2,36 0,92 1,76 1,22 1,41 0,62 2,10 0,91 1,25 0,70 1,18 0,98
DCP-CBR 4,77 1,00 5,00 1,64 1,81 1,72 2,57 2,39 1,06 0,62 1,11 1,01 1,85 0,75 1,85 1,29 1,00 0,46 1,64 0,74 1,00 0,82 1,42 1,13
ORN31 8,33 1,67 8,33 1,67 1,79 1,67 2,46 2,35 1,79 1,00 1,79 1,00 1,79 0,69 1,38 0,98 1,66 0,73 1,66 0,73 0,99 0,56 0,95 0,82
DCP-DN 1,00 1,00 1,00 1,00 1,00 1,00 1,00 1,00 1,00 1,00 1,00 1,00 1,00 1,00 1,00 1,00 1,00 1,00 1,00 1,00 1,00 1,00 1,00 1,00
TRH4 10,17 2,03 13,58 2,72 2,91 2,72 3,70 3,45 2,51 0,88 3,24 1,14 3,24 0,89 2,26 1,11 2,18 0,68 2,81 0,88 1,67 0,72 1,48 0,97
DCP-CBR 4,77 1,00 5,00 1,64 1,81 1,72 2,57 2,39 1,06 0,39 1,11 0,63 1,85 0,53 2,44 1,20 1,00 0,33 1,64 0,53 1,00 0,94 1,93 1,17
ORN31 13,25 2,65 13,25 2,65 2,84 2,65 3,52 3,33 2,84 1,00 2,84 1,00 2,84 0,78 1,97 0,99 2,73 0,85 2,73 0,85 1,62 0,70 1,40 0,94
DCP-DN 1,00 1,00 1,00 1,00 1,00 1,00 1,00 1,00 1,00 1,00 1,00 1,00 1,00 1,00 1,00 1,00 1,00 1,00 1,00 1,00 1,00 1,00 1,00 1,00
TRH4 5,11 1,02 8,53 1,71 1,83 1,71 2,61 2,44 1,15 0,95 1,89 1,55 1,89 0,94 1,50 1,34 1,00 0,56 1,68 0,94 1,00 0,68 1,00 0,98
DCP-CBR 4,77 1,00 5,00 1,64 1,81 1,72 2,57 2,39 1,06 0,92 1,11 1,48 1,85 0,96 1,53 1,37 1,00 0,58 1,64 0,94 1,00 0,72 1,14 1,08
ORN31 5,67 1,13 5,67 1,13 1,21 1,13 1,89 1,82 1,21 1,00 1,21 1,00 1,21 0,61 1,06 0,97 1,08 0,60 1,08 0,60 0,65 0,44 0,71 0,72
DCP-DN 1,00 1,00 1,00 1,00 1,00 1,00 1,00 1,00 1,00 1,00 1,00 1,00 1,00 1,00 1,00 1,00 1,00 1,00 1,00 1,00 1,00 1,00 1,00 1,00
TRH4 5,11 1,02 8,86 1,77 1,90 1,77 2,68 2,51 1,15 0,95 1,96 1,61 1,96 0,90 1,54 1,26 1,00 0,56 1,74 0,97 1,04 0,70 1,03 1,00
DCP-CBR 4,77 1,00 5,00 1,64 1,81 1,72 2,57 2,39 1,06 0,92 1,11 1,48 1,85 0,88 1,53 1,25 1,00 0,58 1,64 0,94 1,00 0,72 1,14 1,08
ORN31 5,67 1,13 5,67 1,13 1,21 1,13 1,89 1,82 1,21 1,00 1,21 1,00 1,21 0,56 1,06 0,89 1,08 0,60 1,08 0,60 0,65 0,44 0,78 0,80
DCP-DN 1,00 1,00 1,00 1,00 1,00 1,00 1,00 1,00 1,00 1,00 1,00 1,00 1,00 1,00 1,00 1,00 1,00 1,00 1,00 1,00 1,00 1,00 1,00 1,00
TRH4 5,11 1,02 8,86 1,77 1,90 1,77 2,68 2,51 1,15 0,95 1,96 1,61 1,96 0,76 1,54 1,07 1,00 0,56 1,74 0,97 1,04 0,70 1,03 1,00
DCP-CBR 4,77 1,00 5,00 1,64 1,81 1,72 2,57 2,39 1,06 0,92 1,11 1,48 1,85 0,75 1,53 1,06 1,00 0,58 1,64 0,94 1,00 0,72 1,14 1,08
ORN31 5,67 1,13 5,67 1,13 1,21 1,13 1,89 1,82 1,21 1,00 1,21 1,00 1,21 0,47 1,06 0,76 1,08 0,60 1,08 0,60 0,65 0,44 0,71 0,72
DCP-DN 1,00 1,00 1,00 1,00 1,00 1,00 1,00 1,00 1,00 1,00 1,00 1,00 1,00 1,00 1,00 1,00 1,00 1,00 1,00 1,00 1,00 1,00 1,00 1,00
TRH4 5,11 1,02 8,86 1,77 1,90 1,77 2,68 2,51 1,96 1,61 1,96 1,61 1,96 0,54 1,54 0,76 1,00 0,56 1,74 0,97 1,04 0,70 1,03 1,00
DCP-CBR 4,77 1,00 5,00 1,64 1,81 1,72 2,57 2,39 1,06 0,92 1,11 1,48 1,85 0,53 1,53 0,75 1,00 0,58 1,64 0,94 1,00 0,72 1,14 1,08
ORN31 5,67 1,13 5,67 1,13 1,21 1,13 1,89 1,82 1,21 1,00 1,21 1,00 1,21 0,33 1,06 0,54 1,08 0,60 1,08 0,60 0,65 0,44 0,71 0,72
High (0.3 - 1.0 MESA)
Good (NG15) Fair (NG7) Poor (NG3)Good (NG15) Fair (NG7) Very Good (NG25/30)Fair (NG7) Poor (NG3)Very Good (NG25/30) Very Good (NG25/30)
Traffic
ORN31 subgrade class
Subgrade
Low (< 0.1 MESA) Medium (0.1 - 0.3 MESA)
Cost ratios
Low
Medium
High
Low
Medium
Climate
NG55
Cost of
layer/s
import
Zero
Haulage
NG65
Cost of
layer/s
import
Zero
Haulage
Good (NG15)
High
Poor (NG3)
Cost-effectiveness DCP-DN versus other methods
NG80
Cost of
layer/s
import
Zero
Haulage
Low
Medium
High
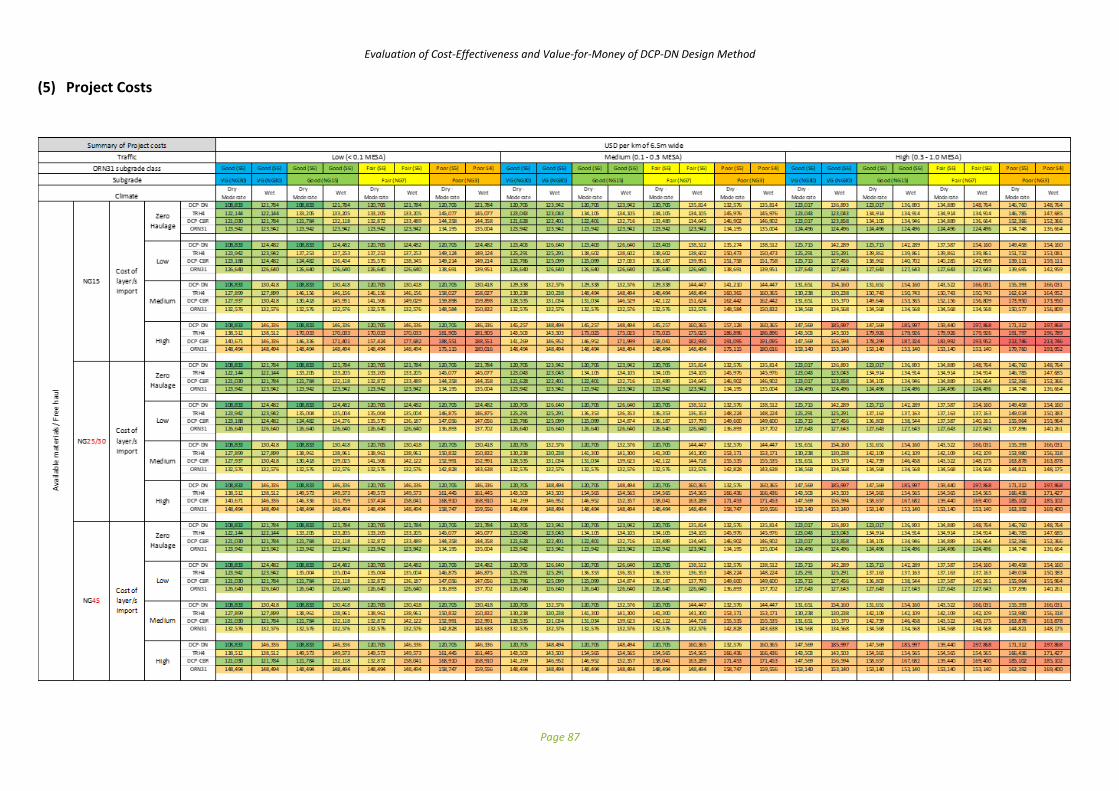
Evaluation of Cost-Effectiveness and Value-for-Money of DCP-DN Design Method
Page 87
(5) Project Costs
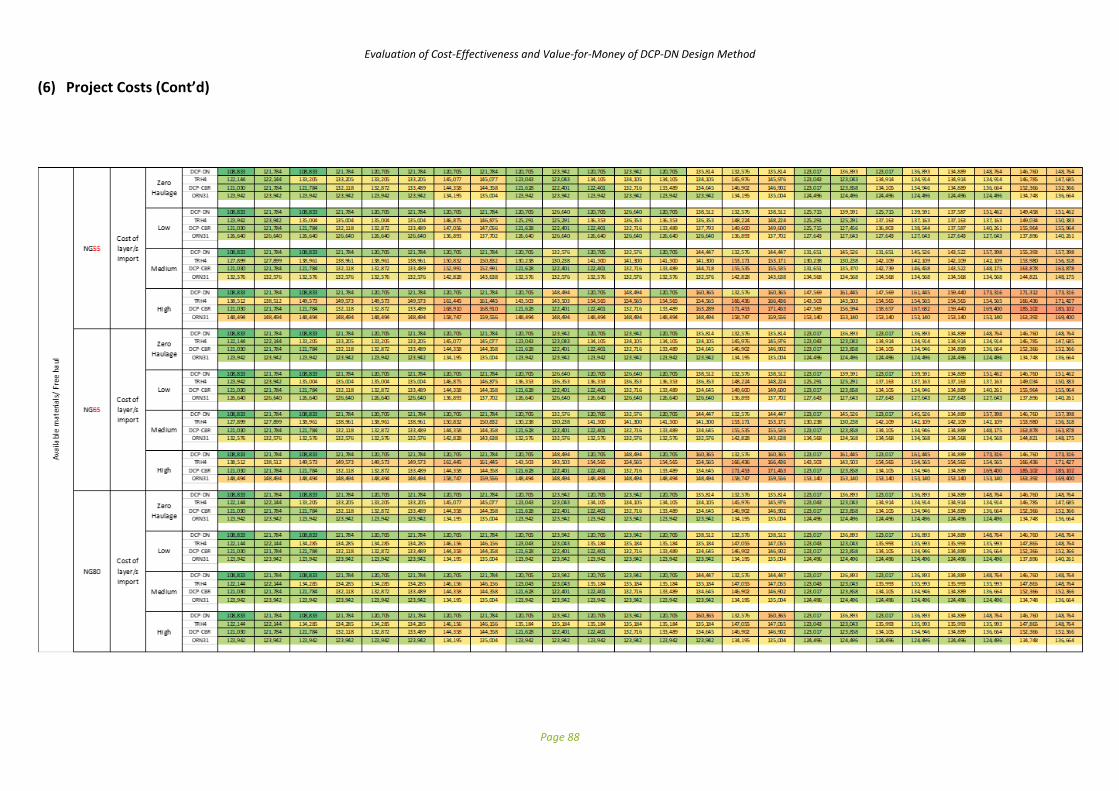
Evaluation of Cost-Effectiveness and Value-for-Money of DCP-DN Design Method
Page 88
(6) Project Costs (Cont’d)

Evaluation of Cost-Effectiveness and Value-for-Money of DCP-DN Design Method
Page 89
(7) Project Costs Ratios

Evaluation of Cost-Effectiveness and Value-for-Money of DCP-DN Design Method
Page 90
(8) Project Costs Ratios (Cont’d)

Evaluation of Cost-Effectiveness and Value-for-Money of DCP-DN Design Method
Page 91
9. Project Cost Savings/km

Evaluation of Cost-Effectiveness and Value-for-Money of DCP-DN Design Method
Page 92
10. Project Cost Savings/km (Cont’d)

Evaluation of Cost-Effectiveness and Value-for-Money of DCP-DN Design Method
Page 93
Annex I - Pavement structures and costs by TLCs for different design methods
Site Avg. DN DCP-DN TRH4 ORN31 DCP-CBR
New base
100 mm
CBRsoaked=80
NG80 New base
New subbase 150 mm
125 mm
CBRsoaked=25 CBRsoaked=80
NG25 NG80
150 mm R&R R&R R&R R&R
DNOMC=4.1 DN=4.0 DN(90P)=5.6 DN(90P)=5.6 CBRomc=70
CBROMC=46 CBRomc=50 CBRsoaked=45
CBRsoaked=15+
NG15/SG1 Subgrade S6 Subgrade S5
Kenya: Wamwangi - Karatu TLC 0.1
2438 12458
5 20 65 5 20 65
0 2 438 2 438 2 438 0 13 813 16 792 24 781
0 0
0 0
20786 2438
5 20 65 5 20 65
5 23 833 26 813 34 802 0 2 438 2 438 2 438
20 26 813 30 536 38 526 0 - - -
65 37 544 40 523 48 513 0 - - -
Zero haulage
Base not required
Avg. haul km
Zero haulage
Subbase not
required
Base not required Base 150 mm NG80
Subbase not
required
Subbase not
required
Avg. haul km
Base 100 mm NG80
Avg. haul km
125 mm NG25
Subbase
DCP-DN
Zero haulage
ORN31
TRH4
Zero haulage
DCP-CBR
Avg. haul km
Cost for 6.5 m wide pavement incl. 100 mm rip, shape and recompact of in situ wearing course
USD/km
Possible Unlikely

Evaluation of Cost-Effectiveness and Value-for-Money of DCP-DN Design Method
Page 94
Site Avg. DN DCP-DN TRH4 ORN31 DCP-CBR
New base
New base 150 mm
100 mm
CBRsoaked=80
New base NG80 CBRsoaked=55
150 mm New subbase New base NG55
DN≤4 125 mm 150 mm New subbase
CBROMC≥70 120 mm
CBRsoaked≥45 CBRsoaked=25
NG45 NG25 CBRsoaked=80 CBRsoaked=30
New subbase Capping NG80 NG30
150 mm 150 mm New subbase Capping
DN≤9 125 mm 120 mm
CBROMC≥25
CBRsoaked≥3 CBRsoaked=7 CBRsoaked=30 CBRsoaked=15
NG3 NG7 NG30 NG15
150 mm
DN=16 DN<16 DN(90P)=20 DN(90P)=20 CBROMC=18
@RMC≈OMC CBROMC=9 CBROMC=14 CBRsoaked<3
CBROMC=12 CBRsoaked<3
CBRsoaked<3
SG4 Subgrade S4 Subgrade S1
Zambia: Kantongo - Waitwika TLC 0.1
19500 22141
5 20 65 5 20 65
5 23 563 28 031 40 016 5 25 865 30 333 42 318
20 28 031 32 500 44 484 20 29 589 34 057 46 042
65 40 016 44 484 56 469 65 39 576 44 044 56 029
28911 29313
5 20 65 5 20 65
5 33 990 36 969 44 958 5 34 594 39 063 51 047
20 42 182 45 161 53 151 20 41 744 46 213 58 197
65 64 154 67 133 75 122 65 60 919 65 388 77 372
Avg. haul km Avg. haul km
150 mm NG7 +
Subbase
125 mm NG25
120 mm NG15 +
Subbase
120 mm NG30
Base 100 mm NG80 Base 150 mm NG55
Base 150 mm NG80
Avg. haul km Avg. haul km
Subbase
150 mm NG3
Subbase
125 mm NG30
Zero haulage
TRH4
Zero haulage
DCP-CBR
USD/km
Base 150 mm NG25DCP-DN
Zero haulage
ORN31
Zero haulage
Cost for 6.5 m wide pavement incl. 100 mm rip, shape and recompact of in situ wearing course

Evaluation of Cost-Effectiveness and Value-for-Money of DCP-DN Design Method
Page 95
Site Avg. DN DCP-DN TRH4 ORN31 DCP-CBR
New base
125 mm
CBRsoaked=80
NG80 New base
New subbase 175 mm
125 mm
CBRsoaked=25
NG25 CBRsoaked=65
New base Capping New base NG65
150 mm 150 mm 150 mm New subbase
DNOMC≤3.2 120 mm
CBROMC=70
CBRsoaked=45 CBRsoaked=7 CBRsoaked=80 CBRsoaked=30
NG45 NG7 NG80 NG30
150 mm 150mm 150 mm 150 mm 150 mm
DN0.75 OMC=4.0 DN(80P)=4.6 DN(90P)=4.9 DN(90P)=4.9 DN(75P)=4.4
@RMC≈0.75MC CBR0.75OMC=54 DN0.75 OMC=4.9 DN0.75 OMC=4.4
CBR0.75 OMC=70 CBROMC=33 CBR0.75 OMC =58 CBROMC=39
CBRsoaked=12 CBRsoaked=5 CBROMC=36 CBRsoaked=8
NG3/SG3 Subgrade S6 Subgrade S4
Ghana: Kukurantumi - Asafo TLC 0.3
12188 13813
5 20 65 5 20 65
0 14 219 20 313 38 594 0 15 844 21 938 40 219
0 0
0 0
29589 18685
5 20 65 5 20 65
5 35 005 38 729 48 716 5 25 879 31 092 45 074
20 43 198 46 922 56 909 20 29 454 34 667 48 649
65 65 169 68 893 78 880 65 39 041 44 255 58 236
Avg. haul km
Subbase
120 mm NG30
Base 175 mm NG65
Subbase not
required
Subbase not
required
Avg. haul km
150 mm NG7
+ Subbase 125
mm NG25
Base 125 mm NG80
Avg. haul km
Base 150 mm NG80
Avg. haul km
Zero haulage
Zero haulage
TRH4
Zero haulage
DCP-CBR
DCP-DN
Zero haulage
ORN31Base 150 mm NG25
Cost for 6.5 m wide pavement incl. 100 mm rip, shape and recompact of in situ wearing course
USD/km

Evaluation of Cost-Effectiveness and Value-for-Money of DCP-DN Design Method
Page 96
11 618,75
5 20 65
15 844 20 313 32 297
21 409,38
5 20 65
5 24 849 28 573 38 560
20 28 573 32 297 42 284
65 38 560 42 284 52 271
11 618,75
5 20 65
15 844 20 313 32 297
24 727,41
5 20 65
5 25 878 31 092 45 074
20 29453,45 34 667 48 649
65 39040,95 44254,49 58 236
120 mm NG30
DCP-CBR 175 mm NG65
Avg. haul km
Avg. haul km
ORN31 150 mm NG80
125mm NG80
Avg. haul km
125 mm NG25
Zero haulage
Zero haulage
Cost for 6.5 m wide pavement
DCP-DN 150 mm NG45
Zero haulage
Zero haulage
USD/km incl. 100mm rip & recompact in situ layer
Avg. haul km
TRH4
New base
175 mm
New base
125 mm
CBRsoaked= 80 CBRsoaked= 65
New base G4/NG80 New base NG65
150 mm New subbase 150 mm New subbase
DN= 3.2 125 mm 120 mm
In situ layer CBRsoaked= 82 CBRsoaked= 25 CBRsoaked= 80 CBRsoaked= 30
NG80 NG25 NG80 NG30
150 mm 150 mm 150 mm 150 mm 150 mm
DN= 4.54 DN(80P)= 5.03 DN (90P)= 5.29 DN(90P)= 5.29 DN= 4.54
Moist. Ratio= 0.8 CBROMC= 53 CBR0.8 OMC= 49 CBR0.8 OMC= 52 CBR0.8 OMC= 61
CBRKLEIN = 60 CBRsoaked= 7 CBRomc= 30 CBRsoaked= 11
CBRSoaked = 11 Subgrade:S3 Subgrade: S6 Subgrade: S4
R&R 100mm R&R 100mm R&R 100mm R&R 100mm
DCP-CBRSite Avg. DN DCP-DN TRH4 ORN31
Malawi - Mwanza: Kunenekude (S135) km 3.00 to km 5.7 (TLC 0.3)

Evaluation of Cost-Effectiveness and Value-for-Money of DCP-DN Design Method
Page 97
New base New base
125 mm 120 mm
CBRsoaked= 80 CBRsoaked= 55
New base NG80 New base NG55
150 mm New subbase 150 mm New subbase
DN= 3.2 125 mm 120 mm
In situ layer CBRsoaked= 82 CBRsoaked= 25 CBRsoaked= 80 CBRsoaked= 30
NG80 NG25 NG80 NG30
150 mm 150 mm 150 mm 150 mm 150 mm
DN = 3.74 DN(80P)= 4.26 DN (90P)= 4.53 DN(90P)= 4.53 DN= 3.74
Moist. Ratio= 0.74 CBROMC= 65 CBR0.74 OMC= 60.0 CBR0.74 OMC= 61.0 CBR0.74 OMC= 75
CBRKLEIN = 77 CBRsoaked= 11.0 CBRomc= 38.0 CBRsoaked= 18
CBRSoaked = 19 Subgrade: S4 Subgrade: S6 Subgrade: S5
R&R 100mm R&R 100mm R&R 100mm R&R 100mm
Site Avg. DN DCP-DN TRH4 ORN31 DCP-CBR
Malawi: Linthipe: Linthipe - Lobi (S126) km 0.00 to km 1.195 (TLC 0.3)
11 618,75
5 20 65
15 844 20 313 32 297
19 269,79
5 20 65
5 43 875 51 323 71 297
20 51 323 58 771 78 745
65 71 297 78 745 98 719
11 618,75
5 20 65
15 844 20 313 32 297
18 196,10
5 20 65
5 41 592 48 742 67 917
20 48742,20 55 892 75 067
65 67917,20 75067,20 94 242
Zero haulage
Zero haulage
Zero haulage
Avg. haul km
120 mm NG30
Avg. haul km
DCP-CBR 150 mm NG80
ORN31 150 mm NG80
TRH4 125 mm NG80
Avg. haul km
125 mm NG25
Cost for 6.5 m wide pavement
DCP-DN 150 mm NG80
USD/km incl. 100mm rip & recompact in situ layer
Avg. haul km
Zero haulage
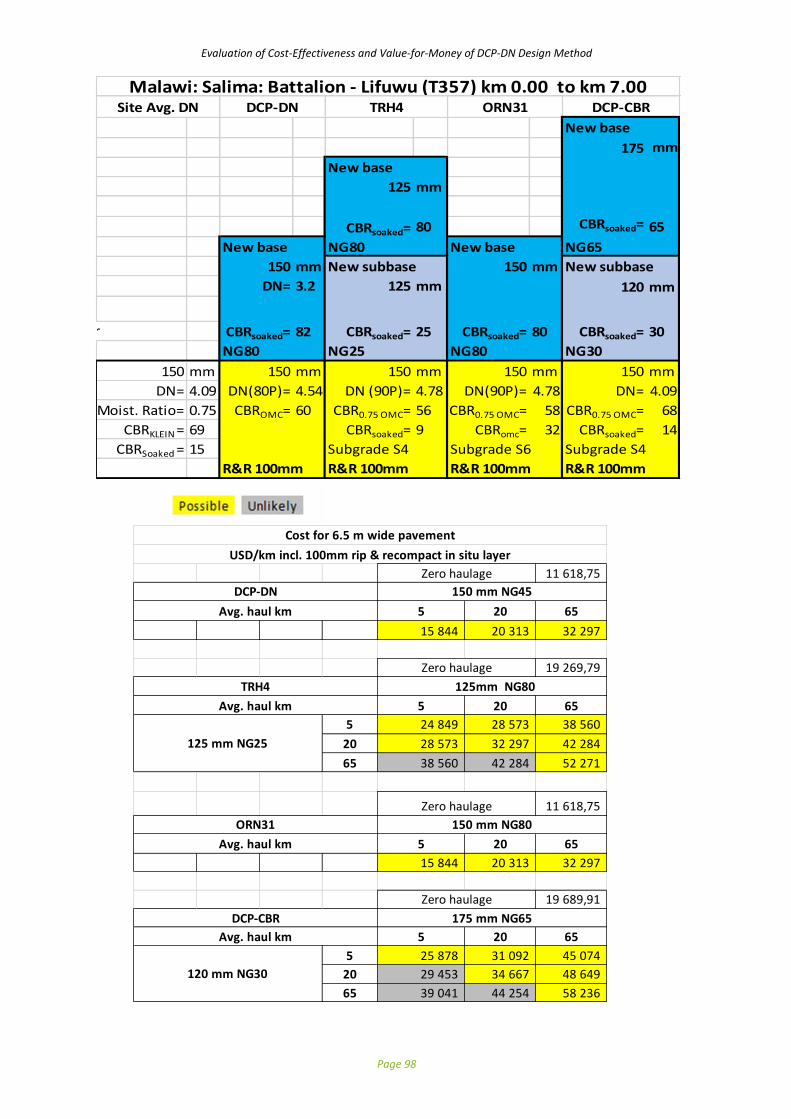
Evaluation of Cost-Effectiveness and Value-for-Money of DCP-DN Design Method
Page 98
New base
175 mm
New base
125 mm
CBRsoaked= 80 CBRsoaked= 65
New base NG80 New base NG65
150 mm New subbase 150 mm New subbase
DN= 3.2 125 mm 120 mm
In situ layer CBRsoaked= 82 CBRsoaked= 25 CBRsoaked= 80 CBRsoaked= 30
NG80 NG25 NG80 NG30
150 mm 150 mm 150 mm (R&R) 150 mm (R&R) 150 mm
DN= 4.09 DN(80P)= 4.54 DN (90P)= 4.78 DN(90P)= 4.78 DN= 4.09
Moist. Ratio= 0.75 CBROMC= 60 CBR0.75 OMC= 56 CBR0.75 OMC= 58 CBR0.75 OMC= 68
CBRKLEIN = 69 CBRsoaked= 9 CBRomc= 32 CBRsoaked= 14
CBRSoaked = 15 Subgrade S4 Subgrade S6 Subgrade S4
R&R 100mm R&R 100mm R&R 100mm R&R 100mm
Malawi: Salima: Battalion - Lifuwu (T357) km 0.00 to km 7.00Site Avg. DN DCP-DN TRH4 ORN31 DCP-CBR
11 618,75
5 20 65
15 844 20 313 32 297
19 269,79
5 20 65
5 24 849 28 573 38 560
20 28 573 32 297 42 284
65 38 560 42 284 52 271
11 618,75
5 20 65
15 844 20 313 32 297
19 689,91
5 20 65
5 25 878 31 092 45 074
20 29 453 34 667 48 649
65 39 041 44 254 58 236
120 mm NG30
DCP-CBR 175 mm NG65
Avg. haul km
125mm NG80
Avg. haul km
125 mm NG25
Avg. haul km
ORN31 150 mm NG80
TRH4
Cost for 6.5 m wide pavement
DCP-DN 150 mm NG45
Zero haulage
Zero haulage
Zero haulage
USD/km incl. 100mm rip & recompact in situ layer
Avg. haul km
Zero haulage

Evaluation of Cost-Effectiveness and Value-for-Money of DCP-DN Design Method
Page 99
New base
New base 150 mm
125 mm
CBRsoaked= 80 CBRsoaked= 80
NG80 NG80
New subbase New subbase
125 mm New base 120 mm
150 mm
CBRsoaked= 25 CBRsoaked= 30
NG25 NG30
New base New foundation CBRsoaked= 80 capping layer
150 mm 150 mm NG80 150 mm
DN= 3.2 New subbase
100 mmIn situ layer CBRsoaked= 82 CBRsoaked= 7 CBRsoaked= 30 CBRsoaked= 15
NG80 NG3 NG30 NG15
150 mm 150 mm 150 mm 150 mm 150 mm
DN= 5.66 DN(80P)= 6.65 DN (90P)= 7.17 DN(90P)= 7.17 DN= 5.66
Moist. Ratio= 0.34 CBROMC= 37 CBR0.34 OMC= 34 CBR0.34 OMC= 38 CBR0.34 OMC= 48
CBRKLEIN= 45 CBRsoaked= 1 CBRomc= 20 CBRsoaked= 3
Soaked CBR= 3 Subgrade: S2 Subgrade: S5 Subgrade: S2
R&R 100mm R&R 100mm R&R 100mm R&R 100mm
Site Avg. DN DCP-DN TRH4 ORN31 DCP-CBR
Malawi - Ntcheu: Kasinje - Kandeu (S134) km 2.30 to km 3.90 (TLC 0.3)
11 618,75
5 20 65
15 844 20 313 32 297
27 394,79
5 20 65
5 35 005 38 729 48 716
20 38 729 42 453 52 440
65 48 716 52 440 62 427
5 39 474 43 198 53 185
20 43 198 46 922 56 909
65 53 185 56 909 66 896
5 51 458 55 182 65 169
20 55 182 58 906 68 893
65 65 169 68 893 78 880
19 337,50
5 20 65
5 24 917 29 385 41 370
20 27895,83 32 365 44 349
65 35885,42 40354,17 52 339
28 904,20
5 20 65
5 38 248 42 717 54 701
20 41822,95 46 292 58 276
65 51410,45 55879,20 67 864
5 42 717 47 185 59 170
20 46291,70 50 760 62 745
65 55879,20 60347,95 72332,33
5 54701,08 59169,83 71 154
20 58276,08 62744,83 74 729
65 67863,58 72332,33 84316,70
20120 mm
NG30
65120 mm
NG30
DCP-CBR 150 mm NG80
Avg. haul km
150 mm
NG15
5120 mm
NG30
ORN31 150 mm NG80
Avg. haul km
65125 mm
NG25
125mm NG80
Avg. haul km
150 mm
NG3
5125 mm
NG25
20125 mm
NG25
Avg. haul km
TRH4
DCP-DN 150 mm NG80
Zero haulage
Cost for 6.5 m wide pavement
USD/km incl. 100mm rip & recompact in situ layer
Zero haulage
Zero haulage
Zero haulage
100 mm NG30

Evaluation of Cost-Effectiveness and Value-for-Money of DCP-DN Design Method
Page 100
New base
100 mm
CBRsoaked= 80 New base
NG80 150 mm
New subbase
125 mm New base
150 mm
CBRsoaked= 15 CBRsoaked= 55
NG15 NG55
New base New foundation CBRsoaked= 80 Capping layer
150 mm 150 mm NG80 120 mm
DN= 5.9 New subbase
100 mmIn situ layer CBRsoaked= 43 CBRsoaked= 7 CBRsoaked= 30 CBRsoaked= 15
NG30 NG7 NG30 NG15
150 mm 150 mm 150 mm 150 mm 150 mm
DN= 6.5 DN(80P)= 9.0 DN (90)= 10.8 DN(90P)= 10.8 DN= 6.5
Moist. Ratio= 0.75 CBROMC= 25 CBR0.75 OMC= 20 CBR0.75 OMC= 38 CBR0.75 OMC= 42
CBRKLEIN= 38 CBRsoaked= 1 CBRomc= 16 CBRsoaked= 5
Soaked CBR= 4 Subgrade:<S1 Subgrade: S5 Subgrade: S3
R&R 100mm R&R 100mm R&R 100mm R&R 100mm
Site Avg. DN DCP-DN TRH4 ORN31 DCP-CBR
Tanzania: Siha: Lawate - Kibongoto km 4.34 to km 4.54 (double seal) (TLC 0.03)
9 181,25
5 20 65
13 406 17 875 29 859
26 717,71
5 20 65
5 33 990 36 969 44 958
20 37 714 40 693 48 682
65 47 701 50 680 58 669
5 38 458 41 438 49 427
20 42 182 45 161 53 151
65 52 169 55 148 63 138
5 50 443 53 422 61 411
20 54 167 57 146 65 135
65 64 154 67 133 75 122
19 337,50
5 20 65
5 24 917 29 385 41 370
20 27895,83 32 365 44 349
65 35885,42 40354,17 52 339
18 771,51
5 20 65
5 24 622 29 090 41 075
20 28196,51 32 665 44 650
65 37784,01 42252,76 54 237
DCP-DN 150 mmNG30
Cost for 6.5 m wide pavement
USD/km incl. 100mm rip & recompact in situ layer
Avg. haul km
TRH4 10mm NG80
Avg. haul km
150 mm NG7
5125 mm
NG15
65125 mm
NG15
20125 mm
NG15
100 mm NG30
Zero haulage
ORN31 150 mm NG80
Avg. haul km
DCP-CBR 150 mm NG55
Avg. haul km
120 mm NG15
Zero haulage
Zero haulage
Zero haulage
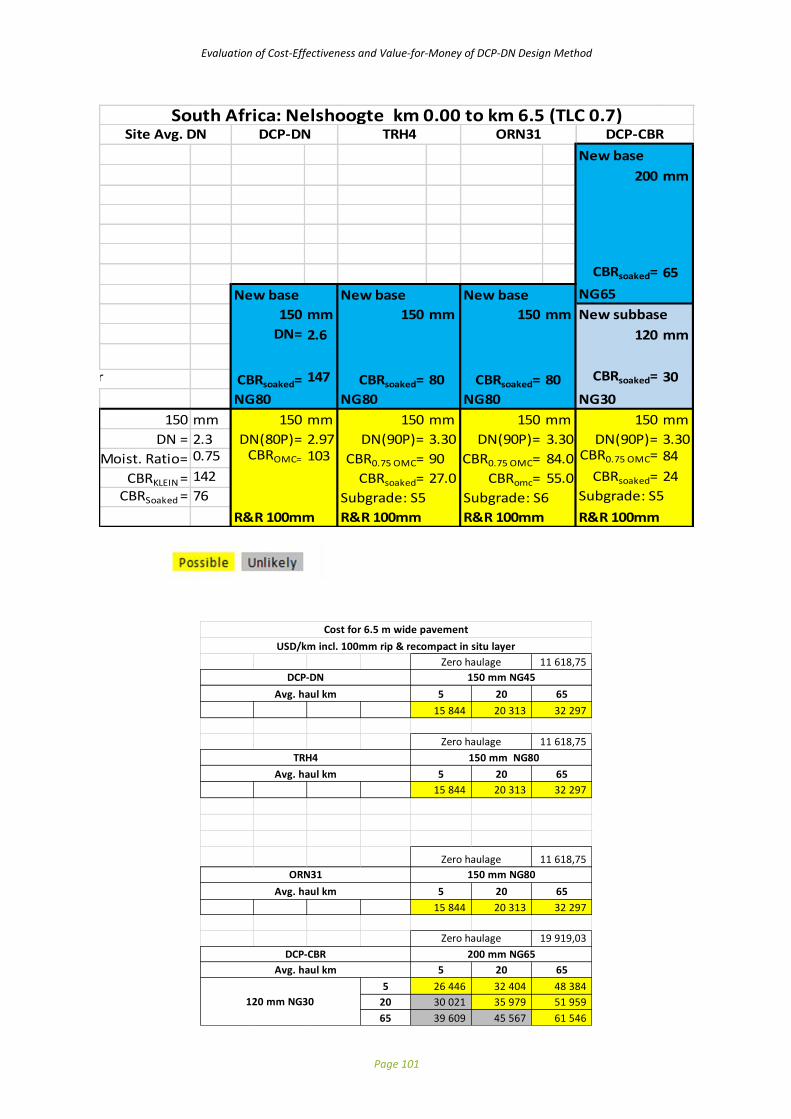
Evaluation of Cost-Effectiveness and Value-for-Money of DCP-DN Design Method
Page 101
New base
200 mm
CBRsoaked= 65
New base New base New base NG65
150 mm 150 mm 150 mm New subbase
DN= 2.6 120 mm
In situ layer CBRsoaked= 147 CBRsoaked= 80 CBRsoaked= 80 CBRsoaked= 30
NG80 NG80 NG80 NG30
150 mm 150 mm 150 mm 150 mm 150 mm
DN = 2.3 DN(80P)= 2.97 DN(90P)= 3.30 DN(90P)= 3.30 DN(90P)= 3.30
Moist. Ratio= 0.75 CBROMC= 103 CBR0.75 OMC= 90 CBR0.75 OMC= 84.0 CBR0.75 OMC= 84
CBRKLEIN = 142 CBRsoaked= 27.0 CBRomc= 55.0 CBRsoaked= 24
CBRSoaked = 76 Subgrade: S5 Subgrade: S6 Subgrade: S5
R&R 100mm R&R 100mm R&R 100mm R&R 100mm
DCP-DN TRH4 ORN31 DCP-CBRSite Avg. DNSouth Africa: Nelshoogte km 0.00 to km 6.5 (TLC 0.7)
11 618,75
5 20 65
15 844 20 313 32 297
11 618,75
5 20 65
15 844 20 313 32 297
11 618,75
5 20 65
15 844 20 313 32 297
19 919,03
5 20 65
5 26 446 32 404 48 384
20 30 021 35 979 51 959
65 39 609 45 567 61 546
Cost for 6.5 m wide pavement
150 mm NG45
USD/km incl. 100mm rip & recompact in situ layer
DCP-DN
Zero haulage
Avg. haul km
Avg. haul km
TRH4 150 mm NG80
Zero haulage
Avg. haul km
ORN31 150 mm NG80
Zero haulage
Zero haulage
120 mm NG30
DCP-CBR 200 mm NG65
Avg. haul km