evaluation of cement treated base · pdf fileevaluation of cement treated base courses ......
TRANSCRIPT

Evaluation of Cement Treated Base Courses
Technical Assistance Report Number 00-1TA
by
Kevin J. Gaspard, P.E.
Louisiana Transportation Research Center
Louisiana Department of Transportation and Development
4101 Gourrier Ave.
Baton Rouge, LA 70808
Tel: (225) 767- 9133, Fax (225) 767-9108
www.ltrc.lsu.edu
December 2000

ii

iii
Acknowledgements
The financial support and cooperation of the Louisiana Transportation Research
Center (LTRC) and the Louisiana Department of Transportation and Development
(DOTD) is appreciated.
The effort of Gary Keel in conducting FWD and Dynaflect testing is appreciated. The
assistance of Masood Rasoulian and Bryon Becnel in developing the program and
providing the data and write up for ALF Experiment 1 is greatly appreciated.
Ron Watts, John Sanders, M.M. Cryer, Vance Droody, Mike Moss, Michael
Boudreaux, Hiro Alexandrian, Cephas Bowie, Robbie Mayes, Nicholas Verrett, Rhett
Desselle, J. B. Esnard, Zhongjie Zhang are acknowledged for the development,
construction, and materials testing performed on the test section sites.
The assistance of Mark Morvant and Harold Paul in the development of the program
is appreciated.
Ken Johnston, Melba Bounds, and Paul Brady are acknowledged for their
performance of laboratory testing on these projects.

iv

v
TABLE OF CONTENTS
Page
Acknowledgement ....................................................................................................iii
List of Tables .............................................................................................................vii
List of Figures ............................................................................................................ix
Introduction ................................................................................................................. 1
Methodology ............................................................................................................... 5
Chapter 1 .................................................................................................................... 7
Chapter 2 ..................................................................................................................11
Chapter 3 ..................................................................................................................15
Chapter 4 ..................................................................................................................21
Conclusions ..............................................................................................................27
Recommendations ..................................................................................................31
References ................................................................................................................33
Appendix 1 ...............................................................................................................36
Appendix 2 ...............................................................................................................37
Appendix 3 .................................................................................................................38

vi
vii
List of Tables
Table 1 Test section projects for FWD evaluation .................................................. 4
Table 2 Previously constructed projects for FWD evaluation ............................... 6
Table 3 Project sites for dynaflect evaluation ........................................................10
Table 4 Material testing projects ..............................................................................13
Table 5 Durability criteria ..........................................................................................14
Table 6 Durability test results ...................................................................................15
Table 7 DOTD compressive strength criteria.........................................................16
Table 8 ALF Experiment 1 test lane summary ......................................................19
Table 9 Structural numbers for ALF test lanes ......................................................20
Table 10 Loading summary from ALF test lanes.....................................................21

viii

ix
List of Figures
Figure 1 Summary of resilient moduli values ............................................................ 7
Figure 2 Resilient moduli method comparison ......................................................... 8
Figure 3 Layer coefficient summary.........................................................................11
Figure 4 Layer coefficient method comparison.......................................................12
Figure 5 Unconfined compressive strength results................................................17
Figure 6 ALF loading summary.................................................................................22


1
INTRODUCTION
The Louisiana Department of Transportation and Development (DOTD)
committed approximately $160 million to its overlay program in the 1999-2000 fiscal
year. Many of the roadway projects resurfaced under this program include the
stabilization or restabilization of the existing base course with cement. DOTD strives
to construct roadways that function adequately for the duration of their projected
design life. Many roadways previously constructed with soil cement base courses
have experienced excessive shrinkage cracks which have led to premature roadway
failures and is aesthetically unappealing to the traveling Public. Often these cracks
are filled with a bituminous sealer but many are allowed to remain as is.
Soil cement is a composite material of pulverized soil, Portland cement, and
water which forms a durable structural material. It has been used throughout the
world to enhance the strength characteristics of bases for roadways, parking lots,
and buildings. When Portland cement is blended with water and soil and
compacted, a hydration process and chemical alteration of the soil begins. The
hydration process forms a paste which acts like a glue to hold the soil particles
together. This mixture hardens to form a rigid material that is durable and resistant
to rutting. Unfortunately, it also causes the material to contract, which produces
shrinkage cracks. Factors that can influence shrinkage cracking in soil cement
bases are: cement content, moisture content, density, compaction, curing, and fine
grain soils. In concrete pavement, the shrinkage due to hydration and thermal
expansion/contraction is typically mitigated with joints and reinforcement. Soil
cement is basically a low grade concrete slab. It has no reinforcement or joints to
counteract stresses and therefore must rely on the tensile strength of the material
and friction with the underlying soil to resist shrinkage.
In place cement stabilization of base courses is governed by Section 303 of
the Louisiana Standard Specifications for Roads and Bridges, 1992 edition. The
percent of cement used to stabilize the base courses is determined by one of four
methods (A,B,C,D) in DOTD TR 432M/432-99. Method B was typically used to
determine the cement percentages for the projects that will be discussed later in this

2
report. The current practice is to determine the percentage of cement that produces
a compressive strength of 300 psi at seven days for soil/aggregate or recycled
bases. This cement percentage (eight percent minimum) is used to construct a soil
cement base course that is 8.5 inches thick (hereafter referred to as stabilized
cement design).
DOTD began to construct soil cement base courses at lower cement contents
of four to six percent with thicker sections of 10 to 12 inches (hereafter referred to as
cement treated design). This was based on the philosophy that a thicker section
with lower cement content should produce an adequate structural base course and
reduce shrinkage cracks. Some states had been successful with this procedure and
it was endorsed by the Portland Cement Association (PCA). However, this design
was based on experience and lacked empirical data or strength criteria.
Consequently, the Federal Highway Administration (FHWA) Division’s office required
that the cement treated design be justified and proven to be sound. They also
wanted a criteria established to select the cement percentage based on testing.
In addition to the projects constructed on roads, experimental test sections
were constructed at the Accelerated Loading Facility (ALF). These tests were part of
a research project called Experiment 1, “Construction and Comparison of Louisiana
Conventional and Alternative bases under Accelerated Loading” [1]. Nine lanes were
constructed and tested. Six of the nine lanes contained a soil cement base or
subbase. Each of the nine lanes had a surface course of 3.5 inches of hot mix
asphaltic concrete. Though not officially part of this study, the results of the soil
cement section testing in “Experiment 1” have been included.
The objectives of this project are to determine the strength characteristics of
soil cement bases that were constructed under stabilized procedures (DOTD TR
432M/432-99) and the cement treated design philosophy. This was accomplished
by using the Falling Weight Deflectometer (FWD) to obtain resilient modulus (Mr),
the Dynamic Deflection Determination System (Dynaflect) to obtain structural
number (SN), unconfined compression testing (ASTM D 1633), and durability testing
(AASHTO T-135). Additionally, the testing conducted at ALF yields the total lane
passes and equivalent single axle loads at failure. The results of these tests were

3
compared with established design values or standards of practice by DOTD,
AASHTO, ASTM, and FHWA. If a cement treated design base course material
meets the durability, resilient modulus, and layer structural number criteria, the base
course should perform favorably for its projected design life and can be used as
design option for soil cement base courses.

4

5
METHODOLOGY
In order to begin, specific construction sites had to be located that met the
objectives of obtaining the resilient modulus, structural number, compressive
strength, and durability. This was accomplished by conducting a written survey with
the DOTD District Construction Engineers. Each was petitioned to identify
previously constructed and proposed projects with low cement content design.
Based on that survey, a list of projects to be evaluated in the time frame of this study
was compiled. Cement treated design test sections were added on two projects in
District 04 and test sections were already scheduled for monitoring in District 03 and
District 08, table 1. The data collected from these four research projects are also
included. The ALF experiment had already been completed and the data relevant to
this study has been included.
Table 1 Test section projects for FWD evaluation
Route Parish District
LA 89 Vermilion 03 LA 792 Bienville 04 LA 531 Webster 04 LA 496 Rapides 08
The testing program, along with the results for resilient modulus, layer
coefficient, material testing, and ALF are outlined in Chapters 1 – 4, respectively.

6

7
Chapter 1
FWD and Resilient Modulus
The Falling Weight Deflectometer (FWD) is a device that closely
approximates the effect of a moving wheel load, both in magnitude and duration.
The 9,000 pound load is applied through a circular plate which causes the pavement
to deflect. Once the load is applied, it is measured by a precision heavy duty load
cell which is above the loading plate. By means of a high speed transducer, the
deflection data is acquired by a computer. Through a back calculation process, the
resilient modulus (elastic modulus) is determined for each layer. The resilient
modulus (Mr) is a measure of a material’s stiffness and can provide an indication of
the condition and uniformity of a material. This number was compared to typical
values found in stabilized soil cement (200 k.s.i.) and cement treated soil (100 k.s.i.)
[2].
In flexible pavement design, resilient modulus is one of five variables used to
determine the design structural number (SN) [3]. The structural number represents
the ability of a flexible pavement to withstand the projected axle loading. The
formula for the structural number is the sum of the structural numbers for each layer
in the pavement section and is listed below [3]:
SN = a1D1 + a2D2m2 + a3D3m3
a1, a2, a3 = layer coefficients (SN/in.) representative of surface, base, and
subbase courses, respectively.
D1, D2, D3 = actual thicknesses (in) of surface, base, and subbase,
respectively.
m2, m3 = drainage coefficients for base and subbase layers,
respectively.
Once the survey of the District Construction Engineers was completed, a list
of previously constructed sites was compiled for evaluation by the FWD, as shown in
table 2. Data from the test section sites listed in table 1 included cement bases that

8
were constructed under stabilized cement design procedures as well as the cement
treated design. The goal was to locate as many sites as possible in various parts of
the State. Twelve sites were available in the time frame of this study for evaluation in
Districts 03, 04, 07, 08, 58, 61, and 62. Such a scatter of locations throughout the
State has provided representative samples. By evaluating soil cement base courses
developed by stabilized cement design and cement treated design, it was possible to
compare the cement treated design resilient modulus values to both stabilized
cement design and established design resilient modulus values. This provided an
additional performance indicator for cement treated design base courses.
Two sequences of data acquisition were used. On the projects listed in table
1, ten FWD readings were taken on each test section and then averaged to provide
a representative resilient modulus for that test section. For the projects listed in
table 2, FWD readings were taken every 0.25 miles in alternating lanes for the length
of the project. The results were averaged to provide a representative resilient
modulus for the limits of that project. The raw data from the FWD was processed by
Dynatest’s ELMOD 4 software to obtain the resilient modulus.
Table 2 Previously constructed projects for FWD evaluation
Route Parish District
LA 991 Iberville 61 LA 1054 Tangipahoa 62 LA 109 Calcasieu 07 LA 1217 Sabine 08 LA 547 Caldwell 58 LA 1221 Natchitoches 08 LA 1085 St. Tammany 62 LA 135 Franklin 58
It should be noted that six of the12 projects evaluated had multiple cement
content sections used within its limits. For clarity purposes, figure 1 illustrates the
high, low, and average resilient modulus values for each cement content section.

9
The data for each project is listed in Appendix 1. The cement treated sections (four
percent, five percent, six percent) yielded average resilient moduli of 183, 203, and
175 k.s.i., respectively. The stabilized cement sections (seven percent, eight
percent, nine percent, ten percent) yielded average resilient moduli of 174, 229, 237,
and 145 k.s.i., respectively.
FWD Results
183203
175 174
229 237
145
100
150
200
250
300
4% 5% 6% 7% 8% 9% 10%
Cement Content
Mr
(ksi
) HighLowAverage
Figure 1
Summary of resilient moduli values
In order to compare the methods, the data from the four percent to six percent
cement content sections were grouped into the cement treated design (CTD) and
the data from the seven percent to ten percent cement content sections were
grouped into the stabilized cement design (SCD). Figure 2 illustrates the high, low,
and average resilient modulus for both groups. The cement treated design’s
average resilient moduli was 195 k.s.i. while the stabilized cement design’s average
resilient moduli was 220 k.s.i.
Utilizing the Statistical Analysis System (SAS) version 6.12, a statistical
analysis (TTEST) was performed comparing the cement treated design with the
stabilized cement design. The results indicated that there was no sta tistical
difference between groups and that both had equal variance.

10
Therefore, based on the results obtained, cement treated design bases met
the established criteria and were statistically the same as stabilized cement design.
Method Comparison
195219
100
150
200
250
300
CTD SCD
Design Type
Mr
(ksi
) HighLowAverage
Figure 2
Resilient moduli method comparison

11
Chapter 2
Dynaflect and Structural Number
The Dynamic Deflection Determination system (DYNAFLECT) is a trailer
mounted device which induces a dynamic load on the pavement and measures the
resulting slab deflections by use of geophones spaced under the trailer at
approximately one foot intervals from the application of the load. The pavement is
subjected to a 1,000 pound dynamic load at a frequency of eight cycles per second,
which is produced by a counter rotation of two unbalanced flywheels. The
generated cyclic force is transmitted vertically through two steel wheels spaced 20
inches apart, center to center. The dynamic force during each rotation of the
flywheels at the proper speed varies from 1,100 to 2,100 pounds. The deflection
measurements induced by the system are expressed in terms of milli-inches of
deflection. Through a series of equations and graphs, the structural number (SN) is
determined. The layer coefficient, which is the structural number divided by the
thickness of base layer, used for soil cement base courses in flexible pavement
design by DOTD is 0.14 SN/in. Refer to Chapter 1 for details on the AASHTO
pavement design formula.
Once the survey of the District Construction Engineers was completed, a list
of sites was compiled for evaluation by the Dynaflect, table 3. Data from the test
section sites listed in table 3 included cement bases that were constructed under
stabilized cement design procedures as well as the cement treated design. The goal
was to locate as many sites as possible in various parts of the state. Six sites were
available in the time frame of this study for evaluation in Districts 03, 04, 58, 08, and
61. By evaluating soil cement base courses developed by stabilized cement design
and cement treated design, it was possible to compare the cement treated design
layer coefficient values to both stabilized cement and established design layer
coefficient values. This provided an additional performance indicator for cement
treated design base courses.

12
Table 3
Project sites for Dynaflect evaluation
Route Parish District LA 531 Webster 04 LA 870 Franklin 58 LA 960 E. Feliciana 61 LA 792 Bienville 04 LA 89 Vermilion 03 LA 496 Rapides 08
Test zones for each project except LA 496, were 1000 feet long. Segments
measuring 100 feet were established in each test zone for Dynaflect readings. Ten
readings were taken in each segment. On LA 496, each test zone was
approximately one mile long. One hundred feet segments were established in two
locations within each test zone for Dynaflect readings. Ten readings were taken in
each segment. The Dynaflect provides the structural number of the layers below it.
It does not distinguish between layers such as subbase and base. In order to
acquire the structural number of the base course (SN2), two readings were taken.
One reading was taken on the subbase (SN3) and the other was taken on the
stabilized soil cement base course (SN3+2). The structural number for the soil
cement base course was determined by subtracting (SN3+2) from (SN3). The layer
coefficient (a2) for the soil cement base course was determined by dividing (SN2 ) by
the thickness (d2) of the base course.
SN2 = SN3+2 - SN3
a2 = SN2 / d2
It should be noted that four of the six projects evaluated had multiple cement
content sections used within its limits. For clarity purposes, figure 3 illustrates the
high, low, and average layer coefficient values for each cement content section. The
data for each project is listed in Appendix 2. The cement treated design sections

13
(four percent, five percent, and six percent) yielded average layer coefficients of
0.19, 0.21, and 0.22 SN/in., respectively. There were two layer coefficient values in
the five percent cement content sections that were anomalous and not used in this
evaluation. One of the layer coefficient values was 0.39 SN/in. This value was high
due to a weak subbase. The other layer coefficient value was 0.02 SN/in. This
value was low due to a strong subbase. Each of the cement treated design sections
produced layer coefficients that exceeded the 0.14 SN/in. criteria. The stabilized
cement design sections (seven percent, eight percent, and nine percent) yielded
average layer coefficients of 0.18, 0.32, and 0.23 SN/in., respectively. Each of the
stabilized cement design sections produced layer coefficients that exceeded the
0.14 SN/in. criteria.
Dynaflect Results
0.19 0.21 0.220.18
0.32
0.23
0
0.1
0.2
0.3
0.4
4% 5% 6% 7% 8% 9%
Cement Content
Laye
r C
oeff
icie
nt
High
LowAverage
Figure 3
Layer coefficient summary
In order to compare the methods, the data from the four percent to six percent
cement content sections were grouped into the cement treated design (CTD) and
the data from the seven percent to nine percent cement content sections were
grouped into the stabilized cement design (SCD). Figure 4 illustrates the high, low,
and average layer coefficient for both groups. The cement treated design’s average

14
layer coefficient was 195 k.s.i. while the stabilized cement design’s average layer
coefficient was 220 k.s.i.
Utilizing the Statistical Analysis System (SAS) version 6.12, a statistical
analysis (TTEST) was performed comparing the cement treated design with the
stabilized cement design. The results indicated that there was no statistical
difference between groups and that both had equal variance.
Therefore, based on the results obtained, cement treated design bases met
the established criteria and were statistically the same as stabilized cement design.
Method Comparison
0.210.24
0
0.1
0.2
0.3
0.4
LC SD
Design Type
Lay
er C
oef
fici
ent
HighLowAverage
Figure 4
Layer coefficient method comparison

15
Chapter 3
Materials Testing
While the FWD and Dynaflect provide the in place resilient modulus and layer
coefficient, they do not give the unconfined compressive strength or durability of the
material. Current DOTD soil cement design criteria is based on the seven day
unconfined compressive strength of the material. In order to compare the material
properties of cement treated design with resilient modulus, layer coefficient, DOTD
design criteria, AASHTO criteria, and stabilized cement design, samples were
acquired from the locations of the Dynaflect Test sites listed in table 4. Samples
were acquired after pulverization and just prior to cement stabilization for evaluation
at the LTRC laboratory. Copies of the Density and Moisture Content worksheet
were obtained from the Project Engineer. In order to reproduce field conditions, the
laboratory samples were prepared at the cement and moisture content that was
constructed in the field. It should be noted that the soils tested were from areas of
the state where good bases and subgrades exist. Additionally, the results of material
testing for LA 89 is not included in this report. Due to variability in laboratory testing
results, a separate testing program is being conducted on the LA 89 soil and the
results will be included in a separate report.
Table 4
Materials testing projects Route Parish District Soil
group LA 531 Webster 04 A-2-4 * LA 960 E. Feliciana 61 A-1-b * LA 792 Bienville 04 A-2-4 * * See Appendix 3
It is the premise of the Portland Cement Association (PCA), that durability
(AASHTO T-135) is the primary indicator of a soil cement base course’s long term
performance. Unfortunately, it can take up to six weeks to obtain the results from a

16
durability test. In order to alleviate this, the PCA conducted a study that compares
the unconfined compressive strength to durability. They found, depending upon the
soil chemistry, that in general an unconfined compressive strength ranging from 300
to 800 psi represents a durable soil cement. However, the curves from their chart
are not representative for all soils [4]. It is believed that most States have adopted
the unconfined compressive strength criteria, which is of secondary importance
according to the PCA, because it is a simple test tha t can be completed in seven
days, unlike the durability test that can take up to six weeks.
The durability test (AASHTO T-135) consists of exposing soil cement
specimens to a series of wet and dry cycles. The procedure was begun by molding
two specimens at the desired cement and moisture content. One specimen was
used to monitor weight loss and the other was used to determine volume change.
After the specimens were molded, they were placed in a damp room at 100 percent
humidity for seven days. The specimens were then removed from the damp room
and submerged in water for five hours. Next, both specimens were placed in the
oven at 160o F for a minimum of 48 hours. The specimens were removed from the
oven. Specimen 1 was weighed and measured. Specimen 2 was subjected to
brushing with a wire scratch brush on its ends as well as longitudinally and then was
weighed. Both specimens were put through twelve cycles of wetting and drying as
previously outlined. Specimens pass the test when there was less than a two
percent change in volume in Specimen 1 and when the weight loss criteria was met
in Specimen 2, as outlined in table 5.
Table 5
Durability criteria
Soil groups Passing weight loss A-1, A-2-4, A-2-5, A-3 < 14% A-2-6, A-2-7, A-4, A-5 < 10% A-6, A-7 < 7%
Table 6 outlines the results of the durability tests and Appendix 3 lists the
data for each project. For clarity purposes, the results are illustrated by cement

17
content. It should be noted that there was one failing durability test in the five
percent content specimens and that the unconfined compressive strength was also
low. This was attributed to the fact that the specimen was made at a moisture
content that was three percent below optimum, which matched the condition in the
field. It is well know that a material prepared above or below optimum moisture
content can show a significant decrease in strength whether it is stabilized or not.
All other specimens ranging from 4 percent to 7 percent passed the durability tests.
Table 6
Durability test results
Cement content
Number of specimens
Durability test results
4% 2 Pass 5% 2 (1) Pass – (1) Fail 6% 3 Pass 7% 2 Pass
The unconfined compressive strength is governed by the soil/aggregate type,
cement content, moisture content, compaction, and curing period. Because of this,
procedures have been developed to determine the cement content based on a
specified property such as compressive and tensile strength, resilient modulus, or
durability. Compressive strength is typically used since it can be determined in a
short period of time (seven days) and because of the simpliticity of the test.
Unconfined compression testing was conducted in accordance with ASTM D1633.
Briefly, it consists of molding specimens and allowing them to cure for seven days in
a damp room at 100 percent humidity. The specimens are then loaded in
compression to failure. The load divided by the cross sectional area of the specimen
yields the unconfined compressive strength. DOTD TR 432M/432-99 outlines the
required compression strengths for Methods B and C, as shown in table 7.

18
Table 7
DOTD compressive strength criteria
Material Design compressive strength Cement stabilized or treated soil, soil-aggregate and recycled materials
(300 psi) +
Cement stabilized sand clay gravel (500 psi) + Cement stabilized sand-shell (600 psi) +
For clarity purposes, figure 5 illustrates the high, low, and average unconfined
compressive strength values for each cement content section. The data for each
project is listed in Appendix 3. There was one abnormally low unconfined
compressive strength (56 psi) in the five percent cement content sections, and it was
not illustrated in figure 5. This was attributed to the fact that the specimen was
made at a moisture content that was three percent below optimum, which matched
the condition in the field. It is well know that a material prepared above or below
optimum moisture content can show a significant decrease in strength whether it
was stabilized or not. The average unconfined compressive strengths for the (four
percent, six percent, and seven percent) sections were 200, 279, and 443 psi,
respectively. The unconfined compressive strength for the five percent cement
content section was 338 psi. The results show that the unconfined compressive
strength values for four percent and six percent cement contents are below and the
five percent and seven percent cement contents are above the 300 psi requirement.

19
Unconfined Compression Results
200
338
279
443
100
200
300
400
500
600
4% 5% 6% 7%
Cement Content
U. C
. Str
engt
h (p
si)
HighLow
Average
Figure 5
Unconfined compressive strength results

20

21
Chapter 4
Accelerated Loading Facility (ALF)
The Accelerate Loading Facility (ALF) was completed in 1995. Its purpose
was to provide accelerated loading to sections constructed under conditions similar
to roadways. It is based on Australian developed technology and was built entirely
in the United States of America by Engineering Incorporated of Hampton, Virginia at
a cost of $1.9 million. The ALF device is a transportable, linear, full-scale
accelerated loading facility which imposes a rolling wheel load on a 39 foot by 4 foot
area test pavement. Loading is one direction only, at a constant speed of 10.4 miles
per hour. Each loading cycle takes eight seconds and is applied through a standard
dual truck tire capable of loads between 9,750 pounds and 18,950 pounds. This
indicates that for each pass 1.38 to 19.7 equivalent single axle loads (EASLs) is
applied to the pavement. This allows the ALF to simulate traffic loads on a test
pavement at up to 8,100 wheel passes (11,200 to 160,000 EASLs) per day. Figure
6 displays a photograph of the ALF device. The facility is operated by the LTRC
under a contract with Louisiana State University (LSU).
In 1995 nine test lanes were constructed and subsequently loaded to failure.
The project was entitled, “Experiment 1, Construction and Comparison of
Louisiana’s Conventional and Alternative Base courses Under Accelerated Loading”.
Its purpose was to evaluate alternative soil cement base courses for shrinkage crack
reduction and structural capacity. Table 8 lists the nine sections that were
constructed under Experiment 1.

22
Table 8
ALF experiment 1 test lane summary Lane number Base course description
S-002 8.5” stone over fabric over 3.5” select soil S-003 5.5” stone over grid and fabric over 6.5” select soil S-004 4” stone over 6” stone stabilized soil over 2” select soil S-005 8.5” plant mix soil cement (10% cement content) over 3.5” select
soil S-006 8.5” plant mix sol cement (4% cement content) over 3.5” select soil S-007 8.5” plant mix soil cement (4% cement content) with polypropylene
fibers over 3.5” select soil S-008 8.5” in-place soil cement (10% cement content) over 2” select soil S-009 4” stone over 6” in-place soil cement (10% cement content) over 2”
select soil S-010 12” plant mix soil cement (4% cement content)
Six of the nine lanes contained a soil cement base or subbase type. Each of
the test lanes had a surface course of 3½ inches of hot mix asphaltic concrete
placed over the base. The subgrade beneath the base was a 5 ft. embankment
which consisted of an A-4 select silty soil. The six lanes that contain soil cement are
S-005, S-006, S-007, S-008, S-009, and S-010. Lane S-008 is considered the
standard cement design, while lane S-010 would be considered the low cement
design. Lane S-009 has a stone base and a soil cement sub base, and it may be
referred to as the stone interlayer design.
Structural characteristics of the pavement layers within the test lanes were
measured during the construction process by the Dynaflect. The Dynaflect induces
a 1,000 pound vibratory load and measures surface deflections. The structural
number (SN) of each constructed pavement layer is determined through
nomographs developed from Louisiana pavements and environmental conditions.
Table 9 displays the structural numbers from ALF Experiment 1 for the six lanes that
contain soil cement in the base or sub base. Measurements by Dynaflect revealed a
subgrade SN of less than -2 on all six lanes, which means the subgrade was very
weak. Since a negative structural number is impractical, a subgrade SN of 0 was
assumed on all six lanes. Based on this assumption, lane S-010 received a base

23
structural layer coefficient of 0.22/inch. As seen in table 9, this value for the cement
treated design was higher than that on the other five lanes, and also compares
favorably to the soil cement design coefficient of 0.14 SN/in. The overall SN on lane
S-010 was 3.1, which was also higher than that on the other five lanes. Thus, lane
S-010 provided the best overall structural characteristics as measured by Dynaflect.
Table 9
Structural numbers for ALF Experiment 1
Lane # Base Type Thickness (in)
Base SN Base coefficient
Surface SN
S-005 Plant mix
soil cement (10%)
8.5
0.8
0.09
2.4
S-006 Plant mix soil cement
(4%)
8.5
0.4
0.05
1.5
S-007 Plant mix soil cement with fibers
(4%)
8.5
0.8
0.09
1.5
S-008 In-place soil cement
(10%)
8.5
1.4
0.16
2.6
S-009 Stone in-place
soil cement (10%)
4.0
6.0
0.3
0.0
0.07
0.00
2.3
S-010 Plant mix soil cement
(4%)
12.0
2.6
0.22
3.1
The test lane sections were loaded to failure in an accelerated fashion with
the ALF device as part of Experiment 1. A development of 1 in. (25 mm) depth of
rutting or 1.5 ft/ft2 (5 m/m2) rate of cracking constituted failure for a test lane. Six of
the nine test lanes contained a soil cement base or sub base type. Table 10 lists the
loading summary from ALF Experiment 1 for the six lanes. The table contains the
lane number, the base course type and thickness, the total passes at failure, and the

24
total equivalent single axle loads (ESALs) at failure. One ESAL is equivalent to 18
kips. Lane S-009 had a pavement performance life of 1,295,000 ESALs, which was
by far the highest of any test lane. Lane S-010 had a performance life of 620,000
ESALs, which was considerably higher than that on the other four lanes with a soil
cement base.
Table 10
Loading summary from ALF Experiment 1
Lane # Base type Thickness (in.) Total passes Total ESALs
S-005 Plant mix
soil cement (10%)
8.5
225,000
310,000
S-006 Plant mix soil cement
(4%)
8.5
200,000
275,000
S-007 Plant mix soil cement with fibers
(4%)
8.5
225,000
310,000
S-008 In-place soil cement
(10%)
8.5
148,000
298,000
S-009 Stone in-place
soil cement (10%)
4.0
6.0
460,000
1,295,000
S-010 Plant mix soil cement
(4%)
12.0
250,000
620,000
Figure 6 illustrates in bar chart form the data from table 10. The figure plots
the total ESALs for each of the six test lanes with soil cement base or subbase. As
seen in figure 6, the pavement performance life of the stone interlayer lane was two
to four times as long as the other lanes. Also, the pavement performance life of the
cement treated design lane was a t least twice as long as the other four lanes.

25
200,000
400,000
600,000
800,000
1,000,000
1,200,000
To
tal E
SA
Ls
5 6 7 8 9 10
Lane Number
ALF Loading Summary
8.5" Thick
12" Thick
4" Stone & 6"Cement
Figure 6
ALF loading summary
In summary, the test section with the stone base and soil cement stabilized
subbase provided the best pavement performance of all the soil cement test lanes,
according to ALF testing. Also, the test section with the cement treated design
provided better pavement performance than the other stabilized soil cement base
course test sections.

26
27
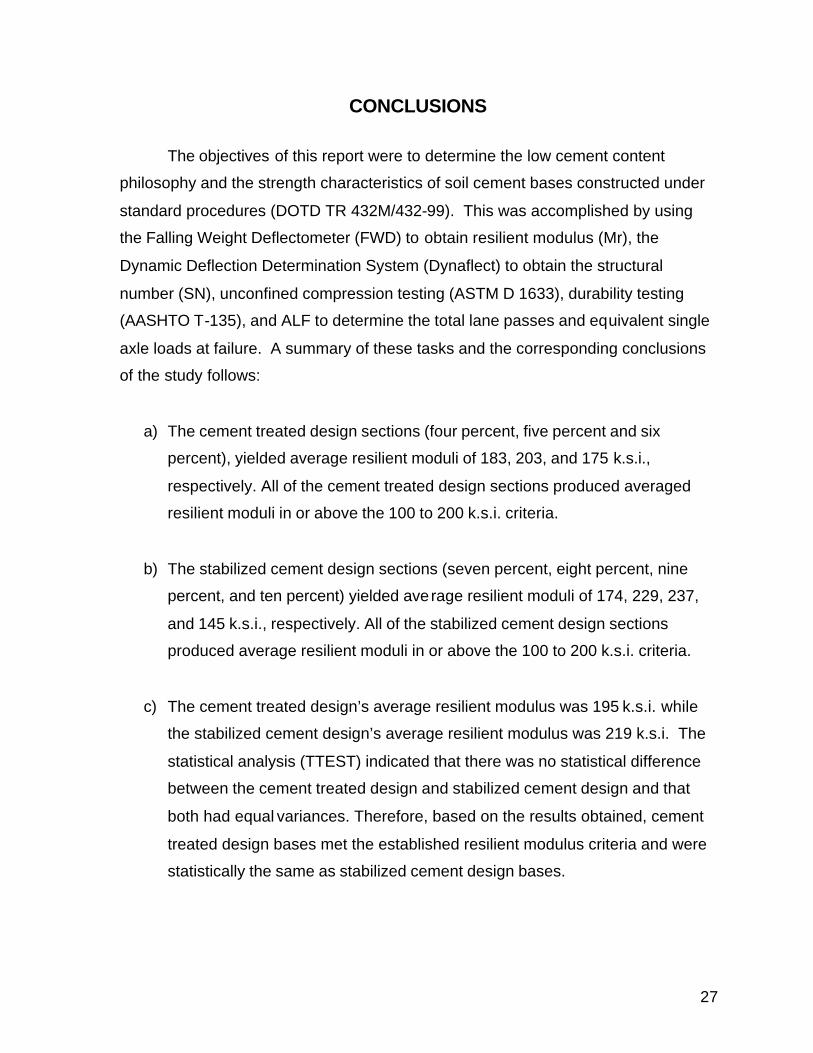
CONCLUSIONS
The objectives of this report were to determine the low cement content
philosophy and the strength characteristics of soil cement bases constructed under
standard procedures (DOTD TR 432M/432-99). This was accomplished by using
the Falling Weight Deflectometer (FWD) to obtain resilient modulus (Mr), the
Dynamic Deflection Determination System (Dynaflect) to obtain the structural
number (SN), unconfined compression testing (ASTM D 1633), durability testing
(AASHTO T-135), and ALF to determine the total lane passes and equivalent single
axle loads at failure. A summary of these tasks and the corresponding conclusions
of the study follows:
a) The cement treated design sections (four percent, five percent and six
percent), yielded average resilient moduli of 183, 203, and 175 k.s.i.,
respectively. All of the cement treated design sections produced averaged
resilient moduli in or above the 100 to 200 k.s.i. criteria.
b) The stabilized cement design sections (seven percent, eight percent, nine
percent, and ten percent) yielded average resilient moduli of 174, 229, 237,
and 145 k.s.i., respectively. All of the stabilized cement design sections
produced average resilient moduli in or above the 100 to 200 k.s.i. criteria.
c) The cement treated design’s average resilient modulus was 195 k.s.i. while
the stabilized cement design’s average resilient modulus was 219 k.s.i. The
statistical analysis (TTEST) indicated that there was no statistical difference
between the cement treated design and stabilized cement design and that
both had equal variances. Therefore, based on the results obtained, cement
treated design bases met the established resilient modulus criteria and were
statistically the same as stabilized cement design bases.

28
d) The cement treated design sections (four percent, five percent, six percent)
yielded average layer coefficients of 0.19, 0.21, and 0.22 SN/in., respectively.
Each of the cement treated design sections produced layer coefficients that
exceeded the 0.14 SN/in. criteria.
e) The stabilized cement design sections (seven percent, eight percent, nine
percent) yielded average layer coefficients of 0.18, 0.32, and 0.23 SN/in.,
respectively. Each of the stabilized cement design sections produced layer
coefficients that exceeded the 0.14 SN/in. criteria.
f) The cement treated design’s average layer coefficient was 0.21 SN/in. while
the stabilized cement design’s average layer coefficient was 0.24 SN/in. The
statistical analysis (TTEST) indicated that there was no statistical difference
between the cement treated design and stabilized cement design and that
both had equal variances. Therefore, based on the results obtained, cement
treated design bases met the established layer coefficient criteria and were
statistically the same as stabilized cement design bases.
g) The durability tests performed on the soils tested at cement contents ranging
from four percent to seven percent cement content all passed, with the
exception of one specimen at five percent cement content. The failing
specimen was prepared at three percent below optimum moisture content to
match field conditions. Passing durability tests indicates that the cement
treated design bases should perform favorably.
h) The average unconfined compressive strengths for the (four percent, six
percent, and seven percent) sections were 200, 279, and 443 psi,
respectively. The unconfined compressive strength for the five percent
cement content section was 338 psi. The results indicated that the unconfined
compressive strength values for four percent and six percent cement contents

29
were below the 300 psi requirement while the five percent and seven percent
cement contents were above it. It should be noted that the soils tested were
from areas of the state where good bases and subgrades exist.
i) The cement treated design section at ALF failed at 620,000 EASLs while the
average of the stabilized cement design sections failed at 238,600 EASLs.
Since the cement treated design section withstood approximately twice the
loading of the standard design cement sections, it can be concluded that they
should perform as well or better than the standard cement design sections.

30

31
RECOMMENDATIONS
The stabilized soil cement design method had two primary governing factors
for determining the minimum cement content, 300 psi minimum compressive
strength and an eight percent minimum cement, which can be modified by an
aggregate correction factor. Some soils may achieve the 300 psi compressive
strength minimum at less than eight percent cement, but the cement content must
be increased due the established minimum. This policy should be reviewed and
perhaps modified, requiring a lower minimum compressive strength with a five
percent minimum cement content. On the soils tested during this study, soils with
four percent cement content yielded compressive strengths as low as 172 psi and
passed the wet and dry cycle durability tests. According to the PCA, durability tests
should be used to determine the minimum cement content.
Furthermore, the layer coefficients from Dynaflect and resilient moduli from
the FWD indicated that on the soils tested, the cement treated design bases met or
exceeded current design values. Perhaps a study could be launched to correlate
lower compressive strengths categorized by soil groups versus durability tests
supported with results from the Dynaflect and FWD. A compressive strength
standard, based on soil group and parish, could be established while the
corresponding tables in DOTD TR 432M/432-99 could be revised.
Because this report contains a summary based on projects that were
available in this time frame, we recommend that a research study be conducted
statewide. The base course soil groups tested were predominately granular
materials (A-1 to A-3), which are generally good structural materials. Additional sites
should be tested with fine grain soils (A-4 to A-7).

32

33
REFERENCES
[1] Metcalf, J.M., Rasoulian, M., Romanoschi, S., and Yongqi, Li. “Construction
and Comparison of Louisiana’s Conventional and Alternative Base Courses Under
Accelerated Loading” Interim Report 1, Phase 1. Louisiana Transportation
Research Center Research Report No. 302.
[2] Rada, G.R., Rabinow, S.D., Witczak, M.W., and Richter, C.A. “Strategic
Highway research Program Falling Weight Deflectometer Quality Assurance
Software.” In Transportation Research Record 1377, TRB, National Research
Council, Washington, D.C., 1992, pp 42, table 3.
[3] AASHTO Guide for Pavement Structures, “Highway Pavement Structural
Design.” AASHTO, Washington D.C. 1993, chapter 3.
[4] Portland Cement Association, “Soil Cement Laboratory Handbook”, Portland
Cement Association, Skokie, IL, 1992, chapter 4, pp 29, figure 31.

34

35
Appendix 1
Summary of falling weight deflectometer site tests Route Parish District Cement
content (percent)
Base thickness (inches)
Surface thickness (inches)
Base modulus
(ksi) LA 991 Iberville 61 4% 12 3.5 154 5% 12 3.5 145 6% 12 3.5 152 LA 1054 Tangipahoa 62 5% 12 3.5 246 LA 109 Calcasieu 07 5% 12 3.5 216 LA 1217 Sabine 08 5% 12 3.5 177 LA 547 Caldwell 58 5% 10 3.5 172 LA 1221 Natchitoches 08 5% 12 3.5 162 LA 1085 St.
Tammany 62 5% 12 3.5 191
LA 135 Franklin 58 5% 10 3.5 162 10% 8.5 3.5 145 LA 531 Webster 04 4% 12 3.5 191 5% 12 3.5 192 6% 12 3.5 193 7% 8.5 3.5 160 LA 792 Bienville 04 4% 12 3.5 167 5% 12 3.5 186 6% 12 3.5 180 7% 8.5 3.5 187 LA 496 Rapides 08 8% 8.5 3.5 217 8% 8.5 3.5 140 8% 8.5 3.5 292 8% 8.5 3.5 266 5% 12 3.5 222 4% 12 3.5 219 (continued on next page)

36
Route Parish District Cement Content (Percent)
Base Thickness (Inches)
Surface Thickness (Inches)
Base Modulus
(ksi)
LA 89 Vermilion 03 9% 8.5 3.5 250 9% 8.5 3.5 # 222 9% 8.5 3.5 # 182 9% 8.5 3.5 241 9% 8.5 3.5 276 9% 8.5 3.5 257 9% 8.5 3.5 236 5% 12 3.5 265 5% 12 3.5 # 230 5% 12 3.5 # 270 # Base course contains polypropylene fibers

37
Appendix 2
Summary of Dynaflect Test Sites Route Parish District Cement
content (percent)
Thickness (inches)
Layer Structural
Number (SN) LA 531 Webster 04 4% 12 0.16 5% 12 0.26 6% 12 0.23 LA 870 Franklin 58 5% 10 0.39 * (&) LA 960 E. Feliciana 61 6% 12 0.27 LA 792 Bienville 04 4% 12 0.13 5% 12 0.02 ** (&) 6% 12 0.17 7% 8.5 0.18 LA 496 Rapides 08 8% 8.5 0.33 8% 8.5 0.22 8% 8.5 0.36 8% 8.5 0.37 5% 12 0.28 4% 12 0.27 LA 89 Vermilion 03 9% 8.5 0.24 9% 8.5 0.25 # 9% 8.5 0.27 # 9% 8.5 0.22 9% 8.5 0.20 9% 8.5 0.21 5% 12 0.18 5% 12 0.09 # 5% 12 0.18 # * Layer SN is high due to a weak subgrade ** Layer SN is low due to a strong subgrade # Base course contains polypropylene fibers (&) These values were not used in the data analysis process

38
Appendix 3
Summary of unconfined compression and durability tests Route Parish District Cement
Content (percent)
Unconfined compressive
strength (psi)
Durability AASHTO
T-135
Soil grade group
{1} LA 531 Webster 04 4% 172 Pass A-2-4 5% 56 {2} Fail A-2-4 6% 172 Pass A-2-4 7% 292 Pass A-2-4 LA 960 E. Feliciana 61 6% 211 Pass A-1-b LA 792 Bienville 04 4% 228 Pass A-2-4 5% 338 Pass A-2-4 6% 455 Pass A-2-4 7% 593 Pass A-2-4 {1} The group determination is based upon the gradation and classification of a
recycled soil cement base course. {2} This sample was prepared at the field moisture content that was used in the
field which was about three percent below optimum moisture content.