evaluation of capillary pressure methods via digital
TRANSCRIPT

Transp Porous Med (2015) 107:623–640DOI 10.1007/s11242-015-0459-z
Evaluation of Capillary Pressure Methods via DigitalRock Simulations
Igor Shikhov · Christoph H. Arns
Received: 5 May 2014 / Accepted: 17 January 2015 / Published online: 28 January 2015© The Author(s) 2015. This article is published with open access at Springerlink.com
Abstract Capillary pressure measurements are an important part of the characterizationof petroleum-bearing reservoirs. Three commonly used laboratory techniques, namely theporous plate (PP), centrifuge multi-speed experiment (CM), and mercury intrusion (MICP)methods, often provide nonidentical capillary pressure curves. We use high-resolution μ-CTimages of Fontainebleau and Bentheimer sandstones to derive saturation profiles numericallyin 3D at the pore scale through morphological distance transforms to simulate the aboveexperiments. In the invasion simulation, the capillary pressure is realized by using as structuralelement a ball—whose diameter is a function of a local pressure potential, which in turn isa function of radial distance in centrifuge experiment and constant throughout the sample inMICP and porous plate measurements. To assess the effect on heterogeneous rock samples,we compare the computed saturation profiles of the relatively homogeneous sandstones toa highly heterogeneous numerical model of rock generated by a mixture of a Gaussianrandom field approach for the large-scale features and two Poisson particle processes atthe small scale. The comparison of the image-based pore-scale numerical interpretationto capillary drainage experiments reveals their match and demonstrates the influence ofboundary conditions and heterogeneity on the resulting saturation profiles and capillarypressure curves. Simulated centrifuge experiments may assist in estimation of experimentalequilibrium times and provide a useful tool in speed schedule design.
Keywords Capillary pressure · Porous plate · Centrifuge · Mercury intrusion · Bentheimer ·Fontainebleau sandstone
1 Introduction
In petroleum and groundwater engineering applications, capillary pressure relationships areamong the most vital inputs required for reservoir description and modeling. Information
I. Shikhov · C. H. Arns (B)School of Petroleum Engineering, The University of New South Wales, Sydney, NSW 2052, Australiae-mail: [email protected]
123

624 I. Shikhov, C. H. Arns
about capillary pressure is used to estimate reservoir initial fluid saturations, fluid contacts,and transition zones; evaluate caprock sealing ability and displacement pressure; providessupplimentary data for relative permeability estimates and enables to predict dynamic behav-ior. One or few special core analysis laboratory (SCAL) techniques are normally used todetermine capillary pressure curves: the porous plate (PP), centrifuge (CM), and mercuryintrusion porosimetry (MICP). Due to the substantial difference in the underlying physics,these methods often provide sufficiently different pressure curves and consequently resid-uals, which are difficult to reconcile. In this paper, we consider primary capillary drainageonly.
Capillary pressures across the rock sample arise between interfaces of two immisciblefluids. Usually, one phase is considered as a wetting phase and the other as a non-wettingphase. However, intermediate cases complicating the picture are common. The drainage case,i.e., a non-wetting phase displacing a wetting phase applies to hydrocarbon migrating into apreviously water-saturated rock. Thus, the drainage data can usually be used to predict non-wetting fluid saturation at various points in a reservoir, and the imbibition data can be usefulin assessing the relative contributions of capillary and viscous forces in dynamic systems.
Of the three common methods (PP, MICP, CM) to obtain capillary pressure curves for arock core, the porous plate technique (Leverett 1941) is usually considered the most accuratesince it avoids a saturation gradient and operates with native fluids. It can be combined withother measurements, e.g., with resistivity index, leads to a relatively homogeneous saturationprofile, and allows further analysis with the core. It is a slow method—20 to 30 weeks arenot uncommon to obtain an oil–water drainage curve (Wilson et al. 2001).
Mercury intrusion capillary pressure measurements (MICP) (Purcell 1949) are fast andalso provide access to very small pores. Because of the strong non-wetting behavior ofmercury, the mercury invasion is close to ideal drainage and therefore provides an excellentmeasure of the connectivity of the pore structure. MICP also has a number of drawbacks:contamination of the sample preventing its further use, non-representative fluids, limitationson sample size, and safety/environmental issues.
Evaluation of petroleum reserves requires analysis of a vast number of cores, making timeand accuracy equally critical. The multi-speed centrifuge method (CM), first proposed byHassler and Brunner (1945), is the most obvious option for routine core analysis enablingboth speed and potentially, accuracy. In a centrifuge drainage experiment, a core saturatedwith wetting fluid is rotated while stepwise increasing rotational speeds. The core holdercontains non-wetting fluid, which is allowed to drain into the core. The amount of displacedfluid provides the estimate of average core saturation at each rotational speed ω. The rawaverage saturation data should be converted to the capillary pressure Pci at a certain point,normally at a core plug inflow face (inlet). Correspondingly, an average saturation S needsto be converted to a saturation at that point S(Pci). That transform (S, ω) → (S, Pc) is themajor complication of the centrifuge technique as no analytical solution exists.
Numerous approaches have been proposed to transform average saturation of a centrifugedcore to a saturation at the inlet: Hassler and Brunner (1945) approximation (HB), “typecurves” by Bentsen and Anli (1977), “an exact equation” of van Domselaar (1984), “the-oretically correct analytical solution” by Rajan (1986), and Ruth’s (1988) iterative match,to mention just few. All those techniques have been found to be approximations. A goodaccount of comparing 13 data reduction techniques can be found in Seth (2006). Forbes(1997) who analyzed 19 various techniques pointed out that for typical centrifuging condi-tions, the HB approximation can provide a poor estimate, while other known interpretationtechniques provide estimates with associated error of ±3 saturation units at best (in additionto experimental error).
123

Digital Rock Evaluation of Capillary Pressure Methods 625
One long-standing problem associated with centrifuge capillary pressure measurements isan inaccurate estimate of average saturation at equilibrium for each rotational speed (O’Mearaet al. 1992). Furthermore, the lack of knowledge about an appropriate speed schedule maylead to a low-quality data set (a few useful saturation points at equilibrium) even for extremelylong measurements (Ruth 2006; Ferno et al. 2007). An equilibrium state for a given rotationalspeed can be defined as the saturation where no additional fluid production is observed. Thedifficulty in estimating the time required to reach an equilibrium in centrifuge experiments hasbeen discussed by Slobod et al. (1951), Hoffman (1963), Szabo (1972), Ward and Morrow(1987), Fleury et al. (2000), Seth (2006), Ferno et al. (2007). From a practical point ofview, the criteria of equilibrium include either the absence of observable production over acertain period of 1–24 h, (Hoffman 1963; Seth 2006; Ferno et al. 2007) or a fixed time step(Szabo 1972). The time required to establish equilibrium state of two phases saturating therock sample mainly depends on permeability and wettability conditions. While generally24 h is accepted as an appropriate time step between the rotational speed increments, itobviously may not work equally well for all rocks, considering that permeability may varyby as much as eight orders of magnitude (between shale to benchmark rocks). Anotherpossible explanation for the variable time to reach equilibrium, and why equilibrium isdifficult to foresee in samples with comparable permeability, was proposed by Ward andMorrow (1987). They emphasized the influence of fluid connectivity provided through liquidwedges retained at the corners of pores and through surface roughness of natural porous rocks.The difficulty in estimating the degree of connectivity in natural rock may explain why itis yet not resolved how long a core plug needs to be spun to reach saturation equilibrium.The proposed numerical model does not answer directly the question about the productionrate during centrifuging; instead, it inherently reproduces a static final equilibrium state. Thismay be practically employed to estimate production between centrifuge speed incrementsallowing to apply time required for eqilibration, thus enable a meaningful speed scheduledesign.
In recent years improvements in the interpretation of centrifuge experimental resultshave been achieved by the development of techniques enabling registration of satura-tion profiles, including CT-assisted imaging (Wunderlich 1985), nuclear tracers imag-ing (Graue et al. 2002), NMR transverse relaxation (Kleinberg 1996), and MRI (Greenet al. 2008). For cores exhibiting higher permeability, this poses the problem that flu-ids tend to redistribute quickly and the actual saturation profiles are difficult to estab-lish.
While the previously proposed approaches rely on experiments, we develop a pore-scaletechnique characterizing the saturation distribution within the centrifuged rock plug basedon mathematical morphology and a realistic digitized representation of the sample. In thepresent paper, we aim to examine the three main capillary techniques using numericallysimulated drainage on realistic rock morphologies derived from 3D digitized tomographicimages. Focus is given to centrifuge technique as it has not been simulated before usinga combination of μ-CT and morphological transforms. The organization of the paper is asfollows: In the next section, the theoretical background to the centrifuge drainage capillarypressure technique is given and associated data reduction problems are discussed. In thefollowing section, we describe in detail the numerical approach and describe the simula-tions on Fontainebleau and Bentheimer sandstones, and GRF model structure. Comparisonsof the simulated capillary drainage curves to experiment are given thereafter, followed byconclusions.
123

626 I. Shikhov, C. H. Arns
Fig. 1 Schematic diagram of thecentrifuge drainage method. Inrotating Cartesian referenceframe (RCRF), the axis ofrotation is aligned along theZ-axis and the long axis of a coreplug is along the transverse axisX. In the text, a radial distance ris a distance along the X-axis inRCRF; ri denotes a discrete valueof r
2 Theoretical Summary
At hydrostatic equilibrium, fluids saturating a porous medium subjected to centrifuging aredistributed following centrifugal force field (and its history). Below we express equationsrelating to capillary drainage in terms of centrifugal force field potential. This enables general-ization and makes accomodation of gravity and radial effects easier. The classical expressionof radial centrifugal force acting on an element of mass m is following:
Fc = mac(r) = mω2r = − d
drUc(r), (1)
where r notes the distance from the axis of rotation, ac(r) centrifugal acceleration, ω theangular frequency, and Uc(r) the potential energy in the centrifugal force field (see Fig. 1).
Correspondingly, integration of (1) with respect to r provides the expression of a potential(potential energy per unit mass) which is defined by the following:
Ψc(r) = Uc(r)/m = −1
2ω2r2. (2)
It is easy to see that at hydrostatic equilibrium, capillary pressure Pc and potential Ψc areconnected through the simple relationship:
dPc = −�ρ dΨc, (3)
where �ρ is the difference in density.A general expression for the potential combining gravity, centrifugal force, and a back-
ground energy independent on position (e.g., stepwise applied pressure) is:
Ψc(r, z, ω) = Ψo + gz + 1
2ω2r2, (4)
where g is gravitational acceleration. Here, we neglect the gravity term, so that for CMexperiment dΨ/dr = −ω2r . For PP and MICP, the potential is independent on radial positionalong the core; dΨ/dr = 0.
Assuming that a core is homogeneous, the grain matrix incompressible, and interfacialtension constant (isothermal conditions), the pressure potential along a sufficiently short coresubjected to spinning can be described by the following simple integral (Hassler and Brunner1945):
Ψc =∫ r
r2
ω2r dr, (5)
where r2 is the radial distance from axis to the outer face of the core plug and r the radialdistance from the axis to an arbitrary point of the plug (see Fig. 1). By applying the limits,
123

Digital Rock Evaluation of Capillary Pressure Methods 627
the change in potential energy for the particle moving from arbitrary position r to r2 in thedirection of the centrifugal acceleration is given by:
Ψc = 1
2ω2 (
r22 − r2) + Ψc,outlet. (6)
For the Hassler–Brunner outflow boundary condition of Ψc = 0 (for a discussion seee.g., O’Meara et al. 1992), negligible equilibration time, absence of end piece and radialeffects, absence of bubble formation, and short core approximation: r1/r2 ≈ 1, Eq. (6) maybe reduced to:
Ψc,inlet = (1/2)ω2 (r2
2 − r21
), (7)
where r1 is the distance from the rotational axis to the near end (inlet face) of core. We usethe expression for potential Ψ to define a local capillary radius R to set an interface of fluidssaturating a core (see next section). In the experimental part (see Sect. 6), we use a traditionalinterpretation which involves match of observed average saturation to inlet capillary pressure.The most relevant equations are summarized below.
The general mathematical expression describing a centrifuge experiment, where observedaverage saturation (S) is connected to pressure potential (Ψc) through the various parameters,can be represented as an integral sum of the local saturations along the length of the core andgiven by the following:
S =∫ Ψc,inlet
0S(Ψc) dΨc. (8)
Making the usual assumption that the projection (intersection) of a sample on equipotentialsurface is slender enough (Ayappa et al. 1989), the average saturation can be represented asthe integral sum of the local saturations along the core:
S = 1
r2 − r1
∫ r2
r1
S(r) dr. (9)
By manipulating (9) and neglecting radial and gravity effects, the average saturation fordrainage in the centrifugal field in respect of the inlet is given by Hassler and Brunner (1945)in integral form:
S = 1 + 1 + √1 + B
2
∫ 1
0
Sξ (ξ Pci)√1 − Bξ
dξ, (10)
where ξ = Pc/Pci is a dimensionless variable and B = 1 − r1/r2. The Hassler–Brunnerexpression suggests a simple solution for B → 0, which practically implies short cores:
S =∫ 1
0Sξ (ξ Pci) dξ. (11)
This expression may be written in a differential form as (referred in the text as HB approxi-mation):
S(Pci) = S + PcidS
dPci(P). (12)
We use both the HB approximation and Forbes method (Forbes 1997) for experimental datainterpretation.
123
628 I. Shikhov, C. H. Arns
3 Numerical Model
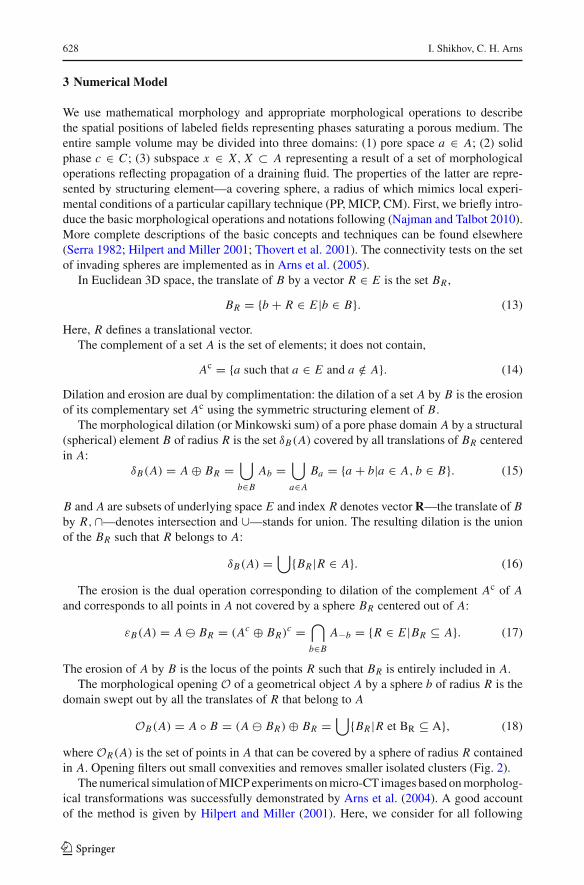
We use mathematical morphology and appropriate morphological operations to describethe spatial positions of labeled fields representing phases saturating a porous medium. Theentire sample volume may be divided into three domains: (1) pore space a ∈ A; (2) solidphase c ∈ C ; (3) subspace x ∈ X, X ⊂ A representing a result of a set of morphologicaloperations reflecting propagation of a draining fluid. The properties of the latter are repre-sented by structuring element—a covering sphere, a radius of which mimics local experi-mental conditions of a particular capillary technique (PP, MICP, CM). First, we briefly intro-duce the basic morphological operations and notations following (Najman and Talbot 2010).More complete descriptions of the basic concepts and techniques can be found elsewhere(Serra 1982; Hilpert and Miller 2001; Thovert et al. 2001). The connectivity tests on the setof invading spheres are implemented as in Arns et al. (2005).
In Euclidean 3D space, the translate of B by a vector R ∈ E is the set BR ,
BR = {b + R ∈ E |b ∈ B}. (13)
Here, R defines a translational vector.The complement of a set A is the set of elements; it does not contain,
Ac = {a such that a ∈ E and a /∈ A}. (14)
Dilation and erosion are dual by complimentation: the dilation of a set A by B is the erosionof its complementary set Ac using the symmetric structuring element of B.
The morphological dilation (or Minkowski sum) of a pore phase domain A by a structural(spherical) element B of radius R is the set δB(A) covered by all translations of BR centeredin A:
δB(A) = A ⊕ BR =⋃b∈B
Ab =⋃a∈A
Ba = {a + b|a ∈ A, b ∈ B}. (15)
B and A are subsets of underlying space E and index R denotes vector R—the translate of Bby R,∩—denotes intersection and ∪—stands for union. The resulting dilation is the unionof the BR such that R belongs to A:
δB(A) =⋃
{BR |R ∈ A}. (16)
The erosion is the dual operation corresponding to dilation of the complement Ac of Aand corresponds to all points in A not covered by a sphere BR centered out of A:
εB(A) = A BR = (Ac ⊕ BR)c =⋂b∈B
A−b = {R ∈ E |BR ⊆ A}. (17)
The erosion of A by B is the locus of the points R such that BR is entirely included in A.The morphological opening O of a geometrical object A by a sphere b of radius R is the
domain swept out by all the translates of R that belong to A
OB(A) = A ◦ B = (A BR) ⊕ BR =⋃
{BR |R et BR ⊆ A}, (18)
where OR(A) is the set of points in A that can be covered by a sphere of radius R containedin A. Opening filters out small convexities and removes smaller isolated clusters (Fig. 2).
The numerical simulation of MICP experiments on micro-CT images based on morpholog-ical transformations was successfully demonstrated by Arns et al. (2004). A good accountof the method is given by Hilpert and Miller (2001). Here, we consider for all following
123

Digital Rock Evaluation of Capillary Pressure Methods 629
Fig. 2 A series of centrifuge saturation RPM-maps attained on a beeds pack model. a RPM-map attained in4,000–6,000 rpm interval; b expanded speed interval 4,000–8,000 rpm; c a mapped rotational speed intervalfurther expanded to 4,000–21,000 rpm. In case of MICP and PP, the fluid would propagate through all thethroats (white circles) once the far-left one is percolated, while CM requires further increase in rotationalspeeds due to the pressure potential Ψc drop toward the outlet (right end)
numerical drainage experiments an idealized wettability model: Solid is presumed to betotally wet to a wetting fluid, i.e., a contact angle of θw−s = 180◦, while perfectly non-wetto the invading phase. Fluids are immiscible and incompressible, residual saturation due toelectrokinetic interaction of wetting fluid with solid surface is ignored as well as snap-offeffect at the outlet boundary. All three drainage experiments (PP, MICP, CM) are simulatedin 3D by considering the invasion of a digitized image by a continuous structure using asstructuring element BR—a ball of a radius R inversely proportional to pressure potentialΨc(r). In a general case, the radius of a structuring element BR(ω, x), where x is a radialcoordinate and ω—radial speed, may be expressed as following:
BR(ω, x) : R(B) = −2σ cos(θr)/(�ρ Ψc(ω, x)), (19)
with receding contact angle θr , pressure potential Ψc, surface tension σ , and density difference�ρ. In PP and CM experiments, boundaries other than inlet and outlet faces are completelyclosed and the invasion occurs just from one side (inlet, Figs. 1, 3c–d, g–h, left), while forMICP, invasion occurs from all sides (Fig. 3e–f). The outlet boundaries for PP and CMare given by semi-permeable membranes which only the wetting fluid can traverse (withoutresistance), while for MICP, the defending phase is considered to be vacuum. The porousplate (PP) drainage experiment is characterized by a slow propagation of invading non-wetting fluid from the inlet side of a sample toward the opposite outlet side, displacingwetting fluid initially saturating the sample. Wetting fluid is allowed to go through a fluidplate or membrane attached to the outlet impermeable for the draining fluid, so the outerboundary is effectively closed. Following the assumptions used in the present paper at anygiven pressure step, the pressure potential Ψc is constant all across the sample. The spatialposition of draining and displaced phases is described by a maximum inscribed sphere BR
of a radius R, which is placed on one side of the medium and allowed to progress throughthe system until it reaches a pore that cannot be traversed without overlapping the interface.The saturation map relative to the particular pressure step can then be produced. The radiusis decremented and the traverse step is repeated until the sphere is becoming trapped. Thisprocess continues until the discretized sphere macroscopically traverses the medium. ForPP and MICP, a series of capillary pressures is considered by increasing the pressure of theinvading phase, leading to a particular saturation map for each step in capillary pressure(R = const) with a constant structuring element BR (Arns et al. 2005). These saturationmaps are combined into a single field by storing for each voxel the largest invasion radiuswhen the voxel is drained (Fig. 3c–f). A saturation map for a particular capillary pressure
123

630 I. Shikhov, C. H. Arns
Fig. 3 Central x–z slices through the 3D structures and simulated invasion maps. Core length in all cases is15 mm. Left Fontainebleau sandstone (1,024 × 1,024 × 4,096 voxels; x–z slice at y=512 level). Right GRFmodel structure (1,600 × 1,600 × 3,200 voxels; x–z slice at y=800 level). a, b phase images, c, d porousplate, e, f MICP and g, h centrifuge drainage profile, respectively. The inlet (PP, CM) is on the left side, oron all sides (MICP). The color bars denote the invasion radius for which a voxel can be first invaded in voxelunits (c–f), or the rotational speed in rpm at which a voxel is drained (g, h). The region close to the outlet(g, h) desaturates only at high rotational speeds
can then be extracted by thresholding this field with a desired radius cutoff corresponding toa target capillary pressure.
For the centrifuge capillary pressure simulation, the approach is similar, with the differencethat for a given rotational speed, the size R of BR is now a function of radial distance x fromthe inlet and R = R(x) (see Fig. 1). The size of the structuring element BR can be calculatedvia equation (6), (19) by converting the capillary pressure at location x to an equivalentcapillary pressure, leading to a structuring element BR(x). A saturation map is now definedfor each chosen rotational speed, and the natural way of accumulating all saturation maps isby storing the rotational speed at which a particular voxel is drained (Fig. 3g, h). A saturationmap for a particular rotational speed, representing a whole range of capillary pressures, canthen be recovered by thresholding this RPM-map (rotations per minute).
4 Rock Sample Representation
The numerical model of capillary drainage techniques was first tested on two idealized sam-ples in this study. The first represents a homogeneous sample and consists of a 15 mmlong and 3.75 mm wide reconstructed Fontainebleau sandstone using a stochastic geomet-
123

Digital Rock Evaluation of Capillary Pressure Methods 631
rical model (Latief et al. 2010). We consider the discretisations provided at resolutionsof 1.83 µm (512 × 512 × 2, 048 voxel), 3.66 µm (1, 024 × 1, 024 × 4, 096 voxel), and7.32 µm (2, 048×2, 048×8, 192 voxel). These reconstructions were shown to reproduce theMinkowski functionals of the original imaged rock samples as well as e.g., local percolationproperties (Latief et al. 2010). We use the different discretisations to discuss discretisationeffects for the CM method in the discussion section. The bulk porosity of the sample isφ = 13.6 %, and we calculated the permeability to be about k = 1.18 ± 0.04 D using a MPIparallel LBM method with Cartesian decomposition based on Arns (2004). The permeabilitycalculations were carried out on 1, 0243 blocks of the reconstructed Fontainebleau image ata resolution of 1.831 µm, e.g., on blocks of sidelength 2 mm, significantly above the sizeconsidered in Arns (2004). Compared to the experimental data in Fredrich et al. (1995), Arns(2004), this is slightly higher than that expected for the porosity of 13.6 %.
The second sample is constructed as a dual-scale medium by using a Gaussian RandomField (GRF) to spatially separate two independent Poisson particle placement processes ofspheres (r = 12 voxel) and oblate disks (half-axes a = b = 24, c = 3 voxel), discretised ata resolution 4.688 µm (1, 600 × 1, 600 × 3, 200 voxel). We follow the technique of Cahn(1965), Roberts (1997), Arns et al. (2004) to generate a GRF and use the field-field correlationfunction
g(r) = e−r/ξ − (rc/ξ)e−r/rc
1 − (rc/ξ)
sin 2πr/d
2πr/d, (20)
where rc = 0.4033, ξ = 0.4031, d = 7.7069 in voxel units (see Roberts 1997; Arns et al.2004). We take a symmetric 1-level cut through the resulting field to separate the space intotwo equal partitions. The particle density of the Poisson processes is chosen such that theporosity in both partitions is φ = 30 %. The length of the samples (15 mm) is selected tobe sufficiently short in respect of standard Beckman centrifuge distance to inlet to test theHassler–Brunner approximation (Hassler and Brunner 1945), which is supposed to work wellif r1/r2 > 0.7. Here, we have r1 = 7.1 cm and r2 = 8.6 cm and therefore r1/r2 = 0.83.Cross sections of the considered samples are depicted in Fig. 3, first row.
Comparison between simulation and experiment was performed on Bentheimer sandstone(see Sect. 6).
To aid the comparison of samples and provide a measure of heterogeneity, we derive thevariograms of the digital representations of all samples; Fontainebleau sandstone at 3.66 µmresolution, GRF/Boolean (4.688 µm resolution), and Bentheimer (2.89 µm resolution). Weuse the approach taken in Marcotte (1996), Arns et al. (2005) to calculate smoothed surrogatemeasures of the Minkowski functionals. The Minkowski measures itself are derived using thealgorithm introduced in Arns et al. (2001). In the notation of Arns et al. (2005), we define theintrinsic volumes Vk(Y ) of a body Y in R
3 as V0(Y ) = χ(Y ), V1(Y ) = 1π
M(Y ), V2(Y ) =12 S(Y ), and V3(Y ) = V (Y ). We can then define the curvature measures CX,i of a given (andthen fixed) random structure X for a variable set B in R
3 as CX,i (B) = Vi (X ∩ B). Weuse as Ba sphere b of radius R = 5 voxel which provides the support of the measurements.The sphere is moved over the structure X to derive a field of curvature measures Zi (x) =Ci (b(x, R)) for x ∈ R
3, from which the variograms are derived; γi (r) = 12 〈(Zi (o)−Zi (r))2〉.
The variograms are depicted in Fig. 4 and normalized by their respective variances. Meanand variance for each measure with respect to the macro-solid (grain) fraction are given inTable 1. The GRF/Boolean model was constructed with constant porosity across both large-scale partitions generated by the GRF model. Accordingly, we see only the short correlationlength of the Boolean model reflected in γ3(r)/σ 2
3 (Fig. 4d). However, both the length scale ofthe GRF coarse-scale structure controlling the distribution of the Boolean sphere models and
123

632 I. Shikhov, C. H. Arns
(a) (b)
(d)(c)
Fig. 4 Normalized variograms γi (r)/σ 2i (see Table 1) of the intrinsic volumes and curvature measures
CX,i (B) of the reconstructed Fontainebleau sandstone, the GRF/Boolean model, and Bentheimer sandstonefor R = 5 voxels following the notation of Arns et al. (2005). a Euler characteristic χV , b integral meancurvature MV , c surface area, SV , and d volume VV
Table 1 Mean μ and variance σ of the curvature measures CX,i for reconstructed Fontainebleau sandstone,the GRF/Boolean model, and Bentheimer sandstone
Sample and moment χV (mm−3) MV (mm−2) SV (mm−1) VV
Fontainebleau (3.66 µm resolution)
μ −566 −1,800 88.7 0.865
σ 11,300 10,500 156 0.276
GRF/Boolean
μ 1,780 −14, 200 283 0.700
σ 20,700 21,500 176 0.285
Bentheimer
μ −1,910 −3,380 181 0.763
σ 34,800 25,750 244 0.346
the short length scales associated with the sphere radii are reflected in γ1(r)/σ 21 and γ2(r)/σ 2
2 .A single-phase REV based on the two-point correlation function is typically reached at about5–10 times the correlation length (Joshi (1974)). This would imply an REV of less than 1 cm3
for all structures. For two fluid phases, it is known that the REV can be substantially larger(Arns et al. 2003). Given that the correlation lengths for some of the structural measures arean order of magnitude larger for the GRF/Boolean model than for both Fontainebleau and
123
Digital Rock Evaluation of Capillary Pressure Methods 633
(a) (b)
(d)(c)
(e) (f)
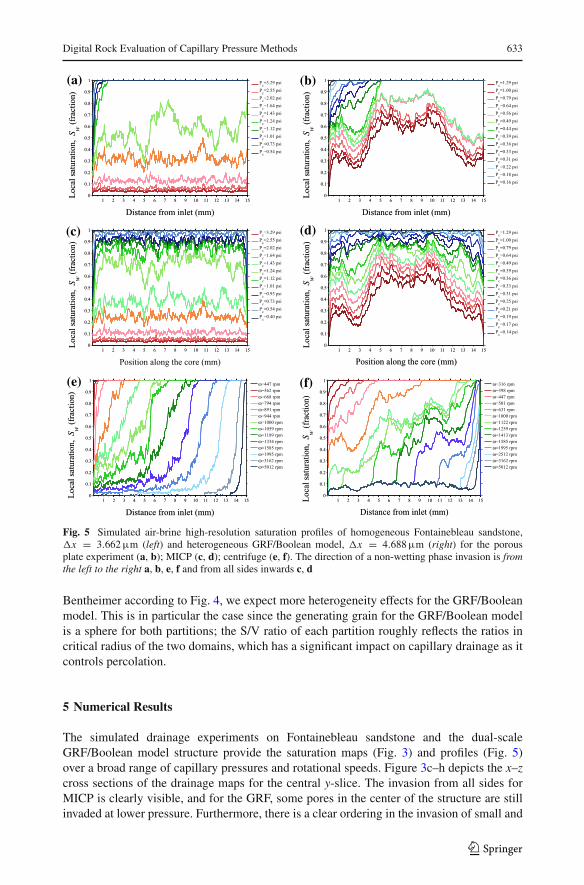
Fig. 5 Simulated air-brine high-resolution saturation profiles of homogeneous Fontainebleau sandstone,�x = 3.662 µm (left) and heterogeneous GRF/Boolean model, �x = 4.688 µm (right) for the porousplate experiment (a, b); MICP (c, d); centrifuge (e, f). The direction of a non-wetting phase invasion is fromthe left to the right a, b, e, f and from all sides inwards c, d
Bentheimer according to Fig. 4, we expect more heterogeneity effects for the GRF/Booleanmodel. This is in particular the case since the generating grain for the GRF/Boolean modelis a sphere for both partitions; the S/V ratio of each partition roughly reflects the ratios incritical radius of the two domains, which has a significant impact on capillary drainage as itcontrols percolation.
5 Numerical Results
The simulated drainage experiments on Fontainebleau sandstone and the dual-scaleGRF/Boolean model structure provide the saturation maps (Fig. 3) and profiles (Fig. 5)over a broad range of capillary pressures and rotational speeds. Figure 3c–h depicts the x–zcross sections of the drainage maps for the central y-slice. The invasion from all sides forMICP is clearly visible, and for the GRF, some pores in the center of the structure are stillinvaded at lower pressure. Furthermore, there is a clear ordering in the invasion of small and
123

634 I. Shikhov, C. H. Arns
(b)(a)
Fig. 6 Comparison of the simulated capillary pressure curves with the Hassler–Brunner approximation. Thepoint sets depict the capillary pressure curves for a selection of equally spaced slices along the core for thecentrifuge drainage simulation case, thus enabling a comparison of the average capillary saturation relationshipwith local measurements, which for the homogeneous case (top) coincide. a Fontainebleau sandstone. bGRF/Boolean structure
large porosity for the GRF/Boolean system. Figure 3 also illustrates the relative homogeneityof the saturation profiles for PP and MICP away from the boundaries.
Figure 5 shows the relative homogeneity of the saturation profiles for the PP method. Incomparison, the saturation profiles for the centrifuge method show strong trends reflecting thespatial gradient in the potential function. The maps as well as the saturation profiles illustrateclearly the difference in propagation of a saturation front a) for the different capillary drainagetechniques and b) between homogeneous Fontainebleau sandstone and the heterogeneousdual-scale GRF/Boolean model system. The dual-scale structure of the GRF model alreadyillustrated using the variogram technique (Fig. 4) leads to larger-scale variability in thesaturation profile (Fig. 5b, d, f). The resulting capillary pressure curves according to (7) aredepicted in Fig. 6.
6 Validation by Experiment
We compare numerically simulated MICP and centrifuge drainage to experiment using Ben-theimer sandstone samples and their digitized representation.
The CM and MICP experiments were performed on Bentheimer core plugs of (2.5 cmdiameter, 2.5 cm length) and (0.5 cm diameter, 1.5 cm length), respectively. The brine porositywas measured as φ = 23.3 %. The MICP experiment was performed using a QuantachromePoreMaster PM33-17 porosimeter. Acquired data were reduced assuming a surface tensionvalue σHg−vac = 480 dynes/cm2 and a contact angle σ = 140◦. CM experiments were per-formed using Beckman L60 M/P ultra-centrifuge (PIR-20 rotor) with 12 h between rotationalspeed increments (22 steps in total). Increments were 50 rpm at the low-speed region (below1200 rpm) then gradually increased. The displaced volume of brine was visually registeredwith the aid of stroboscope and graduated pippets of the bucklets containig the centrifugedsamples following the standard procedure. Raw data were reduced using Forbes method(Forbes (1997)) accounting for gravity and radial effects.
The numerical part was performed on a 2.89 µm resolution μ-CT image of 1, 800 ×1, 024 × 1, 024 voxels. The image was mirrored twice, resulting in dimensions of 5, 400 ×1, 024 × 1, 024 voxels corresponding to a real physical length 1.5 cm (see Fig. 7, top). Thecorresponding centrifuge drainage RPM-map is given in Fig. 7, bottom. Note that the outletis on the left side. Furthermore, the highest RPM simulated is lower than in Fig. 3, thus
123

Digital Rock Evaluation of Capillary Pressure Methods 635
Fig. 7 Central slices through the Xray μ-CT image of Bentheimer sandstone. Top: 1, 024 × 1, 024 × 1, 800voxels μ-CT image at 2.89 µm resolution, mirrored twice such that the length in drainage direction for theCM simulations corresponds to 1.5 cm. Bottom: saturation RPM-map of CM drainage. The invasion directionis indicated by a red arrow
(a) (b)
Fig. 8 Saturation profiles attained on the μ-CT image of Bentheimer sandstone. a simulated MICP on 1, 800×1, 024 × 1, 024 voxels image, b simulated CM on 5, 400 × 1, 024 × 1, 024 voxels (twice-mirrored) image.Pressures are converted to air/water
a significant part of the sample has not been invaded. The propagated draining fluid (air)as a function of rotational speed (rpm) is coded by different colors. Note a perceivableheterogeneity of Bentheimer expressed as fingering of propagating drained fluid at 750,950, 1,100, and 1,500 rpm. Furthermore, the induced symmetry by mirroring the sample isreflected as saturation spikes in Fig. 8.b. This is likely due to a shift in connectivity across themirrored boundaries, where some pore space can only be drained at relatively elevated RPMs.
We compare in Fig. 9 the simulated capillary pressure curves to the experimentally derivedones. Both simulated and experimental MICP capillary pressure curves are converted to air-water fluid pairs (σw−air = 72 dynes/cm2) to enable comparison to PP/CM data. There isvery good agreement between the MICP simulation and experiment. The match betweenexperiment and simulation for CM is acceptable.
123

636 I. Shikhov, C. H. Arns
Fig. 9 Comparison of simulatedand experimental MICP (solidlines) and CM (dashed lines)primary capillary drainage curvesobtained on Bentheimersandstone. Circularmarkers—experimental anddiamonds markers—simulateddata points. Pressures areconverted to air/water
7 Discussion
Both simulated MICP and CM primary drainage capillary pressure curves attained onthe Bentheimer μ-CT image being adjusted for air–water pair almost perfectly coincide,except for the very high saturation region where the observed difference is due to thespecific boundary conditions (see Fig. 9). In the low-saturation region, simulated curvesdeviate substantially from experiment due to the image resolution limit: the unresolvedclay region, which has a volume fraction of 1.5 %, contributing about 0.7 % porosity,would in principle account for the steep end of the curve together with fine-scale sur-face roughness. In the medium saturation region, the simulated MICP agrees well withexperiment; however, the measured CM capillary pressure curve deviates from the othercurves. Simulations were performed in assumption of perfect wetting conditions, i.e.,receding angle θr = 0◦ and uniform and known surface tension values of σw−air andσHg−vac. While 0◦ is often used in numerical models (Øren and Bakke 2003; Zhao et al.2010), in a real experiment the contact angle of natural rock (without plasma clean-ing or firing) may depart quite significantly from that ideal value. In the future, weplan to extend this work to include nonzero contact angles, which can, e.g., be intro-duced morphologically using the level-set method (Sethian 1999; Prodanovic and Bryant2006).
Other factors include sample shape and size, which result in different entry effects. Sim-ulations were performed on samples represented by a rectangular slender prism, 5 mm long(mirrored twice in case of CM for a total length of 1.5 cm), while cylindrical samples of25 mm length were used in the experiments.
We finally consider discretization effects in the numerical approach using the reconstructedFontainebleau sandstone sample at different resolutions for the case of the CM method.Figure 10a, b shows the saturation profiles of Fontainebleau at higher (�x = 1.831 µm)and lower (�x = 7.324 µm) resolution than in Fig. 5e, as well as the respective dif-ferences to �x = 3.662 µm. A positive difference indicates higher saturation for higherresolution. The largest absolute errors occur closer to the saturation front, where onlythe higher curvatures occur and where the saturation profile is steepest. This is associ-ated with the discretization of a sphere on the lattice becoming increasingly inaccurate forsmall sphere diameters affecting both percolation through constrictions and into crevices.The error is in general well below 0.1 saturation units for the steepest part of the curveor below about 10 % relative error. In terms of the resulting centrifuge capillary pressure
123

Digital Rock Evaluation of Capillary Pressure Methods 637
(a) (b)
(d)
(e)
(c)
Fig. 10 Simulated air–brine saturation profiles of centrifuged Fontainebleau sandstone at a higher resolution(�x = 1.831 µm), and b lower resolution (�x = 7.324 µm) than in Fig. 5.e (�x = 3.662 µm). Thedifference in saturation along the core between profiles at the same simulated rotational speed is shown below:c difference between saturation profiles at (�x = 3.662 µm) and (�x = 1.831 µm) resolution, d differencebetween saturation profiles at (�x = 3.662 µm) and (�x = 7.324 µm) resolution. Offsets of 0.1, 0.3, . . .
have been added to aid visualization. e Resulting capillary pressure curves for the different resolutions
curves (Fig. 10e), the difference between the �x = 1.831 µm and �x = 3.662 µmcurves is marginal and the difference between �x = 3.662 µm and �x = 7.324 µmis well below 10 % except for the high-pressure region where one enters the resolutionlimit.
8 Conclusions
We present a numerical approach enabling comparisons of the three main capillary drainageexperimental techniques. The impact of heterogeneity on capillary drainage estimates is
123
638 I. Shikhov, C. H. Arns
demonstrated by simulation of three systems with different degree of heterogeneity. Thenumerical results have been experimentally validated. It was demonstrated that for the suffi-ciently homogeneous system of appropriate size, the CM drainage agrees well with porousplate and MICP results. Furthermore, a simulated centrifuge experiment is free from mainuncertainties specific to CM—unknown equilibrium time between speed increments and atransform between average core saturation to saturation at the inlet face provides a tool forCM experimental design.
In addition to comparisons between different capillary pressure measurement techniques,this morphological method allows to design more targeted speed schedules for complexworkflows involving centrifuge experiments. It may also assist in the typing of microporosityby comparing CM simulation with actual measurements for rocks exhibiting significantporosity below imaging resolution.
The current work does not consider the simulation of more complex wettability conditionsincluding more advanced level-set morphological techniques or the extension to relativepermeability prediction. This will be the subject of a future article.
Acknowledgments CHA acknowledges the Australian Research Council (ARC) for a Future Fellowshipand the National Computing Infrastructure for generous allocation of computing time. We acknowledge R.Hilfer for providing the reconstructed image of Fontainebleau sandstone.
Open Access This article is distributed under the terms of the Creative Commons Attribution License whichpermits any use, distribution, and reproduction in any medium, provided the original author(s) and the sourceare credited.
References
Arns, C.H.: A comparison of pore size distributions derived by NMR and Xray-CT techniques. Phys.A 339(1–2), 159–165 (2004)
Arns, C.H., Averdunk, H., Bauget, F., Sakellariou, A., Senden, T.J., Sheppard, A.P., Sok, R.M., Pinczewski,W.V., Knackstedt, M.A.: Digital core laboratory: reservoir core analysis from 3D images. In: Gulf Rocks2004: Rock Mechanics Across Borders & Disciplines, The 6th North American Rock Mechanics Sym-posium, p. paper 498. Houston (2004)
Arns, C.H., Knackstedt, M.A., Martys, N.: Cross-property correlations and permeability estimation in sand-stone. Phys. Rev. E 72, 046,304 (2005)
Arns, C.H., Knackstedt, M.A., Pinczewski, W.V., Mecke, K.R.: Euler–Poincaré characteristics of classes ofdisordered media. Phys. Rev. E 63, 031,112:1–031,112:13 (2001)
Arns, C.H., Knackstedt, M.A., Pinczewski, W.V., Mecke, K.R.: Characterisation of irregular spatial structuresby parallel sets and integral geometric measures. Colloids Surf. A 241(1–3), 351–372 (2004)
Arns, C.H., Mecke, J., Mecke, K.R., Stoyan, D.: Second-order analysis by variograms for curvature measuresof two-phase structures. Eur. Phys. J. B Condens. Matter 47(3), 397–409 (2005)
Arns, J.Y., Arns, C.H., Sheppard, A.P., Sok, R.M., Knackstedt, M.A., Pinczewski, W.V.: Relative permeabilityfrom tomographic images; effect of correlated heterogeneity. J. Pet. Sci. Eng. 39(3–4), 247–259 (2003)
Ayappa, K.G., Davis, H.T., Davis, E.A., Gordon, J.: Capillary pressure: centrifuge method revised. Am. Inst.Chem. Eng. J. 35(3), 365–372 (1989)
Bentsen, R.G., Anli, J.: Using parameter estimation techniques to convert centrifuge data into a capillary-pressure curve. Soc. Pet. Eng. J. 17, 57–64 (1977)
Cahn, J.W.: Phase separation by spinodal decomposition in isotropic systems. J. Chem. Phys. 42, 93–99 (1965)Ferno, M.A., Treinen, R., Graue, A.: Experimental measurements of capillary pressure with the centrifuge
technique—emphasis on equilibrium time and accuracy in production. In: The 21st International Sym-posium of the Society of Core Analysts, No. SCA2007-22, pp. 1–12. Society of Core Analysts, Calgary(2007)
Fleury, M., Egermann, P., Goglin, E.: A model of capillary equilibrium for the centrifuge technique. In: The14th International Symposium of the Society of Core Analysts, No. SCA2000-31, pp. 1–12. Society ofCore Analysts, Abu Dhabi (2000)
123

Digital Rock Evaluation of Capillary Pressure Methods 639
Forbes, P.L.: Centrifuge data analysis techniques—a survey from the Society of Core Analysis. SCA, Dallas(1997)
Forbes, P.L.: Centrifuge data analysis techniques: an sca survey on the calculation of drainage capillarypressure curves from centrifuge measurements. In: The 11th International Symposium of the Society ofCore Analysts, No. SCA-9714, pp. 1–20. Society of Core Analysts, Calgary (1997)
Fredrich, J., Menéndez, B., Wong, T.F.: Imaging the pore structure of geomaterials. Science 268, 276–279(1995)
Graue, A., Bogno, T., Spinler, E.A., Baldwin, B.A.: A method for measuring in-situ capillary pressures atdifferent wettabilities using live crude oil at reservoir conditions, part 1: feasibility study. In: The 16thInternational Symposium of the Society of Core Analysts, No. SCA2002-18, pp. 1–12. Society of CoreAnalysts, Monterey (2002)
Green, D.P., Dick, J.R., McAloon, M., de J. Cano-Barrita, P.F., Burger, J., Balcom, B.: Oil/water imbibition anddrainage capillary pressure determined by mri on a wide sampling of rocks. In: The 22nd InternationalSymposium of the Society of Core Analysts, No. SCA2008-01, Society of Core Analysts, Abu Dhabi(2008)
Hassler, G.L., Brunner, E.: Measurements of capillary pressures in small core samples. Trans. AIME 160,114–123 (1945)
Hilpert, M., Miller, C.T.: Pore-morphology based simulation of drainage in totally wetting porous media. Adv.Water Resour. 24, 243–255 (2001)
Hoffman, R.N.: A technique for the determination of capillary pressure curves using a constantly acceleratedcentrifuge. Soc. Pet. Eng. J. 3(3), 227–235 (1963)
Joshi, M.: A class of stochastic models for porous materials. Ph.D. thesis, University of Kansas, Lawrence(1974)
Kleinberg, R.L.: Utility of NMR T2 distributions, connection with capillary pressure, clay effect, and deter-mination of the surface relaxivity parameter ρ2. Magn. Reson. Imaging 14(7/8), 761–767 (1996)
Latief, F., Biswal, B., Fauzi, U., Hilfer, R.: Continuum reconstruction of the pore scale microstructure forFontainebleau. Phys. A 389, 1607–1618 (2010)
Leverett, M.C.: Capillary behavior in porous solids. Trans. AIME 142, 152–169 (1941)Marcotte, D.: Fast variogram computation with FFT. Comput. Geosci. 22(10), 1175–1186 (1996)Najman, L., Talbot, H. (eds.): Mathematical morphology. Wiley, Haboken (2010). p. 507O’Meara, D.J., Hirasaki, G.J., Rohan, J.A.: Centrifuge measurements of capillary pressure: part 1—outflow
boundary condition. SPE Reserv. Eng. J. 7(1), 133–142 (1992)Øren, P.E., Bakke, S.: Reconstruction of Berea sandstone and pore-scale modelling of wettability effects. J.
Pet. Sci. Eng. 39, 177–199 (2003)Prodanovic, M., Bryant, S.L.: A level set method for determining critical curvatures for drainage and imbibition.
J. Colloid Interface Sci. 304, 442–458 (2006)Purcell, W.R.: Capillary pressures their measurement using mercury and the calculation of permeability there-
from. Trans. AIME 186, 39–48 (1949)Rajan, R.R.: Theoretically correct analytical solution for calculating capillary pressure-saturation from cen-
trifuge experiments. In: The 27th Annual Logging Symposium, No. J, pp. 1–18. Society of Petrophysicistsand Well Log Analysts, Houston (1986)
Roberts, A.P.: Statistical reconstruction of three-dimensional porous media from two-dimensional images.Phys. Rev. E 56, 3203–3212 (1997)
Ruth, D.: Calculation of capillary pressure curves from data obtained by the centrifuge method. In: The 20thInternational Symposium of Society of Core Analysts, No. SCA2006-06, pp. 1–10. Society of CoreAnalysts, Trondheim (2006)
Ruth, D., Wong, S.: Calculation of capillary pressure curves from data obtained by the centrifuge method.In: Society of Core Analysts Conference, No. SCA-8802, pp. 1–10. Society of Core Analysts, Houston(1988)
Serra, J.: Image analysis and mathematical morphology, vol. 1,2. Academic Press, Amsterdam (1982)Seth, S.: Increase in surface energy by drainage in sandstone and carbonate. Ph.D. thesis, University of
Wyoming, Dept. of Chemical and Petroleum Engineering, Laramie, Wyoming (2006)Sethian, J.A.: Level set methods and fast marching methods. Cambridge University Press, Cambridge (1999)Slobod, R.L., Chambers, A., Prehn, W.L.: Use of centrifuge for determining connate water, residual oil, and
capillary pressure curves of small core samples. Trans. AIME 192, 127–134 (1951)Szabo, M.T.: The role of gravity in capillary pressure measurements. Soc. Pet. Eng. J. 12(2), 85–88 (1972)Thovert, J.F., Yousefian, F., Spanne, P., Jacquin, C.G., Adler, P.M.: Grain reconstruction of porous media:
application to a low-porosity Fontainebleau sandstone. Phys. Rev. E 63(6, Pt.1), 307 (2001)van Domselaar, H.R.: An exact equation to calculate actual saturations from centrifuge capillary pressure
measurements. Rev. Tech. Intevep 4(1), 55–62 (1984)
123

640 I. Shikhov, C. H. Arns
Ward, J.S., Morrow, N.R.: Capllary pressures and gas relative permeabilities of low-permeability sandstone.SPE Form. Eval. J. 2(3), 345–356 (1987)
Wilson, O.B., Tjetland, B.T., Skauge, A.: Drainage rates in capillary pressure experiments. In: 15th Interna-tional Symposium of the Society of Core Analysts, No. SCA2001-30, pp. 1–12. Society of Core Analysts,Edinburgh (2001)
Wunderlich, R.W.: Imaging of wetting and nonwetting phase distributions: application to centrifuge capillarypressure measurements. In: The 60th Annual Technical Conference and Exhibition of the Society ofPetroleum Engineers, No. SPE14422, pp. 1–12. Society of Petroleum Engineers, Las-Vegas (1985)
Zhao, X., Blunt, M.J., Yao, J.: Pore-scale modeling: effect of wettability on waterflood oil recovery. J. Pet.Sci. Eng. 71, 169–178 (2010)
123