evaluation of bfs extrusions through processing...
TRANSCRIPT

Page 1 of 1
Evaluation of Blow/Fill/Seal Extrusion through Processing Polymer
Contaminated with Bacterial Spores and Endotoxin
Frank Leo1, Patrick Poisson1, Colin S. Sinclair2 and Alan Tallentire2 *
1 Cardinal Health, Inc., Biotechnology and Sterile Life Sciences, Woodstock, IL 60098, USA
2 Air Dispersions Ltd., Manchester M15 6SE, UK
SHORT TITLE: Blow/Fill/Seal Extruder Challenges
*Author to whom correspondence should be addressed: Air Dispersions Ltd, Enterprise House, Manchester
Science Park, Manchester M15 6SE, U.K.
Page 2 of 2
ABSTRACT: A collaborative study involving Cardinal Health, Inc. and Air Dispersions Ltd. has been carried out
to further the understanding of the extrusion process and its impact upon the quality of Blow/Fill/Seal product.
Controlled challenges to the extrusion system, comprising Low Density Polyethylene granulate contaminated
with characterized levels of Bacillus atrophaeus (ATCC 9372) endospores and Escherichia coli 055:B5 bacterial
endotoxin, have been conducted. Batches of spore contaminated polymer, at challenge levels varying from 103
to 106 spores g-1 polymer with derived D160 values ranging from 1.22 to 2.07 minutes’ and endotoxin
contaminated polymer, at challenge levels varying from 102 to 104 EU g-1 polymer, were processed through a
Blow/Fill/Seal machine employing Tryptone Soya Broth and Water for Injection as the fill mediums, respectively.
Relationships have been established between the levels of challenge for each of spores and endotoxin and the
extent of product contamination. The relationships allow for prediction of microbiological and pyrogenic quality
based upon the microbiological and pyrogenic attributes of unprocessed polymeric granulate and for rationalized
choices of polymeric granulate acceptance limits. It is stressed that the findings apply only to the particular
Blow/Fill/Seal machine and to the specific conditions of machine operation.
KEYWORDS: B/F/S, Blow/Fill/Seal, Extruder, Polymer extrusion, Spore challenge, Endotoxin challenge,
Microbiological quality, Pyrogenic quality.

Page 3 of 3
Introduction
Blow/Fill/Seal technology, originally developed in Europe in the 1930's and introduced in the U.S. in the 1960's,
has emerged as a highly acceptable method for aseptic packaging of liquid pharmaceutical and healthcare
products. The method provides flexibility in container design, high product output, low operational costs and
assurance of product sterility. The Blow/Fill/Seal process enables a plastic container to be molded, aseptically
filled and hermetically sealed in one continuous, integrated operation (1), with fill volumes ranging from 0.1 to
1000 cm3. A variety of polymers may be used in the process, with low and high-density polyethylene and
polypropylene being the most common. For processing, these polymers are typically supplied in granulate form.
During molding of the containers, the polymeric granulate is processed through an extruder held at elevated
temperature. The combination of high temperature and pressure within the extruder provides a container “free”
of viable microorganisms and with acceptable endotoxin levels, as demonstrated by the Blow/Fill/Seal operators
through routine performance of media fills (2) and final product testing, respectively.
Because extrusion occurs within a closed system that is essentially inaccessible, it is not amenable to the usual
direct methods for assessment of dry heat treatments used by the industry, circumstances that prompted the
present experimental work. The objectives of the work were threefold;
(i) to challenge the extrusion process with polymeric granulate whose surfaces were contaminated
with known levels of characterized bacterial endospores or pyrogens and measure the affect
upon container/product contamination,
(ii) to gain a better understanding of the process by which extrusion influences risk of product
contamination, and
(iii) to develop a rationale for setting microbiological and pyrogenic limits on virgin incoming
polymeric granulate in order to control risk.
To achieve these objectives, multiple batches of spore or endotoxin contaminated polymeric granulate were
processed on a Blow/Fill/Seal machine employing an appropriate fill medium for evaluation of the particular
contaminant. Thereafter, for the spore challenge, measurements were made of the fraction of product exhibiting

Page 4 of 4
microbial growth, and, for the endotoxin challenge, of the quantity of endotoxin present in the contained fill
liquid.
The Extrusion Process
Thermoplastic extrusion is a complex process that involves heat, pressure, phase transition and melt rheology.
During the extrusion process, the plastic melt is forced through a shaped orifice by a single screw extruder to
produce a semi-solid continuous tube of plastic material with a constant cross section (the parison). This tube is
cut to the desired length and then formed into the container(s) by a set of molds. Vacuum, applied through the
mold face, is used to facilitate container formation and, for some container designs, it can be necessary to apply
filtered air under pressure to blow open the container. A cooling liquid, circulated through a closed manifold
within the mold, expedites solidification of the polymer so that, upon sealing and mold release, the container is
robust and no longer malleable. The cycle time from parison exit from container release from the mold is
primarily dependent upon container volume and typically ranges from 12 to 18 s.
For convenience, the process of polymer phase transition and conveyance is considered to occur over three
distinct physical zones. These zones are known as the feed zone - solids conveying, transition zone - melting
and metering zone - melt pumping (3). Figure 1 is a diagrammatic representation of a single screw extrusion
system commonly used in Blow/Fill/Seal technology. As the polymeric granulate drops into the extruder barrel
from the hopper, the feed zone conveys the granulate forward in the solid state. Several flights of constant
depth are provided on the extruder screw to level out irregularities of feed. This zone is designed with a volume
capacity higher than subsequent zones to ensure a constant flow of polymer free of air pockets. The transition
zone is designed to apply increasing pressure to the granulate by decreasing screw flight depth. At the same
time, the temperature of the granulate, especially near the wall of the extruder barrel, increases due to the heat
supplied to the barrel wall and the heat generated by the friction between the granulate and the wall. Phase
transition, solid to liquid, occurs as the now semi-solid polymer moves forward through the screw flights of the
transition zone. The metering zone controls the uniformity of the output melt flow; a mixing tip installed on the
end of the extruder screw enhances melt uniformity by providing intimate mixing of the various melt layers.
Page 5 of 5
Following the metering zone the melt passes into the parison tooling which is used to dictate the tubular shape
of the extrudate.
A critical design specification of an extruder is the Length/Diameter (L/D) ratio that describes the length of the
flighted portion of the screw divided by the inside diameter of the barrel. This ratio dictates the design of the
extruder screw. To process a given quantity of polymer within a set period of time, a low L/D ratio extruder,
contrasted with a high L/D ratio extruder, must have increased screw flight depth to compensate for the
reduction in length of the processing zones. The extruder barrel is usually equipped with electrical heaters that
are mainly used during cold extruder start-up to melt solid material remaining from the previous operation.
Temperature set points and screw rotational speed may be adjusted to process different types of polymer. Also
in common use are adiabatic extruders that rely solely on friction heat to maintain temperature during the
process. Adiabatic extruders normally have a low L/D ratio and operate at high rotational speeds to achieve the
same or greater outputs of polymer compared with non-adiabatic extruders.
Materials and Methods
Blow/Fill/Seal Machine
State of the art Model 624 Blow/Fill/Seal machines (Weiler Engineering, Inc., Elgin, IL), designed to produce
sterile liquid product, have been used for the present studies. Each 624 machine was equipped with a 24:1 L/D
single screw non-adiabatic extruder designed for polyethylene or polypropylene extrusion. Variations in machine
configurations and operating parameters were used to provide a comprehensive body of performance data.
Spore Polymer
(a) Test Spore
Endospores of Bacillus atrophaeus (ATCC 9372), formerly classified as Bacillus subtilis var. niger (ATCC 9372),
were selected as the test spore; they exist as discrete cells, produce readily scoreable colonies and possess a
high resistance to inactivation by dry heat. The USP and EP recommend this particular strain of Bacillus

Page 6 of 6
atrophaeus for preparation of biological indicators for dry heat sterilization. The source of the test spores was a
freeze-dried bacterial culture obtained from the American Type Culture Collection. 50 cm3 quantities of 3x
washed stock suspensions at concentrations of around 109 spores cm-3 were produced from the surface growth
on nutrient agar supplemented with manganese to aid sporulation. Prepared spore suspensions were routinely
characterized for dry heat resistance through determination of the D value at 160°C for spores dried on
borosilicate glass surfaces. This characterization was carried out to ensure a consistent behaviour of test
spores on a standard heated surface. Spores taken from suspensions used in the present study exhibited D160
values on glass that were close, ranging from 0.89 to 1.22 min.
(b) Preparation of Spore Polymer
Nine 35 kg batches of spore contaminated low density polyethylene granulate (Huntsman 6010, Huntsman
Corp., Salt Lake City, UT) were prepared individually at levels of nominally 104 and 106 g-1 polymer. Preparation
was achieved through controlled deposition of discrete air dispersed spores on all surfaces of polymer granules
using a purpose built drum, mounted horizontally and rotating about its longitudinal axis; air dispersed spores
were generated within the drum through aerosolization of a known volume of aqueous spore suspension of pre-
selected concentration. The number of deposited spores per gram polymer (designated “spore challenge level”)
was determined through conducting a viable count on each of 5 x 1 g samples of spore contaminated granules
taken randomly from a given spore polymer batch. Viable spores were recovered from polymer granules
employing sonication of each sample in 10 cm3 sterile solution of 0.1% Tween 80 for 30 minutes at a
temperature of approximately 50°C; the method achieved a recovery efficiency of > 80% spores from polymer
granules.
(c) Determination of D160 value of test spores located on polymer granules
A sample of granules of spore contaminated polymer was withdrawn from each batch as it was prepared.
Single granules from this sample were put into separate 4 cm3 thin walled glass tubes (i.d. 9mm). Immediately
prior to undertaking a D160 value determination, the single granules, contained individually in tubes, were heated
at 56 ± 1°C for 2 hours. This conditioning ensured that spores were at a constant low water content; heating at
56°C was shown to have no effect on the viability of test spores. Following conditioning, the individual granules

Page 7 of 7
held in separate tubes were located in a heating block at 160 ± 1°C; oil in the wells of the block ensured rapid
heat transfer. At timed intervals, tubes were removed from the heating block and immediately cooled by placing
in a water bath at 10°C. Twenty replicate granules were heated at each of a minimum of eight time intervals.
Following cooling, a 2 cm3 aliquot of sterile nutrient broth was aseptically added to each tube. The tubes and
contents were incubated at 37°C for 7 days and inspected for visible growth; appropriate controls showed that
the presence of polymer granules had no inhibitory effect on the growth of test spores. For each spore polymer
batch, the D160 value and its standard deviation were calculated using the Spearman-Karber estimation
procedure (4) described in USP Chapter 1035 <Biological Indicators>.
Endotoxin Polymer
(a) Test Endotoxin
Bacterial endotoxin derived from E. coli 055:B5 (sourced from both Difco Inc or Sigma Chemical Ltd) was
selected for test purposes. This bacterial endotoxin is commonly used in the pharmaceutical industry to validate
dry heat sterilization processes. The USP specifies that a control standard endotoxin (CSE), appropriate for
depyrogenation studies, should exhibit a potency of not less than 2 EU ng-1 and not more than 50 EU ng-1.
When tested by Associates of Cape Cod Int. Inc., an accredited test facility, against the USP Reference
Standard Endotoxin (RSE) prior to its use in the preparation of contaminated polymer batches, the commercial
bacterial endotoxin gave potencies between 10 and 11 EU ng-1.
To characterize the dry heat resistance of the supplied endotoxin, thin walled glass tubes were individually
inoculated with endotoxin at typically 104 EU per tube, and each tube heated at 200°C for a specified time up to
480 min. Following exposure to heat, levels of endotoxin recovered in LAL reagent water (certified <10-3 EU
cm-3) were assayed employing the LAL kinetic turbidimetric method (5,6). The dry heat resistance of the
endotoxin at 200°C was represented by a bi-phasic curve of log recovered endotoxin plotted against exposure
time; such behavior is typical for reduction in recovered endotoxin consequent upon exposure to heat (7).
Overall, test endotoxin exhibited a 3 log reduction following 90 to 100 min exposures at 200°C, times typical of
dried lipopolysaccharide derived from E.coli treated under similar conditions (8).
Page 8 of 8
(b) Preparation of Endotoxin Polymer
Seven batches of Huntsman 6010 granulate, each between 10 and 30 kg, were contaminated with test
endotoxin at mean levels of Endotoxin Units (EU) per gram of polymer that ranged from 1.60 x 10² to 1.15 x 10⁴.
Controlled deposition of the endotoxin onto granulate surfaces occurred through aerosolization of a solution of
endotoxin of known potency in equipment similar to that developed for preparation of spore polymer batches.
The EU g-1 polymer (designated “endotoxin challenge level”) was determined through the performance of
assays on each of 5 x 1 g samples of endotoxin contaminated granules taken from throughout the given
endotoxin polymer batch. The deposited endotoxin was recovered from the surfaces of the granules by
immersing the granules in 10 cm3 of LAL reagent water and subjecting the sample to two successive recovery
treatments done immediately after one another; a recovery treatment comprised sonication for 10 minutes
followed by vigorous vortexing for 1 minute at room temperature. Determination of the EU content per cm3 of
recovery water, and hence the EU per gram polymer, was carried out using the LAL Kinetic Turbidimetric Assay.
(c) LAL Kinetic Turbidimetric Assay
Endotoxin assays were carried out using an LAL-5000E series 2 system (Associates of Cape Cod Int. Inc.). The
system was certified to determine endotoxin concentrations to a minimum of 10-3 EU cm-3. This lower limit was
reduced twenty-five fold to allow assays to be undertaken over an endotoxin concentration range from 4 x 10⁻⁵
to 102 EU cm-3. The assay method was validated in accordance with the FDA Guideline on Validation of the
Limulus Amebocyte Lysate Test as an End-Product Endotoxin Test for Human and Animal Parenteral Drugs,
Biological Products and Medical Devices (1987) and USP <85> Bacterial Endotoxins Test.
(d) Determination of D150 value of test endotoxin located on polymer granules
As for spore polymer, a sample of endotoxin polymer was drawn from each batch as the batch was prepared.
Individual granules from the batch were each placed in separate 4 cm3 thin walled glass tubes. The tubes were
located in a heating block at 150 ± 1°C. This heating temperature was selected for the determinations as
prolonged exposures to levels above this temperature affected the integrity of the polymer granule and hence
the ability to recover the endotoxin from the granule. Following timed intervals at 150 °C extending up to 480
min, tubes were removed from the heating block and immediately cooled by placing in a water bath at 10 °C.
Page 9 of 9
Following cooling, a 1.2 cm3 volume of LAL reagent water was added to each tube and endotoxin recovered
from the heated granule, employing two successive recovery treatments comprising sonication followed by
vortexing and the solution assayed using the LAL kinetic turbidimetric method. Generated data in the form of a
semi-logarithmic plot of recovered endotoxin against exposure time, extending over 2 log cycles, yielded a linear
curve of negative slope allowing the D150 value to be derived from the best-fit straight line.
Processing of Spore or Endotoxin Polymer
Spore and endotoxin polymer challenges to the extrusion process were carried out on a number of separate
experimental occasions at Cardinal Health Biotechnology & Sterile Life Sciences, Woodstock, IL. On each
experimental occasion, the Blow/Fill/Seal machine was set up according to standard operating procedures used
for validation and routine processing. Product contacting surfaces were cleaned in place with Water for Injection
(USP XXV) and then sterilized by exposure to saturated steam. Prior to filling, the fill liquid was passed through
a sterilizing grade hydrophilic filter located upstream of the fill nozzles; after use, the filter was tested for
integrity.
For spore polymer challenges, a minimum fill volume was set according to the vi al size being processed with
Tryptone Soya Broth, demonstrated to be capable of sustaining the growth of the test spore, employed as the fill
medium. The extruder was set and maintained at a rotational speed and temperature that would routinely be
used for the particular fill configuration and polymeric granulate. The established extruder and temperature set
points are associated with a given type of polymer and container design and cannot be significantly altered
without impacting negatively upon the vial formation. Immediately after processing, all broth filled vials were
incubated for a minimum of 7 days at 22.5°C, inverted and then incubated for a minimum of 7 days at 32.5°C so
that contamination of the vials could be assessed by appearance of visible growth. The fraction of vials
contaminated was derived for each of the different spore polymer challenges.
For endotoxin polymer challenges, set-up and processing procedures were similar to those used for spore
polymer, except the fill medium was Water For Injection (USP XXV); a single vial size of 5.5 cm3 was used
throughout this work together with a nominal fill volume of 5 cm3 except on one processing occasion, C, when a
fill volume of 2.0 cm3 was employed. To assess the level of recovered endotoxin in WFI fill medium, between 5

Page 10 of 10
and 10 vials were selected from across the whole of the production which commenced after an initial processing
period of 10 minutes that allowed the endotoxin polymer to enter fully the barrel of the extruder. Recovery of
endotoxin in WFI was achieved through application of the previously described successive treatments of
sonication and vortexing. Following recovery, the level of endotoxin in WFI was assayed employing the LAL
kinetic turbidimetric method.
Results and Discussion
Spore Polymer Challenges
Table Ia) lists machine configurations and settings employed for processing the nine different spore polymer
batches. The different batches were processed on separate occasions employing different machine
configurations ranging from 24 x 0.5 cm3 vials to 8 x 120 cm3 vials [see columns 2 and 3 of Table Ia)].
Differences in extruder speed and temperature settings reflect typical differences in machine operating
conditions that are required for the different machine configurations.
In preparing the spore polymer, the aim was to have available batches with spore challenge levels that varied
widely and batches whose levels were close, for which an estimate of the D160 value of the deposited spores
located on the polymer, specific to the batch, would be made. Columns 2 and 3 of Table II lists, in order of
increasing spore challenge level, the characteristics of the nine challenge batches. For each batch, they give
the mean spore challenge level and associated standard deviation, determined from at least 3 viable counts
carried out on separate occasions, and the derived D160 value and its standard deviation. It can be seen that the
extremes of challenge level cover a difference in level of about 100 fold, while four of the nine levels (3 through
6) are effectively the same. The D160 values also varied appreciably, falling within the range 1.22 to 2.07 min.
The remaining columns of Table II provide the vial characteristics, vial processing data and the derived
outcomes from the media fills undertaken when processing the nine batches employing a variety of vial sizes.
Consideration of the findings from batches 1, 2, 5, and 8, all of which were processed using a 2.4 cm3 vial
volume, allows a rational interpretation to be applied to the results. For a given test organism exposed to a

Page 11 of 11
particular set of inimical conditions, the expectation is that smaller the challenge level, the lower the number of
organisms surviving which, for extruded containers, would translate into a lower fraction of units contaminated.
A comparison of the characteristics and outcomes of batches 1 and 5 enables this expectation to be examined
directly. These batches had spores with very similar D160 values, but possessed spore challenge levels that
differed 100 fold and, on processing, they gave a corresponding 100 fold difference in the fraction of units
contaminated. On the other hand, batches 2 and 8, possessed spore challenge levels that were not widely
different from that of batch 5, but took values of D160 of 1.28 and 1.56 minutes respectively, in other words,
resistances appreciably less than that of batch 5. Inspection of the fractions of units contaminated for batches 2
and 8, relative to the fraction seen for batch 5, shows these to be wholly in accord with the magnitudes of the
their D160 values. Thus, the indications are that the heat resistance of the microbial challenge in the extruder will
also affect container contamination and that heat lethality is, to some degree, associated with the extrusion
process.
Two other batches (4 and 9) were processed to give vials of the same volume, 20 cm3, different from that
previously considered. Batch 4 had a spore challenge level and a D160 value that was somewhat less than
those of batch 9 (Columns 2 and 3, Table II). The observed outcomes of processing, given in column 7, are
3.95 x 10⁻³ fraction units contaminated for batch 4 and 1.50 x 10⁻² for batch 9, a difference and direction that
supports the above generalizations.
Without knowing the exact temperature and time combinations experienced by the polymer during its passage
through the extruder and during molding, determination of the extent of inactivation of spores by the heating
associated with container formation is not feasible. The thermal conditions in the extruder are complex and
inaccessible, and consequently pursuit of this form of analysis was not an option. The alternative is to examine
other possible fates of spores entering the extruder that might impact on the interpretation of the present
findings.
Extrusions, carried out with coloured granules or finely divided particles mixed with virgin polymer, give melts
exiting the parison tooling that are wholly homogenous. This suggests that the added spores too will be
uniformly distributed throughout the melt, which, in turn, means throughout the solidified polymer comprising the
containers. In such circumstances, it is to be expected that there will be, on or in the container, viable spores
Page 12 of 12
and probably heat inactivated spores, either encapsulated in solid polymer or borne on the internal and external
container surfaces. In this context, ‘surface borne’ spores refers to discrete spores that are free and held on the
polymer by forces of adhesion or those that are partially encapsulated and, if viable, be capable of germination
and outgrowth. Clearly, heat inactivated spores of either kind will not contribute to the fraction of units
contaminated, nor is it likely that wholly encapsulated viable spores will either, since access to the liquid growth
medium is totally excluded. Thus, the only spores to contribute to the fraction of vials contaminated are viable
internal surface borne spores, whose frequency of occurrence per unit area of surface will be directly related to
the level of the spore challenge and, possibly, spore heat resistance.
To take account of the above considerations in the analysis of the overall data given in Table II, an index,
normalizing the fraction units contaminated with respect of challenge level and vial internal surface area, has
been derived for each challenge batch. Values of this index are plotted against corresponding D160 values for
spores on polymer granules for the nine processed batches in Figure 2.
The general conclusion drawn from inspection of the figure is that, over the range of D160 values examined,
there is a definite relationship between the normalized fraction of vials contaminated and the D160 values of the
spores contaminating the polymer used to make the vials. The best fitting asymptotic curve describing this
relationship is concave relative to the D160 value axis and it shows that the rate of increase in the index is
greatest at low values of D160 and least at high values. The inference from this finding is that heat lethality has a
role in the extrusion process. At D160 values of around 2 min, it appears that the index is approaching a maximal
value, which, when reached, would mean that heat lethality is not operating during the extrusion process.
Nonetheless, this upper limit corresponds to a low contamination frequency and probably reflects the frequency
of occurrence of viable surface borne spores on the vial internal surface area only, other viable spores present
during BFS molding being encapsulated in and immobilized by polymer and thus inconsequential in respect of
product contamination.
Endotoxin Polymer Challenges
Table Ib) lists machine configurations and settings employed in processing seven different endotoxin polymer
batches. The batches were used on three separate processing occasions designated A through C. The three
Page 13 of 13
processing occasions employed the same machine configuration of 24 x 5.5 cm3 vials. The differences in
extruder speed and temperature settings recorded in Table Ib) reflect typical differences in machine operating
conditions that might be required from one processing occasion to another. On occasion C, batch 7 was
processed as two lots employing fill volumes of 2.0 and 5.0 cm3 and, for convenience, the two lots are
designated 7a and 7b respectively.
Table III gives the characteristics of the endotoxin polymer and fill volumes employed in processing the seven
endotoxin polymer batches, together with corresponding estimates of the amounts of endotoxin present in the fill
WFI. Column 2 of the table lists the mean endotoxin challenge level and associated standard deviation derived
from assays performed on each of five samples taken from a given endotoxin polymer batch. For the batches
processed on occasions A and C, endotoxin challenge levels were deliberately set close at 104 EU g-1 polymer,
whereas for occasion B, challenge levels varied over a 70 fold range. The conditions associated with occasion
A allowed assessment of the repeatability of the levels of endotoxin recovered from vials extruded from different
polymer batches, those for occasion B an assessment of the effect of changing endotoxin challenge level and,
for occasion C, an assessment of the impact of fill volume and storage on recovered endotoxin.
Column 3 of Table III lists the derived D150 value for each endotoxin polymer batch. It can be seen that D150
values are high and somewhat different, falling within the range 212 to 382 min. However, examination of the
curves used in the determination of the D150 values revealed a high degree of scatter of points around the best-
fit line, which, in part, reflects the imprecision of the LAL assay. These high D150 values show that at 150 oC the
reduction in recovered endotoxin with time of heating is extremely slow (a tenfold reduction requiring more than
3 hours of heating), a finding wholly in accord with the results of others who have studied endotoxin recovery
following heating to similar temperatures (9). For present purposes, the seven values reported in Table III are
regarded as estimates of a particular D150 value.
For the three endotoxin polymer batches nominally at 104 EU g-1 and processed under the same heating and
extrusion conditions of occasion A, mean values of recovered endotoxin are reasonably consistent, ranging from
4.42 x 10⁻² to 9.03 x 10⁻² EU cm-3. Given that the endotoxin challenge level was in the order of 104 EU g-1
polymer, recovered levels of endotoxin in the WFI fill of extruded vials are strikingly low. Bearing in mind the
temperature to which the endotoxin is exposed during extrusion (temperature settings were mainly less than 170
Page 14 of 14
oC) and the short length of time over which exposure occurs (estimated to be less than 10 minutes), these low
levels cannot principally be a consequence of the processes responsible for the slow reduction found on heating
endotoxin at 150 oC. A more likely explanation resides in dispersal of endotoxin throughout the extruded
polymer mass. Recovered endotoxin can then be attributed to that available for dissolution from a defined depth
of the internal surface of the extruded vial. To account for the amounts of endotoxin recovered for the different
challenges processed on occasion A, assuming homogenous dispersal of endotoxin throughout the extruded
polymer, depths of polymer for recovered endotoxin were calculated to range from 9 to 16 nm; this calculation
was achieved through dividing the amount of recovered endotoxin in WFI fill by the product of the derived
endotoxin concentration in the extruded polymer mass and the vial internal surface area. The molecular order
of these calculated depths suggests that lipopolysaccharide located directly on the internal surface of the
extruded vial has the potential to contaminate the vial contents whereas endotoxin encapsulated within the
polymer mass is immobilized and unavailable for dissolution and contamination of vial contents.
Findings from processing endotoxin polymer having different challenge levels (occasion B) show a direct
relationship exists between the level of endotoxin on polymeric granulate and that recovered from extruded
vials. For the three endotoxin polymer batches processed on occasion B, a 70 fold change in endotoxin
challenge level brought about a 300 fold change in recovered endotoxin. The discrepancy from direct
proportionality may well be explained by the imprecision associated with the LAL assay, particularly at the low
levels of recovered endotoxin found for batches 4 and 5.
For the two sets of processing conditions employed on occasion C, mean recovered levels of endotoxin from
extruded vials were found to fall close to one another, 2.05 x 10⁻³ and to 1.57 x 10⁻³ EU cm-3 for vial fill volumes
of 2.0 and 5.0 cm3 respectively. The somewhat higher mean value for the lower fill volumes provides some
support for the notion that total recovered endotoxin from an extruded vial is independent of fill volume (i.e. the
product of mean recovered endotoxin and fill volume is constant for a given vial configuration).
Recovered endotoxin from vials produced from endotoxin polymer batch 7 were also assessed following 90
days storage under ambient, ‘real’ (40% RH at 25 °C) and ‘accelerated’ (90% RH at 40 °C) conditions. Table IV
gives values of mean recovered endotoxin ± standard deviation for the vials subjected to the different storage
conditions, together with the corresponding value for unstored vials taken from Table III. For the two fill

Page 15 of 15
volumes, mean recovered endotoxin levels for vials following 90 days storage under ambient, ‘real’ and
‘accelerated’ conditions are seen to fall within a 5 fold range (i.e. well within the precision of the LAL assay) and
are close to that recorded for vials at 0 days storage. This finding provides evidence that endotoxin
encapsulated during the extrusion process remains immobilised and unavailable to contaminate the packaged
WFI during storage.
To take account of differences in fill volume and endotoxin challenge level between the different endotoxin
polymer challenges, an index designated Endotoxin Reduction Factor (ERF), allowing for fill volume and
normalising for endotoxin challenge level, has been derived for each challenge. The ERF was derived as
follows,
ERF = mean recovered endotoxin x fill volume
endotoxin challenge level
The value taken by the ERF index provides a simple quantitative measure of the impact of endotoxin present on
polymeric granulate upon the fill volume packaged within extruded vials. Values of this index are listed in
column 6 of Table III.
Inspection of values of ERF reveals that endotoxin polymer batches processed on the same occasion take
values that generally fall close to one another. This includes occasion A which employed three endotoxin
polymer batches prepared with bacterial endotoxin obtained from two different sources (Difco Inc. and Sigma
Chemicals Ltd.) and with three different lots of polymeric granulate supplied by Huntsman Corp. For the three
different processing occasions, mean values of ERF were 2.7 x 10⁴, 2.4 x 10⁵ and 1.2 x 10⁶ for occasions A, B
and C respectively. Clearly, on each occasion, values of ERF were high and exceeded 104, demonstrating a
low impact of presence of endotoxin on polymeric granulate upon packaged WFI. In practice, the impact is such
that WFI filled in vials extruded from low density polyethylene contaminated with endotoxin at levels up to 104
EU g-1 polymer is predicted to meet the USP Endotoxin Release Limit of 0.25 EU cm-3 for Water For Injection.
Clearly, it must be stressed that this prediction holds for the particular Blow/Fill/Seal 624 machine and to the
specific conditions of machine operation.

Page 16 of 16
Summary of Findings and their Relevance to Setting Quality Acceptance Limits for Polymeric Granulate
Polymeric granulate is supplied to operators of Blow/Fill/Seal technology in large bulk quantities, typically in
plastic lined corrugated containers capable of holding up to several tons of material. Until use, bulk material is
generally stored in a controlled temperature/humidity environment. Control data generated for bulk material at
the Cardinal Health suggest that bioburden levels are routinely low with not more than 5 CFU g-1 polymer.
Endotoxin on bulk material was generally found to be no more than 1 EU g-1 polymer.
Extruder challenge studies, employing spore polymer and endotoxin polymer, have provided definitive evidence
for polymer extrusion having the capability to produce vials "free" of viable microorganisms and possessing
acceptable endotoxin levels. These studies have also demonstrated that the microbiological and pyrogenic
qualities of the surfaces of virgin polymeric granules can impact upon the quality of the extruded vial. Thus, it is
of fundamental importance in Blow/Fill/Seal processing that acceptance limits are established for bioburden and
endotoxin levels on polymeric granulate to assure consistent production of vials of appropriate quality.
Through processing spore polymer, possessing known challenge levels and dry heat resistances, data have
been generated to assess the extent of spore reduction associated with the extrusion process. Spore reduction
is attributable to heat inactivation combined with encapsulation and immobilization of spores within the solidified
polymer mass that makes up the container. Given this, it has been possible to develop a curve relating fraction
of vials contaminated, normalized with respect of spore challenge level and vial internal surface area, against
dry heat resistance of test spores. The nature of the curve reveals the role that heat inactivation plays in
determining the fraction of extruded vials exhibiting contamination. The contribution of heat inactivation is seen
to decrease with increasing heat resistance of test spores so that, at high levels of heat resistance, the fraction
of vials contaminated is regarded as simply reflecting the frequency of occurrence of viable spores on internal
vial surfaces. The derived relationship between vial contamination and dry heat resistance provides, for the first
time, a rational scientific basis for setting bioburden limits on unprocessed polymeric granulate so that the risk of
occurrence of a contaminated vial is low and acceptable. This approach of applying a bioburden limit to

Page 17 of 17
polymeric granulate to achieve the outcome of an extruded sterile vial is wholly analogous with application of
bioburden limits to items to be processed by conventional methods of terminal sterilization.
Through processing endotoxin polymer, possessing known challenge levels and dry heat resistances, data have
been generated to assess the extent of endotoxin reduction associated with the extrusion process. As for
bacterial spores possessing high levels of heat resistance, endotoxin reduction associated with polymer
extrusion is not primarily attributable to heat inactivation but rather explained by immobilisation within and on
the extruded polymer. Recovered levels of endotoxin from processed vials were generally low and were directly
related to the endotoxin challenge level on the unprocessed polymeric granulate. Levels of recovered endotoxin
from vials were also little changed following 90 days storage, a finding illustrative of the immobilized nature of
endotoxin encapsulated in extruded polymer. To quantify reductions in recoverable endotoxin consequent upon
polymer extrusion, an index ERF, relating endotoxin challenge level to recovered endotoxin from extruded vials,
has been devised. For the processing conditions of the present study, values taken by ERF consistently
exceeded 104 and were found to be independent of endotoxin challenge level on unprocessed polymeric
granulate. Knowledge of the ERF value allows endotoxin limits on unprocessed polymeric granulate to be
rationally set so that the pyrogenic quality of the extruded Blow/Fill/Seal vial is appropriate for the intended use.
The above work is intended to provide a step forward in the understanding of the Blow/Fill/Seal extrusion
process in relation to provision of a sterile vial of appropriate pyrogenic quality. However, it has to be stressed
that the findings apply to the extrusion system peculiar to the Model 624 Blow/Fill/Seal machine and to the
specific conditions of machine operation.

Phase Transition
Polymeric Granulate
Semi-Solid Melt Exiting Parison
Head
Parison Head
Metering Zone
Transition Zone
Feed Zone
Mixing Tip
Hopper

0.5 1.0 1.5 2.0 2.5
Dry Heat Resistance (D160 value)
10-12
10-11
10-10
10-9
10-8
10-7
Con
tam
inat
ion
Freq
uenc
yM
ean
Spo
re C
halle
nge
Leve
l x In
t. B
ottle
Sur
face
Are
a

Figure Captions
Figure 1
Typical Blow/Fill/Seal single screw extrusion system
Figure 2
Best fit asymptotic curve showing the relationship between fraction of vials contaminated,
normalized for spore challenge level and internal bottle surface area, and dry heat resistance
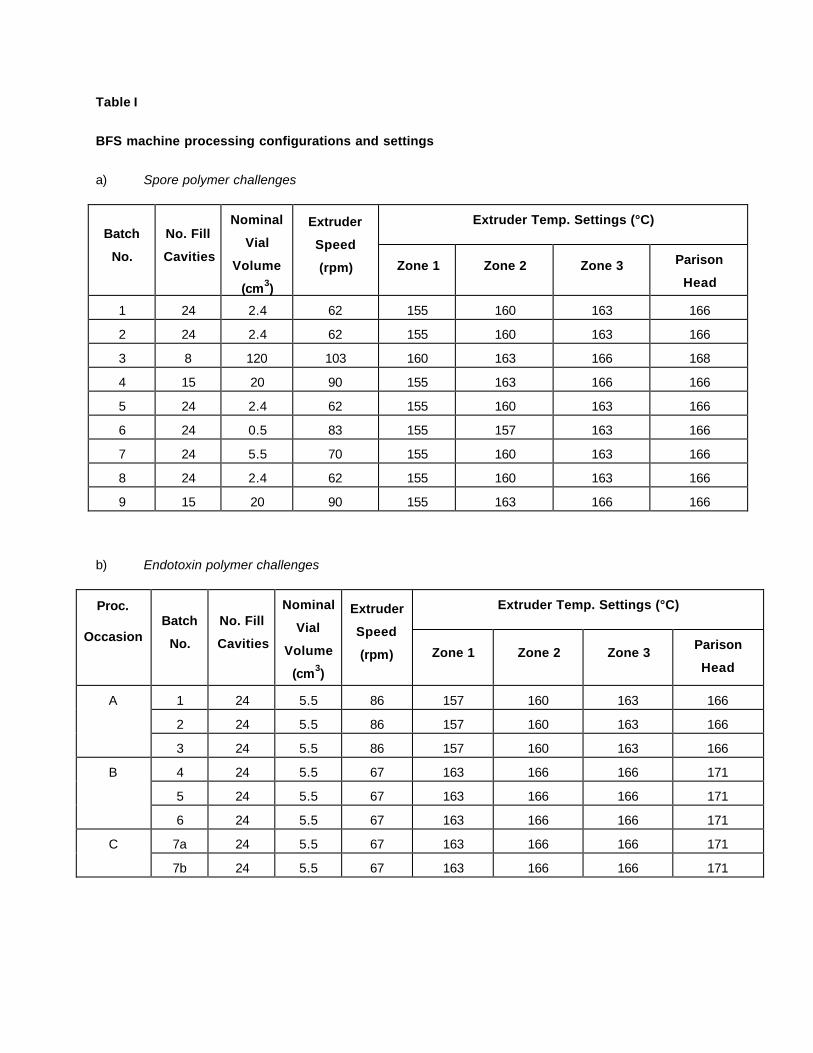
Table I
BFS machine processing configurations and settings
a) Spore polymer challenges
Extruder Temp. Settings (°C) Batch
No.
No. Fill
Cavities
Nominal
Vial
Volume
(cm3)
Extruder
Speed
(rpm) Zone 1 Zone 2 Zone 3 Parison
Head
1 24 2.4 62 155 160 163 166
2 24 2.4 62 155 160 163 166
3 8 120 103 160 163 166 168
4 15 20 90 155 163 166 166
5 24 2.4 62 155 160 163 166
6 24 0.5 83 155 157 163 166
7 24 5.5 70 155 160 163 166
8 24 2.4 62 155 160 163 166
9 15 20 90 155 163 166 166
b) Endotoxin polymer challenges
Extruder Temp. Settings (°C) Proc.
Occasion
Batch
No.
No. Fill
Cavities
Nominal
Vial
Volume
(cm3)
Extruder
Speed
(rpm) Zone 1 Zone 2 Zone 3 Parison
Head
1 24 5.5 86 157 160 163 166
2 24 5.5 86 157 160 163 166
A
3 24 5.5 86 157 160 163 166
4 24 5.5 67 163 166 166 171
5 24 5.5 67 163 166 166 171
B
6 24 5.5 67 163 166 166 171
7a 24 5.5 67 163 166 166 171 C
7b 24 5.5 67 163 166 166 171
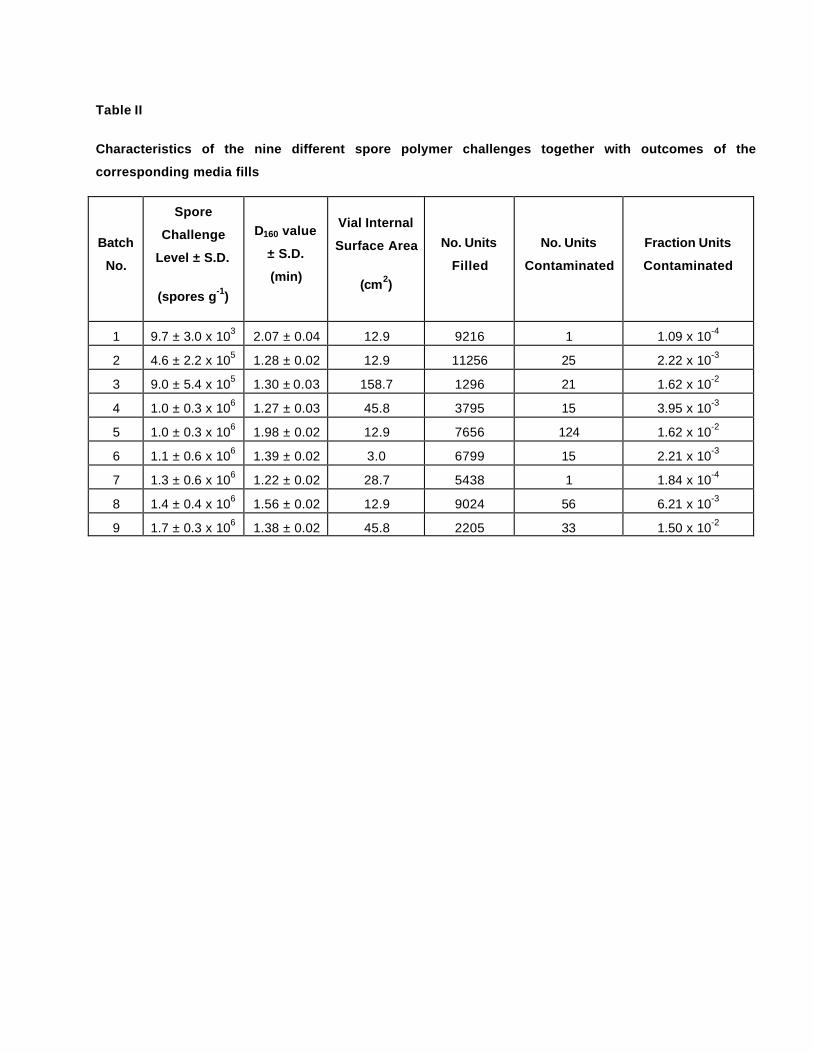
Table II
Characteristics of the nine different spore polymer challenges together with outcomes of the
corresponding media fills
Batch
No.
Spore
Challenge
Level ± S.D.
(spores g-1)
D160 value
± S.D.
(min)
Vial Internal
Surface Area
(cm2)
No. Units
Filled
No. Units
Contaminated
Fraction Units
Contaminated
1 9.7 ± 3.0 x 10³ 2.07 ± 0.04 12.9 9216 1 1.09 x 10⁻⁴
2 4.6 ± 2.2 x 10⁵ 1.28 ± 0.02 12.9 11256 25 2.22 x 10⁻³
3 9.0 ± 5.4 x 10⁵ 1.30 ± 0.03 158.7 1296 21 1.62 x 10⁻²
4 1.0 ± 0.3 x 10⁶ 1.27 ± 0.03 45.8 3795 15 3.95 x 10⁻³
5 1.0 ± 0.3 x 10⁶ 1.98 ± 0.02 12.9 7656 124 1.62 x 10⁻²
6 1.1 ± 0.6 x 10⁶ 1.39 ± 0.02 3.0 6799 15 2.21 x 10⁻³
7 1.3 ± 0.6 x 10⁶ 1.22 ± 0.02 28.7 5438 1 1.84 x 10⁻⁴
8 1.4 ± 0.4 x 10⁶ 1.56 ± 0.02 12.9 9024 56 6.21 x 10⁻³
9 1.7 ± 0.3 x 10⁶ 1.38 ± 0.02 45.8 2205 33 1.50 x 10⁻²
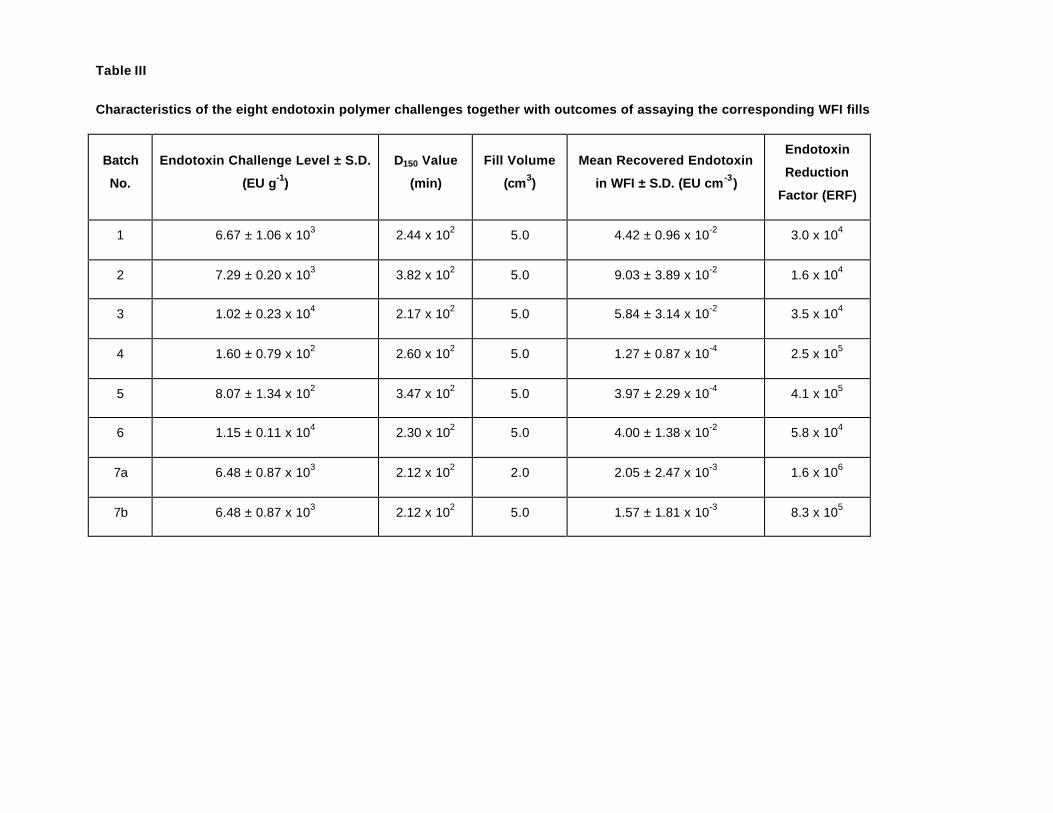
Table III
Characteristics of the eight endotoxin polymer challenges together with outcomes of assaying the corresponding WFI fills
Batch
No.
Endotoxin Challenge Level ± S.D.
(EU g-1)
D150 Value
(min)
Fill Volume
(cm3)
Mean Recovered Endotoxin
in WFI ± S.D. (EU cm -3)
Endotoxin
Reduction
Factor (ERF)
1 6.67 ± 1.06 x 10³ 2.44 x 10² 5.0 4.42 ± 0.96 x 10⁻² 3.0 x 10⁴
2 7.29 ± 0.20 x 10³ 3.82 x 10² 5.0 9.03 ± 3.89 x 10⁻² 1.6 x 10⁴
3 1.02 ± 0.23 x 10⁴ 2.17 x 10² 5.0 5.84 ± 3.14 x 10⁻² 3.5 x 10⁴
4 1.60 ± 0.79 x 10² 2.60 x 10² 5.0 1.27 ± 0.87 x 10⁻⁴ 2.5 x 10⁵
5 8.07 ± 1.34 x 10² 3.47 x 10² 5.0 3.97 ± 2.29 x 10⁻⁴ 4.1 x 10⁵
6 1.15 ± 0.11 x 10⁴ 2.30 x 10² 5.0 4.00 ± 1.38 x 10⁻² 5.8 x 10⁴
7a 6.48 ± 0.87 x 10³ 2.12 x 10² 2.0 2.05 ± 2.47 x 10⁻³ 1.6 x 10⁶
7b 6.48 ± 0.87 x 10³ 2.12 x 10² 5.0 1.57 ± 1.81 x 10⁻³ 8.3 x 10⁵

Table IV
Endotoxin recovered from vials formed from endotoxin polymer batches 7a (2.0 cm3 fill vol.) and 7b (5.0 cm3 fill vol.) following 0 and 90
days storage under ambient, ‘real’ and ‘accelerated’ conditions
Mean Recovered Endotoxin in WFI ± S.D. (EU cm -3 )
90 days storage Batch No.
0 days storage
ambient ‘real’ (40% RH at 25°C) ‘accelerated’(90% RH at 40°C)
7a 2.05 ± 2.47 x 10⁻³ 4.12 ± 10.79 x 10⁻³ 7.85 ± 7.03 x 10⁻⁴ 1.20 ± 0.66 x 10⁻³
7b 1.57 ± 1.81 x 10⁻³ 4.25 ± 4.13 x 10⁻³ 4.13 ± 4.39 x 10⁻³ 2.13 ± 1.99 x 10⁻³

References
1. F. Leo, “Blow/Fill/Seal aseptic packaging technology”, in Aseptic Pharmaceutical Manufacturing Technology
for the 1990s, Interpharm Press Inc., Prairie View, IL, 1989, p.195.
2. Parenteral Drug Association. “Technical Report No. 22, Process Simulation Testing for Aseptically Filled
Products”, PDA J. Pharm. Sci. Technol., 50 (S1), (1996).
3. J. Carley and F. Levy, "Plastics Extrusion Technology Handbook", 2nd Edition, Industrial Press Inc., New
York, 1989, p. 22.
4. I.J. Pflug and R.G. Holcomb, "Principles of Thermal Destruction of Microorganisms", in Disinfection,
Sterilization and Preservation, S.S. Block, Ed., 3rd Edition, Lea & Febringer; Philadelphia, 1983, p. 787.
5 T.J. Novitsky, S.S. Ryther, M.J. Case and S.W. Watson, "Automated LAL testing of parenteral drugs in the
Abbot MS-2", J. Parenteral Sci. Technol., 36, 11 (1982).
6. H. Oisha, A. Takaoka, Y. Hatayama, T. Matsuo and Y. Sakata, "Automated limulus amebocyte lysate (LAL)
test for endotoxin analysis using a new toxinometer ET-210", J. Parenteral Sci. Technol., 39, 194 (1985).
7. J.D. Ludwig and K.E. Avis, "Dry heat inactivation of endotoxin on the surface of glass", J. Parenteral Sci.
Technol., 44, 4 (1990).
8. K. Tsuji and S.J. Harrison, "Dry-heat destruction of lipopolysaccharide: Dry-heat destruction kinetics", Appl.
Environ. Microbiol., 36, 710 (1978).
9. M.J. Akers, K.M. Ketron and B.R. Thompson, “F value requirements for the destruction of endotoxin in the
validation of dry heat sterilization/depyrogenation cycles”, J. Parenteral Sci. Technol., 36, 23 (1982).