evaluation of augmented reality sandtable (ares) … jan 2018 us army research laboratory evaluation...
TRANSCRIPT

ARL-TR-8278 ● JAN 2018
US Army Research Laboratory
Evaluation of Augmented REality Sandtable (ARES) during Sand Table Construction by Kelly S Hale, Jennifer M Riley, Charles Amburn, and Nathan Vey
Approved for public release; distribution is unlimited.

NOTICES
Disclaimers
The findings in this report are not to be construed as an official Department of the
Army position unless so designated by other authorized documents.
Citation of manufacturer’s or trade names does not constitute an official
endorsement or approval of the use thereof.
Destroy this report when it is no longer needed. Do not return it to the originator.

ARL-TR-8278 ● JAN 2018
US Army Research Laboratory
Evaluation of Augmented REality Sandtable (ARES) during Sand Table Construction by Kelly S Hale and Jennifer M Riley Design Interactive, Inc., Orlando, FL
Charles Amburn and Nathan Vey Human Research and Engineering Directorate, ARL
Approved for public release; distribution is unlimited.

ii
REPORT DOCUMENTATION PAGE Form Approved
OMB No. 0704-0188
Public reporting burden for this collection of information is estimated to average 1 hour per response, including the time for reviewing instructions, searching existing data sources, gathering and maintaining the
data needed, and completing and reviewing the collection information. Send comments regarding this burden estimate or any other aspect of this collection of information, including suggestions for reducing the
burden, to Department of Defense, Washington Headquarters Services, Directorate for Information Operations and Reports (0704-0188), 1215 Jefferson Davis Highway, Suite 1204, Arlington, VA 22202-4302.
Respondents should be aware that notwithstanding any other provision of law, no person shall be subject to any penalty for failing to comply with a collection of information if it does not display a currently
valid OMB control number.
PLEASE DO NOT RETURN YOUR FORM TO THE ABOVE ADDRESS.
1. REPORT DATE (DD-MM-YYYY)
January 2018
2. REPORT TYPE
Technical Report
3. DATES COVERED (From - To)
March 2017–August 2017
4. TITLE AND SUBTITLE
Evaluation of Augmented REality Sandtable (ARES) during Sand Table
Construction
5a. CONTRACT NUMBER
5b. GRANT NUMBER
5c. PROGRAM ELEMENT NUMBER
6. AUTHOR(S)
Kelly S Hale, Jennifer M Riley, Charles Amburn, and Nathan Vey
5d. PROJECT NUMBER
5e. TASK NUMBER
5f. WORK UNIT NUMBER
7. PERFORMING ORGANIZATION NAME(S) AND ADDRESS(ES)
US Army Research Laboratory
Human Research and Engineering Directorate (ATTN: RDRL-HRT-A)
12423 Research Parkway, Orlando, FL 32826
8. PERFORMING ORGANIZATION REPORT NUMBER
ARL-TR-8278
9. SPONSORING/MONITORING AGENCY NAME(S) AND ADDRESS(ES)
10. SPONSOR/MONITOR'S ACRONYM(S)
11. SPONSOR/MONITOR'S REPORT NUMBER(S)
12. DISTRIBUTION/AVAILABILITY STATEMENT
Approved for public release; distribution is unlimited.
13. SUPPLEMENTARY NOTES
14. ABSTRACT
The research presented here empirically evaluates the effectiveness and efficiency of sand table terrain model construction on
2 sand tables: a traditional table using a terrain kit and an Augmented REality Sandtable (ARES) that provides a digital
interface and visual overlay projected on a traditional sand table. The objective of the study was to evaluate the impact of a
tangible interface augmented with advanced digital overlays compared to traditional methods on construction accuracy and
efficiency, perceived workload, and knowledge retention. Participants were 55 active duty Soldiers E1–E5 from the 3rd
Infantry Division at Ft Stewart in Hinesville, Georgia. Results demonstrated that the augmented sand table, ARES, resulted in
significantly higher-quality ratings overall for the terrain model based on a global rating scale, as well as specifically on a
focused evaluation of topography item placement and accuracy. Perceived workload and utility both demonstrated an
advantage of ARES compared to the traditional table. This, however, did not translate into differences in post-knowledge
scores, which may be attributable to the low experience level of the participants with sand tables and topographical maps. This
study represents the first investigation of the utility of a digitally enhanced sand table compared to traditional sand-table-on-
sand-table construction with an Army operational unit. 15. SUBJECT TERMS
Augmented REality Sandtable, ARES, augmented reality, sand table, sand table construction, terrain model, mission planning
16. SECURITY CLASSIFICATION OF: 17. LIMITATION OF ABSTRACT
UU
18. NUMBER OF PAGES
82
19a. NAME OF RESPONSIBLE PERSON
Nathan Vey
a. REPORT
Unclassified
b. ABSTRACT
Unclassified
c. THIS PAGE
Unclassified
19b. TELEPHONE NUMBER (Include area code)
(407) 208-3392 Standard Form 298 (Rev. 8/98)
Prescribed by ANSI Std. Z39.18

Approved for public release; distribution is unlimited.
iii
Contents
List of Figures v
List of Tables vi
Acknowledgments vii
1. Introduction 1
2. Methods 2
2.1 Participants 2
2.2 Apparatus 3
2.3 Tasks and Stimuli 6
2.4 Questionnaires, Surveys, Psychometric Tests, or Forms 7
2.5 Experimental Design 8
2.6 Procedure 9
3. Results 11
3.1 Data Reduction and Analysis 11
3.1.1 Outlier Analysis 13
3.1.2 Covariates 13
3.1.3 Normality Testing 14
3.2 Results 14
3.2.1 Construction Performance 14
3.2.2 Time on Construction Activities 15
3.2.3 Post-Knowledge Questionnaire 16
3.2.4 Perceived Workload 16
3.2.5 Perceived Utility 17
4. Discussion and Conclusions 18
4.1 Study Limitations 19
4.2 Directions for Future Work 20

Approved for public release; distribution is unlimited.
iv
5. References 21
Appendix A. Demographics Questionnaire 23
Appendix B. Santa Barbara Sense of Direction Scale 27
Appendix C. Land Navigation/Map Reading Test 31
Appendix D. Sand Table Construction Score Card 35
Appendix E. Terrain Construction Grade 37
Appendix F. Post-Construction Knowledge Test 39
Appendix G. System Usability Scale 43
Appendix H. NASA Task Load Index (NASA-TLX) 45
Appendix I. Outlier Analysis: Box Plots 49
Appendix J. Normality Testing: Histograms 59
List of Symbols, Abbreviations, and Acronyms 70
Distribution List 71

Approved for public release; distribution is unlimited.
v
List of Figures
Fig. 1 A 7- × 4-ft “squad-sized” ARES prototype .......................................... 4
Fig. 2 Placement of units using associated mobile tablet ................................ 5
Fig. 3 Example terrain model kit ..................................................................... 5
Fig. 4 FRAGO map used in study ................................................................... 7
Fig. 5 Sand table construction scores showing mean and standard error of the mean between groups (* denotes significance) .................................. 14
Fig. 6 Terrain construction grade showing mean and standard error of the mean between groups (* denotes significance) .................................. 15
Fig. 7 Time on construction activities showing mean and standard error of the mean across groups (*denotes significance) ................................. 16
Fig. 8 NASA-TLX Scores for perceived load showing means and standard error of the mean across groups (*denotes significance) .................... 17
Fig. 9 Perceived system usability scale scores showing means and standard error of the mean across groups (* denotes significance) ................... 17
Fig. I-1 Sand table construction score.............................................................. 50
Fig. I-2 Terrain construction grade .................................................................. 50
Fig. I-3 Time to set up table ............................................................................. 51
Fig. I-4 Time spent building topography (sand) .............................................. 51
Fig. I-5 Time spent placing tactical symbols/graphics .................................... 52
Fig. I-6 Post-knowledge questionnaire map: labels ......................................... 52
Fig. I-7 Post-knowledge questionnaire map: landmarks .................................. 53
Fig. I-8 Post-knowledge questionnaire map: routes ........................................ 53
Fig. I-9 Post-knowledge questionnaire score ................................................... 54
Fig. I-10 NASA-TLX mental load ..................................................................... 54
Fig. I-11 NASA-TLX physical load .................................................................. 55
Fig. I-12 NASA-TLX temporal load ................................................................. 55
Fig. I-13 NASA-TLX performance load ........................................................... 56
Fig. I-14 NASA-TLX effort load ....................................................................... 56
Fig. I-15 NASA-TLX frustration ....................................................................... 57
Fig. I-16 NASA-TLX total load......................................................................... 57
Fig. I-17 System usability scale ......................................................................... 58
Fig. J-1 Sand table construction score.............................................................. 61
Fig. J-2 Terrain construction grade .................................................................. 61

Approved for public release; distribution is unlimited.
vi
Fig. J-3 Time to set up table ............................................................................. 62
Fig. J-4 Time spent building topography (sand) .............................................. 62
Fig. J-5 Time spent placing tactical symbols/graphics .................................... 63
Fig. J-6 Post-knowledge questionnaire map: labels ......................................... 63
Fig. J-7 Post-knowledge questionnaire map: landmarks .................................. 64
Fig. J-8 Post-knowledge questionnaire map: routes ........................................ 64
Fig. J-9 Post-knowledge questionnaire score ................................................... 65
Fig. J-10 NASA-TLX mental load ..................................................................... 65
Fig. J-11 NASA-TLX physical load .................................................................. 66
Fig. J-12 NASA-TLX temporal load ................................................................. 66
Fig. J-13 NASA-TLX performance load ........................................................... 67
Fig. J-14 NASA-TLX effort load ....................................................................... 67
Fig. J-15 NASA-TLX frustration ....................................................................... 68
Fig. J-17 NASA-TLX total load......................................................................... 68
Fig. J-18 System usability scale ......................................................................... 69
List of Tables
Table 1 Procedure schedule: daily schedule .................................................... 11
Table J-1 Tests of normalcy of the data .............................................................. 60

Approved for public release; distribution is unlimited.
vii
Acknowledgments
The authors would like to acknowledge the following people who were
paramount in the coordination, planning, and study implementation of this
project:
CPT David Downing and his team from the 3rd Infantry Division at Ft
Stewart for providing support and study resources
Mr Nathan Vey and SFC Roger Ordish of the US Army Research
Laboratory Human Research and Engineering Directorate’s Advanced
Training and Simulation Division for their expertise, experience, and
guidance during experimentation, protocol development, and system
setup; and for providing subject-matter expert evaluations of sand
construction during data collection
Mr Christopher Markuck from Dignitas Technologies, Inc., and his team in
providing and installing hardware and software for the Augmented REality
Sandtable (ARES) used in this study.

Approved for public release; distribution is unlimited.
viii
INTENTIONALLY LEFT BLANK.

Approved for public release; distribution is unlimited.
1
1. Introduction
Advances in technologies such as multimodal and tangible interfaces, along with
augmented reality systems, are leading to increased popularity of tangible
interaction as a means for boosting learning, collaborative work, and social
interactions (Marshall et al. 2007; Schneider et al. 2016). Tangible interaction
encompasses a broad range of systems and interfaces that facilitate embodied or
physical interaction, tangible manipulation and physical representation of data,
embeddedness in real space, and digitally augmenting physical spaces (Buur et al.
2004; Price and Rogers 2004). The technologies are rapidly advancing along with
research that has focused on technological developments and the establishment of
taxonomies for tangible interactions (Fishkin 2004). Theoretical and empirical
work toward substantiating purported learning and performance benefits of the
tangible interactions supported through these technologies is currently limited;
however, work in the area is expanding.
The Army has used sand tables, a form of tangible interfaces, for decades to support
tactical mission planning and briefing (Brewster 2002). These can vary in
complexity from a formal sandbox and associated terrain kit indoors to a rough area
mapped out on the ground during operations using items available in nature to
represent various tactical symbols and graphics. As technology advances to allow
multimodal and augmented display enhancements or alternatives to sand tables, it
is critical to empirically examine the benefit of integrating such advances on
Soldiers’ construction abilities, knowledge retention, and perceived load. As noted
in Schmidt-Daly et al. (2016, p 7), “Any effort made to enhance or modify
existing, traditional sand tables would need to ensure the new system will meet
ease-of-use and training outcome requirements deemed important by Military
instructors and leaders.”
Research is needed to identify the advantages of multimedia tangible interaction
systems, such as the US Army Research Laboratory’s Augmented REality
Sandtable (ARES), and the contexts for which these technologies are most
effective, particularly as they relate to the Army’s operational units. When paired
with a traditional physical sand table, ARES enhances the experience, providing
tactile and 3-D visualization of terrain with a digital overlay. This produces
enriched graphics and interactivity (Amburn et al. 2015) for the user, offering a
multimodal and multisensory user interaction that is expected to benefit the
development and retention of spatial knowledge. Previous research has
demonstrated significant performance gains using ARES for landmark
identification and distance estimation tasks compared to using a paper map and a

Approved for public release; distribution is unlimited.
2
2-D digital display of a 3-D map (Smith-Daly et al. 2016), and significant
differences in both cognitive load (in favor of ARES) and increased engagement
(Boyce et al. 2016, 2017). The current study examines the impact of a basic sand
table compared to ARES on the benefits related to sand table construction and
quantifies the impact of projected digital overlays onto the tangible interface to
support construction. Soldiers constructed sand table–representative terrain models
based on orders provided via paper-based maps and written orders, which included
enemy locations, land hazards and topography, and tactical planning symbols. Sand
tables are used to support mission briefings. Therefore, an accurate representation
of land features and tactical graphics is critical to ensure a common understanding
of the mission plan.
The research presented here empirically evaluates the effectiveness and efficiency
of sand table terrain model construction, and advantages provided by tangible
interfaces and associated digital enhancements to an operational unit, including
terrain modeling efficiency, effectiveness, and knowledge retention using ARES
compared to a traditional sand table.
The objectives were 2-fold:
Evaluate the impact of a tangible interface augmented with advanced digital
overlays (ARES) compared to traditional methods on construction accuracy
and efficiency, perceived workload, and knowledge retention; and
Conduct a preliminary assessment of the utility for using multimodal and
tangible interfaces for assessing operational skills.
2. Methods
2.1 Participants
Fifty-five participants—39 males and 16 females—ranging in age from 18 to 32
years (mean age [Mage] = 22.42, standard deviation [SDage] = 3.48) voluntarily
completed the study. Participants were all active duty military personnel and
participated as part of their normal work day. The majority of participants were
right-handed (48), while 7 were left-handed. Handedness was considered, as
previous research has shown a potential relationship between handedness and
spatial ability (Peters et al. 2006; Mefoh and Samuel 2013). All had completed a
high school diploma or equivalent, with 4 having associate’s degrees, 3 having
bachelor’s degrees, and 1 having a graduate degree. Participants were E1–E5
rank, with 1 Sergeant (SGT; E5), 33 Specialists (SPC; E4), 11 Privates First Class

Approved for public release; distribution is unlimited.
3
(PFC; E3), 9 Privates Second Class (PV2), and 1 Private (PV1). Those reporting
familiarity or experience with sand tables were under military occupational
specialty (MOS) 13F (fire support specialist; n = 3) and MOS 12W (carpentry
and masonry specialist; n = 1).
Of the 55 participants, 3 participants did not choose to participate in the
construction exercise and excused themselves from the study. Thus, there were a
total of 26 participants (19M; 7F) who completed the study using ARES and 26
participants (17M; 9F) who completed the study using the traditional sand table.
2.2 Apparatus
The ARES architecture supports a user-defined operating picture (Mulgund and
Landsman 2007) to the point of need (e.g., sand table, desktop, mobile device, or
mixed reality headsets). This allows for real-time collaboration on mission
planning, mission rehearsal, or after-action review.
For this experiment, only the ARES software, 7- × 4-ft physical sand table, and
associated mobile tablet were used. The experimental group used the ARES
proof-of-concept table, which was a traditional sand table filled with play sand
and supplemented with low-cost commercial off-the-shelf (COTS) components
as shown in Fig. 1. They included the following equipment:
A commercial projector (~$900)
Microsoft’s Kinect sensor (~$200)
A COTS laptop (~$3,000)
An LCD monitor (~$400)
Government-owned ARES software.

Approved for public release; distribution is unlimited.
4
Fig. 1 A 7- × 4-ft “squad-sized” ARES prototype
The following ARES capabilities were used in this study:
Projection of Topographic Map onto the Sand. ARES displayed a top-
down view of the Fragmentary Order (FRAGO) topographical map used in
this study. This view mimicked the display shown on the associated tablet
interface.
Placement and Labeling of Units and Tactical Graphics. The full library
of Military Standard (MIL-STD) 2525C military symbols, including icons
and tactical graphics, was available to support creating a copy of the
FRAGO on ARES through the associated tablet interface. Units and
graphics could be labeled and placed using built-in tools such as a tracked
10-digit grid location for mission planning. This plan (“scenario”) was
saved (Fig. 2) for analysis.
Export of the User-Shaped Sand as a 3-D Terrain File. Sand topologies
and associated scenarios were captured and sorted for assessment. Sand
topologies were saved in a format that allows for assessment via 3-D
viewing software on both PCs and mixed-reality headsets, such as the
Microsoft HoloLens or the HTC Vive.

Approved for public release; distribution is unlimited.
5
Fig. 2 Placement of units using associated mobile tablet
The control group used a modified version of the ARES sand table that had the
same physical dimensions but lacked the LCD. An associated terrain kit was
provided, as none of the ARES technical features were used by the participants and
thus the map imagery and tactical graphics were not projected down onto the table.
The terrain kit included items required to complete the construction task, such as
various colored string (red, blue, gray, black), pencil, markers (black, blue, red),
550 cord, 3 × 5 cards, poker chips (blue/red), and tape (Fig. 3). A legend of available
materials was provided for reference. The provided kit allowed for the manual
construction of all the same features included or available within the ARES
interface.
Fig. 3 Example terrain model kit

Approved for public release; distribution is unlimited.
6
In both cases, the ARES software was calibrated using the Microsoft Kinect sensor
to ensure precise alignment of the interpreted sand topologies with the physical
sand table. The ARES software was used to capture data for both conditions. Data
that were captured from the ARES condition included 3-D sand topology, an image
of the completed scenario, the location of tactical units and graphics, and a top-
down image of the completed mission plan and shaped topography. From the
traditional condition, the following data were captured: 3-D sand topology and top-
down image of the completed mission plan and shaped topography.
2.3 Tasks and Stimuli
Because participants would be randomly assigned to their conditions later, an
introduction session was provided for each sand table condition up front. A hands-
on training period was provided to introduce the ARES table, tablet interface, and
controls that were required to complete the construction task within the
experimental group. The training period allowed each participant to project a map
down onto the sand; physically manipulate the sand to match contour lines; and
add, edit, and delete tactical graphics and symbols using the tablet interface. The
training period for ARES took approximately 20 min.
A verbal introduction was also provided for the traditional sand table. Participants
were encouraged to physically manipulate the sand to represent land features and
were introduced to the various materials provided to support construction of the
tactical graphics. The introduction to the traditional table took approximately
10 min, as there was no computer interface being introduced to the participants.
During the experiment, participants were provided a tactical map presented on
11- × 17-inch cardstock (Fig. 4). A legend was provided on the back side of the
cardstock. On a separate piece of paper, a written FRAGO was provided, outlining
the current status of the tactical plan. Participants were asked to construct a sand
table terrain model that accurately depicted the relevant topography and the tactical
plan as outlined on the map and in the FRAGO. Participants were given an
equivalent amount of time, 30 min, to construct their sand table model. A 30-min
duration was chosen based on subject-matter expert (SME) input, noting that
experts would take 25–30 min to construct—thus, within this timeline, all
participants should be actively constructing and not finishing the task considerably
earlier than planned, thereby leading to groups having different exposure times.
Participants constructed the table on a standard sand table or ARES, as defined by
which experimental condition they are randomly assigned to. The participants
assigned to the experimental condition (ARES) were also provided a quick user

Approved for public release; distribution is unlimited.
7
interface reference to aid them in remembering how to use the interface covered
during the training period.
Fig. 4 FRAGO map used in study
2.4 Questionnaires, Surveys, Psychometric Tests, or Forms
Validated, easy to implement measures associated with individual differences
were selected based on past research and theory to examine the effects of
individual differences potentially impacting performance of the spatial
knowledge tasks conducted in this study (Hart and Staveland 1988; Darken and
Banker 1998; Goldiez et al. 2007).
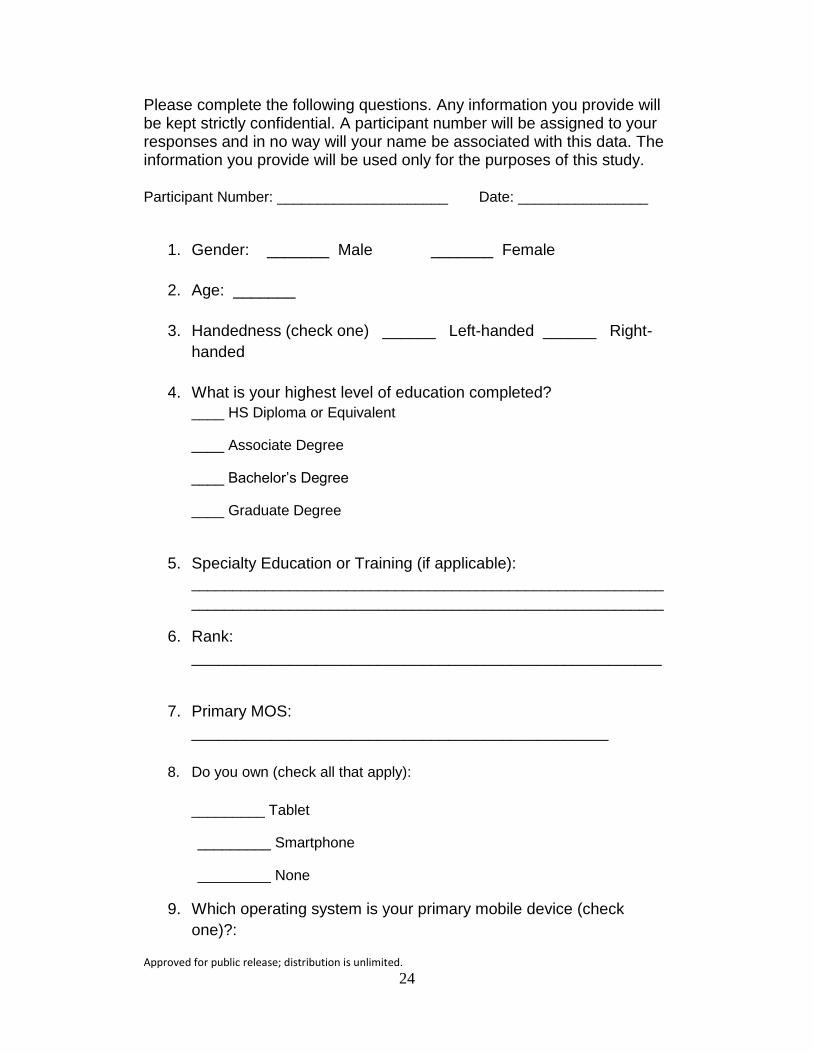
Demographics Questionnaire: This questionnaire contained items pertaining to
individual differences (e.g., age, sex, MOS, familiarity with technology, sand table
construction experience). See Appendix A.
Santa Barbara Sense of Direction Scale: This questionnaire contained items
pertaining to subjective sense-of-direction in terms of orienting oneself to the
environment (Hegarty et al. 2002) and was assessed using a paper-based method.
This questionnaire provides a quick, subjective measure of spatial ability. See
Appendix B.

Approved for public release; distribution is unlimited.
8
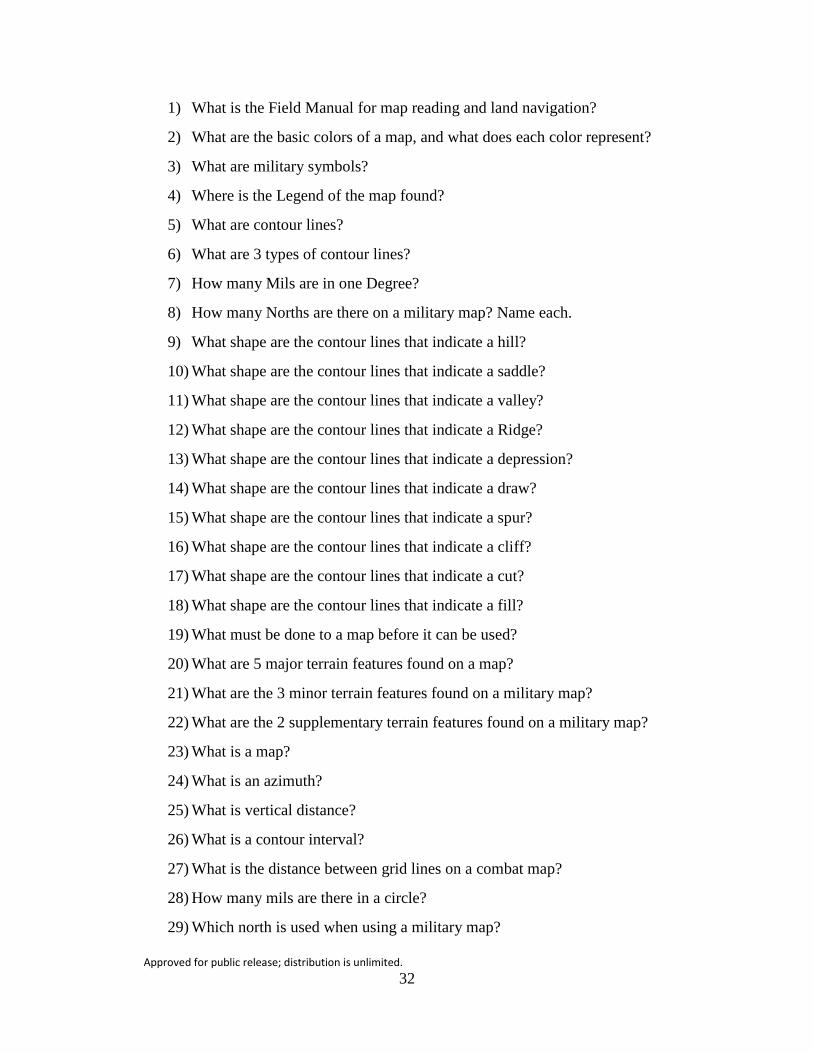
Land Navigation/Map Reading Test: This was an open-ended response test to
evaluate knowledge related to sand table construction and was assessed using a
paper-based method. See Appendix C.
The following questionnaires were used as dependent measures in this study.
Sand Table Construction Score Card: A 5-point Likert scale was used to identify
the accuracy and quality of required sand table elements from the US Army’s
Ranger Handbook SH 21-76 (US Army 2011). SMEs familiar with the experiment
evaluated each table. Two SMEs participated and altered which table they reviewed
based on the day of data collection (e.g., one SME evaluated traditional on Day 1,
ARES on Day 2) throughout the experiment in an attempt to control for differences
across raters and conditions. It was determined post-hoc that only questions 4–9
were applicable to both the ARES and traditional table, and thus only those
responses were used to evaluate construction across both conditions. See
Appendix D.
Terrain Construction Grade: Each table was evaluated using a grading sheet that
specifically looked for the presence and accuracy of key terrain features (such as
hills, valleys, ridges, etc.). A total of 15 questions were evaluated by SMEs familiar
with the experiment. Two SMEs participated and altered which table they reviewed
based on the day of data collection (e.g., one SME evaluated traditional on Day 1,
ARES on Day 2) throughout the experiment in an attempt to control for differences
across raters and conditions. See Appendix E.
Post-Construction Knowledge Test: This questionnaire captured spatial
knowledge recall of construction task, including creation of a map outlining the
entity labels, locations, and routes included in the map (Coluccia et al. 2007). In
addition, 11 multiple choice questions related to the FRAGO were included to
assess recall of key terrain and entity placement. See Appendix F.
System Usability Scale: Items pertaining to perceived ease of use, utility to
complete construction, and user satisfaction were used in this questionnaire
(Brooke 1996). See Appendix G.
NASA Task Load Index (NASA-TLX): This is a validated, self-report measure
of perceived workload and effort (Hart and Staveland 1988). Subscales include
mental, physical, temporal, performance, effort, and frustration. See Appendix H.
2.5 Experimental Design
The study was a between-group comparison, with sand table type as the
independent variable (traditional, ARES). Dependent variables were sand table

Approved for public release; distribution is unlimited.
9
construction scores, terrain construction grades, time spent in build activities (e.g.,
setting up table, adding tactical graphics, building terrain), Post-Construction
Knowledge Test scores, perceived workload scores, and perceived utility
scale/system usability questionnaire as described previously. Potential covariate
measures collected included demographics, Santa-Barbara Sense-of-Direction
Scale (Hegarty et al. 2002), and land navigation/map reading test. Based on a
previous study that showed medium to high effect sizes (Schmidt Daly et al. 2016),
a conservative Cohen’s d of 0.65 was used with an alpha of 0.05 and power of 0.8
to determine an a priori sample size total of 60 participants for the study.
Specific research hypotheses are outlined as follows:
H1: Construction of a tactical terrain map using ARES will include significantly
more accurate terrain features, resulting in a higher sand table construction
score, than using a traditional sand table.
H2: Constructing a tactical terrain map on ARES will show significantly higher
outcome performance on a Post-Construction Knowledge Test compared to
constructing on a traditional sand table.
H3: Construction of a tactical terrain map using ARES will result in
significantly lower perceived workload than using a traditional sand table.
H4: Perceived utility/system usability will be significantly higher with ARES
compared to a traditional sand table.
Participants were assigned to treatment conditions based on the time they arrived
at the study location, as participants were run in groups of 2. The first participant
who arrived for each session was assigned to one group, while the other participant
was in the alternative group—first participants were assigned to either ARES or
traditional sand table on an alternating schedule.
2.6 Procedure
Each day, up to 12 participants arrived at the test location. They were briefed on
the study purpose by the principal investigator (PI) and/or associate investigators
(AIs), and each was asked to complete an Informed Consent, which was collected
by the PI and/or AIs. Those that chose not to sign the informed consent left the
study room and returned to their normal duties. Following completion of the
Informed Consent, each participant was provided a numbered envelope—the
number was used as their participant number throughout the study. Participants then
completed the demographics questionnaire and Santa Barbara Sense of Direction
Approved for public release; distribution is unlimited.
10
scale. They were then given up to 30 min to complete the Land Navigation/Map
Reading Test to assess knowledge in land navigation and map reading.
All participants then completed an introduction session to both the traditional sand
table and the ARES system in the group setting. The traditional sand table
introduction focused on the contents of the terrain model kit that was provided,
reviewing the items included, and possible uses as applicable to sand table
construction. The ARES introduction focused on familiarization of features of the
technology and how to use the system interface (e.g., location of various controls
within the interface). This ensured that all participants were familiar with both sand
table construction environments and were prepared to participate in their assigned
role.
After completing the opening session, participants were assigned to a test session
to complete the experimental protocol and asked to return at a specified time for
1 h. Participants were assigned to treatment conditions based on the time they
arrived at the study site for their scheduled time, as participants were run in groups
of 2. The first participant who arrived for each session was assigned to one group,
while the other participant was in the alternative group—first participants were
assigned to either ARES or the traditional sand table on an alternating schedule.
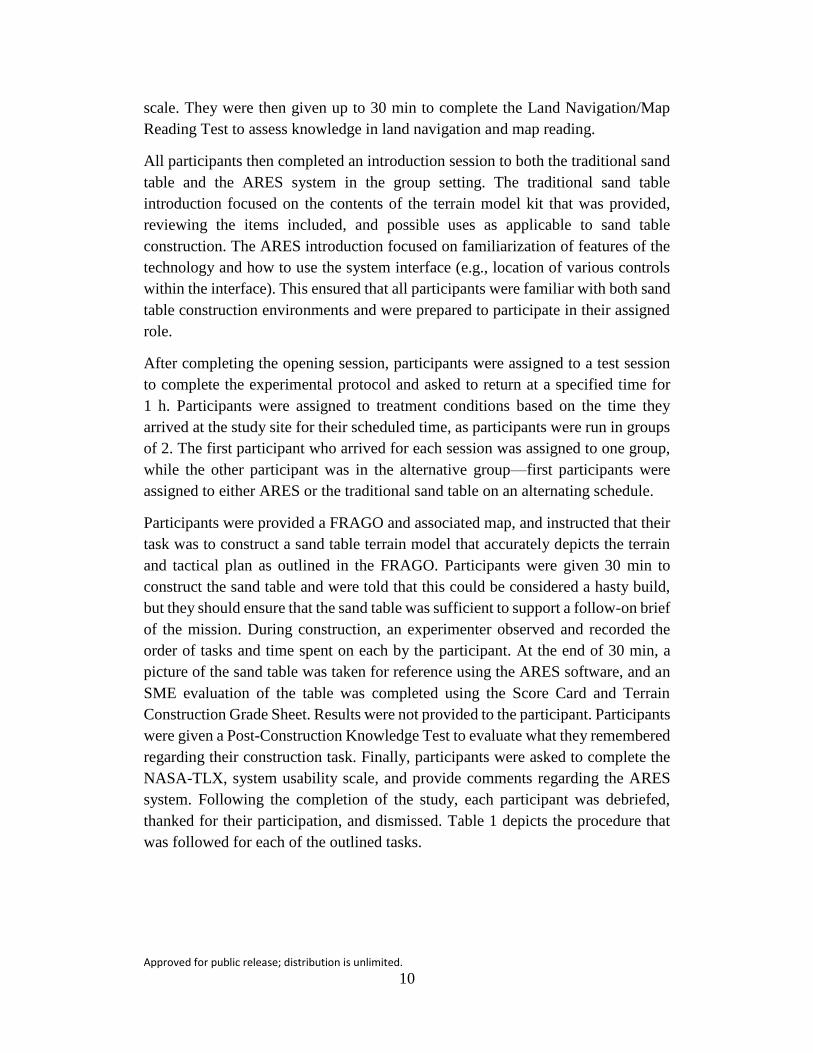
Participants were provided a FRAGO and associated map, and instructed that their
task was to construct a sand table terrain model that accurately depicts the terrain
and tactical plan as outlined in the FRAGO. Participants were given 30 min to
construct the sand table and were told that this could be considered a hasty build,
but they should ensure that the sand table was sufficient to support a follow-on brief
of the mission. During construction, an experimenter observed and recorded the
order of tasks and time spent on each by the participant. At the end of 30 min, a
picture of the sand table was taken for reference using the ARES software, and an
SME evaluation of the table was completed using the Score Card and Terrain
Construction Grade Sheet. Results were not provided to the participant. Participants
were given a Post-Construction Knowledge Test to evaluate what they remembered
regarding their construction task. Finally, participants were asked to complete the
NASA-TLX, system usability scale, and provide comments regarding the ARES
system. Following the completion of the study, each participant was debriefed,
thanked for their participation, and dismissed. Table 1 depicts the procedure that
was followed for each of the outlined tasks.

Approved for public release; distribution is unlimited.
11
Table 1 Procedure schedule: daily schedule
Time Segment Measure/Task Time (min)
0800 Study
Introduction (12 participants)a
Informed Consent 5
Demographic Questionnaire 5
Santa Barbara Sense of Direction 5
Land Navigation Test 30
Sand Table Introduction 45
0930
1030
1130
1230 (lunch)
1330
1430
1530
Construction Task
(Participants scheduled at
individual hour timeslots)a
Introduction/FRAGO Provided 10
Construction Phase 30
Post-Construction Knowledge Test 10
System Usability Scale 5
Posttest Administration
Debrief 5
Total: 150 min per participant a After being dismissed from the morning introduction session, participants were free to leave the
study area and resume other duties as scheduled by their Commanding Officer. They were asked
to return at their scheduled time to complete the final hour of the study protocol.
3. Results
3.1 Data Reduction and Analysis
To assess data for analyses, dependent measures were coded and scored as follows.
Sand Table Construction Score Card: While the score card rated 12 items on a
5-point scale, it was determined that only 6 of the items directly related to both
conditions and could be compared across the 2 conditions. The ARES system’s
down-projected map included danger areas (e.g., roads, trails) yet did not include
an option to insert a blow-up of the objective area; both of these items from the
score card were irrelevant in this condition. In addition, because labeled grid lines
that provided scale and orientation information were included in the ARES
projected map image, it was unnecessary for the ARES table to have a north-
seeking arrow, scale, or participant-created grid lines. In addition, both systems
were provided a legend, so creating a separate legend as part of the construction
task was not necessary. Thus, the final construction score for each participant was
an average score across 6 items each rated on a 5-point Likert scale: objective
location, exaggerated terrain relief, friendly patrol locations, targets, routes, and
planned rally points.

Approved for public release; distribution is unlimited.
12
Terrain Construction Grade: Each YES rating was given 1 point. Each NO rating
was given 0 points. The total performance score was the sum total of YES ratings
for each participant.
Time Conducting Sand Table Activities: The time spent conducting various
construction activities was recorded using a timer by observers during the task. For
the traditional table, the time spent measuring, laying down, and labeling grid
lines—and laying down land symbols—was combined to provide a table setup
time. For the ARES table, the table setup time represented the time needed to create
a new scenario and project the map down onto the ARES table. The remaining time
was recorded according to 3 categories: topography manipulation/building the
sand, tactical graphics, and reviewing the map/table. Because time reviewing the
map was recorded for less than half of the participants, and overall time spent on
this activity was low, this measure was not considered for analysis.
Post-Construction Knowledge Test: The first question on the test asked
participants to recreate a visual map that represented the FRAGO map they had just
reproduced on the sand table. The quality of the map reproduced was evaluated
using standard procedures of the map-drawing paradigm, such as that outlined in
Coluccia et al. (2007). The map was scored in 3 categories:
Labels: This evaluated the correctness of verbal labels of each landmark
included in the drawing independent of its location. Each correct label was
given a value of 1. The score was the sum total of correct labels.
Locations: This evaluated the number of landmarks properly placed in the
drawing. Each landmark correctly placed respective to other entities on the map
was given a value of 1. The score was the sum total of correctly placed
landmarks.
Routes: This evaluated the scale and completeness of routes placed on the map.
A score of 1 was given if a route was representative of more than 70% of its
original length/location on the map. A score of 0.5 was given if a route was
between 50% and 70% representative of its original length/location. The score
was the sum total of route scores.
The remaining 11 questions on the knowledge test were evaluated for correctness.
Each correct response was given a score of 1. The total score was the sum total of
correct responses.

Approved for public release; distribution is unlimited.
13
3.1.1 Outlier Analysis
The goal for outlier removal was to reduce potential for inflated error rates,
skewed data, and potential misrepresentation of statistical analysis (Zimmerman
1994). Box plots were created to investigate outliers (Appendix I). Outliers under
consideration for removal were defined as data points that fell outside 2 standard
deviations from the mean. If a single participant had more than 50% of their data
considered to be an outlier, then the entire data set for the participant would be
omitted from data analysis (e.g., McGill et al. 1978). No participant was omitted
completely by this rule. However, 2 outliers were detected for the post-
knowledge questionnaire multiple choice section and were excluded from that
analysis only, as they demonstrated perfect scores—it was determined that the
answer key was accidentally provided to these participants. There were additional
outliers found for the ARES group: 1 outlier identified on the NASA-TLX Physical
Workload scale, 1 outlier identified on the post-knowledge questionnaire, and 2
outliers in the performance measure of time to “set up” the sand table. However,
these scores were within the overall range of scores across both groups and were
not excluded from the analysis. There was no other missing data across sets for
those that completed the study.
3.1.2 Covariates
Data considered potential covariates included participant gender, age, handedness,
education level, operating system on personal device (Apple or Android), reported
use of sand tables in current duty position (Yes/No), reported familiarity with sand
tables, Santa Barbara Sense of Direction score, and land navigation test score. Only
4 participants reported using sand tables in their current duty, and 4 reported having
familiarity with sand tables. Thus, these 2 metrics were removed as potential
covariates given the small number of participants who reported experience and
familiarity with sand tables. Out of the remaining data, age and operating device
showed a significant relationship to some of the dependent measures. Age was
correlated with the post-knowledge mapping score: location (r = –0.279, n = 52,
p = 0.045) and system usability scale score (r = –0.296, n = 52, p = 0.028). The
operating system of their primary mobile device was correlated with Sand Table
Construction Score (r = 0.296, n = 52, p = 0.033), Terrain Construction Score
(r = 0.324, n = 52, p = 0.019), and post-knowledge test (r = 0.298, n = 50,
p = 0.036). Any covariates relating to the dependent variables were controlled for
in subsequent analyses. This step was important because it set up the ability of the
independent variables to explain significant incremental variance in the dependent
variables above and beyond that which is accounted for by individual differences.
For these dependent measures, an analysis of covariance (ANCOVA) analysis was

Approved for public release; distribution is unlimited.
14
used to factor in the related variable. Remaining dependent measures were analyzed
using t-tests comparing the difference between 2 independent means to examine
effects of the sand table (traditional vs. ARES).
3.1.3 Normality Testing
To test normality of the data, an evaluation of skewness and kurtosis, as well as
histograms with normalcy curves, was performed in the Statistical Package for
Social Science (Appendix J). One dependent variable resulted in values of greater
than ±2 in either skewness or kurtosis from the statistical evaluation, which was
time to set up the sand table. Thus, this variable was tested using the Mann–
Whitney–Wilcoxon nonparametric statistical evaluation.
3.2 Results
3.2.1 Construction Performance
Sand table construction performance was evaluated first using the sand table
construction score card and the terrain construction grade. A one-way ANCOVA
was conducted to determine a statistically significant difference between type of
sand table on these 2 dependent variables controlling for the participant’s operating
system on their personal mobile device. Significant main effects were found with
regard to sand table for both the sand table construction score
[F(1, 50) = 8.312, p = 0.001, partial eta squared = 0.182] (Fig. 5) and terrain
construction grade [F(1, 50) = 11.671, p < 0.001, partial eta squared = 0.323]
(Fig. 6).
Fig. 5 Sand table construction scores showing mean and standard error of the mean
between groups (* denotes significance)

Approved for public release; distribution is unlimited.
15
Fig. 6 Terrain construction grade showing mean and standard error of the mean between
groups (* denotes significance)
3.2.2 Time on Construction Activities
The time to set up the sand table did not meet normality assumptions and thus was
evaluated using a nonparametric statistical test. A Mann–Whitney test indicated
that time to set up was significantly faster for the ARES condition (Mdn = 1.00)
than for the traditional sand table condition (Mdn = 12.00), U = 0.00, p < 0.001, eta
squared = 0.79. U equaling zero indicates that all samples in one group were lower
than all samples in the second group. Thus, the null hypothesis can be rejected that
all samples have been drawn from the same distribution.
The time spent building topography and time spent adding tactical graphics during
construction were evaluated using an analysis of variance (ANOVA). Results
showed no significant effect of sand table on building topography time
[F(1, 46) = 3.518, p = 0.067, partial eta squared = 0.073] but did show a significant
main effect of sand table for time spent adding tactical graphics [F(1, 46) = 61.956,
p < 0.001, partial et squared = 0.579], where those in the ARES condition spent
significantly more time adding tactical symbols compared to those using the
traditional sand table. Figure 7 illustrates means and standard error for time spent
in each construction activity.

Approved for public release; distribution is unlimited.
16
Fig. 7 Time on construction activities showing mean and standard error of the mean across
groups (*denotes significance)
3.2.3 Post-Knowledge Questionnaire
The map evaluation scores were evaluated separately due to the influence of
covariates on the scores. A one-way ANCOVA was used to evaluate the Labels
score using the participants’ operating system on their personal mobile device as a
covariate. Results showed no significant main effect [F(1, 50) = 2.046, p = 0.159,
partial eta squared = 0.033]. A one-way ANCOVA was used to evaluate the
Landmark score using age as a covariate. Results showed no significant main effect
[F(1, 52) = 0.977, p = 0.328, partial eta squared = 0.020]. A t-test was used to
evaluate Routes score. Results showed no significant main effect [t(50) = 0.090,
p = 0.929, Cohen’s d = 0.026].
The remaining 11 multiple choice scores were summed. A one-way ANCOVA was
used to evaluate significance for this dependent variable using the participants’
operating system on their personal mobile device as a covariate. There was no
significant main effect of sand table for the average scores on the post-knowledge
questionnaire [F(1, 50) = 2.532, p = 0.118, partial eta squared = 0.015].
3.2.4 Perceived Workload
Perceived workload was measured using the NASA-TLX self-reported
questionnaire, and subscale ratings as well as the total workload score were evaluated
using an ANOVA. Significant main effects for the sand table were found for Mental
[F (1, 50) = 9.419, p = 0.003, partial eta squared = 0.159], Physical [F(1, 50) = 7.451,
p = 0.009, partial eta squared = 0.130], Temporal [F(1, 50) = 10.147, p = 0.002, partial
eta squared = 0.169], and Performance [F(1, 50) = 9.293, p = 0.004, partial eta
squared = 0.157] subscales, as well as overall workload [F(1, 50) = 7.597, p = 0.008,

Approved for public release; distribution is unlimited.
17
partial eta squared = 0.132]. Ratings for all were lower for the ARES group compared
to the Traditional group (Fig. 8). No other significant differences were found.
Fig. 8 NASA-TLX Scores for perceived load showing means and standard error of the
mean across groups (*denotes significance)
3.2.5 Perceived Utility
A one-way ANCOVA was conducted to determine a statistically significant
difference between type of sand table on System Usability Scale Scores controlling
for the participant’s age. There was a significant main effect of sand table for
perceived utility/system usability [F(1, 52) = 5.896, p < 0.001, partial eta squared
= 0.270] (Fig. 9).
Fig. 9 Perceived system usability scale scores showing means and standard error of the
mean across groups (* denotes significance)

Approved for public release; distribution is unlimited.
18
4. Discussion and Conclusions
This study conducted with active duty Soldiers represents the first investigation of
the utility of a digitally enhanced sand table compared to a traditional sand table on
sand table construction with an Army operational unit. The goal of the study was
to examine the impact of using a digital interface and interactive visual overlay on
sand table construction, knowledge recall immediately after the task, perceived
workload, and perceived system utility compared to using a traditional sand table
and terrain building kit. Results demonstrated that the augmented sand table,
ARES, resulted in significantly higher quality ratings for the terrain model overall
based on a global rating scale, as well as specifically on a focused evaluation of
topography item placement and accuracy. With the ARES system, Soldiers spent
significantly less time setting up the table, as grid lines and land symbols were
incorporated into the visual overlay. This allowed more time to focus on tactical
graphic and symbol placement on the table. Further, the digital overlay and
associated tablet interface supported accurate placement of icons by having not only
the identical reference displayed with grid lines, but also by providing the capability
of showing the accurate 10-point grid coordinate location on the interface. These
key features supported more appropriate entity placement compared to a traditional
sand table based on SME assessed scores of the construction and terrain features
included. Further analysis to quantify the accuracy of entity placement is pending.
Results from the post-knowledge test showed no significant difference between
sand table groups. Both groups scored relatively low across all aspects of the post-
knowledge test, including map re-creation and multiple-choice questions. This
could be attributed to the lack of knowledge or experience with sand tables and
topographical maps as evident from their low scores on the land navigation test and
self-reported experience levels.
Perceived workload and perceived utility both demonstrated an advantage of ARES
compared to the traditional table. Perceived workload, as measured using the
NASA-TLX ratings, demonstrated significantly higher scores reported with the
traditional sand table compared to the ARES sand table. Mental, physical, temporal,
and performance subscales were all significantly higher for those using the
traditional table. This may be attributable to the fact that with the traditional table,
participants were expected to create their own grid space on the table, measuring
and marking out appropriate locations for grid lines, as well as adding land
symbols/features to the sand table. Participants spent between 6 and 25 min setting
up the traditional table compared to those in the ARES condition who only spent
between 1 and 4 min, as grid lines and land symbols were included in the digital

Approved for public release; distribution is unlimited.
19
scenario file that projected down on the sand. Thus, the ARES condition provided
an advantage across the physical, mental, and temporal demand experienced,
allowing participants to spend more time on placement of tactical symbols and
graphics with less effort. These findings are in line with results from the System
Usability Score, where ARES was also rated significantly higher in perceived
utility for the given task compared to the traditional table. It should be noted,
however, that participants were exposed to both conditions prior to participating in
the construction activity. Some bias may have been developed during initial
exposure, which may have influenced their subjective ratings post-exposure.
For operational units, the focus in constructing sand tables should be on elements
critical to tactical planning and operations. The ARES sand table provides the
opportunity to decrease setup time while also improving appropriate placement as
measured via SME assessment of construction by displaying accurate grid lines and
map features directly onto the sand table, allowing Soldiers to focus on 1) shaping
accurate terrain topography and 2) placing tactical symbols and graphics. Using the
digital interface to accurately place graphics and symbols on the sand table was
perceived as less load, more usable, and resulted in higher-quality sand table
construction.
4.1 Study Limitations
Almost all Soldiers who participated were unfamiliar with topographical maps and
the impact of terrain on tactical planning. Thus, some items that more experienced
Soldiers may see as critical, such as shaping the sand to provide an adequate
representation and key terrain features to consider in placing symbols, may have
not been a focus of participants within this study. The task was interpreted as a
basic FRAGO map copying exercise with little decision making or
interpretation/understanding of the underlying terrain and its impact to the overall
placement of entities. Further, this study was conducted in a classroom setting, and
results may not reflect use outside of this controlled environment.
Participants were exposed to both experimental conditions during an introduction
session, ensuring all participants were aware of both and able to participate in either
condition as they were assigned when they arrived for their scheduled construction
phase of the study. While this supported better participant randomization in
experimental condition assignment, it may have impacted results as participants
were aware of the alternative condition they could have been assigned. It is not
clear whether their performance or questionnaire responses were influenced by a
priori knowledge of both conditions, but findings should be considered in light of
this limitation.

Approved for public release; distribution is unlimited.
20
4.2 Directions for Future Work
Benefits of ARES demonstrated within this study using inexperienced participants
building a FRAGO of lower complexity should be expanded to evaluate whether
performance gains are also seen with experienced users who are familiar with
topographical maps and sand table construction needed to support mission briefings
on various plans that differ in complexity. It is expected that experienced
participants would demonstrate significant differences in the post-knowledge test,
with those using the ARES interface scoring higher due to 1) having background
knowledge of key elements that should be focused on during the build and 2) more
time spent focused on tactical graphic and symbol placement compared with a
traditional table. In addition, the task should be extended from copying a FRAGO
map to a higher-order decision-making task involving tactical planning to evaluate
how an augmented sand table interface impacts tactical decision making.
Having collected the 3-D sand topologies using the ARES system from all
participants, regardless of condition, additional analyses on the sand table
topographies are possible. The captured data allow for an accurate 3-D
reconstruction of the sand tables using PC-based software or visualization in
augmented reality or virtual reality head-mounted displays (e.g., Microsoft
HoloLens or HTC Vive). Additionally, Geospatial Information System
measurement and analysis tools can be used to measure the relative heights and
locations of key terrain features. Coupling these analysis tools with an SME on the
tactical mission plan, the topography of the participant’s sand table can be assessed
more completely, adding objective measures to the subjective analysis measures
included in this report. This assessment could aid in identifying any benefit or
hindrance on shaping the sand while the topographic map was projected directly on
top of the sand table.

Approved for public release; distribution is unlimited.
21
5. References
Amburn CR, Vey NL, Boyce MW, Mize JR. The Augmented REality Sandtable
(ARES). Aberdeen Proving Ground (MD): Army Research Laboratory (US);
2015 Oct. Report No.: ARL-SR-0340.
Army Maneuver Center of Excellence (US). United States Army. Ranger
Handbook. Fort Benning (GA): Army Maneuver Center of Excellence (US);
2011. Solider Handbook No.: SH 21-76.
Boyce MW, Reyes RJ, Cruz DE, Amburn CR, Goldberg B, Moss JD, Sottilare RA.
Effect of topography on learning military tactics-integration of Generalized
Intelligent Framework for Tutoring (GIFT) and Augmented REality Sandtable
(ARES). Aberdeen Proving Ground (MD): Army Research Laboratory (US);
2016. Report No.: ARL-TR-7792. http://www.dtic.mil/get-tr-
doc/pdf?AD=AD1017876.
Boyce MW, Rowan CP, Moss JD, Amburn CR, Shorter PL, Garneau CJ, Sottilare
RA. The impact of surface projection on military tactics comprehension.
Military Psychology, 2017 (Submitted).
Brewster FW. Using tactical decision exercises to study tactics. Military Review.
2002;82(6): 3.
Brooke J. SUS - A quick and dirty usability scale. In: Jordan PW, Thomas B,
Weerdmeester BA, McClelland AL, editors. Usability evaluation in industry.
London (UK): Taylor and Francis; 1996.
Buur J, Jensen MV, Djajadiningrat T. Hands only scenarios and video action walls
– novel methods for tangible user interaction design. Proceedings of DIS’04;
2004. p. 185–192.
Coluccia E, Bosco A, Brandimonte MA. The role of visuo-spatial working memory
in map learning: new findings from a map drawing paradigm. Psychological
Research. 2007;71(3):359–72.
Darken RP, Banker WP. Navigating in natural environments: a virtual environment
training transfer study. Proceedings of the IEEE 1998 Virtual Reality Annual
International Symposium; 1998 Mar 14–18; Atlanta, GA. p. 12–19.
Fishkin KP. A taxonomy for and analysis of tangible interfaces. Journal of Personal
and Ubiquitous Computing. 2004;8(5);347–358.

Approved for public release; distribution is unlimited.
22
Goldiez BF, Ahmad AM, Hancock PA. Effects of augmented reality display
settings on human wayfinding performance. IEEE Trans Syst Man Cybern C
App Rev. 2007;37(5):839–845.
Hart SG, Staveland LE. Development of NASA-TLX (Task Load Index): results of
empirical and theoretical research. In: Hancock PA, Meshkati N, editors.
Human mental workload. Amsterdam (Netherlands): North-Holland Press;
1988. p. 139–183.
Hegarty M, Richardson AE, Montello DR, Lovelace K, Subbiah I. Development of
a self-report measure of environmental spatial ability. Intelligence.
2002;30:425–448.
Marshall P, Rogers Y, Hornecker E. Are tangible interfaces really any better than
other kinds of interfaces? CHI’07 workshop on Tangible User Interfaces in
Context & Theory; 2007 Apr 28; San Jose, CA.
McGill R, Tukey JW, Larsen WA. Variations on box plots. Amer Stat. 1978;32:12–16.
Mefoh PC, Samuel LB. Gender differences vs. hand preference in spatial ability
among a Nigerian sample. Gender and Behavior. 2013:11(1);5096–5105.
Mulgund S, Landsman S. User defined operational pictures for tailored situation
awareness. 12th International Command and Control Research & Technology
Symposium (ICCRTS): Adapting C2 to the 21st Century; 2007.
Peters M, Reimers S, Manning JT. Hand preference for writing and associations
with selected demographic and behavioral variables in 256,100: The BBC
internet study. Brain and Cognition. 2006;62:177–189
Price S, Rogers Y. Let’s get physical: the learning benefits of interacting in
digitally-augmented physical spaces. Computers and Education.
2004;15(2):169–185.
Schmidt-Daly T, Riley J, Hale K, Yacht D, Hart J. Augmented REality Sandtable’s
(ARES’s) impact on learning. Aberdeen Proving Ground (MD): Army
Research Laboratory (US); 2016 July. Report No.: ARL-CR-0803.
Schneider B, Sharma K, Cuendet S, Zufferey G, Dillenbourg P, Pea R. Using
mobile eye-trackers to unpack the perceptual benefits of a tangible user
interface for collaborative learning. ACM Transactions on Computer-Human
Interaction (TOCHI). 2016; 23(6):39.
Zimmerman DW. A note on the influence of outliers on parametric and
nonparametric tests. J Gen Psych. 1994;12(4):391–401.

Approved for public release; distribution is unlimited.
23
Appendix A. Demographics Questionnaire
_____________________________
This appendix appears in its original form, without editorial change.
Approved for public release; distribution is unlimited.
24
Please complete the following questions. Any information you provide will be kept strictly confidential. A participant number will be assigned to your responses and in no way will your name be associated with this data. The information you provide will be used only for the purposes of this study.
Participant Number: _____________________ Date: ________________
1. Gender: _______ Male _______ Female
2. Age: _______
3. Handedness (check one) ______ Left-handed ______ Right-
handed
4. What is your highest level of education completed?
____ HS Diploma or Equivalent
____ Associate Degree
____ Bachelor’s Degree
____ Graduate Degree
5. Specialty Education or Training (if applicable):
__________________________________________________________
__________________________________________________________
6. Rank:
_____________________________________________________
7. Primary MOS:
_______________________________________________
8. Do you own (check all that apply):
_________ Tablet
_________ Smartphone
_________ None
9. Which operating system is your primary mobile device (check
one)?:

Approved for public release; distribution is unlimited.
25
_______ Apple
_______ Android
_______ Windows
_______ Other
10. What is the primary use of your phone (check all that apply)?:
_______ Communication (e.g. phone calls, text messages)
_______ Entertainment (e.g. games, movies, videos, social media, etc.)
_______ Personal or Work Email
_______ Camera (e.g. capturing photos and videos)
_______ Internet and web browsing
_______ Other (please specify)
__________________________________________________________
__________________________________________________________
__________________________________________________________
11. In your current duty position, do you build sand tables?
______ Yes
______ No
12. What is your familiarity or experience with sand tables and sand
table technology? (Select one.)
_____ Very familiar
_____ Somewhat familiar
_____ Somewhat unfamiliar
_____ No experience with sand tables

Approved for public release; distribution is unlimited.
26
INTENTIONALLY LEFT BLANK.
Approved for public release; distribution is unlimited.
27
Appendix B. Santa Barbara Sense of Direction Scale
_____________________________
This appendix appears in its original form, without editorial change.

Approved for public release; distribution is unlimited.
28
This questionnaire consists of several statements about your spatial and
navigational abilities, preferences, and experiences. After each statement, you
should circle a number to indicate your level of agreement with the statement.
Circle "1" if you strongly agree that the statement applies to you, "7" if you strongly
disagree, or some number in between if your agreement is intermediate. Circle "4"
if you neither agree nor disagree.
1. I am very good at giving directions.
strongly
agree
neither
agree nor
disagree
strongly
disagree
1 2 3 4 5 6 7
2. I have a poor memory for where I left things.
strongly
agree
neither
agree nor
disagree
strongly
disagree
1 2 3 4 5 6 7
3. I am very good at judging distances.
strongly
agree
neither
agree nor
disagree
strongly
disagree
1 2 3 4 5 6 7
4. My "sense of direction" is very good.
strongly
agree
neither
agree nor
disagree
strongly
disagree
1 2 3 4 5 6 7
5. I tend to think of my environment in terms of cardinal directions (N, S, E,
W).
strongly
agree
neither
agree nor
disagree
strongly
disagree
1 2 3 4 5 6 7
6. I very easily get lost in a new city.
strongly
agree
neither
agree nor
disagree
strongly
disagree
1 2 3 4 5 6 7

Approved for public release; distribution is unlimited.
29
7. I enjoy reading maps.
strongly
agree
neither
agree nor
disagree
strongly
disagree
1 2 3 4 5 6 7
8. I have trouble understanding directions.
strongly
agree
neither
agree nor
disagree
strongly
disagree
1 2 3 4 5 6 7
9. I am very good at reading maps.
strongly
agree
neither
agree nor
disagree
strongly
disagree
1 2 3 4 5 6 7
10. I don't remember routes very well while riding as a passenger in a car.
strongly
agree
neither
agree nor
disagree
strongly
disagree
1 2 3 4 5 6 7
11. I don't enjoy giving directions.
strongly
agree
neither
agree nor
disagree
strongly
disagree
1 2 3 4 5 6 7
12. It's not important to me to know where I am.
strongly
agree
neither
agree nor
disagree
strongly
disagree
1 2 3 4 5 6 7
13. I usually let someone else do the navigational planning for long trips.
strongly
agree
neither
agree nor
disagree
strongly
disagree
1 2 3 4 5 6 7
14. I can usually remember a new route after I have traveled it only once.
strongly
agree
neither
agree nor
disagree
strongly
disagree
1 2 3 4 5 6 7

Approved for public release; distribution is unlimited.
30
15. I don't have a very good "mental map" of my environment.
strongly
agree
neither
agree nor
disagree
strongly
disagree
1 2 3 4 5 6 7

Approved for public release; distribution is unlimited.
31
Appendix C. Land Navigation/Map Reading Test
_____________________________
This appendix appears in its original form, without editorial change.
Approved for public release; distribution is unlimited.
32
1) What is the Field Manual for map reading and land navigation?
2) What are the basic colors of a map, and what does each color represent?
3) What are military symbols?
4) Where is the Legend of the map found?
5) What are contour lines?
6) What are 3 types of contour lines?
7) How many Mils are in one Degree?
8) How many Norths are there on a military map? Name each.
9) What shape are the contour lines that indicate a hill?
10) What shape are the contour lines that indicate a saddle?
11) What shape are the contour lines that indicate a valley?
12) What shape are the contour lines that indicate a Ridge?
13) What shape are the contour lines that indicate a depression?
14) What shape are the contour lines that indicate a draw?
15) What shape are the contour lines that indicate a spur?
16) What shape are the contour lines that indicate a cliff?
17) What shape are the contour lines that indicate a cut?
18) What shape are the contour lines that indicate a fill?
19) What must be done to a map before it can be used?
20) What are 5 major terrain features found on a map?
21) What are the 3 minor terrain features found on a military map?
22) What are the 2 supplementary terrain features found on a military map?
23) What is a map?
24) What is an azimuth?
25) What is vertical distance?
26) What is a contour interval?
27) What is the distance between grid lines on a combat map?
28) How many mils are there in a circle?
29) Which north is used when using a military map?
Approved for public release; distribution is unlimited.
33
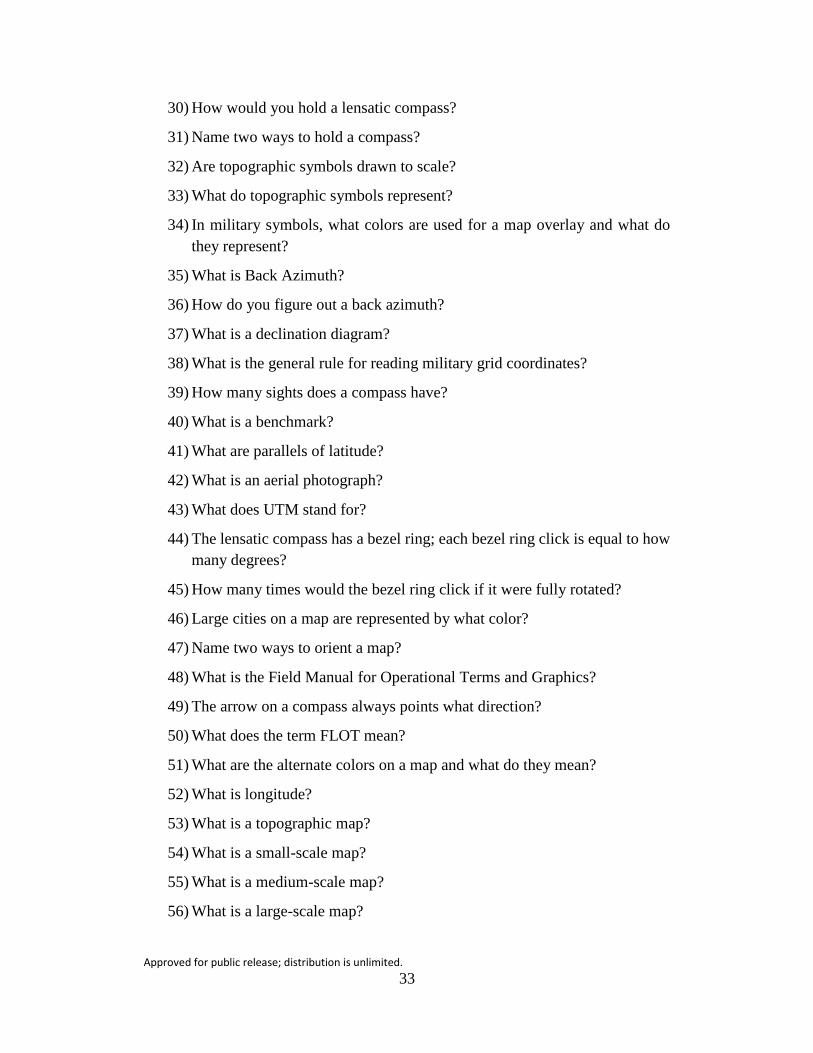
30) How would you hold a lensatic compass?
31) Name two ways to hold a compass?
32) Are topographic symbols drawn to scale?
33) What do topographic symbols represent?
34) In military symbols, what colors are used for a map overlay and what do
they represent?
35) What is Back Azimuth?
36) How do you figure out a back azimuth?
37) What is a declination diagram?
38) What is the general rule for reading military grid coordinates?
39) How many sights does a compass have?
40) What is a benchmark?
41) What are parallels of latitude?
42) What is an aerial photograph?
43) What does UTM stand for?
44) The lensatic compass has a bezel ring; each bezel ring click is equal to how
many degrees?
45) How many times would the bezel ring click if it were fully rotated?
46) Large cities on a map are represented by what color?
47) Name two ways to orient a map?
48) What is the Field Manual for Operational Terms and Graphics?
49) The arrow on a compass always points what direction?
50) What does the term FLOT mean?
51) What are the alternate colors on a map and what do they mean?
52) What is longitude?
53) What is a topographic map?
54) What is a small-scale map?
55) What is a medium-scale map?
56) What is a large-scale map?

Approved for public release; distribution is unlimited.
34
57) What does the term intersection mean?
58) Why is a map so important?
59) What does the term resection mean?
60) If you find a symbol on a map that is unknown to you, where would you
look?
61) How many scales are there on a compass, what are they?
62) What are the 4 quadrants on a map?
63) What are the three elements for a land navigation process known as Dead
Reckoning?
64) What is the feature that makes the lensatic compass work well at night?
65) What is a polar coordinate?
66) What is the name of the map system that the U.S. uses?
67) On a lensatic compass there are two rings, an outer black ring and an inner
red ring, what are they used for?
68) Name 3 field expedient methods of determining direction
69) What is a contour level?
70) The border line around the edge of the map is called the what?
71) Name the different slopes found on a map.
72) You must find at least how many known locations on a map and the actual
ground in order to plot your location accurately?
73) What are the three main map sizes?
74) What are two methods of measuring an azimuth?
75) How close will an eight-digit grid get you to your point?
76) How close will a six-digit grid coordinate get you to your point?
77) What would you use on a map to measure actual ground distance?

Approved for public release; distribution is unlimited.
35
Appendix D. Sand Table Construction Score Card
_____________________________
This appendix appears in its original form, without editorial change.

Approved for public release; distribution is unlimited.
36
Required Component Score
Not present
1
Insufficiently Represented
2
3
4
Sufficiently Represented
5
1 North-seeking arrow
|___________________________________________________|
2 Scale
|___________________________________________________|
3 Grid lines
|___________________________________________________|
4 Objective location
|___________________________________________________|
5
Exaggerated terrain relief, water obstacles
|___________________________________________________|
6 Friendly patrol locations
|___________________________________________________|
7
Targets (indirect fires, including grid and type of round)
|___________________________________________________|
8 Routes, primary and alternate
|___________________________________________________|
9 Planned RPs (ORP, L/URP, RP)
|___________________________________________________|
10 Danger areas (roads, trails)
|___________________________________________________|
11 Legend
|___________________________________________________|
12 Blowup of objective area
|___________________________________________________|
*Bolded items were used in scoring for this assessment.

Approved for public release; distribution is unlimited.
37
Appendix E. Terrain Construction Grade
_____________________________
This appendix appears in its original form, without editorial change.

Approved for public release; distribution is unlimited.
38

Approved for public release; distribution is unlimited.
39
Appendix F. Post-Construction Knowledge Test
_____________________________
This appendix appears in its original form, without editorial change.

Approved for public release; distribution is unlimited.
40
1. Draw out the tactical map below, identifying as many key features as you
recall, including terrain and tactile symbols/graphics.
2. The purpose of the operation was to:
a. Establish supply lines South of Mauldin Creek
b. Deny Anti-Coalition forces the ability to establish supply lines
c. Provide defensive support
d. Establish supply lines North of Mauldin Creek
3. Target points were located:
a. To the north of hostile HQ and east of hostile squad
b. To the south of hostile HQ and east of hostile squad
c. To the north of hostile HQ and the west of hostile squad
d. To the south of hostile HQ and the west of hostile squad
4. Phoenix Landing Zone was located:
a. West of the Etowah River
b. East of Appalachian Blue Ridge Road
c. East of the Etowah River
d. South of Coopers Gap Road
5. Squad 1’s observation post was located:
a. On a hilltop
b. In a saddle
c. Next to a river
d. Next to a road

Approved for public release; distribution is unlimited.
41
6. The hostile/OPFOR squad was located:
a. On a hilltop
b. In a saddle
c. Next to a river
d. Next to a road
7. The route for Squad 1 crossed a river:
a. half way through their route
b. at the beginning of their route
c. at the end of their route
d. never crossed a river
8. The route for Squad 1 followed the terrain along a river.
a. True
b. False
9. The route for Squad 1 route included how many checkpoints (including
start point and rally point)?
a. 3
b. 4
c. 5
d. 6
10. If traveling along the route for Squad 1, what would you see to your left?
a. River
b. Valley
c. Mountain ridge
d. Wooded area
11. Squad 2’s rally point was placed:
a. At a spur
b. Next to a creek
c. In a saddle
d. On a hilltop
12. The route for Squad 2 followed a road for:
a. Half of their route
b. About one third of their route
c. About three quarters of their route
d. They did not follow a road

Approved for public release; distribution is unlimited.
42
INTENTIONALLY LEFT BLANK.

Approved for public release; distribution is unlimited.
43
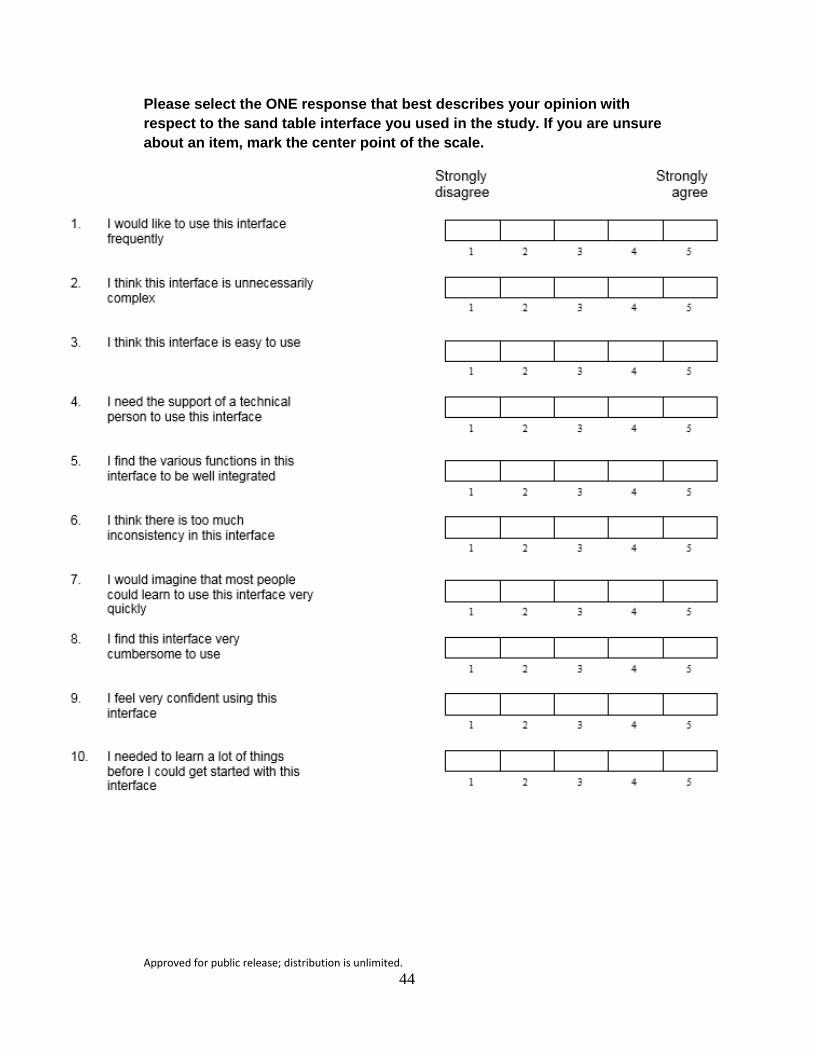
Appendix G. System Usability Scale
_____________________________
This appendix appears in its original form, without editorial change.
Approved for public release; distribution is unlimited.
44
Please select the ONE response that best describes your opinion with
respect to the sand table interface you used in the study. If you are unsure
about an item, mark the center point of the scale.

Approved for public release; distribution is unlimited.
45
Appendix H. NASA Task Load Index (NASA-TLX)
_____________________________
This appendix appears in its original form, without editorial change.

Approved for public release; distribution is unlimited.
46
Rating Scale Definitions:
Title Endpoints Descriptions
Mental Demand Low/High
How much mental and perceptual activity
was required (e.g. thinking, deciding,
calculating, remembering, looking,
searching, etc.)? Was the task easy or
demanding, simple or complex, exacting or
forgiving
Physical
Demand Low/High
How much physical activity was required
(e.g. pushing, pulling, turning, controlling,
activating, etc.)? Was the task easy or
demanding, slow or brisk, slack or
strenuous, restful or laborious?
Temporal
Demand Low/High
How much time pressure did you feel due to
the rate or pace at which the tasks or task
elements occurred? Was the pace slow and
leisurely or rapid and frantic?
Performance Good/Poor
How successful do you think you were in
accomplishing the goals of the task set by
the experimenter (or yourself)? How
satisfied were you with your performance in
accomplishing these goals?
Effort Low/High
How hard did you have to work (mental and
physically) to accomplish your level of
performance?
Frustration
Level Low/High
How insecure, discouraged, irritated,
stressed and annoyed versus secure,
gratified, content, relaxed and complacent
did you feel during the task?
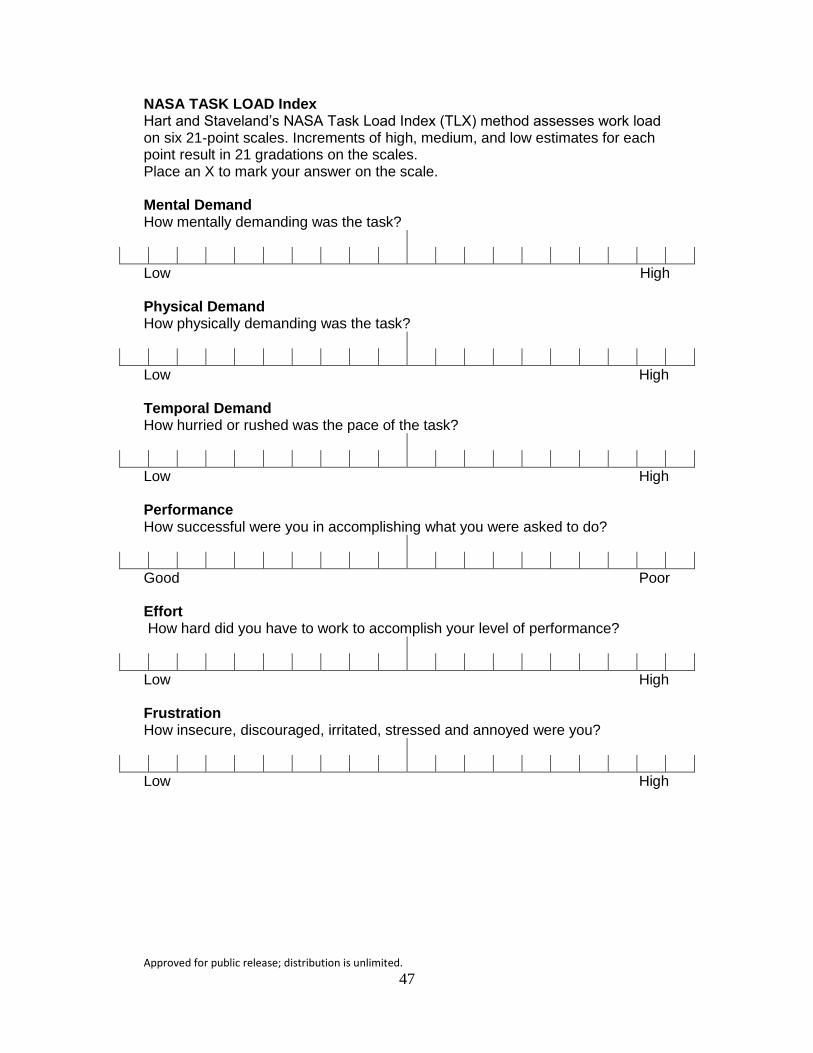
Approved for public release; distribution is unlimited.
47
NASA TASK LOAD Index Hart and Staveland’s NASA Task Load Index (TLX) method assesses work load on six 21-point scales. Increments of high, medium, and low estimates for each point result in 21 gradations on the scales. Place an X to mark your answer on the scale. Mental Demand How mentally demanding was the task?
Low High Physical Demand How physically demanding was the task?
Low High Temporal Demand How hurried or rushed was the pace of the task?
Low High Performance How successful were you in accomplishing what you were asked to do?
Good Poor Effort How hard did you have to work to accomplish your level of performance?
Low High Frustration How insecure, discouraged, irritated, stressed and annoyed were you?
Low High

Approved for public release; distribution is unlimited.
48
You will be now be presented with a series of pairs of rating scale titles (for
example, Effort vs. Mental Demands) and asked to choose which of the items was
more important to your experience of workload in the task that you just performed.
Please consider your choices carefully. There are no right or wrong answers, we
are only interested in your opinions. Descriptions of each factor are located below.
Instructions:
Circle the scale title that represents the more important contributor to workload
for the specific task you performed in this experiment.
Effort
or
Performance
Temporal Demand
or
Frustration
Temporal Demand
or
Effort
Physical Demand
or
Frustration
Performance
or
Frustration
Physical Demand
or
Temporal Demand
Physical Demand
or
Performance
Temporal Demand
or
Mental Demand
Frustration
or
Effort
Performance
or
Mental Demand
Performance
or
Temporal Demand
Mental Demand
or
Effort
Mental Demand
or
Physical Demand
Effort
or
Physical Demand
Frustration
or
Mental Demand

Approved for public release; distribution is unlimited.
49
Appendix I. Outlier Analysis: Box Plots

Approved for public release; distribution is unlimited.
50
Fig. I-1 Sand table construction score
Fig. I-2 Terrain construction grade

Approved for public release; distribution is unlimited.
51
Fig. I-3 Time to set up table
Fig. I-4 Time spent building topography (sand)

Approved for public release; distribution is unlimited.
52
Fig. I-5 Time spent placing tactical symbols/graphics
Fig. I-6 Post-knowledge questionnaire map: labels

Approved for public release; distribution is unlimited.
53
Fig. I-7 Post-knowledge questionnaire map: landmarks
Fig. I-8 Post-knowledge questionnaire map: routes
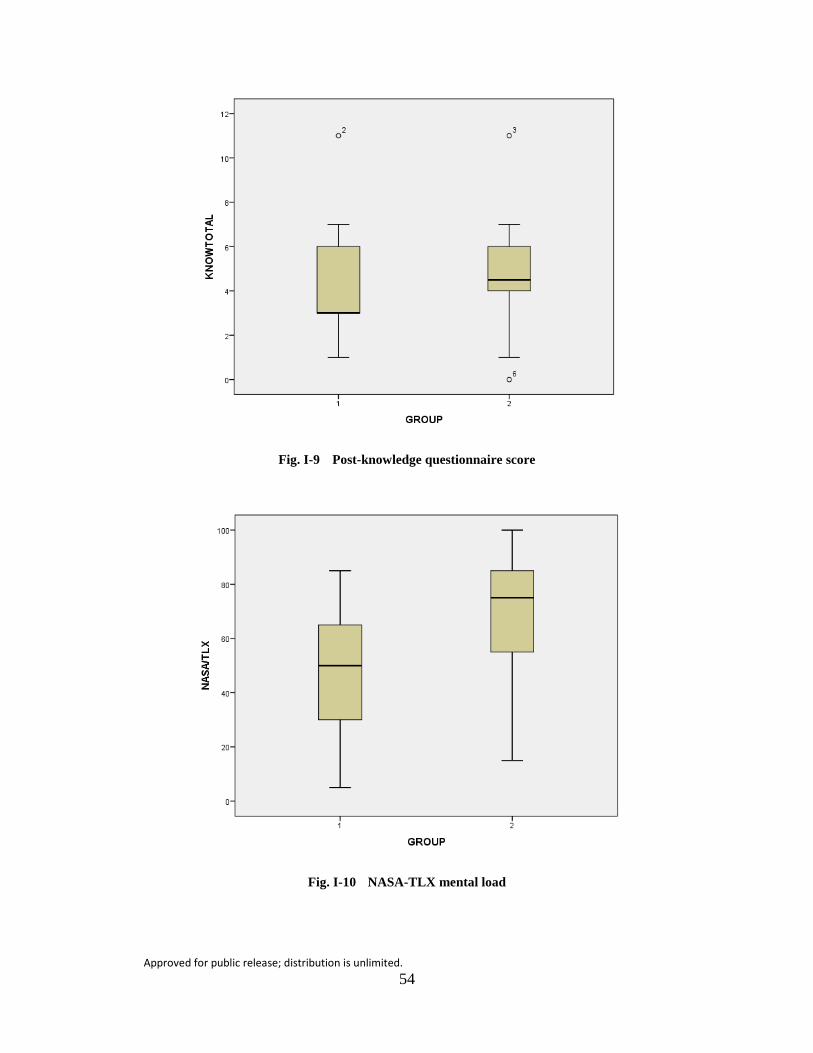
Approved for public release; distribution is unlimited.
54
Fig. I-9 Post-knowledge questionnaire score
Fig. I-10 NASA-TLX mental load

Approved for public release; distribution is unlimited.
55
Fig. I-11 NASA-TLX physical load
Fig. I-12 NASA-TLX temporal load

Approved for public release; distribution is unlimited.
56
Fig. I-13 NASA-TLX performance load
Fig. I-14 NASA-TLX effort load

Approved for public release; distribution is unlimited.
57
Fig. I-15 NASA-TLX frustration
Fig. I-16 NASA-TLX total load

Approved for public release; distribution is unlimited.
58
Fig. I-17 System usability scale

Approved for public release; distribution is unlimited.
59
Appendix J. Normality Testing: Histograms

Approved for public release; distribution is unlimited.
60
Table J-1 Tests of normalcy of the data
Note: Yellow highlights indicate that data in that group are outside the range of normalcy.
Variable Group
Skewness Kurtosis
Statistic Std.
error Statistic
Std. error
Sand Table Construction Score 1 –0.831 0.456 0.724 0.887
2 –0.681 0.456 –0.570 0.887
Terrain Construction Grade 1 –0.256 0.456 –0.932 0.887
2 0.861 0.456 –0.587 0.887
Time to Set up Table 1 2.784 0.456 9.240 0.887
2 1.310 0.456 3.879 0.887
Time Spent building Topography (Sand)
1 –0.338 0.481 –.490 0.935
2 0.266 0.472 –1.057 0.918
Time spent placing tactical symbols/graphics
1 0.100 0.456 –1.090 0.887
2 –0.367 0.456 –.386 0.887
Post–knowledge map: labels 1 0.592 0.456 –1.066 0.887
2 1.733 0.456 1.868 0.887
Post–knowledge map: landmarks 1 –0.862 0.456 .013 0.887
2 –0.118 0.456 –.557 0.887
Post–knowledge map: routes 1 –0.067 0.456 –1.557 0.887
2 –0.087 0.456 –1.233 0.887
Post–knowledge score 1 0.212 0.464 –.870 0.902
2 –0.713 0.464 .704 0.902
NASA–TLX Mental 1 –0.316 0.456 –.644 0.887
2 –0.627 0.464 –0.409 0.902
NASA–TLX Physical 1 1.628 0.456 1.669 0.887
2 0.508 0.464 –1.338 0.902
NASA–TLX Temporal 1 –0.304 0.456 –1.012 0.887
2 –0.171 0.464 –1.440 0.902
NASA–TLX Performance 1 0.469 0.456 –1.25 0.887
2 –0.408 0.464 –.753 0.902
NASA–TLX Effort 1 0.172 0.456 –.677 0.887
2 –0.142 0.464 –1.140 0.902
NASA–TLX Frustration 1 0.523 0.456 –1.329 0.887
2 0.143 0.464 –1.261 0.902
NASA–TLX Total 1 –0.157 0.456 –1.139 0.887
2 –0.538 0.464 –.745 0.902
System Usability Scale 1 –0.703 0.456 –.599 0.887
2 –0.347 0.456 –.561 0.887

Approved for public release; distribution is unlimited.
61
Fig. J-1 Sand table construction score
Fig. J-2 Terrain construction grade

Approved for public release; distribution is unlimited.
62
Fig. J-3 Time to set up table
Fig. J-4 Time spent building topography (sand)

Approved for public release; distribution is unlimited.
63
Fig. J-5 Time spent placing tactical symbols/graphics
Fig. J-6 Post-knowledge questionnaire map: labels

Approved for public release; distribution is unlimited.
64
Fig. J-7 Post-knowledge questionnaire map: landmarks
Fig. J-8 Post-knowledge questionnaire map: routes

Approved for public release; distribution is unlimited.
65
Fig. J-9 Post-knowledge questionnaire score
Fig. J-10 NASA-TLX mental load

Approved for public release; distribution is unlimited.
66
Fig. J-11 NASA-TLX physical load
Fig. J-12 NASA-TLX temporal load

Approved for public release; distribution is unlimited.
67
Fig. J-13 NASA-TLX performance load
Fig. J-14 NASA-TLX effort load

Approved for public release; distribution is unlimited.
68
Fig. J-15 NASA-TLX frustration
Fig. J-17 NASA-TLX total load

Approved for public release; distribution is unlimited.
69
Fig. J-18 System usability scale

Approved for public release; distribution is unlimited.
70
List of Symbols, Abbreviations, and Acronyms
2-D 2-dimensional
3-D 3-dimensional
AI associate investigator
ANCOVA analysis of covariance
ANOVA analysis of variance
ARES Augmented REality Sandtable
CI confidence interval
d Cohen’s d
η2 eta squared
2ηp partial eta squared
M mean
MOS military occupational specialty
NASA-TLX NASA Task Load Index
PI principal investigator
SD standard deviation
SE standard error
SME subject matter expert
Approved for public release; distribution is unlimited.
71
1 DEFENSE TECHNICAL
(PDF) INFORMATION CTR
DTIC OCA
2 DIR ARL
(PDF) IMAL HRA
RECORDS MGMT
RDRL DCL
TECH LIB
1 GOVT PRINTG OFC
(PDF) A MALHOTRA
1 ARL
(PDF) RDRL HRB B
T DAVIS
BLDG 5400 RM C242
REDSTONE ARSENAL AL
35898-7290
8 ARL
(PDF) SFC PAUL RAY SMITH
CENTER
RDRL HRO COL H BUHL
RDRL HRF J CHEN
RDRL HRA I MARTINEZ
RDRL HRR R SOTTILARE
RDRL HRA C A RODRIGUEZ
RDRL HRA B G GOODWIN
RDRL HRA A C METEVIER
RDRL HRA D B PETTIT
12423 RESEARCH PARKWAY
ORLANDO FL 32826
1 USA ARMY G1
(PDF) DAPE HSI B KNAPP
300 ARMY PENTAGON
RM 2C489
WASHINGTON DC 20310-0300
1 USAF 711 HPW
(PDF) 711 HPW/RH K GEISS
2698 G ST BLDG 190
WRIGHT PATTERSON AFB OH
45433-7604
1 USN ONR
(PDF) ONR CODE 341 J TANGNEY
875 N RANDOLPH STREET
BLDG 87
ARLINGTON VA 22203-1986
1 USA NSRDEC
(PDF) RDNS D D TAMILIO
10 GENERAL GREENE AVE
NATICK MA 01760-2642
1 OSD OUSD ATL
(PDF) HPT&B B PETRO
4800 MARK CENTER DRIVE
SUITE 17E08
ALEXANDRIA VA 22350
ABERDEEN PROVING GROUND
13 DIR ARL
(PDF) RDRL HR
J LOCKETT
P FRANASZCZUK
K MCDOWELL
K OIE
RDRL HRB
D HEADLEY
RDRL HRB C
J GRYNOVICKI
RDRL HRB D
C PAULILLO
RDRL HRF A
A DECOSTANZA
C AMBURN
N VEY
RDRL HRF B
A EVANS
RDRL HRF C
J GASTON
RDRL HRF D
A MARATHE

Approved for public release; distribution is unlimited.
72
INTENTIONALLY LEFT BLANK.