evaluation of atkin's model of ductile machining including
TRANSCRIPT

This document is downloaded from DR‑NTU (https://dr.ntu.edu.sg)Nanyang Technological University, Singapore.
Evaluation of Atkin's model of ductile machiningincluding the material separation component
Subbiah, Sathyan; Melkote, Shreyes N.
2007
Subbiah, S., & Melkote, S. N. (2007). Evaluation of Atkin's model of ductile machiningincluding the material separation component. Journal of Materials Processing Technology,182(1‑3), 398‑404.
https://hdl.handle.net/10356/92308
https://doi.org/10.1016/j.jmatprotec.2006.08.019
© 2007 ElsevierThis is the author created version of a work that has been peer reviewedand accepted for publication by Journal of Materials Processing Technology, Elsevier. Itincorporates referee’s comments but changes resulting from the publishing process, suchas copyediting, structural formatting, may not be reflected in this document. Thepublished version is available at: [DOI: http://dx.doi.org/10.1016/j.jmatprotec.2006.08.019]
Downloaded on 10 Dec 2021 03:16:09 SGT
Evaluation of Atkins’ model of ductile
machining including the material separation
component
Sathyan Subbiah, Shreyes N. Melkote ∗
The George W. Woodruff School of Mechanical Engineering
Georgia Institute of Technology
813 Ferst Dr. NW
Atlanta, GA 30332, USA
Abstract
This paper provides data along with experimental evidence of ductile material sep-aration that supports the Atkins’ model of machining, which includes the energyneeded for material separation along with shear and frictional dissipation. Thismodel proposed earlier explicitly includes the energy needed for material separationin addition to that needed for shear and friction. However, no experimental evidencefor material separation via ductile tearing or fracture was provided. In this work,orthogonal cutting is performed on oxygen-free high conductivity (OFHC) Cop-per, a highly ductile metal, at very low speeds and low uncut chip thickness wheresize-effect is observed. The chip-workpiece interface is observed under a scanningelectron microscope to find evidence of material separation via ductile fracture. Forvalues of fracture toughness and shear yield stress, that are of the same order ofmagnitude as that reported in the literature for OFHC Copper, the Atkins modelcaptures the trend and the predictions are seen to be comparable to experimentaldata.
1 Introduction
Many researchers are investigating mechanical removal of material for manu-facturing micro/meso scale parts (micro-cutting). For example, Yamagata etal. [1] have used the micro-cutting process to fabricate a vibration gyro incombination with a piezo film deposition process. They have reported that
∗ Corresponding author: Email: [email protected]; ph. +1-404-894-8499; fax: +1-404-894-9342
micro-cutting offers several advantages including capability to process sev-eral materials, to create three dimensional structures, and to provide goodsurface finish. As in other areas of engineering, scaling effects are present incutting at the micro/meso scale (0.1-500 µm) as well. One such scaling effectis known as the size-effect in specific cutting energy. The specific cutting en-ergy is the energy needed to remove a unit volume of material and is seen toincrease non-linearly as the undeformed chip thickness is reduced to zero. Twoapproaches have been taken in the literature to explain the size-effect phenom-enon in micro-cutting: one retains the traditional approach of energy expendedin shear and friction alone while accounting for the size-effect phenomenon asa change in the energy expended in these two; the second approach explicitlyaccounts for other energy sinks.
In the former traditional approach, machining models developed for sharp cut-ting tools typically account for the energy consumed in machining via energiesfor shearing the metal and overcoming friction between the chip and tool [2].The energy used to separate the chip from the metal just ahead of the cut-ting tool tip, historically accounted for using solid surface energy (tension),is considered negligible in comparison with that consumed in shear and fric-tion [2, 3]. Additionally, the energy associated with momentum change as themetal crosses the shear plane has been shown to be negligible [3]. However, ithas been mentioned by Merchant [2] that at very small uncut chip thicknessvalues less than 0.254 µm the energy for material separation may become sig-nificant. Merchant also points out that upon considering the local plastic flowthe energy required for material separation would be more, but would stillbe negligible in comparison to shear and friction. Analytic predictive mod-els, following a similar modeling approach, have been largely unsuccessful inpredicting the material dependence of the shear angle.
Relying on this traditional modeling approach, several researchers [4, 5, 6,7, 8] have sought explanations for the size-effect in specific cutting energyby investigating why the energy expended in shear and friction could be morethan expected at smaller uncut chip thickness values. These explanations rangefrom increase in shear energy expended due to increase in material strengthresulting from strain-rate increase [5], strain-gradient effects [9, 6, 10], lack ofdefects at small uncut chip thicknesses [11], cutting edge radius contributionto material flow [7] around the tool tip etc. Other explanations such as sub-surface plastic flow [12] and pushing of the material by the tool [13], similar toa punch, have also been offered. This modeling approach of considering onlythe shear and friction energies expended in cutting has been unable to fullyaccount for the observed phenomenon of the increase in specific cutting energyas the uncut chip thickness is reduced.
The second modeling approach accounts for a third energy sink. Since no toolis perfectly sharp, a corresponding force is said to act on the cutting edge.
2
This force is considered to not contribute to chip formation and is collectivelycalled the ploughing force (see [14] for a review on ploughing forces). Theenergy spent in ploughing due to the finite edge radius has been attributed tothe size effect [15]. Recently, a model that explicitly accounts for the energyconsumed in material separation as the third energy sink has been proposedby Atkins [16, 17]. In his earlier work, Atkins [16] presented a metal cuttingtheory for brittle materials that incorporates fracture. Fracture is consideredto be the mechanism of material separation leading to chip formation. Insubsequent work [17], Atkins argued that ductile fracture mechanics can beused to explain chip formation in ductile metals by incorporating fracturetoughness as the specific work of surface creation into the machining model inaddition to energy expended in shear and friction. This provides a constantterm in the force expression that gives rise to the size-effect. This approach wasalso shown to account for the observed trends in shear angles with decreasein uncut chip thickness. Atkins has also suggested this as a way to establishfracture toughness values of materials [18]. However, Atkins provided no directevidence of ductile fracture as the cause for chip formation.
This paper follows the Atkins approach and tests the model at cutting condi-tions where strain-rate, and temperature effects are low. Evidence of ductiletearing as the cause of material separation is provided in the form of scanningelectron micrographs of the chip-workpiece interface at small uncut chip thick-ness where the size-effect is observed. The Atkins model is seen to apply well,and captures trends, for values of fracture toughness, coefficient of friction andshear yield stress, that are within an order of magnitude of that reported inthe literature for OFHC Cu.
2 Atkins model
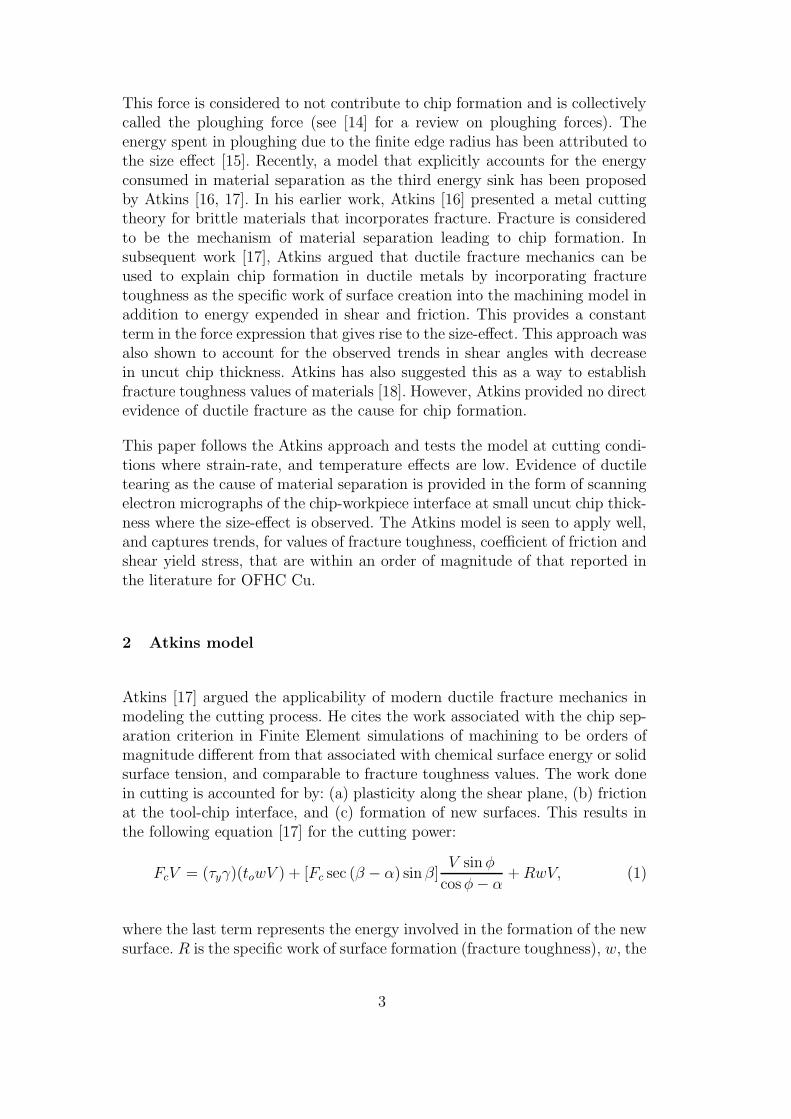
Atkins [17] argued the applicability of modern ductile fracture mechanics inmodeling the cutting process. He cites the work associated with the chip sep-aration criterion in Finite Element simulations of machining to be orders ofmagnitude different from that associated with chemical surface energy or solidsurface tension, and comparable to fracture toughness values. The work donein cutting is accounted for by: (a) plasticity along the shear plane, (b) frictionat the tool-chip interface, and (c) formation of new surfaces. This results inthe following equation [17] for the cutting power:
FcV = (τyγ)(towV ) + [Fc sec (β − α) sin β]V sin φ
cos φ − α+ RwV, (1)
where the last term represents the energy involved in the formation of the newsurface. R is the specific work of surface formation (fracture toughness), w, the
3
width of cut, τy, the shear yield stress, β, the friction angle, α, the rake angle,to, the uncut chip thickness, Fc, the cutting force, and V , the cutting speed.The energy terms are also illustrated in Fig. 1. It can be seen from Eq. 1 that
Fig. 1. Distribution of energy in cutting
if the other components of energy can be ignored, then for a unit width of cut,the fracture energy term naturally gives rise to a constant component of thecutting force viz., R. When Atkins applied this theory to data in the literature,the values of R needed to get a good fit of data were, in some workpiecematerials, an order of magnitude lower than that obtained using standardfracture tests [17]. The reason attributed to this was as follows: machininginvolves high strains, strain-rates and temperatures, conditions which can alterthe fracture toughness of metals.
Based on this argument, at cutting conditions where strain-rate, and temper-ature effects are low, the values of fracture toughness needed for the modelshould be comparable to that seen in the fracture mechanics literature. Thiswould then confirm the applicability of the model. Strain-rates and tempera-ture effects are minimal at very low cutting speeds. Under conditions of highrake angles and low cutting speeds, the authors [19] have reported the presenceof a constant force component [20] and have shown evidence of ductile tearingahead of the tool. However, due to experimental limitations, experiments wereperformed at higher uncut chip thickness values where the size-effect may notbe prominent. In this work, experiments are performed at lower uncut chipthickness values to confirm if indeed Atkins’ model captures the size-effect.
4
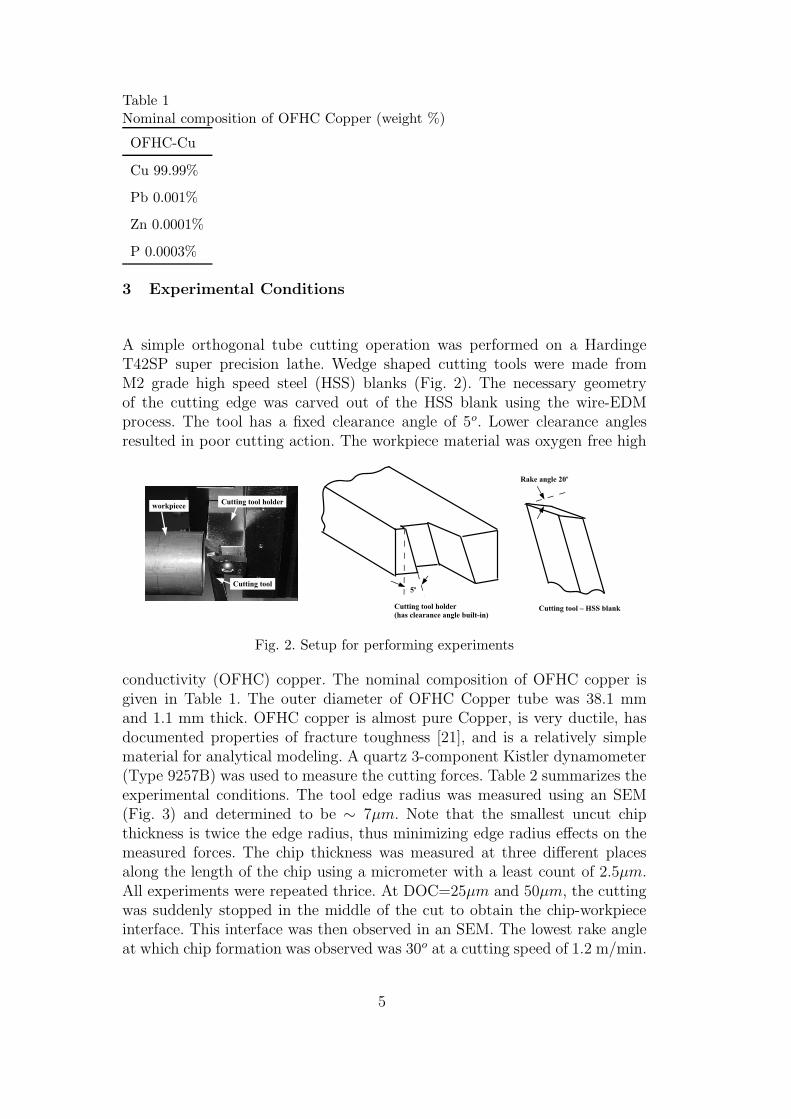
Table 1Nominal composition of OFHC Copper (weight %)
OFHC-Cu
Cu 99.99%
Pb 0.001%
Zn 0.0001%
P 0.0003%
3 Experimental Conditions
A simple orthogonal tube cutting operation was performed on a HardingeT42SP super precision lathe. Wedge shaped cutting tools were made fromM2 grade high speed steel (HSS) blanks (Fig. 2). The necessary geometryof the cutting edge was carved out of the HSS blank using the wire-EDMprocess. The tool has a fixed clearance angle of 5o. Lower clearance anglesresulted in poor cutting action. The workpiece material was oxygen free high
Fig. 2. Setup for performing experiments
conductivity (OFHC) copper. The nominal composition of OFHC copper isgiven in Table 1. The outer diameter of OFHC Copper tube was 38.1 mmand 1.1 mm thick. OFHC copper is almost pure Copper, is very ductile, hasdocumented properties of fracture toughness [21], and is a relatively simplematerial for analytical modeling. A quartz 3-component Kistler dynamometer(Type 9257B) was used to measure the cutting forces. Table 2 summarizes theexperimental conditions. The tool edge radius was measured using an SEM(Fig. 3) and determined to be ∼ 7µm. Note that the smallest uncut chipthickness is twice the edge radius, thus minimizing edge radius effects on themeasured forces. The chip thickness was measured at three different placesalong the length of the chip using a micrometer with a least count of 2.5µm.All experiments were repeated thrice. At DOC=25µm and 50µm, the cuttingwas suddenly stopped in the middle of the cut to obtain the chip-workpieceinterface. This interface was then observed in an SEM. The lowest rake angleat which chip formation was observed was 30o at a cutting speed of 1.2 m/min.
5

Table 2Experimental Conditions
Workpiece OFHC Copper (38.1 mm diameter tube)
Tool HSS M2 grade
Rake angle 30o
Cutting speed 1.2 m/min (10 RPM Spindle Speed)
to 75-200 µm
Cut width 1.1 mm
Edge radius ∼ 7µm
Fig. 3. Edge radius measured using an SEM
4 Experimental Results
4.1 Force and chip thickness
The experimental results are shown in Table 3. The table gives the averagevalues of the cutting force (Fc) and its standard deviation σFc
, thrust force(Ft) and its standard deviation σFt
, and chip thickness (tc) and its standarddeviation σtc . Also shown is the calculated specific cutting energy U alongwith its standard deviation σU , and the coefficient of friction calculated fromthe measured forces. The size-effect can be clearly seen in the specific cuttingenergy values with decrease in the uncut chip thickness (see also Fig. 8). Thecoefficient of friction is also seen to increase as to decreases.
6
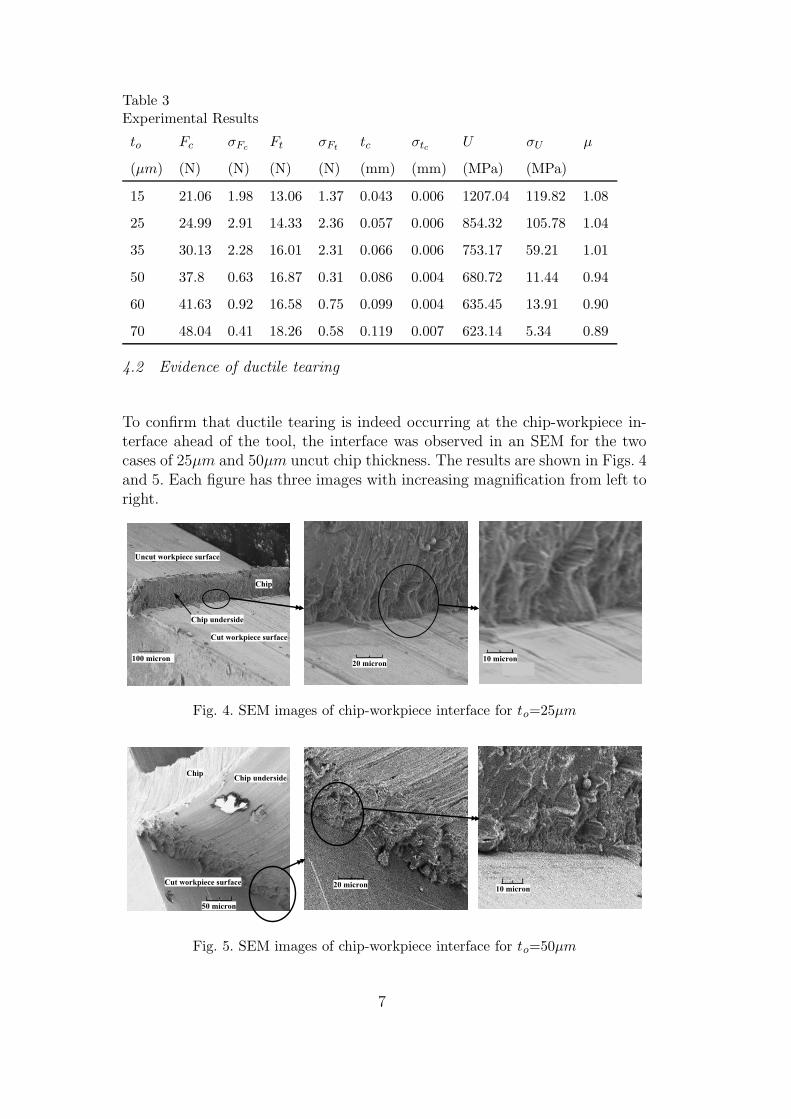
Table 3Experimental Results
to Fc σFcFt σFt
tc σtc U σU µ
(µm) (N) (N) (N) (N) (mm) (mm) (MPa) (MPa)
15 21.06 1.98 13.06 1.37 0.043 0.006 1207.04 119.82 1.08
25 24.99 2.91 14.33 2.36 0.057 0.006 854.32 105.78 1.04
35 30.13 2.28 16.01 2.31 0.066 0.006 753.17 59.21 1.01
50 37.8 0.63 16.87 0.31 0.086 0.004 680.72 11.44 0.94
60 41.63 0.92 16.58 0.75 0.099 0.004 635.45 13.91 0.90
70 48.04 0.41 18.26 0.58 0.119 0.007 623.14 5.34 0.89
4.2 Evidence of ductile tearing
To confirm that ductile tearing is indeed occurring at the chip-workpiece in-terface ahead of the tool, the interface was observed in an SEM for the twocases of 25µm and 50µm uncut chip thickness. The results are shown in Figs. 4and 5. Each figure has three images with increasing magnification from left toright.
Fig. 4. SEM images of chip-workpiece interface for to=25µm
Fig. 5. SEM images of chip-workpiece interface for to=50µm
7
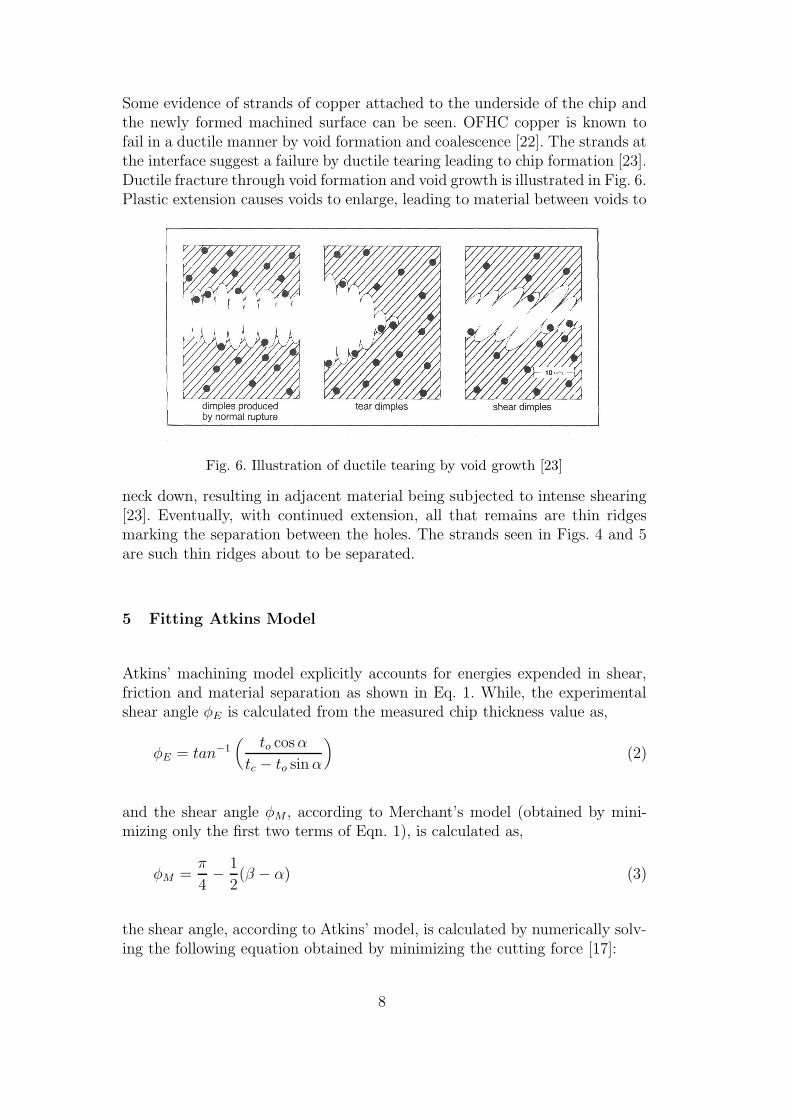
Some evidence of strands of copper attached to the underside of the chip andthe newly formed machined surface can be seen. OFHC copper is known tofail in a ductile manner by void formation and coalescence [22]. The strands atthe interface suggest a failure by ductile tearing leading to chip formation [23].Ductile fracture through void formation and void growth is illustrated in Fig. 6.Plastic extension causes voids to enlarge, leading to material between voids to
Fig. 6. Illustration of ductile tearing by void growth [23]
neck down, resulting in adjacent material being subjected to intense shearing[23]. Eventually, with continued extension, all that remains are thin ridgesmarking the separation between the holes. The strands seen in Figs. 4 and 5are such thin ridges about to be separated.
5 Fitting Atkins Model
Atkins’ machining model explicitly accounts for energies expended in shear,friction and material separation as shown in Eq. 1. While, the experimentalshear angle φE is calculated from the measured chip thickness value as,
φE = tan−1
(
to cos α
tc − to sin α
)
(2)
and the shear angle φM , according to Merchant’s model (obtained by mini-mizing only the first two terms of Eqn. 1), is calculated as,
φM =π
4−
1
2(β − α) (3)
the shear angle, according to Atkins’ model, is calculated by numerically solv-ing the following equation obtained by minimizing the cutting force [17]:
8
[
1 −sin β sin φ
cos(β − α) cos(φ − α)
] [
1
cos2(φ − α)−
1
sin2 φ
]
= (4)
− [cotφ + tan(φ − α) + Z]
[
sin β
cos(β − α)
(
cos φ
cos(φ − α)+
sin φ sin(φ − α)
cos2(φ − α)
)]
where Z=R/τyto. The friction angle β, in both Merchant’s model and Atkins’model, is calculated from the measured values of the cutting force Fc andthrust force Ft in an identical manner as follows.
β = tan−1
(
Ft
Fc
)
+ α (5)
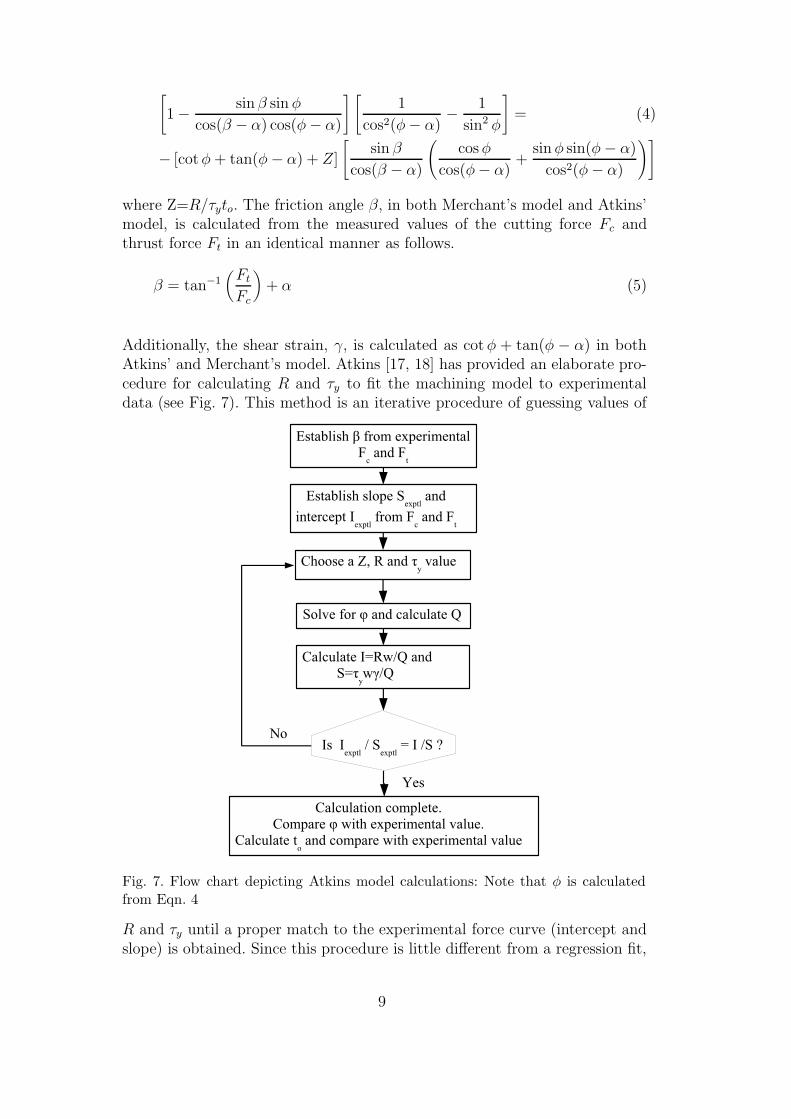
Additionally, the shear strain, γ, is calculated as cot φ + tan(φ − α) in bothAtkins’ and Merchant’s model. Atkins [17, 18] has provided an elaborate pro-cedure for calculating R and τy to fit the machining model to experimentaldata (see Fig. 7). This method is an iterative procedure of guessing values of
Fig. 7. Flow chart depicting Atkins model calculations: Note that φ is calculatedfrom Eqn. 4
R and τy until a proper match to the experimental force curve (intercept andslope) is obtained. Since this procedure is little different from a regression fit,
9
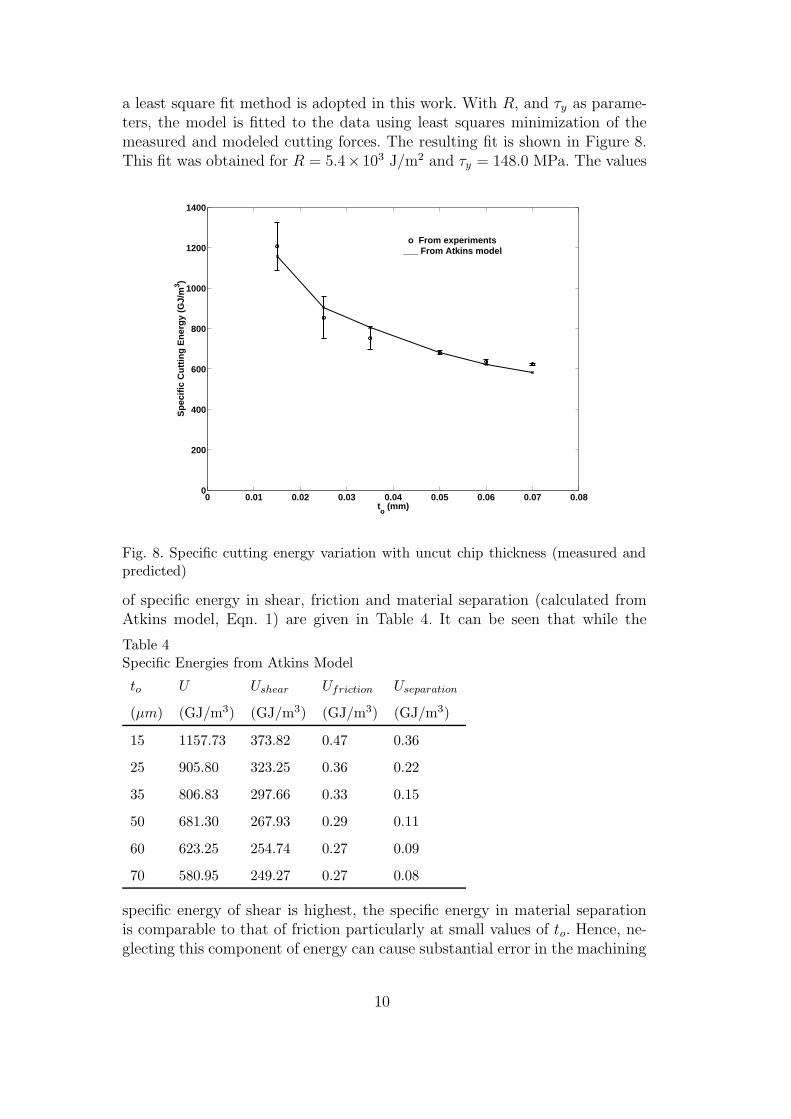
a least square fit method is adopted in this work. With R, and τy as parame-ters, the model is fitted to the data using least squares minimization of themeasured and modeled cutting forces. The resulting fit is shown in Figure 8.This fit was obtained for R = 5.4× 10³ J/m2 and τy = 148.0 MPa. The values
0 0.01 0.02 0.03 0.04 0.05 0.06 0.07 0.080
200
400
600
800
1000
1200
1400
to (mm)
Sp
ecif
ic C
utt
ing
En
erg
y (G
J/m
3 )
o From experiments ___ From Atkins model
Fig. 8. Specific cutting energy variation with uncut chip thickness (measured andpredicted)
of specific energy in shear, friction and material separation (calculated fromAtkins model, Eqn. 1) are given in Table 4. It can be seen that while the
Table 4Specific Energies from Atkins Model
to U Ushear Ufriction Useparation
(µm) (GJ/m3) (GJ/m3) (GJ/m3) (GJ/m3)
15 1157.73 373.82 0.47 0.36
25 905.80 323.25 0.36 0.22
35 806.83 297.66 0.33 0.15
50 681.30 267.93 0.29 0.11
60 623.25 254.74 0.27 0.09
70 580.95 249.27 0.27 0.08
specific energy of shear is highest, the specific energy in material separationis comparable to that of friction particularly at small values of to. Hence, ne-glecting this component of energy can cause substantial error in the machining
10
model when applied to micro-cutting.
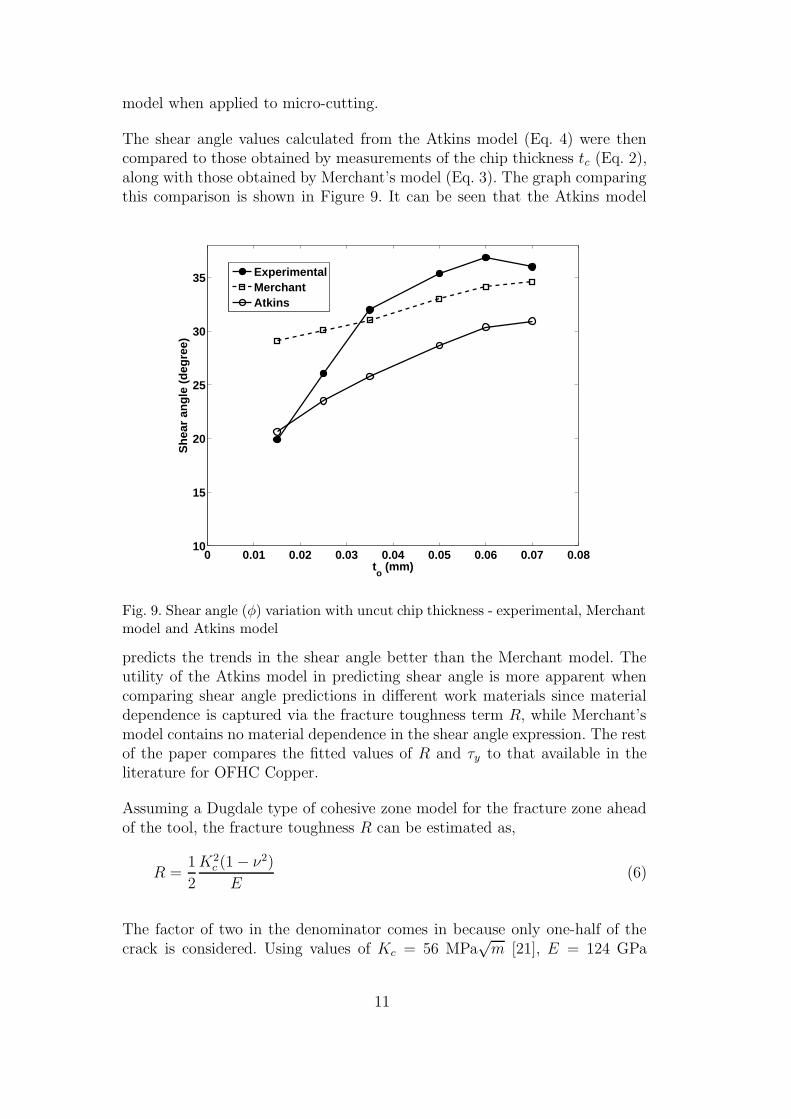
The shear angle values calculated from the Atkins model (Eq. 4) were thencompared to those obtained by measurements of the chip thickness tc (Eq. 2),along with those obtained by Merchant’s model (Eq. 3). The graph comparingthis comparison is shown in Figure 9. It can be seen that the Atkins model
0 0.01 0.02 0.03 0.04 0.05 0.06 0.07 0.0810
15
20
25
30
35
to (mm)
Sh
ear
ang
le (
deg
ree)
ExperimentalMerchantAtkins
Fig. 9. Shear angle (φ) variation with uncut chip thickness - experimental, Merchantmodel and Atkins model
predicts the trends in the shear angle better than the Merchant model. Theutility of the Atkins model in predicting shear angle is more apparent whencomparing shear angle predictions in different work materials since materialdependence is captured via the fracture toughness term R, while Merchant’smodel contains no material dependence in the shear angle expression. The restof the paper compares the fitted values of R and τy to that available in theliterature for OFHC Copper.
Assuming a Dugdale type of cohesive zone model for the fracture zone aheadof the tool, the fracture toughness R can be estimated as,
R =1
2
K2
c (1 − ν2)
E(6)
The factor of two in the denominator comes in because only one-half of thecrack is considered. Using values of Kc = 56 MPa
√m [21], E = 124 GPa
11
and ν = 0.34 [22], the value of fracture toughness, for OFHC Copper, can bedetermined as R = 11.2 × 10² J/m2. The fitted value of R = 5.4 × 10² J/m2
and the fracture toughness value are of the same order of magnitude.
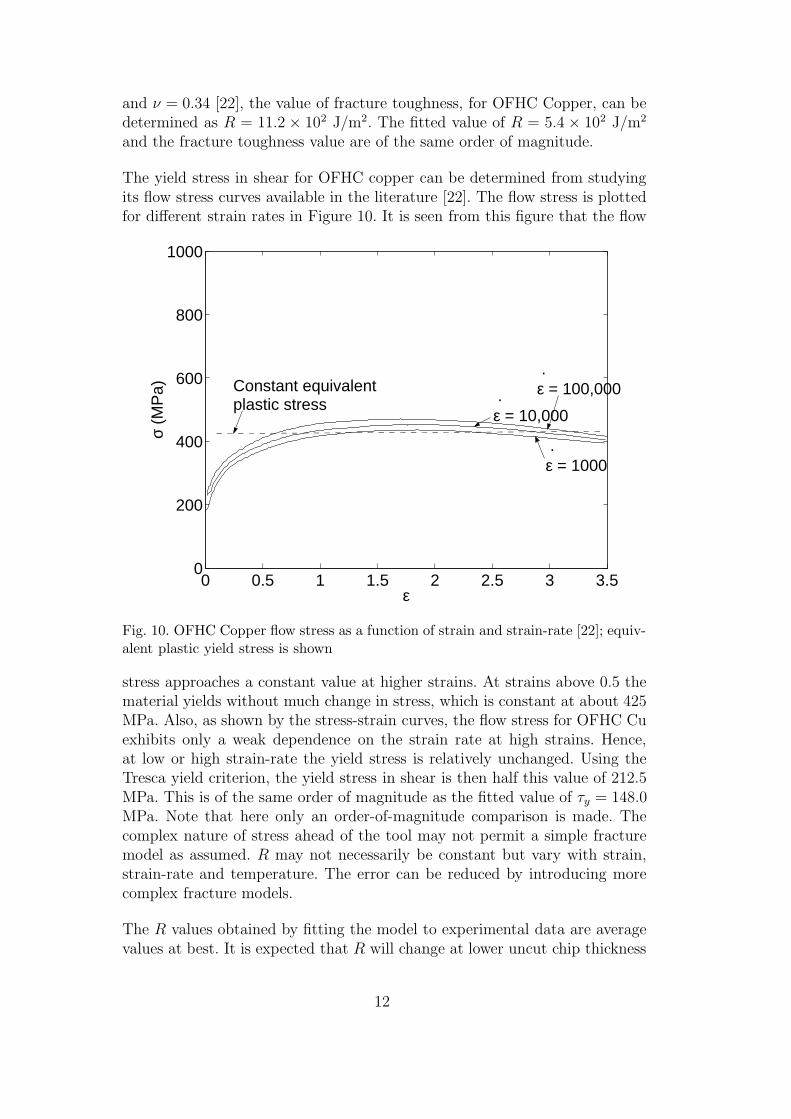
The yield stress in shear for OFHC copper can be determined from studyingits flow stress curves available in the literature [22]. The flow stress is plottedfor different strain rates in Figure 10. It is seen from this figure that the flow
0 0.5 1 1.5 2 2.5 3 3.50
200
400
600
800
1000
ε
σ (M
Pa) .
ε = 10,000
. ε = 1000
. ε = 100,000Constant equivalent
plastic stress
Fig. 10. OFHC Copper flow stress as a function of strain and strain-rate [22]; equiv-alent plastic yield stress is shown
stress approaches a constant value at higher strains. At strains above 0.5 thematerial yields without much change in stress, which is constant at about 425MPa. Also, as shown by the stress-strain curves, the flow stress for OFHC Cuexhibits only a weak dependence on the strain rate at high strains. Hence,at low or high strain-rate the yield stress is relatively unchanged. Using theTresca yield criterion, the yield stress in shear is then half this value of 212.5MPa. This is of the same order of magnitude as the fitted value of τy = 148.0MPa. Note that here only an order-of-magnitude comparison is made. Thecomplex nature of stress ahead of the tool may not permit a simple fracturemodel as assumed. R may not necessarily be constant but vary with strain,strain-rate and temperature. The error can be reduced by introducing morecomplex fracture models.
The R values obtained by fitting the model to experimental data are averagevalues at best. It is expected that R will change at lower uncut chip thickness
12
values. The reason for this is as follows. In machining the ductile fractureahead of the tool is very close to the free surface of the workpiece. At very lowuncut chip thickness values, the plastic zone ahead of the crack tip will startto interact with the free surface and the fracture toughness is then expectedto change. Investigations in this area are in progress and will be reported inthe future.
It is thus seen that the fitted values of the two parameters, fracture toughnessand shear yield stress, compare well on an order of magnitude basis. At lowcutting speeds where strain-rates and temperature effects are small, the Atkinsmodel of machining appears to explain the trends in machining data andphenomenon fairly well.
6 Summary and Conclusions
In this work, the Atkins model, which incorporates a third term for the energyexpended in material separation [17], is evaluated by performing orthogonalcutting tests on OFHC Copper and experimental evidence in the form of SEMpictures depicting ductile tearing ahead of the tool are provided. The mainconclusions of this work are:
• The Atkins model of machining, which explicitly includes energy needed formaterial separation as that due to ductile fracture, can phenomenologicallyexplain effects such as the increase in specific cutting energy with decreasein uncut chip thickness.
• At low cutting speeds where strain-rate and temperature effects are minimal,the Atkins model fits the experimental data fairly well for values of fracturetoughness, coefficient of friction and shear yield stress, that are of the sameorder of magnitude as that reported in the literature.
• Ductile tearing leading to chip formation occurs at uncut chip thickness aslow as 25µm.
References
[1] Y. Yamagata, S. Mihara, N. Nishioki, T. Higuchi, A new fabricationmethod for micro actuators with piezoelectric thin film using cuttingtechnique, Proceedings IEEE Micro-Electro-Mechanical-Systems Feb 11-15, San Diego, CA (1996) 307–311.
[2] M. E. Merchant, Mechanics of the metal cutting process. I. Orthogonalcutting and a Type 2 chip, Journal of Applied Physics 16 (5) (1945)267–275.
13
[3] M. C. Shaw, Metal cutting principles, Oxford Science Publications, NewYork, 1997.
[4] W. R. Backer, E. R. Marshall, M. C. Shaw, The size effect in metalcutting, Transactions of the ASME 74 (1952) 61–72.
[5] E. M. Kopalinsky, P. L. B. Oxley, Size effects in metal removal process,3rd Conf. Mech. Prop. High Rates of Strain (1984) 389–396.
[6] S. S. Joshi, S. N. Melkote, An explanation for the size-effect in machiningusing strain gradient plasticity, Proc. JSME/ASME Int. Conf. on Mate-rials and Processing, 1 (2002) 318–323.
[7] N. Fang, Slip-line modeling of machining with a rounded-edge tool - partsI and II, J. Mech. Phy. Solids 51 (2003) 715–762.
[8] M. C. Shaw, The size effect in metal cutting, Sadhana 25 (5) (2003)875–896.
[9] D. Dinesh, S. Swaminathan, S. Chandrasekhar, T. N. Farris, An intrinsicsize-effect in machining due to the strain gradient, Proc. ASME IMECE,New York (2001) 197–204.
[10] K. Liu, S. N. Melkote, A strain-gradient based finite element modelfor micro-meso scale orthogonal cutting process, Proc. 2004 Japan/USASymposium on Flexible Automation, Denver, CO, USA.
[11] M. C. Shaw, A quantized theory of strain hardening as applied to cuttingof metals, Journal of Applied Physics 21 (1950) 599–606.
[12] K. Nakayama, K. Tamura, Size effect in metal-cutting force, Trans.ASME, Journal of Engineering for Industry (1968) 119–126.
[13] E. G. Thomsen, J. T. Lapsley, R. C. Grassi, Deformation work absorbedby the workpiece during metal cutting, Transactions of ASME 75 (1953)591–603.
[14] J. A. Arsecularatne, On tool-chip interface stress distributions, ploughingforce and size effect in machining, International Journal Machine Toolsad Manufacture 37 (7) (1997) 885–899.
[15] E. J. A. Armarego, R. H. Brown, On the size effect in metal cutting, Int.J. Prod. Res. 1 (1962) 75–99.
[16] A. G. Atkins, Fracture toughness and cutting, International Journal ofProduction Research 12 (2) (1974) 263–274.
[17] A. G. Atkins, Modelling metal cutting using modern ductile fracture me-chanics: quantitative explanations for some longstanding problems, Inter-national Journal of Mechanical Sciences 45 (2003) 373–396.
[18] A. G. Atkins, Toughness and Cutting: a new way of simultaneously de-termining ductile fracture toughness and strength, Engineering FractureMechanics 72 (2005) 849–860.
[19] S. Subbiah, S. N. Melkote, The constant force component due to materialseparation and its contribution to the size-effect in specific cutting energy,ASME Transactions J. Manuf. Sci. Engg 128 (3) (2006) 811–815.
[20] S. Subbiah, S. N. Melkote, On the size effect in micro-cutting at low andhigh rake angles, Proceedings of ASME IMECE, Anaheim, CA, November13-15, MED MED-15 (2004) 485–493.
14

[21] A. Nyilas, A. Nishimura, B. Obst, Further aspects on J-evaluation demon-strated with EDM notched round bars and double-edged plates between300 and 7 K, Proc. of Int. Cryogenic Materials Conf ICMC 48 (2002)131–138.
[22] G. R. Johnson, W. H. Cook, Fracture characteristics of three metals sub-jected to various strains, strain rates, temperatures and pressures, Engi-neering Fracture Mechanics 21 (1) (1985) 31–49.
[23] L. Engel, H. Klingele, An Atlas of Metal Damage, Page 41, Prentice-Hall,Inc., New Jersey, 1981.
15