evaluation of april 1, 2000 school district population
TRANSCRIPT
Population Division
Evaluation of April 1 2000 School District Population Estimates Based on the Synthetic Ratio Method
by Monique Oosse
Working Paper No 74
June 2004
This paper reports the results of research and analysis undertaken by the US Census Bureau staff It has undergone a Census Bureau review more limited in scope than that given to Official Census Bureau publications This report is released to inform interested parties of ongoing research and to encourage discussion of work in progress
Evaluation of April 1 2000 School District Population Estimates
Based on the Synthetic Ratio Method
Abstract
The Department of Education uses school district population estimates in
combination with estimates of the numbers of children in poverty to distribute billions of
dollars in federal funds to school districts This report evaluates the synthetic ratio
method used to produce postcensal school district estimates of the total population and
the school-age population (5 to 17 years) The synthetic ratio method assumes that the
ratio of the school district population to the county population as measured in the most
recent decennial census remains constant throughout the estimate period To evaluate
the method school district population estimates for April 1 2000 are produced from the
1990 census population of school districts and counties and the April 1 2000 county
population estimates The accuracy of the April 1 2000 estimates is measured by
comparison with Census 2000 enumeration data The Mean Algebraic Percent Error
(MALPE) the Mean Absolute Percent Error (MAPE) and the Weighted Mean Absolute
Percent Error are calculated for the school district population estimates The average
errors are calculated for regions states school district types school district population
size in 1990 and 2000 and the percent population change from 1990 to 2000 The results
identify the characteristics of school districts for which the synthetic ratio method
performs relatively well and for which the method appears to generate biased estimates
i
Table of Contents
I Introduction 1 II Methods and Data 3
A Base Population 1990 Census Data 5 B Estimates of Change Over Time April 1 2000 County Population Estimates 6 C Standard for Calculating Errors Census 2000 Data 7
III Results April 1 2000 School District Estimates 9 A School-Age Population Estimates 10 B Total Population Estimates 11 C Estimating the Error Attributed to the Synthetic Ratio Method 12 D Comparisons with Past Research 13
IV Evaluation 14 A 1990 Census Population 14 B Census 2000 Population 16 C Percent Population Change 1990 ndash 2000 17 D Census Divisions 18 E Type of School District 20 F Errors for School Districts with Total Populations of 20000 or More 22 G Errors for School Districts that Were Not Coterminous with County Boundaries 22
V Conclusion 24 Appendix A Identifying Overlapping School Districts 25 Appendix B Cohort-Component and Ratio Methods for Calculating April 1 2000 County Estimates 27 Appendix C Treatment of 1990 Census and Census 2000 School District Files 29 References 31
Figures
Figure 1 Unweighted and Weighted Mean Absolute Percent Errors (MAPE) for the April 1 2000 School District Estimates of the Total and School-Age Populations Estimates Based on April 1 2000 County Estimates and Census 2000 County Enumeration Datahelliphelliphelliphelliphelliphelliphelliphelliphelliphelliphelliphelliphelliphelliphelliphelliphelliphelliphelliphelliphelliphelliphelliphelliphelliphellip32
Figure 2 Mean Algebraic Percent Errors (MALPE) for the April 1 2000 Estimates of the Total Population and School-Age Population in School Districts Compared with the Census 2000 Enumerated Population by School District Size in the 1990 Censushellip33
Figure 3 Mean Absolute Percent Errors (MAPE) for the April 1 2000 Estimates of the School-Age Population in School Districts Compared with the Census 2000 Enumerated Population by School District Size in the 1990 Censushelliphelliphelliphellip34
Figure 4 Mean Absolute Percent Errors (MAPE) for the April 1 2000 Estimates of the Total Population in School Districts Compared with the Census 2000 Enumerated Population by School District Size in the 1990 Censushelliphelliphelliphelliphelliphelliphelliphelliphelliphelliphelliphellip35
Figure 5 Mean Algebraic Percent Errors (MALPE) for the April 1 2000 Estimates of the Total Population and School-Age Population in School Districts Compared with the Census 2000 Enumerated Population by School District Size in Census 2000helliphelliphellip36
ii
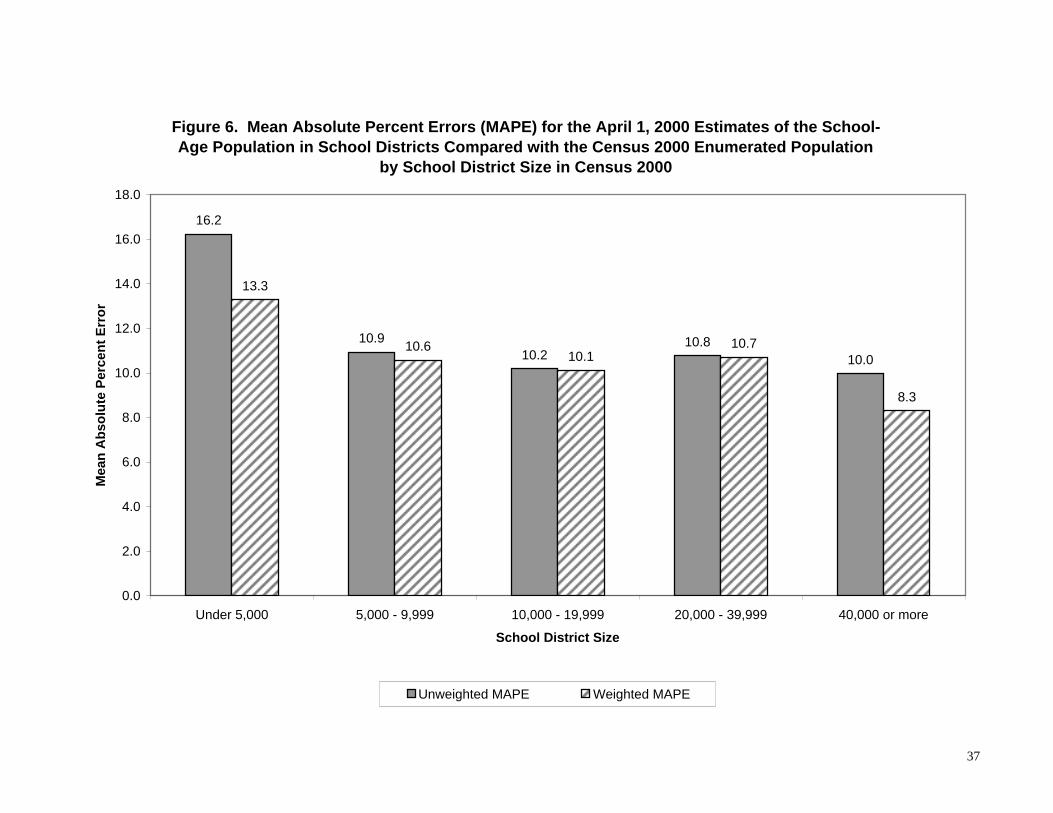
Figure 6 Mean Absolute Percent Errors (MAPE) for the April 1 2000 Estimates of the School-Age Population in School Districts Compared with the Census 2000 Enumerated Population by School District Size in Census 2000helliphelliphelliphelliphellip37
Figure 7 Mean Absolute Percent Errors (MAPE) for the April 1 2000 Estimates of the Total Population in School Districts Compared with the Census 2000 Enumerated Population by School District Size in Census 2000helliphelliphelliphelliphelliphelliphelliphelliphelliphelliphellip38
Figure 8 Mean Algebraic Percent Errors (MALPE) for the April 1 2000 Estimates of the Total and School-Age Populations in School Districts Compared with the Census 2000 Enumerated Population by Ten-Year Percent Change in School District Populationshelliphelliphelliphelliphelliphelliphelliphelliphelliphelliphelliphelliphelliphelliphelliphelliphelliphelliphelliphelliphelliphelliphelliphelliphelliphelliphelliphelliphellip39
Figure 9 Mean Absolute Percent Errors (MAPE) for the April 1 2000 Estimates of the School-Age Population in School Districts Compared with the Census 2000 Enumerated Population by Ten-Year Percent Change in the School District School-Age Populationhelliphelliphelliphelliphelliphelliphelliphelliphelliphelliphelliphelliphelliphelliphelliphelliphelliphelliphelliphelliphelliphelliphelliphelliphelliphelliphelliphelliphellip40
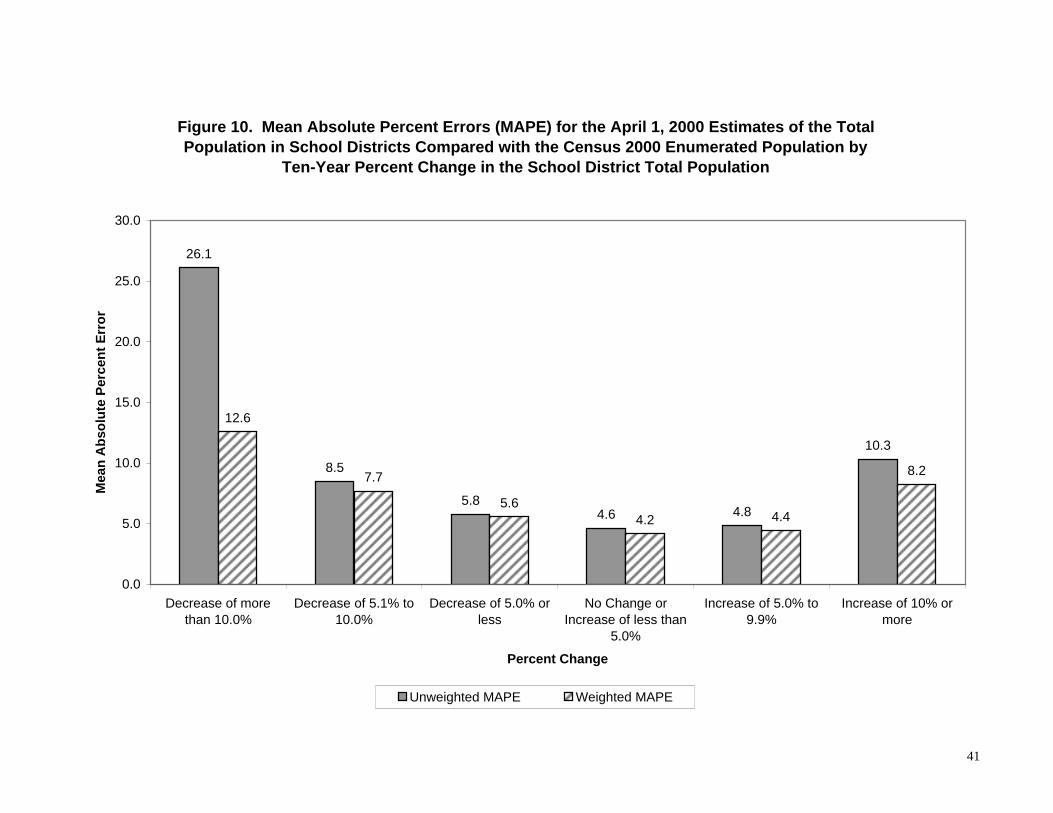
Figure 10 Mean Absolute Percent Errors (MAPE) for the April 1 2000 Estimates of the Total Population in School Districts Compared with the Census 2000 Enumerated Population by Ten-Year Percent Change in the School District Total Populationhelliphellip41
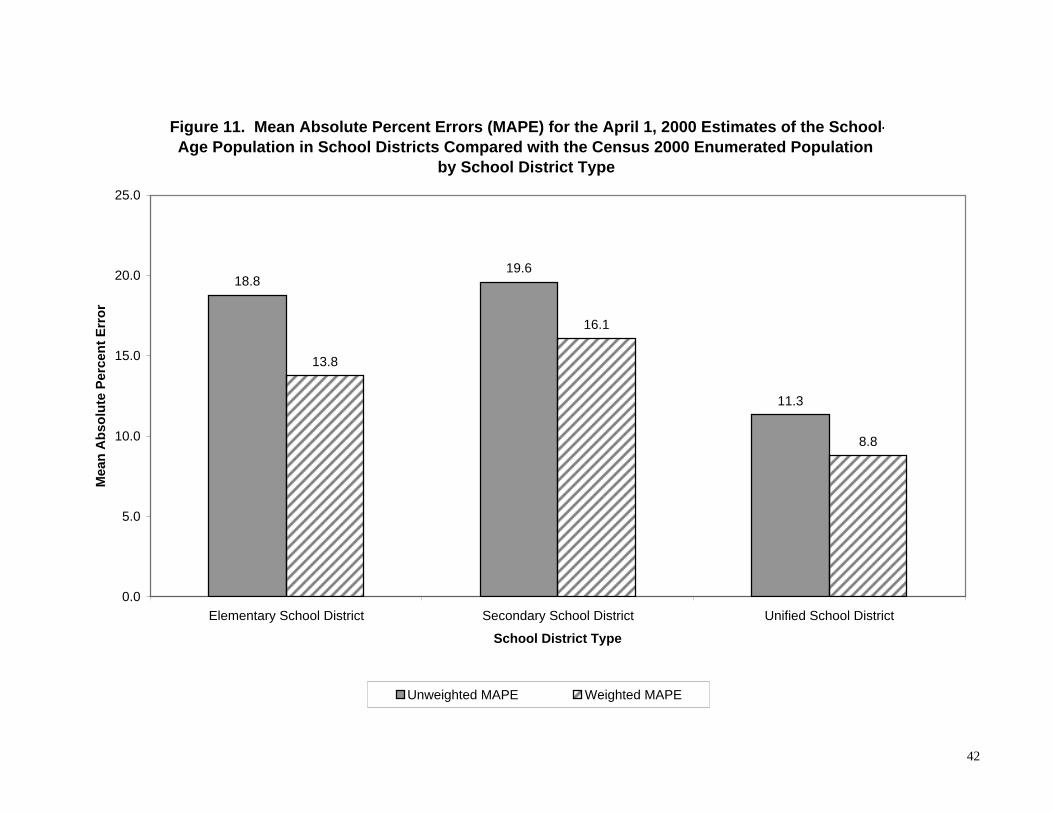
Figure 11 Mean Absolute Percent Errors (MAPE) for the April 1 2000 Estimates of the School-Age Population in School Districts Compared with the Census 2000 Enumerated Population by School District Typehelliphelliphelliphelliphelliphelliphelliphelliphelliphelliphelliphelliphelliphellip42
Figure 12 Mean Absolute Percent Errors (MAPE) for the April 1 2000 Estimates of the Total Population in School Districts Compared with the Census 2000 Enumerated Population by School District Typehelliphelliphelliphelliphelliphelliphelliphelliphelliphelliphelliphelliphelliphelliphelliphelliphellip43
Tables
Table 1 Number of School Districts Included and Excluded from Analyses 2000hellip44 Table 2 Mean Algebraic Percent Errors (MALPE) and Standard Deviations of Errors for
the April 1 2000 Estimates of the School-Age Population in School Districts Compared with the Census 2000 Enumerated Population by Statehelliphelliphelliphelliphelliphelliphelliphelliphelliphelliphelliphellip45
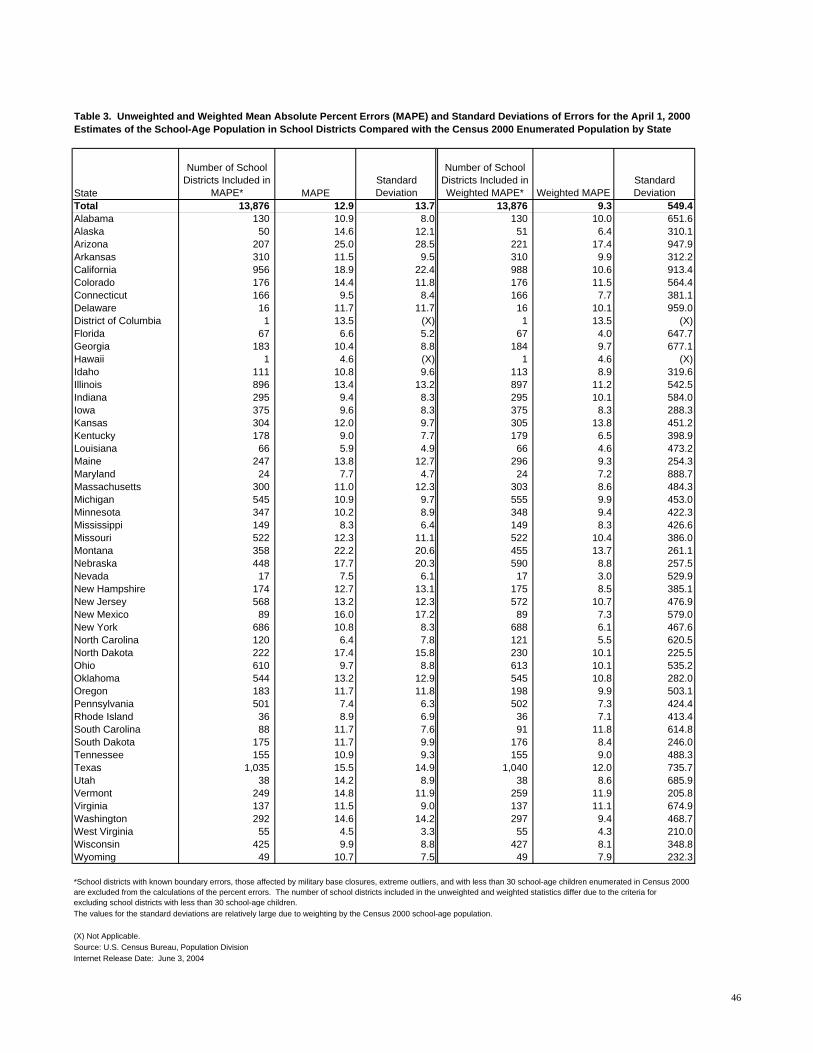
Table 3 Unweighted and Weighted Mean Absolute Percent Errors (MAPE) and Standard Deviations of Errors for the April 1 2000 Estimates of the School-Age Population in School Districts Compared with the Census 2000 Enumerated Population by Statehelliphelliphelliphelliphelliphelliphelliphelliphelliphelliphelliphelliphelliphelliphelliphelliphelliphelliphelliphelliphelliphelliphelliphelliphelliphelliphelliphelliphelliphellip46
Table 4 Mean Algebraic Percent Errors (MALPE) and Standard Deviations of Errors for the April 1 2000 Estimates of the Total Population in School Districts Compared with the Census 2000 Enumerated Population by Statehelliphelliphelliphelliphelliphelliphelliphelliphelliphelliphelliphelliphelliphellip47
Table 5 Unweighted and Weighted Mean Absolute Percent Errors (MAPE) and Standard Deviations of Errors for the April 1 2000 Estimates of the Total Population in School Districts Compared with the Census 2000 Enumerated Population by Statehellip48
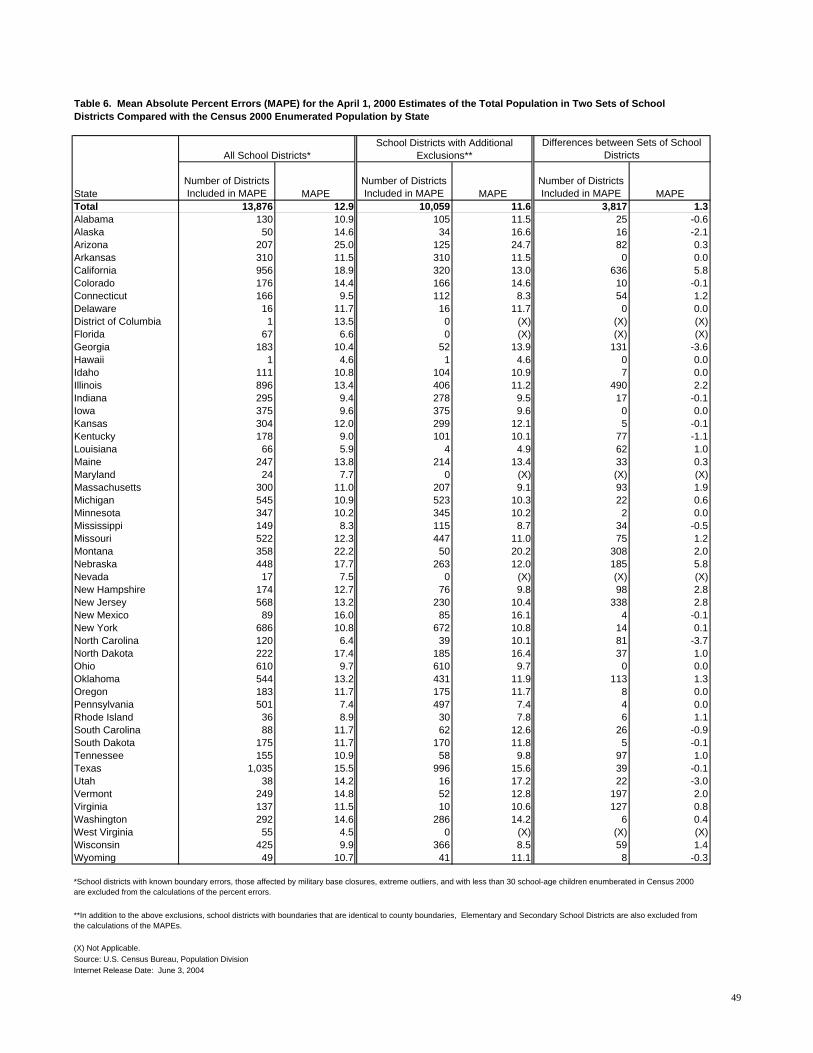
Table 6 Mean Absolute Percent Errors (MAPE) for the April 1 2000 Estimates of the School-Age Population in Two Sets of School Districts Compared with the Census 2000 Enumerated Population by Statehelliphelliphelliphelliphelliphelliphelliphelliphelliphelliphelliphelliphelliphelliphelliphelliphelliphelliphellip49
iii
Table 7 Mean Absolute Percent Errors (MAPE) for the April 1 2000 Estimates of the Total Population in Two Sets of School Districts Compared with the Census 2000 Enumerated Population by Statehelliphelliphelliphelliphelliphelliphelliphelliphelliphelliphelliphelliphelliphelliphelliphelliphelliphelliphelliphelliphellip50
Table 8 Mean Absolute Percent Errors (MAPE) and Mean Algebraic Percent Errors (MALPE) for the April 1 2000 Estimates of the School-Age Population in School Districts Compared with the Census 2000 Enumerated Population by School District Characteristicshelliphelliphelliphelliphelliphelliphelliphelliphelliphelliphelliphelliphelliphelliphelliphelliphelliphelliphelliphelliphelliphelliphelliphelliphelliphelliphelliphellip51
Table 9 Mean Absolute Percent Errors (MAPE) and Mean Algebraic Percent Errors (MALPE) for the April 1 2000 Estimates of the Total Population in School Districts Compared with the Census 2000 Enumerated Population by School District Characteristicshelliphelliphelliphelliphelliphelliphelliphelliphelliphelliphelliphelliphelliphelliphelliphelliphelliphelliphelliphelliphelliphelliphelliphelliphelliphelliphelliphellip52
Table 10 Number of School Districts and Distribution of the School-Age Population by the Total School District Population 1990 and 2000helliphelliphelliphelliphelliphelliphelliphelliphelliphelliphelliphelliphellip53
Table 11 Mean Absolute Percent Errors (MAPE) for the April 1 2000 Estimates of the School-Age Population in Two Sets of School Districts Compared with the Census 2000 Enumerated Population by School District Characteristicshelliphelliphelliphelliphelliphelliphelliphellip54
Table 12 Mean Absolute Percent Errors (MAPE) for the April 1 2000 Estimates of the Total Population in Two Sets of School Districts Compared with the Census 2000 Enumerated Population by School District Characteristicshelliphelliphelliphelliphelliphelliphelliphelliphelliphelliphellip55
Table 13 Mean Absolute Percent Errors (MAPE) for the April 1 2000 Estimates of the School-Age Population and Total Population in School Districts Compared with the Census 2000 Enumerated Population by School District Characteristics for School Districts with 1990 Census Populations of 20000 or Morehelliphelliphelliphelliphelliphelliphelliphelliphelliphellip56
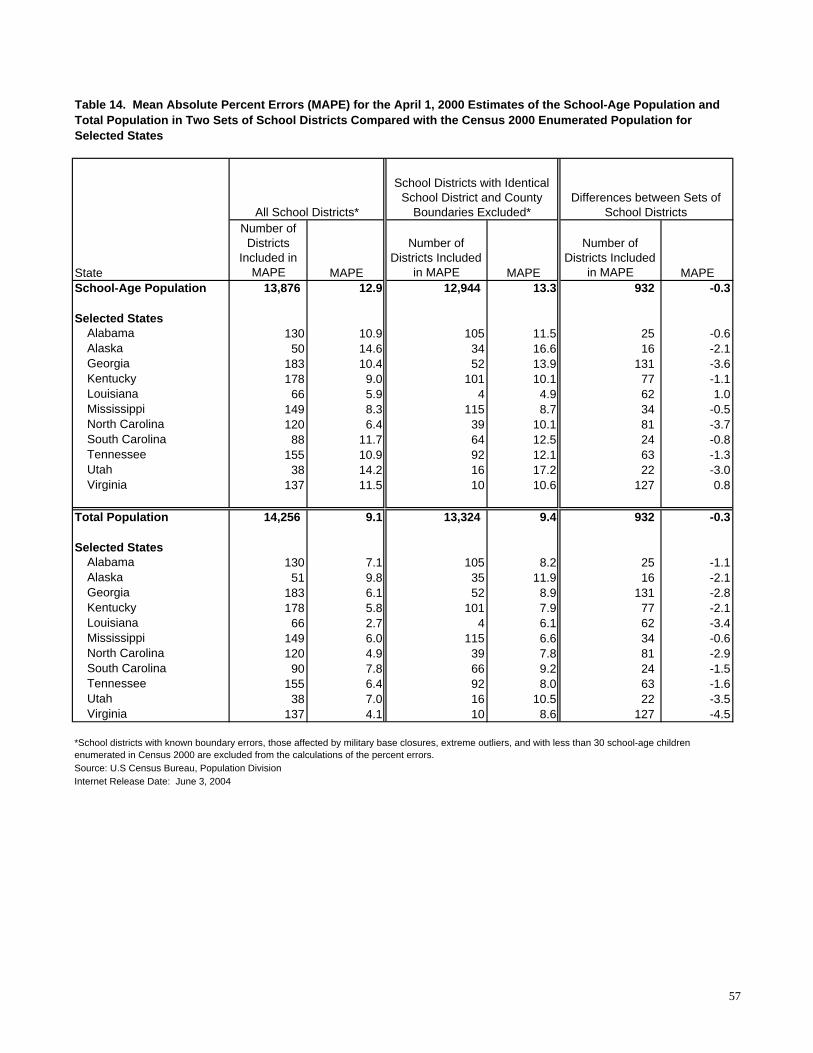
Table 14 Mean Absolute Percent Errors (MAPE) for the April 1 2000 Estimates of the School-Age Population and Total Population in Two Sets of School Districts Compared with the Census 2000 Enumerated Population for Selected Stateshelliphelliphelliphelliphelliphelliphelliphellip57
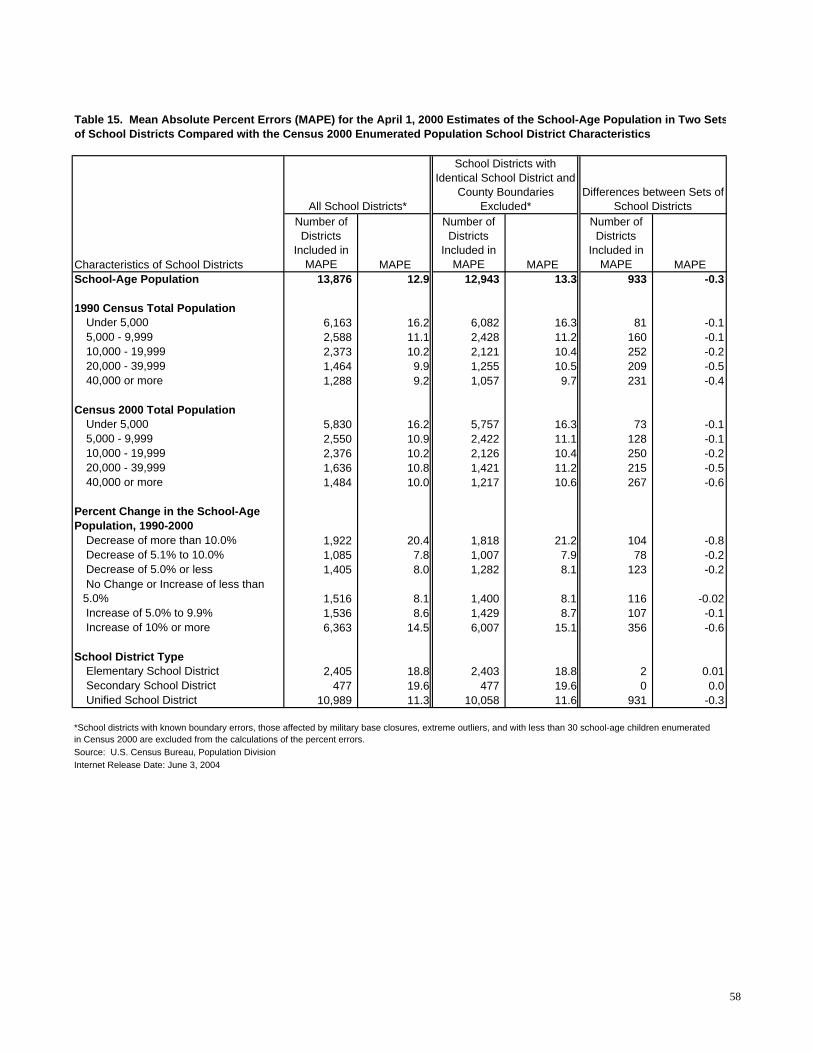
Table 15 Mean Absolute Percent Errors (MAPE) for the April 1 2000 Estimates of the School-Age Population in Two Sets of School Districts Compared with the Census 2000 Enumerated Population by School District Characteristicshelliphelliphelliphelliphelliphelliphelliphellip58
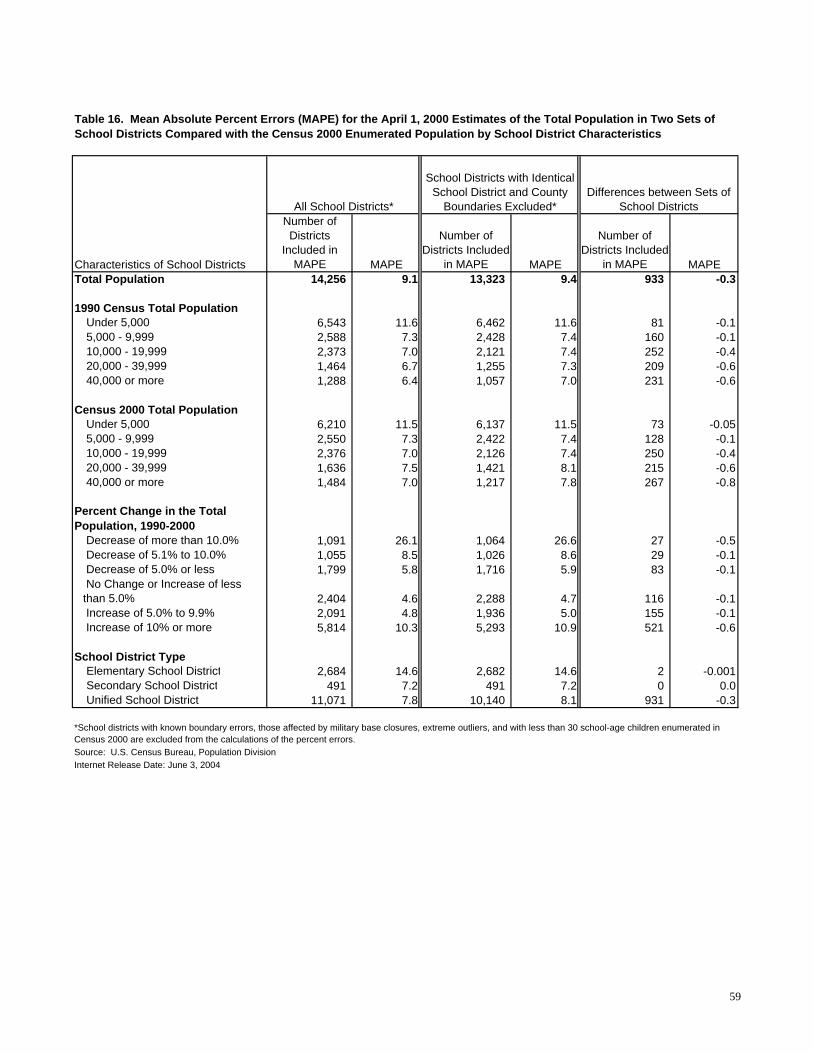
Table 16 Mean Absolute Percent Errors (MAPE) for the April 1 2000 Estimates of the Total Population in Two Sets of School Districts Compared with the Census 2000 Enumerated Population by School District Characteristicshelliphelliphelliphelliphelliphelliphelliphelliphelliphelliphellip59
Population Division Working Paper Serieshelliphelliphelliphelliphelliphelliphelliphelliphelliphelliphelliphelliphelliphelliphelliphellip60
iv
I Introduction
Each year the United States Department of Education (DOE) distributes more
than seven billion dollars to public school districts in order to supplement programs for
educationally disadvantaged children Prior to 1997 distributions to school districts
made under Title 1 of the Elementary and Secondary Education Act were based on the
number of school-age children in poverty as enumerated in the most recent decennial
census The funds were distributed to counties and then the county funds were
distributed to school districts by state governments Along with other changes enacted
for the 1997-1998 school year Congress mandated that the DOE distribute Title 1 funds
directly to school districts based on intercensal updates of the estimated number of
school-age children in poverty
The Census Bureau was given the task of conducting research and updating
estimates of the number of poor school-age children between decennial censuses The
Population Division is responsible for the production of the population estimates and the
Small Area Income and Poverty Estimates (SAIPE) Program produces estimates of the
number of poor school-age children by school district This report evaluates the current
methodology used to create intercensal estimates of the school district population
The 1996 and 1998 school district estimates were produced using a synthetic ratio
method This approach was used to calculate both the total and school-age (5 to 17
years) populations by school district Though the synthetic ratio method makes efficient
use of easily available data there are some concerns about the accuracy of the estimates it
produces and the assumptions it requires Inherent to the synthetic ratio method is the
assumption that the ratio of a school district population to the corresponding county
population remains constant over time To the extent that a school district population
grows or declines at different rates than that of the county or counties in which the school
district lies the estimate will be erroneous The impact of this assumption and related
biases becomes greater for dates further from the decennial census used as the base
population for the estimates Inaccuracies in the county population estimates are also
incorporated into the school district estimates
1
Miller (2001) evaluated the synthetic ratio method by calculating April 1 1990
school district population estimates from 1980 census data and April 1 1990 county
estimates The April 1 1990 school district estimates were compared with the school
district populations enumerated in the 1990 census to determine the accuracy and biases
of the synthetic ratio method The largest proportional errors occurred for small school
districts districts with the highest and lowest poverty rates and districts with the highest
and lowest growth rates
This report continues the effort to evaluate the results of the synthetic ratio
method by producing April 1 2000 school district population estimates based on the
1990 census and April 1 2000 county estimates These estimates were compared to the
school district populations enumerated in Census 2000 Section II describes the synthetic
ratio method and assumptions and the data used to produce and evaluate the school
district population estimates Section III presents the estimate results and calculates the
amount of error attributable to the county estimates and the amount of error attributable
to the synthetic ratio method and related assumptions Section IV evaluates the level of
error associated with school district size growth geographic region and district type
Section V summarizes the findings from this evaluation indicating where the synthetic
ratio method was fairly accurate and where other methods may need to be developed in
order to improve the estimates
2
II Methods and Data
The synthetic ratio method calculates the population in school districts by
assuming that the ratio of the school district population to the county population remains
constant over time In other words the populations of all school districts or portions of
school districts within a county (referred to as ldquoschool district piecesrdquo) change at the
same rate The method requires county and school district level census data as the
starting population and county population estimates for the time period of interest The
synthetic ratio method does not employ a time-sensitive rate of change so the method
can be applied to any time interval without special treatment
The county population estimates used to calculate the changes in the school
district populations are produced annually using a cohort-component method The
cohort-component method begins with the most recent census population by county and
adds or subtracts estimates of four components of population change as calculated for the
estimate time period Births deaths and net internal and international migration are
calculated from various administrative records To the degree that the assumptions
associated with county estimates methodology and coverage in the data sources are
inaccurate the school district estimates will be similarly biased
Using the 1990 census population counts and April 1 2000 county estimates the
estimated total population in school districts was calculated with the following ratio
P sd 2000 = P sd 1990 P ct 2000 P ct 1990
Where
P sd 2000 = total population estimated for each school district piece for April 1
2000
P sd 1990 = total population enumerated for each school district piece in the 1990
census
P ct 2000 = total estimated county population for April 1 2000 for the county in
which the school district piece lies
3
P ct 1990 = total county population enumerated in the 1990 census for the county in
which the school district piece lies
Using the 1990 census population counts and April 1 2000 county estimates the
estimated school-age (5 to 17 years) population in school districts was calculated with the
following ratio
C sd 2000 = C sd 1990 C ct 2000 C ct 1990
Where
C sd 2000 = estimated school-age population for each school district piece for April
1 2000
C sd 1990 = school-age population enumerated for each school district piece in the
1990 census
C ct 2000 = estimated school-age population by county for April 1 2000 for the
county in which the school district piece lies
C ct 1990 = school-age population by county enumerated in the 1990 census for the
county in which the school district piece lies
The ratios of school district piece populations to county populations in 1990 were
applied to each April 1 2000 county estimate to calculate April 1 2000 preliminary
population estimates for school district pieces These preliminary estimates were
rounded and the sums were controlled to equal the April 1 2000 county population
estimates as conventional in the Population Divisionrsquos Population Estimates Branch
(PEB) products and as described in Appendix A
To calculate total population estimates for school districts that cross county
boundaries the school district piece estimates were summed by school districts These
sums are essentially weighted averages of the population change in the relevant counties
weighted by the school district piece populations and applied to the school district base
populations
4
A Base Population 1990 Census Data
Estimating the population in school districts is complicated by a number of
factors First school districts boundaries usually do not match the boundaries of other
governmental units such as counties or cities for which data are readily available
School districts may cross county and other place boundaries or serve only portions of
counties or places Second school districts may annex new territory lose territory open
or close resulting in changes to school district boundaries over time Third some school
districts overlap and share the same pieces of land because the districts serve only limited
grade ranges Each of these issues is addressed by the treatment of the 1990 census data
used as the base population for the April 1 2000 school district population estimates
In order to evaluate the synthetic ratio approach with the most consistent data
available the starting school district populations from the 1990 census data were
tabulated by the Geography Division according to 1999-2000 school district boundaries
These school district boundaries were combined with county boundaries to create
separate population counts for each portion of a school district in each county These are
referred to as ldquoschool district piecesrdquo in this report In addition to portions of school
districts in each county there are some areas of land for which there are no school
districts Population counts for these geographies were also included in the 1990 census
data used in this evaluation and were tabulated by state and county
Where school districts serve only limited grade ranges SAIPE assigned the
school-age population from the 1990 census to a single school district based on the ageshy
to-grade distribution from Current Population Survey (CPS) data (averages of 1988
1989 and 1990 data) For example an Elementary School District (ESD) and Secondary
School District (SSD) share the same geography All children ages 5 to 10 would be
assigned to the ESD all children ages 14 to 17 would be assigned to the SSD and the
children ages 11 to 13 would be divided between the two districts according to the CPS
age-to-grade distributions These children as well as those who reside in non-
overlapping school districts are referred to as ldquorelevant childrenrdquo in this report (US
Census Bureau 2002) The process of assigning relevant children ensures that the 1990
data and subsequent estimates of school-age children sum to match county and state
5
totals for the population ages 5 to 17 School-age children were assigned to overlapping
school districts in this manner for 223 percent of school districts in the 1990 census data
This same process of assigning relevant children cannot be used to assign the total
population to only one school district as the logic of assigning non-school-age people to a
particular grade range does not apply Consequently overlapping school districts may
count the same total population more than once and the 1990 census data and subsequent
estimates of the total population will not sum to match county and state totals
B Estimates of Change Over Time April 1 2000 County Population Estimates
The April 1 2000 estimates of the population by counties were produced by the
PEB using a cohort-component methodology These April 1 2000 estimates were
produced in order to evaluate the accuracy of the county estimates produced for the 1990s
by comparing the results with Census 2000 data To calculate postcensal estimates with
the cohort-component method estimates of births and net internal and international
migration were added to the starting 1990 census populations by county and deaths were
subtracted from the census populations These components (births deaths and
migration) were calculated from Internal Revenue Service Immigration and
Naturalization Service and Social Security Administration and birth and death
registration (vital statistics) records for the 10-year time period since the 1990 census
The Administrative Records and Methodology Branch (ARMR) in the Population
Division also produced county population estimates by single years of age (0 to 85) sex
race and Hispanic origin The detailed county estimates were collapsed by sex race and
Hispanic origin into the two sets of county populations required by the school district
estimates the total population and school-age children (5 to 17 years)
A second set of April 1 2000 county estimates was also used to calculate school
district population estimates in the preliminary analyses These county estimates were
created using a ratio methodology Only the cohort-component method will be used for
the post-Census 2000 county estimates and therefore only the school district estimates
based on the cohort-component county estimates are discussed in Sections III and IV of
6
this report Appendix B contains a summary of the findings using the ratio-based April 1
2000 county estimates
C Standard for Calculating Errors Census 2000 Data
Census 2000 enumeration data were used to evaluate the accuracy of the April 1
2000 school district population estimates1 The Census 2000 data were tabulated by
2001-2002 school district boundaries These boundaries closely matched the 1999-2000
boundaries used to tabulate the 1990 census data and subsequent estimates based on those
data Though the 1990 census and Census 2000 files were not exact matches they were
sufficiently similar for the purposes of this research However there were some
differences in the data that required special treatment as described in Appendix C
In addition to using Census 2000 school district data as a standard to evaluate the
accuracy of the synthetic ratio method Census 2000 county populations were used in
place of the April 1 2000 county estimates to produce a set of school district estimates
that do not contain errors due to the county estimates Comparing the two sets of
estimates distinguished the error attributable to the synthetic ratio method and related
assumptions from the error attributable to the county estimates
Both sets of school district estimates (using April 1 2000 county estimates and
Census 2000 county populations) were compared to the Census 2000 school district
populations as enumerated using the Mean Algebraic Percent Error (MALPE) and the
Mean Absolute Percent Error (MAPE) The MALPE is the sum of the percent
differences between each school district estimate and the corresponding Census 2000
population as enumerated divided by the number of school districts Positive mean
algebraic percent errors indicate overestimation of the school district populations on
average and negative errors indicate underestimation of the school district populations
The MAPE is computed in a similar manner except that the numerator is the sum of the
absolute percent differences between the estimates and the Census 2000 values The
MAPE measures the overall accuracy of the estimates Weighted MAPEs were also
1 Census 2000 population data include modifications as documented in the Count Question Resolution program updates from the Boundary and Annexation Survey and geographic program revisions
7
calculated to account for the size of the school district populations (total or school-age) in
Census 2000 MALPEs and MAPEs were only computed for school districts with total
or school-age populations of 30 or more in Census 2000 because population estimates for
smaller numbers are particularly unreliable
8
III Results April 1 2000 School District Estimates
As noted above the school district estimates were compared with the Census
2000 school district populations as enumerated (see Footnote 1) by calculating the Mean
Algebraic Percent Errors (MALPEs) and Mean Absolute Percent Errors (MAPEs) The
synthetic ratio method produced estimates for a few school districts with very large errors
that had very large effects on the MALPEs and MAPEs (ie one school district estimate
was 52 times larger than the Census 2000 population) Therefore various subsets of
school districts were tested to determine which allowed for the most useful analyses and
still allowed for the inclusion of as many school districts as possible
In addition to excluding school districts with Census 2000 populations (total or
school-age) of less than 30 and those with boundary errors from the calculations of the
MALPEs and MAPEs (see Appendix C) school districts were excluded for two other
reasons First 8 extreme outliers defined as estimates that are 90 percent smaller or 5
times larger than the Census 2000 populations were omitted from the statistics for the
total population because they distorted the unweighted MAPEs and MALPEs to such a
degree that they lost meaning Three extreme outliers were omitted from the MAPE and
MALPE calculations for the school-age population (see Table 1) Second four school
districts (two in Alaska and one each in Alabama and Maine) with extremely large errors
and population changes associated with military base closures were excluded from the
analyses Omitting these outliers appeared justified since county population estimates
may appropriately account for population changes due to military base closures but they
cannot account for population redistribution within counties
The MALPE and MAPE statistics were also calculated for a subset of school
districts that contained populations of 100 or more but this restriction did not noticeably
improve the estimates over omitting just the extreme outliers The latter option was
selected since it allowed a larger number of school districts to be retained in the analyses
With these omissions the analyses were performed on 14256 (996 percent of 14310)
school districts for the total population and 13876 (970 percent of 14310) school
districts for the school-age population Though the analyses are more meaningful with
these omissions it is still important to consider outliers when developing alternative
9
methods for estimating school district populations because these are the school districts
for which improved estimates would be most valuable
A School-Age Population Estimates
Table 2 shows the MALPEs for the school-age population estimates by state The
school district population was underestimated by 38 percent on average for the nation
and was underestimated in 48 states and the District of Columbia The District of
Columbia as a single school district was underestimated by 135 percent followed by
Delaware at 100 percent North Carolina and Rhode Island were the only states for
which the average error was overestimated but only at 02 and 03 percent respectively
Table 2 also includes standard deviations for the MALPEs which indicate the spread of
the errors The estimates for Texas California Arizona and New Mexico had
relatively large standard deviations The difficulties with estimating the school district
populations in these states is likely due to the areas with large population growth during
the 1990s (see Section IVC below) Standard deviations were also relatively large for
Montana Nebraska and North Dakota states that contain school districts with relatively
small populations which are associated with large errors (see Section IVA and IV B
below) States such as Maryland Florida Louisiana and West Virginia had the smallest
standard deviations for the errors probably because most or all of the school district
boundaries in these states are coterminous with county boundaries Consequently most
of the errors for the school districts in these states were identical to the errors in the
county population estimates and no additional error was added by the synthetic ratio
method Also these errors tend to apply to larger populations than in most other school
districts and larger school districts generally have smaller errors (see Section IVA and
IVB below)
Table 3 shows unweighted and weighted MAPEs for the school-age population
These figures average absolute errors and are consistent with the MALPEs The MAPE
for the United States was 129 percent ranging from 45 percent for West Virginia to
250 percent for Arizona As with the MALPEs the MAPEs were highest for states that
experienced rapid growth in the 1990s (Texas New Mexico California and Arizona)
10
and for states with smaller school district populations (North Dakota Nebraska and
Montana) Texas New Mexico and Arizona were also among the states with the largest
MAPEs for the county estimates (Blumerman and Christenson 2002) but the MAPE for
California was relatively small This suggests that though the accuracy of the county
estimates has an impact on the accuracy of the school district estimates the synthetic
ratio method and assumptions also have relatively large effects
Weighting the MAPEs by the Census 2000 school-age population generally
reduces the levels of the MAPEs compared with the unweighted MAPEs (see Table 3)
The weighted MAPE for the United States was 93 percent ranging from 30 percent for
Nevada to 174 percent for Arizona Weighting the MAPEs substantially reduces the
average errors for states with some of the largest unweighted MAPEs such as North
Dakota Nebraska California Texas Montana and Arizona This supports the
conclusion that small school districts in some of these states tend to have relatively large
errors
B Total Population Estimates
Table 4 shows the mean percent errors between the estimated April 1 2000 total
school district population and Census 2000 enumerated data On average the school
district estimates were 01 percent too high for the nation The MALPEs for the total
population estimates ranged from ndash86 percent for Washington DC to 67 percent for
California The total population of school districts was underestimated on average for 33
states and the District of Columbia and overestimated on average for 17 states As with
the school-age population the standard deviations of the errors for the total population
estimates were largest for Arizona Texas Montana Nebraska and California Some of
the states with the smallest standard deviations like Rhode Island North Carolina
Louisiana and West Virginia had relatively low population growth in the 1990s and
others like Virginia Maryland and Florida contain school district boundaries that are
coterminous with county boundaries
For the nation the unweighted MAPE for the estimates of the total population is
91 percent and the weighted MAPE was 67 percent (see Table 5) The unweighted
MAPEs for the estimates of the total population in school districts ranged from 19
11
percent for Maryland to 234 percent for Arizona California (168 percent MAPE) and
Arizona contained more outliers than the other states but many were still retained in the
analyses because the school districts did not meet the strict criteria to be excluded as
extreme outliers The average size of the errors was greatly reduced when weighting by
the Census 2000 school district population indicating that the estimates for larger school
districts tend to be more accurate than those for smaller school districts (see Sections
IVA and IV B)
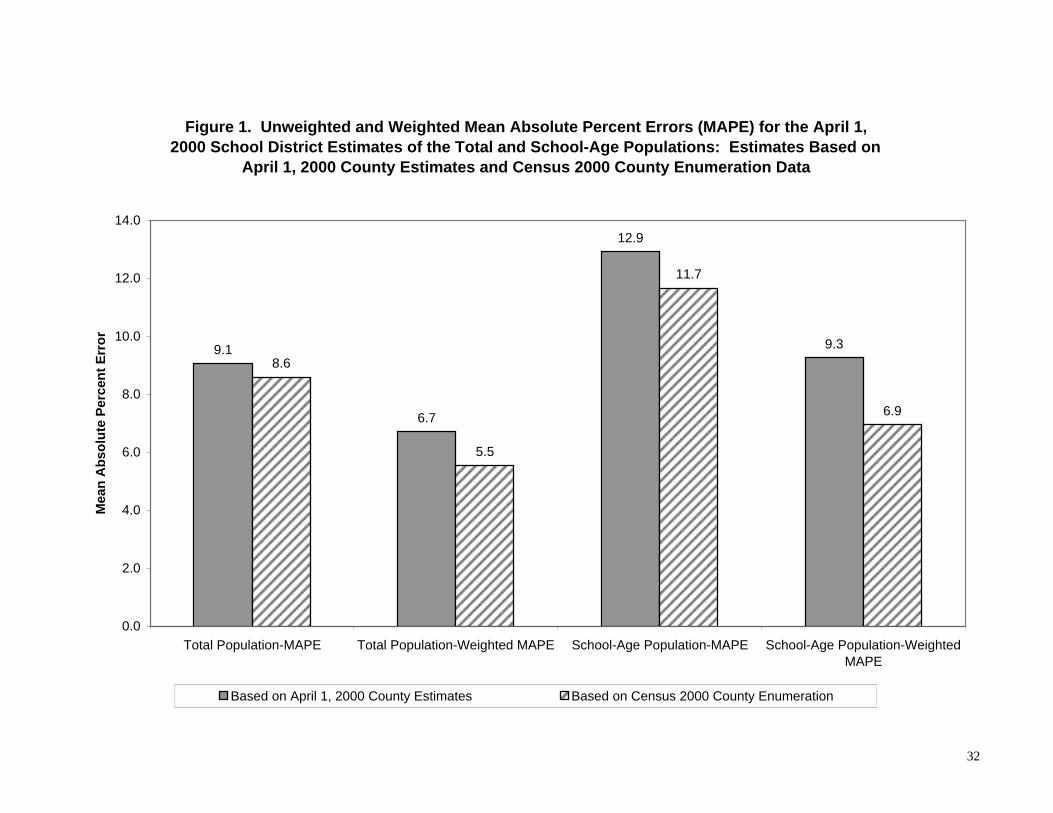
C Estimating the Error Attributed to the Synthetic Ratio Method
One element of the synthetic ratio formula is a postcensal estimate of the county
population for the time period of interest County estimates contain errors from the input
data methodology and assumptions that are introduced into the school district estimates
To evaluate the impact of the errors from the county estimates a set of school district
population estimates was created using Census 2000 county data in place of April 1 2000
county estimates This eliminated the errors attributed to the county estimates from the
school district population estimates The differences between the school district
estimates based on Census 2000 county data and the actual Census 2000 school district
populations were errors due to either differences in coverage and accuracy for the 1990
census and Census 2000 or the synthetic ratio method The differences between the
school district estimates based on Census 2000 county data and the school district
estimates based on April 1 2000 county estimates were errors due to inaccuracies in the
county estimates
Figure 1 shows unweighted and weighted MAPEs for the total and school-age
populations in school districts as estimated from the April 1 2000 county estimates and
from Census 2000 county data For both the total and school-age population estimates
the mean errors for the school district estimates that used Census 2000 county data were
at least three-fourths of the mean errors for the estimates based on April 1 2000 county
estimates This suggests that a relatively large portion of the inaccuracy in the school
district population estimates may be attributed to the synthetic ratio method rather than
errors in the county estimates
12
D Comparisons with Past Research
Miller (2001) evaluated the synthetic ratio method with 1980 Census-based
estimates of the school district population in April 1 1990 using 1990 census data as a
standard For the school-age population the MAPE of 129 percent for the April 1 2000
estimates was an improvement over the MAPE of 169 percent for the April 1 1990
estimates Improvements of similar magnitude occurred for weighted MAPEs 93
percent for the 2000 estimates and 120 percent for the 1990 estimates
For the total population the 2000 estimates had a MAPE of 91 percent more
accurate than the 1990 estimates with a MAPE of 133 percent (Miller 2001) The
weighted MAPE for the 1990 estimates was 96 percent and the weighted MAPE for the
2000 estimates was 67 percent The apparent improvement from the 1980 Census-based
estimates was at least partly due to the increased accuracy of the county estimates for the
1990s compared with the county estimates for the 1980s
The evaluation of the 1980 Census-based estimates for 1990 included only 604
percent of school districts (Miller 2001) while almost all the school districts were
included in the results presented in this report because the 1990 census data were
tabulated by 1999-2000 school district boundaries Though including more school
districts may lead to lower MAPEs when the evaluation was limited to a set of school
districts that was more comparable to the Miller (2001) evaluation2 the mean errors were
even smaller than those described above For the school-age population estimates the
MAPE was 116 percent for the nation ranging from 49 percent for Louisiana (with
only four school districts selected) to 247 percent for Arizona (see Table 6) The MAPE
of the smaller set of school districts for the total population estimates was 81 percent
ranging from 22 percent for Hawaii to 249 percent for Arizona (see Table 7)
2 This subset of school districts excluded Elementary and Secondary School Districts and school districts with boundaries that are coterminous with county boundaries in addition to those described in Appendix C and Section III
13
IV Evaluation
The accuracy of the school district estimates were evaluated for a number of
school district characteristics based on prior research on school district poverty and
population estimates (Miller 2001 National Research Council 2000) Keeping the
characteristics examined consistent allows for comparisons across decades to identify
improvements in estimation methods The accuracy of the school district estimates was
examined for the following characteristics of school districts
A Total census population in 1990
B Total census population in 2000
C Percent change in census population from 1990 to 2000
D Census division and
E School district type
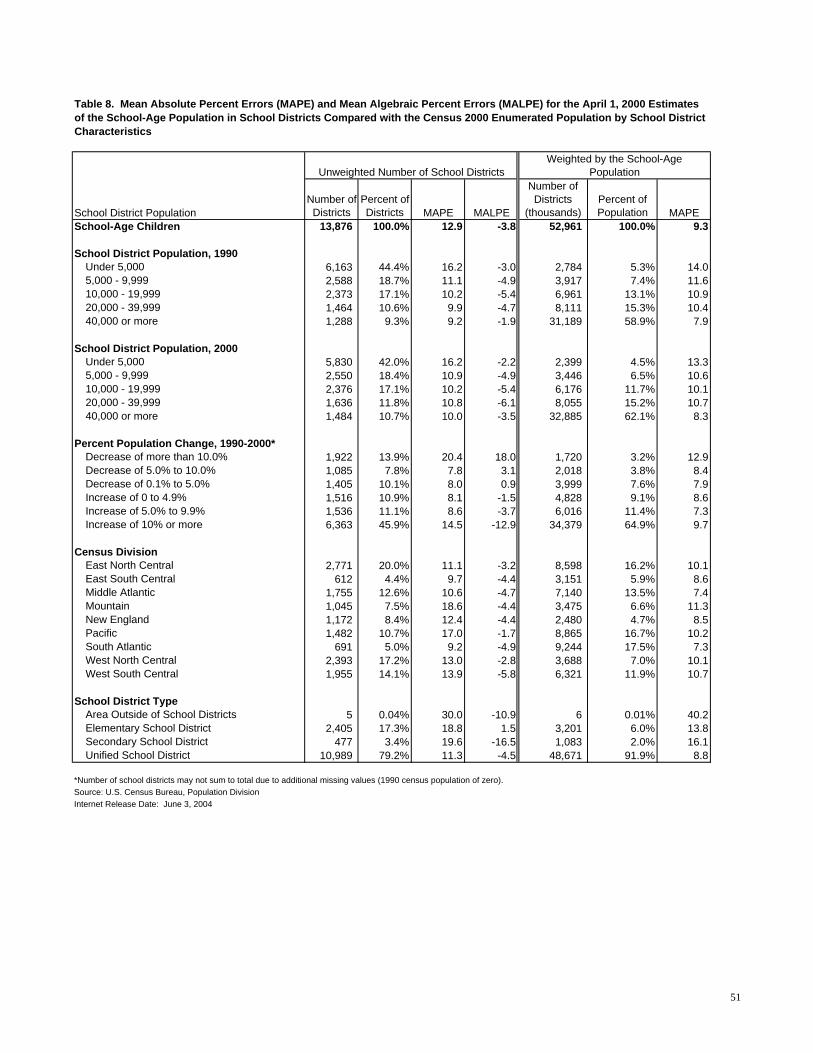
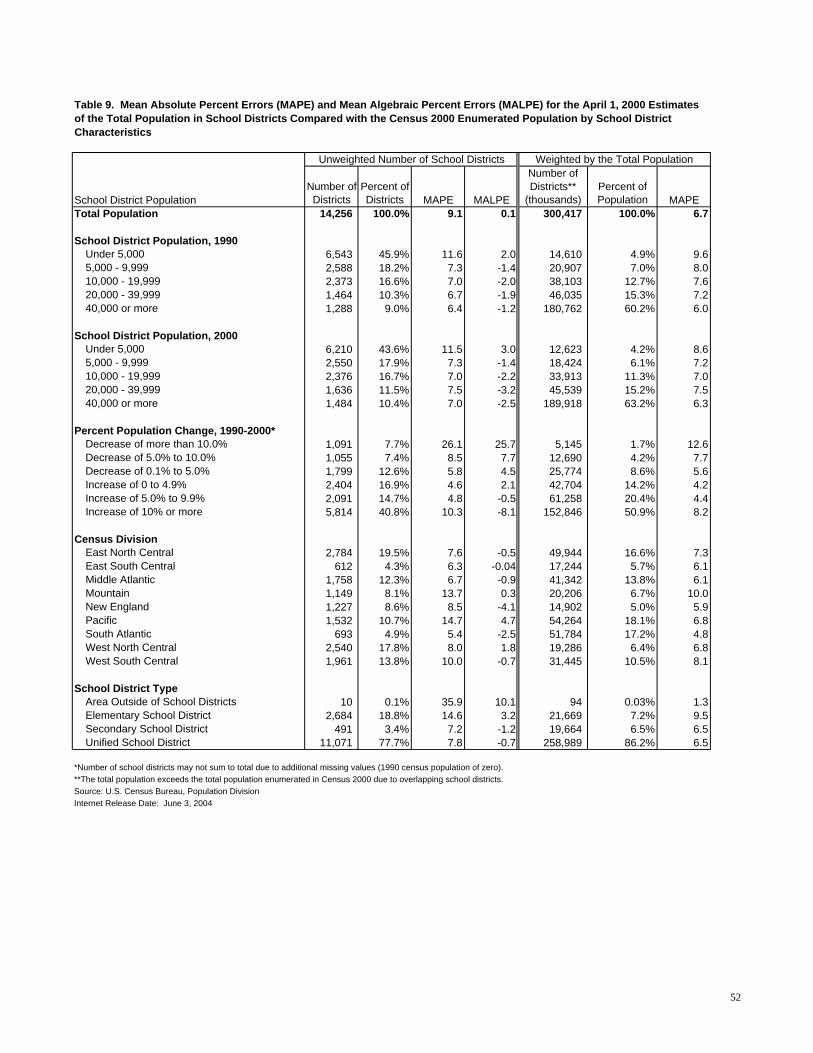
See Tables 8 and 9 for summaries of the MALPEs and MAPEs by these
characteristics of school districts Analyzing the accuracy of the school district estimates
using these characteristics helps determine the types of school districts for which the
synthetic ratio method works relatively well and for the types for which this approach is
problematic Where the accuracy of the school districts estimates differs by geography
size or population change bias in the population estimates may adversely affect the
estimates of the percent of children in poverty (when combined with SAIPErsquos poverty
estimates) and the distribution of Title I federal funds to school districts
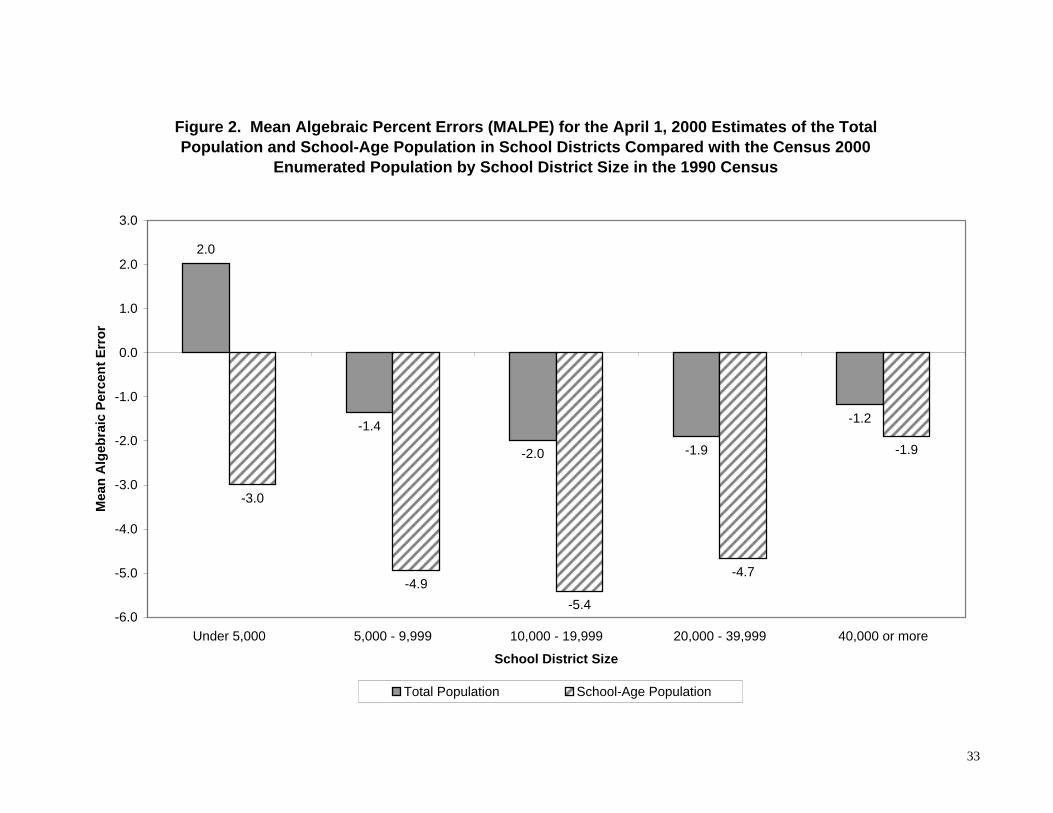
A 1990 Census Population
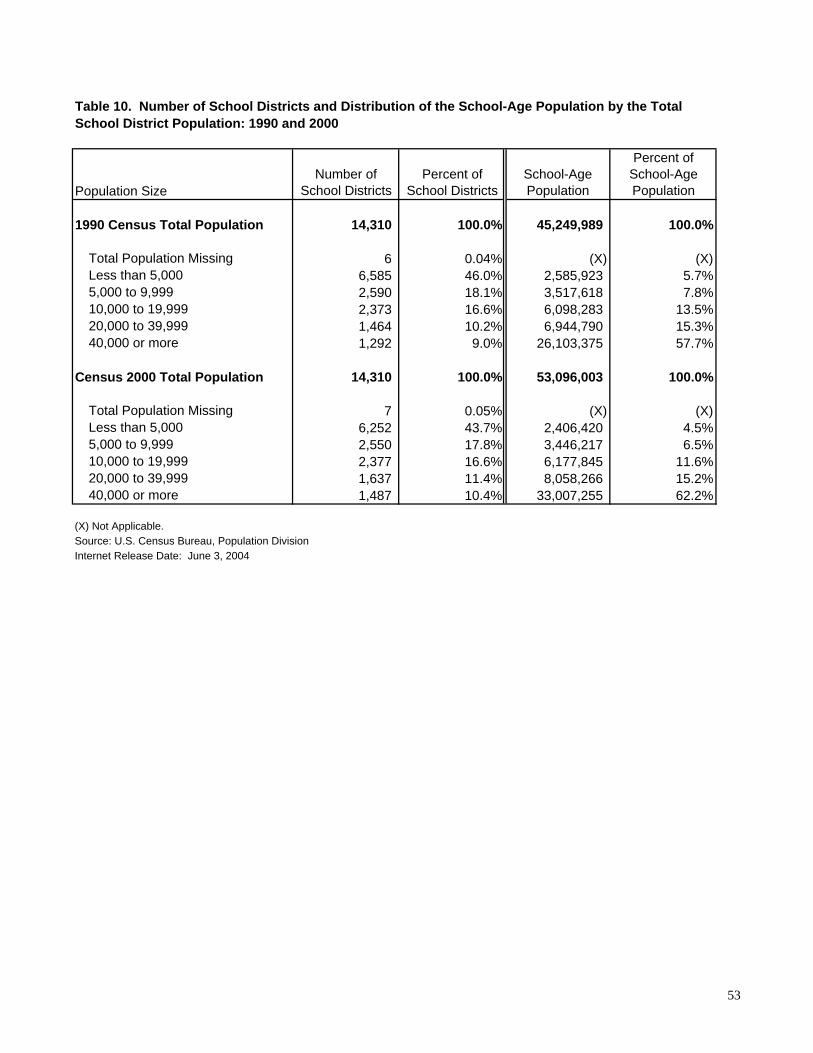
Almost half (460 percent) of school districts had a total population under 5000 in
1990 These school districts accounted for only 57 percent of the school-age population
School districts with 20000 or more people represented 193 percent of all school
districts but contained 730 percent of the school-age children in 1990 (see Table 10)
As larger school districts were more likely to make up larger proportions of the county
14
populations it may be easier to estimate the school district populations for larger school
districts with the synthetic ratio method
Figure 2 shows the MALPEs for the total and school-age populations by the
school district total population size in the 1990 census The synthetic ratio method
consistently underestimated the school-age population for all size categories of school
districts The largest MALPE was for school districts with total populations of 10000 to
19999 which were underestimated by 54 percent
For school districts with less than 5000 people the synthetic ratio method
overestimated the total population by 20 percent The total population was
underestimated for all larger school districts by 12 to 20 percent (MALPEs) This is in
contrast to the findings reported for the 1980 Census-based estimates of the 1990
population where the total population was overestimated for all school districts
particularly the largest and smallest (Miller 2001) The differences were likely due to
differences in errors for the county estimates across decades where the county population
estimates were too high for the 1980s and too low for the 1990s (Blumerman and
Christenson 2002)
Figure 3 presents the unweighted and weighted MAPEs for the estimates of the
school-age populations by the school district size in 1990 Similar to the results found in
the previous work (Miller 2001) the unweighted error for school districts with less than
5000 people (162 percent) is about 50 percent higher than the errors for larger school
districts (ranging from 92 to 111 percent) Weighting the MAPEs by the school-age
population in Census 2000 somewhat reduced the differences in errors across size
categories but there was still a steady decline in average errors with increasing school
district size Figure 4 shows similar results for the total population estimates the larger
the school districts the smaller the average errors
The school-age population estimates had larger errors (MALPEs and MAPEs)
than for the total population which suggests that it is more difficult to correctly distribute
the population by age within counties (and consequently school districts) than to estimate
the total county (and school district) populations
15
B Census 2000 Population
Of the 14310 school districts 6252 (437 percent) had total populations of less
than 5000 in Census 2000 a decline from 460 percent in 1990 (see Table 10) These
school districts accounted for only 45 percent of the school-age population School
districts with 20000 or more people represented 218 percent of all school districts but
contained 773 percent of the school-age children in 2000 Both the proportion of large
school districts and the proportion of children in those districts were higher in Census
2000 than in the 1990 census
Not surprisingly the relationship between the size of the school districts in 2000
and the size of the average errors was similar to that for the size of the school districts in
1990 Figure 5 shows that the school-age population was underestimated in all sizes of
school districts ranging from -22 percent for school districts with under 5000 people to
ndash61 percent for school districts with 20000 to 39999 people The total population was
overestimated by 30 percent for school districts with less than 5000 people and was
underestimated for all other school district size categories by 14 percent to 32 percent
The unweighted MAPEs for the school-age population were almost two-thirds
higher for school districts with less than 5000 people than for larger school districts (see
Figure 6) Weighting the MAPEs by the school-age population in Census 2000 reduced
the average errors for both the largest and smallest school districts but changed the
MAPE values for the other size categories very little The smallest school districts also
had the largest unweighted MAPEs for the total population 115 percent for school
districts with populations under 5000 and 70 to 75 percent for the larger school districts
(see Figure 7) As with the school-age population the differences in average errors by
school district size were substantially reduced when weighted by population These
findings suggest that smaller school districts may need special treatment in future school
district estimates and research
The relationship between school district size and average errors was similar to
that found for county size and average errors When April 1 2000 county estimates were
compared with the Census 2000 results larger counties tended to have lower MAPEs
This was also true when comparing April 1 1990 estimates with the 1990 census data
(Blumerman and Christenson 2002) The similarities may be due to both the nature of
16
creating population estimates and the inclusion of county estimates in the calculation of
school district population estimates
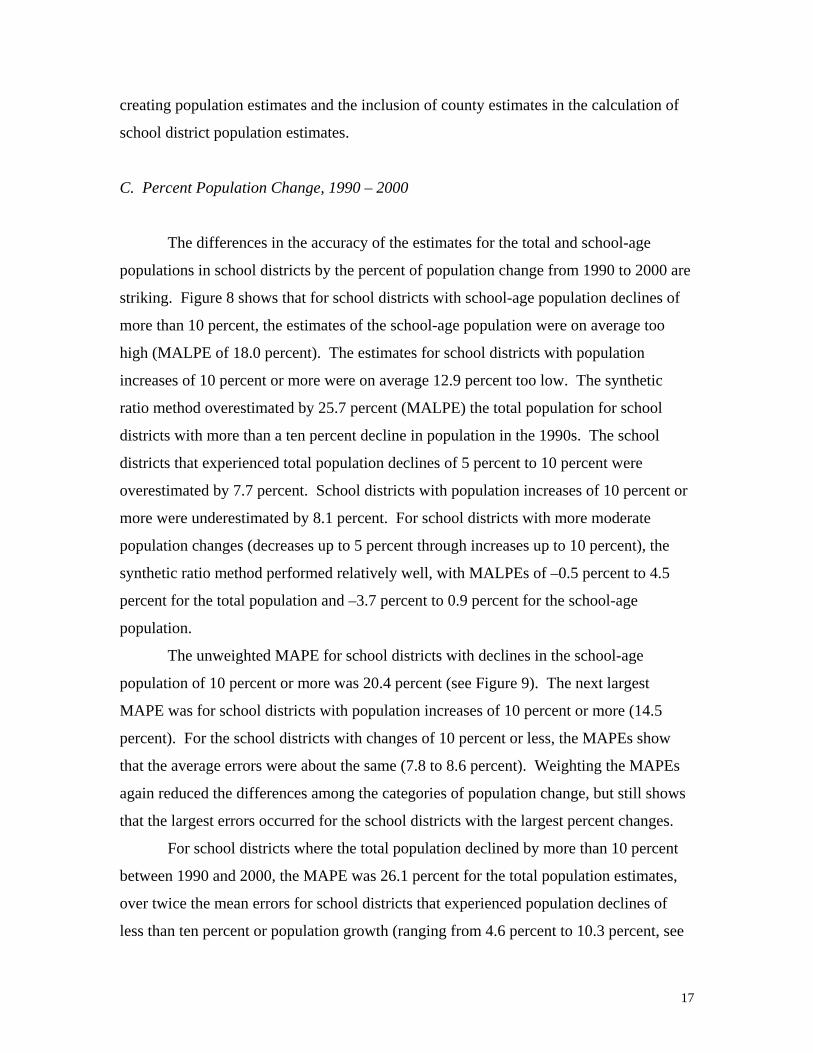
C Percent Population Change 1990 ndash 2000
The differences in the accuracy of the estimates for the total and school-age
populations in school districts by the percent of population change from 1990 to 2000 are
striking Figure 8 shows that for school districts with school-age population declines of
more than 10 percent the estimates of the school-age population were on average too
high (MALPE of 180 percent) The estimates for school districts with population
increases of 10 percent or more were on average 129 percent too low The synthetic
ratio method overestimated by 257 percent (MALPE) the total population for school
districts with more than a ten percent decline in population in the 1990s The school
districts that experienced total population declines of 5 percent to 10 percent were
overestimated by 77 percent School districts with population increases of 10 percent or
more were underestimated by 81 percent For school districts with more moderate
population changes (decreases up to 5 percent through increases up to 10 percent) the
synthetic ratio method performed relatively well with MALPEs of ndash05 percent to 45
percent for the total population and ndash37 percent to 09 percent for the school-age
population
The unweighted MAPE for school districts with declines in the school-age
population of 10 percent or more was 204 percent (see Figure 9) The next largest
MAPE was for school districts with population increases of 10 percent or more (145
percent) For the school districts with changes of 10 percent or less the MAPEs show
that the average errors were about the same (78 to 86 percent) Weighting the MAPEs
again reduced the differences among the categories of population change but still shows
that the largest errors occurred for the school districts with the largest percent changes
For school districts where the total population declined by more than 10 percent
between 1990 and 2000 the MAPE was 261 percent for the total population estimates
over twice the mean errors for school districts that experienced population declines of
less than ten percent or population growth (ranging from 46 percent to 103 percent see
17
Figure 10) The second largest MAPE was for school districts with population increases
of ten percent or more (103 percent) Weighting the MAPEs with the Census 2000
population reduced the MAPE for school districts with the largest population declines by
over half to 126 percent
The synthetic ratio method does not perform well when estimating school districts
with extreme population changes though the errors are attributed partly to errors in the
county estimates This was also true when comparing April 1 2000 county estimates
with Census 2000 data Counties with the largest percent population change from 1990
to 2000 whether growth or decline had the largest MAPEs (Blumerman and Christenson
2002) These findings demonstrate how the assumption that school district populations
change at the same rates as the counties in which they lie fails to capture large population
changes and redistribution within these counties These results also suggest that small
school districts with relatively large population changes are among the most difficult to
estimate accurately
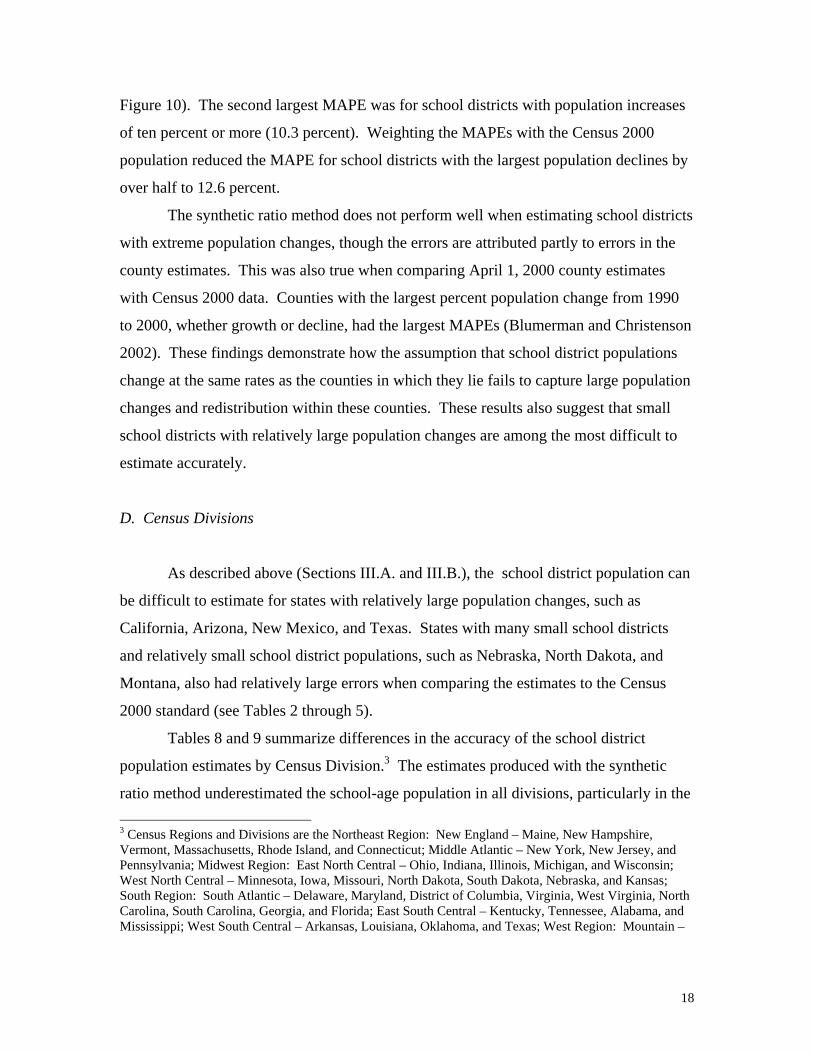
D Census Divisions
As described above (Sections IIIA and IIIB) the school district population can
be difficult to estimate for states with relatively large population changes such as
California Arizona New Mexico and Texas States with many small school districts
and relatively small school district populations such as Nebraska North Dakota and
Montana also had relatively large errors when comparing the estimates to the Census
2000 standard (see Tables 2 through 5)
Tables 8 and 9 summarize differences in the accuracy of the school district
population estimates by Census Division3 The estimates produced with the synthetic
ratio method underestimated the school-age population in all divisions particularly in the
3 Census Regions and Divisions are the Northeast Region New England ndash Maine New Hampshire Vermont Massachusetts Rhode Island and Connecticut Middle Atlantic ndash New York New Jersey and Pennsylvania Midwest Region East North Central ndash Ohio Indiana Illinois Michigan and Wisconsin West North Central ndash Minnesota Iowa Missouri North Dakota South Dakota Nebraska and Kansas South Region South Atlantic ndash Delaware Maryland District of Columbia Virginia West Virginia North Carolina South Carolina Georgia and Florida East South Central ndash Kentucky Tennessee Alabama and Mississippi West South Central ndash Arkansas Louisiana Oklahoma and Texas West Region Mountain ndash
18
south and east (West South Central South Atlantic Middle Atlantic New England and
East South Central Divisions) but also in the Mountain Division The total population
was underestimated in the New England and South Atlantic Divisions and overestimated
in the West North Central and Pacific Divisions The mean errors were quite small for
the other five Census Divisions The relatively small differences across Divisions were
likely due to the effects of combining many sizes of school districts with large ranges of
population changes into single categories
Consistent with the findings for individual states the Pacific and Mountain
Divisions had the largest MAPEs for the total and school-age population estimates
These Divisions include the states of Arizona Colorado Idaho Nevada New Mexico
Oregon Utah and Washington some of the fastest growing states during the 1990s The
smallest MAPEs were in the South Atlantic and East South Central Divisions which
contain some of the states with the slowest growth in the past decade as well as five of
the states for which most or all of the school district boundaries were identical to county
boundaries The states with coterminous county and school district boundaries have
lower errors on average because the county population estimates were more accurate than
the school district estimates Weighting the errors by population greatly reduced the
differences in the errors by Census Division
Similar to what was found with the bias associated with the percent change in
school districts from 1990 to 2000 Census Divisions that experienced the largest
population growth from 1990 to 2000 contained school districts whose populations were
the most difficult to estimate accurately These findings suggest that the synthetic ratio
method may yield school district population estimates of acceptable accuracy for most
states and Census Divisions The development of alternative methodology could focus
on the fastest changing areas
Montana Idaho Wyoming Colorado New Mexico Arizona Utah Nevada Pacific ndash Washington Oregon California Alaska and Hawaii
19
E Type of School District
This report attempts to determine the limits of the synthetic ratio method for
estimating the population in school districts and it may prove useful to determine
whether the method produces estimates that differ in accuracy by types of school
districts Of the 13876 school districts included in statistics for the estimated school-age
populations 173 percent were Elementary School Districts (ESDs) 34 percent were
Secondary School Districts (SSDs) and 792 percent were Unified School Districts
(USDs see Table 8) The distribution was similar for the 14256 school districts included
in the statistics for the estimates of the total population 188 percent were ESDs 34
percent were SSDs and 777 percent were USDs (see Table 9)
There were also five areas outside of school districts for which the school-age
population size was large enough (30 people or more) to be included in the evaluation
statistics discussed above For the estimates of the total population there were ten areas
outside of school districts that met the minimum size criteria and were included in the
analyses presented in this report However when MALPEs and MAPEs were calculated
separately by school district type the interpretation is limited for these areas outside
school districts because only five or ten observations were used For example the
school-age population was underestimated by 109 percent (MALPE) and the total
population for areas outside school districts was overestimated by 101 percent The
unweighted MAPEs had even more extreme average errors of 300 percent for the school-
age population and 359 percent for the total population As these errors for the areas
outside of school districts were relatively large a series of MALPEs and MAPEs (not
shown) were also calculated for the school district characteristics described above with
the areas outside of school districts excluded The differences between the MALPEs and
MAPEs presented in this paper and for the subset with the areas outside school districts
excluded were negligible for all the evaluation characteristics
The MALPEs in Table 8 show that the school-age population was overestimated
for ESDs by 15 percent underestimated by 165 percent for SSDs and underestimated
by 45 percent for USDs The differences in mean errors were much smaller for the total
20
population which was overestimated by 32 percent for ESDs and underestimated for
SSDs and USDs by 12 percent and 07 percent respectively
The MAPE for the estimates of the school-age populations were almost 50
percent higher for the ESDs and SSDs than for the USDs (see Figure 11) These
differences remained after weighting by the school-age population In contrast the
MAPE for the ESDs for the total population estimates was about two times higher (146
percent) than those for the SSDs (72 percent) and the USDs (78 percent) (see Figure
12) These differences were smaller for weighted MAPEs (95 percent for ESDs and 65
percent for both SSDs and USDs) but still show that the estimates were least accurate for
the Elementary School Districts
One reason the errors were higher for the ESDs and SSDs may be that the average
population in Census 2000 was at least twice as large for USDs as for ESDs and SSDs
(1196 for ESDs 2206 for SSDs and 4406 for USDs) As shown in Sections IVA and
IVB above estimates for school districts with smaller populations tended to be less
accurate In addition the SSD mean errors apply to the smallest number of school
districts (477 for the school-age population and 491 for the total population) so outliers
would have greater effects on the errors The underestimation of the older population of
children (including 12 to 17 year olds) may be because there was a relatively large
immigrant population which was underestimated for this age group in the county
estimates for the 1990s
The results also indicate that there may be some differences in the age-to-grade
distributions used to assign relevant children to overlapping school districts The
assignment of relevant children to school districts in the 1990 census starting population
was based on averages of 1988-1990 CPS data In the Census 2000 standard used for the
evaluation relevant children were assigned to school districts based on Census 2000
sample data by sex race Hispanic origin and Census Region It is possible that the ageshy
to-grade distributions may have changed over the ten-year period and introduced
additional error into the estimates of Elementary and Secondary School Districts that do
not affect the estimates for children in Unified School Districts
Finally the statistics for the estimates for the total population may be somewhat
skewed because the errors associated with overlapping school districts may be counted
21
more than once in the computation of the MAPEs and MALPEs However there is little
evidence of bias created by including overlapping school districts in the statistics more
than once Tables 11 and 12 show MAPEs for a subset of school districts that includes
only USDs and school districts with boundaries that were not coterminous with county
boundaries The MAPEs demonstrate similar patterns of errors by school district
characteristics with the largest errors for the smallest school districts and for those with
the largest percent changes from 1990 to 2000
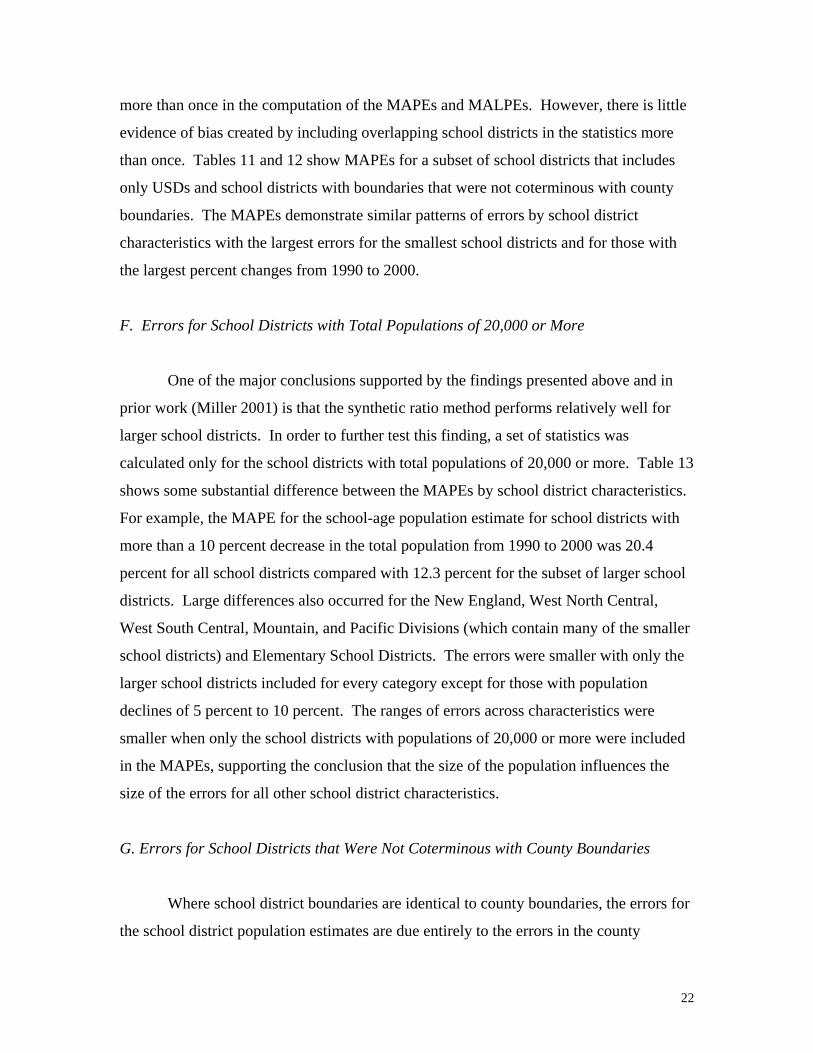
F Errors for School Districts with Total Populations of 20000 or More
One of the major conclusions supported by the findings presented above and in
prior work (Miller 2001) is that the synthetic ratio method performs relatively well for
larger school districts In order to further test this finding a set of statistics was
calculated only for the school districts with total populations of 20000 or more Table 13
shows some substantial difference between the MAPEs by school district characteristics
For example the MAPE for the school-age population estimate for school districts with
more than a 10 percent decrease in the total population from 1990 to 2000 was 204
percent for all school districts compared with 123 percent for the subset of larger school
districts Large differences also occurred for the New England West North Central
West South Central Mountain and Pacific Divisions (which contain many of the smaller
school districts) and Elementary School Districts The errors were smaller with only the
larger school districts included for every category except for those with population
declines of 5 percent to 10 percent The ranges of errors across characteristics were
smaller when only the school districts with populations of 20000 or more were included
in the MAPEs supporting the conclusion that the size of the population influences the
size of the errors for all other school district characteristics
G Errors for School Districts that Were Not Coterminous with County Boundaries
Where school district boundaries are identical to county boundaries the errors for
the school district population estimates are due entirely to the errors in the county
22
population estimates by methodological design To determine if including school
districts with boundaries that were coterminous with county boundaries substantially
reduced the mean errors for the school district estimates MAPEs were also calculated
with these school districts excluded All the school districts in Florida Nevada
Maryland and West Virginia were coterminous with county boundaries and Hawaii and
the District of Columbia contained single school districts
Table 14 shows the differences between MAPEs for the two sets of school
districts for the states with the largest differences While most of the errors increased
when coterminous school districts were excluded the MAPEs for the school-age
population for Louisiana and Virginia increased slightly because only a few school
districts were included in the analyses for those two states There were slight increases in
the MAPEs for the school-age and total population by size percent population change
and school district type when the school districts with boundaries identical to county
boundaries were excluded (see Tables 15 and 16) The largest differences were for the
largest school district size categories and for the largest percent changes whether
population growth or decline Not surprisingly the largest changes were for the
categories for which the most school districts were excluded as having boundaries
coterminous with county boundaries
23
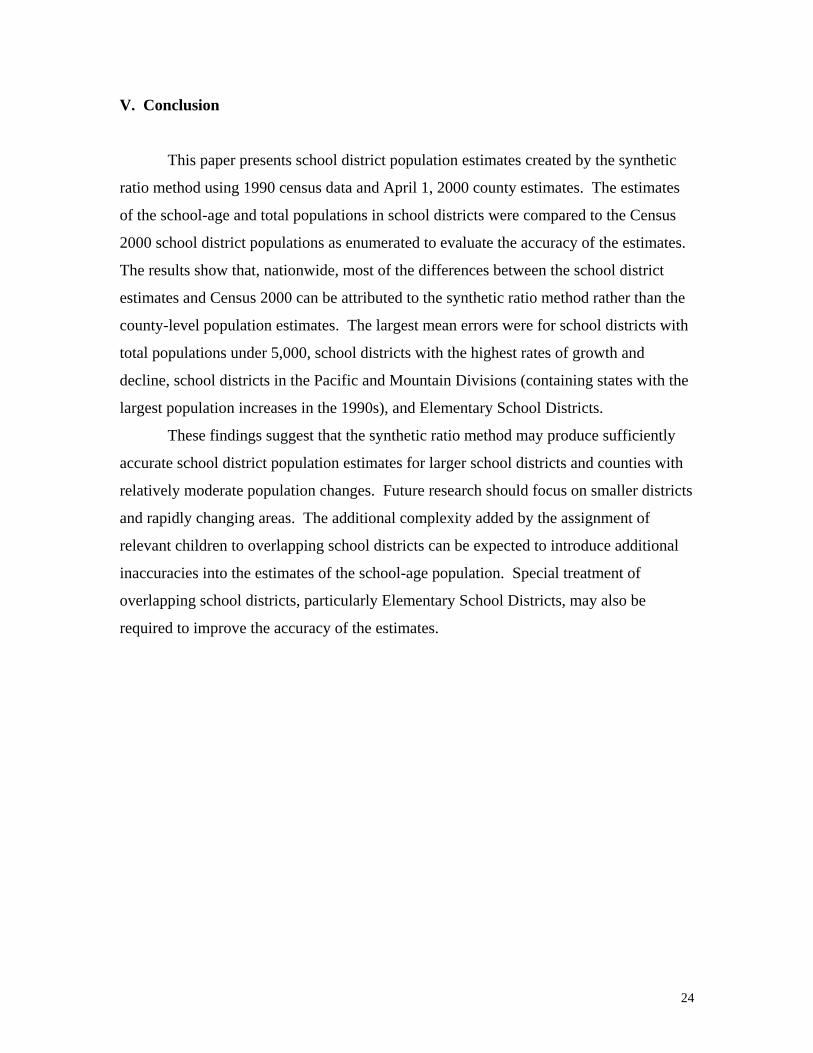
V Conclusion
This paper presents school district population estimates created by the synthetic
ratio method using 1990 census data and April 1 2000 county estimates The estimates
of the school-age and total populations in school districts were compared to the Census
2000 school district populations as enumerated to evaluate the accuracy of the estimates
The results show that nationwide most of the differences between the school district
estimates and Census 2000 can be attributed to the synthetic ratio method rather than the
county-level population estimates The largest mean errors were for school districts with
total populations under 5000 school districts with the highest rates of growth and
decline school districts in the Pacific and Mountain Divisions (containing states with the
largest population increases in the 1990s) and Elementary School Districts
These findings suggest that the synthetic ratio method may produce sufficiently
accurate school district population estimates for larger school districts and counties with
relatively moderate population changes Future research should focus on smaller districts
and rapidly changing areas The additional complexity added by the assignment of
relevant children to overlapping school districts can be expected to introduce additional
inaccuracies into the estimates of the school-age population Special treatment of
overlapping school districts particularly Elementary School Districts may also be
required to improve the accuracy of the estimates
24
Appendix A Identifying Overlapping School Districts
When assigning relevant children to school districts in the 1990 census data
SAIPE staff created a variable to indicate whether a county contained overlapping school
districts If a county contained school districts that shared geography and the populations
within that geography the school district populations do not sum to equal the county
populations Knowing when school district populations should sum to match county and
state totals is useful for checking the accuracy of the data files as they are manipulated in
the production of the estimates and for allocating rounding error
When population estimates for one level of geography (ie school district pieces)
are intended to sum exactly to estimates of a higher level of geography (ie counties) it
is conventional in the Population Estimates Branch to allocate (add or subtract) the
rounding error to the area with the largest population in order for the change to have the
least impact on the estimated population distribution When the sums of school district
total populations include people who were counted more than once because school
districts contained overlapping geography it was impossible to accurately calculate
rounding error For counties that included these populations the allocation procedure
could not be applied to the school estimates discussed in this report
The flag created by SAIPE staff (referred to as the ldquooriginal flagrdquo in this report)
indicated that a county contained overlapping school districts if ldquorelevant childrenrdquo were
assigned to overlapping school districts in the 1990 census data tabulated with 1999-2000
boundaries When there were overlapping school district pieces in a county but no actual
school-age children enumerated in the 1990 census for those pieces this flag did not
accurately identify the county as containing overlapping school districts Consequently a
second flag (referred to as the ldquoalternative flagrdquo in this report) was created by comparing
the sums of the total population for each school district piece in a county to the
independent county totals from the 1990 census If the sum of the total population in the
school district pieces was greater than the county total population there were people
counted in more than one school district and the county was identified as containing
overlapping school districts Otherwise the sums of the total population in school district
pieces equaled the independent county total population and the county did not contain
any overlapping school districts This approach did not depend on the presence of
25
school-age children but rather on the presence of people of any age which was a critical
difference for the very small school district pieces for which the original flag was
inaccurate
The school district population estimates were calculated using both flags and
though the alternative appeared more accurate the differences were negligible The flags
were the same for all but 10 counties (03 percent of 3141) in six states (Hawaii Illinois
Nebraska North Dakota Oklahoma and Texas) The flags generated population
estimates that were almost identical to each other (no more than 010 percent different)
Only the results using the alternative flag are discussed in this report
26
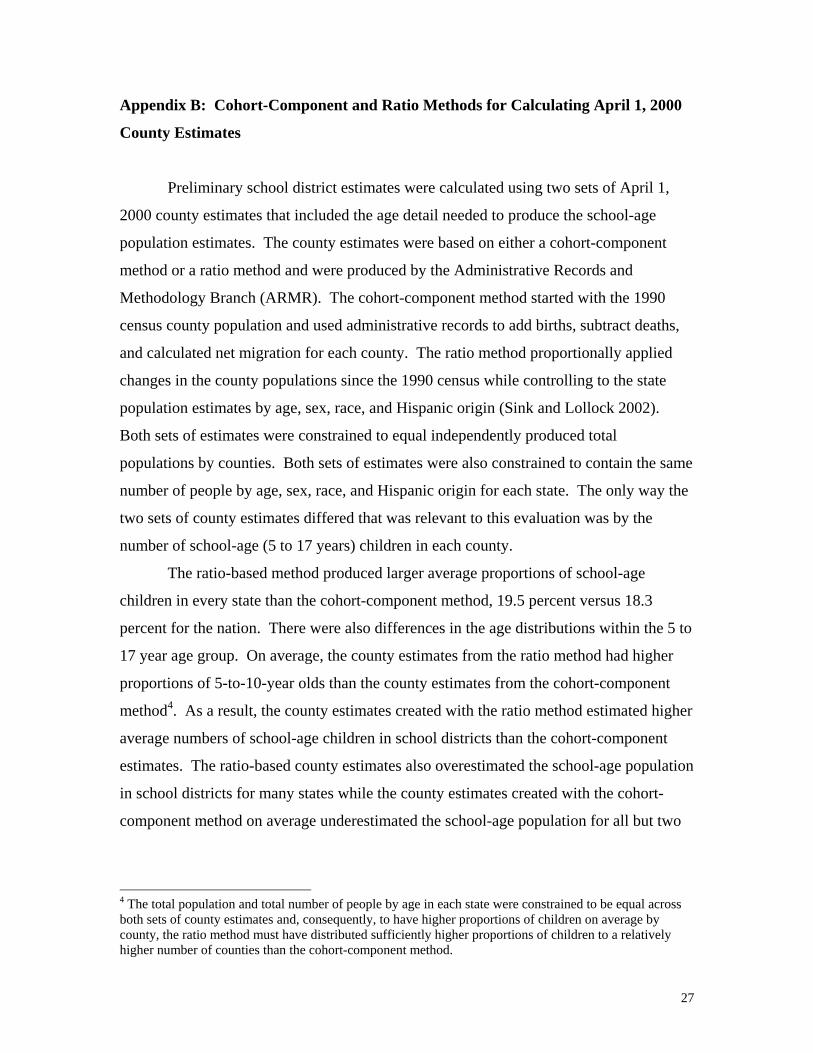
Appendix B Cohort-Component and Ratio Methods for Calculating April 1 2000
County Estimates
Preliminary school district estimates were calculated using two sets of April 1
2000 county estimates that included the age detail needed to produce the school-age
population estimates The county estimates were based on either a cohort-component
method or a ratio method and were produced by the Administrative Records and
Methodology Branch (ARMR) The cohort-component method started with the 1990
census county population and used administrative records to add births subtract deaths
and calculated net migration for each county The ratio method proportionally applied
changes in the county populations since the 1990 census while controlling to the state
population estimates by age sex race and Hispanic origin (Sink and Lollock 2002)
Both sets of estimates were constrained to equal independently produced total
populations by counties Both sets of estimates were also constrained to contain the same
number of people by age sex race and Hispanic origin for each state The only way the
two sets of county estimates differed that was relevant to this evaluation was by the
number of school-age (5 to 17 years) children in each county
The ratio-based method produced larger average proportions of school-age
children in every state than the cohort-component method 195 percent versus 183
percent for the nation There were also differences in the age distributions within the 5 to
17 year age group On average the county estimates from the ratio method had higher
proportions of 5-to-10-year olds than the county estimates from the cohort-component
method4 As a result the county estimates created with the ratio method estimated higher
average numbers of school-age children in school districts than the cohort-component
estimates The ratio-based county estimates also overestimated the school-age population
in school districts for many states while the county estimates created with the cohort-
component method on average underestimated the school-age population for all but two
4 The total population and total number of people by age in each state were constrained to be equal across both sets of county estimates and consequently to have higher proportions of children on average by county the ratio method must have distributed sufficiently higher proportions of children to a relatively higher number of counties than the cohort-component method
27
states This was due to differences in the methodology that were most evident in the
states with higher population growth such as California Colorado Florida and Utah
For the nation the cohort-component county estimates underestimated the April
1 2000 school-age population in school districts by 38 percent and the ratio-based
county estimates overestimated the school-age population by 10 percent The MAPEs
for the cohort-component- and ratio-based school district estimates of the school-age
population however were almost identical For most states the differences for the
cohort-component- and ratio-based estimates as measured by the MAPEs were relatively
small
Though the MALPE findings suggest that the ratio-based county estimates may
yield better school district estimates of the school-age population compared with the
cohort-component county estimates the MAPEs do not show such clear results Only the
results using the April 1 2000 county estimates produced using the cohort-component
method were discussed in this report because this is the only method for producing
demographic details for county estimates planned for post-Census 2000 estimates
28
Appendix C Treatment of 1990 Census and Census 2000 School District Files
The Census 2000 data were tabulated by 2001-2002 school district boundaries These
boundaries closely matched the 1999-2000 boundaries used to tabulate the 1990 census
data and subsequent estimates based on those data There were some differences in the
data that required special treatment as follows
1) The boundaries for three school districts in Ocean County New Jersey and two
school districts in Salt Lake County Utah were incorrectly tabulated in the Census 2000
data These five school districts were excluded from all the analyses described in this
report There may be other errors in the tabulations of school district population data but
only these five districts were identified at the time this report was produced
2) Hawaii operates as only one school district and was broken down into five
school district pieces that coincided with county boundaries in the 1990 census data By
definition the school district population estimates were identical to the county estimates
The April 1 2000 estimates created for these five school district pieces were collapsed
into a single district for the entire state for comparisons with the Census 2000 data This
limited the ability to evaluate the estimates for Hawaii and all the errors between the
school district estimates and Census 2000 were really errors in the county estimates
3) The 1990 census data included areas outside of school districts tabulated
separately for each county while the areas outside of school districts in Census 2000 data
were tabulated only for the state totals For the evaluation the 1990 census-based school
district estimates for areas outside of school districts were summed by states in order to
have comparable figures These areas contain relatively small populations 70037 people
nationwide in 1990 (881 percent of those in Arizona) and 106351 people in 2000 (787
percent of those in Arizona and 114 percent in New York) These areas in Arizona and
New York were not covered by school districts for reasons unique to those areas
4) The total populations in school districts were used as enumerated from the
Census 2000 long-form data5 and the school-age populations were tabulated from the
Census 2000 sample data (approximately 1 in 6 sample) Sample data were used for the
5 Census 2000 population data include modifications as documented in the Count Question Resolution program updates from the Boundary and Annexation Survey and geographic program revisions
29
assignment of relevant children to school districts because they included information on
both age and grade The use of Census 2000 sample data meant that there were some
school districts for which the school-age populations were too small to be selected in the
households sampled When the total and school-age populations were matched by school
districts there were 38 school districts not listed in the file of school-age children
because the districts did not contain any sample data for the population ages 5 to 17
Most of these school districts had less than 60 people of any age enumerated in Census
2000 and only one school district had more than 100 people enumerated This confirms
that there were probably households with school-age children present in the 38
unmatched school districts but not in large enough numbers to be selected in the sample
Though important to note the use of sample data does not generally limit this evaluation
of 1990 census-based school district estimates because school districts must have
contained at least 30 people (total or school-age) in Census 2000 to be included in the
calculation of the MAPEs and MALPEs
30
References
Blumerman Lisa M and Matthew Christenson 2002 ldquoThe Population Estimates of the
1990s Close to the Markrdquo Paper Presented at the Annual Meeting of the American
Sociological Association Chicago IL
Miller Esther 2001 ldquoEvaluation of the 1990 School District Level Population
Estimates Based on the Synthetic Ratio Approachrdquo US Census Bureau Population
Division Working Paper No 54
National Research Council 2000 Small-Area Estimates of School-Age Children in
Poverty Evaluation of Current Methodology Panel on Estimates of Poverty for
Small Geographic Areas Constance F Citro and Graham Kalton editors Committee
on National Statistics Washington DC National Academy Press
Sink Larry and Lisa Lollock ldquoAn Evaluation of Alternative Methods of Estimating
Population by Age Race and Hispanic Origin at the County Levelrdquo Paper presented
at the annual meeting of the Southern Demographic Association October 2002
US Census Bureau Housing and Household Economic Statistics Division Small Area
Estimates Branch 2002 ldquoSmall Area Income and Poverty Estimates 1999
Overview of School District Estimatesrdquo
wwwcensusgovhheswwwsaipeschoolssd99overhtmp
31
Figure 1 Unweighted and Weighted Mean Absolute Percent Errors (MAPE) for the April 1 2000 School District Estimates of the Total and School-Age Populations Estimates Based on
April 1 2000 County Estimates and Census 2000 County Enumeration Data
Total Population-MAPE Total Population-Weighted MAPE School-Age Population-MAPE School-Age Population-Weighted MAPE
91
67
129
93 86
55
117
69
00
20
40
60
80
100
120
140
Mea
n A
bsol
ute
Perc
ent E
rror
Based on April 1 2000 County Estimates Based on Census 2000 County Enumeration
32
Figure 2 Mean Algebraic Percent Errors (MALPE) for the April 1 2000 Estimates of the Total Population and School-Age Population in School Districts Compared with the Census 2000
Enumerated Population by School District Size in the 1990 Census
Under 5000 5000 - 9999 10000 - 19999 20000 - 39999 40000 or more
School District Size
20
-14
-20 -19
-12
-30
-49 -54
-47
-19
-60
-50
-40
-30
-20
-10
00
10
20
30
Mea
n A
lgeb
raic
Per
cent
Err
or
Total Population School-Age Population
33
Figure 3 Mean Absolute Percent Errors (MAPE) for the April 1 2000 Estimates of the School-Age Population in School Districts Compared with Census 2000 Enumerated Population by
School District Size in the 1990 Census
Under 5000 5000 - 9999 10000 - 19999 20000 - 39999 40000 or more
School District Size
162
111 102 99
92
140
116 109
104
79
00
20
40
60
80
100
120
140
160
180
Mea
n A
bsol
ute
Perc
ent E
rror
Unweighted MAPE Weighted MAPE
34
Figure 4 Mean Absolute Percent Errors (MAPE) for the April 1 2000 Estimates of the Total Population in School Districts Compared with the Census 2000 Enumerated Population by
School District Size in the 1990 Census
Under 5000 5000 - 9999 10000 - 19999 20000 - 39999 40000 or more
School District Size
116
73 70 67 64
96
80 76
72
60
00
20
40
60
80
100
120
140
Mea
n A
bsol
ute
Perc
ent E
rror
Unweighted MAPE Weighted MAPE
35
Figure 5 Mean Algebraic Percent Errors (MALPE) for the April 1 2000 Estimates of the Total Population and School-Age Population in School Districts Compared with the Census 2000
Enumerated Population by School District Size in Census 2000
Under 5000 5000 - 9999 10000 - 19999 20000 - 39999 40000 or more
School District Size
30
-14
-22
-32
-25 -22
-49 -54
-61
-35
-70
-60
-50
-40
-30
-20
-10
00
10
20
30
40
Mea
n A
lgeb
raic
Per
cent
Err
or
Total Population School-Age Population
36
Figure 6 Mean Absolute Percent Errors (MAPE) for the April 1 2000 Estimates of the School-Age Population in School Districts Compared with the Census 2000 Enumerated Population
by School District Size in Census 2000
Under 5000 5000 - 9999 10000 - 19999 20000 - 39999 40000 or more
School District Size
162
109 102
108 100
133
106 101
107
83
00
20
40
60
80
100
120
140
160
180
Mea
n A
bsol
ute
Perc
ent E
rror
Unweighted MAPE Weighted MAPE
37
Figure 7 Mean Absolute Percent Errors (MAPE) for the April 1 2000 Estimates of the Total Population in School Districts Compared with the Census 2000 Enumerated Population by
School District Size in Census 2000
Under 5000 5000 - 9999 10000 - 19999 20000 - 39999 40000 or more
School District Size
115
73 70 75
70
86
72 70 75
63
00
20
40
60
80
100
120
140
Mea
n A
bsol
ute
Perc
ent E
rror
Unweighted MAPE Weighted MAPE
38
Figure 8 Mean Algebraic Percent Errors (MALPE) for the April 1 2000 Estimates of the Total and School-Age Populations in School Districts Compared with the Census 2000 Enumerated Population by Ten-Year Percent Change in School District Populations
257
77
45 21
-05
-81
180
31 09
-15 -37
-129-150
-100
-50
00
50
100
150
200
250
300
Mea
n A
lgeb
raic
Per
cent
Err
or
Decrease of more than 100
Decrease of 51 to 100
Decrease of 50 or less
No Change or Increase of less than
50
Increase of 50 to 99
Increase of 10 or more
Percent Change 1990 to 2000
Total Population School-Age Population
39
204
78 80 81 86
145
129
84 79 86
73
97
00
50
100
150
200
250
Mea
n A
bsol
ute
Perc
ent E
rror
Figure 9 Mean Absolute Percent Errors (MAPE) for the April 1 2000 Estimates of the School-Age Population in School Districts Compared with the Census 2000 Enumerated Population
by Ten-Year Percent Change in the School District School-Age Population
Decrease of more Decrease of 51 to Decrease of 50 or No Change or Increase of 50 to Increase of 10 or than 100 100 less Increase of less than 99 more
50
Percent Change
Unweighted MAPE Weighted MAPE
40
Figure 10 Mean Absolute Percent Errors (MAPE) for the April 1 2000 Estimates of the Total Population in School Districts Compared with the Census 2000 Enumerated Population by
Ten-Year Percent Change in the School District Total Population
Decrease of more Decrease of 51 to Decrease of 50 or No Change or Increase of 50 to Increase of 10 or than 100 100 less Increase of less than 99 more
50
Percent Change
261
85
58 46 48
103
126
77
56 42 44
82
00
50
100
150
200
250
300
Mea
n A
bsol
ute
Perc
ent E
rror
Unweighted MAPE Weighted MAPE
41
Mea
n A
bsol
ute
Perc
ent E
rror
Figure 11 Mean Absolute Percent Errors (MAPE) for the April 1 2000 Estimates of the School-Age Population in School Districts Compared with the Census 2000 Enumerated Population
by School District Type 250
196200 188
161
150 138
113
100 88
50
00
Elementary School District Secondary School District Unified School District
School District Type
Unweighted MAPE Weighted MAPE
42
Figure 12 Mean Absolute Percent Errors (MAPE) for the April 1 2000 Estimates of the Total Population in School Districts Compared with the Census 2000 Enumerated Population by
School District Type
Elementary School District Secondary School District Unified School District
School District Type
146
72 78
95
65 65
00
20
40
60
80
100
120
140
160
Mea
n A
bsol
ute
Perc
ent E
rror
Unweighted MAPE Weighted MAPE
43
(leading dot indicates sub-part)
Footnotes
Table 1 Number of School Districts Included and Excluded from Analyses 2000
School District Type
Number of School Districts
Total Population School-Age Population
Total 14310 14310 Included Excluded
Boundary Error in Census 2000 Data Extreme Outliers Associated with Military Base Closures Census 2000 Population Less than 30 (including zero)
14256 54 5 8 4
40
13876 434
5 3 4
425
The figures contain three school districts that qualified twice for exclusion Source US Census Bureau Population Division Internet Release Date June 3 2004
44
Footnotes
Table 2 Mean Algebraic Percent Errors (MALPE) and Standard Deviations of Errors for the April 1 2000 Estimates of the School-Age Population in School Districts Compared with the Census 2000 Enumerated Population by State
State
Number of School Districts Included in
MALPE MALPE Standard Deviation Total 13876 -38 184 Alabama 130 -64 119 Alaska 50 -29 188 Arizona 207 -08 379 Arkansas 310 -53 139 California 956 -10 293 Colorado 176 -84 167 Connecticut 166 -44 119 Delaware 16 -100 132 District of Columbia 1 -135 (X) Florida 67 -46 71 Georgia 183 -61 122 Hawaii 1 -46 (X) Idaho 111 -41 139 Illinois 896 -27 186 Indiana 295 -45 117 Iowa 375 -31 123 Kansas 304 -70 137 Kentucky 178 -24 116 Louisiana 66 -46 62 Maine 247 -54 180 Maryland 24 -66 61 Massachusetts 300 -31 162 Michigan 545 -27 143 Minnesota 347 -14 135 Mississippi 149 -35 99 Missouri 522 -18 165 Montana 358 -50 299 Nebraska 448 -22 269 Nevada 17 -24 95 New Hampshire 174 -51 175 New Jersey 568 -18 180 New Mexico 89 -09 235 New York 686 -83 109 North Carolina 120 02 101 North Dakota 222 -08 235 Ohio 610 -37 126 Oklahoma 544 -35 181 Oregon 183 -03 166 Pennsylvania 501 -32 92 Rhode Island 36 03 114 South Carolina 88 -84 112 South Dakota 175 -41 148 Tennessee 155 -58 131 Texas 1035 -73 203 Utah 38 -78 149 Vermont 249 -53 183 Virginia 137 -62 132 Washington 292 -44 199 West Virginia 55 -14 54 Wisconsin 425 -31 129 Wyoming 49 -51 121
School districts with known boundary errors those affected by military base closures extreme outliers and with less than 30 school-age children enumerated in Census 2000 are excluded from the calculations of the percent errors
(X) Not Applicable Source US Census Bureau Population Division Internet Release Date June 3 2004
45
Footnotes
Table 3 Unweighted and Weighted Mean Absolute Percent Errors (MAPE) and Standard Deviations of Errors for the April 1 2000 Estimates of the School-Age Population in School Districts Compared with the Census 2000 Enumerated Population by State
State
Number of School Districts Included in
MAPE MAPE Standard Deviation
Number of School Districts Included in Weighted MAPE Weighted MAPE
Standard Deviation
Total 13876 129 137 13876 93 5494 Alabama 130 109 80 130 100 6516 Alaska 50 146 121 51 64 3101 Arizona 207 250 285 221 174 9479 Arkansas 310 115 95 310 99 3122 California 956 189 224 988 106 9134 Colorado 176 144 118 176 115 5644 Connecticut 166 95 84 166 77 3811 Delaware 16 117 117 16 101 9590 District of Columbia 1 135 (X) 1 135 (X) Florida 67 66 52 67 40 6477 Georgia 183 104 88 184 97 6771 Hawaii 1 46 (X) 1 46 (X) Idaho 111 108 96 113 89 3196 Illinois 896 134 132 897 112 5425 Indiana 295 94 83 295 101 5840 Iowa 375 96 83 375 83 2883 Kansas 304 120 97 305 138 4512 Kentucky 178 90 77 179 65 3989 Louisiana 66 59 49 66 46 4732 Maine 247 138 127 296 93 2543 Maryland 24 77 47 24 72 8887 Massachusetts 300 110 123 303 86 4843 Michigan 545 109 97 555 99 4530 Minnesota 347 102 89 348 94 4223 Mississippi 149 83 64 149 83 4266 Missouri 522 123 111 522 104 3860 Montana 358 222 206 455 137 2611 Nebraska 448 177 203 590 88 2575 Nevada 17 75 61 17 30 5299 New Hampshire 174 127 131 175 85 3851 New Jersey 568 132 123 572 107 4769 New Mexico 89 160 172 89 73 5790 New York 686 108 83 688 61 4676 North Carolina 120 64 78 121 55 6205 North Dakota 222 174 158 230 101 2255 Ohio 610 97 88 613 101 5352 Oklahoma 544 132 129 545 108 2820 Oregon 183 117 118 198 99 5031 Pennsylvania 501 74 63 502 73 4244 Rhode Island 36 89 69 36 71 4134 South Carolina 88 117 76 91 118 6148 South Dakota 175 117 99 176 84 2460 Tennessee 155 109 93 155 90 4883 Texas 1035 155 149 1040 120 7357 Utah 38 142 89 38 86 6859 Vermont 249 148 119 259 119 2058 Virginia 137 115 90 137 111 6749 Washington 292 146 142 297 94 4687 West Virginia 55 45 33 55 43 2100 Wisconsin 425 99 88 427 81 3488 Wyoming 49 107 75 49 79 2323
School districts with known boundary errors those affected by military base closures extreme outliers and with less than 30 school-age children enumerated in Census 2000 are excluded from the calculations of the percent errors The number of school districts included in the unweighted and weighted statistics differ due to the criteria for excluding school districts with less than 30 school-age children The values for the standard deviations are relatively large due to weighting by the Census 2000 school-age population
(X) Not Applicable Source US Census Bureau Population Division Internet Release Date June 3 2004
46
Footnotes
Table 4 Mean Algebraic Percent Errors (MALPE) and Standard Deviations of Errors for the April 1 2000 Estimates of the Total Population in School Districts Compared with the Census 2000 Enumerated Population by State
State
Number of School Districts Included in
MALPE MALPE Standard Deviation Total 14256 01 163 Alabama 130 -08 104 Alaska 51 -08 141 Arizona 219 -20 356 Arkansas 310 -28 114 California 986 67 339 Colorado 176 -52 143 Connecticut 166 -48 77 Delaware 16 -46 136 District of Columbia 1 -86 (X) Florida 67 -52 58 Georgia 183 -26 83 Hawaii 1 -22 (X) Idaho 113 11 119 Illinois 896 06 132 Indiana 295 003 111 Iowa 375 001 76 Kansas 304 -06 95 Kentucky 178 17 94 Louisiana 66 -10 34 Maine 289 -29 144 Maryland 24 -12 21 Massachusetts 302 -34 109 Michigan 555 -12 111 Minnesota 348 -05 94 Mississippi 149 -17 80 Missouri 522 09 107 Montana 448 37 213 Nebraska 585 51 187 Nevada 17 -11 99 New Hampshire 175 -51 110 New Jersey 569 04 121 New Mexico 89 01 169 New York 688 -17 85 North Carolina 120 -22 68 North Dakota 230 54 134 Ohio 613 -08 115 Oklahoma 545 15 165 Oregon 197 45 193 Pennsylvania 501 -13 73 Rhode Island 36 -52 58 South Carolina 90 -40 112 South Dakota 176 05 97 Tennessee 155 03 115 Texas 1040 -13 209 Utah 38 -15 106 Vermont 259 -48 97 Virginia 137 -14 59 Washington 297 -07 161 West Virginia 55 08 37 Wisconsin 425 -18 82 Wyoming 49 -07 83
School districts with known boundary errors those affected by military base closures extreme outliers and with less than 30 people enumerated in Census 2000 are excluded from the calculations of the prercent errors
(X) Not Applicable Source US Census Bureau Population Division Internet Release Date June 3 2004
47
Footnotes
Table 5 Unweighted and Weighted Mean Absolute Percent Errors (MAPE) and Standard Deviations of Errors for the April 1 2000 Estimates of the Total Population in School Districts Compared with the Census 2000 Enumerated Population by State
State
Number of School Districts Included in
MAPE MAPE Standard Deviation
Number of School Districts Included in Weighted MAPE Weighted MAPE
Standard Deviation
Total 14256 91 136 14256 67 10687 Alabama 130 71 76 130 71 12949 Alaska 51 98 101 51 22 4590 Arizona 219 234 268 219 148 23562 Arkansas 310 80 86 310 68 6391 California 986 168 302 986 69 18158 Colorado 176 111 104 176 83 11357 Connecticut 166 72 55 166 61 6532 Delaware 16 91 109 16 99 18600 District of Columbia 1 86 (X) 1 86 (X) Florida 67 57 53 67 48 15283 Georgia 183 61 61 183 63 12089 Hawaii 1 22 (X) 1 22 (X) Idaho 113 72 95 113 73 7812 Illinois 896 85 101 896 70 12458 Indiana 295 69 87 295 68 11563 Iowa 375 50 57 375 52 5794 Kansas 304 61 72 304 100 9855 Kentucky 178 58 76 178 47 8972 Louisiana 66 27 22 66 27 4557 Maine 289 111 96 289 74 4054 Maryland 24 19 15 24 20 5457 Massachusetts 302 72 89 302 55 8870 Michigan 555 81 77 555 84 8144 Minnesota 348 62 71 348 62 7569 Mississippi 149 60 55 149 66 8110 Missouri 522 75 77 522 73 7577 Montana 448 135 169 448 48 4439 Nebraska 585 119 154 585 56 3846 Nevada 17 82 53 17 84 8711 New Hampshire 175 84 88 175 62 6246 New Jersey 569 86 85 569 72 8624 New Mexico 89 115 123 89 69 8733 New York 688 61 61 688 58 6629 North Carolina 120 49 52 120 54 10536 North Dakota 230 103 102 230 62 4596 Ohio 613 74 88 613 80 10559 Oklahoma 545 91 139 545 74 6155 Oregon 197 112 164 197 58 8082 Pennsylvania 501 54 50 501 57 7487 Rhode Island 36 64 44 36 59 7358 South Carolina 90 78 89 90 65 11923 South Dakota 176 65 72 176 57 4298 Tennessee 155 64 95 155 60 13390 Texas 1040 115 174 1040 96 14457 Utah 38 70 81 38 82 13483 Vermont 259 81 72 259 62 3146 Virginia 137 41 44 137 35 6707 Washington 297 111 117 297 76 9368 West Virginia 55 29 24 55 24 4110 Wisconsin 425 60 58 425 51 6596 Wyoming 49 65 52 49 52 4794
School districts with known boundary errors those affected by military base closures extreme outliers and with less than 30 people enumerated in Census 2000 are excluded from the calculations of the percent errors The values for the standard deviations are relatively large due to weighting by the Census 2000 total population
(X) Not Applicable Source US Census Bureau Population Division Internet Release Date June 3 2004
48
Footnotes
Table 6 Mean Absolute Percent Errors (MAPE) for the April 1 2000 Estimates of the Total Population in Two Sets of School Districts Compared with the Census 2000 Enumerated Population by State
State
All School Districts School Districts with Additional
Exclusions Differences between Sets of School
Districts
Number of Districts Included in MAPE MAPE
Number of Districts Included in MAPE MAPE
Number of Districts Included in MAPE MAPE
Total 13876 129 10059 116 3817 13 Alabama 130 109 105 115 25 -06 Alaska 50 146 34 166 16 -21 Arizona 207 250 125 247 82 03 Arkansas 310 115 310 115 0 00 California 956 189 320 130 636 58 Colorado 176 144 166 146 10 -01 Connecticut 166 95 112 83 54 12 Delaware 16 117 16 117 0 00 District of Columbia 1 135 0 (X) (X) (X) Florida 67 66 0 (X) (X) (X) Georgia 183 104 52 139 131 -36 Hawaii 1 46 1 46 0 00 Idaho 111 108 104 109 7 00 Illinois 896 134 406 112 490 22 Indiana 295 94 278 95 17 -01 Iowa 375 96 375 96 0 00 Kansas 304 120 299 121 5 -01 Kentucky 178 90 101 101 77 -11 Louisiana 66 59 4 49 62 10 Maine 247 138 214 134 33 03 Maryland 24 77 0 (X) (X) (X) Massachusetts 300 110 207 91 93 19 Michigan 545 109 523 103 22 06 Minnesota 347 102 345 102 2 00 Mississippi 149 83 115 87 34 -05 Missouri 522 123 447 110 75 12 Montana 358 222 50 202 308 20 Nebraska 448 177 263 120 185 58 Nevada 17 75 0 (X) (X) (X) New Hampshire 174 127 76 98 98 28 New Jersey 568 132 230 104 338 28 New Mexico 89 160 85 161 4 -01 New York 686 108 672 108 14 01 North Carolina 120 64 39 101 81 -37 North Dakota 222 174 185 164 37 10 Ohio 610 97 610 97 0 00 Oklahoma 544 132 431 119 113 13 Oregon 183 117 175 117 8 00 Pennsylvania 501 74 497 74 4 00 Rhode Island 36 89 30 78 6 11 South Carolina 88 117 62 126 26 -09 South Dakota 175 117 170 118 5 -01 Tennessee 155 109 58 98 97 10 Texas 1035 155 996 156 39 -01 Utah 38 142 16 172 22 -30 Vermont 249 148 52 128 197 20 Virginia 137 115 10 106 127 08 Washington 292 146 286 142 6 04 West Virginia 55 45 0 (X) (X) (X) Wisconsin 425 99 366 85 59 14 Wyoming 49 107 41 111 8 -03
School districts with known boundary errors those affected by military base closures extreme outliers and with less than 30 school-age children enumberated in Census 2000 are excluded from the calculations of the percent errors
In addition to the above exclusions school districts with boundaries that are identical to county boundaries Elementary and Secondary School Districts are also excluded from the calculations of the MAPEs
(X) Not Applicable Source US Census Bureau Population Division Internet Release Date June 3 2004
49
Footnotes
Table 7 Mean Absolute Percent Errors (MAPE) for the April 1 2000 Estimates of the Total Population in Two Sets of School Districts Compared with the Census 2000 Enumerated Population by State
State
All School Districts School Districts with Additional
Exclusions Differences between Sets of School
Districts
Number of Districts Included in MAPE MAPE
Number of Districts Included in MAPE MAPE
Number of Districts Included in MAPE MAPE
Total 14256 91 10141 81 4115 09 Alabama 130 71 105 82 25 -11 Alaska 51 98 35 119 16 -21 Arizona 219 234 137 249 82 -14 Arkansas 310 80 310 80 0 00 California 986 168 320 112 666 56 Colorado 176 111 166 114 10 -03 Connecticut 166 72 112 68 54 05 Delaware 16 91 16 91 0 00 District of Columbia 1 86 0 (X) (X) (X) Florida 67 57 0 (X) (X) (X) Georgia 183 61 52 89 131 -28 Hawaii 1 22 1 22 0 00 Idaho 113 72 106 74 7 -02 Illinois 896 85 406 74 490 11 Indiana 295 69 278 71 17 -02 Iowa 375 50 375 50 0 00 Kansas 304 61 299 61 5 00 Kentucky 178 58 101 79 77 -21 Louisiana 66 27 4 61 62 -34 Maine 289 111 256 113 33 -03 Maryland 24 19 0 (X) (X) (X) Massachusetts 302 72 207 65 95 07 Michigan 555 81 523 76 32 05 Minnesota 348 62 345 60 3 02 Mississippi 149 60 115 66 34 -06 Missouri 522 75 447 73 75 02 Montana 448 135 51 113 397 22 Nebraska 585 119 263 58 322 61 Nevada 17 82 0 (X) (X) (X) New Hampshire 175 84 76 66 99 18 New Jersey 569 86 231 74 338 12 New Mexico 89 115 85 118 4 -02 New York 688 61 674 62 14 -01 North Carolina 120 49 39 78 81 -29 North Dakota 230 103 185 93 45 10 Ohio 613 74 612 72 1 02 Oklahoma 545 91 431 78 114 13 Oregon 197 112 182 103 15 08 Pennsylvania 501 54 497 54 4 00 Rhode Island 36 64 30 57 6 07 South Carolina 90 78 62 81 28 -04 South Dakota 176 65 171 65 5 00 Tennessee 155 64 58 76 97 -12 Texas 1040 115 999 116 41 -01 Utah 38 70 16 105 22 -35 Vermont 259 81 56 84 203 -02 Virginia 137 41 10 86 127 -45 Washington 297 111 290 104 7 06 West Virginia 55 29 0 (X) (X) (X) Wisconsin 425 60 366 56 59 05 Wyoming 49 65 41 67 8 -02
School districts with known boundary errors those affected by military base closures extreme outliers and with less than 30 school-age children enumberated in Census 2000 are excluded from the calculations of the percent errors
In addition to the above exclusions school districts with boundaries that are identical to county boundaries Elementary and Secondary School Districts are also excluded from the calculations of the MAPEs
(X) Not Applicable Source US Census Bureau Population Division Internet Release Date June 3 2004
50
(leading dot indicates sub-part)
Footnotes
Table 8 Mean Absolute Percent Errors (MAPE) and Mean Algebraic Percent Errors (MALPE) for the April 1 2000 Estimates of the School-Age Population in School Districts Compared with the Census 2000 Enumerated Population by School District Characteristics
School District Population
Unweighted Number of School Districts Weighted by the School-Age
Population
Number of Districts
Percent of Districts MAPE MALPE
Number of Districts
(thousands) Percent of Population MAPE
School-Age Children
School District Population 1990
13876 1000 129 -38 52961 1000 93
Under 5000 6163 444 162 -30 2784 53 140 5000 - 9999 2588 187 111 -49 3917 74 116 10000 - 19999 2373 171 102 -54 6961 131 109 20000 - 39999 1464 106 99 -47 8111 153 104 40000 or more
School District Population 2000
1288 93 92 -19 31189 589 79
Under 5000 5830 420 162 -22 2399 45 133 5000 - 9999 2550 184 109 -49 3446 65 106 10000 - 19999 2376 171 102 -54 6176 117 101 20000 - 39999 1636 118 108 -61 8055 152 107 40000 or more
Percent Population Change 1990-2000
1484 107 100 -35 32885 621 83
Decrease of more than 100 1922 139 204 180 1720 32 129 Decrease of 50 to 100 1085 78 78 31 2018 38 84 Decrease of 01 to 50 1405 101 80 09 3999 76 79 Increase of 0 to 49 1516 109 81 -15 4828 91 86 Increase of 50 to 99 1536 111 86 -37 6016 114 73 Increase of 10 or more
Census Division
6363 459 145 -129 34379 649 97
East North Central 2771 200 111 -32 8598 162 101 East South Central 612 44 97 -44 3151 59 86 Middle Atlantic 1755 126 106 -47 7140 135 74 Mountain 1045 75 186 -44 3475 66 113 New England 1172 84 124 -44 2480 47 85 Pacific 1482 107 170 -17 8865 167 102 South Atlantic 691 50 92 -49 9244 175 73 West North Central 2393 172 130 -28 3688 70 101 West South Central
School District Type
1955 141 139 -58 6321 119 107
Area Outside of School Districts 5 004 300 -109 6 001 402 Elementary School District 2405 173 188 15 3201 60 138 Secondary School District 477 34 196 -165 1083 20 161 Unified School District 10989 792 113 -45 48671 919 88
Number of school districts may not sum to total due to additional missing values (1990 census population of zero) Source US Census Bureau Population Division Internet Release Date June 3 2004
51
(leading dot indicates sub-part)
Footnotes
Table 9 Mean Absolute Percent Errors (MAPE) and Mean Algebraic Percent Errors (MALPE) for the April 1 2000 Estimates of the Total Population in School Districts Compared with the Census 2000 Enumerated Population by School District Characteristics
School District Population
Unweighted Number of School Districts Weighted by the Total Population
Number of Districts
Percent of Districts MAPE MALPE
Number of Districts
(thousands) Percent of Population MAPE
Total Population
School District Population 1990
14256 1000 91 01 300417 1000 67
Under 5000 6543 459 116 20 14610 49 96 5000 - 9999 2588 182 73 -14 20907 70 80 10000 - 19999 2373 166 70 -20 38103 127 76 20000 - 39999 1464 103 67 -19 46035 153 72 40000 or more
School District Population 2000
1288 90 64 -12 180762 602 60
Under 5000 6210 436 115 30 12623 42 86 5000 - 9999 2550 179 73 -14 18424 61 72 10000 - 19999 2376 167 70 -22 33913 113 70 20000 - 39999 1636 115 75 -32 45539 152 75 40000 or more
Percent Population Change 1990-2000
1484 104 70 -25 189918 632 63
Decrease of more than 100 1091 77 261 257 5145 17 126 Decrease of 50 to 100 1055 74 85 77 12690 42 77 Decrease of 01 to 50 1799 126 58 45 25774 86 56 Increase of 0 to 49 2404 169 46 21 42704 142 42 Increase of 50 to 99 2091 147 48 -05 61258 204 44 Increase of 10 or more
Census Division
5814 408 103 -81 152846 509 82
East North Central 2784 195 76 -05 49944 166 73 East South Central 612 43 63 -004 17244 57 61 Middle Atlantic 1758 123 67 -09 41342 138 61 Mountain 1149 81 137 03 20206 67 100 New England 1227 86 85 -41 14902 50 59 Pacific 1532 107 147 47 54264 181 68 South Atlantic 693 49 54 -25 51784 172 48 West North Central 2540 178 80 18 19286 64 68 West South Central
School District Type
1961 138 100 -07 31445 105 81
Area Outside of School Districts 10 01 359 101 94 003 13 Elementary School District 2684 188 146 32 21669 72 95 Secondary School District 491 34 72 -12 19664 65 65 Unified School District 11071 777 78 -07 258989 862 65
Number of school districts may not sum to total due to additional missing values (1990 census population of zero) The total population exceeds the total population enumerated in Census 2000 due to overlapping school districts Source US Census Bureau Population Division
Internet Release Date June 3 2004
52
(leading dot indicates sub-part)
Footnotes
Table 10 Number of School Districts and Distribution of the School-Age Population by the Total School District Population 1990 and 2000
Population Size Number of
School Districts Percent of
School Districts School-Age Population
Percent of School-Age Population
1990 Census Total Population 14310 1000 45249989 1000
Total Population Missing 6 004 (X) (X) Less than 5000 6585 460 2585923 57 5000 to 9999 2590 181 3517618 78 10000 to 19999 2373 166 6098283 135 20000 to 39999 1464 102 6944790 153 40000 or more 1292 90 26103375 577
Census 2000 Total Population 14310 1000 53096003 1000
Total Population Missing 7 005 (X) (X) Less than 5000 6252 437 2406420 45 5000 to 9999 2550 178 3446217 65 10000 to 19999 2377 166 6177845 116 20000 to 39999 1637 114 8058266 152 40000 or more 1487 104 33007255 622
(X) Not Applicable Source US Census Bureau Population Division Internet Release Date June 3 2004
53
(leading dot indicates sub-part)
Footnotes
Table 11 Mean Absolute Percent Errors (MAPE) for the April 1 2000 Estimates of the School-Age Population inTwo Sets of School Districts Compared with the Census 2000 Enumerated Population by School District Characteristics
All School Districts School Districts with
Additional Exclusions Differences between Sets
of School Districts Number of Number of Number of
Districts Districts Districts Included in Included in Included in
Population Group MAPE MAPE MAPE MAPE MAPE MAPE School-Age Children
1990 Census Total Population
13876 129 10058 116 3818 13
Under 5000 6163 162 4329 142 1834 21 5000 - 9999 2588 111 2034 102 554 09 10000 - 19999 2373 102 1795 96 578 06 20000 - 39999 1464 99 1050 97 414 03 40000 or more
Census 2000 Total Population
1288 92 850 88 438 05
Under 5000 5830 162 4075 141 1755 22 5000 - 9999 2550 109 2025 101 525 08 10000 - 19999 2376 102 1791 96 585 06 20000 - 39999 1636 108 1190 105 446 03 40000 or more
Percent Change in the School-Age Population 1990-2000
1484 100 977 96 507 04
Decrease of more than 100 1922 204 1318 161 604 44 Decrease of 51 to 100 1085 78 853 71 232 07 Decrease of 50 or less No Change or Increase of less than
1405 80 1087 74 318 06
50 1516 81 1187 76 329 05 Increase of 50 to 99 1536 86 1190 87 346 -01 Increase of 10 or more 6363 145 4423 141 1940 04
School districts with known boundary errors those affected by military base closures extreme outliers and with less than 30 school-age children enumerated in Census 2000 are excluded from the calculations of the percent errors
In addition to the above exclusions school districts with boundaries that are identical to county boundaries Elementary and Secondary School Districts ar e also excluded from the calculations of the MAPEs
Source US Census Bureau Population Division Internet Release Date June 3 2004
54
(leading dot indicates sub-part)
Footnotes
Table 12 Mean Absolute Percent Errors (MAPE) for the April 1 2000 Estimates of the Total Population in Two Sets of School Districts Compared with the Census 2000 Enumerated Population by School District Characteristics
All School Districts School Districts with
Additional Exclusions Differences between Sets
of School Districts Number of Number of Number of
Districts Districts Districts Included in Included in Included in
Population Group MAPE MAPE MAPE MAPE MAPE MAPE Total Population
1990 Census Total Population
14256 91 10140 81 4116 09
Under 5000 6543 116 4411 94 2132 22 5000 - 9999 2588 73 2034 69 554 03 10000 - 19999 2373 70 1795 73 578 -03 20000 - 39999 1464 67 1050 73 414 -05 40000 or more
Census 2000 Total Population
1288 64 850 70 438 -07
Under 5000 6210 115 4157 92 2053 23 5000 - 9999 2550 73 2025 70 525 02 10000 - 19999 2376 70 1791 73 585 -02 20000 - 39999 1636 75 1190 79 446 -04 40000 or more
Percent Change in the Total Population 1990-2000
1484 70 977 77 507 -07
Decrease of more than 100 1091 261 668 191 423 71 Decrease of 51 to 100 1055 85 820 75 235 10 Decrease of 50 or less No Change or Increase of less than
1799 58 1392 54 407 04
50 2404 46 1836 45 568 01 Increase of 50 to 99 2091 48 1489 48 602 01 Increase of 10 or more 5814 103 3935 103 1879 00
School districts with known boundary errors those affected by military base closures extreme outliers and with less than 30 school-age children enumerated in Census 2000 are excluded from the calculations of the percent errors In addition to the above exclusions school districts with boundaries that are identical to county boundaries Elementary and Secondary School Districts ar e also excluded from the calculations of the MAPEs Source US Census Bureau Population Division Internet Release Date June 3 2004
55
(leading dot indicates sub-part)
Footnotes
Table 13 Mean Absolute Percent Errors (MAPE) for the April 1 2000 Estimates of the School-Age Population and Total Population in School Districts Compared with the Census 2000 Enumerated Population by School District Characteristics for School Districts with 1990 Census Populations of 20000 or More
School District Characteristics
School-Age Population Total Population
All School Districts
School Districts with Total
Populations of 20000 or More
All School Districts
School Districts with Total
Populations of 20000 or More
Total 129 96 91 66
Percent Population Change 1990-2000 Decrease of more than 100 204 123 261 153 Decrease of 51 to 100 78 94 85 85 Decrease of 50 or less 80 75 58 52 No Change or Increase of less than 50 81 82 46 39 Increase of 50 to 99 86 68 48 44 Increase of 10 or more 145 105 103 81
Census Division East North Central 111 98 76 75 East South Central 97 92 63 62 Middle Atlantic 106 88 67 57 Mountain 186 117 137 86 New England 124 78 85 52 Pacific 170 116 147 72 South Atlantic 92 82 54 47 West North Central 130 92 80 69 West South Central 139 98 100 79
Type of School District Elementary School District 188 117 146 76 Secondary School District 196 164 72 65 Unified School District 113 89 78 65
School districts with known boundary errors those affected by military base closures extreme outliers and with less than 30 school-age children enumerated in Census 2000 are excluded from the calculations of the percent errors Source US Census Bureau Population Division Internet Release Date June 3 2004
56
(leading dot indicates sub-part)
Footnotes
Table 14 Mean Absolute Percent Errors (MAPE) for the April 1 2000 Estimates of the School-Age Population and Total Population in Two Sets of School Districts Compared with the Census 2000 Enumerated Population for Selected States
All School Districts
School Districts with Identical School District and County
Boundaries Excluded Differences between Sets of
School Districts Number of
Districts Number of Number of Included in Districts Included Districts Included
State MAPE MAPE in MAPE MAPE in MAPE MAPE School-Age Population 13876 129 12944 133 932 -03
Selected States Alabama 130 109 105 115 25 -06 Alaska 50 146 34 166 16 -21 Georgia 183 104 52 139 131 -36 Kentucky 178 90 101 101 77 -11 Louisiana 66 59 4 49 62 10 Mississippi 149 83 115 87 34 -05 North Carolina 120 64 39 101 81 -37 South Carolina 88 117 64 125 24 -08 Tennessee 155 109 92 121 63 -13 Utah 38 142 16 172 22 -30 Virginia 137 115 10 106 127 08
Total Population 14256 91 13324 94 932 -03
Selected States Alabama 130 71 105 82 25 -11 Alaska 51 98 35 119 16 -21 Georgia 183 61 52 89 131 -28 Kentucky 178 58 101 79 77 -21 Louisiana 66 27 4 61 62 -34 Mississippi 149 60 115 66 34 -06 North Carolina 120 49 39 78 81 -29 South Carolina 90 78 66 92 24 -15 Tennessee 155 64 92 80 63 -16 Utah 38 70 16 105 22 -35 Virginia 137 41 10 86 127 -45
School districts with known boundary errors those affected by military base closures extreme outliers and with less than 30 school-age children enumerated in Census 2000 are excluded from the calculations of the percent errors Source US Census Bureau Population Division Internet Release Date June 3 2004
57
(leading dot indicates sub-part)
Footnotes
Table 15 Mean Absolute Percent Errors (MAPE) for the April 1 2000 Estimates of the School-Age Population in Two Sets of School Districts Compared with the Census 2000 Enumerated Population School District Characteristics
All School Districts
School Districts with Identical School District and
County Boundaries Excluded
Differences between Sets of School Districts
Number of Number of Number of Districts Districts Districts
Included in Included in Included in Characteristics of School Districts MAPE MAPE MAPE MAPE MAPE MAPE School-Age Population
1990 Census Total Population
13876 129 12943 133 933 -03
Under 5000 6163 162 6082 163 81 -01 5000 - 9999 2588 111 2428 112 160 -01 10000 - 19999 2373 102 2121 104 252 -02 20000 - 39999 1464 99 1255 105 209 -05 40000 or more
Census 2000 Total Population
1288 92 1057 97 231 -04
Under 5000 5830 162 5757 163 73 -01 5000 - 9999 2550 109 2422 111 128 -01 10000 - 19999 2376 102 2126 104 250 -02 20000 - 39999 1636 108 1421 112 215 -05 40000 or more
Percent Change in the School-Age Population 1990-2000
1484 100 1217 106 267 -06
Decrease of more than 100 1922 204 1818 212 104 -08 Decrease of 51 to 100 1085 78 1007 79 78 -02 Decrease of 50 or less No Change or Increase of less than
1405 80 1282 81 123 -02
50 1516 81 1400 81 116 -002 Increase of 50 to 99 1536 86 1429 87 107 -01 Increase of 10 or more
School District Type
6363 145 6007 151 356 -06
Elementary School District 2405 188 2403 188 2 001 Secondary School District 477 196 477 196 0 00 Unified School District 10989 113 10058 116 931 -03
School districts with known boundary errors those affected by military base closures extreme outliers and with less than 30 school-age children enumerated in Census 2000 are excluded from the calculations of the percent errors Source US Census Bureau Population Division Internet Release Date June 3 2004
58
(leading dot indicates sub-part)
Footnotes
Table 16 Mean Absolute Percent Errors (MAPE) for the April 1 2000 Estimates of the Total Population in Two Sets of School Districts Compared with the Census 2000 Enumerated Population by School District Characteristics
Characteristics of School Districts
All School Districts
School Districts with Identical School District and County
Boundaries Excluded Differences between Sets of
School Districts Number of Districts
Included in MAPE MAPE
Number of Districts Included
in MAPE MAPE
Number of Districts Included
in MAPE MAPE Total Population
1990 Census Total Population
14256 91 13323 94 933 -03
Under 5000 6543 116 6462 116 81 -01 5000 - 9999 2588 73 2428 74 160 -01 10000 - 19999 2373 70 2121 74 252 -04 20000 - 39999 1464 67 1255 73 209 -06 40000 or more
Census 2000 Total Population
1288 64 1057 70 231 -06
Under 5000 6210 115 6137 115 73 -005 5000 - 9999 2550 73 2422 74 128 -01 10000 - 19999 2376 70 2126 74 250 -04 20000 - 39999 1636 75 1421 81 215 -06 40000 or more
Percent Change in the Total Population 1990-2000
1484 70 1217 78 267 -08
Decrease of more than 100 1091 261 1064 266 27 -05 Decrease of 51 to 100 1055 85 1026 86 29 -01 Decrease of 50 or less No Change or Increase of less
1799 58 1716 59 83 -01
than 50 2404 46 2288 47 116 -01 Increase of 50 to 99 2091 48 1936 50 155 -01 Increase of 10 or more
School District Type
5814 103 5293 109 521 -06
Elementary School District 2684 146 2682 146 2 -0001 Secondary School District 491 72 491 72 0 00 Unified School District 11071 78 10140 81 931 -03
School districts with known boundary errors those affected by military base closures extreme outliers and with less than 30 school-age children enumerated in Census 2000 are excluded from the calculations of the percent errors Source US Census Bureau Population Division Internet Release Date June 3 2004
59
POPULATION DIVISION WORKING PAPER SERIES
For copies of these working papers please contact the Statistical Information Staff Population Division Bureau of the Census Washington DC 20233-8800 (301)763-2422popcensusgov
No 1 - The Census Bureau Approach for Allocating International Migration to States Counties and Places 1981-1991 David L Word October 1992
No 2 - Geographic Coding of Administrative Records--Past Experience and Current Research Douglas KSater April 1993
No 3 - Postcensal Population Estimates States Counties and Places John F Long August 1993
No 4 - Evaluating the Passel-Word Spanish Surname List 1990 Decennial Census Post Enumeration Survey Results R Colby Perkins August 1993
No 5 - Evaluation of Postcensal County Estimates for the 1980s Sam T Davis March 1994
No 6 - Metropolitan Growth and Expansion in the 1980s Richard L Forstall and James D Fitzsimmons April 1993
No 7 - Geographic Coding of Administrative Records -- Current Research in ZIPSector-to-County Coding Process Douglas K Sater June 1994
No 8 - Illustrative Ranges of the Distribution of Undocumented Immigrants by State Edward W Fernandez and J Gregory Robinson October 1994
No 9 - Estimates of Emigration of the Foreign-Born Population 1980-l990 Bashir Ahmed and J Gregory Robinson December 1994
No 10 - Estimation of the Annual Emigration of US Born Persons by Using Foreign Censuses and Selected Administrative Data Circa 1980 Edward W Fernandez January 1995
No 11- Using Analytic Techniques to Evaluate the 1990 Census Coverage of Young Hispanics Edward Fernandez May 1995
No 12 - Metropolitan and Nonmetropolitan Areas New Approaches to Geographical Definition Donald C Dahmann and James D Fitzsimmons October 1995
No 13 - Building a Spanish Surname List for the 1990s--New Approach to An Old Problem David L Word and R Colby Perkins Jr February 1996
No 14 - Fertility of American Men Amara Bachu March 1996 60
No 15 - Comparisons of Selected Social and Economic Characteristics Between Asians Hawaiians Pacific Islanders and American Indians (Including Alaskan Natives) Edward W Fernandez June 1996
No 16 - Findings on Questions on Race and Hispanic Origin Tested in the 1996 National Content Survey Prepared in the Population Division by the Racial Statistics Branch and the Ethnic and Hispanic Statistics Branch December 1996
No 17 - Race and Ethnicity Classification Consistency Between the Census Bureau and the National Center for Health Statistics Larry Sink February 1997
No 18 - Results of the 1996 Race and Ethnic Targeted Test May 1997
No 19 - Who RespondsWho Doesnrsquot Analyzing Variation in Mail Response Rates During the 1990 Census David L Word July 1997
No 20 - Trends in Marital Status of US Women at First Birth 1930 to 1994 Amara Bachu March 1998
No 21 - State Estimates of Organized Child Care Facilities Lynne Casper and Martin OrsquoConnell March 1998
No 22 - How Well Does the Current Population Survey Measure the Foreign-Born Population in the United States Dianne Schmidley and J Gregory Robinson April 1998
No 23 - Poverty Family Structure and Child Well-Being Indicators from the SIPP Jason Fields and Kristin Smith April 1998
No 24 - Child Well-Being Indicators from the SIPP Kristin Smith Loretta Bass and Jason Fields April 1998
No 25 - Timing of First Births 1930-34 1990-94 Amara Bachu May 1998
No 26 - Co-Resident Grandparents and Grandchildren Grandparent Maintained Families Lynne Casper and Ken Bryson March 1998
No 27 - Population of the 100 Largest Cities and Other Urban Places in the United States 1790 to 1990 Campbell Gibson June 1998
No 28 - Are There Differences in Voting Behavior Between Naturalized and Native-born Americans Loretta E Bass and Lynne M Casper March 1999
No 29 - Historical Census Statistics on the Foreign-born Population of the United States 1850-1990 Campbell J Gibson February 1999
61
No 30 - Direct Measures of Poverty as Indicators of Economic Need Evidence from the Survey of Income and Program Participation Kurt J Bauman November 1998
No 31 - American Community Survey and Intercensal Population Estimates Where Are the Cross-roads Amy Symens December 1998
No 32 - Womenrsquos Labor Force Attachment Patterns and Maternity Leave A Review of the Literature Kristen Smith and Amara Bachu January 1999
No 33 - Evaluation of Relationship Marital Status and Grandparents Items on the Census 2000 Dress Rehearsal Charles Clark and Jason Fields April 1999
No 34 - Unbinding the Ties Edit Effects of Marital Status on Same Gender Couples Charles Clark and Jason Fields April 1999
No 35 - Racial-Ethnic and Gender Differences in Returns to Cohabitation and Marriage Evidence from the Current Population Survey Philip N Cohen May 1999
No 36 - How Does POSSLQ Measure Up Historical Estimates of Cohabitation Lynne Casper Philip N Cohen and Tavia Simmons May 1999
No 37 - Childlessness Among American Women On the Rise Amara Bachu May 1999
No 38 - Methodology and Assumptions for the Population Projections of the United States 1999 to 2100 Frederick Hollman Tammany Mulder and Jeffrey Kallan January 1999
No 39 - What Do We Know About the Undercount of Children Kirsten K West and J Gregory Robinson August 1999
No 40 - Canceled
No 41 - Canceled
No 42 - Measures of Help Available to Households in Need Their Relationship to Well-Being Welfare and Work Kurt Bauman and Barbara Downs May 2000
No 43 - Have We Reached the Top Educational Attainment Projections of the US Population Jennifer Cheeseman Day and Kurt Bauman May 2000
No 44 - The Emerging American Voter An Examination of the Increase in the Black Vote in November 1998 Avalaura L Gaither and Eric C Newburger June 2000
No 45 - An Analysis of State and County Population Changes by Characteristics 1990-1999 Amy Symens Smith Bashir Ahmed and Larry Sink November 2000
62
No 46 - The Effect of Work and Welfare on Living Conditions in Single Parent Households Kurt Bauman August 2000
No 47 - Canceled
No 48 - Canceled
No 49 - Variations in State Mortality From 1960 to 1990 Monique Oosse September 2003
No 50 - Accuracy of the US Census Bureau National Population Projections and Their Respective Components of Change Tammany Mulder November 2002
No 51 - US Census Bureau Measurement of Net International Migration to the United States 1990 to 2000 Tammany Mulder Frederick Hollmann Lisa Lollock Rachel Cassidy Joseph Costanzo and Josephine Baker February 2002
No 52 - At-Risk Conditions of US School-Age Children Robert Kominski Amie Jamieson and Gladys Martinez June 2001
No 53 - Home Schooling in the United States Trends and Characteristics K J Bauman August 2001
No 54 - Evaluation of the 1990 School District Level Population Estimates Based on the Synthetic Ratio Approach E R Miller September 2001
No 55 - State Estimates of Child Care Establishments 1977-1997 Grace OrsquoNeil and Martin OrsquoConnell August 2001
No 56 - Historical Census Statistics on Population Totals by Race 1790 to 1990 and by Hispanic Origin 1970 to 1990 for the United States Regions Divisions and States Campbell Gibson and Kay Jung September 2002
No 57 - Evaluating Forecast Error in State Population Projections Using Census 2000 Counts Paul Campbell July 2002
No 58 - Evaluating Components of International Migration Estimates of the Foreign-Born Population by Migrant Status 2000 Kevin Deardorff and Lisa Blumerman November 2002
No 59 - Evaluating Components of International Migration Legal Migrants Marc Perry Barbara Van der Vate Lea Auman and Kathy Morris November 2001
No 60 - Evaluating Components of International Migration Temporary (Legal) Migrants Rachel Cassidy and Lucinda Pearson November 2001
63
No 61 - Evaluating Components of International Migration The Residual Foreign Born Joe Costanzo Cynthia Davis Caribert Irazi Daniel Goodkind Roberto Ramirez January 2002
No 62 - Evaluating Components of International Migration Foreign-Born Emigrants Tammany Mulder Betsy Guzmaacuten and Angela Brittingham June 2002
No 63 - Evaluating Components of Internation Migration Native-Born Emigrants Jim C Gibbs Gregory S Harper Marc J Rubin and Hyon B Shin January
2003
No 64 - Evaluating Components of International Migration Migration Between Puerto Rico and the United States Matt Christenson January 2002
No 65 - Evaluating Components of International Migration Quality of Foreign-Born and Hispanic Population Data Art Cresce Roberto Ramirez and Gregory Spencer July 2002
No 66 - Evaluating Components of International Migration Consistency of 2000 Nativity Data Nolan Malone January 2002
No 67 - Evaluation of Census Bureaursquos1995-2025 State Population Projections Ching Li Wang October 2002
No 68 - Guide To International Migration Statistics The Sources Collection and Processing of Foreign-Born Population Data at the US Census Bureau Joseph M Costanzo Cynthia J Davis and Nolan Malone October 2002
No 69 - Seasonality of Moves and Duration and Tenure of Residence 1996 Jason Schachter and Jeffrey Kuenzi December 2002
No 70 - Evaluation of 2000 Subcounty Population Estimates Greg Harper Chuck Coleman and Jason Devine May 2003
No 71 - People Might Move Out but Housing Units Donrsquot An Evaluation of the State and County Housing Unit Estimates Jason Devine and Charles Coleman April 2003
No 72 - Analysis of General Hispanic Responses in Census 2000 Arthur R Cresce and Roberto R Ramirez September 2003
No 73 - Measuring the Foreign-Born Population in the United States With the Current Population Survey 1994-2002 A Dianne Schmidley and J Gregory Robinson October 2003
64
No 74 - Evaluation of April 1 2000 School District Population Estimates Based on the Synthetic Ratio Method Monique Oosse Release Pending
65
- Based on the Synthetic Ratio Method
- I Introduction
- II Methods and Data
-
- A Base Population 1990 Census Data
- B Estimates of Change Over Time April 1 2000 County Pop
- C Standard for Calculating Errors Census 2000 Data
-
- III Results April 1 2000 School District Estimates
-
- A School-Age Population Estimates
- B Total Population Estimates
- C Estimating the Error Attributed to the Synthetic Ratio Me
- D Comparisons with Past Research
-
- IV Evaluation
-
- A 1990 Census Population
- B Census 2000 Population
- C Percent Population Change 1990 ndash 2000
- D Census Divisions
- E Type of School District
- F Errors for School Districts with Total Populations of 20
- G Errors for School Districts that Were Not Coterminous wit
-
- V Conclusion
- Appendix A Identifying Overlapping School Districts
- Appendix B Cohort-Component and Ratio Methods for Calculat
- Appendix C Treatment of 1990 Census and Census 2000 School
- References
- Figure 1
- Figure 2
- Figure 3
- Figure 4
- Figure 5
- Figure 6
- Figure 7
- Figure 8
- Figure 9
- Figure 10
- Figure 11
- Figure 12
- Table 1
- Table 2
- Table 3
- Table 4
- Table 5
- Table 6
- Table 7
- Table 8
- Table 9
- Table 10
- Table 11
- Table 12
- Table 13
- Table 14
- Table 15
- Table 16
- Population Division Working Paper Series
-
Evaluation of April 1 2000 School District Population Estimates
Based on the Synthetic Ratio Method
Abstract
The Department of Education uses school district population estimates in
combination with estimates of the numbers of children in poverty to distribute billions of
dollars in federal funds to school districts This report evaluates the synthetic ratio
method used to produce postcensal school district estimates of the total population and
the school-age population (5 to 17 years) The synthetic ratio method assumes that the
ratio of the school district population to the county population as measured in the most
recent decennial census remains constant throughout the estimate period To evaluate
the method school district population estimates for April 1 2000 are produced from the
1990 census population of school districts and counties and the April 1 2000 county
population estimates The accuracy of the April 1 2000 estimates is measured by
comparison with Census 2000 enumeration data The Mean Algebraic Percent Error
(MALPE) the Mean Absolute Percent Error (MAPE) and the Weighted Mean Absolute
Percent Error are calculated for the school district population estimates The average
errors are calculated for regions states school district types school district population
size in 1990 and 2000 and the percent population change from 1990 to 2000 The results
identify the characteristics of school districts for which the synthetic ratio method
performs relatively well and for which the method appears to generate biased estimates
i
Table of Contents
I Introduction 1 II Methods and Data 3
A Base Population 1990 Census Data 5 B Estimates of Change Over Time April 1 2000 County Population Estimates 6 C Standard for Calculating Errors Census 2000 Data 7
III Results April 1 2000 School District Estimates 9 A School-Age Population Estimates 10 B Total Population Estimates 11 C Estimating the Error Attributed to the Synthetic Ratio Method 12 D Comparisons with Past Research 13
IV Evaluation 14 A 1990 Census Population 14 B Census 2000 Population 16 C Percent Population Change 1990 ndash 2000 17 D Census Divisions 18 E Type of School District 20 F Errors for School Districts with Total Populations of 20000 or More 22 G Errors for School Districts that Were Not Coterminous with County Boundaries 22
V Conclusion 24 Appendix A Identifying Overlapping School Districts 25 Appendix B Cohort-Component and Ratio Methods for Calculating April 1 2000 County Estimates 27 Appendix C Treatment of 1990 Census and Census 2000 School District Files 29 References 31
Figures
Figure 1 Unweighted and Weighted Mean Absolute Percent Errors (MAPE) for the April 1 2000 School District Estimates of the Total and School-Age Populations Estimates Based on April 1 2000 County Estimates and Census 2000 County Enumeration Datahelliphelliphelliphelliphelliphelliphelliphelliphelliphelliphelliphelliphelliphelliphelliphelliphelliphelliphelliphelliphelliphelliphelliphelliphelliphellip32
Figure 2 Mean Algebraic Percent Errors (MALPE) for the April 1 2000 Estimates of the Total Population and School-Age Population in School Districts Compared with the Census 2000 Enumerated Population by School District Size in the 1990 Censushellip33
Figure 3 Mean Absolute Percent Errors (MAPE) for the April 1 2000 Estimates of the School-Age Population in School Districts Compared with the Census 2000 Enumerated Population by School District Size in the 1990 Censushelliphelliphelliphellip34
Figure 4 Mean Absolute Percent Errors (MAPE) for the April 1 2000 Estimates of the Total Population in School Districts Compared with the Census 2000 Enumerated Population by School District Size in the 1990 Censushelliphelliphelliphelliphelliphelliphelliphelliphelliphelliphelliphellip35
Figure 5 Mean Algebraic Percent Errors (MALPE) for the April 1 2000 Estimates of the Total Population and School-Age Population in School Districts Compared with the Census 2000 Enumerated Population by School District Size in Census 2000helliphelliphellip36
ii
Figure 6 Mean Absolute Percent Errors (MAPE) for the April 1 2000 Estimates of the School-Age Population in School Districts Compared with the Census 2000 Enumerated Population by School District Size in Census 2000helliphelliphelliphelliphellip37
Figure 7 Mean Absolute Percent Errors (MAPE) for the April 1 2000 Estimates of the Total Population in School Districts Compared with the Census 2000 Enumerated Population by School District Size in Census 2000helliphelliphelliphelliphelliphelliphelliphelliphelliphelliphellip38
Figure 8 Mean Algebraic Percent Errors (MALPE) for the April 1 2000 Estimates of the Total and School-Age Populations in School Districts Compared with the Census 2000 Enumerated Population by Ten-Year Percent Change in School District Populationshelliphelliphelliphelliphelliphelliphelliphelliphelliphelliphelliphelliphelliphelliphelliphelliphelliphelliphelliphelliphelliphelliphelliphelliphelliphelliphelliphelliphellip39
Figure 9 Mean Absolute Percent Errors (MAPE) for the April 1 2000 Estimates of the School-Age Population in School Districts Compared with the Census 2000 Enumerated Population by Ten-Year Percent Change in the School District School-Age Populationhelliphelliphelliphelliphelliphelliphelliphelliphelliphelliphelliphelliphelliphelliphelliphelliphelliphelliphelliphelliphelliphelliphelliphelliphelliphelliphelliphelliphellip40
Figure 10 Mean Absolute Percent Errors (MAPE) for the April 1 2000 Estimates of the Total Population in School Districts Compared with the Census 2000 Enumerated Population by Ten-Year Percent Change in the School District Total Populationhelliphellip41
Figure 11 Mean Absolute Percent Errors (MAPE) for the April 1 2000 Estimates of the School-Age Population in School Districts Compared with the Census 2000 Enumerated Population by School District Typehelliphelliphelliphelliphelliphelliphelliphelliphelliphelliphelliphelliphelliphellip42
Figure 12 Mean Absolute Percent Errors (MAPE) for the April 1 2000 Estimates of the Total Population in School Districts Compared with the Census 2000 Enumerated Population by School District Typehelliphelliphelliphelliphelliphelliphelliphelliphelliphelliphelliphelliphelliphelliphelliphelliphellip43
Tables
Table 1 Number of School Districts Included and Excluded from Analyses 2000hellip44 Table 2 Mean Algebraic Percent Errors (MALPE) and Standard Deviations of Errors for
the April 1 2000 Estimates of the School-Age Population in School Districts Compared with the Census 2000 Enumerated Population by Statehelliphelliphelliphelliphelliphelliphelliphelliphelliphelliphelliphellip45
Table 3 Unweighted and Weighted Mean Absolute Percent Errors (MAPE) and Standard Deviations of Errors for the April 1 2000 Estimates of the School-Age Population in School Districts Compared with the Census 2000 Enumerated Population by Statehelliphelliphelliphelliphelliphelliphelliphelliphelliphelliphelliphelliphelliphelliphelliphelliphelliphelliphelliphelliphelliphelliphelliphelliphelliphelliphelliphelliphelliphellip46
Table 4 Mean Algebraic Percent Errors (MALPE) and Standard Deviations of Errors for the April 1 2000 Estimates of the Total Population in School Districts Compared with the Census 2000 Enumerated Population by Statehelliphelliphelliphelliphelliphelliphelliphelliphelliphelliphelliphelliphelliphellip47
Table 5 Unweighted and Weighted Mean Absolute Percent Errors (MAPE) and Standard Deviations of Errors for the April 1 2000 Estimates of the Total Population in School Districts Compared with the Census 2000 Enumerated Population by Statehellip48
Table 6 Mean Absolute Percent Errors (MAPE) for the April 1 2000 Estimates of the School-Age Population in Two Sets of School Districts Compared with the Census 2000 Enumerated Population by Statehelliphelliphelliphelliphelliphelliphelliphelliphelliphelliphelliphelliphelliphelliphelliphelliphelliphelliphellip49
iii
Table 7 Mean Absolute Percent Errors (MAPE) for the April 1 2000 Estimates of the Total Population in Two Sets of School Districts Compared with the Census 2000 Enumerated Population by Statehelliphelliphelliphelliphelliphelliphelliphelliphelliphelliphelliphelliphelliphelliphelliphelliphelliphelliphelliphelliphellip50
Table 8 Mean Absolute Percent Errors (MAPE) and Mean Algebraic Percent Errors (MALPE) for the April 1 2000 Estimates of the School-Age Population in School Districts Compared with the Census 2000 Enumerated Population by School District Characteristicshelliphelliphelliphelliphelliphelliphelliphelliphelliphelliphelliphelliphelliphelliphelliphelliphelliphelliphelliphelliphelliphelliphelliphelliphelliphelliphelliphellip51
Table 9 Mean Absolute Percent Errors (MAPE) and Mean Algebraic Percent Errors (MALPE) for the April 1 2000 Estimates of the Total Population in School Districts Compared with the Census 2000 Enumerated Population by School District Characteristicshelliphelliphelliphelliphelliphelliphelliphelliphelliphelliphelliphelliphelliphelliphelliphelliphelliphelliphelliphelliphelliphelliphelliphelliphelliphelliphelliphellip52
Table 10 Number of School Districts and Distribution of the School-Age Population by the Total School District Population 1990 and 2000helliphelliphelliphelliphelliphelliphelliphelliphelliphelliphelliphelliphellip53
Table 11 Mean Absolute Percent Errors (MAPE) for the April 1 2000 Estimates of the School-Age Population in Two Sets of School Districts Compared with the Census 2000 Enumerated Population by School District Characteristicshelliphelliphelliphelliphelliphelliphelliphellip54
Table 12 Mean Absolute Percent Errors (MAPE) for the April 1 2000 Estimates of the Total Population in Two Sets of School Districts Compared with the Census 2000 Enumerated Population by School District Characteristicshelliphelliphelliphelliphelliphelliphelliphelliphelliphelliphellip55
Table 13 Mean Absolute Percent Errors (MAPE) for the April 1 2000 Estimates of the School-Age Population and Total Population in School Districts Compared with the Census 2000 Enumerated Population by School District Characteristics for School Districts with 1990 Census Populations of 20000 or Morehelliphelliphelliphelliphelliphelliphelliphelliphelliphellip56
Table 14 Mean Absolute Percent Errors (MAPE) for the April 1 2000 Estimates of the School-Age Population and Total Population in Two Sets of School Districts Compared with the Census 2000 Enumerated Population for Selected Stateshelliphelliphelliphelliphelliphelliphelliphellip57
Table 15 Mean Absolute Percent Errors (MAPE) for the April 1 2000 Estimates of the School-Age Population in Two Sets of School Districts Compared with the Census 2000 Enumerated Population by School District Characteristicshelliphelliphelliphelliphelliphelliphelliphellip58
Table 16 Mean Absolute Percent Errors (MAPE) for the April 1 2000 Estimates of the Total Population in Two Sets of School Districts Compared with the Census 2000 Enumerated Population by School District Characteristicshelliphelliphelliphelliphelliphelliphelliphelliphelliphelliphellip59
Population Division Working Paper Serieshelliphelliphelliphelliphelliphelliphelliphelliphelliphelliphelliphelliphelliphelliphelliphellip60
iv
I Introduction
Each year the United States Department of Education (DOE) distributes more
than seven billion dollars to public school districts in order to supplement programs for
educationally disadvantaged children Prior to 1997 distributions to school districts
made under Title 1 of the Elementary and Secondary Education Act were based on the
number of school-age children in poverty as enumerated in the most recent decennial
census The funds were distributed to counties and then the county funds were
distributed to school districts by state governments Along with other changes enacted
for the 1997-1998 school year Congress mandated that the DOE distribute Title 1 funds
directly to school districts based on intercensal updates of the estimated number of
school-age children in poverty
The Census Bureau was given the task of conducting research and updating
estimates of the number of poor school-age children between decennial censuses The
Population Division is responsible for the production of the population estimates and the
Small Area Income and Poverty Estimates (SAIPE) Program produces estimates of the
number of poor school-age children by school district This report evaluates the current
methodology used to create intercensal estimates of the school district population
The 1996 and 1998 school district estimates were produced using a synthetic ratio
method This approach was used to calculate both the total and school-age (5 to 17
years) populations by school district Though the synthetic ratio method makes efficient
use of easily available data there are some concerns about the accuracy of the estimates it
produces and the assumptions it requires Inherent to the synthetic ratio method is the
assumption that the ratio of a school district population to the corresponding county
population remains constant over time To the extent that a school district population
grows or declines at different rates than that of the county or counties in which the school
district lies the estimate will be erroneous The impact of this assumption and related
biases becomes greater for dates further from the decennial census used as the base
population for the estimates Inaccuracies in the county population estimates are also
incorporated into the school district estimates
1
Miller (2001) evaluated the synthetic ratio method by calculating April 1 1990
school district population estimates from 1980 census data and April 1 1990 county
estimates The April 1 1990 school district estimates were compared with the school
district populations enumerated in the 1990 census to determine the accuracy and biases
of the synthetic ratio method The largest proportional errors occurred for small school
districts districts with the highest and lowest poverty rates and districts with the highest
and lowest growth rates
This report continues the effort to evaluate the results of the synthetic ratio
method by producing April 1 2000 school district population estimates based on the
1990 census and April 1 2000 county estimates These estimates were compared to the
school district populations enumerated in Census 2000 Section II describes the synthetic
ratio method and assumptions and the data used to produce and evaluate the school
district population estimates Section III presents the estimate results and calculates the
amount of error attributable to the county estimates and the amount of error attributable
to the synthetic ratio method and related assumptions Section IV evaluates the level of
error associated with school district size growth geographic region and district type
Section V summarizes the findings from this evaluation indicating where the synthetic
ratio method was fairly accurate and where other methods may need to be developed in
order to improve the estimates
2
II Methods and Data
The synthetic ratio method calculates the population in school districts by
assuming that the ratio of the school district population to the county population remains
constant over time In other words the populations of all school districts or portions of
school districts within a county (referred to as ldquoschool district piecesrdquo) change at the
same rate The method requires county and school district level census data as the
starting population and county population estimates for the time period of interest The
synthetic ratio method does not employ a time-sensitive rate of change so the method
can be applied to any time interval without special treatment
The county population estimates used to calculate the changes in the school
district populations are produced annually using a cohort-component method The
cohort-component method begins with the most recent census population by county and
adds or subtracts estimates of four components of population change as calculated for the
estimate time period Births deaths and net internal and international migration are
calculated from various administrative records To the degree that the assumptions
associated with county estimates methodology and coverage in the data sources are
inaccurate the school district estimates will be similarly biased
Using the 1990 census population counts and April 1 2000 county estimates the
estimated total population in school districts was calculated with the following ratio
P sd 2000 = P sd 1990 P ct 2000 P ct 1990
Where
P sd 2000 = total population estimated for each school district piece for April 1
2000
P sd 1990 = total population enumerated for each school district piece in the 1990
census
P ct 2000 = total estimated county population for April 1 2000 for the county in
which the school district piece lies
3
P ct 1990 = total county population enumerated in the 1990 census for the county in
which the school district piece lies
Using the 1990 census population counts and April 1 2000 county estimates the
estimated school-age (5 to 17 years) population in school districts was calculated with the
following ratio
C sd 2000 = C sd 1990 C ct 2000 C ct 1990
Where
C sd 2000 = estimated school-age population for each school district piece for April
1 2000
C sd 1990 = school-age population enumerated for each school district piece in the
1990 census
C ct 2000 = estimated school-age population by county for April 1 2000 for the
county in which the school district piece lies
C ct 1990 = school-age population by county enumerated in the 1990 census for the
county in which the school district piece lies
The ratios of school district piece populations to county populations in 1990 were
applied to each April 1 2000 county estimate to calculate April 1 2000 preliminary
population estimates for school district pieces These preliminary estimates were
rounded and the sums were controlled to equal the April 1 2000 county population
estimates as conventional in the Population Divisionrsquos Population Estimates Branch
(PEB) products and as described in Appendix A
To calculate total population estimates for school districts that cross county
boundaries the school district piece estimates were summed by school districts These
sums are essentially weighted averages of the population change in the relevant counties
weighted by the school district piece populations and applied to the school district base
populations
4
A Base Population 1990 Census Data
Estimating the population in school districts is complicated by a number of
factors First school districts boundaries usually do not match the boundaries of other
governmental units such as counties or cities for which data are readily available
School districts may cross county and other place boundaries or serve only portions of
counties or places Second school districts may annex new territory lose territory open
or close resulting in changes to school district boundaries over time Third some school
districts overlap and share the same pieces of land because the districts serve only limited
grade ranges Each of these issues is addressed by the treatment of the 1990 census data
used as the base population for the April 1 2000 school district population estimates
In order to evaluate the synthetic ratio approach with the most consistent data
available the starting school district populations from the 1990 census data were
tabulated by the Geography Division according to 1999-2000 school district boundaries
These school district boundaries were combined with county boundaries to create
separate population counts for each portion of a school district in each county These are
referred to as ldquoschool district piecesrdquo in this report In addition to portions of school
districts in each county there are some areas of land for which there are no school
districts Population counts for these geographies were also included in the 1990 census
data used in this evaluation and were tabulated by state and county
Where school districts serve only limited grade ranges SAIPE assigned the
school-age population from the 1990 census to a single school district based on the ageshy
to-grade distribution from Current Population Survey (CPS) data (averages of 1988
1989 and 1990 data) For example an Elementary School District (ESD) and Secondary
School District (SSD) share the same geography All children ages 5 to 10 would be
assigned to the ESD all children ages 14 to 17 would be assigned to the SSD and the
children ages 11 to 13 would be divided between the two districts according to the CPS
age-to-grade distributions These children as well as those who reside in non-
overlapping school districts are referred to as ldquorelevant childrenrdquo in this report (US
Census Bureau 2002) The process of assigning relevant children ensures that the 1990
data and subsequent estimates of school-age children sum to match county and state
5
totals for the population ages 5 to 17 School-age children were assigned to overlapping
school districts in this manner for 223 percent of school districts in the 1990 census data
This same process of assigning relevant children cannot be used to assign the total
population to only one school district as the logic of assigning non-school-age people to a
particular grade range does not apply Consequently overlapping school districts may
count the same total population more than once and the 1990 census data and subsequent
estimates of the total population will not sum to match county and state totals
B Estimates of Change Over Time April 1 2000 County Population Estimates
The April 1 2000 estimates of the population by counties were produced by the
PEB using a cohort-component methodology These April 1 2000 estimates were
produced in order to evaluate the accuracy of the county estimates produced for the 1990s
by comparing the results with Census 2000 data To calculate postcensal estimates with
the cohort-component method estimates of births and net internal and international
migration were added to the starting 1990 census populations by county and deaths were
subtracted from the census populations These components (births deaths and
migration) were calculated from Internal Revenue Service Immigration and
Naturalization Service and Social Security Administration and birth and death
registration (vital statistics) records for the 10-year time period since the 1990 census
The Administrative Records and Methodology Branch (ARMR) in the Population
Division also produced county population estimates by single years of age (0 to 85) sex
race and Hispanic origin The detailed county estimates were collapsed by sex race and
Hispanic origin into the two sets of county populations required by the school district
estimates the total population and school-age children (5 to 17 years)
A second set of April 1 2000 county estimates was also used to calculate school
district population estimates in the preliminary analyses These county estimates were
created using a ratio methodology Only the cohort-component method will be used for
the post-Census 2000 county estimates and therefore only the school district estimates
based on the cohort-component county estimates are discussed in Sections III and IV of
6
this report Appendix B contains a summary of the findings using the ratio-based April 1
2000 county estimates
C Standard for Calculating Errors Census 2000 Data
Census 2000 enumeration data were used to evaluate the accuracy of the April 1
2000 school district population estimates1 The Census 2000 data were tabulated by
2001-2002 school district boundaries These boundaries closely matched the 1999-2000
boundaries used to tabulate the 1990 census data and subsequent estimates based on those
data Though the 1990 census and Census 2000 files were not exact matches they were
sufficiently similar for the purposes of this research However there were some
differences in the data that required special treatment as described in Appendix C
In addition to using Census 2000 school district data as a standard to evaluate the
accuracy of the synthetic ratio method Census 2000 county populations were used in
place of the April 1 2000 county estimates to produce a set of school district estimates
that do not contain errors due to the county estimates Comparing the two sets of
estimates distinguished the error attributable to the synthetic ratio method and related
assumptions from the error attributable to the county estimates
Both sets of school district estimates (using April 1 2000 county estimates and
Census 2000 county populations) were compared to the Census 2000 school district
populations as enumerated using the Mean Algebraic Percent Error (MALPE) and the
Mean Absolute Percent Error (MAPE) The MALPE is the sum of the percent
differences between each school district estimate and the corresponding Census 2000
population as enumerated divided by the number of school districts Positive mean
algebraic percent errors indicate overestimation of the school district populations on
average and negative errors indicate underestimation of the school district populations
The MAPE is computed in a similar manner except that the numerator is the sum of the
absolute percent differences between the estimates and the Census 2000 values The
MAPE measures the overall accuracy of the estimates Weighted MAPEs were also
1 Census 2000 population data include modifications as documented in the Count Question Resolution program updates from the Boundary and Annexation Survey and geographic program revisions
7
calculated to account for the size of the school district populations (total or school-age) in
Census 2000 MALPEs and MAPEs were only computed for school districts with total
or school-age populations of 30 or more in Census 2000 because population estimates for
smaller numbers are particularly unreliable
8
III Results April 1 2000 School District Estimates
As noted above the school district estimates were compared with the Census
2000 school district populations as enumerated (see Footnote 1) by calculating the Mean
Algebraic Percent Errors (MALPEs) and Mean Absolute Percent Errors (MAPEs) The
synthetic ratio method produced estimates for a few school districts with very large errors
that had very large effects on the MALPEs and MAPEs (ie one school district estimate
was 52 times larger than the Census 2000 population) Therefore various subsets of
school districts were tested to determine which allowed for the most useful analyses and
still allowed for the inclusion of as many school districts as possible
In addition to excluding school districts with Census 2000 populations (total or
school-age) of less than 30 and those with boundary errors from the calculations of the
MALPEs and MAPEs (see Appendix C) school districts were excluded for two other
reasons First 8 extreme outliers defined as estimates that are 90 percent smaller or 5
times larger than the Census 2000 populations were omitted from the statistics for the
total population because they distorted the unweighted MAPEs and MALPEs to such a
degree that they lost meaning Three extreme outliers were omitted from the MAPE and
MALPE calculations for the school-age population (see Table 1) Second four school
districts (two in Alaska and one each in Alabama and Maine) with extremely large errors
and population changes associated with military base closures were excluded from the
analyses Omitting these outliers appeared justified since county population estimates
may appropriately account for population changes due to military base closures but they
cannot account for population redistribution within counties
The MALPE and MAPE statistics were also calculated for a subset of school
districts that contained populations of 100 or more but this restriction did not noticeably
improve the estimates over omitting just the extreme outliers The latter option was
selected since it allowed a larger number of school districts to be retained in the analyses
With these omissions the analyses were performed on 14256 (996 percent of 14310)
school districts for the total population and 13876 (970 percent of 14310) school
districts for the school-age population Though the analyses are more meaningful with
these omissions it is still important to consider outliers when developing alternative
9
methods for estimating school district populations because these are the school districts
for which improved estimates would be most valuable
A School-Age Population Estimates
Table 2 shows the MALPEs for the school-age population estimates by state The
school district population was underestimated by 38 percent on average for the nation
and was underestimated in 48 states and the District of Columbia The District of
Columbia as a single school district was underestimated by 135 percent followed by
Delaware at 100 percent North Carolina and Rhode Island were the only states for
which the average error was overestimated but only at 02 and 03 percent respectively
Table 2 also includes standard deviations for the MALPEs which indicate the spread of
the errors The estimates for Texas California Arizona and New Mexico had
relatively large standard deviations The difficulties with estimating the school district
populations in these states is likely due to the areas with large population growth during
the 1990s (see Section IVC below) Standard deviations were also relatively large for
Montana Nebraska and North Dakota states that contain school districts with relatively
small populations which are associated with large errors (see Section IVA and IV B
below) States such as Maryland Florida Louisiana and West Virginia had the smallest
standard deviations for the errors probably because most or all of the school district
boundaries in these states are coterminous with county boundaries Consequently most
of the errors for the school districts in these states were identical to the errors in the
county population estimates and no additional error was added by the synthetic ratio
method Also these errors tend to apply to larger populations than in most other school
districts and larger school districts generally have smaller errors (see Section IVA and
IVB below)
Table 3 shows unweighted and weighted MAPEs for the school-age population
These figures average absolute errors and are consistent with the MALPEs The MAPE
for the United States was 129 percent ranging from 45 percent for West Virginia to
250 percent for Arizona As with the MALPEs the MAPEs were highest for states that
experienced rapid growth in the 1990s (Texas New Mexico California and Arizona)
10
and for states with smaller school district populations (North Dakota Nebraska and
Montana) Texas New Mexico and Arizona were also among the states with the largest
MAPEs for the county estimates (Blumerman and Christenson 2002) but the MAPE for
California was relatively small This suggests that though the accuracy of the county
estimates has an impact on the accuracy of the school district estimates the synthetic
ratio method and assumptions also have relatively large effects
Weighting the MAPEs by the Census 2000 school-age population generally
reduces the levels of the MAPEs compared with the unweighted MAPEs (see Table 3)
The weighted MAPE for the United States was 93 percent ranging from 30 percent for
Nevada to 174 percent for Arizona Weighting the MAPEs substantially reduces the
average errors for states with some of the largest unweighted MAPEs such as North
Dakota Nebraska California Texas Montana and Arizona This supports the
conclusion that small school districts in some of these states tend to have relatively large
errors
B Total Population Estimates
Table 4 shows the mean percent errors between the estimated April 1 2000 total
school district population and Census 2000 enumerated data On average the school
district estimates were 01 percent too high for the nation The MALPEs for the total
population estimates ranged from ndash86 percent for Washington DC to 67 percent for
California The total population of school districts was underestimated on average for 33
states and the District of Columbia and overestimated on average for 17 states As with
the school-age population the standard deviations of the errors for the total population
estimates were largest for Arizona Texas Montana Nebraska and California Some of
the states with the smallest standard deviations like Rhode Island North Carolina
Louisiana and West Virginia had relatively low population growth in the 1990s and
others like Virginia Maryland and Florida contain school district boundaries that are
coterminous with county boundaries
For the nation the unweighted MAPE for the estimates of the total population is
91 percent and the weighted MAPE was 67 percent (see Table 5) The unweighted
MAPEs for the estimates of the total population in school districts ranged from 19
11
percent for Maryland to 234 percent for Arizona California (168 percent MAPE) and
Arizona contained more outliers than the other states but many were still retained in the
analyses because the school districts did not meet the strict criteria to be excluded as
extreme outliers The average size of the errors was greatly reduced when weighting by
the Census 2000 school district population indicating that the estimates for larger school
districts tend to be more accurate than those for smaller school districts (see Sections
IVA and IV B)
C Estimating the Error Attributed to the Synthetic Ratio Method
One element of the synthetic ratio formula is a postcensal estimate of the county
population for the time period of interest County estimates contain errors from the input
data methodology and assumptions that are introduced into the school district estimates
To evaluate the impact of the errors from the county estimates a set of school district
population estimates was created using Census 2000 county data in place of April 1 2000
county estimates This eliminated the errors attributed to the county estimates from the
school district population estimates The differences between the school district
estimates based on Census 2000 county data and the actual Census 2000 school district
populations were errors due to either differences in coverage and accuracy for the 1990
census and Census 2000 or the synthetic ratio method The differences between the
school district estimates based on Census 2000 county data and the school district
estimates based on April 1 2000 county estimates were errors due to inaccuracies in the
county estimates
Figure 1 shows unweighted and weighted MAPEs for the total and school-age
populations in school districts as estimated from the April 1 2000 county estimates and
from Census 2000 county data For both the total and school-age population estimates
the mean errors for the school district estimates that used Census 2000 county data were
at least three-fourths of the mean errors for the estimates based on April 1 2000 county
estimates This suggests that a relatively large portion of the inaccuracy in the school
district population estimates may be attributed to the synthetic ratio method rather than
errors in the county estimates
12
D Comparisons with Past Research
Miller (2001) evaluated the synthetic ratio method with 1980 Census-based
estimates of the school district population in April 1 1990 using 1990 census data as a
standard For the school-age population the MAPE of 129 percent for the April 1 2000
estimates was an improvement over the MAPE of 169 percent for the April 1 1990
estimates Improvements of similar magnitude occurred for weighted MAPEs 93
percent for the 2000 estimates and 120 percent for the 1990 estimates
For the total population the 2000 estimates had a MAPE of 91 percent more
accurate than the 1990 estimates with a MAPE of 133 percent (Miller 2001) The
weighted MAPE for the 1990 estimates was 96 percent and the weighted MAPE for the
2000 estimates was 67 percent The apparent improvement from the 1980 Census-based
estimates was at least partly due to the increased accuracy of the county estimates for the
1990s compared with the county estimates for the 1980s
The evaluation of the 1980 Census-based estimates for 1990 included only 604
percent of school districts (Miller 2001) while almost all the school districts were
included in the results presented in this report because the 1990 census data were
tabulated by 1999-2000 school district boundaries Though including more school
districts may lead to lower MAPEs when the evaluation was limited to a set of school
districts that was more comparable to the Miller (2001) evaluation2 the mean errors were
even smaller than those described above For the school-age population estimates the
MAPE was 116 percent for the nation ranging from 49 percent for Louisiana (with
only four school districts selected) to 247 percent for Arizona (see Table 6) The MAPE
of the smaller set of school districts for the total population estimates was 81 percent
ranging from 22 percent for Hawaii to 249 percent for Arizona (see Table 7)
2 This subset of school districts excluded Elementary and Secondary School Districts and school districts with boundaries that are coterminous with county boundaries in addition to those described in Appendix C and Section III
13
IV Evaluation
The accuracy of the school district estimates were evaluated for a number of
school district characteristics based on prior research on school district poverty and
population estimates (Miller 2001 National Research Council 2000) Keeping the
characteristics examined consistent allows for comparisons across decades to identify
improvements in estimation methods The accuracy of the school district estimates was
examined for the following characteristics of school districts
A Total census population in 1990
B Total census population in 2000
C Percent change in census population from 1990 to 2000
D Census division and
E School district type
See Tables 8 and 9 for summaries of the MALPEs and MAPEs by these
characteristics of school districts Analyzing the accuracy of the school district estimates
using these characteristics helps determine the types of school districts for which the
synthetic ratio method works relatively well and for the types for which this approach is
problematic Where the accuracy of the school districts estimates differs by geography
size or population change bias in the population estimates may adversely affect the
estimates of the percent of children in poverty (when combined with SAIPErsquos poverty
estimates) and the distribution of Title I federal funds to school districts
A 1990 Census Population
Almost half (460 percent) of school districts had a total population under 5000 in
1990 These school districts accounted for only 57 percent of the school-age population
School districts with 20000 or more people represented 193 percent of all school
districts but contained 730 percent of the school-age children in 1990 (see Table 10)
As larger school districts were more likely to make up larger proportions of the county
14
populations it may be easier to estimate the school district populations for larger school
districts with the synthetic ratio method
Figure 2 shows the MALPEs for the total and school-age populations by the
school district total population size in the 1990 census The synthetic ratio method
consistently underestimated the school-age population for all size categories of school
districts The largest MALPE was for school districts with total populations of 10000 to
19999 which were underestimated by 54 percent
For school districts with less than 5000 people the synthetic ratio method
overestimated the total population by 20 percent The total population was
underestimated for all larger school districts by 12 to 20 percent (MALPEs) This is in
contrast to the findings reported for the 1980 Census-based estimates of the 1990
population where the total population was overestimated for all school districts
particularly the largest and smallest (Miller 2001) The differences were likely due to
differences in errors for the county estimates across decades where the county population
estimates were too high for the 1980s and too low for the 1990s (Blumerman and
Christenson 2002)
Figure 3 presents the unweighted and weighted MAPEs for the estimates of the
school-age populations by the school district size in 1990 Similar to the results found in
the previous work (Miller 2001) the unweighted error for school districts with less than
5000 people (162 percent) is about 50 percent higher than the errors for larger school
districts (ranging from 92 to 111 percent) Weighting the MAPEs by the school-age
population in Census 2000 somewhat reduced the differences in errors across size
categories but there was still a steady decline in average errors with increasing school
district size Figure 4 shows similar results for the total population estimates the larger
the school districts the smaller the average errors
The school-age population estimates had larger errors (MALPEs and MAPEs)
than for the total population which suggests that it is more difficult to correctly distribute
the population by age within counties (and consequently school districts) than to estimate
the total county (and school district) populations
15
B Census 2000 Population
Of the 14310 school districts 6252 (437 percent) had total populations of less
than 5000 in Census 2000 a decline from 460 percent in 1990 (see Table 10) These
school districts accounted for only 45 percent of the school-age population School
districts with 20000 or more people represented 218 percent of all school districts but
contained 773 percent of the school-age children in 2000 Both the proportion of large
school districts and the proportion of children in those districts were higher in Census
2000 than in the 1990 census
Not surprisingly the relationship between the size of the school districts in 2000
and the size of the average errors was similar to that for the size of the school districts in
1990 Figure 5 shows that the school-age population was underestimated in all sizes of
school districts ranging from -22 percent for school districts with under 5000 people to
ndash61 percent for school districts with 20000 to 39999 people The total population was
overestimated by 30 percent for school districts with less than 5000 people and was
underestimated for all other school district size categories by 14 percent to 32 percent
The unweighted MAPEs for the school-age population were almost two-thirds
higher for school districts with less than 5000 people than for larger school districts (see
Figure 6) Weighting the MAPEs by the school-age population in Census 2000 reduced
the average errors for both the largest and smallest school districts but changed the
MAPE values for the other size categories very little The smallest school districts also
had the largest unweighted MAPEs for the total population 115 percent for school
districts with populations under 5000 and 70 to 75 percent for the larger school districts
(see Figure 7) As with the school-age population the differences in average errors by
school district size were substantially reduced when weighted by population These
findings suggest that smaller school districts may need special treatment in future school
district estimates and research
The relationship between school district size and average errors was similar to
that found for county size and average errors When April 1 2000 county estimates were
compared with the Census 2000 results larger counties tended to have lower MAPEs
This was also true when comparing April 1 1990 estimates with the 1990 census data
(Blumerman and Christenson 2002) The similarities may be due to both the nature of
16
creating population estimates and the inclusion of county estimates in the calculation of
school district population estimates
C Percent Population Change 1990 ndash 2000
The differences in the accuracy of the estimates for the total and school-age
populations in school districts by the percent of population change from 1990 to 2000 are
striking Figure 8 shows that for school districts with school-age population declines of
more than 10 percent the estimates of the school-age population were on average too
high (MALPE of 180 percent) The estimates for school districts with population
increases of 10 percent or more were on average 129 percent too low The synthetic
ratio method overestimated by 257 percent (MALPE) the total population for school
districts with more than a ten percent decline in population in the 1990s The school
districts that experienced total population declines of 5 percent to 10 percent were
overestimated by 77 percent School districts with population increases of 10 percent or
more were underestimated by 81 percent For school districts with more moderate
population changes (decreases up to 5 percent through increases up to 10 percent) the
synthetic ratio method performed relatively well with MALPEs of ndash05 percent to 45
percent for the total population and ndash37 percent to 09 percent for the school-age
population
The unweighted MAPE for school districts with declines in the school-age
population of 10 percent or more was 204 percent (see Figure 9) The next largest
MAPE was for school districts with population increases of 10 percent or more (145
percent) For the school districts with changes of 10 percent or less the MAPEs show
that the average errors were about the same (78 to 86 percent) Weighting the MAPEs
again reduced the differences among the categories of population change but still shows
that the largest errors occurred for the school districts with the largest percent changes
For school districts where the total population declined by more than 10 percent
between 1990 and 2000 the MAPE was 261 percent for the total population estimates
over twice the mean errors for school districts that experienced population declines of
less than ten percent or population growth (ranging from 46 percent to 103 percent see
17
Figure 10) The second largest MAPE was for school districts with population increases
of ten percent or more (103 percent) Weighting the MAPEs with the Census 2000
population reduced the MAPE for school districts with the largest population declines by
over half to 126 percent
The synthetic ratio method does not perform well when estimating school districts
with extreme population changes though the errors are attributed partly to errors in the
county estimates This was also true when comparing April 1 2000 county estimates
with Census 2000 data Counties with the largest percent population change from 1990
to 2000 whether growth or decline had the largest MAPEs (Blumerman and Christenson
2002) These findings demonstrate how the assumption that school district populations
change at the same rates as the counties in which they lie fails to capture large population
changes and redistribution within these counties These results also suggest that small
school districts with relatively large population changes are among the most difficult to
estimate accurately
D Census Divisions
As described above (Sections IIIA and IIIB) the school district population can
be difficult to estimate for states with relatively large population changes such as
California Arizona New Mexico and Texas States with many small school districts
and relatively small school district populations such as Nebraska North Dakota and
Montana also had relatively large errors when comparing the estimates to the Census
2000 standard (see Tables 2 through 5)
Tables 8 and 9 summarize differences in the accuracy of the school district
population estimates by Census Division3 The estimates produced with the synthetic
ratio method underestimated the school-age population in all divisions particularly in the
3 Census Regions and Divisions are the Northeast Region New England ndash Maine New Hampshire Vermont Massachusetts Rhode Island and Connecticut Middle Atlantic ndash New York New Jersey and Pennsylvania Midwest Region East North Central ndash Ohio Indiana Illinois Michigan and Wisconsin West North Central ndash Minnesota Iowa Missouri North Dakota South Dakota Nebraska and Kansas South Region South Atlantic ndash Delaware Maryland District of Columbia Virginia West Virginia North Carolina South Carolina Georgia and Florida East South Central ndash Kentucky Tennessee Alabama and Mississippi West South Central ndash Arkansas Louisiana Oklahoma and Texas West Region Mountain ndash
18
south and east (West South Central South Atlantic Middle Atlantic New England and
East South Central Divisions) but also in the Mountain Division The total population
was underestimated in the New England and South Atlantic Divisions and overestimated
in the West North Central and Pacific Divisions The mean errors were quite small for
the other five Census Divisions The relatively small differences across Divisions were
likely due to the effects of combining many sizes of school districts with large ranges of
population changes into single categories
Consistent with the findings for individual states the Pacific and Mountain
Divisions had the largest MAPEs for the total and school-age population estimates
These Divisions include the states of Arizona Colorado Idaho Nevada New Mexico
Oregon Utah and Washington some of the fastest growing states during the 1990s The
smallest MAPEs were in the South Atlantic and East South Central Divisions which
contain some of the states with the slowest growth in the past decade as well as five of
the states for which most or all of the school district boundaries were identical to county
boundaries The states with coterminous county and school district boundaries have
lower errors on average because the county population estimates were more accurate than
the school district estimates Weighting the errors by population greatly reduced the
differences in the errors by Census Division
Similar to what was found with the bias associated with the percent change in
school districts from 1990 to 2000 Census Divisions that experienced the largest
population growth from 1990 to 2000 contained school districts whose populations were
the most difficult to estimate accurately These findings suggest that the synthetic ratio
method may yield school district population estimates of acceptable accuracy for most
states and Census Divisions The development of alternative methodology could focus
on the fastest changing areas
Montana Idaho Wyoming Colorado New Mexico Arizona Utah Nevada Pacific ndash Washington Oregon California Alaska and Hawaii
19
E Type of School District
This report attempts to determine the limits of the synthetic ratio method for
estimating the population in school districts and it may prove useful to determine
whether the method produces estimates that differ in accuracy by types of school
districts Of the 13876 school districts included in statistics for the estimated school-age
populations 173 percent were Elementary School Districts (ESDs) 34 percent were
Secondary School Districts (SSDs) and 792 percent were Unified School Districts
(USDs see Table 8) The distribution was similar for the 14256 school districts included
in the statistics for the estimates of the total population 188 percent were ESDs 34
percent were SSDs and 777 percent were USDs (see Table 9)
There were also five areas outside of school districts for which the school-age
population size was large enough (30 people or more) to be included in the evaluation
statistics discussed above For the estimates of the total population there were ten areas
outside of school districts that met the minimum size criteria and were included in the
analyses presented in this report However when MALPEs and MAPEs were calculated
separately by school district type the interpretation is limited for these areas outside
school districts because only five or ten observations were used For example the
school-age population was underestimated by 109 percent (MALPE) and the total
population for areas outside school districts was overestimated by 101 percent The
unweighted MAPEs had even more extreme average errors of 300 percent for the school-
age population and 359 percent for the total population As these errors for the areas
outside of school districts were relatively large a series of MALPEs and MAPEs (not
shown) were also calculated for the school district characteristics described above with
the areas outside of school districts excluded The differences between the MALPEs and
MAPEs presented in this paper and for the subset with the areas outside school districts
excluded were negligible for all the evaluation characteristics
The MALPEs in Table 8 show that the school-age population was overestimated
for ESDs by 15 percent underestimated by 165 percent for SSDs and underestimated
by 45 percent for USDs The differences in mean errors were much smaller for the total
20
population which was overestimated by 32 percent for ESDs and underestimated for
SSDs and USDs by 12 percent and 07 percent respectively
The MAPE for the estimates of the school-age populations were almost 50
percent higher for the ESDs and SSDs than for the USDs (see Figure 11) These
differences remained after weighting by the school-age population In contrast the
MAPE for the ESDs for the total population estimates was about two times higher (146
percent) than those for the SSDs (72 percent) and the USDs (78 percent) (see Figure
12) These differences were smaller for weighted MAPEs (95 percent for ESDs and 65
percent for both SSDs and USDs) but still show that the estimates were least accurate for
the Elementary School Districts
One reason the errors were higher for the ESDs and SSDs may be that the average
population in Census 2000 was at least twice as large for USDs as for ESDs and SSDs
(1196 for ESDs 2206 for SSDs and 4406 for USDs) As shown in Sections IVA and
IVB above estimates for school districts with smaller populations tended to be less
accurate In addition the SSD mean errors apply to the smallest number of school
districts (477 for the school-age population and 491 for the total population) so outliers
would have greater effects on the errors The underestimation of the older population of
children (including 12 to 17 year olds) may be because there was a relatively large
immigrant population which was underestimated for this age group in the county
estimates for the 1990s
The results also indicate that there may be some differences in the age-to-grade
distributions used to assign relevant children to overlapping school districts The
assignment of relevant children to school districts in the 1990 census starting population
was based on averages of 1988-1990 CPS data In the Census 2000 standard used for the
evaluation relevant children were assigned to school districts based on Census 2000
sample data by sex race Hispanic origin and Census Region It is possible that the ageshy
to-grade distributions may have changed over the ten-year period and introduced
additional error into the estimates of Elementary and Secondary School Districts that do
not affect the estimates for children in Unified School Districts
Finally the statistics for the estimates for the total population may be somewhat
skewed because the errors associated with overlapping school districts may be counted
21
more than once in the computation of the MAPEs and MALPEs However there is little
evidence of bias created by including overlapping school districts in the statistics more
than once Tables 11 and 12 show MAPEs for a subset of school districts that includes
only USDs and school districts with boundaries that were not coterminous with county
boundaries The MAPEs demonstrate similar patterns of errors by school district
characteristics with the largest errors for the smallest school districts and for those with
the largest percent changes from 1990 to 2000
F Errors for School Districts with Total Populations of 20000 or More
One of the major conclusions supported by the findings presented above and in
prior work (Miller 2001) is that the synthetic ratio method performs relatively well for
larger school districts In order to further test this finding a set of statistics was
calculated only for the school districts with total populations of 20000 or more Table 13
shows some substantial difference between the MAPEs by school district characteristics
For example the MAPE for the school-age population estimate for school districts with
more than a 10 percent decrease in the total population from 1990 to 2000 was 204
percent for all school districts compared with 123 percent for the subset of larger school
districts Large differences also occurred for the New England West North Central
West South Central Mountain and Pacific Divisions (which contain many of the smaller
school districts) and Elementary School Districts The errors were smaller with only the
larger school districts included for every category except for those with population
declines of 5 percent to 10 percent The ranges of errors across characteristics were
smaller when only the school districts with populations of 20000 or more were included
in the MAPEs supporting the conclusion that the size of the population influences the
size of the errors for all other school district characteristics
G Errors for School Districts that Were Not Coterminous with County Boundaries
Where school district boundaries are identical to county boundaries the errors for
the school district population estimates are due entirely to the errors in the county
22
population estimates by methodological design To determine if including school
districts with boundaries that were coterminous with county boundaries substantially
reduced the mean errors for the school district estimates MAPEs were also calculated
with these school districts excluded All the school districts in Florida Nevada
Maryland and West Virginia were coterminous with county boundaries and Hawaii and
the District of Columbia contained single school districts
Table 14 shows the differences between MAPEs for the two sets of school
districts for the states with the largest differences While most of the errors increased
when coterminous school districts were excluded the MAPEs for the school-age
population for Louisiana and Virginia increased slightly because only a few school
districts were included in the analyses for those two states There were slight increases in
the MAPEs for the school-age and total population by size percent population change
and school district type when the school districts with boundaries identical to county
boundaries were excluded (see Tables 15 and 16) The largest differences were for the
largest school district size categories and for the largest percent changes whether
population growth or decline Not surprisingly the largest changes were for the
categories for which the most school districts were excluded as having boundaries
coterminous with county boundaries
23
V Conclusion
This paper presents school district population estimates created by the synthetic
ratio method using 1990 census data and April 1 2000 county estimates The estimates
of the school-age and total populations in school districts were compared to the Census
2000 school district populations as enumerated to evaluate the accuracy of the estimates
The results show that nationwide most of the differences between the school district
estimates and Census 2000 can be attributed to the synthetic ratio method rather than the
county-level population estimates The largest mean errors were for school districts with
total populations under 5000 school districts with the highest rates of growth and
decline school districts in the Pacific and Mountain Divisions (containing states with the
largest population increases in the 1990s) and Elementary School Districts
These findings suggest that the synthetic ratio method may produce sufficiently
accurate school district population estimates for larger school districts and counties with
relatively moderate population changes Future research should focus on smaller districts
and rapidly changing areas The additional complexity added by the assignment of
relevant children to overlapping school districts can be expected to introduce additional
inaccuracies into the estimates of the school-age population Special treatment of
overlapping school districts particularly Elementary School Districts may also be
required to improve the accuracy of the estimates
24
Appendix A Identifying Overlapping School Districts
When assigning relevant children to school districts in the 1990 census data
SAIPE staff created a variable to indicate whether a county contained overlapping school
districts If a county contained school districts that shared geography and the populations
within that geography the school district populations do not sum to equal the county
populations Knowing when school district populations should sum to match county and
state totals is useful for checking the accuracy of the data files as they are manipulated in
the production of the estimates and for allocating rounding error
When population estimates for one level of geography (ie school district pieces)
are intended to sum exactly to estimates of a higher level of geography (ie counties) it
is conventional in the Population Estimates Branch to allocate (add or subtract) the
rounding error to the area with the largest population in order for the change to have the
least impact on the estimated population distribution When the sums of school district
total populations include people who were counted more than once because school
districts contained overlapping geography it was impossible to accurately calculate
rounding error For counties that included these populations the allocation procedure
could not be applied to the school estimates discussed in this report
The flag created by SAIPE staff (referred to as the ldquooriginal flagrdquo in this report)
indicated that a county contained overlapping school districts if ldquorelevant childrenrdquo were
assigned to overlapping school districts in the 1990 census data tabulated with 1999-2000
boundaries When there were overlapping school district pieces in a county but no actual
school-age children enumerated in the 1990 census for those pieces this flag did not
accurately identify the county as containing overlapping school districts Consequently a
second flag (referred to as the ldquoalternative flagrdquo in this report) was created by comparing
the sums of the total population for each school district piece in a county to the
independent county totals from the 1990 census If the sum of the total population in the
school district pieces was greater than the county total population there were people
counted in more than one school district and the county was identified as containing
overlapping school districts Otherwise the sums of the total population in school district
pieces equaled the independent county total population and the county did not contain
any overlapping school districts This approach did not depend on the presence of
25
school-age children but rather on the presence of people of any age which was a critical
difference for the very small school district pieces for which the original flag was
inaccurate
The school district population estimates were calculated using both flags and
though the alternative appeared more accurate the differences were negligible The flags
were the same for all but 10 counties (03 percent of 3141) in six states (Hawaii Illinois
Nebraska North Dakota Oklahoma and Texas) The flags generated population
estimates that were almost identical to each other (no more than 010 percent different)
Only the results using the alternative flag are discussed in this report
26
Appendix B Cohort-Component and Ratio Methods for Calculating April 1 2000
County Estimates
Preliminary school district estimates were calculated using two sets of April 1
2000 county estimates that included the age detail needed to produce the school-age
population estimates The county estimates were based on either a cohort-component
method or a ratio method and were produced by the Administrative Records and
Methodology Branch (ARMR) The cohort-component method started with the 1990
census county population and used administrative records to add births subtract deaths
and calculated net migration for each county The ratio method proportionally applied
changes in the county populations since the 1990 census while controlling to the state
population estimates by age sex race and Hispanic origin (Sink and Lollock 2002)
Both sets of estimates were constrained to equal independently produced total
populations by counties Both sets of estimates were also constrained to contain the same
number of people by age sex race and Hispanic origin for each state The only way the
two sets of county estimates differed that was relevant to this evaluation was by the
number of school-age (5 to 17 years) children in each county
The ratio-based method produced larger average proportions of school-age
children in every state than the cohort-component method 195 percent versus 183
percent for the nation There were also differences in the age distributions within the 5 to
17 year age group On average the county estimates from the ratio method had higher
proportions of 5-to-10-year olds than the county estimates from the cohort-component
method4 As a result the county estimates created with the ratio method estimated higher
average numbers of school-age children in school districts than the cohort-component
estimates The ratio-based county estimates also overestimated the school-age population
in school districts for many states while the county estimates created with the cohort-
component method on average underestimated the school-age population for all but two
4 The total population and total number of people by age in each state were constrained to be equal across both sets of county estimates and consequently to have higher proportions of children on average by county the ratio method must have distributed sufficiently higher proportions of children to a relatively higher number of counties than the cohort-component method
27
states This was due to differences in the methodology that were most evident in the
states with higher population growth such as California Colorado Florida and Utah
For the nation the cohort-component county estimates underestimated the April
1 2000 school-age population in school districts by 38 percent and the ratio-based
county estimates overestimated the school-age population by 10 percent The MAPEs
for the cohort-component- and ratio-based school district estimates of the school-age
population however were almost identical For most states the differences for the
cohort-component- and ratio-based estimates as measured by the MAPEs were relatively
small
Though the MALPE findings suggest that the ratio-based county estimates may
yield better school district estimates of the school-age population compared with the
cohort-component county estimates the MAPEs do not show such clear results Only the
results using the April 1 2000 county estimates produced using the cohort-component
method were discussed in this report because this is the only method for producing
demographic details for county estimates planned for post-Census 2000 estimates
28
Appendix C Treatment of 1990 Census and Census 2000 School District Files
The Census 2000 data were tabulated by 2001-2002 school district boundaries These
boundaries closely matched the 1999-2000 boundaries used to tabulate the 1990 census
data and subsequent estimates based on those data There were some differences in the
data that required special treatment as follows
1) The boundaries for three school districts in Ocean County New Jersey and two
school districts in Salt Lake County Utah were incorrectly tabulated in the Census 2000
data These five school districts were excluded from all the analyses described in this
report There may be other errors in the tabulations of school district population data but
only these five districts were identified at the time this report was produced
2) Hawaii operates as only one school district and was broken down into five
school district pieces that coincided with county boundaries in the 1990 census data By
definition the school district population estimates were identical to the county estimates
The April 1 2000 estimates created for these five school district pieces were collapsed
into a single district for the entire state for comparisons with the Census 2000 data This
limited the ability to evaluate the estimates for Hawaii and all the errors between the
school district estimates and Census 2000 were really errors in the county estimates
3) The 1990 census data included areas outside of school districts tabulated
separately for each county while the areas outside of school districts in Census 2000 data
were tabulated only for the state totals For the evaluation the 1990 census-based school
district estimates for areas outside of school districts were summed by states in order to
have comparable figures These areas contain relatively small populations 70037 people
nationwide in 1990 (881 percent of those in Arizona) and 106351 people in 2000 (787
percent of those in Arizona and 114 percent in New York) These areas in Arizona and
New York were not covered by school districts for reasons unique to those areas
4) The total populations in school districts were used as enumerated from the
Census 2000 long-form data5 and the school-age populations were tabulated from the
Census 2000 sample data (approximately 1 in 6 sample) Sample data were used for the
5 Census 2000 population data include modifications as documented in the Count Question Resolution program updates from the Boundary and Annexation Survey and geographic program revisions
29
assignment of relevant children to school districts because they included information on
both age and grade The use of Census 2000 sample data meant that there were some
school districts for which the school-age populations were too small to be selected in the
households sampled When the total and school-age populations were matched by school
districts there were 38 school districts not listed in the file of school-age children
because the districts did not contain any sample data for the population ages 5 to 17
Most of these school districts had less than 60 people of any age enumerated in Census
2000 and only one school district had more than 100 people enumerated This confirms
that there were probably households with school-age children present in the 38
unmatched school districts but not in large enough numbers to be selected in the sample
Though important to note the use of sample data does not generally limit this evaluation
of 1990 census-based school district estimates because school districts must have
contained at least 30 people (total or school-age) in Census 2000 to be included in the
calculation of the MAPEs and MALPEs
30
References
Blumerman Lisa M and Matthew Christenson 2002 ldquoThe Population Estimates of the
1990s Close to the Markrdquo Paper Presented at the Annual Meeting of the American
Sociological Association Chicago IL
Miller Esther 2001 ldquoEvaluation of the 1990 School District Level Population
Estimates Based on the Synthetic Ratio Approachrdquo US Census Bureau Population
Division Working Paper No 54
National Research Council 2000 Small-Area Estimates of School-Age Children in
Poverty Evaluation of Current Methodology Panel on Estimates of Poverty for
Small Geographic Areas Constance F Citro and Graham Kalton editors Committee
on National Statistics Washington DC National Academy Press
Sink Larry and Lisa Lollock ldquoAn Evaluation of Alternative Methods of Estimating
Population by Age Race and Hispanic Origin at the County Levelrdquo Paper presented
at the annual meeting of the Southern Demographic Association October 2002
US Census Bureau Housing and Household Economic Statistics Division Small Area
Estimates Branch 2002 ldquoSmall Area Income and Poverty Estimates 1999
Overview of School District Estimatesrdquo
wwwcensusgovhheswwwsaipeschoolssd99overhtmp
31
Figure 1 Unweighted and Weighted Mean Absolute Percent Errors (MAPE) for the April 1 2000 School District Estimates of the Total and School-Age Populations Estimates Based on
April 1 2000 County Estimates and Census 2000 County Enumeration Data
Total Population-MAPE Total Population-Weighted MAPE School-Age Population-MAPE School-Age Population-Weighted MAPE
91
67
129
93 86
55
117
69
00
20
40
60
80
100
120
140
Mea
n A
bsol
ute
Perc
ent E
rror
Based on April 1 2000 County Estimates Based on Census 2000 County Enumeration
32
Figure 2 Mean Algebraic Percent Errors (MALPE) for the April 1 2000 Estimates of the Total Population and School-Age Population in School Districts Compared with the Census 2000
Enumerated Population by School District Size in the 1990 Census
Under 5000 5000 - 9999 10000 - 19999 20000 - 39999 40000 or more
School District Size
20
-14
-20 -19
-12
-30
-49 -54
-47
-19
-60
-50
-40
-30
-20
-10
00
10
20
30
Mea
n A
lgeb
raic
Per
cent
Err
or
Total Population School-Age Population
33
Figure 3 Mean Absolute Percent Errors (MAPE) for the April 1 2000 Estimates of the School-Age Population in School Districts Compared with Census 2000 Enumerated Population by
School District Size in the 1990 Census
Under 5000 5000 - 9999 10000 - 19999 20000 - 39999 40000 or more
School District Size
162
111 102 99
92
140
116 109
104
79
00
20
40
60
80
100
120
140
160
180
Mea
n A
bsol
ute
Perc
ent E
rror
Unweighted MAPE Weighted MAPE
34
Figure 4 Mean Absolute Percent Errors (MAPE) for the April 1 2000 Estimates of the Total Population in School Districts Compared with the Census 2000 Enumerated Population by
School District Size in the 1990 Census
Under 5000 5000 - 9999 10000 - 19999 20000 - 39999 40000 or more
School District Size
116
73 70 67 64
96
80 76
72
60
00
20
40
60
80
100
120
140
Mea
n A
bsol
ute
Perc
ent E
rror
Unweighted MAPE Weighted MAPE
35
Figure 5 Mean Algebraic Percent Errors (MALPE) for the April 1 2000 Estimates of the Total Population and School-Age Population in School Districts Compared with the Census 2000
Enumerated Population by School District Size in Census 2000
Under 5000 5000 - 9999 10000 - 19999 20000 - 39999 40000 or more
School District Size
30
-14
-22
-32
-25 -22
-49 -54
-61
-35
-70
-60
-50
-40
-30
-20
-10
00
10
20
30
40
Mea
n A
lgeb
raic
Per
cent
Err
or
Total Population School-Age Population
36
Figure 6 Mean Absolute Percent Errors (MAPE) for the April 1 2000 Estimates of the School-Age Population in School Districts Compared with the Census 2000 Enumerated Population
by School District Size in Census 2000
Under 5000 5000 - 9999 10000 - 19999 20000 - 39999 40000 or more
School District Size
162
109 102
108 100
133
106 101
107
83
00
20
40
60
80
100
120
140
160
180
Mea
n A
bsol
ute
Perc
ent E
rror
Unweighted MAPE Weighted MAPE
37
Figure 7 Mean Absolute Percent Errors (MAPE) for the April 1 2000 Estimates of the Total Population in School Districts Compared with the Census 2000 Enumerated Population by
School District Size in Census 2000
Under 5000 5000 - 9999 10000 - 19999 20000 - 39999 40000 or more
School District Size
115
73 70 75
70
86
72 70 75
63
00
20
40
60
80
100
120
140
Mea
n A
bsol
ute
Perc
ent E
rror
Unweighted MAPE Weighted MAPE
38
Figure 8 Mean Algebraic Percent Errors (MALPE) for the April 1 2000 Estimates of the Total and School-Age Populations in School Districts Compared with the Census 2000 Enumerated Population by Ten-Year Percent Change in School District Populations
257
77
45 21
-05
-81
180
31 09
-15 -37
-129-150
-100
-50
00
50
100
150
200
250
300
Mea
n A
lgeb
raic
Per
cent
Err
or
Decrease of more than 100
Decrease of 51 to 100
Decrease of 50 or less
No Change or Increase of less than
50
Increase of 50 to 99
Increase of 10 or more
Percent Change 1990 to 2000
Total Population School-Age Population
39
204
78 80 81 86
145
129
84 79 86
73
97
00
50
100
150
200
250
Mea
n A
bsol
ute
Perc
ent E
rror
Figure 9 Mean Absolute Percent Errors (MAPE) for the April 1 2000 Estimates of the School-Age Population in School Districts Compared with the Census 2000 Enumerated Population
by Ten-Year Percent Change in the School District School-Age Population
Decrease of more Decrease of 51 to Decrease of 50 or No Change or Increase of 50 to Increase of 10 or than 100 100 less Increase of less than 99 more
50
Percent Change
Unweighted MAPE Weighted MAPE
40
Figure 10 Mean Absolute Percent Errors (MAPE) for the April 1 2000 Estimates of the Total Population in School Districts Compared with the Census 2000 Enumerated Population by
Ten-Year Percent Change in the School District Total Population
Decrease of more Decrease of 51 to Decrease of 50 or No Change or Increase of 50 to Increase of 10 or than 100 100 less Increase of less than 99 more
50
Percent Change
261
85
58 46 48
103
126
77
56 42 44
82
00
50
100
150
200
250
300
Mea
n A
bsol
ute
Perc
ent E
rror
Unweighted MAPE Weighted MAPE
41
Mea
n A
bsol
ute
Perc
ent E
rror
Figure 11 Mean Absolute Percent Errors (MAPE) for the April 1 2000 Estimates of the School-Age Population in School Districts Compared with the Census 2000 Enumerated Population
by School District Type 250
196200 188
161
150 138
113
100 88
50
00
Elementary School District Secondary School District Unified School District
School District Type
Unweighted MAPE Weighted MAPE
42
Figure 12 Mean Absolute Percent Errors (MAPE) for the April 1 2000 Estimates of the Total Population in School Districts Compared with the Census 2000 Enumerated Population by
School District Type
Elementary School District Secondary School District Unified School District
School District Type
146
72 78
95
65 65
00
20
40
60
80
100
120
140
160
Mea
n A
bsol
ute
Perc
ent E
rror
Unweighted MAPE Weighted MAPE
43
(leading dot indicates sub-part)
Footnotes
Table 1 Number of School Districts Included and Excluded from Analyses 2000
School District Type
Number of School Districts
Total Population School-Age Population
Total 14310 14310 Included Excluded
Boundary Error in Census 2000 Data Extreme Outliers Associated with Military Base Closures Census 2000 Population Less than 30 (including zero)
14256 54 5 8 4
40
13876 434
5 3 4
425
The figures contain three school districts that qualified twice for exclusion Source US Census Bureau Population Division Internet Release Date June 3 2004
44
Footnotes
Table 2 Mean Algebraic Percent Errors (MALPE) and Standard Deviations of Errors for the April 1 2000 Estimates of the School-Age Population in School Districts Compared with the Census 2000 Enumerated Population by State
State
Number of School Districts Included in
MALPE MALPE Standard Deviation Total 13876 -38 184 Alabama 130 -64 119 Alaska 50 -29 188 Arizona 207 -08 379 Arkansas 310 -53 139 California 956 -10 293 Colorado 176 -84 167 Connecticut 166 -44 119 Delaware 16 -100 132 District of Columbia 1 -135 (X) Florida 67 -46 71 Georgia 183 -61 122 Hawaii 1 -46 (X) Idaho 111 -41 139 Illinois 896 -27 186 Indiana 295 -45 117 Iowa 375 -31 123 Kansas 304 -70 137 Kentucky 178 -24 116 Louisiana 66 -46 62 Maine 247 -54 180 Maryland 24 -66 61 Massachusetts 300 -31 162 Michigan 545 -27 143 Minnesota 347 -14 135 Mississippi 149 -35 99 Missouri 522 -18 165 Montana 358 -50 299 Nebraska 448 -22 269 Nevada 17 -24 95 New Hampshire 174 -51 175 New Jersey 568 -18 180 New Mexico 89 -09 235 New York 686 -83 109 North Carolina 120 02 101 North Dakota 222 -08 235 Ohio 610 -37 126 Oklahoma 544 -35 181 Oregon 183 -03 166 Pennsylvania 501 -32 92 Rhode Island 36 03 114 South Carolina 88 -84 112 South Dakota 175 -41 148 Tennessee 155 -58 131 Texas 1035 -73 203 Utah 38 -78 149 Vermont 249 -53 183 Virginia 137 -62 132 Washington 292 -44 199 West Virginia 55 -14 54 Wisconsin 425 -31 129 Wyoming 49 -51 121
School districts with known boundary errors those affected by military base closures extreme outliers and with less than 30 school-age children enumerated in Census 2000 are excluded from the calculations of the percent errors
(X) Not Applicable Source US Census Bureau Population Division Internet Release Date June 3 2004
45
Footnotes
Table 3 Unweighted and Weighted Mean Absolute Percent Errors (MAPE) and Standard Deviations of Errors for the April 1 2000 Estimates of the School-Age Population in School Districts Compared with the Census 2000 Enumerated Population by State
State
Number of School Districts Included in
MAPE MAPE Standard Deviation
Number of School Districts Included in Weighted MAPE Weighted MAPE
Standard Deviation
Total 13876 129 137 13876 93 5494 Alabama 130 109 80 130 100 6516 Alaska 50 146 121 51 64 3101 Arizona 207 250 285 221 174 9479 Arkansas 310 115 95 310 99 3122 California 956 189 224 988 106 9134 Colorado 176 144 118 176 115 5644 Connecticut 166 95 84 166 77 3811 Delaware 16 117 117 16 101 9590 District of Columbia 1 135 (X) 1 135 (X) Florida 67 66 52 67 40 6477 Georgia 183 104 88 184 97 6771 Hawaii 1 46 (X) 1 46 (X) Idaho 111 108 96 113 89 3196 Illinois 896 134 132 897 112 5425 Indiana 295 94 83 295 101 5840 Iowa 375 96 83 375 83 2883 Kansas 304 120 97 305 138 4512 Kentucky 178 90 77 179 65 3989 Louisiana 66 59 49 66 46 4732 Maine 247 138 127 296 93 2543 Maryland 24 77 47 24 72 8887 Massachusetts 300 110 123 303 86 4843 Michigan 545 109 97 555 99 4530 Minnesota 347 102 89 348 94 4223 Mississippi 149 83 64 149 83 4266 Missouri 522 123 111 522 104 3860 Montana 358 222 206 455 137 2611 Nebraska 448 177 203 590 88 2575 Nevada 17 75 61 17 30 5299 New Hampshire 174 127 131 175 85 3851 New Jersey 568 132 123 572 107 4769 New Mexico 89 160 172 89 73 5790 New York 686 108 83 688 61 4676 North Carolina 120 64 78 121 55 6205 North Dakota 222 174 158 230 101 2255 Ohio 610 97 88 613 101 5352 Oklahoma 544 132 129 545 108 2820 Oregon 183 117 118 198 99 5031 Pennsylvania 501 74 63 502 73 4244 Rhode Island 36 89 69 36 71 4134 South Carolina 88 117 76 91 118 6148 South Dakota 175 117 99 176 84 2460 Tennessee 155 109 93 155 90 4883 Texas 1035 155 149 1040 120 7357 Utah 38 142 89 38 86 6859 Vermont 249 148 119 259 119 2058 Virginia 137 115 90 137 111 6749 Washington 292 146 142 297 94 4687 West Virginia 55 45 33 55 43 2100 Wisconsin 425 99 88 427 81 3488 Wyoming 49 107 75 49 79 2323
School districts with known boundary errors those affected by military base closures extreme outliers and with less than 30 school-age children enumerated in Census 2000 are excluded from the calculations of the percent errors The number of school districts included in the unweighted and weighted statistics differ due to the criteria for excluding school districts with less than 30 school-age children The values for the standard deviations are relatively large due to weighting by the Census 2000 school-age population
(X) Not Applicable Source US Census Bureau Population Division Internet Release Date June 3 2004
46
Footnotes
Table 4 Mean Algebraic Percent Errors (MALPE) and Standard Deviations of Errors for the April 1 2000 Estimates of the Total Population in School Districts Compared with the Census 2000 Enumerated Population by State
State
Number of School Districts Included in
MALPE MALPE Standard Deviation Total 14256 01 163 Alabama 130 -08 104 Alaska 51 -08 141 Arizona 219 -20 356 Arkansas 310 -28 114 California 986 67 339 Colorado 176 -52 143 Connecticut 166 -48 77 Delaware 16 -46 136 District of Columbia 1 -86 (X) Florida 67 -52 58 Georgia 183 -26 83 Hawaii 1 -22 (X) Idaho 113 11 119 Illinois 896 06 132 Indiana 295 003 111 Iowa 375 001 76 Kansas 304 -06 95 Kentucky 178 17 94 Louisiana 66 -10 34 Maine 289 -29 144 Maryland 24 -12 21 Massachusetts 302 -34 109 Michigan 555 -12 111 Minnesota 348 -05 94 Mississippi 149 -17 80 Missouri 522 09 107 Montana 448 37 213 Nebraska 585 51 187 Nevada 17 -11 99 New Hampshire 175 -51 110 New Jersey 569 04 121 New Mexico 89 01 169 New York 688 -17 85 North Carolina 120 -22 68 North Dakota 230 54 134 Ohio 613 -08 115 Oklahoma 545 15 165 Oregon 197 45 193 Pennsylvania 501 -13 73 Rhode Island 36 -52 58 South Carolina 90 -40 112 South Dakota 176 05 97 Tennessee 155 03 115 Texas 1040 -13 209 Utah 38 -15 106 Vermont 259 -48 97 Virginia 137 -14 59 Washington 297 -07 161 West Virginia 55 08 37 Wisconsin 425 -18 82 Wyoming 49 -07 83
School districts with known boundary errors those affected by military base closures extreme outliers and with less than 30 people enumerated in Census 2000 are excluded from the calculations of the prercent errors
(X) Not Applicable Source US Census Bureau Population Division Internet Release Date June 3 2004
47
Footnotes
Table 5 Unweighted and Weighted Mean Absolute Percent Errors (MAPE) and Standard Deviations of Errors for the April 1 2000 Estimates of the Total Population in School Districts Compared with the Census 2000 Enumerated Population by State
State
Number of School Districts Included in
MAPE MAPE Standard Deviation
Number of School Districts Included in Weighted MAPE Weighted MAPE
Standard Deviation
Total 14256 91 136 14256 67 10687 Alabama 130 71 76 130 71 12949 Alaska 51 98 101 51 22 4590 Arizona 219 234 268 219 148 23562 Arkansas 310 80 86 310 68 6391 California 986 168 302 986 69 18158 Colorado 176 111 104 176 83 11357 Connecticut 166 72 55 166 61 6532 Delaware 16 91 109 16 99 18600 District of Columbia 1 86 (X) 1 86 (X) Florida 67 57 53 67 48 15283 Georgia 183 61 61 183 63 12089 Hawaii 1 22 (X) 1 22 (X) Idaho 113 72 95 113 73 7812 Illinois 896 85 101 896 70 12458 Indiana 295 69 87 295 68 11563 Iowa 375 50 57 375 52 5794 Kansas 304 61 72 304 100 9855 Kentucky 178 58 76 178 47 8972 Louisiana 66 27 22 66 27 4557 Maine 289 111 96 289 74 4054 Maryland 24 19 15 24 20 5457 Massachusetts 302 72 89 302 55 8870 Michigan 555 81 77 555 84 8144 Minnesota 348 62 71 348 62 7569 Mississippi 149 60 55 149 66 8110 Missouri 522 75 77 522 73 7577 Montana 448 135 169 448 48 4439 Nebraska 585 119 154 585 56 3846 Nevada 17 82 53 17 84 8711 New Hampshire 175 84 88 175 62 6246 New Jersey 569 86 85 569 72 8624 New Mexico 89 115 123 89 69 8733 New York 688 61 61 688 58 6629 North Carolina 120 49 52 120 54 10536 North Dakota 230 103 102 230 62 4596 Ohio 613 74 88 613 80 10559 Oklahoma 545 91 139 545 74 6155 Oregon 197 112 164 197 58 8082 Pennsylvania 501 54 50 501 57 7487 Rhode Island 36 64 44 36 59 7358 South Carolina 90 78 89 90 65 11923 South Dakota 176 65 72 176 57 4298 Tennessee 155 64 95 155 60 13390 Texas 1040 115 174 1040 96 14457 Utah 38 70 81 38 82 13483 Vermont 259 81 72 259 62 3146 Virginia 137 41 44 137 35 6707 Washington 297 111 117 297 76 9368 West Virginia 55 29 24 55 24 4110 Wisconsin 425 60 58 425 51 6596 Wyoming 49 65 52 49 52 4794
School districts with known boundary errors those affected by military base closures extreme outliers and with less than 30 people enumerated in Census 2000 are excluded from the calculations of the percent errors The values for the standard deviations are relatively large due to weighting by the Census 2000 total population
(X) Not Applicable Source US Census Bureau Population Division Internet Release Date June 3 2004
48
Footnotes
Table 6 Mean Absolute Percent Errors (MAPE) for the April 1 2000 Estimates of the Total Population in Two Sets of School Districts Compared with the Census 2000 Enumerated Population by State
State
All School Districts School Districts with Additional
Exclusions Differences between Sets of School
Districts
Number of Districts Included in MAPE MAPE
Number of Districts Included in MAPE MAPE
Number of Districts Included in MAPE MAPE
Total 13876 129 10059 116 3817 13 Alabama 130 109 105 115 25 -06 Alaska 50 146 34 166 16 -21 Arizona 207 250 125 247 82 03 Arkansas 310 115 310 115 0 00 California 956 189 320 130 636 58 Colorado 176 144 166 146 10 -01 Connecticut 166 95 112 83 54 12 Delaware 16 117 16 117 0 00 District of Columbia 1 135 0 (X) (X) (X) Florida 67 66 0 (X) (X) (X) Georgia 183 104 52 139 131 -36 Hawaii 1 46 1 46 0 00 Idaho 111 108 104 109 7 00 Illinois 896 134 406 112 490 22 Indiana 295 94 278 95 17 -01 Iowa 375 96 375 96 0 00 Kansas 304 120 299 121 5 -01 Kentucky 178 90 101 101 77 -11 Louisiana 66 59 4 49 62 10 Maine 247 138 214 134 33 03 Maryland 24 77 0 (X) (X) (X) Massachusetts 300 110 207 91 93 19 Michigan 545 109 523 103 22 06 Minnesota 347 102 345 102 2 00 Mississippi 149 83 115 87 34 -05 Missouri 522 123 447 110 75 12 Montana 358 222 50 202 308 20 Nebraska 448 177 263 120 185 58 Nevada 17 75 0 (X) (X) (X) New Hampshire 174 127 76 98 98 28 New Jersey 568 132 230 104 338 28 New Mexico 89 160 85 161 4 -01 New York 686 108 672 108 14 01 North Carolina 120 64 39 101 81 -37 North Dakota 222 174 185 164 37 10 Ohio 610 97 610 97 0 00 Oklahoma 544 132 431 119 113 13 Oregon 183 117 175 117 8 00 Pennsylvania 501 74 497 74 4 00 Rhode Island 36 89 30 78 6 11 South Carolina 88 117 62 126 26 -09 South Dakota 175 117 170 118 5 -01 Tennessee 155 109 58 98 97 10 Texas 1035 155 996 156 39 -01 Utah 38 142 16 172 22 -30 Vermont 249 148 52 128 197 20 Virginia 137 115 10 106 127 08 Washington 292 146 286 142 6 04 West Virginia 55 45 0 (X) (X) (X) Wisconsin 425 99 366 85 59 14 Wyoming 49 107 41 111 8 -03
School districts with known boundary errors those affected by military base closures extreme outliers and with less than 30 school-age children enumberated in Census 2000 are excluded from the calculations of the percent errors
In addition to the above exclusions school districts with boundaries that are identical to county boundaries Elementary and Secondary School Districts are also excluded from the calculations of the MAPEs
(X) Not Applicable Source US Census Bureau Population Division Internet Release Date June 3 2004
49
Footnotes
Table 7 Mean Absolute Percent Errors (MAPE) for the April 1 2000 Estimates of the Total Population in Two Sets of School Districts Compared with the Census 2000 Enumerated Population by State
State
All School Districts School Districts with Additional
Exclusions Differences between Sets of School
Districts
Number of Districts Included in MAPE MAPE
Number of Districts Included in MAPE MAPE
Number of Districts Included in MAPE MAPE
Total 14256 91 10141 81 4115 09 Alabama 130 71 105 82 25 -11 Alaska 51 98 35 119 16 -21 Arizona 219 234 137 249 82 -14 Arkansas 310 80 310 80 0 00 California 986 168 320 112 666 56 Colorado 176 111 166 114 10 -03 Connecticut 166 72 112 68 54 05 Delaware 16 91 16 91 0 00 District of Columbia 1 86 0 (X) (X) (X) Florida 67 57 0 (X) (X) (X) Georgia 183 61 52 89 131 -28 Hawaii 1 22 1 22 0 00 Idaho 113 72 106 74 7 -02 Illinois 896 85 406 74 490 11 Indiana 295 69 278 71 17 -02 Iowa 375 50 375 50 0 00 Kansas 304 61 299 61 5 00 Kentucky 178 58 101 79 77 -21 Louisiana 66 27 4 61 62 -34 Maine 289 111 256 113 33 -03 Maryland 24 19 0 (X) (X) (X) Massachusetts 302 72 207 65 95 07 Michigan 555 81 523 76 32 05 Minnesota 348 62 345 60 3 02 Mississippi 149 60 115 66 34 -06 Missouri 522 75 447 73 75 02 Montana 448 135 51 113 397 22 Nebraska 585 119 263 58 322 61 Nevada 17 82 0 (X) (X) (X) New Hampshire 175 84 76 66 99 18 New Jersey 569 86 231 74 338 12 New Mexico 89 115 85 118 4 -02 New York 688 61 674 62 14 -01 North Carolina 120 49 39 78 81 -29 North Dakota 230 103 185 93 45 10 Ohio 613 74 612 72 1 02 Oklahoma 545 91 431 78 114 13 Oregon 197 112 182 103 15 08 Pennsylvania 501 54 497 54 4 00 Rhode Island 36 64 30 57 6 07 South Carolina 90 78 62 81 28 -04 South Dakota 176 65 171 65 5 00 Tennessee 155 64 58 76 97 -12 Texas 1040 115 999 116 41 -01 Utah 38 70 16 105 22 -35 Vermont 259 81 56 84 203 -02 Virginia 137 41 10 86 127 -45 Washington 297 111 290 104 7 06 West Virginia 55 29 0 (X) (X) (X) Wisconsin 425 60 366 56 59 05 Wyoming 49 65 41 67 8 -02
School districts with known boundary errors those affected by military base closures extreme outliers and with less than 30 school-age children enumberated in Census 2000 are excluded from the calculations of the percent errors
In addition to the above exclusions school districts with boundaries that are identical to county boundaries Elementary and Secondary School Districts are also excluded from the calculations of the MAPEs
(X) Not Applicable Source US Census Bureau Population Division Internet Release Date June 3 2004
50
(leading dot indicates sub-part)
Footnotes
Table 8 Mean Absolute Percent Errors (MAPE) and Mean Algebraic Percent Errors (MALPE) for the April 1 2000 Estimates of the School-Age Population in School Districts Compared with the Census 2000 Enumerated Population by School District Characteristics
School District Population
Unweighted Number of School Districts Weighted by the School-Age
Population
Number of Districts
Percent of Districts MAPE MALPE
Number of Districts
(thousands) Percent of Population MAPE
School-Age Children
School District Population 1990
13876 1000 129 -38 52961 1000 93
Under 5000 6163 444 162 -30 2784 53 140 5000 - 9999 2588 187 111 -49 3917 74 116 10000 - 19999 2373 171 102 -54 6961 131 109 20000 - 39999 1464 106 99 -47 8111 153 104 40000 or more
School District Population 2000
1288 93 92 -19 31189 589 79
Under 5000 5830 420 162 -22 2399 45 133 5000 - 9999 2550 184 109 -49 3446 65 106 10000 - 19999 2376 171 102 -54 6176 117 101 20000 - 39999 1636 118 108 -61 8055 152 107 40000 or more
Percent Population Change 1990-2000
1484 107 100 -35 32885 621 83
Decrease of more than 100 1922 139 204 180 1720 32 129 Decrease of 50 to 100 1085 78 78 31 2018 38 84 Decrease of 01 to 50 1405 101 80 09 3999 76 79 Increase of 0 to 49 1516 109 81 -15 4828 91 86 Increase of 50 to 99 1536 111 86 -37 6016 114 73 Increase of 10 or more
Census Division
6363 459 145 -129 34379 649 97
East North Central 2771 200 111 -32 8598 162 101 East South Central 612 44 97 -44 3151 59 86 Middle Atlantic 1755 126 106 -47 7140 135 74 Mountain 1045 75 186 -44 3475 66 113 New England 1172 84 124 -44 2480 47 85 Pacific 1482 107 170 -17 8865 167 102 South Atlantic 691 50 92 -49 9244 175 73 West North Central 2393 172 130 -28 3688 70 101 West South Central
School District Type
1955 141 139 -58 6321 119 107
Area Outside of School Districts 5 004 300 -109 6 001 402 Elementary School District 2405 173 188 15 3201 60 138 Secondary School District 477 34 196 -165 1083 20 161 Unified School District 10989 792 113 -45 48671 919 88
Number of school districts may not sum to total due to additional missing values (1990 census population of zero) Source US Census Bureau Population Division Internet Release Date June 3 2004
51
(leading dot indicates sub-part)
Footnotes
Table 9 Mean Absolute Percent Errors (MAPE) and Mean Algebraic Percent Errors (MALPE) for the April 1 2000 Estimates of the Total Population in School Districts Compared with the Census 2000 Enumerated Population by School District Characteristics
School District Population
Unweighted Number of School Districts Weighted by the Total Population
Number of Districts
Percent of Districts MAPE MALPE
Number of Districts
(thousands) Percent of Population MAPE
Total Population
School District Population 1990
14256 1000 91 01 300417 1000 67
Under 5000 6543 459 116 20 14610 49 96 5000 - 9999 2588 182 73 -14 20907 70 80 10000 - 19999 2373 166 70 -20 38103 127 76 20000 - 39999 1464 103 67 -19 46035 153 72 40000 or more
School District Population 2000
1288 90 64 -12 180762 602 60
Under 5000 6210 436 115 30 12623 42 86 5000 - 9999 2550 179 73 -14 18424 61 72 10000 - 19999 2376 167 70 -22 33913 113 70 20000 - 39999 1636 115 75 -32 45539 152 75 40000 or more
Percent Population Change 1990-2000
1484 104 70 -25 189918 632 63
Decrease of more than 100 1091 77 261 257 5145 17 126 Decrease of 50 to 100 1055 74 85 77 12690 42 77 Decrease of 01 to 50 1799 126 58 45 25774 86 56 Increase of 0 to 49 2404 169 46 21 42704 142 42 Increase of 50 to 99 2091 147 48 -05 61258 204 44 Increase of 10 or more
Census Division
5814 408 103 -81 152846 509 82
East North Central 2784 195 76 -05 49944 166 73 East South Central 612 43 63 -004 17244 57 61 Middle Atlantic 1758 123 67 -09 41342 138 61 Mountain 1149 81 137 03 20206 67 100 New England 1227 86 85 -41 14902 50 59 Pacific 1532 107 147 47 54264 181 68 South Atlantic 693 49 54 -25 51784 172 48 West North Central 2540 178 80 18 19286 64 68 West South Central
School District Type
1961 138 100 -07 31445 105 81
Area Outside of School Districts 10 01 359 101 94 003 13 Elementary School District 2684 188 146 32 21669 72 95 Secondary School District 491 34 72 -12 19664 65 65 Unified School District 11071 777 78 -07 258989 862 65
Number of school districts may not sum to total due to additional missing values (1990 census population of zero) The total population exceeds the total population enumerated in Census 2000 due to overlapping school districts Source US Census Bureau Population Division
Internet Release Date June 3 2004
52
(leading dot indicates sub-part)
Footnotes
Table 10 Number of School Districts and Distribution of the School-Age Population by the Total School District Population 1990 and 2000
Population Size Number of
School Districts Percent of
School Districts School-Age Population
Percent of School-Age Population
1990 Census Total Population 14310 1000 45249989 1000
Total Population Missing 6 004 (X) (X) Less than 5000 6585 460 2585923 57 5000 to 9999 2590 181 3517618 78 10000 to 19999 2373 166 6098283 135 20000 to 39999 1464 102 6944790 153 40000 or more 1292 90 26103375 577
Census 2000 Total Population 14310 1000 53096003 1000
Total Population Missing 7 005 (X) (X) Less than 5000 6252 437 2406420 45 5000 to 9999 2550 178 3446217 65 10000 to 19999 2377 166 6177845 116 20000 to 39999 1637 114 8058266 152 40000 or more 1487 104 33007255 622
(X) Not Applicable Source US Census Bureau Population Division Internet Release Date June 3 2004
53
(leading dot indicates sub-part)
Footnotes
Table 11 Mean Absolute Percent Errors (MAPE) for the April 1 2000 Estimates of the School-Age Population inTwo Sets of School Districts Compared with the Census 2000 Enumerated Population by School District Characteristics
All School Districts School Districts with
Additional Exclusions Differences between Sets
of School Districts Number of Number of Number of
Districts Districts Districts Included in Included in Included in
Population Group MAPE MAPE MAPE MAPE MAPE MAPE School-Age Children
1990 Census Total Population
13876 129 10058 116 3818 13
Under 5000 6163 162 4329 142 1834 21 5000 - 9999 2588 111 2034 102 554 09 10000 - 19999 2373 102 1795 96 578 06 20000 - 39999 1464 99 1050 97 414 03 40000 or more
Census 2000 Total Population
1288 92 850 88 438 05
Under 5000 5830 162 4075 141 1755 22 5000 - 9999 2550 109 2025 101 525 08 10000 - 19999 2376 102 1791 96 585 06 20000 - 39999 1636 108 1190 105 446 03 40000 or more
Percent Change in the School-Age Population 1990-2000
1484 100 977 96 507 04
Decrease of more than 100 1922 204 1318 161 604 44 Decrease of 51 to 100 1085 78 853 71 232 07 Decrease of 50 or less No Change or Increase of less than
1405 80 1087 74 318 06
50 1516 81 1187 76 329 05 Increase of 50 to 99 1536 86 1190 87 346 -01 Increase of 10 or more 6363 145 4423 141 1940 04
School districts with known boundary errors those affected by military base closures extreme outliers and with less than 30 school-age children enumerated in Census 2000 are excluded from the calculations of the percent errors
In addition to the above exclusions school districts with boundaries that are identical to county boundaries Elementary and Secondary School Districts ar e also excluded from the calculations of the MAPEs
Source US Census Bureau Population Division Internet Release Date June 3 2004
54
(leading dot indicates sub-part)
Footnotes
Table 12 Mean Absolute Percent Errors (MAPE) for the April 1 2000 Estimates of the Total Population in Two Sets of School Districts Compared with the Census 2000 Enumerated Population by School District Characteristics
All School Districts School Districts with
Additional Exclusions Differences between Sets
of School Districts Number of Number of Number of
Districts Districts Districts Included in Included in Included in
Population Group MAPE MAPE MAPE MAPE MAPE MAPE Total Population
1990 Census Total Population
14256 91 10140 81 4116 09
Under 5000 6543 116 4411 94 2132 22 5000 - 9999 2588 73 2034 69 554 03 10000 - 19999 2373 70 1795 73 578 -03 20000 - 39999 1464 67 1050 73 414 -05 40000 or more
Census 2000 Total Population
1288 64 850 70 438 -07
Under 5000 6210 115 4157 92 2053 23 5000 - 9999 2550 73 2025 70 525 02 10000 - 19999 2376 70 1791 73 585 -02 20000 - 39999 1636 75 1190 79 446 -04 40000 or more
Percent Change in the Total Population 1990-2000
1484 70 977 77 507 -07
Decrease of more than 100 1091 261 668 191 423 71 Decrease of 51 to 100 1055 85 820 75 235 10 Decrease of 50 or less No Change or Increase of less than
1799 58 1392 54 407 04
50 2404 46 1836 45 568 01 Increase of 50 to 99 2091 48 1489 48 602 01 Increase of 10 or more 5814 103 3935 103 1879 00
School districts with known boundary errors those affected by military base closures extreme outliers and with less than 30 school-age children enumerated in Census 2000 are excluded from the calculations of the percent errors In addition to the above exclusions school districts with boundaries that are identical to county boundaries Elementary and Secondary School Districts ar e also excluded from the calculations of the MAPEs Source US Census Bureau Population Division Internet Release Date June 3 2004
55
(leading dot indicates sub-part)
Footnotes
Table 13 Mean Absolute Percent Errors (MAPE) for the April 1 2000 Estimates of the School-Age Population and Total Population in School Districts Compared with the Census 2000 Enumerated Population by School District Characteristics for School Districts with 1990 Census Populations of 20000 or More
School District Characteristics
School-Age Population Total Population
All School Districts
School Districts with Total
Populations of 20000 or More
All School Districts
School Districts with Total
Populations of 20000 or More
Total 129 96 91 66
Percent Population Change 1990-2000 Decrease of more than 100 204 123 261 153 Decrease of 51 to 100 78 94 85 85 Decrease of 50 or less 80 75 58 52 No Change or Increase of less than 50 81 82 46 39 Increase of 50 to 99 86 68 48 44 Increase of 10 or more 145 105 103 81
Census Division East North Central 111 98 76 75 East South Central 97 92 63 62 Middle Atlantic 106 88 67 57 Mountain 186 117 137 86 New England 124 78 85 52 Pacific 170 116 147 72 South Atlantic 92 82 54 47 West North Central 130 92 80 69 West South Central 139 98 100 79
Type of School District Elementary School District 188 117 146 76 Secondary School District 196 164 72 65 Unified School District 113 89 78 65
School districts with known boundary errors those affected by military base closures extreme outliers and with less than 30 school-age children enumerated in Census 2000 are excluded from the calculations of the percent errors Source US Census Bureau Population Division Internet Release Date June 3 2004
56
(leading dot indicates sub-part)
Footnotes
Table 14 Mean Absolute Percent Errors (MAPE) for the April 1 2000 Estimates of the School-Age Population and Total Population in Two Sets of School Districts Compared with the Census 2000 Enumerated Population for Selected States
All School Districts
School Districts with Identical School District and County
Boundaries Excluded Differences between Sets of
School Districts Number of
Districts Number of Number of Included in Districts Included Districts Included
State MAPE MAPE in MAPE MAPE in MAPE MAPE School-Age Population 13876 129 12944 133 932 -03
Selected States Alabama 130 109 105 115 25 -06 Alaska 50 146 34 166 16 -21 Georgia 183 104 52 139 131 -36 Kentucky 178 90 101 101 77 -11 Louisiana 66 59 4 49 62 10 Mississippi 149 83 115 87 34 -05 North Carolina 120 64 39 101 81 -37 South Carolina 88 117 64 125 24 -08 Tennessee 155 109 92 121 63 -13 Utah 38 142 16 172 22 -30 Virginia 137 115 10 106 127 08
Total Population 14256 91 13324 94 932 -03
Selected States Alabama 130 71 105 82 25 -11 Alaska 51 98 35 119 16 -21 Georgia 183 61 52 89 131 -28 Kentucky 178 58 101 79 77 -21 Louisiana 66 27 4 61 62 -34 Mississippi 149 60 115 66 34 -06 North Carolina 120 49 39 78 81 -29 South Carolina 90 78 66 92 24 -15 Tennessee 155 64 92 80 63 -16 Utah 38 70 16 105 22 -35 Virginia 137 41 10 86 127 -45
School districts with known boundary errors those affected by military base closures extreme outliers and with less than 30 school-age children enumerated in Census 2000 are excluded from the calculations of the percent errors Source US Census Bureau Population Division Internet Release Date June 3 2004
57
(leading dot indicates sub-part)
Footnotes
Table 15 Mean Absolute Percent Errors (MAPE) for the April 1 2000 Estimates of the School-Age Population in Two Sets of School Districts Compared with the Census 2000 Enumerated Population School District Characteristics
All School Districts
School Districts with Identical School District and
County Boundaries Excluded
Differences between Sets of School Districts
Number of Number of Number of Districts Districts Districts
Included in Included in Included in Characteristics of School Districts MAPE MAPE MAPE MAPE MAPE MAPE School-Age Population
1990 Census Total Population
13876 129 12943 133 933 -03
Under 5000 6163 162 6082 163 81 -01 5000 - 9999 2588 111 2428 112 160 -01 10000 - 19999 2373 102 2121 104 252 -02 20000 - 39999 1464 99 1255 105 209 -05 40000 or more
Census 2000 Total Population
1288 92 1057 97 231 -04
Under 5000 5830 162 5757 163 73 -01 5000 - 9999 2550 109 2422 111 128 -01 10000 - 19999 2376 102 2126 104 250 -02 20000 - 39999 1636 108 1421 112 215 -05 40000 or more
Percent Change in the School-Age Population 1990-2000
1484 100 1217 106 267 -06
Decrease of more than 100 1922 204 1818 212 104 -08 Decrease of 51 to 100 1085 78 1007 79 78 -02 Decrease of 50 or less No Change or Increase of less than
1405 80 1282 81 123 -02
50 1516 81 1400 81 116 -002 Increase of 50 to 99 1536 86 1429 87 107 -01 Increase of 10 or more
School District Type
6363 145 6007 151 356 -06
Elementary School District 2405 188 2403 188 2 001 Secondary School District 477 196 477 196 0 00 Unified School District 10989 113 10058 116 931 -03
School districts with known boundary errors those affected by military base closures extreme outliers and with less than 30 school-age children enumerated in Census 2000 are excluded from the calculations of the percent errors Source US Census Bureau Population Division Internet Release Date June 3 2004
58
(leading dot indicates sub-part)
Footnotes
Table 16 Mean Absolute Percent Errors (MAPE) for the April 1 2000 Estimates of the Total Population in Two Sets of School Districts Compared with the Census 2000 Enumerated Population by School District Characteristics
Characteristics of School Districts
All School Districts
School Districts with Identical School District and County
Boundaries Excluded Differences between Sets of
School Districts Number of Districts
Included in MAPE MAPE
Number of Districts Included
in MAPE MAPE
Number of Districts Included
in MAPE MAPE Total Population
1990 Census Total Population
14256 91 13323 94 933 -03
Under 5000 6543 116 6462 116 81 -01 5000 - 9999 2588 73 2428 74 160 -01 10000 - 19999 2373 70 2121 74 252 -04 20000 - 39999 1464 67 1255 73 209 -06 40000 or more
Census 2000 Total Population
1288 64 1057 70 231 -06
Under 5000 6210 115 6137 115 73 -005 5000 - 9999 2550 73 2422 74 128 -01 10000 - 19999 2376 70 2126 74 250 -04 20000 - 39999 1636 75 1421 81 215 -06 40000 or more
Percent Change in the Total Population 1990-2000
1484 70 1217 78 267 -08
Decrease of more than 100 1091 261 1064 266 27 -05 Decrease of 51 to 100 1055 85 1026 86 29 -01 Decrease of 50 or less No Change or Increase of less
1799 58 1716 59 83 -01
than 50 2404 46 2288 47 116 -01 Increase of 50 to 99 2091 48 1936 50 155 -01 Increase of 10 or more
School District Type
5814 103 5293 109 521 -06
Elementary School District 2684 146 2682 146 2 -0001 Secondary School District 491 72 491 72 0 00 Unified School District 11071 78 10140 81 931 -03
School districts with known boundary errors those affected by military base closures extreme outliers and with less than 30 school-age children enumerated in Census 2000 are excluded from the calculations of the percent errors Source US Census Bureau Population Division Internet Release Date June 3 2004
59
POPULATION DIVISION WORKING PAPER SERIES
For copies of these working papers please contact the Statistical Information Staff Population Division Bureau of the Census Washington DC 20233-8800 (301)763-2422popcensusgov
No 1 - The Census Bureau Approach for Allocating International Migration to States Counties and Places 1981-1991 David L Word October 1992
No 2 - Geographic Coding of Administrative Records--Past Experience and Current Research Douglas KSater April 1993
No 3 - Postcensal Population Estimates States Counties and Places John F Long August 1993
No 4 - Evaluating the Passel-Word Spanish Surname List 1990 Decennial Census Post Enumeration Survey Results R Colby Perkins August 1993
No 5 - Evaluation of Postcensal County Estimates for the 1980s Sam T Davis March 1994
No 6 - Metropolitan Growth and Expansion in the 1980s Richard L Forstall and James D Fitzsimmons April 1993
No 7 - Geographic Coding of Administrative Records -- Current Research in ZIPSector-to-County Coding Process Douglas K Sater June 1994
No 8 - Illustrative Ranges of the Distribution of Undocumented Immigrants by State Edward W Fernandez and J Gregory Robinson October 1994
No 9 - Estimates of Emigration of the Foreign-Born Population 1980-l990 Bashir Ahmed and J Gregory Robinson December 1994
No 10 - Estimation of the Annual Emigration of US Born Persons by Using Foreign Censuses and Selected Administrative Data Circa 1980 Edward W Fernandez January 1995
No 11- Using Analytic Techniques to Evaluate the 1990 Census Coverage of Young Hispanics Edward Fernandez May 1995
No 12 - Metropolitan and Nonmetropolitan Areas New Approaches to Geographical Definition Donald C Dahmann and James D Fitzsimmons October 1995
No 13 - Building a Spanish Surname List for the 1990s--New Approach to An Old Problem David L Word and R Colby Perkins Jr February 1996
No 14 - Fertility of American Men Amara Bachu March 1996 60
No 15 - Comparisons of Selected Social and Economic Characteristics Between Asians Hawaiians Pacific Islanders and American Indians (Including Alaskan Natives) Edward W Fernandez June 1996
No 16 - Findings on Questions on Race and Hispanic Origin Tested in the 1996 National Content Survey Prepared in the Population Division by the Racial Statistics Branch and the Ethnic and Hispanic Statistics Branch December 1996
No 17 - Race and Ethnicity Classification Consistency Between the Census Bureau and the National Center for Health Statistics Larry Sink February 1997
No 18 - Results of the 1996 Race and Ethnic Targeted Test May 1997
No 19 - Who RespondsWho Doesnrsquot Analyzing Variation in Mail Response Rates During the 1990 Census David L Word July 1997
No 20 - Trends in Marital Status of US Women at First Birth 1930 to 1994 Amara Bachu March 1998
No 21 - State Estimates of Organized Child Care Facilities Lynne Casper and Martin OrsquoConnell March 1998
No 22 - How Well Does the Current Population Survey Measure the Foreign-Born Population in the United States Dianne Schmidley and J Gregory Robinson April 1998
No 23 - Poverty Family Structure and Child Well-Being Indicators from the SIPP Jason Fields and Kristin Smith April 1998
No 24 - Child Well-Being Indicators from the SIPP Kristin Smith Loretta Bass and Jason Fields April 1998
No 25 - Timing of First Births 1930-34 1990-94 Amara Bachu May 1998
No 26 - Co-Resident Grandparents and Grandchildren Grandparent Maintained Families Lynne Casper and Ken Bryson March 1998
No 27 - Population of the 100 Largest Cities and Other Urban Places in the United States 1790 to 1990 Campbell Gibson June 1998
No 28 - Are There Differences in Voting Behavior Between Naturalized and Native-born Americans Loretta E Bass and Lynne M Casper March 1999
No 29 - Historical Census Statistics on the Foreign-born Population of the United States 1850-1990 Campbell J Gibson February 1999
61
No 30 - Direct Measures of Poverty as Indicators of Economic Need Evidence from the Survey of Income and Program Participation Kurt J Bauman November 1998
No 31 - American Community Survey and Intercensal Population Estimates Where Are the Cross-roads Amy Symens December 1998
No 32 - Womenrsquos Labor Force Attachment Patterns and Maternity Leave A Review of the Literature Kristen Smith and Amara Bachu January 1999
No 33 - Evaluation of Relationship Marital Status and Grandparents Items on the Census 2000 Dress Rehearsal Charles Clark and Jason Fields April 1999
No 34 - Unbinding the Ties Edit Effects of Marital Status on Same Gender Couples Charles Clark and Jason Fields April 1999
No 35 - Racial-Ethnic and Gender Differences in Returns to Cohabitation and Marriage Evidence from the Current Population Survey Philip N Cohen May 1999
No 36 - How Does POSSLQ Measure Up Historical Estimates of Cohabitation Lynne Casper Philip N Cohen and Tavia Simmons May 1999
No 37 - Childlessness Among American Women On the Rise Amara Bachu May 1999
No 38 - Methodology and Assumptions for the Population Projections of the United States 1999 to 2100 Frederick Hollman Tammany Mulder and Jeffrey Kallan January 1999
No 39 - What Do We Know About the Undercount of Children Kirsten K West and J Gregory Robinson August 1999
No 40 - Canceled
No 41 - Canceled
No 42 - Measures of Help Available to Households in Need Their Relationship to Well-Being Welfare and Work Kurt Bauman and Barbara Downs May 2000
No 43 - Have We Reached the Top Educational Attainment Projections of the US Population Jennifer Cheeseman Day and Kurt Bauman May 2000
No 44 - The Emerging American Voter An Examination of the Increase in the Black Vote in November 1998 Avalaura L Gaither and Eric C Newburger June 2000
No 45 - An Analysis of State and County Population Changes by Characteristics 1990-1999 Amy Symens Smith Bashir Ahmed and Larry Sink November 2000
62
No 46 - The Effect of Work and Welfare on Living Conditions in Single Parent Households Kurt Bauman August 2000
No 47 - Canceled
No 48 - Canceled
No 49 - Variations in State Mortality From 1960 to 1990 Monique Oosse September 2003
No 50 - Accuracy of the US Census Bureau National Population Projections and Their Respective Components of Change Tammany Mulder November 2002
No 51 - US Census Bureau Measurement of Net International Migration to the United States 1990 to 2000 Tammany Mulder Frederick Hollmann Lisa Lollock Rachel Cassidy Joseph Costanzo and Josephine Baker February 2002
No 52 - At-Risk Conditions of US School-Age Children Robert Kominski Amie Jamieson and Gladys Martinez June 2001
No 53 - Home Schooling in the United States Trends and Characteristics K J Bauman August 2001
No 54 - Evaluation of the 1990 School District Level Population Estimates Based on the Synthetic Ratio Approach E R Miller September 2001
No 55 - State Estimates of Child Care Establishments 1977-1997 Grace OrsquoNeil and Martin OrsquoConnell August 2001
No 56 - Historical Census Statistics on Population Totals by Race 1790 to 1990 and by Hispanic Origin 1970 to 1990 for the United States Regions Divisions and States Campbell Gibson and Kay Jung September 2002
No 57 - Evaluating Forecast Error in State Population Projections Using Census 2000 Counts Paul Campbell July 2002
No 58 - Evaluating Components of International Migration Estimates of the Foreign-Born Population by Migrant Status 2000 Kevin Deardorff and Lisa Blumerman November 2002
No 59 - Evaluating Components of International Migration Legal Migrants Marc Perry Barbara Van der Vate Lea Auman and Kathy Morris November 2001
No 60 - Evaluating Components of International Migration Temporary (Legal) Migrants Rachel Cassidy and Lucinda Pearson November 2001
63
No 61 - Evaluating Components of International Migration The Residual Foreign Born Joe Costanzo Cynthia Davis Caribert Irazi Daniel Goodkind Roberto Ramirez January 2002
No 62 - Evaluating Components of International Migration Foreign-Born Emigrants Tammany Mulder Betsy Guzmaacuten and Angela Brittingham June 2002
No 63 - Evaluating Components of Internation Migration Native-Born Emigrants Jim C Gibbs Gregory S Harper Marc J Rubin and Hyon B Shin January
2003
No 64 - Evaluating Components of International Migration Migration Between Puerto Rico and the United States Matt Christenson January 2002
No 65 - Evaluating Components of International Migration Quality of Foreign-Born and Hispanic Population Data Art Cresce Roberto Ramirez and Gregory Spencer July 2002
No 66 - Evaluating Components of International Migration Consistency of 2000 Nativity Data Nolan Malone January 2002
No 67 - Evaluation of Census Bureaursquos1995-2025 State Population Projections Ching Li Wang October 2002
No 68 - Guide To International Migration Statistics The Sources Collection and Processing of Foreign-Born Population Data at the US Census Bureau Joseph M Costanzo Cynthia J Davis and Nolan Malone October 2002
No 69 - Seasonality of Moves and Duration and Tenure of Residence 1996 Jason Schachter and Jeffrey Kuenzi December 2002
No 70 - Evaluation of 2000 Subcounty Population Estimates Greg Harper Chuck Coleman and Jason Devine May 2003
No 71 - People Might Move Out but Housing Units Donrsquot An Evaluation of the State and County Housing Unit Estimates Jason Devine and Charles Coleman April 2003
No 72 - Analysis of General Hispanic Responses in Census 2000 Arthur R Cresce and Roberto R Ramirez September 2003
No 73 - Measuring the Foreign-Born Population in the United States With the Current Population Survey 1994-2002 A Dianne Schmidley and J Gregory Robinson October 2003
64
No 74 - Evaluation of April 1 2000 School District Population Estimates Based on the Synthetic Ratio Method Monique Oosse Release Pending
65
- Based on the Synthetic Ratio Method
- I Introduction
- II Methods and Data
-
- A Base Population 1990 Census Data
- B Estimates of Change Over Time April 1 2000 County Pop
- C Standard for Calculating Errors Census 2000 Data
-
- III Results April 1 2000 School District Estimates
-
- A School-Age Population Estimates
- B Total Population Estimates
- C Estimating the Error Attributed to the Synthetic Ratio Me
- D Comparisons with Past Research
-
- IV Evaluation
-
- A 1990 Census Population
- B Census 2000 Population
- C Percent Population Change 1990 ndash 2000
- D Census Divisions
- E Type of School District
- F Errors for School Districts with Total Populations of 20
- G Errors for School Districts that Were Not Coterminous wit
-
- V Conclusion
- Appendix A Identifying Overlapping School Districts
- Appendix B Cohort-Component and Ratio Methods for Calculat
- Appendix C Treatment of 1990 Census and Census 2000 School
- References
- Figure 1
- Figure 2
- Figure 3
- Figure 4
- Figure 5
- Figure 6
- Figure 7
- Figure 8
- Figure 9
- Figure 10
- Figure 11
- Figure 12
- Table 1
- Table 2
- Table 3
- Table 4
- Table 5
- Table 6
- Table 7
- Table 8
- Table 9
- Table 10
- Table 11
- Table 12
- Table 13
- Table 14
- Table 15
- Table 16
- Population Division Working Paper Series
-