evaluation of an x-ray digital radiography system world conference on nondestructive testing, 16-20...
TRANSCRIPT

18th World Conference on Nondestructive Testing, 16-20 April 2012, Durban, South Africa
Evaluation of an X-ray Digital Radiography System
Ike SIKAKANA, Mohapi THEBE
Department of Non-Destructive Testing and Physics,
Vaal University of Technology; Vanderbijlpark,
Gauteng, South Africa
Phone: +27 16950 9761, Fax: +27 16950 9794
e-mail: [email protected], [email protected]
Abstract
Digital imaging technology as applied in industrial radiography continues to improve with time. The detector based
digital industrial radiography (DIR) is steadily replacing film based radiography and surpassing the use of computed
radiography. DIR is currently being used in a broad range of industries, including aerospace, power plants,
refineries, the security sector and artwork analysis.
This paper presents results of a DIR system evaluation that addresses confidence in methodology and capabilities of
the instrumentation. A variety of custom designed step wedges and a part fir-tree turbine blade jig are used in this
study.
The presented methodology facilitates the quantification and optimisation of resolution and contrast for the step
wedges. The identification of internal pin-like voids in the turbine blade jig and their dimensions shows the
reliability of the DIR system.
For proper system calibration and operation, training and experience of personnel is important; particularly in data
processing and interpretation.
Keywords: digital industrial radiography (DIR), step wedge, fir-tree turbine blade
1. Introduction
The increasing use of DIR systems poses a variety of challenges, of which the most pressing are
confidence in methodology / procedure and limitations on instrument capability. These
challenges are as a result of the fact that film-based industrial radiography is a well-established
and an extensively documented technique.
Manufacturers of DIR systems continually produce scientific evidence that supports the
‘superiority’ of their systems over film-based industrial radiography [1,2]. A survey of their
literature reveals that they present a variety of applications where their products evaluate
components in minimal time and at reduced costs. Their literature, therefore, in the main
provides compelling arguments that the DIR systems increase productivity while at the same
time reduces radiation exposure to the radiographers.
In this study the performance of a combination of the Vidisco foX-Rayzor flat panel detector
(FPD), its data acquisition component and the use of a Balteau NDT Ceram 235 as the X-ray
generator is evaluated.
This integrated system performance is evaluated by using different custom machined specimen,
namely, step wedges and a turbine blade root. Figure 1, below shows the step wedges used in
our study; one of carbon steel and the other of aluminium.

a) Carbon steel b) Aluminium
Figure 1. Step Wedges
As can be observed in figure 1, these are four step wedges starting at a minimum thickness of
4 mm to a maximum thickness of 10 mm, with 2 mm step differences between them.
The choice of materials used is based on their approximate radiographic equivalence factors. At
X-ray voltages of between 50 kV and 100 kV, aluminium is taken as the standard metal, while at
higher voltages steel becomes the standard metal.
The use of step wedges is derived from the fact that their radiographs yield important parameters
for image quality [3-5]. The step wedges were radiographed at several different exposures at
each voltage.
Figure 2 below shows one-part of a custom machined carbon steel turbine blade root (fir-tree
design). This test sample was primarily used for the verification of the instrument capability.
a) Pictorial view b) Dimensional sketch
Figure 2. One-part fir-tree design turbine blade root, with dimensions in mm
Turbine blades are rotating components in fossil fuel power plants. They are thus some of the
highly stressed components in a turbine / generator, particularly certain areas of the blade roots
and blade attachment grooves [6,7]

2. Equipment Specification and Literature Review of Performance
2.1 The Vidisco foX-Rayzor Digital X-ray System
According to specifications, the foX-Rayzor FPD can be used in combination with a Vidisco
supplied 270 kV pulsed X-ray source or almost any X-ray source / isotope. The recommended
X-ray sources must be up to 160 kV, otherwise shielding is required for higher voltages.
2.1.1 Classification of Imager
This detector is composed of X-ray scintillate, photodiode and thin film transistor (TFT). The
TFT is an electronic switch made from amorphous silicon (a-Si) on a flat panel detector / imager,
allows the charge collected at each pixel to be independently transferred to electronic circuits
where it is amplified by photomultiplier to be then converted from analog to digital into 512 gray
shades in order to produce the digital image data. The digital image will be processed to produce
the suitable image for display and diagnosis on the control and display unit (CDU) (laptop
computer) [8]. The imager control unit (ICU) serves as the interface between the flat panel
detector / imager and the CDU.
This system has been used in the petrochemical and pipeline industry, shipyards and in the
service of art and other industries [1]
2.1.2 Image Quality
Image quality of a computed radiography image includes geometric unsharpness, signal/noise
ratio, scatter and contrast sensitivity.
The amorphous silicon flat panel imager is 13 mm deep. The panels have a wide dynamic range
of 16 384 gray scale levels (14 bit) and high resolution of 3.5 line pair / mm and imaging area of
482 cm2. Super sensitive panels reveal layers of information that enable increased detection
capabilities with more details for improved analysis.
2.2 Balteau NDT Baltospot – Ceram 235
The generator uses a pulsed wave high voltage that can drive a higher current at full power and
will still keep an extremely broad spectrum to guarantee that soft X-rays will be present even at
full kV giving a contrast that is not comparable with any other technique at the same kV.
The specifications tables are as below:
Electrical X-ray tube
High voltage range kV
Tube current range mA
70 – 235
0.1 – 5
Beam angle
Focal spot size mm
Inherent filtration mm
40o
2 x 2
1 Be
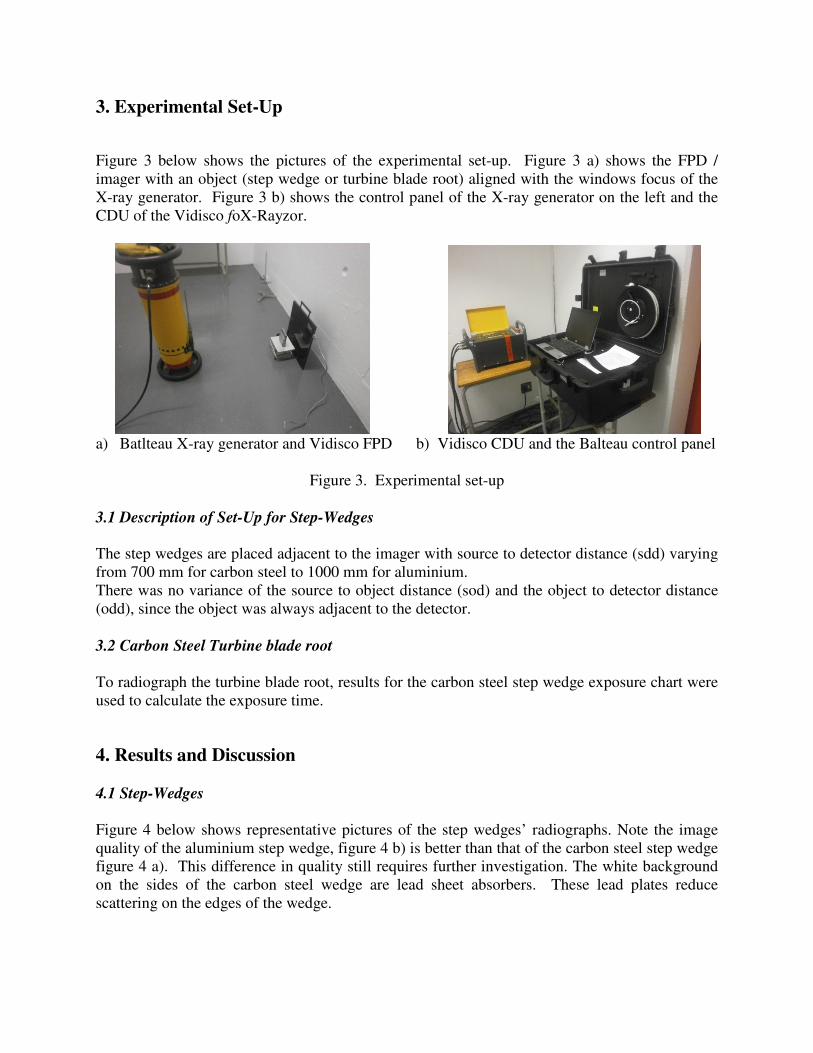
3. Experimental Set-Up
Figure 3 below shows the pictures of the experimental set-up. Figure 3 a) shows the FPD /
imager with an object (step wedge or turbine blade root) aligned with the windows focus of the
X-ray generator. Figure 3 b) shows the control panel of the X-ray generator on the left and the
CDU of the Vidisco foX-Rayzor.
a) Batlteau X-ray generator and Vidisco FPD b) Vidisco CDU and the Balteau control panel
Figure 3. Experimental set-up
3.1 Description of Set-Up for Step-Wedges
The step wedges are placed adjacent to the imager with source to detector distance (sdd) varying
from 700 mm for carbon steel to 1000 mm for aluminium.
There was no variance of the source to object distance (sod) and the object to detector distance
(odd), since the object was always adjacent to the detector.
3.2 Carbon Steel Turbine blade root
To radiograph the turbine blade root, results for the carbon steel step wedge exposure chart were
used to calculate the exposure time.
4. Results and Discussion
4.1 Step-Wedges
Figure 4 below shows representative pictures of the step wedges’ radiographs. Note the image
quality of the aluminium step wedge, figure 4 b) is better than that of the carbon steel step wedge
figure 4 a). This difference in quality still requires further investigation. The white background
on the sides of the carbon steel wedge are lead sheet absorbers. These lead plates reduce
scattering on the edges of the wedge.

a) Carbon Steel b) Aluminium
Figure 4. Step Wedge radiographs
The desired gray value was calculated to be 140.8 for 256 gray shades, while for the 16 384 gray
shades, it was calculated to be 9011.2. These gray values corresponded with a 2.2 optical density
on the film radiography [9]. The below equation was used for the calculation of the
corresponding thickness for the desired gray value.
( ) bstepofThicknessbstepofvalueGreyvaluegreydesiredbstepofvalueGreyastepofvalueGrey
bstepofThicknessastepofThicknessThickness +−×
−
−=
4.1.1 Carbon Steel
The voltages and current used are shown in table 1, below
Table 1.
Specimen: Carbon Steel sdd: 700mm Voltage: 140kV Current: 0.6mA
Time
(s)
Exposure
(mAs) Step a thickness (mm) Step a gray value Step b thickness (mm) Step b gray value Thickness (mm)
8 4.8 4 73 6 164 5.49
11 6.6 6 111 8 158 7.27
14 8.4 8 129 10 142 9.82
Voltage: 160kV Current: 0.8mA
Time
(s)
Exposure
(mAs) Step a thickness (mm) Step a gray value
Step b thickness (mm)
Step b gray value Thickness (mm)
5 4 4 5433 6 10347 5.46
6.8 5.44 6 7114 8 9993 7.32
7.8 6.24 8 8356 10 9368 9.29

Voltage: 180kV Current: 1.0mA
Time
(s)
Exposure
(mAs) Step a thickness (mm) Step a gray value
Step b thickness (mm)
Step b gray value Thickness (mm)
2 2 4 3080 6 9094 5.97
3 3 6 7159 8 9860 7.37
4.4 4.4 8 8549 10 9610 8.87
4.1.2 Aluminium
The voltages and current used are shown in table 2, below
Table 2
Specimen: Aluminium sdd: 1000 mm Voltage: 70kV Current: 0.1mA
Time
(s)
Exposure
(mAs) Step a thickness (mm) Step a gray value Step b thickness (mm) Step b gray value Thickness (mm)
25 2.5 4 120 6 144 5.73
26 2.6 6 135 8 149 6.83
27 2.7 8 132 10 150 8.98
Voltage: 75kV Current: 0.1mA
Time
(s)
Exposure
(mAs) Step a thickness (mm) Step a gray value Step b thickness (mm)
Step b gray value Thickness (mm)
21 2.1 4 120 6 143 5.81
23 2.3 6 132 8 149 7.04
25 2.5 8 135 10 154 8.61
Voltage: 80kV Current: 0.1mA
Time
(s)
Exposure
(mAs) Step a thickness (mm) Step a gray value Step b thickness (mm)
Step b gray value Thickness (mm)
17 1.7 4 127 6 148 5.31
20 2 6 129 8 142 7.82
23 2.3 8 130 10 148 9.2
Figure 5 below shows the exposure charts and these are comparative to work by SOTJA E,
NARDONI G and NARDONI P [3].

a) Carbon Steel
b) Aluminium
Figure 5. Exposure Charts,

4.2 Turbine Blade
Figure 6 are the pictures of the turbine blade root. A voltage of 140 kV and current of 0.6 mA
was used to radiograph the turbine blade root. It can be observed that there are small hole in fin
one and two. These hole simulate flaws
a) Exposure time = 43s b) Exposure time = 42s
Figure 6. Part turbine blade root radiographs
The compatibility of the X-ray generator and foX-Rayzor FPD system has shown that good
results can be obtained when these systems are operated optimally.
5. Conclusions
The performance of an inspection system is paramount for providing reliable and reproducible
results, given the same initial conditions and following the same procedure. It also must be
capable of identifying and measuring flaws in different sample geometries.
This work begins to address system compatibility, so that the inspection process can be trusted.
The development and testing of the optimal source – digital detector configurations for different
materials is inherently a key component in this study.
The turbine blade results do not purport that DIR is the most appropriate nor efficient method to
use, but to merely show what can be achieved in a short space of time.
The study points towards future improved inspection considerations using this system
integration.
Future studies will contribute to the education and training procedures for the qualification of
NDT personnel in digital radiography, hence applicable codes, standards and specifications.

Acknowledgements
Ms Zandi Buthelezi and Ms Boitumelo Sekudu are hereby acknowledged for their initial work on
these samples – radiography on the step-wedges and Phased Array Ultrasonics on the turbine
blade root - respectively.
References
1. Ron Pincu, ‘Digital Radiography and its advantages in Field NDT Inspection Today’,
17th
World Conference on Non-Destructive Testing, 25 – 28 October 2008, Shanghai, China.
2. Steve Jelfs, ‘Optimized Digital Radiography Using Co-60, Ir-192 and Se-75 Sources to
Achieve Weld-Quality Images’, ASNT Digital Imaging VII, July 2009, Mashantucket, CT.
3. Enkelejda Sotja, Giuseppe Nardoni and Pietro Nardoni, ‘Contrast Gradient Determination in
Digital Radiography to Optimize the Capability in Defect Detection’
4. U Zscherpel, K Osterloh and U Ewert, ‘Unsharpness characteristics of digital detectors for
industrial imaging’, DGZfP – Proceedings BB 84-CD, pp 175 – 185, CT-IP 2003.
5. R Nomoto, A Mishima, K Kobayashi, JF McCabe, BW Darvell, DC Watts, Y Momoi and S
Hirano, ‘Quantitative determination of radio-opacity: Equivalence of digital and film X-ray
systems’, Dental Materials 24 , pp 141 – 147, 2008.
6. Michael F Opheys, Hans Rauschenbach and Michael Siegel, ‘Blade Root / Blade Attachment
Inspection by advanced UT and Phased Array Technique’, 6th
International Charles Parsons
Turbine conference, 16 – 18 September 2003, Trinity College Dublin.
7. Kumar Raja, Vaidehi Ganesan, T Saravanan, S Bagathiappan and Krishnan
Balasubramaniam, ‘Detection of Micro-Cracks in the HP Turbine Blades Using Phased
Array and Radiography Techniques and Enhancement of Radiographic Images by Image
Processing’, Proceedings of the National Seminar & Exhibition on Non-Destructive
Evaluation, pp 298 – 303, 10 – 12 December 2009.
8. Wafik Harara, ‘Digital Radiography in Industry’, 17th
World Conference on Non-Destructive
Testing, 25 – 28 October 2008, Shanghai, China.
9. VN Misale, S Ravi and R Narayan, ‘Digital Radiography Systems Techniques and
Performance Evaluation for Space Applications’, Proceedings of the National Seminar &
Exhibition on Non-Destructive Evaluation, pp 172 – 176, 10 – 12 December 2009.