evaluation of an activated alumina sorption system for
TRANSCRIPT

EVALUATION OF AN ACTIVATED ALUMINA SORPTION SYSTEM
FOR REMOVAL OF FLUORIDE FROM WATER
by
UKIWO OBASI ONUOHA, B.S. in Ch.E.
A THESIS
IN
CHEMICAL ENGINEERING
Submitted to the Graduate Faculty of Texas Tech University in
Partial Fulfillment of the Requirements for
the Degree of
MASTER OF SCIENCE
IN
CHEMICAL ENGINEERING
Approved
May, 1983

ACKNOWLEDGMENTS
The author would like to express his sincere gratitude to Dr.
Richard Wm. Tock for his helpful advice and guidance during this study.
Sincere thanks are also due to Dr. Steven R. Beck and Dr. H. R.
Heichelheim, other members of the committee, for their devotion, sugges
tions and constructive criticisms. Their contributions have been ^er)j
helpful.
I would also like to thank Sue Willis for her diligence in typing
this work.
Special thanks are due to my wi-f'e, Marianne Onuoha, for her inval
uable steady support and patience throughout the period of the study.
n

TABLE OF CONTENTS
PAGE
ACKNOWLEDGMENTS ii
LIST OF TABLES v
LIST OF FIGURES vi
CHAPTER 1 INTRODUCTION 1
Fluoride Ecology 1
Removal Techniques 3
This Study 5
CHAPTER 2 LITERATURE REVIEW 7
Methods 7
Precipitation Methods 8
Adsorption Methods 9
Earlier Methods Used in Fluoride Removal 9
Alum Coagulation 10
Lime Softening 16
Activated Carbon 23
Zeolite 25
Mi xed Bed Demi neral i zer 26
Bone 27
Bone Char 27
Synthetic Bone Material (Tricalcium Phosphate) 28
Activated Alumina 29
Defluoridation Plant (Bartlett, Texas) 32
Current Trends in Fluoride Removal 36
Regeneration of Activated Alumina with
Aluminum Sulfate 36
Fluoride Removal Using a Fluidized Bed 44
iii

PAGE
CHAPTER 3 EXPERIMENTAL PROCEDURES 57
Procedure for Determination of Fluoride
Concentration i n Water 57
Batch Studies 58
pH 58
Concentrati on Effects 59
Effect of Temperature on Exchange
Capacity During Sorption 60
Batch Thermal Regeneration Study 61
Column Study 62
Column Regeneration Study 63
CHAPTER 4 RESULTS AND DISCUSSION 67
Calibration Curve 67
pH Effects 67
Concentration Effects 74
Isotherm Study, Temperature Effects 74
Batch Thermal Regeneration 90
Packed Column Study 96
Packed Column Regeneration 99
CHAPTER 5 CONCLUSIONS AND RECOMMENDATIONS 104
Conclusions 104
Recommendations 105
BIBLIOGRAPHY 106
APPENDIX 109
TV

LIST OF TABLES
PAGE
TABLE 2-1. Alum Flocculation With and Without Lime
TABLE 2-2. Fluoride Removal by Aluminum Sulfate (21)...,
TABLE 2-3. Fluoride Removal by Lime Softening
TABLE 2-4. Magnesium Removal in Relation to an Effluent Fluoride Concentration of 1.0 ppm
TABLE 2-5. Fluoride Removal Media
TABLE 2-6. Removal of Fluorides By Contact Filter
of Activated Alumina
TABLE 2-7. Efficiency of Activated Alumina Regeneration,
TABLE 2-8. Column Fluidization Characteristics
TABLE 2-9. Fluidized Activated Alumina Fluoride Removal Capacity
TABLE 3-1. List of Apparatus Components (Sizes) and Chemical Reagents Used
TABLE 4-1. Residual Fluoride Concentration in Solution During Contact With 0.1 Grams Activated Alumina
TABLE 4-2. Relationship Between Exchange Capacity of Activated Alumina and the Amount of the Adsorbent at Different Temperatures
TABLE 4-3. Residual Fluoride in Solution Contacted With Varying Amounts of Activated Alumina, pH = 5.0, Temp. = 24.5 + 0.5°C
TABLE 4-4. Results of the Packed Column Regeneration. Influent Fluoride Concentration = 520 ppm...
14
17
19
22
31
33
53
55
56
64
75
87
88
103

LIST OF FIGURES
PAGE
Figure 2- 1. Removal of Fluorides with Aluminum Sulfate pH = 7.2-7.4 (2) f^ = Initial Fluoride Concentration (ppm) 11
Figure 2- 2. Fluoride Removal by Alum Flocculation (Incremental Feeding of Alum During Mixing) (5) 13
Figure 2- 3. Effect of pH on Fluoride Removal (Alum dosage = 250 ppm) (5) 15
Figure 2- 4. Fluoride vs. Magnesium Removal as Predicted by Equation 2-1 (21) 20
Figure 2- 5. Schematic Layout of Defluoridation Unit at Bartlett, TX (15) 35
Figure 2- 6. Schematic Diagram of Apparatus Used in Defluoridation Studies 37
Figure 2- 7. Relation of Exchange Capacity and Regeneration Level (20) 39
Figure 2- 8. Relation of Exchange Capacity and Regeneration Efficiency (20) 40
Figure 2- 9. Exchange Capacity of Activated Alumina vs. Regeneration Time (20) 42
Figure 2-10. Exchange Capacity of Activated Alumina vs. Fluoride Ion Concentration in Influent (20) 43
Figure 2-11. Relation of Exchange Capacity and pH of Influent (20) 45
Figure 2-12. Schematic Diagram of Fluidized Reactor System for Defluoridation Studies (1) 47
Figure 2-13. Effect of Activated Alumina Particle Size on Fluoride Removal Capacity (1) 49
Figure 2-14. Effect of pH on Alumina Fluoride Removal Capacity (1) 50
Figure 2-15. Effect of Influent Fluoride Concentration on Alumina Fluoride Removal Capacity (1) 51
VI

PAGE
Figure 2-16. Exchange Capacity of Activated Alumina vs. Alkalinity of Influent (1) 52
Figure 3- 1. Schematic Diagram of the Apparatus Used in the Defluoridation Study 65
Figure 4- 1. Calibration Curve Showing Fluoride Concentration versus Millivolts at pH 5 and 24.5°C 68
Figure 4- 2. Temperature Dependence of the Fluoride Specific Ion Probe 69
Figure 4- 3. pH Dependence of the Fluoride Specific pH Dependence of the Fluoride Speci Ion Probe. T = 24.5°C 70
Figure 4- 4. Relationship Between Residual Fluoride Concentration in Solution and the pH at Different Contact Times. T = 24.5°C 71
Figure 4- 5. Relationship Between the Exchange Capacity of Activated Alumina and the pH of Influent. T = 24.0 + 0.5°C 72
Figure 4- 6. Relationship Between Exchange Capacity and Initial Fluoride Concentration. T = 24.5°C, pH = 5.0, Contact Time = 10 hrs 76
Figure 4- 7. Residual Fluoride in Solution Using 4.0 ppm Initial Fluoride Concentration at pH 5, 24.5 C and Various Doses of Activated Al umi na 77
Figure 4- 8. Residual Fluoride in Solution Using 8.0 ppm Initial Fluoride Concentration at pH 5, 24.5 C, and Various Doses of Activated Alumina 78
Figure 4- 9. Residual Fluoride in Solution Using 2.0 ppm Initial Fluoride Concentration at pH 4.95, 24.5 C and Various Doses of Acti vated Al umi na 79
Figure 4-10. Residual Fluoride in Solution Using 2.0 ppm Initial Fluoride Concentration at pH 4.90, 56.0 C and Various Doses of Acti vated Al umi na 80
v n

PAGE
Figure 4-11. Residual Fluoride in Solution Using 4.0 ppm Initial Fluoride Concentration at pH 4.90, 55.5°C and Various Doses of Activated Alumina 81
Figure 4-12. Residual Fluoride in Solution Using 8.0 ppm Initial Fluoride Concentration at pH 4.92, 55.0°C and Various Doses of Activated Alumina 82
Figure 4-13. Residual Fluoride in Solution Using 2.0 ppm Initial Fluoride Concentration at pH 4.98, 5.0°C and Various Doses of Activated Alumina 83
Figure 4-14. Residual Fluoride in Solution Using 4.0 ppm Initial Fluoride Concentration at pH 4.98, 5.0°C and Various Doses of Acti vated Al umi na 84
Figure 4-15. Residual Fluoride in Solution Using 8.0 ppm Initial Fluoride Concentration at pH 4.97, 5.0 C and Various Doses of Acti vated Al umi na 85
Figure 4-16. Relationship Between Exchange Capacity and the Ratio of Initial Fluoride Concentration to a Unit Weight of Sorbent. T = 24.5 + 0.5°C, pH = 5.0 T 89
Figure 4-17. Residual Fluoride in Solution at Different Temperatures and Quantity of Activated Alumina 91
Figure 4-18. Residual Fluoride Concentration in Solution Using a Virgin Activated Alumina and the Sorbent Regenerated at Different Temperatures 92
Figure 4-19. Relationship Between Fluoride Removed Per Unit Weight of Activated Alumina, the Virgin Sorbent and Sorbent Regenerated at Different Temperatures 93
Figure 4-20. Relationship Between the Exchange Capacities of Thermally Regenerated Sorbent and Regeneration Temperatures 94
vm

PAGE
Figure 4-21. Breakthrough Curve Showing the Effluent Fluoride Concentration at Different Times Using Initial Fluoride Concentration of 10 ppm 97
Figure 4-22. Breakthrough Curve Showing the Effluent Fluoride Concentration at Different Times Using Wastewater from Texas Instruments 520 ppm Fluoride 98
Figure 4-23. Breakthrough Curve Showing the Effluent Fluoride Concentration at Different Times Using Activated Alumina Regenerated with a 2 Percent Sodi um Hydroxi de 100
Figure 4-24. Breakthrough Curve Showing the Effluent Fluoride Concentration at Different Times Using Activated Alumina Thermally Regenerated at 800°F 102
IX

CHAPTER 1
INTRODUCTION
Fluoride Ecology
Fluorine, the most electronegative of all elements, rarely occurs
free in nature. It combines chemically to form fluorides which can be
found in varying amounts in soils, water, the atmosphere, vegetation and
in body tissues. A study conducted by the National Academy of Sciences
(17) found inorganic fluoride compounds to constitute the most important
sources of fluoride toxicosis in man and livestock. Organic fluoride
(compounds in which fluorine is bound to carbon) have not yet been
identified as a major source of concern in fluoride toxicosis.
Fluoride ingested in small amounts may be beneficial. Studies (8,
9, 17) have shown that trace quantities of fluoride are needed for the
development of cavity-resistant teeth and may also be necessary in pre
venting excessive demineralization of bone (osteoporosis) in aged indi
viduals. However, numerous field studies and research point to the fact
that excessive fluoride ingestion by animal and man can result in
permanent bone and teeth deformities. At a minimum, endemic dental flu
orosis (fluorotic lesions in permanent dentition) can occur and mottling
of teeth characterized by dull-white, chalk-like patches or striations
of the enamel or by a defective calcification of the enamel described as
hypoplasia can lead to an early loss of teeth. A severe case of dental
fluorosis, often seen as crsamy yellow to brown or black discoloration
of the teeth, results in a rapid erosion of the enamel. Several

standards that have been developed for classification of dental fluoro
sis have been described in detail (8, 9, 17). Fluorosis generally tends
to occur more frequently in areas with fluoride levels of 1.5 parts per
million or more in the drinking water. Other skeletal problems that
have been linked to fluoride toxicity include stiffness, rheumatism, and
permanent crippling rigidity (4). Some clinical and experimental stud
ies have suggested a link between kidney defects and long term fluoride
ingestion (17).
In order to alleviate the adverse effects that may result from a
long term ingestion of excess fluoride, the U.S. Public Health Service
Drinking Water Standards have set a mandatory limit on the level of
fluoride allowed in the drinking water of any particular area (1, 13).
These doses vary from location to location depending on the annual aver
age of the maximum ambient temperature of that particular area (1, 6).
The premise is that people consume more water generally in warmer
climates and therefore reducing the level of fluoride content in the
drinking water also reduces the danger of excessive fluoride intake.
Despite these standards however, reportedly more than 600 water supplies
in the U.S. serving approximately 1.5 million people contain fluoride in
excess of 1.5 mg/liter (exceeding the 1.0 ppm level recommended for
development of healthy teeth) and only very few of these water treatment
plants include fluoride-removal processes (23).
The common sources of fluoride include: a) airborne contamination
from nearby industrial operations; b) feed supplements for livestock
with excessive fluoride such as in fluorite (CaF^) and fluorapatite
^

(3Ca2(P0^)2'Cg^F2); c) water that is excessive in fluoride — which con
stitutes the single most predominant source of fluoride pollution known
today (3). Fluoride-laden wastewaters are generated from various indus
trial establishments such as those that manufacture pesticides,
disinfectants, wood preservatives, metals, glasses, and fertilizer.
Aluminum smelting plants, manufacturers of microprocessors, uranium
enrichment plants, and nuclear weapon components production and
engineering facilities also produce wastewater with high levels of
fluorides. A great amount of fluoride deposition into the environment
occurs during mining of phosphate rocks when silicon tetrafluoride is
unearthed and released or leached into nearby waters (23).
These and other dangers posed by pollution to health and welfare
call for the need to develop new and improved technologies to prevent,
treat and manage wastewater systems that otherwise would become hazard
ous pollutants.
Removal Techniques
Many attempts made in the past to remove fluoride from drinking
water have met with mixed success (13, 15). Most of these methods were
based on precipitation and involved addition of chemicals in large
amounts to form precipitates or coprecipitates of fluorides. Some of
the chemicals used were aluminum sulfate, lime, calcium phosphates, etc.
Other adsorption methods or ion exchange methods used materials such as
bone char," or activated carbon. The major drawback with the use of
these materials were: low exchange capacities of these materials for
fluoride ions, high media costs, and difficult or expensive regeneration

of the media once they become spent. In addition, many of these materi
als were not specific for removal of fluoride ions (23).
The first break in solving the fluoride problem came in 1936 (1).
In a patent issued to Churchill, the first mention was made that activa
ted alumina could be used in fluoride removal. Activated alumina is
made by heating aluminum oxide to a temperature of 400 to 500°C in the
presence of alkali metal ions. Since 1936 much effort has and is still
being spent in finding ways of making the use of activated alumina in
fluoride removal efficient and economically viable for water treatment
plants. Several studies have shown that the difference in capacity be
tween activated alumina and other materials previously used is the
result of the increased surface area per unit volume and the relative
polarity of the small activated alumina particles (1). Fluoride removal
therefore is a surface phenomenon. The other advantages in using acti
vated alumina besides its high capacity are: low cost, specificity to
fluoride ions and insensitivity to chloride and sulfite ion concentra
tions, and no loss in effectiveness following regeneration. There are
about three locations in the United States using activated alumina as
the medium for removal of fluoride. There are still major problems with
its use however. This is shown by the lack of public acceptance of
water defluoridation plants (13). Excessive costs of treatment plants
and high operating costs of such plants are the major problems.
Moreover, regeneration of'^spent activated alumina is found to be the
single most expensive item in the overall costs of running defluorida
tion plants (6, 19).

This Study
In this research project, we evaluated the factors that affect the
exchange capacity of activated alumina for fluoride ions. These factors
include: initial fluoride concentration of wastewater influent, and pH
of influent. To do this, we used a fixed bed of activated alumina as
the adsorbent media. All analyses were performed in accordance with the
procedures outlined by "Standard Methods of the Examination of Water and
Wastewater." An Orion specific ion electrode and pH/mV meter were used
to monitor all fluoride concentrations. Water containing various
amounts of fluoride was passed through the bed. On contact with the
bed, the fluoride ions were adsorbed on the surface of the activated
alumina. The treated wastewater, with the pH adjusted, was then ready
for consumption. Fluoride capacity and fluoride effluent concentration
were the major dependent variables monitored.
In addition to these, we examined the effect of temperature on the
exchange capacity of activated alumina. Our hypothesis was that sorbed
fluoride can be released by increasing the temperature of the sorbent
material. Thermal regeneration of activated alumina could provide a
less expensive means of prolonging the life of the media. This may in
fact eliminate the complexity and costs of using caustic soda solution
for regeneration. The added advantage here would be that precipitation
of fluoride salts would take place outside the bed area eliminating the
usual problems of plugging commonly associated with other regeneration
schemes presently being used (1, 7, 20).

The packed bed process enabled us to evaluate an effective economic
method for the regeneration of spent media and provide a means of recov
ering fluorides from regenerants. This was necessary because high
concentrations of fluoride recovered along with regenerant solutions
cannot simply be returned to the environment. It should be suitably
disposed of without causing hazard to the environment.

CHAPTER 2
LITERATURE REVIEW
Beginning on June 24, 1977, communities throughout the United
States were required to comply with the Environmental Protection
Agency's (EPA) national interim primary drinking water regulations (18).
Maximum contaminant levels in potable water supplies were established
for ten inorganic chemicals including fluoride. According to the regu
lations, the maximum allowable contaminant level for fluoride can vary
from 1.4 ppm to 2.4 ppm depending on the annual average of the maximum
daily air temperatures. Since ground water sources can exceed these
limits, some removal techniques are required if the water is to be used
for drinking purposes. In the present chapter, we shall review the
state of the art in fluoride removal technology and examine the changes
that have been made in the methods used in the past. We shall also look
at some of the advantages and disadvantages inherent in most of the flu
oride removal schemes that have been used thus far.
Methods
There are a variety of methods for removal of fluoride (4, 16, 18).
The most commonly used methods can be divided into two categories, name
ly, precipitation and adsorption (1, 20). Below is a list of compounds
used in the different methods.

8
Methods of Fluoride Removal from Water
I 1 Precipitation (additive) methods Adsorption (Ion Exchange) Methods
- Alum coagulation - Activated carbon
- Lime softening - Zeolite
- Magnesium sulfate - Mixed bed dimineralizer
- Calcium carbonate - Bone, bone char, and synthetic bone material
- Activated Alumina
Precipitation Methods
These techniques involve addition of chemicals and the formation of
fluoride precipitates or co-precipitates. Among the chemicals used are
lime, calcium chloride, calcium carbonate, aluminum sulfate, and
magnesium sulfate (4, 6, 17, 20). Other substances such as bentonites,
fuller's earth, diatomaceous earth, silica gel, bauxite, sodium
silicate, sodium aluminate and ferric salts have been tried (4, 20).
Precipitation methods usually cannot achieve low fluoride concentration
(4, 6, 23). Fluoride treatment by lime for example has been shown to be
ineffective in dilute (less than 5 ppm) fluoride solutions (23). In
1973, Rabosky and Miller found that fluoride removal by lime precipita
tion was not effective when the fluoride concentration was below 20 mg
per liter (23). Similarly, alum is required in very high dosage before
chemical removal of fluoride is effected. For the most part, the pH of
precipitation processes must be closely controlled because the solubili
ties of the inorganic fluoride complexes are normally pH dependent (22).
Some other drawbacks of the precipitation methods include (1) the

necessity for additional reagents and higher costs; (2) higher shipment
and treatment costs; (3) the large volume of sludge produced.
Adsorption Methods
Adsorption methods utilize the passage of fluoride containing water
through a contact bed. Fluoride is removed by ion exchange or by chemi
cal reaction with the adsorbent. Several types of adsorbents have been
tried. Among these are natural hydroxyapatite, synthetic hydroxyapat-
ite, zeolites, magnesia, trimagnesium phosphate, natural and synthetic
ion resins, activated carbon, activated bauxite, and activated alumina
(20, 22, 23). Superiority of the adsorption methods over those of pre
cipitation tends to come from the fact that adsorbents such as activated
alumina are both economical and exhibit a good capacity for adsorption
of fluoride ions (14, 20). Moreover, the adsorbent can be readily
regenerated and recycled for reuse (6, 19, 23). Hence adsorption
methods are usually appropriate for removal of relatively low concentra
tions of fluoride. They may be used as polishing operations after the
removal of fluoride by precipitation techniques to the 10-20 ppm level
(4).
Earlier Methods Used in Fluoride Removal
During the years following the discovery by McKay that fluoride was
the cause of dental fluorosis, various methods and materials for fluor
ide removal were investigated. Boruff was the first to investigate a
variety of materials for fluoride removal (2). The materials studied
included aluminum sulfate, sodium silicate, ferric fluoride, sodium
aluminate, zeolites, bauxite, silica gel, and lime. Except for lime and

10
aluminum sulfate, none of these materials were found to be yery practi
cal in fluoride removal (2). These earlier findings led Boruff to
investigate further the removal of fluoride with lime and alum. He
stated that considerable amounts of fluoride could be removed by dosing
with alum and removal of the floe by sedimentation and filtration.
Alum Coagulation
In Boruff's investigation, aluminum sulfate dosages of 8.5 ppm (0.5
gram) to 171 ppm (10 grams) per gallon were added to 2.5 liters of raw
water containing known quantities of fluorides (2). The coagulant and
waters were mixed for half an hour by a mechanical stirrer and allowed
to stand for 18-24 hours before filtering off the floe. In the results
obtained, the author observed that increasing dosages of aluminum
sulfate gave proportionately greater removals of fluoride. Figure 2-1
summarizes the results. The dosage requirement for treating a given
concentration of fluoride were given as:
Cone, of Influent ppm per gal. Cone, of Effluent (2) (ppm) Alum (ppm)
2.5 34.0 1.0
5.0 170.0 1_ 0
In addition to these results, the author (2) observed that chloride and
sulfate concentrations as high as 1000 ppm had no effect on the removal
of fluoride by alum.
In another study on the fluoride removal by alum performed at La
Crosse, Kansas by Culp and Stoltenberg, a method that consisted of
application of 225 ppm of alum in increments during rapid mixing and

11
p E S I 0 u A L F L U 0 1 I 0 £
C 3 N
c i p p .i )
PLUM OCSflGiiPPM)
Figure 2-1. Removal of Fluorides with Aluminum Sulfate pH = 7.2-7.4 (2) "f = I n i t i a l Fluoride Concentration (ppn)

12
flocculation followed by settling and rapid sand filtration was verified
(5). It was desired to reduce the raw water fluoride concentration from
3.6 to 1.0 ppm. The variables studied included effects of a) lime, b)
rate of feed of alum, e) pH, d) mixing time, 3) coagulant aids, and f)
chemical composition of treated water. Their results showed that fluor
ide removal was proportional to the alum dosage. Figure 2-2. The effi
ciency appeared to decrease as higher dosages were employed; 3.50 ppm of
alum were needed to reduce 3.6 ppm initial fluoride influent concen
tration to the required 1.0 ppm. Table 2-1 shows fluoride removal using
alum flocculation with and without addition of lime during rapid mixing.
The authors (5) recommended addition of the lime near the end of the
flocculation period because of the tendency for calcium to slightly in
terfere with fluoride removal (5). Further results also showed that 10
percent less alum was required for the corresponding reduction in fluor
ide when the alum was added in increments during rapid mixing. This was
attributed to the better contact between aluminum and fluoride ions dur
ing floe formation and complete coagulation. Figure 2-3 shows the rela
tionship between the fluoride removal efficiency of alum and the pH of
solution. This figure indicates the optimum pH range for fluoride
removal to be between 6.5 and 7.5. The authors (5) also found that
residual aluminum in treated water tended to lower the true pH. The
flocculation time did not appear to affect fluoride removal very much.
The authors (5) stressed the need for adequate stirring and slow
addition of alum. The use of coagulant aids such as activated silica,
bentonite, hydroxyethyl cellulose, and fuller's earth improved coagula
tion but had no significant effect on fluoride removal. Their further

13
3.S0-
0.00-1 1
0 50 100 ISO 200 250 300 350 HOO HSO SOO S50 SOO
ALUM DOSAGE (PPM)
Figure 2-2. Fluoride Removal by Alum Flocculation (Incremental Feeding of Alum During Mixing) (5)

14
E
cr> Lfi CVJ
E CL CL
I
(/) -o •r-
o 3
CL CL
un
O)
CO
0 0 CVJ
E
E
CO Ln CVJ
"-^ LD ^ ^
P -
1 CVJ
UJ —1 QQ < 1—
"O c (O
J = + J • r -3
C O
•f—
4-> (O
f"""
3 O o o
3
Q . CL
* >>
a. o.
E
rc a.
O)
a. Q L
tn
<u
CO CO CVJ
CVJ vo r—
CVJ 'sar
i n CVJ
1 CVJ 1
r>.
CVJ *
p^
o CXD
O
P>.
o *
cn *
E a. CL
E 3
O O CVJ
o Ln CVJ
o o CO
ro
o
o
<
0) (/) O) c <o cn c
E
o
• o
c
O
CL
a.
t o
O) c •r— n3
o u
&. <u
<o
T3 <U
«o (1)

15
2.0-1
1.8-
1.6-
1.1H
F L U 0 K 1.2-} I 0 E
£ l.G-S I 0 U 1 L 0.8-?
P P H J
O.-^-i
0.2-
0.0-
S.G 6.8
PM JNFLUENr
6.0 S.i4 7.2 7,G S.C
Figure 2-3. Effect of pH on Fluoride Removal (Alum dosage = 250 ppm) (5)

16
use was therefore not recommended. The alum flocculation method
simultaneously reduced the fluoride concentration as well as the
concentration of iron, manganese, color, and turbidity. This removal
process therefore was not particularly specific to fluoride ions.
In another investigation (21) on the removal of fluoride by alum,
well waters containing 1.7, 3.0, 6.0 ppm fluoride were treated with
graded amounts of alum. One liter portions contained in one liter Pyrex
Erlenmeyer flasks were kept tightly stoppered and were shaken 10 times
daily for 7 days, then let stand overnight and the clear supernatant was
decanted off and examined. The results shown on Table 2-2 indicate that
fluoride concentrations of 1.7, 3.0, 6.0 ppm respectively may be lowered
to 1.0 ppm by corresponding dosages of 11.5, 20.0, and 52.0 grains per
gallon. The results of Stoltenberg, et al., are larger than those
obtained by Boruff (2). In the studies by Boruff, initial fluoride
concentrations of 1.5, 3.0, and 5.0 reduced to 1.0 ppm required alum
dosages of 1.3, 2.3 and 10.0 grains per gallon, respectively.
All results however were consistent in that large doses of alum
were required to remove small amounts of fluoride. Because alum doses
required for fluoride removal are much greater than those used for tur
bidity and color removal, this technique has not been considered a very
practical solution to fluoride removal (22).
Lime Softening
It has been shown that treatment of stock waters with sufficient
calcium hydroxide to cause precipitation of the carbonate and magnesium
hardness, brought about co-precipitation of part of the fluoride present

17
TABLE 2-2
Fluoride Removal by Aluminum Sulfate (21)
Aluminum Sulfate Residual Fluoride (girains per gallon) (ppm)
0 1.7
2 1.6
5 1.4
10 1.1
15 0.8
20 0.6
30 0.4
0 3.0
2 2.6
5 2.2
10 1.7
20 1.0
0 6.0
2 5.4
5 4.5
10 3.5
20 2.4
30 1.9
40 1.5
Alkalinity (ppm)
312
300
275
238
204
168
105
290
278
262
232
165
308
298
278
240
168
105
50
pH
7.2
7.0
6.8
6.6
6.5
6.3
6.2
7.8
7.5
7.2
6.9
6.5
7.5
7.2
7.0
6.8
6.5
5.8
5.6

18
(2). In one test (2), the fluoride content in water containing 5.0 ppm
fluoride was reduced to 2.1 ppm through lime softening processes. Sev
eral years after this observation was made, Scott and others showed that
the decrease in fluoride concentration was a function of the amount of
magnesium removed during the softening process (21). Upon a routine ex
amination of raw and treated municipal water supplies, Scott noted that
fluoride concentration in the effluents from lime softening plants show
ed a substantial reduction when compared to the fluoride in the raw
water. To verify these observations, bottle tests were made using nat
ural waters with and without the addition of graded quantities of sodium
fluoride. The tests showed a reduction of fluoride by lime and also
that the degree of fluoride removed was a function of the removal of
magnesium. This led the authors (21) to conclude that fluoride was ad
sorbed by the gelatinous magnesium hydroxide precipitate. So the fluor
ide removal mechanism during lime softening was determined to be
coprecipitation with magnesium hydroxide. From the results obtained by
Scott, et al. (21), shown on Table 2-3, a relationship was established
that explains the role of magnesium in the lime fluoride removal
process. This relation (eqn. 2-1) and Figure 2-4 appears to hold
between initial fluoride concentrations of 1.5 - 3.5 ppm. Equation
(2-1) says that the fluoride reduction by lime is approximately equal to
7 percent of the initial fluoride multiplied by the square root of the
magnesium removed. In terms of the residual fluoride, the equation is
Y = F - (0.07F)(vJx) (2-1)

19
cn c
•r-C (U
•M M -O
CO ---. <u -— E CVJ - r -
(O > o E —
cx: CVJ
•o • (U c 4-> cr <0 LU
' 3 E o o
r— s-<a Li-
c_>
CO I
CVJ
CO
>» J3
> o E <u <D
XJ •I—
s-o 3
E CS. £3.
(U T 3 •f— &-O 3
T3
> O E a:
3 -a •r— V)
•r*
3 •r- -O in (U 0) > ' — C O E CJ) E CL fl 0) Q. 2: cs: —'
o«*coo^oo^cvjcr»cvjo^uno^<^oO'— CVJ.— f— O O « ^ C 0 i — f— I— 1— O C O i — r—
r>. vo o^ r>. I— O r - O O CVJ
CT»vo«^cvjcooocy»forooo f— I— I— r— O L O r O i — I CVJr—
t n ^ c v j f ^ i O r - 0 0 0 CVJi— I— O l — .— OCVJ
r—'^^^oocvjoO'—vo<—lOcoLniooocvjoocovoo I—1—I—.— cvjincvir-o-—«—cvir^roi—r—o<—Ol—
o o o o o o o o c n « d • « s ^ « v ^ o o o o ^ " ! d - « ; ^ ' ^ o corococoroOLOcoi—cocoroOLOcor—cvjcvji—ro
oOLr)OOrN.coLOLnLOLOLnoOLnr^p^r^r>.r^oovoo 0 0 « ^ C O ' — I— O O O O O O C O ^ D r O ' — CVJCVJCVJCVICTiCVJ'^O

20
F = Initial Fluoride (ppm)
Y = Residual Fluoride (ppm)
X = Magnesium Removed (ppm)
TH = Total Hardness
HG = 0.09TH
0.4-3
LEGcNO: p"
MflGNESIUM REMOVED (PPM)
* ¥ m 2 » » » 2. S a o a 3 3.5
Figure 2-4. Fluoride vs. Magnesium Removal as Predicted by Equation 2-1 (21)

21
where Y = Residual fluoride (ppm)
F = Initial fluoride (ppm)
X = Magnesium removed
The amount of magnesium that must be removed to obtain fluoride concen
tration of 1.0 ppm when the initial fluoride concentration is between
3.5 and 1.5 ppm is shown in Table 2-4. According to the authors, to ac
complish a high removal percentage of magnesium, essential to obtain a
reasonable reduction in fluoride concentration, requires the addition of
sufficient lime to raise the pH to about 10.5 (21). Under such con
ditions, a caustic alkalinity of about 30 ppm is required (21). Figure
2-4 is a plot of equation (2-1) when the total concentration of
magnesium in water is about 9 percent of its total hardness. On the
basis of the fluoride reduction formula (eqn. 2-1), it is clear that a
magnesium removal of 100 ppm, secured if necessary, by the addition of a
magnesium salt, limits the initial fluoride content to 3.3 ppm, if the
residual fluoride concentration is to be 1.0 ppm.
On economic grounds, therefore, all efforts must be directed
towards securing a water supply of low fluoride content in the event
that raw waters of high fluoride content are encountered. Clearly
however, if sufficient amount of magnesium is not present in the water,
a magnesium salt must be added in quantities necessary to accomplish the
desired level of fluoride removal. This treatment method therefore is
similar to the alum coagulation method in that it has limited
application (5, 21, 22). Because of the large quantities of chemicals
that would normally be required, the method is adaptable to only low
fluoride-high-magnesium water requiring softening.

22
C L Q.
X>
>
o E <U
OC a. CL
CT> CO
LO CO CVJ
c o
u c o C_)
0) "O
s. o 3
CVJ '"^
^ 1
CVJ
LU —1 CQ < h-
C (U 3
r>^ M-«+-LU
C «3
O + J
C
o
to
C7> to
to
CC
«3 > o E O)
OC
CO
c C7> «3
3
•a •r—
to
C). OL
-o •r— s-o 3
to LO
* CO
o •
CO
LT) «
CVJ
o *
CVJ
LO

23
Although no extraordinary success was made immediately after
observers linked the causes of dental fluorosis to fluoride (14, 22), it
was clear that definite progress was being made towards finding a means
of reducing the levels of fluoride in potable water to an acceptable
level. In 1947, Meier reported that methods utilizing the fluoride
exchange properties of apatites such as those involving the use of con
stituents of bone, the ion exchange principle, and those depending on
the sorptive properties of aluminum compounds appeared to show the most
promise for removing excess fluorides from water (14). In the next few
paragraphs, we shall examine some of these ion exchange and adsorption
methods and look at some of the results that were obtained and relate
them to the current changes that have evolved through the years in the
fluoride removal technology.
Activated Carbon
McKee and Johnston conducted experiments with four different types
of carbon (12). The carbons tested were: a) Norit, a commercial carbon
produced from the charcoal of European pine, b) residual carbon discard
ed by the soda pulp industry, c) same as b) but activated with acid, and
d) anthracite coal activated with hot carbon dioxide gas.
In the results given by the authors (12), a) and d) failed to
remove any fluoride; b) removed about 50 percent of the fluoride at a pH
of less than 3.0. The authors therefore decided to pursue the study of
fluoride removal with residual carbon activated with acid (case c)
because it showed real promise. Their observation (12) was that there
was little removal of fluoride until the pH was between 3.6 and 2.5. In

24
this pH range, fluoride removal increased from approximately 30 percent
to 100 percent. The efficiency of fluoride removal in relation to the
pH of the solution is given as:
pH Percent F Removed (12)
6.9 4
3.57 49
3.16 88
3.01 100
2.53 99
2.38 99
2.25 100
The authors (12) measured the efficiency of fluoride removal by the car
bon when only 0.08 percent by weight of carbon on the weight of water
was used. Their results are shown below:
(12) Fluoride in (ppm)
10.0
10.0
7.5
5.0
Influent Fl uoride Removed (%)
84.5
75.0
94.0
92.0
In other words, 0.08 percent carbon removed 94 percent of the fluoride
from waters containing up to 7.5 ppm and 80 percent from water with 10
ppm. Other tests conducted by the authors using a continuous system
consisted of a glass tube 40 mm in diameter and 750 mm long and filled
to a height of 620 mm with a 16-30 mesh size activated carbon. Their
findings essentially confirmed their earlier results. It was found that
there was no effective removal of fluoride until a pH of about 3.0 was
reached.

25
From a practical standpoint, therefore, the use of this medium for
removal of fluoride would be expensive because of the need to lower and
raise the pH of the water supply. This conclusion has been reached by
other authors (22). Culp and Stoltenberg found that application of 50
ppm of activated carbon to a well water pH of 8.0 failed to reduce the
fluoride content (5).
Zeolite
In a study made to determine fluoride removal by zeolite (2), a
miniature contact filter was set up in a 55 mm glass tube into which
were added 490 grams of synthetic zeolite. Six liters of stock water
containing 5.0 ppm of fluoride were passed through the filter at a rate
of 300 ml per minute. The effluent showed a concentration of only 0.6
ppm fluoride. Then zeolite was backwashed, regenerated with a 5 percent
sodium chloride solution and washed free of salt with chloride-free
water. Fifty liters of water containing 5.0 ppm fluoride were then pas
sed through the filter at the rate of 234-165 ml per minute. The 4-5
liter fraction of effluent collected contained only 0.9 ppm fluoride.
This concentration however increased to 2.5 ppm in the 11-14 liter
fraction, 3.4 ppm in the 20-23 liter fraction, 3.6 ppm in the 27-30
liter fraction, 3.7 ppm in the 36-39 liter fraction, and 4.0 ppm in the
44-47 liter fraction.
A second regeneration of the zeolite with a 5 percent sodium chlor
ide was followed with passage of a 40 liter portion of stock water with
5.0 ppm fluoride. The results showed the following: the 3-5 liter frac
tion contained 2.9 ppm of fluoride, while the 6-9 liter fraction shov/ed

26
3.8 ppm fluoride. However, subsequent fractions collected showed no re
moval of fluorides. The zeolite was backwashed, treated for 30 minutes
with 2 percent sodium hydroxide and rinsed free of alkali with fluoride
free water. Again, stock water containing 5.0 ppm fluoride was passed
through the filter. Results showed the 3-5 liters collected to have 3.7
ppm fluoride while the 6-8 liter fraction contained 4.7 ppm. Subsequent
samples showed no evidence of removal of fluoride.
The results obtained in this study (2) led to the conclusion that
zeolite could effectively remove fluoride from water but had wery low
exchange capacities for fluoride ions. This would make the application
of the media economically unattractive for commercial use. The fact
that small quantities of fluoride were removed following regeneration
was explained as a result of preferential adsorption of other ions in
the solution.
Mix€d Bed Demineralizer
Harman and Kalichman (7) reported on the use of a mixed-bed demin-
eralizer for fluoride removal in Death Valley Junction, Southern
California. The mixed-bed demineralizer consisted of sulfonated
polystyrene and quaternary amine polystyrene. In addition to fluoride
removal, this medium also removed excessive concentrations of arsenide,
total dissolved solids and sodium. The 15 gpm demineralization unit was
reported to have sufficient capacity to operate for 4 days at the rate
of 150 gallons per day between regeneration cycles. No data were given
for the exchange capacity of this medium or the fluoride concentration
of raw water treated. Regeneration chemicals were given as caustic soda
and sulfuric acid (7).

27
Bone
The limited application of either alum coagulation, activated car
bon, or lime softening to fluoride removal led to the employment of
either activated alumina, bone char or granular tricalcium phosphate as
an ion exchange media for defluoridation.
Bone was first suggested for use as an ion exchange media because
of its known affinity for fluoride (22). Bone consists essentially of a
carbonate apatite Cag(PO,)g» CaCO-,. The removal mechanism suggested in
the use of bone was the exchange of the carbonate radical with fluoride
(14, 22). While different studies have shown bone to be an effective
fluoride removal medium, the costs have not allowed its wide use.
Bone Char
Bone char is simply ground animal bones charred to remove all org-
anics. It consists essentially of tricalcium phosphate and carbon. It
has been utilized in full scale defluoridation plants (21, 22). This
material initially developed for decoloring cane syrup (22), is more
economical than bone. The ability to be regenerated by washing with
caustic soda made bone char useful in fluoride removal processes. In
the regeneration of the material with caustic soda, the fluoro-apatite
formed by the adsorbed fluoride probably becomes an hydroxy-apatite and
the fluorides are removed in the form of soluble sodium fluoride. The
hydroxy-apatite subsequently becomes available as an exchange material
by the replacement of its hydroxy radical by fluoride (14).
The first full scale defluoridation plant to use bone char for op
eration was U.S. PHS plant in Britton, South Dakota, which was in oper
ation from 1953 to 1971 (22). Also, the defluoridation plant built at

\ '^
28
Fort Irwin, California, was in operation with bone char as its medium
(7). The exchange capacity for fluoride ions before regeneration
obtained in removing 5 ppm of fluoride was 0.102 kg fluoride per cubic
meter of bone char bed (13). Regeneration of bone char has been effect
ed with solutions of trisodium phosphate and monosodium phosphate, but
the exchange capacity of the medium is reduced by 12 percent after the
first regeneration (14). Alternatively, as previously mentioned, regen
eration may be accomplished with a 1 percent sodium hydroxide solution.
One pound of caustic soda is required for each cubic foot of bed. The
caustic nature of the bed is then neutralized by thorough washing with
distilled water and with a carbon dioxide solution (14). The use of
carbon dioxide solution greatly increases the life of the bed and
considerably reduces attrition losses. Bone char, however, proved to be
impractical for fluoride waters that also contained arsenide. Arsenide
could simultaneously be removed by bone char but that removal process
could not be reversed. Since arsenide competes with the fluoride ions
and because it cannot be removed by the usual caustic regeneration pro
cess, the fluoride capacity of bone char tended to decrease rapidly and
had to be frequently replaced thereby making the process economically
less competitive (19, 22).
The second disadvantage with the use of bone char was its
solubility in acid (19, 22). The pH of the raw water and the acid rinse
must therefore be carefully controlled to minimize loss of the media.
Synthetic Bone Material (Tricalcium Phosphate)
Synthetic bone material is produced by reacting phosphoric acid
with solutions of lime (13, 22). It comes in powder or coarse granular

29
form. Granular tricalcium phosphate can be regenerated with caustic
solution and rinsed with dilute acid solution (22). This material was
first commercially employed as a defluoridation medium in Climax, Color
ado in 1937, and Scoba, Mississippi in 1940 in the fluoride removal
plants built there. However, both plants were abandoned in 1949 (22).
During its use in the defluoridation plant in Britton, South Dakota, in
1948-51, tricalcium phosphate proved to be quite efficient in fluoride
removal. Unfortunately, during the four years it was used, an attrition
loss of 42 percent per year was experienced. The removal capacity
observed was 0.685 kg fluoride removed per cubic meter of medium bed.
It was observed that the presence of 100 ppm sulfate ions in raw water
caused a 3 percent decrease in capacity of tricalcium phosphate (22).
The frequent regeneration needed, coupled with heavy attrition losses,
made synthetic tricalcium phosphate a less attractive medium for
fluoride removal purposes.
Activated Alumina
Activated alumina is made from calcined granules of hydrated alum
ina. The most well-known and longest operating defluoridation plant in
the U.S. is located in Bartlett, Texas. This process utilized activated
alumina as its exchange medium. Reportedly, the plant continued to op
erate on its original charge of activated alumina for 25 years (22). The
advantages of activated alumina over most media studied stem from its:
a) specificity for removal of fluoride ions. In an extensive work done
by Kubli he found the anion-alumina adsorption series in order of
decreasing preference to be (11): OH", PO^"^, Cr^O"^, F", S03"^, CrO^"^,

30
NO2', Cl", NO3", MNO^", SO^"^. This affinity preference offers a parti
cular advantage over synthetic strong-base resins that remove many
anions and whose selectivity series is commonly reported as follows
(22): r , HSO^", NO2", Br", Cl", OH", HCO3", ^ 2 ^ V ' "* ^ ^"'S^
exchange capacity for fluoride ions; c) capacity is not noticeably
affected by the concentration of sulfates or chlorides in the raw water;
d) relatively low cost (about $460 per cubic meter (22)). This is about
10 percent the cost of synthetic anion resin and about 25 percent the
cost of bone char. Table 2-5 compares the 1978 costs of the different
adsorbents for fluoride removal.
The use of caustic (1 percent sodium hydroxide) solution and acid
solution for regeneration is probably the single most expensive item in
the entire defluoridation process (6, 19), and also the major disadvan
tage to the use of activated alumina, since the reagents will require
careful control and handling and hence the need for well-trained opera
tors for defluoridation plants.
According to a report by Sorg (22), there are two large-scale acti
vated alumina defluoridation plants operating. One is at Desert Centre, 3
California with a rated capacity of 5680 m per day of treated water.
The process reduces the fluoride content of water from about 8.0 ppm to
less than 1.0 ppm. The second plant is at X-9 Ranch near Tucson, Ariz
ona. It operates at 2650 m^ per day and reduces fluoride concentration
in drinking water from 5.0 ppm to below 1.0 ppm. The operating exchange
capacities for the medium used in both plants is reportedly 4.52 kg
fluoride removed per cubic meter of activated alumina bed. Operating

31
to
"—* CVJ CVJ • • - »
Lf> 1
CVI
LU _ J 0 3 < 1—
"O Ci
^r
r— to > o E <u OC
<u -o • ^ S-
o 3
CO O
O
>> 4-1 •r-O rt3 Q . «o
CJ
(U • o •r—
o 3
(U
cn
> <:
3 O
CO E ^
Ln
I CVJ
Ln
I 0 0 CO
o i n
I Ln CVJ
o CO cn
I t n CO
o o
I O t n CO
^-
3 O
cn
o o CO t n
I o o
CO E cn
3 O
4-> •r-to
<D O
t n
I US CVJ
o
0 0
I
o CVJ
CVJ
o CO o
t n t n
CO Ln
Ln •si-
I CVJ
co
cn
o o o
0 0 0 0
LO 0 0
CVJ
*
o I
0 0
<o
to r— S-0)
• • ->
to
-o <D +J (O >
• r— +J O
<:
(O
(U
o 0 0
<u OC
<u to n3
CQ
cn c o s -
• ! - >
tn
to c o
to
to +J o
o
T3
o 3
O
o •r—
to
c o
c •r— • o c ca. cu
<u j ^ to
*r-J -(tJ

32
costs (1978 prices) excluding amortization are estimated at about
$0.15-30.20 per 1000 gallons of treated water.
In an earlier investigation on the use of activated alumina for
fluoride removal, Boruff (2) placed 30 grams of 40 mesh activated alum
ina in a 35 mm glass tube. This gave a contact bed 305 mm deep. Fifty
liters of test water containing 5.0 ppm fluoride were passed through at
a rate of 200 to 250 ml per minute. The results are summarized in Table
2-6. The fluoride content of the first 21 liters was reduced to less
than 2.0 ppm. The 48-50th liters contained 2.3 ppm. The activated
alumina was then backwashed, regenerated with 50 ml of 2 percent sodium
hydroxide for 30 minutes, rinsed and again treated with water containing
5.0 ppm fluoride at a rate of 200 ml per minute. The results of this
regeneration cycle are shown in Table 2-6. The first 30 liters contain
ed a maximum of 1.6 ppm fluoride. Regeneration with 500 ml of 5 percent
sodium chloride and 2N hydrochloric acid for 30 minutes gave results
which were approximately the same as those obtained in the sodium hydro
xide regeneration runs. Regeneration with 2N hydrochloric acid caused
some loss in weight of the activated alumina. The author (2) recommend
ed the use of sodium chloride for purposes of regeneration of activated
alumina. Further tests were made replacing activated alumina by bauxite
(commercial grade), as the fluoride removal medium. Here, it was
observed that only minor quantities of fluoride were removed (2).
Defluoridation Plant (Bartlett, Texas)
Activated alumina is the adsorbent used at this full-scale defluor
idation plant. The plant uses 500 cubic feet of media in a standard

33
to
3
CU
>
o
< :
o
OJ CVJ r -
I CVJ
LU - J CQ < :
a to
o CJ > )
CQ
CO (U
T3 •I— Sm
o 3
<T3 > O E
Qt:
E Q .
<u 3
4 J £= (U
4J C o o <u -o •r-
o 3
CO O i-Ln <u
I - M 0 0 T— ' d - r—
o s-I •«->
0 0 T -CO I—
t / )
CO
s . <u
tn -M I T -
CO 1—
I— a> ro - O 4-> C - r - E
• r - S_ O) ^ ^ cn o +-> E
•r - 3 C OL i- r— o a
o u. c_>--
o •r— + J
$- o a> T-c +-> <U 3 cnr— O) o ct: 00
c 3
Q^
CO
CVJ
I— "St f—
c J •— CVJ CVJ
CVJ I I I
O CM * *
CVJ r—
CO f—
I I— r— CVI
CJ s-CO a>
1 -(->
CVJ r—
9-21
ite
rs
CO
s -r— OJ 1— 4->
<y> r—
O
CVJ
cr>
"
to
' ^
CO
'~~
to
—
«;a-
*—"
o CVJ
CVJ
^~
o^ o
CT>
o
p^
o
r—
o
'
o
*""
<T>
O
O
Cvl
cy»
'-"
to
•""
tn
' ~
t n
'—
CO
f —
cn
o
p>.
o
tn o
i n
r—"
cr» o
r^
O
^ t o t o o t o ^ o r ^ i n • • * • • * * • *
r— O O i — O r - r— o o
o o o o o o o o o L n t n c o c o c o c o c o c o t n
to :iz zn r-c o o o I—
•r— to to to O cn z s : z z :
rt3 CJ CJ o
o c v i c v j u n c v j i n c v j c v j c v i
c v j c o < d - L n t o r ^ o o c r >
0)
3 C
(U
o o CVJ
II
(U + j on c o
• r -4-> to im
4->

34
circular steel filter tank, 11 ft. in diameter and 11-1/2 ft. high. It
is fitted with a steel pipe-grid underdrain, steel wash troughs and a 4
inch plastic acid and caustic distributor. Figure 2-5 shows a schematic
representation of the Bartlett defluoridation plant. There is a 12 inch
layer of graded gravel underlying 60 inches of media. The regeneration
equipment includes a 6,000 gallon caustic solution tank with electric
mixer and pump and a system for measuring, diluting and metering acid
solutions. The plant is capable of treating 400 gpm of Bartlett
well-water and was designed to reduce the fluoride content from 8.0 ppm
to an average of 1.0 ppm. Meier reported that regeneration of the
Bartlett plant's activated alumina bed only became necessary after
treatment of about 450,000 gallons of 8.0 ppm fluoride water (15). Re
generation of the activated alumina is primarily intended to remove ac
cumulated fluoride by means of a dilute caustic solution. In the Bart
lett plant, spent caustic could not be reused because of excessive con
tamination by other ions. The caustic solution is applied countercur-
rently, which combines in one operation the backwashing step and the
caustic application. The caustic solution is applied at the rate of 235
gallons per minute and is discarded after passing the bed (15). After
regeneration, a dilute acid solution (0.05 Normal) obtained by diluting
66° Baume sulfuric acid to first 15 percent and then to 0.05 N is used
to neutralize the bed. The capacity of the Bartlett plant when reducing
8.0 ppm fluoride water to 1.0 ppm is given to be 1.6 kg fluoride removed
per cubic meter of activated alumina bed (ca 700 grams per cubic foot).

35
t n
to c
• r» P= 3
r— to
" O OJ
+ J fO >
• ^ 4 J U to
CO
-a r—
o J C
Ji£ E 03
4 J
4-> O fO
4-> C
o C J
4 J (U
n ^ 4-> S . (T3
CO
• M fO
+J •r— C
o c; O
4-) to
• o . r -S-
o 3
r— I t -OJ
Q
M-O
••-> 3 O >» to
- J
u • r -4 J ro cz (U
- C
o oo
LO
CVJ
a> i -3 C^

36
Current Trends in Fluoride Removal
In the following paragraphs, we shall present some of the recent
schemes that have studied the removal of fluoride from water utilizing
activated alumina as the adsorbent.
Regeneration of Activated Alumina with Aluminum Sulfate
Figure 2-6 shows the schematic diagram of the apparatus used by
Savinelli and Black (20) to investigate the removal of fluoride via
activated alumina. The purpose of their study was based on the presump
tion that a dilute solution of aluminum sulfate could be used to regen
erate exhausted activated alumina. Specifically, they studied the
effects of the following factors on the exchange capacity of activated
alumina: a) quantity of aluminum sulfate used during generation; b)
concentration of aluminum sulfate solution used during regeneration; c)
flow rate of aluminum sulfate solution during regeneration; d) flow rate
of water being treated during exhaustion and; e) concentration of fluor
ide ion in the raw water.
The apparatus used in this study consisted of one-inch glass tubes
each 24 in. long packed with activated alumina. The bottom of each tube
was drawn and joined to a ground glass stopcock used to control the flow
of water through the column. Above the point where the tube was drawn,
a perforated clay disc supports the bed of activated alumina. The flow
through the column was measured by a rotameter connected to the stopcock
by rubber tubing. The raw water to be treated was prepared in a
55-gallon drum and distributed through a manifold to the 12 columns
attached. The open end at one end of the manifold allowed a slow stream
of water to overflow and produced the effect of a constant head device.

37
CO
O) • I —
3 4-> 00
C
o •r-•l-> to
•r—
o 3
o
CO
Z3
</) 3
+-» «o to Q . CL
E to
cn fl3
• M to E OJ
o oo
vo I
Cvl
OJ
3
cn

38
The overflow returned to the 55 gallon tank. Before collection of any
test data, the authors (20) conditioned all the activated alumina used
by passing it through at least ten complete cycles of regeneration with
aluminum sulfate and exhaustion with water containing 10 ppm of the
fluoride ion. The flow rate during regeneration was 5.5 ml per minute.
Therefore, the 2 liters used for regeneration required approximately 6
hrs. to pass through the column. After regeneration, the columns were
backwashed for 30 minutes with distilled water at such a rate as to
cause 100 percent expansion of the bed based on the original bed volume.
During the treatment phase, the water used to exhaust the beds contained
10.0 +_ 0.1 ppm fluoride ion and was passed through the beds at a flow
rate of 28 ml per minute.
The results obtained in this investigation showed that the capacity
of the alumina for fluoride ion increases rapidly with the amount of
aluminum sulfate used for regeneration up to a maximum of about 4.6 kg 3
per cubic meter of bed (2,000 grains/ft ). Figure 2-7 shows this rela-
3 3
tionship. Beyond a capacity of 2,000 grains/ft (4.6 kg/m ), the
increase in capacity is very slight even with large increases of
aluminum sulfate. Additional findings were that for exchange capacities
of up to 1,500 grains per cubic foot of bed (3.45 kg/m ), the amount of
aluminum sulfate required per kilograin of fluoride removed was
practically constant at about 2 pounds per kilograin. Beyond this
point, the regeneration efficiency decreases. This result is shown
graphically in Figure 2-8. In order to verify the effect of
concentration of regenerant solution on exchange capacity, a constant
amount of filter alum per column but various amounts of volume of water
\

39
2200-1
**>v«^^im«af"^p«^i^«^^i^<^<^^^^^iiPV^^^w«M^M^^v^>^^^M^^^Mi
S 8 10 12 m 16 18
flLUH (La/CU FT)
Note: 434.78 grains/cu f t is 1 kg/m^
Figure 2-7. Relation of Exchange Capacity and Regeneration Level (20)

40
2200-!
3 M 5 S 7
ALUM PER KiLOG* FLUOSIOE-CS
Figure 2-8. Relation of Exchange Capacity and Regeneration Efficiency (20)

41
in which it dissolved was used. The results showed that for solutions
ranging from one to ten percent by weight of aluminum sulfate, the
concentration of the regenerant had little or no effect on the exchange
capacity of the activated alumina.
The test on the effect of the exhaustion flow rate on the exchange
capacity showed that for flow rates of 0.5 to 2.0 liters per hour, there
was little change in the exchange capacity but that when the flow rate
was raised above 2 liters per hour, the exchange capacity of the activa
ted alumina decreased. Interestingly enough, however, the authors found
that the time of contact of the alumina with aluminum sulfate during re
generation played a significant part in the exchange capacity of the
medium. Figure 2-9 shows that the exchange capacity of the activated
alumina ranges from about 600 grams per cubic foot of bed (1.38 kg/m )
for a regeneration time of one hour to about 1,750 grams per cubic foot 3
(4.03 kg/m ) for a regeneration time of four hours for the same
regeneration level. For contact times of more than 4 hours, the
increase in exchange capacity was small (20).
The data presented in Figure 2-10 showing the exchange capacity as
a function of the fluoride ion concentration of the influent water, in
dicate that there is a linear relationship between the two variables.
However, the alkalinity of the influent water also plays an important
part in the fluoride removal process. The study showed that as the al
kalinity of the influent water increases, the capacity of the medium to
remove fluoride ion decreases. Hence it was inferred that the alkalin
ity in the water could be competing with the fluoride ion in the
exchange process. This result on alkalinity is confirmed, by a study of

42
2000 H
ISOO-
100-
0-i» i '
C 60 120 ISO 2^0 3QC
RSGENtRfiTlCN TJMECHIM)
420
Figure 2-9. Exchange Capacity of Activated Alumina vs. Regeneration Time (20)

43
1700 H
1600-
500-
U 5 6 7 a
iNlTIflL FLUORiOE CONCENTRflTION (PPM)
JO
Figure 2-10. Exchange Capacity of Activated Alumina vs. Fluoride Ion Concentration in Influent (20)

44
pH effect of the influent water on fluoride exchange capacity of the
alumina. Figure 2-11 summarizes the result of this study. From this
figure, it can be seen that when the pH of the influent water is lowered
to 5.6 with acid, the capacity of the alumina to remove the fluoride ion
increases to about 3,400 grains per cubic foot (7.83 kg/m^). It can be
concluded therefore that neutralization of the alkalinity in the water
is immediately effective in substantially increasing the capacity of the
alumina for the fluoride ion.
The last variable studied was the effect of high concentration of
the sulfate and chloride ions on the exchange capacity of activated
alumina. Very little effect on exchange capacity was found with concen
trations of either of these ions up to 1,000 ppm.
To summarize, one. might say, that although alum has been shown to
be an effective regenerant of activated alumina, it does have certain
limitations in its applicability (20). The most important of these is
the problem of precipitation in the bed which causes clogging of the
bed. Although the reason for this precipitate is not clearly known, it
has been attributed to the use of aluminum sulfate for regeneration
(20). Clogging is a problem that cannot be overlooked in adsorption
beds because a decrease in flow rate of water through the bed seriously
reduces the efficiency of the adsorbent (2, 20).
Fluoride Removal Using a Fluidized Bed
Another major research work in the field of fluoride removal was
performed by P. Bishop utilizing a fluidized bed of activated alumina
(1). The hypothesis was that fluidization would eliminate the usual

45
• r
5.4 7.2 7.8
PH OF INFLUENT
S.g
Figure 2-11. Relation of Exchange Capacity and pH of Influent (20)

46
problem of bed clogging associated with previous removal techniques (20)
and would enhance the efficiency of the adsorbent. To verify this, the
author conducted a series of batch and continuous flow tests (1). The
batch tests verified the effects of medium mesh size, pH, fluoride con
centration and alkalinity on fluoride removal capacity of activated
alumina. The continuous studies evaluated fluidization characteristics,
fluoride characteristics, regeneration procedures, and extent of
deterioration of the medium.
The batch studies used one liter reactors. Air was supplied at 28
kpa (4 psig) and regulated so as to circulate the activated alumina
through the reactor. The temperature of the reactors was kept constant
by the use of a constant temperature bath.
A schematic diagram of the apparatus used in the fluidization study
is shown on Figure 2-12. Feed water was pumped from a plastic carboy
through the column by a variable speed peristaltic pump. The acrylic
column is 5.1 cm in diameter, 1.5 m tall and had effluent ports at 15.2
cm intervals. Activated alumina in the column rested on a bed of glass
beads used to achieve a uniform distribution of feed within the column.
Regenerant chemicals were pumped through the column by a peristaltic
pump. A fluoride specific electrode and pH meter monitored all effluent
concentrations.
Preliminary batch studies showed that use of the 14-28 mesh activa
ted alumina was impractical because of the high fluid velocities requir
ed to fluidize the medium. Moreover feed water concentration higher
than 8.0 ppm in fluoride could not be reduced to 1.0 ppm at such high

47
AirVent OiSTiHed Water
XapWater
^Ai^ i^gATSupp'v
flecorcier
MiJiivolt
Ion EiectrcdG
Dram U
Hose Clampv,^^ [
4000 mt Er lenmeyer
!
t Beads^
Ordin 1
Figure 2-12. Schematic Diagram of Fluidized Reactor 9v«;tpm for Defluoridation Studies (1) System for Defluor

48
velocities. To obtain the most efficient medium size for fluoride
removal, activated alumina was ground into size ranges of 14-28, 20-28,
28-42 mesh. Two grams of each size were allowed to contact a solution
of known fluoride concentration in the batch reactors until equilibrium
was reached between the alumina and fluoride. Figure 2-13 shows the re
lationship between exchange capacity of the activated alumina and the
average mesh size of the medium. It shows that capacity increases with
decreasing particle size. The author concluded that the difference in
capacity was the result of the increased surface area per unit volume of
the smaller particles suggesting that fluoride removal by activated
alumina was a surface phenomena. The studies on the effect of pH on the
exchange capacity of activated alumina within the pH range of 5.5-8.0
showed that higher removal capacities were achieved at pH below 6.0 but
that capacities were still reasonably high in the pH range of 6.0 to
8.0. This result is shown in Figure 2-14. The author found a linear re
lationship. Figure 2-15, between removal capacity of activated alumina
and initial fluoride concentration in the feed water. The result of
this study also showed that increasing the initial alkalinity of the
feed water decreased the capacity of the medium. This relationship is
shown on Figure 2-16.
Regenerant procedures were evaluated using five batch reactors each
containing 3 grams of spent media. Different concentrations of regener
ant (caustic soda) were added and the systems were allowed to
equilibrate. The results shown in Table 2-7 show that regenerant
concentrations greater than 2 percent sodium hydroxide desorbed all of
the fluoride in the medium. For regenerants less than 2 percent, the

49
^.^6 2.52 2.58 2. CM 2.70 2.76 2.82
€XCHfiHO€ CPPflCITTfKG/CU METER)
2.88 2.9M
Figure 2-13. Effect of Activated Alumina Particle Size on Fluoride Removal Capacity ( l )

2.7H
50
2 . 6 -
l . G -
1.5-
5.0 5.5 ' I • ' ' • ' ' ' ' ' 1 I I • . ,
6.0 6.5 7.0 7,5
PM OF INFLUENT
8.0
Figure 2-14. Effect of pH on Alumina Fluoride Removal Capacity ( l )

51
6 7 8 9
INITIAL FLUOP.IDE CONC. iPPM)
Figure 2-15. Effect of Influent Fluoride Concentration on Alumina Fluoride Removal Capacity ( l )

52
l.JO-f
o.uo-100 125 150 175 200 225 250 275 300 325 350 375 400
INITIRL RLIJflLJNj'TT (PPMJ
Figure 2-16. Exchange Capacity of Activated Alumina vs. Alkalinity of Influent (l)

53
TABLE 2-7 (1)
Efficiency of Activated Alumina Regeneration
Regenerant Percentage Removed
5 percent NaOH 100
2 percent NaOH 100
1 percent NaOH 93
0.5 percent NaOH 86
2.0 percent NaOH-NaS203 90
Note: Regenerant volume = 1 liter; spent activated alumina = 3 gm.;
detention time = 1.0 hr.

54
desorption process was incomplete. The regenerants of lower concentra
tion would eventually restore the medium to its initial capacity after a
much longer time. The fluidized column provided information on the
general behavior of the medium. Table 2-8 shows the actual and
predicted flows required to achieve a given expansion of the activated
alumina bed. Minimum fluidization velocity was 0.7 x 10 m/s for the _3
35-50 mesh size. A rate of 8 x 10 m/s was necessary to produce a 100
percent bed expansion.
Finally, the column was operated through a series of eleven cycles
of exhaustion and regeneration to investigate the effects of long term
use of the medium, to estimate the exchange capacity of the medium, and
to determine the most effective regeneration procedure. The results of
this investigation are shown in Table 2-9. In all cases, the column 3
contained 500 cm of medium (0.43 kg). Unexpanded medium depth was 25.4
cm (10 in). Initial fluoride concentrations and methods of regeneration
varied during each cycle.

TABLE 2-8 (1)
Column Fluidization Characteristics
55
Flow
10'- m/s
0
2
4
6
8
10
12
16
20
Vel ocity
qpm/sq.
0
3
6
9
12
15
18
24
30
.ft.
Bed Expansion Achieved (percent)
0
25
50
75
100
125
160
210
270
Theoretical Bed Expansion (percent)
0
27
62
85
114
130
150
200
275
-3 Note: Minimum f l u i d i z a t i o n ve loc i ty - 0.7 x 10" m/s (1.0 gpm(sq. f t . )

56
u to a. to
CJ
to > o E <u
CC
O) • a
CT> Z. I o
CVI 3 UJ LL . _-l CQ to <C C I— - i -
E 3
(U 4->
>
CU N
JC
3
o s- <u >>
^ - O 4 J •M - r - -r -J>£ u u to O to <U 3 Q . i- .— (O
CO u_ o
3 L>
E
ro E
^ v . O)
J>^
o CO CO
CT» •
o
o CVJ o r—
OO •
CVJ
o CVJ o r—
CO •
CVJ
o VO
r«* •
CO
«o cn «>j-
o •
r*"
3 O
"E cn
to O to •M 3 C2. CO O r— <T3 I
I H - U - CJ
cn|
OJ
to • ! -f - s- . 4-> O O 5_ f - 3 C D . C r— O Q .
t—4 U_ CJ >•
vo O
O cy» o
o o CX) CO
<!3-•
CVI
in •
CVJ
cy>
o
o o CO
CVJ CVJ o o CVJ
CVI o <J> «d-
o CO in
o o
o cr>
CO •
CO
CO •
CO
p<o •
^ •
CO
i n
CO CVJ
o i n
o o
o o
o O
<3-
O
O o o
o o
' o CO
to s .
(U
OJ
cr| O)
OC
•a
CO 3 o > (U s-a.
CO c o
-a c o
a CJ
to r— 4-> to O 4J
+J O
I— CO to E cn I
CO o I
I/) CVJ o E «
CO I -Li O M -
'x. cr CO t/}
E ' E 3 Q ,
f— c n to
OJ •M I— r— ^ • r - 4-> * • - O
•M ceo (U E ooo S- l <U O CLrm.
X O CVJ CVJ CVJ
to to to to to to to + J -M 4-> + J +J 4 J 4 J
O O O o o o o 4-> 4 J + J 4 J + J ^J 4 J
CO CO CO CO CO 0 0 CO
E _ E E E E E E CVJ CO CO CO CO CO CO
I I I I I I I o o o o o o o - - ^
X X ^ - x . >C^~s X"-^ X to CO * - ^ c v j i — ty\ t— ^ I— o + J
inr— cn (O ^ to c v j f o o o o fO + J ••-> 4 J 4 J
•>+J " O " O " O " c o o l O - M c O + J C 0 4 - > ( / ) «
^"^•M - ^ ^ ^ " ^ >«^.— E E . E . E . £
CO . C O r — C O f — C O r — CO I r — I • l l — I I — t to I to I r t 3 l 0<T3 0 i — O n S O f O o c n o c D o c n o c v j r— O ^ - to r— D l r— CT ^ - r— n— r— . X X C T ^ X X X iSi Xr— X « ^ X « ^
« ^ C O ^ I O O O C O ^ C O . * : ^ . C O ' O O r— cn r— r— O O P ^ <^ •
-o • r -
o 3
CL
CL
i n
o
-o OJ E 3 (/J CO to x: cn 3 o s.
4->
Q . C3>
CVJ
CO
X
c r > - ^ "Si- r—
03 I/) o
oo
X X cn CO—* i ^ J - - — . CO I —
I— to •< fO •>••->
to +J in o •»«^ O - V . + J E -M E
CO oo
E ro
I o
03 CJl
o • «3 + J
2 <•-
o •» to •*->
o • o • 03 -M « +->
cr I/)
•M c <u -> O E S- Q . <u cn cn.
U3
cr CO
r— CVJ
c: o E im CL Q) cn CL
t o
CO
+J cr c cn a E (U c n Cl.
•M c r c «/) cu <> o E S- C3. <u cn a.
CTt
o 03
•»-> cr c t/J <u " ^ a E im a. CU cn
Q .
CVI-—
a: « o •
4 J O -£= CO OJ ^»* O E S- CL OJ cn CL
to CVI
o • 03 +->
4J cr C CO a> - ^ o E s> a. OJ cn Q .
CTi c v j > —
zxz •»-> O M-03
2 : •
cr 4-> CO e <u u s . (U Q.CVI
CVJo—'
C l
cr
Ln •K P ^ 0 0 •K O r -
(U
3
to
X 0 0
CO (U
o
03
im
o
3 cr (U
«+-o
CO 3 «B U (U
</) 0)
f —
o o
CVJ
s-O
OJ r—
OJ <U f—
OJ im
O
O
o
03 > 03
•M O
03 •M 03
Q

CHAPTER 3
EXPERIMENTAL PROCEDURES
In this chapter, the defluoridation scheme and method of the exper
imental procedures will be outlined. This experimental study is organ
ized very much along the line of work reported by Bishop and Sansoucy
(1). Selection of the experimental apparatus was primarily based on
preliminary design calculations done by C. S. Lee (see Appendix). Final
design was based on data collected during the batch studies.
Procedure for Determination of Fluoride Concentration in Water
All fluoride concentrations were determined by the direct measure
ment procedure. In this method, samples of fluoride standard solutions
were prepared by serial dilution of the 100 ppm standard. Five ml of
Total Ionic Strength Adjustment Buffer solution (TISAB III) (1, 20) were
added to each sample in order to break fluoride complexes of aluminum
and iron. TISAB III also adjusts the pH and swamps out variation in
total ionic strength. This method allowed sample fluoride concentration
to be determined independent of the level or nature of dissolved miner
als. The reference electrode, Orion model 90-01-00, and the specific
ion fluoride electrode, Orion model 94-09, were used throughout this
study. All millivolt measurements were made with the aid of the Orion
701A digital pH/mV meter.
To obtain the standard calibration curve (Fig. 4-1), the electrodes
were rinsed, blotted dry and placed in the fluoride standard solution
prepared by the above description. The standard was continuously stir
red and millivolts readings were taken only after a stable reading was
57

58
observed. The procedure was repeated for each of the fluoride standard
solutions. All readings were duplicated for a check. The duplication
showed -^ 0.5 mV variation. A plot of the millivolt readings against
concentration gave the standard calibration curve from which all subse
quent concentration values could be directly obtained once the millivolt
reading was available.
Batch Studies
This part of the study was conducted to determine the effects of
pH, influent fluoride concentration, temperature of sorbent during sorp
tion, and the sorbate-sorbent ratio, on the exchange capacity of activa
ted alumina for fluoride ions. Regeneration studies were also conducted
to determine the possibility of thermal regeneration for spent alumina.
pH
Aluminum oxide, the main component of activated alumina, is an am
photeric compound. When the compound is mixed with an acid solution,
the following surface reaction takes place
H"
(Al203)^Al203 + 3H2O ;^=:^ (Al203)^Al(0H)3 (3-1)
The product, aluminum hydroxide complex (Al203)^Al(0H)3, will raise the
pH of the solution. On the other hand, when activated alumina is intro
duced into an alkali solution, the surface reaction
OH"
^^^2°3^n^^2°3 •" ^2° ^ " ^ ^^^2^3'n^^3^^°3 " " ^

59
occurs. The complex (Al203)^2H3A103, will lower the pn of the soliticn
(23). Hence, the type of complex formed strictly depends upon the acid
ity and alkalinity of the solution in which adsorption of flt^orice
occurs.
In order to determine the optimum pH for fluoride removal. 130 ml
of 10 ppm fluoride solutions with pH 3, 4. 5. 7, 9, .-d 11 were made up
in plastic beakers. Correction of the pH was Kcomplishea through the
use of 20 percent by weight caustic soda solution or 20 percent by
weight hydrochloric acid solution, whichever applied. The experi'-ents
were conducted at room temperature (23 ^ 0.5°C). The 10 ppm fluoride
solutions were contacted with 0.1 grams of activated alumira under con
tinuous stirring and constant temperature. The residua] fluoride
concentration in the solution was recorded as a function of time until
adsorption reached equilibrium. The concentraticn-time history or the
10 ppm solutions at different pH's were used to calculate the exchange
capacity of activated alumina for fluoride ions in aqueous solutions at
different pH values. This pH test was useful in estalrlishing the
optimum pH for operation of the packed bed column.
Concentration Effects
In addition to pH, the value of the initial rluoride concentration
would also significantly influence the extent of fljoride rerr.cval.
Therefore, it was decided to study the effect of changing f e imt.i3l
fluoride content of the water being used at the optimum ;)'^.. For the
purpose of this study, 100 ml of laboratory fluoridated water ^ith ini
tial fluoride concentrations 0.5, 1.0, 2.0. 4.0, 8.0, and 10.0 - were
placed in P|j,?fi^ &iS.^M^^- ^^^^® solutions were contactt^J w^th C l r " 41
Jk
tot ^ } y^ u \v-, Vf" "^ ft'
. J vSi cJ ji? J ^ ^ Hi _ „ a 'xhf—

60
grams of activated alumina under constant stirring and temperature over
a period of 10 hours. After this time, adsorption had reached
equilibrium. During the time of contact, the residual fluoride in
solution was monitored initially after eyery fifteen minutes during the
first two hours. Later, residual fluoride was measured every one hour.
The data collected in this study established, among other things, the
time it took to obtain adsorption equilibrium for the initial
concentrations in question. Also, the variation in exchange capacity as
the initial fluoride concentration changed could be calculated.
Effect of Temperature on Exchange Capacity During Sorption
In this study, it was essential first of all to determine the temp
erature dependence of the selective ion probe. To do this, solutions
with fluoride concentrations 2.0, 4.0, and 8.0 ppm were prepared from a
sodium fluoride standard solution at temperatures 5 +_ 1.0°C, 24.5 _+
0.5°C, and 54 +_ l.O^C. The low temperature was achieved by immersing
the plastic beaker containing the fluoride solution in an ice bath stor
ed in the refrigerator at all times. In order to minimize errors aris
ing from evaporation at the higher temperature, it was essential to pre
pare the fluoride solution with water at a temperature slightly above 54
°C and use a constant temperature bath during all measurements.
With the fluoride standards all set, the concentration of fluoride
in each solution at the different temperatures was determined using the
pH/mV meter. The variation in the mV readings established the tempera
ture dependence of the fluoride ion probe.

HP «K"
61
The second part of the temperature stjc: was to establish tne vari
ation in the rate to adsorption equilibrium jivd contact t^mes at temper
atures 5.0, 24.0, and 54°C. The data collected in this pa-t of the
study enabled the determination of the rate to equilibrijr. and contact
times for the fixed bed operations. All r..peri:r.onts were conducted with
three different initial fluoride concentrations — :, 4, and 8 ppt;:. Ir,
order to also establish the effect of sorbate/sorbent ratio cn the
exchange capacity of activated alumina, it ^as essential to vary the
amount of sorbent that contacted the given rluoride cor-ontrations. For
this purpose, 1.0, 0.5, 0.25, 0.1, and 0.5 gm of activated alumi--: wrre
used to contact 100 ml, 4.0 ppm fluoridated -vater at 25.0°C. Ml other
experiments in this study used activated alumina doses of 1.0, 0.5 and
0.05 grams to contact 100 ml of initial fluori^.e concentrations of 2.0.
4.0, and 8.0 ppm. The residual fluoride concentration became tne cieprn-
dent variable and time was the independent variable. Two hcurs were
sufficient to achieve adsorption equilib'^ium during this par*- of the
study.
Finally, we needed data that would enable us to specify the quanti
ty of activated alumina needed to treat a given quantity of ::n*ar.inated
water. To determine this, 0.1 gm activated alumina was adced to 100 rl,
8 ppm fluoridated water in increments of 0.01 gm at ^e three y.fferfirx
temperatures 5.0, 24.0 and 54°C. Residual fluoride concentration in
solution was measured at 10 minute intervals.
3atc^ Theriia] Regeneration Study
T-e r^''?cse '5 Dct^.or c"' z^e st-rv
. - - - f i " - ' • .- c r — - .- "• T C ^ — ^'
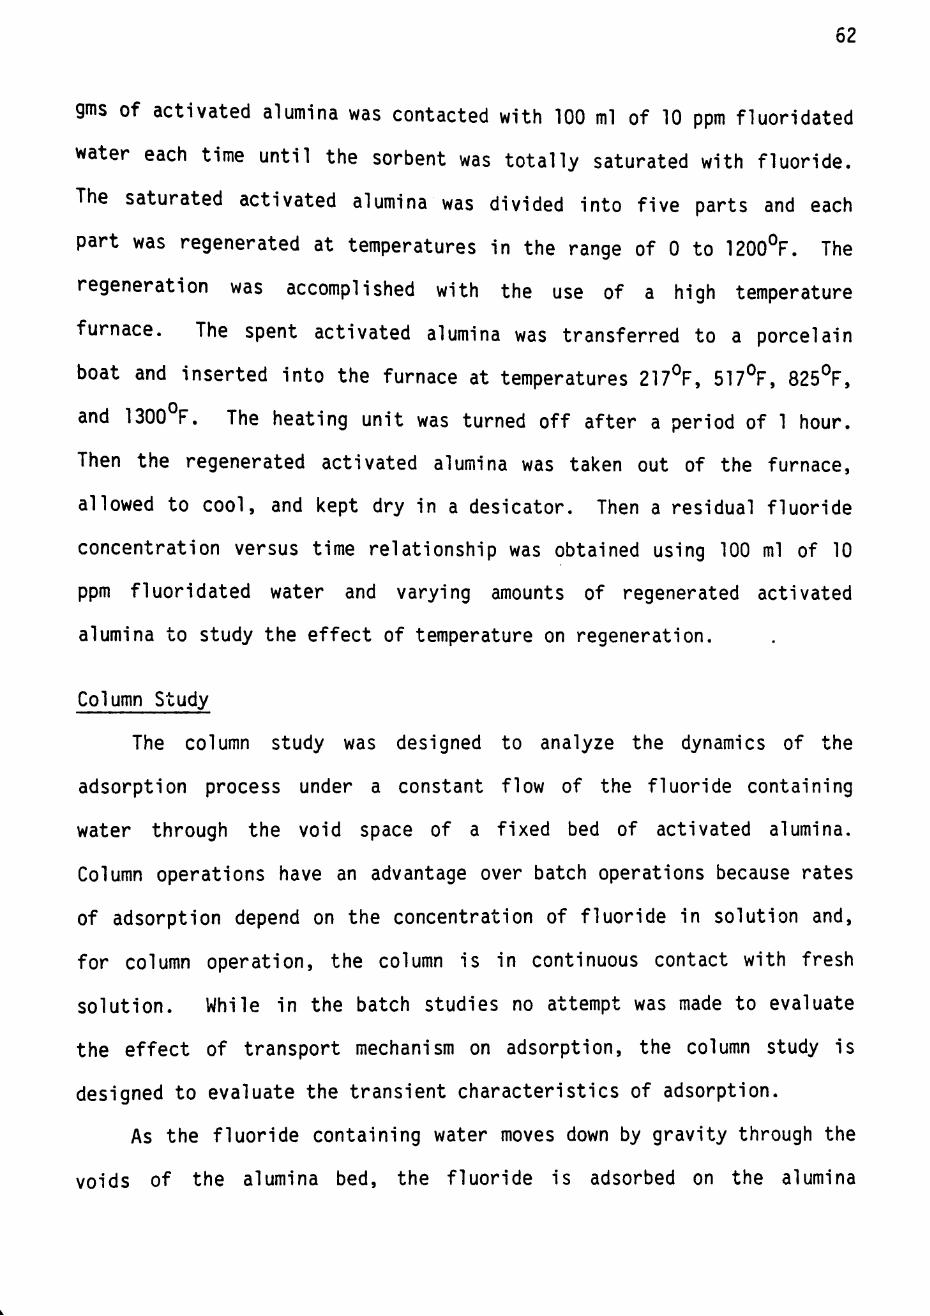
62
gms of activated alumina was contacted with 100 ml of 10 ppm fluoridated
water each time until the sorbent was totally saturated with fluoride.
The saturated activated alumina was divided into five parts and each
part was regenerated at temperatures in the range of 0 to 1200°F. The
regeneration was accomplished with the use of a high temperature
furnace. The spent activated alumina was transferred to a porcelain
boat and inserted into the furnace at temperatures 217°F, 517°F, 825°F,
and 1300 F. The heating unit was turned off after a period of 1 hour.
Then the regenerated activated alumina was taken out of the furnace,
allowed to cool, and kept dry in a desicator. Then a residual fluoride
concentration versus time relationship was obtained using 100 ml of 10
ppm fluoridated water and varying amounts of regenerated activated
alumina to study the effect of temperature on regeneration.
Column Study
The column study was designed to analyze the dynamics of the
adsorption process under a constant flow of the fluoride containing
water through the void space of a fixed bed of activated alumina.
Column operations have an advantage over batch operations because rates
of adsorption depend on the concentration of fluoride in solution and,
for column operation, the column is in continuous contact with fresh
solution. While in the batch studies no attempt was made to evaluate
the effect of transport mechanism on adsorption, the column study is
designed to evaluate the transient characteristics of adsorption.
As the fluoride containing water moves down by gravity through the
voids of the alumina bed, the fluoride is adsorbed on the alumina

63
surface. As this process continues, the bed becomes partially saturated
and becomes less effective for further adsorption. The breakthrough
occurs when there is the appearance of treated water in the activated
alumina bed effluent at a concentration greater than 1.0 ppm. The
breakthrough curve is obtained by plotting effluent concentration
against either time or volume of flow. The factors influencing the
breakthrough curve are flow rate, bed depth (or volume), contact time
and other factors influencing the process of adsorption. The break
point, the point at which the effluent concentration of treated water
becomes close to the initial concentration of the fluoride containing
water determines when the process should be discontinued and the bed
regenerated for further use. Table 3-1 summarizes the list of apparatus
and chemicals, and Figure 3-1 shows a schematic diagram of the packed
column used in this study. The column was packed with 283.85 gms of
28-48 mesh activated alumina.
Column Regeneration Study
Different methods for regenerating the spent activated alumina were
studied. The most conventional method of using caustic soda for regen
eration was investigated. This process consisted of backwashing the
spent bed with 2 liters of distilled water for a period of 30 minutes.
The water entered in an upward flow and was recirculated by the aid of
the pump. Following this backwash, 50 ml of 2 percent sodium hydroxide
was used to regenerate the bed for a period of 30 minutes. This was
followed by a dilute acid neutralization using a 50 ml, 20 percent IN
hydrochloric acid. Finally, the bed was rinsed with 2 liters distilled

64
TABLE 3-1
List of Apparatus Components (Sizes) and Chemical Reagents Used
Apparatus Chemicals
Single junction reference electrode
Fluoride specific ion electrode
4 mm glass beads
1 l i te r Erlenmeyer plastic flask
1/8 in. Tygon tube
Plastic valves
Plastic tubing connectors
Acrylic column (1 f t . x 3 in.)
Pump (1/25 hp)
10-gal. Carboy
Digital pH/mV meter
Media: 28-48 mesh activated alumina
Total ionic strength adjustment buffer solution (TISAB I I I )
Sodium fluoride standard NaF (100 + 0.5 ppm)
Sodium hydroxide solutions
Sulfuric, hydrochloric acid solutions

65
. 5 <D .y p
? ; • ' .• .-••>>
/
•fs
CO
c O
•r-•t-> 03
-o •r—
o 3 <1>
O
4->
c
O) CO
ZD
(A 3 + J 03 im to o. ex o:
x:
03
u C l 03
• I — O
•r—
03 E <u
o
I CO
(U
3 CD

66
water. The bed was ready for use when the effluents' water pH fell back
to 5.0. Briefly summarized below is the regeneration scheme with sodium
hydroxide:
Backwash With Distilled Water
Regeneration With 2% NaOH
Dilute Acid Neutralization
Rinse With Distilled Water
Another regeneration method studied was thermal regeneration; the method
used essentially corresponds to that of the batch studies. The bed was
removed and regenerated at 800°F.
In order to compare the effectiveness of both regeneration modes,
runs were made using the regenerated beds to remove fluoride from waste
water generated by Texas Instruments. The results of these removal
tests were compared to that obtained using a virgin activated alumina
bed.

CHAPTER 4
RESULTS AND DISCUSSION
Calibration Curve
Figure 4-1 shows a semi-log plot of fluoride concentration in parts
per million and the millivolts recorded on the pH/mV meter. This stan
dard calibration curve was utilized for the determination of fluoride
concentrations in this study. Concentrations below 0.1 parts per
million were obtained through extrapolation of these experimental
values. The standard calibration was done at room temperature, 24.5 j
0.5 C, and a solution pH of 5.0 +_ 0.2. For conditions different from
the standard, corrections were made using the temperature and pH
dependences of the selective ion probe as shown in Figures 4-2 and 4-3.
pH Effects
The influence of pH on the removal of fluoride by activated alumina
is shown in Figures 4-4 and 4-5. Figure 4-4 shows that the residual
fluoride concentration is a function of both pH and contact time. The
results obtained with initial fluoride concentration of 10 ppm (10
mg/liter) and activated alumina dosage of 0.1 grams per 100 ml solution
clearly showed that the maximum efficiency of fluoride removal occurred
at a pH of 5.0. At pH 5, 81 percent of the initial fluoride concentra
tion of 10 mg/liter was removed. The exchange capacity (calculated as
shown in the Appendix) under the same conditions as given in Figure 4-4
is graphed in Figure 4-5 as a function of pH. Figure 4-5 shows that the
exchange capacity is pH-dependent. A decrease in exchange capacity was
67

68
10000.0 H
L U 0 R I 0 E
C 0 N C E N T R fl r J 0 N
( P P M )
1000.0 -
100 .0 -
lO.C-
1.0-
0.1
2 0 0
1 8 0
1 6 C
1 4 0
1 2 0
1 0 0
8 0
6 0
4 2 2 0 0 0 0
•1ILuIV0L''S
4 0
6 0
8 0
1 0 c
1 2 0
1 i
4 0
1 6 0
1 8 0
2 0 0
Figure 4-1. Calibration Curve Showing Fluoride Concentration versus Millivolts at pH 5 and 24.5°C

69
10.00-1
1.00-1
L
u 0 R I 0 c
c 0 N c '( p p M C. .'0 )
CC] -• r ^ ^ ^ T ^ ^ ^
PH = 5.08 ^ 0-2 fEMPERflrURE !N OEG.C
!0 !S 20 2S 30
MlLLJVOLrS
• ^ ' I >T ••» M l
40 4'6
Figure 4-2. Temperature Dependence of the Fluoride Specific Ion Probe
•N

70
10.00 H
1.00-F L U 0 R I 0 E
C 0 N C
( P P M ) 0.10
0.01 -^ » i f H ' » l l ' » i f " » » f » TT^ !• • I " I' I —
-20 -10 0 :C 20 30 40 SO 60 7C 80 90 100
MlLLIVOLrS
Figure 4-3. pH Dependence of the Fluoride Specific Ion Probe. T=24.5°C

71
pH=11.0
pH=9.0
pH=7.0
pH=3.0 2pH=4.0
pH=5.0
TIME IN .HOURS
Figure 4-4.
• J .1 ciiinride Concentration Relationship ^flll'^^'T^^^^^^^^^^ Contact Times in Solution and the pH aL T=24.50C
72
7.C-J
6 . 5 -
6 . 0 - "
s.s-E X c M fl S.O-N G E
C 4.5-fl P P C I 4 . 0 -T
r
( K 3 . 5 -G / C U
3 . 0 -M E T E R 2 . 5 -)
2 . 0 -
1 . 5 -
l . C -' I 1 ' ' ' t t > * ' ^ • • p i ^ ^ ym
G 7
PH OF INFLUEN''
10 11
Figure 4-5. Relationship Between the Exchange Capacity of Activated Alumina and the pH of Influent T=24.0 + O.5OC

73
observed as the system pH varied from pH 5. This study showed that the
maximum exchange capacity of fluoride adsorption occured at pH 5. When
the pH either decreased below 4.0 or increased above 6.0, the exchange
capacity decreased sharply.
It has been found elsewhere (4) that anion adsorption sites on min
erals such as alumina are aquo groups (-M-0H2' ) and hydroxo groups
(-M-OH). The surface chemistry of an oxide in contact with an aqueous
solution is determined to a large extent by deprotonation or a hydroxyl
ion association reaction. For a positively charged surface, the
reaction
and.
•M-OHg' ., ^ -M-OH + H"*" ^^'^^
-M-OH + 0 H " ^ = ± - M-O" + H«0 (4-2)
for a negatively charged surface may be written (6). In this study, as
the pH decreases below 4.0, AI2O3 will be dissolved as Al' '*' and
subsequently, positively charged strong aluminum complexes such as AlF
and AIF2 are formed. The surface of AI2O3 will be further positively
charged with a decrease in pH. Therefore, the sharp decrease in capac
ity below pH 4 is probably a result of the formation of positively
charged aluminum complexes as well as electrical repulsion between the
positively charged complexes and the positively charged surface. On the
other hand, as the pH increases above pH 6, the hydroxo groups (-M-OH),
as shown by equations 4-1 and 4-2, will gradually disappear forming an
increasingly negatively charged surface. In addition, OH' will compete

74
with fluoride ions for the available sites left on the surface, hence,
contributing to a decrease in the exchange capacity.
Concentration Effects
The effects of the initial fluoride concentration on the perform
ance of activated alumina in fluoride removal are shown in Table 4-1 and
Figure 4-6. Table 4-1 shows the residual fluoride in solution when sam
ples containing different levels of fluoride are allowed to contact 0.1
grams of activated alumina during a 10 hour period. Figure 4-6 shows
the dependence of the exchange capacity (the amount of fluoride removed
(kg) per unit volume (m ) of sorbent bed) on the initial fluoride
concentration. The exchange capacity of the adsorbent increased
linearly when the initial fluoride concentrations in the concentration
range studied were increased. The sites present on the interior surface
of a pore may not be as easily available (because of resistance to pore
diffusion) as the sites on the exterior surface. The energetically less
active sites will also be more fully occupied as the activity of
fluoride increases.
Isotherm Study, Temperature Effects
Figures 4-7 to 4-15 show residual fluoride concentrations at temp
eratures of 5.0 + 1.0°C, 24.5 + 0.5°C, and 54 + 1.0°C. From these fig
ures, it is seen that, regardless of the temperature of the system, flu
oride removal generally increased with an increase in the amount of act
ivated alumina used. It can, therefore, be said that the amount of ad
sorbent used in a particular removal scheme will be set by the level of
fluoride contained in the raw water, the level of removal desired and

75
TABLE 4-1
Residual Fluoride Concentration in Solution During Contact With 0.1 Grams Activated Alumina
Time (hrs)
0.00
0.25
0.50
0.75
1.00
1.25
1.50
1.75
2.00
2.25
2.50
2.75
3.00
7.00
10.0
10.0
6.80
5.80
5.20
4.70
4.40
4.10
3.90
3.70
W • W «i
3.45
3.30
3.25
1.95
1.90
Residual
8.0
4.40
3.20
2.75
2.50
2.33
2.18
2.10
1.95
1.90
1.88
1.84
1.82
1.50
1.50
Fluoride (
4.0
2.60
1.98
1.70
1.34
1.20
0.99
0.90
0.86
0.76
0.75
0.74
0.68
0.50
0.50
Concentration
2.0
0.78
0.62
0.49
0.46
0.41
0.35
0.33
0.32
0.29
0.28
0.26
0.25
0.18
0.18
(ppm)
1.0
0.56
0.21
0.15
0.13
0.11
0.10
0.09
0.08
0.08
0.07
0.07
0.06
0.06
0.06
0.5
0.12
0.09
0.07
0.06
0.05
0.04
0.03
0.04
0.03
0.03
0.03
0.03
0.02
0.02

76
0.0-
2 3 4 5 6 7
.'NjriflL FLUORIDE CONC. iPPM)
Figure 4-6. Relationship Between Exchange Capacity and Initial Fluoride Concentration. T=24.5°C pH=5.0, Contact Time = 10 hrs

77
10.000 H
0 .010-
0.00! -
INITIAL FLUORIDE CCNC.-4.CPPM TEMPERATURE = 2 4 . 5 OEG.C
PH = 5.0 M = flCTIVflTEO PLUMlNfl (GRflMSJ
i i i i , I l l , I I I ^ I I I I I I 1 1 ' " I
0 10 20 30 40 50 60 70 80 90 100 110 120
TIME IN MINUTES
i.£GEN0: M > • * 0.05 — > ^ i> 0.5 aoa— !
Figure 4-7. Residual Fluoride in Solution Using 4 0 ppm Tniiial Fluoride Concentration at pH 5, 24.5 C "' .!:/.Tnncp<: nf Activated Alumina and Various Doses of Act

78
R E S I 0 u fl L
F L U 0 R I 0 E ( P P M )
INITIAL FLUORIDE C0NC.=8.CPPM TEMPERATURE = 24.Si 0-5 OEG. C
PM = S.O iO^^ M = ACTIVATED ALUMINA fGRAMS1
10.000
1.COO -
0.100-
0.010 -
0.001
0 10 20 30 40 SO 60 70 80 90 100 1! 0 ! 20
TIME IN MINUTES
LEGEND- M > . I C.CS « a » C. S 0 3 3 l-O
Figure 4-8. Residual Fluoride in Solution Using 8.0 ppm Initial Fluoride Concentration at pH 5, 24.5°C, and Various Doses of Activated Alumina

79
INITIAL FLUORIDE C0NC.=2.0PPM TEMPERATURE = 24.5*0.3' OEG.C
PH = 4.95*0.2 M = ACTIVATED ALUMINA (GRAMS)
10.000 H
O.OOI -t . i , . r i i r F i r p prw i i r i p w n M 11 j i M 11 m i ^-nt rf m f [ i i • 11 r f i p M i n 11 *, i i i i T i f * t j n FTTT>TT]I
0 10 20 30 40 SO 60 70 80 90 100 ll 0 120
LEGEND: ri
TIME IN MINUTES
C.CS >—•—»~ O.b a C3 J
Figure 4-9. DoQidiial Fluoride in Solution Using 2.0 ppm Initial Fluiride cincenfration at pH 4.95, 24.5°C and Various Doses of Activated Alumina

80
n = PCTIVATED ALUMINA (GRAMS)
10.000
l.OCO
R £ S I 0 u A L
F L U 0 R I 0 E ( P P M )
0.100
o.cio
c.ooi -' ,0 .0 30 . 0 .0 eo ™ eo so
TIME IN MINUTES
LEGEND: M - '
100 HO '-20
L-0
. in Residual Fluoride in ^''\fll\%'',^iA\r.<i Various Figure 4-10. R"iQua Concentration at pH 4. ".
oises of Activated Alumina

81
INITIAL FLUORIDE C0NC.=4.0PPM TEMPERATURE = 55.StIO OEG.C
PH = 4. 90 « 0-2 M = ACTIVATED ALUMINA (GRAMS)
lO.COC H
0.001 -w T i f T T i r i Tff «"y' f r ^ i 1111 I ' I TTf TT r r ' i n n i ] i t- inRF^ i T [»11 n 111 11 ' 11 • 11 i n 11
30 40 50 60 70 80 90 100 110 120
LEGEND: M
TIME IN MINUTES
-0.C5 —> » -a— 0.5 B O B I-O
Figure 4-11. Residual Fluoride in Solution Using 4.0 ppm Initial Fluoride Concentration at pH 4.90, 55.5 C and Various Doses of Activated Alumina

82
INITIAL FLUORIDE CONC.=a.CPPM TEMPERATURE = SS.OilO OEG.C
PH - 4.92 ±0-2 M = ACTIVATED ALUMINA (GRAMS)
10.000
0.001 -
LEGEND: M
TIME IN MINUTES
> > * O.CS » « > 0.5 a a a 1-0
Figure 4-12. Residual Fluoride in Solution Using 8.0 ppm Initial Fluoride Concentration at pH 4.92, 55.0°C and Various Doses of Activated Alumina

83
INITIAL FLUORIDE C0NC.=2.0PPM TEMPERATURE = 5.0 ±1-0 OEG.C
PH = 4.98*0.2 M = ACTIVATED ALUMINA (GRAMS)
10.000
R E 5 I 0 U A L
L U 0 R I 0 E ( P P M )
l.COO-
0.100-
0.010-
0.00! -
G 10 20 30 40 50 60 70 80 90 100 110 120
TIME IN MINUTES
LEGEND: M I * *i O.CS * ' ' • 0.5 aaa i O
Figure 4-13. Dac-iH.ial Fluoride in Solution Using 2.0 ppm Initial Fluiride cincenfration at pH 4.98, 5.0«C and Various Doses of Activated Alumina

84
R E S I 0 U A L
F L U 0 R I
6 E ( p p M )
INITIAL FLUORIDE C0NC.=4.CPPM TEMPERATURE = 5.C± 1-0 DEC C
PH = 4.98 tOZ M = ACTIVATED ALUMINA (GRAMS)
10.000 -\
1.GOO -
0.100
C.CIO -
0.00! -
LEGEND: M
30 40 50 60 70 80
TIME IN MINUTES
*—*—*—O.CS » » » 0.5
100 no 120
a • n L-0
Figure 4-14. Residual Fluoride in Solution Using 4.0 ppm Initial Fluoride Concentration at pH 4.98, 5.0 C and Various Doses of Activated Alumina

85
INITIAL FLUORIDE C0NC.=8.0PPM TEMPERATURE = 5.0±i-O OEG.C
PH = 4.97 10.2 M = ACTIVATED ALUMINA (GRAMS)
10.000 -I
l.COO-
R E S I 0 U A L
L 0.100 U 0 R I D E ( P P M )
0.010-
0.001 -
LEGEND: M
TIME IN MINUTES
* * * 0.05 . » * i 0.5 a a a 1-0
Figure 4-15. Residual Fluoride in Solution Using 8.0 ppm Initial Fluoride Concentration at pH 4.97, 5.0 C and Various Doses of Activated Alumina

86
economics. Optimum fluoride removal will necessarily involve a
trade-off between these three major factors. Since the increase in the
of fluoride removed (as shown in Figures 4-7 to 4-15) showed no
appreciable increase after 2 hours, the contact time required to est
ablish adsorption equilibrium was set at 120 minutes. Table 4-2
compares the exchange capacities of activated alumina at the three
different temperatures and various quantities of the adsorbent.
Generally, the capacity did not show any strong dependence on
temperature during sorption. There was, however, a minor change in
capacity when the amount of adsorbent was small enough (0.05 grams) to
accomplish the removal at a much smaller rate. On economical grounds,
it will be necessary to use the minimum amount of activated alumina and
smaller rate of adsorption. As Table 4-2 shows, the capacities did not
show any significant change at the three different temperatures when the
amount of the adsorbent was increased to 0.5 and 1.0 grams per 100 ml of
solution. This can be attributed to the fact that close to total
adsorption occurred in the first 30 minutes of contact (see Figures 4-7
to 4-15).
Table 4-3 and Figure 4-16 show the relationship between fluoride
removal and the ratio of the initial fluoride concentration to a unit
weight of adsorbent used. Table 4-3 shows the residual fluoride in sol
ution during sorption. It is shown that for the concentration range
studied, adsorption equilibrium was essentially reached in 2 hours.
After a period of 2 hours, no significant removal of fluoride was
observed. Figure 4-16 shows the relationship between the ratio of
initial fluoride concentration to a unit weight of activated alumina (R)
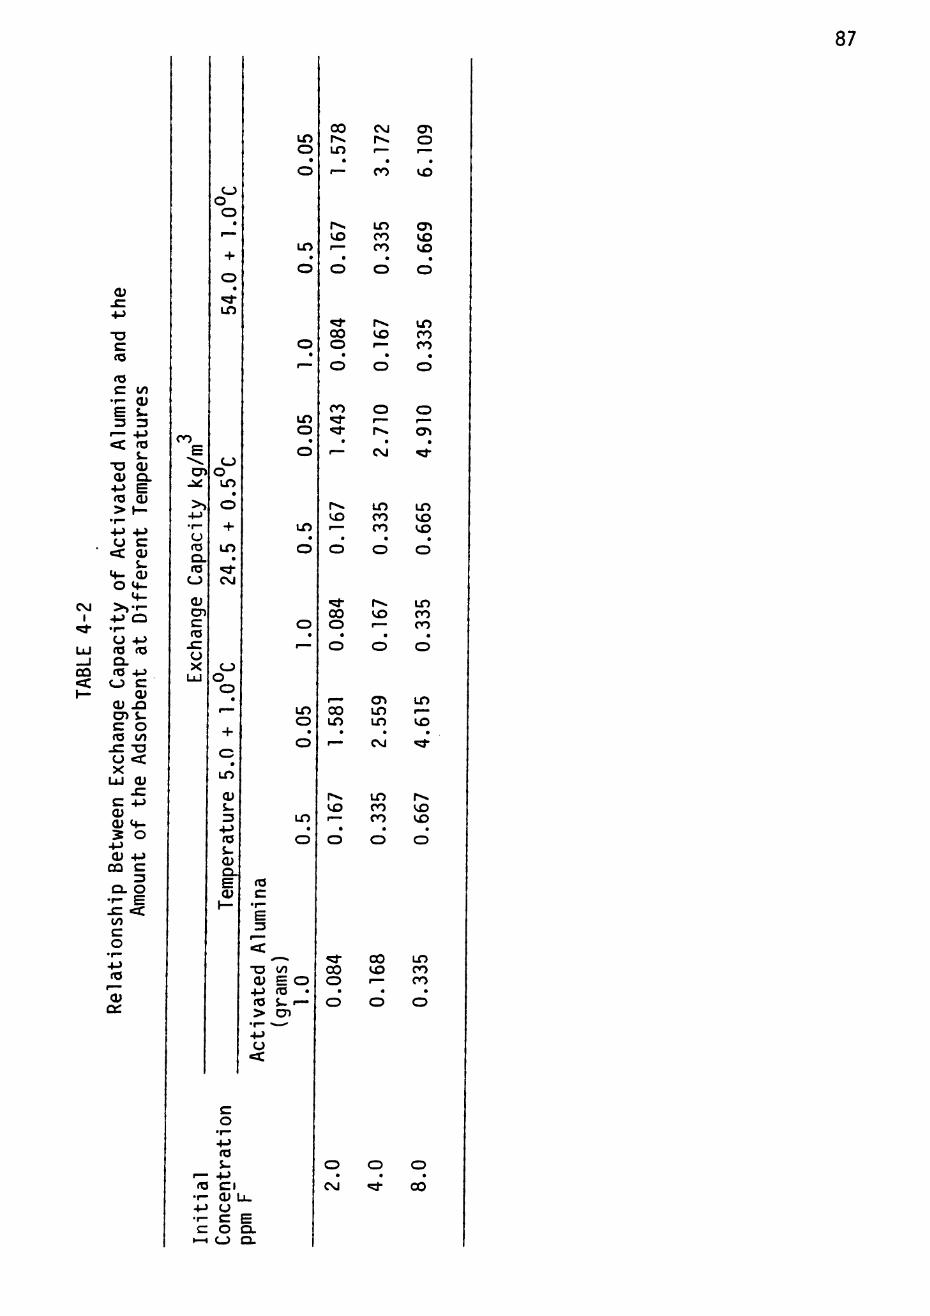
87
CVJ I
CO <3:
<u
c to
to
• r - <U E S-3 3
<— + J
s--a <u <u Q. +-> E to 0) > »—
•r-
o c
O ^m
• I —
O +J (O (TJ Q . to 4->
O C CU
O) ^ CD S-C O fC CO
j = - a o < X
UJ <L> C -M (U <U M-
s o CO C Q . O •r- E x: <x: to c o
- M to
OC
O O
LO
CO
cn j ^
•r— O <o CL to
C_3
<u CD c
x: o X
CJ o
LO
LD
CVJ
CJ o o
in o
00 r>» in
C^sJ
r«» r—
a>
o
ir>
o
If)
o • o
CO •sa-«:f •
< —
o r— P^ •
CVJ
o CT> •
^
uo o
LO
3
s-cu E
LO
o
LO
o
to c •r—
E 3
• O CO <U E O
+J <C • fC S- I— > cn
r«>. LO
CO
LO CO CO
CO
CO CO
^ 00 O
r LO ^
LO CO CO
LO LO CO CO
CO CO LO
«!f 00
o
p«v CO r—
LO CO CO
0 0 cy> LO LO
r— CVJ
p>. CO
LO CO CO
LO
CO
«5r
CO LO
c o
4-> to i-
f— +J to C l
•r- <U U--> O
•-- C E e o Q.
• - • C J C3.
«5r 0 0 o
0 0 LO
LO CO CO
o CVJ
o O
00*

o to
4->
3 o o EO
<X. LO
S- LO
to • CsJ
JC -M II
CO 1
^
LLJ - J OQ < : h -
a. •O E <D <U
•M 1— U to **
4 J O C • O LO
CJ II
c O 31
•r- Q . 4-> 3 *
r— rt3 O C
(>0 -r-E
C 3 • r " r"~
< (U
-O "O •r - 0 ) $- 4-> O fC 3 > — •!—
U_ 4-> O
>— < (O 3
-o •r— to 0) a:
LO O
LO CVJ
o o
o o^
o 00
o 00
o 'd-
o CVJ
o o
o 00
o 00
CVJ
o o
v o LO LO LO LO «;r ^
o CO
o •St
o cr> o o
LO LO
• I —
E
0)
O LO LO CO I— n -
O O ^ S l - C O C V J C V J C V J C V J C V J C v j
o o
LO CVJ
o CO
o CO
o f—
r^ cy»
on 00
00 r>»
i>^ r»
^ CVJ I— r - r— O O O O
O O o
CVJ
CO LO cn cr>
CO
LO r -CO CO CVI CVJ
•tr f— O o o o o o
O L O O L O O O ^ L O O C O r - L O C V J r — O C r i O O C D L O C V J , — r - ^ ^ O O
•— O O O O O O O C D
o Lf)
LO CVJ '—
o <T> O
00 LO o
r«. i n o
LO LO o
LO «>t o
r—
^ o
(-) ^r o
o o o o
o o
l O CO
LO LO
lO co 0 0 CVI
o o
CO CO CVJ CVJ
CVJ CVJ
00 f— o o o o o
o o
LO O CO CVI CVJ 1 — I —
o cy» <— o
00 r>s o o ^ o o o o o o
LO •
o
to c
umi
r—• *m^ « t to
E O "O to ' 0 ) s - <— •M cn ( T J — ' >
•p— + j o
<
o o
• <e:t
O O
^
o o
o CVJ
• o
•d-a> o o
CVJ LO o
CVJ cn o
• o
r>* ^ o o
•5t CVJ o
CVJ LO o
• o
CVJ ro o o
r^ r—
o
00 •51-o
• o
•sa-CVJ o o
CO r—
o
cr> CO o
« o
o CVI o o
o f —
o
LO CO O
• o
r^ r—
o o
cn o o
r— CO o
• o
l O r—
o o
00 o o
00 CVJ o
• o
CO r—
o o
00 o o
CVJ o o o o o o
o o o o o o o lO O LO o r— CO ^ LO
LO O LO o (T> O CVI

89
R^INITIAL FLUORIDE CONC.PER UNIT WEIGHT ACTIVATED ALUMI
0 1 2 3
fVW^'^t • * I I I 'f t* VI I P* • « I f • V V V ^ ^
U 5 6 7 8 9 10 1! 12
R IN MILLIGR.AMS PER GRAM
Figure 4-16. Relationship Between Exchange Cap'-icity and the Ratio of Initial Fluoride Concentration to a Unit Weight of Sorbent. T=24.5 + 0.5^0, pH=5.0

90
in milligrams per gram and the exchange capacity of activated alumina in 3
kg/m . The results showed that the exchange capacity increased with
increase in the ratio R. This result essentially confirms the earlier
findings where it was found that capacity increased linearly with
initial fluoride concentration.
Figure 4-17 shows the relationship between the residual fluoride in
solution and the amount of activated alumina required to treat fluor
idated water containing 8.0 mg/liter fluoride at temperatures of 5.0,
24.5, and 54°C, respectively. The results showed that the amount of
fluoride removed per unit amount of activated alumina increased substan
tially only at 54°C. The concentration of fluoride removed at tempera
tures of 5°C and 24°C was essentially the same. The increased
adsorption at elevated temperature is probably a result of increased
activity and diffusivity of fluoride ions in solution due to increased
thermal activity.
Batch Thermal Regeneration
In this part of the study, attempts were made to thermally
regenerate portions of 0.15 grams of activated alumina which had been
saturated with fluoride. Temperatures of 80°F, 217 F, 517 F, 825 F and
1300°F were used. An evaluation of the effects of the thermal
regeneration efforts was accomplished by determining the subsequent
sorption loading achieved by the regenerated alumina. This operation
involved the exposure of 0.15 grams of the regenerated sorbent to
samples of 100 ml of 10 ppm fluoridated water. Figures 4-18 through
4-20 compare the performance of the media regenerated at these
temperatures to that of the virgin activated alumina.

91
SOLUTION = 8.0PPM FLUORIDE STANDARD T = TEMPERATURE IN DEG '
PH = S.OtO.Z
lO.OH
R E S I 0 U A L
F L U 0 R I 0 r w ( p p M )
1.0-
G. 1-
0.00 0.02 0.04 0.06
OUANTITf OF ACTIVATED ALUMINA(GRAMS)
LEGEND- T ' -p -p 5 — » ••• » 25
0.10
• D C3 S i
Figure 4-17. Residual Fluoride in Solution at Different Temperatures and Quantity of Activated Alumina

92
lO.OH
R E S I 0
u A L F L U 0 R I 0 E ( P P M 1
l.O-J
0.1-
VAA.-VIRGIN ACTIVATED ALUMINA T=REGENERATION TEMPERATURE DEG.!
PH = S.C
• . y I »
^ — . ,
\ N. I 3 a o
\ ^ ,
, , M l I I I 'I I I '•
C 2(3 40 60 80 100 120 140 160 ISO
^IME IN MINUTES
T=80°F
T=217°F
T^SU'^F T=1300°F
T=825"F
VAA
Figure 4-18. Residual Fluoride Concentration in Solution Using a Virgin Activated Alumina and the Sorbent Regenerated at Different Temperatures

93
T-REGENERATION rE.MPERATURE DEG '
X--FLUORJOE REMOVED PER UNlV'wEiGHT S0R8ENT
T=825°F
T=1300°F T=517°F
- T=217T
T=80°F 20 40 60 80
100 J20 mo ISO 180
TIME IN MINUTE.":
Figure 4-19. Relationship Between Fluoride Removed Per Unit Weight of Activated Alumina, the Virgin Sorbent and Sorbent Regenerated at Different Temperatures

94
^.bH
' 4 . 2 -
3 . 9 -
3 . 6 -
E 3 . 3 H X C M A 3 .0-^ N G E
2.7-1 C A P A 2.4-1 C I T r 2.1-J
{ K G 1 . 8 ^ / C u
i.sH M E T E \.2-\ R )
0.9-1
O.G-
0 . 3 -
0 . 0 -' I I I . . . . . — ' ' ' I I ' • •
200 400 600 800
REGENERATION TEMPERAI'URE OEG.F
!CCO 1200
Figure 4-20. Relationship Between the Exchange Capacities of Thermally Regenerated Sorbent and Regeneration Temperatures

95
Figure 4-18 shows the residual fluoride concentration in solution
during a contact period of 180 minutes. It is apparent that increasing
the regeneration temperature improves the adsorption pattern. However,
as shown in Figure 4-19, the maximum removal of fluoride occurred during
the first 90 minutes of contact. After this period, the amount of flu
oride removed was no longer very significant. The sorbent regenerated
at 825 F achieved the highest removal of fluoride. The capacity of act
ivated alumina regenerated at 825°F was 4.625 kg/m^ of media compared to
5.10 kg/m , that of the virgin material. The overall effect of the
regeneration temperature on the exchange capacity of activated alumina
in the concentration range and quantity of media studied is shown in
Figure 4-20. The capacity increased with temperature up to 825°F and
then decreased as the temperature increased to 1300°F. It should be
indicated that even at the optimum regeneration temperature, 825°F, the
regenerated alumina did not match the performance of the virgin
activated alumina. Although a host of reasons may be associated with
the drop in exchange capacity at 1300°F, one probable explanation would
be the damage caused by thermal stress to the pore structure of the
activated alumina. Ideally, thermal regeneration of activated alumina
should provide a material for reapplication with the same sorption
affinity and capacity as the parent material. However, this study has
shown that thermally regenerated activated alumina achieved only 84
percent of its original sorption capacity (see Figure 4-20). The
mechanism of thermal regeneration of activated alumina is probably
related to activation since both processes are accomplished by heat
treatment.

96
Packed Column Study
The results of the packed column studies for influent fluoride con
centrations of 10 ppm and 520 ppm are shown in Figures 4-21 and 4-22.
Figure 4-21 was obtained by suing laboratory fluoridated water while
Figure 4-22 was obtained using process waste water from Texas
Instruments. It was expected that the effluent would approach the
initial concentration when the bed reached saturation. However, as
Figures 4-21 and 4-22 show, the initial concentrations were not reached
by the effluent even though over 50 gallons of the 10 ppm and more than
4 gallons of the water containing 520 ppm fluoride was treated. The
overall adsorption in treating the 10 ppm fluoridated water resulted in
the removal of 0.227 milligrams per gram of activated alumina. Overall
adsorption in the 520 ppm waste water treatment resulted in the removal
of 1.113 milligrams fluoride per gram activated alumina. A breakthrough 3
capacity of 8.327 kg/m was realized when the initial fluoride
concentration was 520 ppm. When the initial fluoride concentration was 3
reduced to 10 ppm, a breakthrough capacity of 4.113 kg/m was obtained.
The exhaustion point (the point where the effluent fluoride concentra
tion becomes close to the initial concentration) for the 10 ppm
fluoridated water was 9.3 ppm and was obtained after treating a total of
72.7 gallons of contaminated water at an average flow rate of 101.92
ml/min (0.026 gallons per minute). For the 520 ppm treated waste water,
the exhaustion point was reached at an effluent concentration of 490
ppm. A total of 4.04 gallons of waste water was treated at an average
flow rate of 56.6 ml/min (0.015 gallons per minute).

97
E F
L U E N T
F L U 0 R I D E
C 0 N C r u N r R A T r 6 N
( P P M )
'1
8J
7-
6-
5-;
4-1
3-
2J
! -
J
INITIAL FLUORIDE CONCrjC OPPM TEMPERATURE = 24 .5 OEG.C '
r
II ' i [ i r p t F " » ^ f »""'f T'^r • F"* * " ^ T -r 0 3 6 9 12 15 18 21 24 27 30 33 36 39 42 45
'"IME IN HOURS
higure 4 -21 . Breakthrough Curve Showing the Effluent Fluoride Concentration at Different Times Using Initial Fluoride Concentration of 10 ppm

98
INITIAL FLUORIDE CONC.=520.OPPM TEMPERATURE = 24.S OEG.C
PH = S.C
500 H
450-
400 E F F L U 350-E N
r F 300-L U 0 R i 250-C E C 0 200-N C E N T J50-R A r F 0 100-N
SO-
Q J I 1 I I I II I I IT
^i I I I I j I I I ' , I 25 SO 75 100 125 ISC 175 200 225 250 275
TIME IN MINUTES
Figure 4-22. Breakthrough Curve Showing the Effluent Fluoride Concentration at Different Times Using Wastewater from Texas Instruments 520 ppm Fluoride

99
In summary, it may be said that the factors that influence the
breakthrough curve are the flow rate of the raw water and the bed depth
and initial fluoride concentration. These conditions must be carefully
chosen in order to obtain the best fluoride removal by activated
alumina. One of the biggest problems encountered during the running of
the packed column was that of bed plugging. When the bed plugs, the
contact time is prolonged and inadequate experimental data results. To
reduce this problem, it was essential to half-fill the column first with
water before addition of the sorbent. This method produced a loose bed
that permitted water to flow freely under gravity, thereby enhancing the
bed's performance.
Packed Column Regeneration
Two different regeneration modes, chemical and thermal were
examined in this study. Figure 4-23 shows the breakthrough curve
obtained using the chemically regenerated sorbent. The waste water
treated contained 520 ppm fluoride. A breakthrough capacity of 6.764
kg/m^ was obtained. The exhaustion point reached was 500 ppm fluoride
after treatment of a total of 3.5 gallons of waste water at an average
flow rate of 50 ml/min (0.0132 gallons per minute). An overall fluoride
removal of 0.745 milligrams per gram of sorbent was obtained when the
activated alumina was regenerated with a 2 percent sodium hydroxide
solution. To dispose of the fluoride-laden regenerant solution without
contaminating the environment, it was decided to remove the high level
(300 ppm) of fluoride from the regenerant solution. The pH of the
solution was adjusted from 11.0 to 7.2. Then 65 grams of powdered

SCO-I
100
CHEMICAL REGENERATION INITIAL FLUORIDE C0NC.aS20.CPPM
TEMPERATURE = 2M.S DEG C PM = 5.0
450-
0-4» J J J — * - • — ^ 1 1 1 1 1 1 1 I J ^ 1 1 1 1 1 1 1 1 t I • I i p I ^ ^ •
25 50 75 ICO 125 ISC 175 200 225 250 275
HME JN MINUTES
Figure 4-23. Breakthrough Curve Showing the Effluent Fluoride Concentration at Different Times Using Activated Alumina Regenerated with a 2 Percent Sodium Hydroxi de

101
calcium chloride were added to one liter of the saturated regenerant.
Fifty ml of 1 percent calcium hydroxide solution was added. The content
was agitated by shaking for 1 hour and left to stand overnight. By this
process, the fluoride concentration of the spent regenerant was reduced
from 300 ppm to 20.1 ppm.
Figure 4-24 shows the breakthrough curve obtained using a sorbent
bed regenerated thermally at 800 ^ 5.0°F. A total of 1.855 gallons of
waste water containing 520 ppm was treated. The exhaustion point 3
obtained was 460 ppm. A breakthrough exchange capacity of 4.077 kg/m
was obtained. An overall fluoride removal of 0.499 milligram per gram
of sorbent was obtained. The average flow rate for this part of the
study was 20.65 ml/min (0.0054 gallons per minute).
Table 4-4 summarizes the results of both regeneration modes
studied. Clearly, the chemical regeneration using a 2 percent sodium
hydroxide provides a sorbent with higher capacity and overall fluoride
removal. Nevertheless, thermal regeneration shows a good promise. It
is therefore an area that necessarily requires further study.

102
THERMALLY REGENERATED SORBENT INITIAL FLUORIDE CONC.-520.OPPM
REGENERATION TEMPERATURE=80C DEG.F
500-1
450-
E F F L U E N T
F L U 0 R I D E
C 0 N C E N T R A T I 0 N
i P P M )
400-
350-
300-
250-
200-
150-
ICO-
50-^
c-b r - r * I f f I ! r r T t r t I' >"T r »• T^-^ - ^ ^ ^ ^ *• r T T | T ^ ' i i ' i •" T » T I -
50 100 150 200
TIME IN MINUTES
250 300 350
Figure 4-24. Breakthrough Curve Showing the Effluent Fluoride Concentration at Different Times Using Activated Alumina Thermally Regenerated at 800 F

103
UJ - J OQ
E CL CL
o CVJ ir>
c o
+ J
im
c OJ u c o o (U
T 3 •r— &-o •3
4-> C Ol 3
o •r-• • - >
to
im
c a>
Q :
c E O
u -a CD
u
4 -O
to
CO (U
0 £
• o cu 4- CTi O " ^ CO O i •O E < :
cu <— - o ~ '^
fO im s- o O) 3 > r—
o u.
0)
10 M- I S — O LO
TD C (U (U O E 4 J r -3 «0 r—
I— <y <o O S- C71|
o
to 3 to
sz — X E
IxJ CL OL
o
0
<L) -l-J
o; (tj oca:: to im 5 (U 0 > r—
<C Ll.
--» C
•r— E
''' . r—
E •*-'
0 0
• 0 LO
CO
1 0
LO
CO
o o t o
cr» CT>
cn
t o <X3
^3-o
o o CT!
LO LO
o CVJ
o LO
• LD LO
JZ cn 3 0 s.
x : •M . ^ ITS CU &.
CQ
">«.» cn
-x:
>) 4-> • r -
0 to CL to
CJ
c o
•r--M ns s-cu O) O) C3^-0
cu o ct: IS
LO
vo
o to
CVJ
o CVJ
ro CO
to E u-s -o (U o
j z : o h- 0 0
cn

CHAPTER 5
CONCLUSIONS AND RECOMMENDATIONS
Conclusions
The results of this study showed that:
1) The use of activated alumina in a gravity flow packed-column,
is a simple and yet effective method for defluoridating water supplies.
Because of the effectiveness of the system in reducing low fluoride
concentration (10 ppm) to below 0.15 ppm, most water supplies would not
require pretreatment.
Fluoride removal by activated alumina is pH dependent. The optimum
pH for fluoride removal occurred at pH 5. The capacity for fluoride re
moval decreased appreciably at pH values below 4.5 or above 8.5. This
pH range will provide an advantage because most water supplies will have
pH in the optimum range and pH adjustment will not necessarily be
required. Furthermore, at the optimum pH, the exchange capacity of
activated alumina increased linearly with increase in the the initial
fluoride concentration. This is again an added advantage since such a
dependence would permit the convenience of a simplified scale-up of
defluoridation plants.
2) Activated alumina can be thermally and chemically regenerated.
Chemical regeneration with a 2 percent sodium hydroxide solution was
more effective than thermal regeneration in restoring part of the sorp
tion capacity of the spent sorbent. Fluoride removal after thermal re
generation was initially rapid and levelled off as time progressed.
104

105
825 F is the optimum regeneration temperature for spent activated alum
ina. An increase in temperature beyond this optimum temperature results
in a drop in the exchange capacity of activated alumina.
Recommendations
Regeneration of activated alumina is an important part of the cost
of operating defluoridation plants. Activated alumina is an effective
removal medium yet its application is limited and regeneration costs are
relatively high (2, 13, 22). Results presented in this study show that
thermal regeneration of activated alumina is promising. Thermal regen
eration may offer some advantages over the conventional chemical regen
eration more frequently used. Regeneration would be outside the bed
area preventing the problem of precipitation and bed plugging commonly
associated with chemical regeneration. Further studies involved with
the thermal regeneration of activated alumina are required. In
addition, since the present study established optimum operating
conditions for low levels of fluoride concentrations, further studies
are required to verify the validity of these findings at fluoride
concentrations and alumina doses outside the range studied. Meanwhile,
it is recommended that water supplies with high levels of fluoride be
pretreated either through lime softening or through alum coagulation in
order to obtain a more efficient removal with activated alumina.
Finally, an investigation of the treatment of fluoride-loaded
regenerant liquid with calcium chloride and calcium hydroxide to form
floes of calcium fluoride is needed. This could be sold to the chemical
companies as a fluoride source to help offset the cost of treatment.

BIBLIOGRAPHY
1. Bishop, P. L., "Fluoride Removal From Drinking Water by Fluidized
Activated Alumina Adsorption," Journal of American Water Works As
sociation, 70 (October 1978): 554-559.
2. Boruff, C. S., "Removal of Fluorides From Drinking Waters," Indus
trial and Engineering Chemistry, 26 (January 1934): 69.
3. Bulusu, K. R. and Pathak, B. N., "Water Defluoridation with Activa
ted Alumina," Journal of Environmental Engineering Division (Ameri
can Society of Civil Engineers) 106 (April 1980): 466-469.
4. Choi, Won-Wook and Chen, Kenneth, Y., "The Removal of Fluoride From
Waters by Adsorption," Journal of American Water Works Association,
71 (October 1979): 562-569.
5. Culp, R. L. and Stoltenberg, H. A., "Fluoride Reduction At
Lacrosse, Kansas," Journal of American Water Works Association, 50
(March 1958): 427.
6. Frankel, Irwin and Juergens, Eric, "Removal of Fluorides From
Industrial Wastewaters Using Activated Alumina," Technical Report
EPA-600/2-80-058 (March 1980).
7. Harmon, A. J. and Kalichman, S. G., "Defluoridation of Drinking
Water in Southern California," Journal of American Water Works As
sociation, 57 (February 1965): 245-254.
8. Johnson, M. S., Cooke, J. A., and Andrews, S. M., "Fluoride in
Small Mammals and Their Potential Food Sources in Contaminated
Grasslands," Journal of International Society for Fluoride Re
search, 15 (April 1982): 56-63.
9. Kaniewski, A., Rydzewska, A., Fiejsierowicz, Z., Chmielnik, M., and
Cyplik, F., "Evaluation of Exposure to Fluoride and Its Compounds
in Children Living in the Area of Aluminum Plants," Journal of In
ternational Society for Fluoride Research, 15 (January 1982):
21-25.
106

107
10. Kobylanska, M., Limanowska, H., and George, B., "A Study of Factors
Aggravating Dental Fluorosis," Journal of International Society for
Fluoride Research, 15 (April 1982): 70-75.
n . Kubli, H., "Zur Kenntnis von Anionentrennungen Mittels Adsorption
an Tonerde," Helv. Chem. Acta, 3 (1947): 453-463.
12. McKee, R. H. and Johnston, W. S., "Removal of Fluorides From Drink
ing Water," Journal of Industrial and Engineering Chemistry, 26
(August 1934): 849.
13. Meier, F. J., "Defluoridation of Municipal Water Supplies," Journal
of American Water Works Association, 45 (August 1953): 879.
14. Meier, F. J., "Methods of Removing Fluorides from Water," American
Journal of Public Health, 37 (December 1947): 1559.
15. Meier, F. J., "Partial Defluoridation of Water," Public Works
Journal, 91 (November 1960): 90.
16. Miller, D. G., "Fluoride Precipitation in Metal Finishing Waste Ef
fluent," AIChE Symposium Series - Water: Industrial Wastewater
Treatment, 70 (1974): 144.
17. National Academy of Sciences. Effects of Fluorides on Animals,
Washington, DC: Printing and Publishing Office (1974).
18. Rao, K. v., Purushottam, D., and Vaidya-Nadham, D., "Uptake of Flu
oride by Serpentine," Geochim. Cosmochim. Acta, 39 (1975): 1403.
19. Rubel, F. and Woosley, R. D., "Removal of Excess Fluoride From
Drinking Water," Technical Report EPA 570/9-78-001 (January 1978).
20. Savinelli, E. A. and Black, A. P., "Defluoridation of Water With
Activated Alumina," Journal of American Water Works Association, 50
(January 1958): 33-43.
21. Scott, R. D., Kimberly, A. E., Van Horn, A. L., Ey, L. F., and War
ing, F. H., "Fluoride in Ohio Water Supplies - Its Effect,
Occurrence and Reduction," Journal of American Water Works
Association, 29 (January 1937): 9.

108
22. Sorg, T. J., "Treatment Technology to Meet the Interim Primary
Drinking Water Regulations For Inorganics," Journal of American
Water Works Association, 70 (February 1978): 105-112.
23. Wu, Yeun. C. and Nitya, Anan., "Water Defluoridation With Activated
Alumina," Journal of Environmental Engineering Division, 105 (April
1979): 357-367.

APPENDIX
Preliminary Design Calculations (by C. S. Lee)
1) Pressure drop across a packed bed: The "Carman Kozeny" equation
is used:
u =
K" =
e =
u =
i =
u =
d =
S =
-AP =
rhorl
V ^ ^ l ^ ' f for Re < 2.0
5.0 Kozeny's constant
0.56 (estimated)
1.0 centipoise
25 cm
0.7 X 10"^ - 8 X lO"' m/sec
28-48 mesh
94.1 - 187.5 cm^/cm^
n 1 " -2 (1-e e
.. Re = ^ . ^
)2
-AP = 0.547 psi
^ - 0.974 < 2.0
. * . Assumption of Reynold's number range was correct.
. * . AP = 0.547 psi
Column: Acrylic pipe 1' x 3" (1/8" wall)
V = (1.5 in)^ TT 0.8 f t = 0.04 ft^ (0.3 gal) H/jU
Choose V^3^[,j,y = 10 gallons.
109

no
Power of Pump
Assume U ^ ^ = 8 x lO"' m/sec = 48 cm/min
(Velocity for 100% bed expansion.) (1)
W " ^mx ' ^ " ""- /"i '" = 0-34 gpm
W,,, = mgh = Qgh = l;,\\^l',^h^n ' ^ = 8.7 x lO'^ hp
^real ' ^Vev^^ " - ^ 10"^/0.7 = 0.00012 hp
Choose the smallest power pump = 1/25 hp
A reasonable hold up in column promotes interphase contact. Choose re-
cycle flow rate in desorption process between 0.7 x 10" m/s (loading
point) and 8.0 x 10 m/sec (100 percent expansion) for 28-43 mesh
activated alumina (1). The smaller the packing size, the greater the
pressure drop, so choose glass beads 4 mm diameter for bed support.

I l l
Final Column Design: Determination of bed volume
The f ina l column design was based primarily on the results of the
batch studies.
Column height = 10 3/4 i n . = 0.896 f t .
I.D. = 2 5/16 i n . = 0.193 f t . n2
Volume = TT . - ^ . h = 0.195 gal. = 0.738 l i t e r
For batch studies, 0.15 gram activated alumina was used to reduce 10.0
ppm f luoride solution to 1.0 ppm in 3.5 hours. Solution Volume = 0.1
l i t e r , capacity'obta^ined = 6 . 8 kg/m"
Basis: 50 gallons of contaminated water
(0.738 liter)(Q•]^9/^^^'^^^^V^^"^^'"^)(^QJg^ ""^^ ^^^ ' ) '^0.1 l i t e r raw water '^0.195 gal. '
= 283.85 gms activated alumina
Bulk density of activated alumina = 839.45 kg/m (See Table 1)
Vol. = 3.38 X l O ' V
^\ Height of activated alumina bed = 12.4 cm
TABLE 1
Physical Property Data of Activated Alumina Used in Study
Voidage 0.56 (experimentally estimated)
Bulk density 839.45 (experimentally determined)
(kg/m^)
Part icle Size 28-48 mesh

Sample Calculation for Exchange Capacity
112
In i t ia l Fluoride Concentration = 10 ppm
Equilibrium Fluoride Concentration = 1.90 ppm
Activated Alumina = 0.1 grams
Sample Solution Volume = 100 ml
Bulk Density of Activated Alumina = 839.45 kg/m 3
Capacity = ^^^^'^^PP"^ ' 10^(0.1 grams)
1 kg F' 1000 g F"
1000 grams
1 kg
839.45 kg
m
100 g soln
ppm F
Capacity =6.80 kg/m'

113
c E 3
O CJ
-o
(J • to to a. E
C7> <u
x : LO - M CO
S- CO O 0 0
^ - CVJ
4-> II
a> to Jd c i - •»-O E
oo 3 «4- ^ O
-o • M CU sz 4-> cn rt3
•r- > CU -r -
3 -M O
cx i- CL
Q_ O -a cu II > o c E O CU - r -
CC 4 J to
CU &. • O + J •r- C S- CU O O 3 C
r— O U. C_) i+_ <u O T 3
C O 3 3 O I— E Li_
<C
CU to sz 't-+-> -M
i- c o •—•
4-c • O to
•I— cu •M - r -rt3 "O
•— 3 3 4-> O CO
rtS C_J
CU
O . E CO
t /1
C7>
cn
c
3 ^ - . r— S-<c <u
4-> • a - i -cu r—
4-> " « ^ to E > CO
•r- i_
+ j cn
< s: cu > o E — CU i -
cc cu •4->
<U T-• O r— • I - "-^^ i - cn o E 3 * —
cu CL - O Q . • r — • * — '
i-o c 3 O
^— "^ li- 4->
(O &.
C cu CJ c o
C-J
r>. CVJ
I . . . . . ' - J ^ ' - ^ ^ - ' C ^ O ' — " ^ C V J O - ^ C X ^ r - C T k ^ f — C V J « : ^ C O O O O O
o o o o o o o o o o o o O O O O O r — o o o o o o o o o o
? 5 S S S l £ ^ ^ i £ J 5 ^ S t 5 5 z : S S i O S ^ S o o ^ a . r - . L O o O L O i n ^ ^ ^ ^ r O ^ ' — C T ^ " ^ C O ^ C V I C T » i — L O i — C O O ^ O ^ C T v
" > * » r -^m^ > ^ ^ fc* ^ \ 7 ^ ^ ^ k ^ ^ ^ ^ ^ ^ 1
cor^oOLOor««.ror—cvjc3^io S S 2 S S ? . 2^ ' ^ ' ^ ' ^<= ' ^ ^«^o^<y> '—oocn r ^c r>c r» roc r» r - ^ S ^ 59 ^ ?!!? T ' ' ^ i ^ ?^ f^ o^ r« r—oo CO r- ft; |< f^ I— CO «;j- «a- ^ *3-
c O L O c o ^ r o o ^ « i - r o r o
* ^ ^ ^ * ^ ' ~ ; ^ < ^ ' - ^ ' ^ ' ^ ' ^ f * ^ 0 0 0 0 r > . - 5 t r o c v j . — I — O O ^ o o r ^ r ^ r ^ r ^ p ^ oocooocoo^cricT>o>o^crio^c3^o^cj>cr>cr»cT>cncT>CT»cT>ooco<d-C)ocDC)
E to &-
cn
CVJ CVJ
c: cu 3
UJ
4 J -w ' C CU (U 3 E
r— 3 M - I— t - O LU >
C
E
O O L O C O O C O L O I — ocT>cococ>OLOcviLOcy>roLOi— o o o o o o o o o o r ^ L O c o i — oor *vLOLororocv jcv j i— i — c v i L O L o r > . o o c T > o > — c v i r o c o c o c o c o
O " — '— '— '— 0 0 0 0 0 0 0 0 0 0 0 0 0 0 0 0 < — I — I— LOCTiCTtCTtO^
cu
E
c 3
OC
O O O O O O O O L O O L O O O o o o o o o o o o o o o o o o o 0<—LOoor^LOOOr—cvjr»«.roLOcvj o o c n o o o o c x D < d - L O L o r ^ O O O O
• r«»':3-r^LDcocvjLO<ooocococr>cy>cvjLOOOOOLOcocvjOLOcvjcT>cr>cT» O cvjro<d-f^ LOOLOOcorop>.LOr—cy»coooco
I— I—rococo I—cvji—I—r—f—
O O O O O O O O O O O O O O O O O O O O O O O O O O O O O O C 3 0 0 0 0 0 0 0 0 0 0 0 0 0 0 0 0 0 0 0 0 0 0 0 0 0 0 0 C )
r — c v j * ^ L 0 c r » o c v j « d - L 0 C 0 « d - o i r > r ^ 0 0 L 0 c v j c 0 L 0 c v j « d - O L 0 c v j « d - o o o I— 1—1— I— I— C V I C O ^ L O L O P > . i — ^ L O P ^ C O O ^ O C O « ! d - L O L O r ^
»—»— f— »—<—•— CVJCVICVJCVJCVJCVJ
r — c v j c o < 5 j ' L O L O r ^ c o c T > o < — c v j c o ^ i O L o r > % c o c T ^ O r - - c v j c o « ^ L O L O r > . c o c T > I— f— I— I— f— r— 1— I— r— (— CVICVJCVJCVICVJCVJCVJCVJCVJCVJ

