evaluation of an 8-year mountain lion removal management action
TRANSCRIPT
Evaluation of an 8-year mountain lion removal management action on endangered desert bighorn sheep recovery Eric M. Rominger, New Mexico Department of Game and Fish, Santa Fe, NM Elise J. Goldstein, New Mexico Department of Game and Fish, Santa Fe, NM Executive Summary: Desert bighorn sheep (Ovis canadensis) (bighorn) have been a state-listed endangered species in New Mexico since 1980 (NMDGF 2003). The Plan for the Recovery of Desert Bighorn Sheep in New Mexico was produced in 2003 to guide the management of this endangered species (NMDGF 2003). In 2001, the state-wide population estimate declined to <170 (~60 ewes), despite the release of 151 bighorn from Red Rock Wildlife Area between 1992 and 1999. Between 1996 and 2002, the number of wild populations declined from 7 to 4 following the extinction of the Alamo Hueco, Animas, and San Andres populations. The principle proximate cause of mortality on adult bighorn during this period was determined to be mountain lion (Puma concolor) (lion) predation. In October 1999, a management action to mitigate this high level of mortality was initiated in 3 bighorn ranges (Rominger and Dunn 2000). A fourth population in the San Andres Mountains was added to the management action when it was reestablished in 2002. Due to the small number of populations and imminent risk of extinction, the lion control effort is a management action rather than a research project. Lions are subsidized predators in much of the Chihuahuan desert ecosystem and it is hypothesized that the ability to prey-switch onto domestic livestock may explain why some small populations of bighorn become extinct without lion populations diminishing (Rominger et al. 2004a). New Mexico Department of Game and Fish (NMDGF), using contract hunters and trappers attempted to reduce lion numbers in 4 bighorn ranges. This management action occurred in <1% of the estimated state wide lion habitat and removal was within the objectives of a sustainable lion population as specified in the harvest management matrix (NMDGF 2006b). Lion control, measured by lion predation rates on bighorn and the number of lions removed, did not occur in any range during the first 3 years of the management action and no response was measured until the end of the fourth year (2003). During the 8 years, a total of 82 were killed using contractors and an additional 16 lions were killed by other causes. We assessed bighorn mortality rates using program MARK (White and Burnham 1999). Average annual mortality rates from lion predation decreased from 0.17 during periods of minimum protection to 0.04 during periods of maximum protection. The statewide bighorn population increased to >400 in 2007 from a combination of increased survival and translocation. Although lion numbers were reduced in all 4 ranges, lion sign was found each year in all ranges during this management action (Rominger et al. 2002, Goldstein and Rominger 2004, Goldstein and Rominger 2007). An example of the high value of desert bighorn sheep is reflected in the $187,500 paid for the 2006 New Mexico auction permit. Expenditures for the 8-year lion control program were approximately $293,450 (~$36,681/year), which averaged <8% of the total annual bighorn sheep budget.
1
Background of Management Action Desert bighorn sheep (bighorn) have been a state-listed endangered species in New Mexico since 1980 (NMDGF 2003). Low population numbers have precluded capture and translocation of wild bighorn within New Mexico. All translocations have come from the captive breeding facility in the Red Rock Wildlife Area (RRWA) and the Kofa National Wildlife Refuge (KNWR) in Arizona. Although mountain lions (lions) were killed historically to protect bighorn (Smith 1966, Muñoz 1983), no lions had been killed since the early 1980’s. Predator control of top-carnivores is controversial (Reiter et al. 1996, Minteer and Collins 2005, Rominger et al. 2006). However, predator control is a recommended management action for the conservation of endangered species (Hecht and Nickerson 1999). NMDGF recognized that restoration of bighorn would require mitigating excessive lion predation in the Management Issues, Opportunities, and Strategies section of the Plan for the Recovery of Desert Bighorn Sheep in New Mexico 2003-2013 (NMDGF 2003). Bighorn are identified as a Species of Greatest Conservation Need in the Comprehensive Wildlife Conservation Strategy for New Mexico (NMDGF 2006a). Recovery efforts for bighorn intensified in 1992 with regular translocations from RRWA. Between 1992 and 2006, NMDGF translocated 284 bighorn from RRWA, and an additional 50 bighorn from KNWR, into 6 mountain ranges. This included starting 3 new populations (Sierra Ladron-1992, Fra Cristobal-1995, San Andres-2002). Between 1992 and 1997 it was determined that lion predation was the principal limiting factor in all bighorn populations where radiocollared individuals were monitored (Rominger and Dunn 2000, Rominger et al. 2004a). Lion predation has been documented to limit desert bighorn populations throughout their range (Wehausen 1996, Hayes et al. 2000, Creeden and Graham 1997, Kamler et al. 2002, Rominger et al. 2004a). Between 1998 and 2001, 3 bighorn populations in New Mexico went extinct (San Andres ~1998, Alamo Hueco ~2000, Animas ~2001). By 2001, the statewide population estimate had declined to <170 (~60 ewes) (Goldstein and Rominger 2002). In 2001, an estimated 31 adult ewes were present in the 4 ranges that were included in the lion removal program. In 1999, the State Game Commission (SGC) approved a 5-year management action to kill lions in an attempt to mitigate high levels of lion predation on desert bighorn (Rominger and Dunn 2000). Because of the inability to reduce lions in any range until the third year, the SGC approved a 3-year extension for the program in October 2004, to enable collection of 5 years of data as originally designed. A graduate research project on cause specific mortality of bighorn lambs resulted in a different lion management strategy in the Fra Cristobal Mountains (Parsons 2007). Results from the Fra Cristobal Mountains will be reported in a separate document.
2
Chronology and Expenditures of Lion Control Management Action In October 1999, contractors were employed in 3 bighorn ranges (Peloncillo, Hatchet, and Sierra Ladron) to conduct range-wide removal of lions within delineated boundaries surrounding bighorn habitat. Contract houndsmen were to hunt 80 hrs/month and were to be paid an additional $350 for each lion killed. However, in the first 2 years, October 1999-September 2001, no lions were killed for which NMDGF paid the additional fee. Three lions were taken by contract houndsmen, but because they had clients during the hunt, the contracts stipulated that no bonus would be paid for these lions. A 4th lion was killed from the carcass of a radiocollared bighorn by a NMDGF houndsman in the Sierra Ladron population. After 2 years of essentially no lion removal, a snareman was contracted to replace the houndsman in the Sierra Ladron. This contractor was paid a flat-fee of $2,000/lion for the first 7 months, and $2,300/lion thereafter. The same snareman conducted lion removal in the San Andres Mountains 2 months prior to and 18 months following the release of 51 bighorn in 2002. Because of a 24-hour snare check requirement stipulated in the Environmental Assessment (EA) (USFWS 2002), versus 48-hour snare checks in the Sierra Ladron, the fee for lions taken in the San Andres during the period of range-wide removal was $4,600. Fifteen months later, it was modified such that offending lions (lions that killed bighorn) were removed at a flat-fee of $2,300. In July 2006, the contract was modified to $4,500/lion regardless of mountain range or circumstances, and a $50 day wage to cover expenses. These changes were made in response to the decreased number of lions killed after lion numbers were presumably reduced. New contract houndsmen were hired in the Hatchet and Peloncillo mountains in 2000. In the Peloncillos, the contractor was originally paid $2,300/lion and $100/day of hunting, and compensation was increased in 2006 to $2,500/lion, and $200/day to cover expenses. In the Hatchet Mountains, compensation began at $2,000/lion, and was increased the following year to $2,300/lion and $100/day to cover expenses. However, poor success in the Hatchet Mountains using houndsmen resulted in no contractor present during 2003-2004. A snareman was employed in the Hatchets in May 2005, and was compensated at a rate of $2,300/lion. A $150 day wage was added in November 2007 to cover expenses. Expenditures for the 8-year lion control program were approximately $293,450, which averages $36,681/year (Table 1), and averaged <8% of the annual bighorn sheep budget. Of the total expenditures, $258,200 were generated from a portion of the sale of 1 auction license sold through the National Chapter of the Foundation for North American Wild Sheep (FNAWS), and 1 raffle license sold through the New Mexico Chapter of FNAWS, annually. An additional $12,000 was donated by NMFNAWS and $23,250 was donated by 3 members of National FNAWS. The high economic value of desert bighorn is reflected in the average auction license sale price of $121,808 from 1995 to 2007, and the $187,500 paid for the 2006 auction license.
3
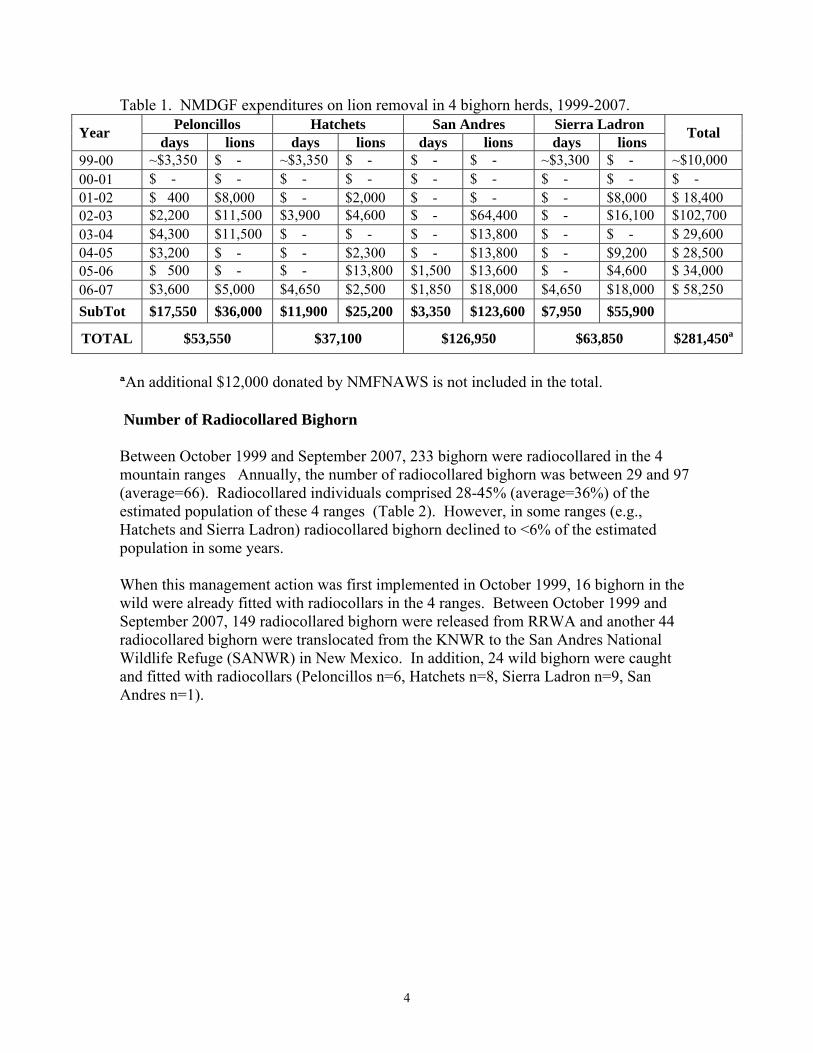
Table 1. NMDGF expenditures on lion removal in 4 bighorn herds, 1999-2007.
Peloncillos Hatchets San Andres Sierra Ladron Year days lions days lions days lions days lions
Total
99-00 ~$3,350 $ - ~$3,350 $ - $ - $ - ~$3,300 $ - ~$10,000 00-01 $ - $ - $ - $ - $ - $ - $ - $ - $ - 01-02 $ 400 $8,000 $ - $2,000 $ - $ - $ - $8,000 $ 18,400 02-03 $2,200 $11,500 $3,900 $4,600 $ - $64,400 $ - $16,100 $102,700 03-04 $4,300 $11,500 $ - $ - $ - $13,800 $ - $ - $ 29,600 04-05 $3,200 $ - $ - $2,300 $ - $13,800 $ - $9,200 $ 28,500 05-06 $ 500 $ - $ - $13,800 $1,500 $13,600 $ - $4,600 $ 34,000 06-07 $3,600 $5,000 $4,650 $2,500 $1,850 $18,000 $4,650 $18,000 $ 58,250 SubTot $17,550 $36,000 $11,900 $25,200 $3,350 $123,600 $7,950 $55,900
TOTAL $53,550 $37,100 $126,950 $63,850 $281,450a
aAn additional $12,000 donated by NMFNAWS is not included in the total. Number of Radiocollared Bighorn Between October 1999 and September 2007, 233 bighorn were radiocollared in the 4 mountain ranges Annually, the number of radiocollared bighorn was between 29 and 97 (average=66). Radiocollared individuals comprised 28-45% (average=36%) of the estimated population of these 4 ranges (Table 2). However, in some ranges (e.g., Hatchets and Sierra Ladron) radiocollared bighorn declined to <6% of the estimated population in some years. When this management action was first implemented in October 1999, 16 bighorn in the wild were already fitted with radiocollars in the 4 ranges. Between October 1999 and September 2007, 149 radiocollared bighorn were released from RRWA and another 44 radiocollared bighorn were translocated from the KNWR to the San Andres National Wildlife Refuge (SANWR) in New Mexico. In addition, 24 wild bighorn were caught and fitted with radiocollars (Peloncillos n=6, Hatchets n=8, Sierra Ladron n=9, San Andres n=1).
4
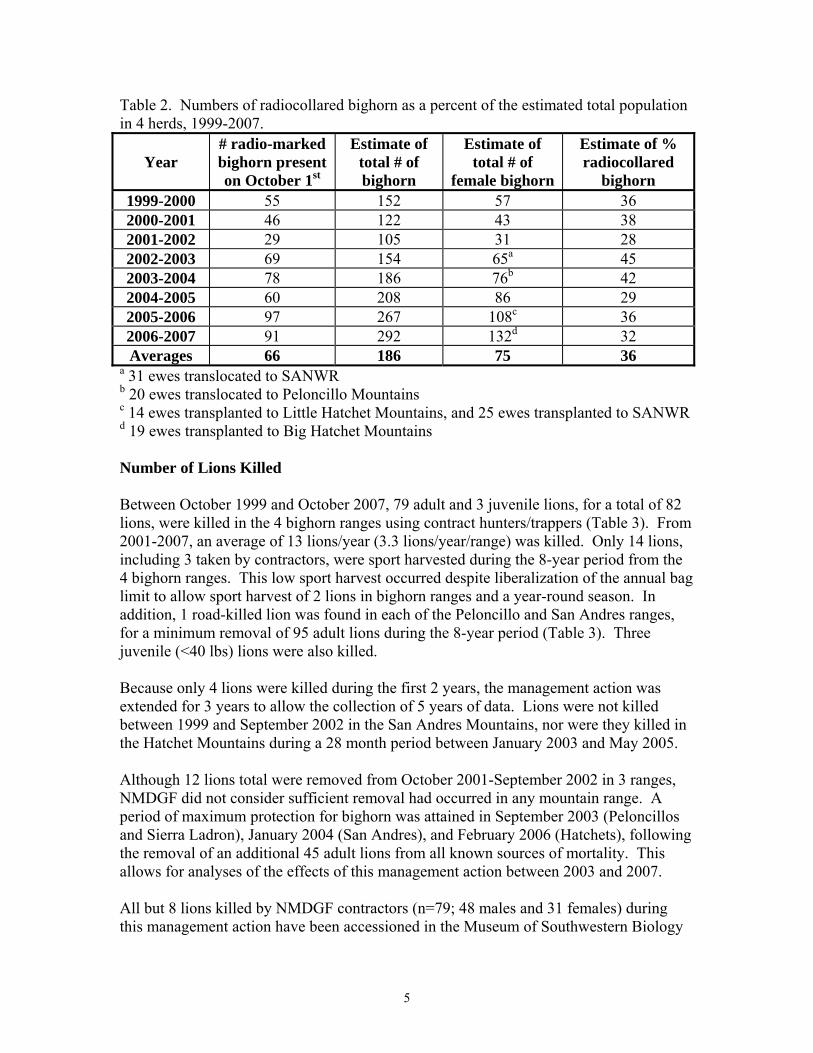
Table 2. Numbers of radiocollared bighorn as a percent of the estimated total population in 4 herds, 1999-2007.
Year # radio-marked bighorn present on October 1st
Estimate of total # of bighorn
Estimate of total # of
female bighorn
Estimate of % radiocollared
bighorn 1999-2000 55 152 57 36 2000-2001 46 122 43 38 2001-2002 29 105 31 28 2002-2003 69 154 65a 45 2003-2004 78 186 76b 42 2004-2005 60 208 86 29 2005-2006 97 267 108c 36 2006-2007 91 292 132d 32 Averages 66 186 75 36
a 31 ewes translocated to SANWR b 20 ewes translocated to Peloncillo Mountains c 14 ewes transplanted to Little Hatchet Mountains, and 25 ewes transplanted to SANWR d 19 ewes transplanted to Big Hatchet Mountains Number of Lions Killed Between October 1999 and October 2007, 79 adult and 3 juvenile lions, for a total of 82 lions, were killed in the 4 bighorn ranges using contract hunters/trappers (Table 3). From 2001-2007, an average of 13 lions/year (3.3 lions/year/range) was killed. Only 14 lions, including 3 taken by contractors, were sport harvested during the 8-year period from the 4 bighorn ranges. This low sport harvest occurred despite liberalization of the annual bag limit to allow sport harvest of 2 lions in bighorn ranges and a year-round season. In addition, 1 road-killed lion was found in each of the Peloncillo and San Andres ranges, for a minimum removal of 95 adult lions during the 8-year period (Table 3). Three juvenile (<40 lbs) lions were also killed. Because only 4 lions were killed during the first 2 years, the management action was extended for 3 years to allow the collection of 5 years of data. Lions were not killed between 1999 and September 2002 in the San Andres Mountains, nor were they killed in the Hatchet Mountains during a 28 month period between January 2003 and May 2005. Although 12 lions total were removed from October 2001-September 2002 in 3 ranges, NMDGF did not consider sufficient removal had occurred in any mountain range. A period of maximum protection for bighorn was attained in September 2003 (Peloncillos and Sierra Ladron), January 2004 (San Andres), and February 2006 (Hatchets), following the removal of an additional 45 adult lions from all known sources of mortality. This allows for analyses of the effects of this management action between 2003 and 2007. All but 8 lions killed by NMDGF contractors (n=79; 48 males and 31 females) during this management action have been accessioned in the Museum of Southwestern Biology
5
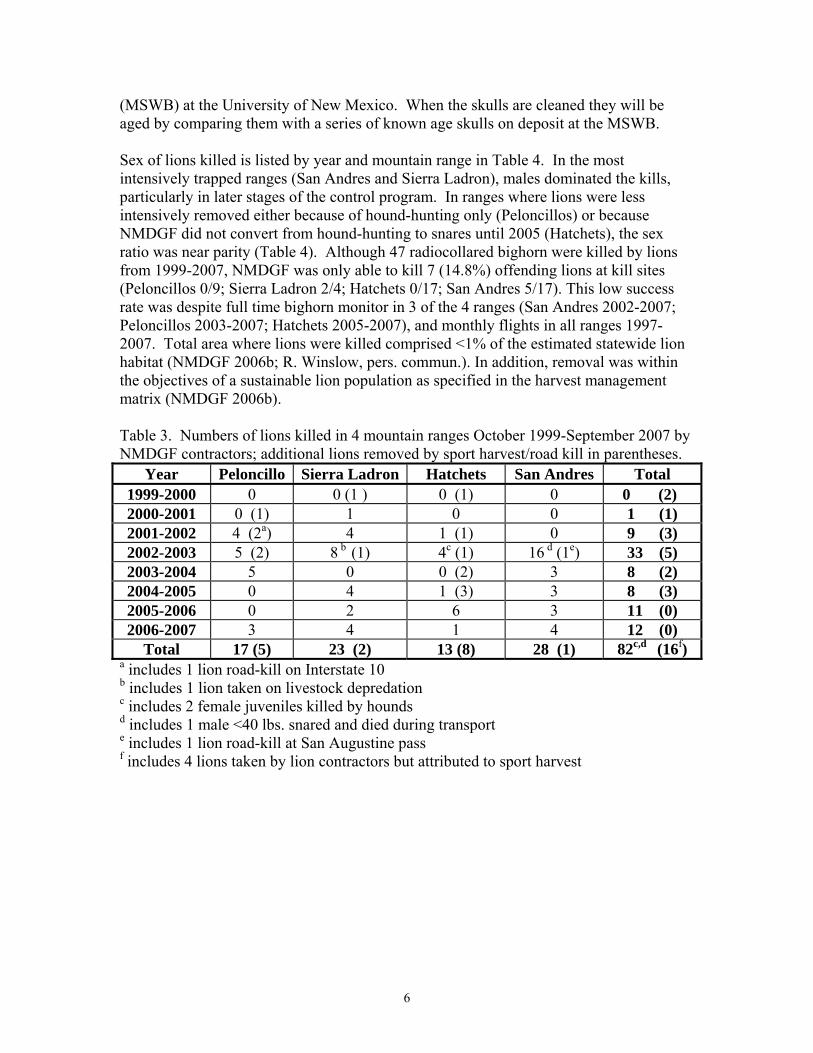
(MSWB) at the University of New Mexico. When the skulls are cleaned they will be aged by comparing them with a series of known age skulls on deposit at the MSWB. Sex of lions killed is listed by year and mountain range in Table 4. In the most intensively trapped ranges (San Andres and Sierra Ladron), males dominated the kills, particularly in later stages of the control program. In ranges where lions were less intensively removed either because of hound-hunting only (Peloncillos) or because NMDGF did not convert from hound-hunting to snares until 2005 (Hatchets), the sex ratio was near parity (Table 4). Although 47 radiocollared bighorn were killed by lions from 1999-2007, NMDGF was only able to kill 7 (14.8%) offending lions at kill sites (Peloncillos 0/9; Sierra Ladron 2/4; Hatchets 0/17; San Andres 5/17). This low success rate was despite full time bighorn monitor in 3 of the 4 ranges (San Andres 2002-2007; Peloncillos 2003-2007; Hatchets 2005-2007), and monthly flights in all ranges 1997-2007. Total area where lions were killed comprised <1% of the estimated statewide lion habitat (NMDGF 2006b; R. Winslow, pers. commun.). In addition, removal was within the objectives of a sustainable lion population as specified in the harvest management matrix (NMDGF 2006b). Table 3. Numbers of lions killed in 4 mountain ranges October 1999-September 2007 by NMDGF contractors; additional lions removed by sport harvest/road kill in parentheses.
Year Peloncillo Sierra Ladron Hatchets San Andres Total 1999-2000 0 0 (1 ) 0 (1) 0 0 (2) 2000-2001 0 (1) 1 0 0 1 (1) 2001-2002 4 (2a) 4 1 (1) 0 9 (3) 2002-2003 5 (2) 8 b (1) 4c (1) 16 d (1e) 33 (5) 2003-2004 5 0 0 (2) 3 8 (2) 2004-2005 0 4 1 (3) 3 8 (3) 2005-2006 0 2 6 3 11 (0) 2006-2007 3 4 1 4 12 (0)
Total 17 (5) 23 (2) 13 (8) 28 (1) 82c,d (16f) a includes 1 lion road-kill on Interstate 10 b includes 1 lion taken on livestock depredation c includes 2 female juveniles killed by hounds d includes 1 male <40 lbs. snared and died during transport e includes 1 lion road-kill at San Augustine pass f includes 4 lions taken by lion contractors but attributed to sport harvest
6
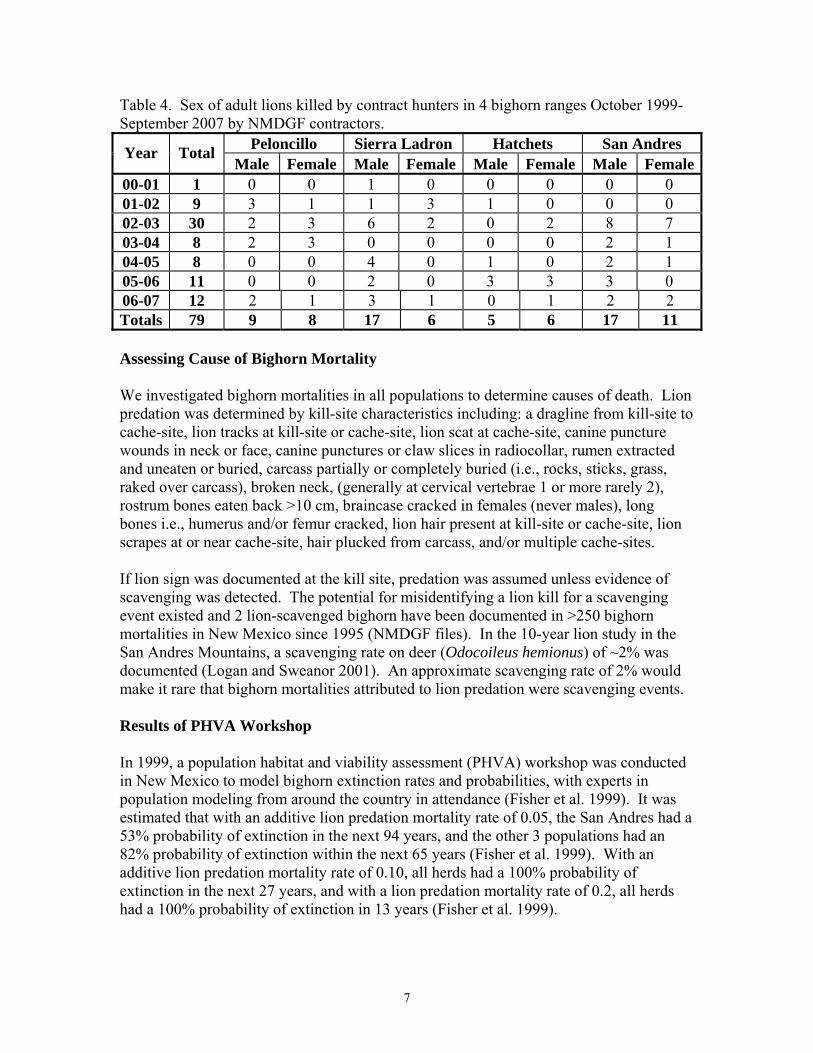
Table 4. Sex of adult lions killed by contract hunters in 4 bighorn ranges October 1999-September 2007 by NMDGF contractors.
Peloncillo Sierra Ladron Hatchets San Andres Year Total Male Female Male Female Male Female Male Female
00-01 1 0 0 1 0 0 0 0 0 01-02 9 3 1 1 3 1 0 0 0 02-03 30 2 3 6 2 0 2 8 7 03-04 8 2 3 0 0 0 0 2 1 04-05 8 0 0 4 0 1 0 2 1 05-06 11 0 0 2 0 3 3 3 0 06-07 12 2 1 3 1 0 1 2 2 Totals 79 9 8 17 6 5 6 17 11 Assessing Cause of Bighorn Mortality We investigated bighorn mortalities in all populations to determine causes of death. Lion predation was determined by kill-site characteristics including: a dragline from kill-site to cache-site, lion tracks at kill-site or cache-site, lion scat at cache-site, canine puncture wounds in neck or face, canine punctures or claw slices in radiocollar, rumen extracted and uneaten or buried, carcass partially or completely buried (i.e., rocks, sticks, grass, raked over carcass), broken neck, (generally at cervical vertebrae 1 or more rarely 2), rostrum bones eaten back >10 cm, braincase cracked in females (never males), long bones i.e., humerus and/or femur cracked, lion hair present at kill-site or cache-site, lion scrapes at or near cache-site, hair plucked from carcass, and/or multiple cache-sites. If lion sign was documented at the kill site, predation was assumed unless evidence of scavenging was detected. The potential for misidentifying a lion kill for a scavenging event existed and 2 lion-scavenged bighorn have been documented in >250 bighorn mortalities in New Mexico since 1995 (NMDGF files). In the 10-year lion study in the San Andres Mountains, a scavenging rate on deer (Odocoileus hemionus) of ~2% was documented (Logan and Sweanor 2001). An approximate scavenging rate of 2% would make it rare that bighorn mortalities attributed to lion predation were scavenging events. Results of PHVA Workshop In 1999, a population habitat and viability assessment (PHVA) workshop was conducted in New Mexico to model bighorn extinction rates and probabilities, with experts in population modeling from around the country in attendance (Fisher et al. 1999). It was estimated that with an additive lion predation mortality rate of 0.05, the San Andres had a 53% probability of extinction in the next 94 years, and the other 3 populations had an 82% probability of extinction within the next 65 years (Fisher et al. 1999). With an additive lion predation mortality rate of 0.10, all herds had a 100% probability of extinction in the next 27 years, and with a lion predation mortality rate of 0.2, all herds had a 100% probability of extinction in 13 years (Fisher et al. 1999).
7
Mortality Rates Calculated Using Program MARK We used the nest-survival model in program MARK (White and Burnham 1999) to calculate mortality rates for radiocollared bighorn. This computer program uses data collected from monitoring radiocollared bighorn to extrapolate mortality rates for individual herds and the statewide population. We examined average annual mortality rates from all causes of mortality and from lion predation only, for all bighorn, for rams and ewes, and for bighorn transplanted from RRWA, KNWR, and extant bighorn captured in the wild. We divided mortality data into 2 main time periods, and 3 additional time periods: 1) a period of minimum protection which includes both the period when no lions were being removed to protect bighorn (no protection), and the period when lion removal was initiated but had not yet resulted in a substantial decrease in lion predation rates on bighorn (establishing protection); and 2) a period of maximum protection that occurred after a substantial number of lions were removed and predation rates on bighorn decreased to 0 for at least 6 months with a concomitant decrease in the amount of lion sign observed by contract hunters. This period continued as long as NMDGF attempted to remove lions, and includes periods when 1 or more bighorn were killed by lions (Table 5). In order to more closely examine impacts of the lion removal program, we also analyzed mortality rates during the period of no protection, the period of establishing protection, and a period starting 1 year after removal was implemented through September 2007, regardless of the level of protection achieved (Table 5). Data from 1992-2007 were included in the analysis, with the exception of the 1999-2000 sentinel ram data from the San Andres Mountains. These rams were released as an experimental population to determine if scabies was still a threat, and to see if additional bighorn were present on the mountain. A small group of rams is not a typical herd, therefore they are not included. The inclusion of the 1992-1999 data provides a larger data set for the periods of no protection and minimum protection to compare with other periods.
8
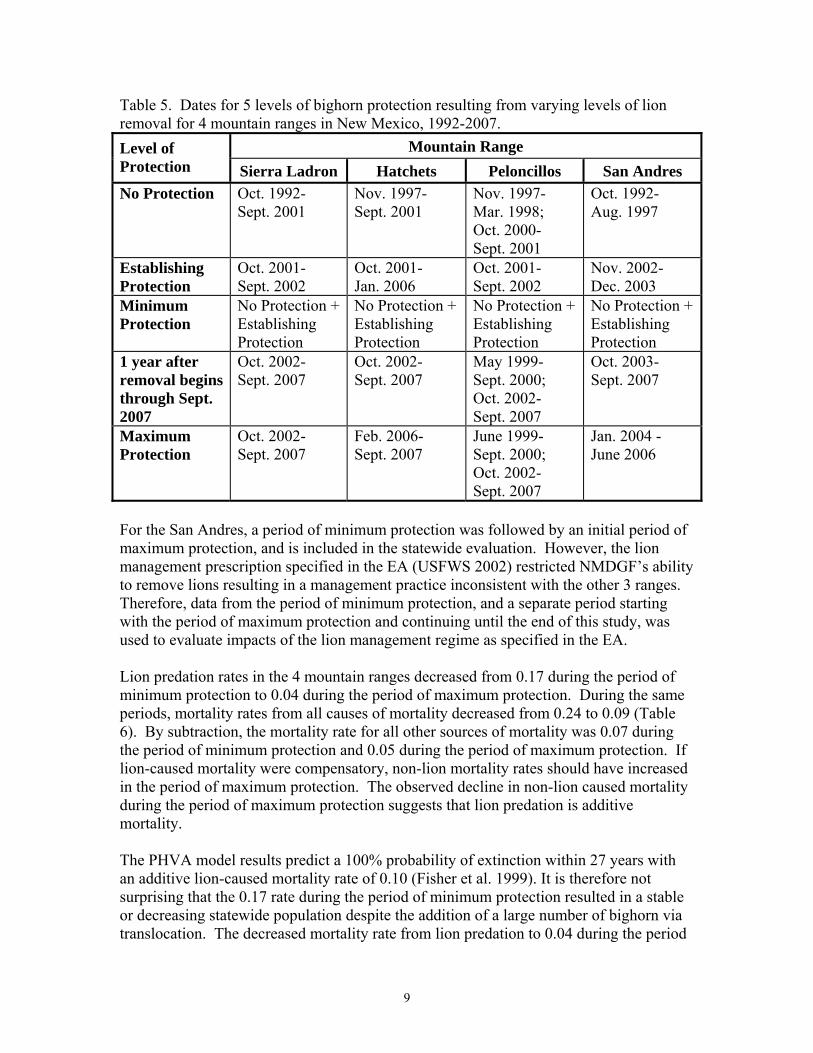
Table 5. Dates for 5 levels of bighorn protection resulting from varying levels of lion removal for 4 mountain ranges in New Mexico, 1992-2007.
Mountain Range Level of Protection Sierra Ladron Hatchets Peloncillos San Andres No Protection Oct. 1992-
Sept. 2001 Nov. 1997-Sept. 2001
Nov. 1997- Mar. 1998; Oct. 2000- Sept. 2001
Oct. 1992- Aug. 1997
Establishing Protection
Oct. 2001- Sept. 2002
Oct. 2001- Jan. 2006
Oct. 2001- Sept. 2002
Nov. 2002- Dec. 2003
Minimum Protection
No Protection + Establishing Protection
No Protection + Establishing Protection
No Protection + Establishing Protection
No Protection + Establishing Protection
1 year after removal begins through Sept. 2007
Oct. 2002- Sept. 2007
Oct. 2002- Sept. 2007
May 1999- Sept. 2000; Oct. 2002- Sept. 2007
Oct. 2003- Sept. 2007
Maximum Protection
Oct. 2002- Sept. 2007
Feb. 2006- Sept. 2007
June 1999- Sept. 2000; Oct. 2002- Sept. 2007
Jan. 2004 - June 2006
For the San Andres, a period of minimum protection was followed by an initial period of maximum protection, and is included in the statewide evaluation. However, the lion management prescription specified in the EA (USFWS 2002) restricted NMDGF’s ability to remove lions resulting in a management practice inconsistent with the other 3 ranges. Therefore, data from the period of minimum protection, and a separate period starting with the period of maximum protection and continuing until the end of this study, was used to evaluate impacts of the lion management regime as specified in the EA. Lion predation rates in the 4 mountain ranges decreased from 0.17 during the period of minimum protection to 0.04 during the period of maximum protection. During the same periods, mortality rates from all causes of mortality decreased from 0.24 to 0.09 (Table 6). By subtraction, the mortality rate for all other sources of mortality was 0.07 during the period of minimum protection and 0.05 during the period of maximum protection. If lion-caused mortality were compensatory, non-lion mortality rates should have increased in the period of maximum protection. The observed decline in non-lion caused mortality during the period of maximum protection suggests that lion predation is additive mortality. The PHVA model results predict a 100% probability of extinction within 27 years with an additive lion-caused mortality rate of 0.10 (Fisher et al. 1999). It is therefore not surprising that the 0.17 rate during the period of minimum protection resulted in a stable or decreasing statewide population despite the addition of a large number of bighorn via translocation. The decreased mortality rate from lion predation to 0.04 during the period
9
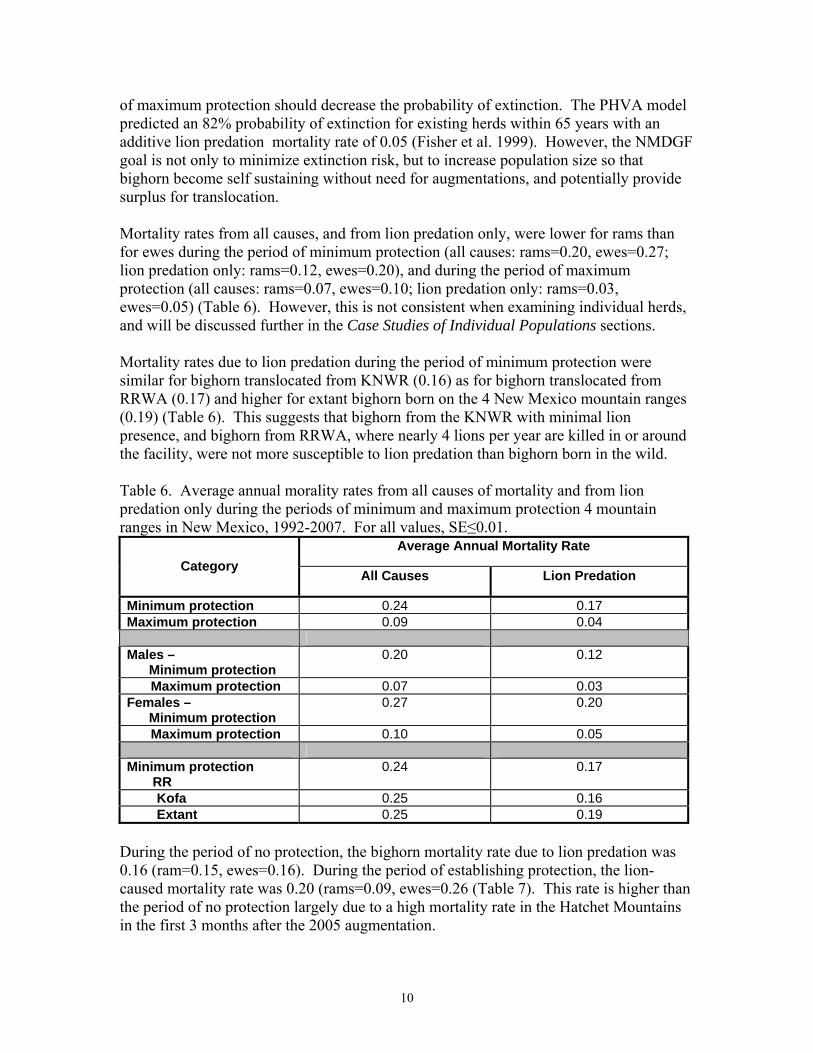
of maximum protection should decrease the probability of extinction. The PHVA model predicted an 82% probability of extinction for existing herds within 65 years with an additive lion predation mortality rate of 0.05 (Fisher et al. 1999). However, the NMDGF goal is not only to minimize extinction risk, but to increase population size so that bighorn become self sustaining without need for augmentations, and potentially provide surplus for translocation. Mortality rates from all causes, and from lion predation only, were lower for rams than for ewes during the period of minimum protection (all causes: rams=0.20, ewes=0.27; lion predation only: rams=0.12, ewes=0.20), and during the period of maximum protection (all causes: rams=0.07, ewes=0.10; lion predation only: rams=0.03, ewes=0.05) (Table 6). However, this is not consistent when examining individual herds, and will be discussed further in the Case Studies of Individual Populations sections. Mortality rates due to lion predation during the period of minimum protection were similar for bighorn translocated from KNWR (0.16) as for bighorn translocated from RRWA (0.17) and higher for extant bighorn born on the 4 New Mexico mountain ranges (0.19) (Table 6). This suggests that bighorn from the KNWR with minimal lion presence, and bighorn from RRWA, where nearly 4 lions per year are killed in or around the facility, were not more susceptible to lion predation than bighorn born in the wild. Table 6. Average annual morality rates from all causes of mortality and from lion predation only during the periods of minimum and maximum protection 4 mountain ranges in New Mexico, 1992-2007. For all values, SE≤0.01.
Average Annual Mortality Rate Category
All Causes Lion Predation
Minimum protection 0.24 0.17 Maximum protection 0.09 0.04 Males – Minimum protection
0.20 0.12
Maximum protection 0.07 0.03 Females – Minimum protection
0.27 0.20
Maximum protection 0.10 0.05
0.24 Minimum protection RR
0.17
Kofa 0.25
During the period of no protection, the bighorn mortality rate due to lion predation was 0.16 (ram=0.15, ewes=0.16). During the period of establishing protection, the lion-caused mortality rate was 0.20 (rams=0.09, ewes=0.26 (Table 7). This rate is higher than the period of no protection largely due to a high mortality rate in the Hatchet Mountains in the first 3 months after the 2005 augmentation.
0.16 Extant 0.25 0.19
10
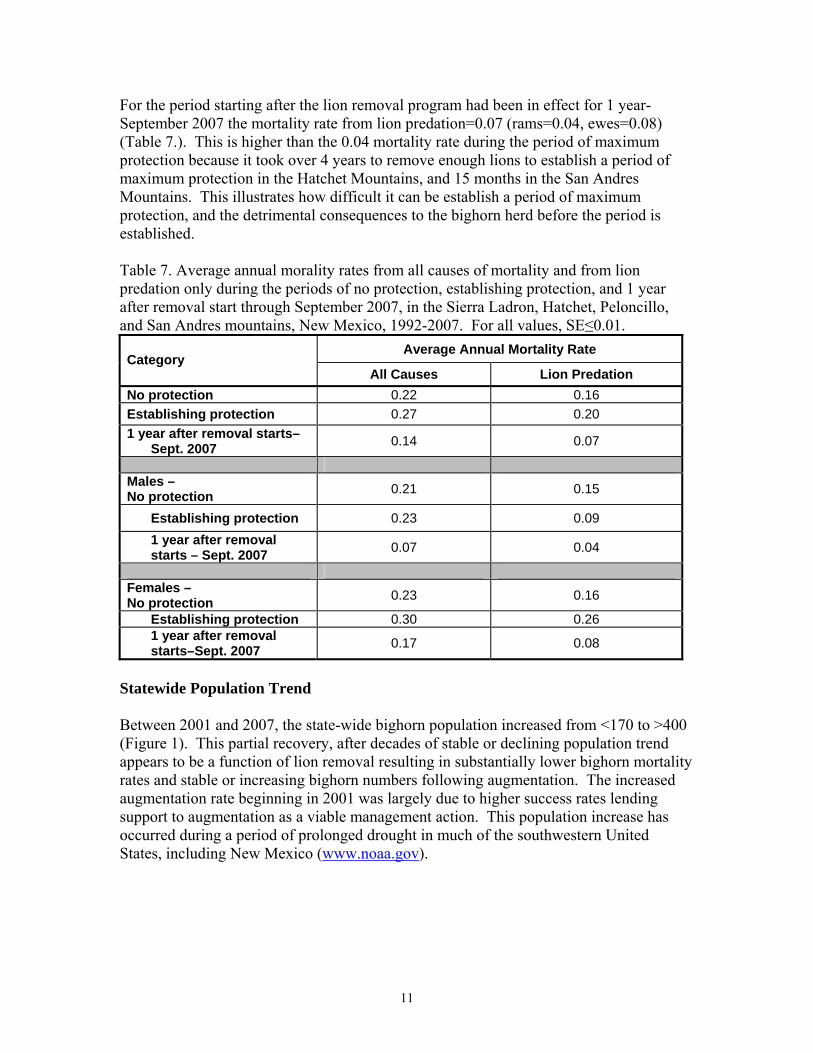
For the period starting after the lion removal program had been in effect for 1 year-September 2007 the mortality rate from lion predation=0.07 (rams=0.04, ewes=0.08) (Table 7.). This is higher than the 0.04 mortality rate during the period of maximum protection because it took over 4 years to remove enough lions to establish a period of maximum protection in the Hatchet Mountains, and 15 months in the San Andres Mountains. This illustrates how difficult it can be establish a period of maximum protection, and the detrimental consequences to the bighorn herd before the period is established. Table 7. Average annual morality rates from all causes of mortality and from lion predation only during the periods of no protection, establishing protection, and 1 year after removal start through September 2007, in the Sierra Ladron, Hatchet, Peloncillo, and San Andres mountains, New Mexico, 1992-2007. For all values, SE≤0.01.
Average Annual Mortality Rate Category
All Causes Lion Predation No protection 0.22 0.16 Establishing protection 0.27 0.20 1 year after removal starts–
Sept. 2007 0.14 0.07
Males – No protection 0.21 0.15
Establishing protection 0.23 0.09 1 year after removal starts – Sept. 2007 0.07 0.04
Females – No protection 0.23 0.16
Establishing protection 0.30 0.26 1 year after removal starts–Sept. 2007 0.17 0.08
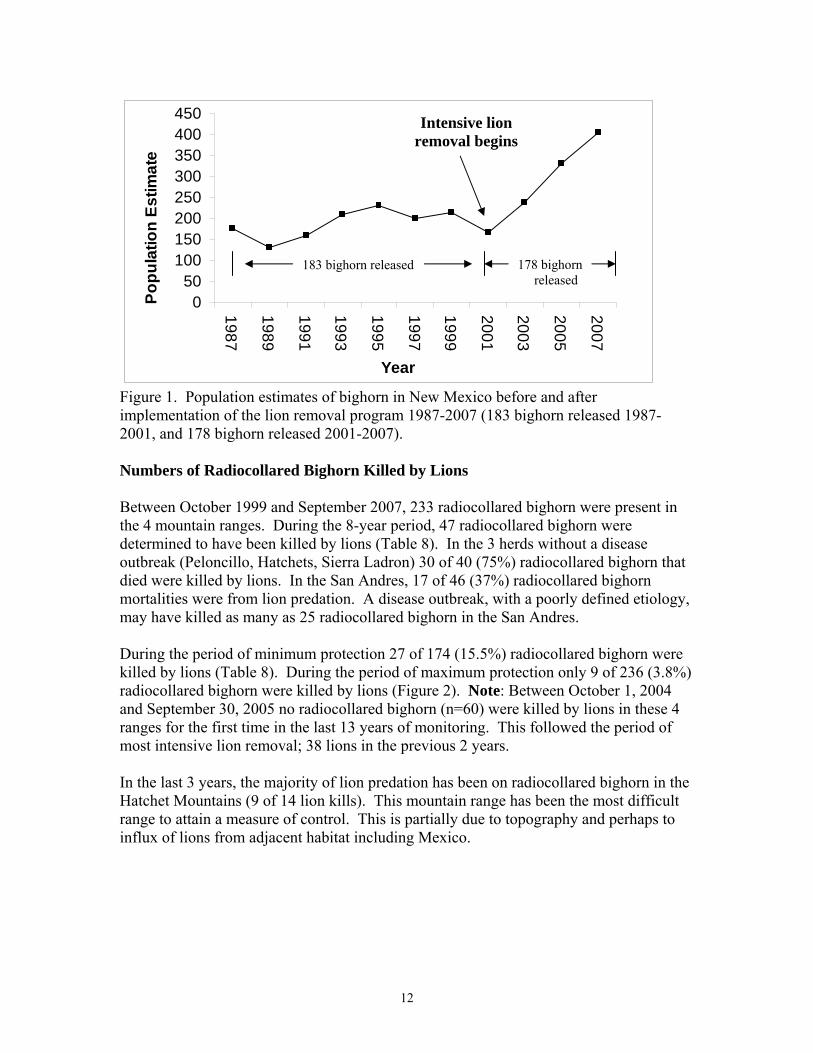
Statewide Population Trend Between 2001 and 2007, the state-wide bighorn population increased from <170 to >400 (Figure 1). This partial recovery, after decades of stable or declining population trend appears to be a function of lion removal resulting in substantially lower bighorn mortality rates and stable or increasing bighorn numbers following augmentation. The increased augmentation rate beginning in 2001 was largely due to higher success rates lending support to augmentation as a viable management action. This population increase has occurred during a period of prolonged drought in much of the southwestern United States, including New Mexico (www.noaa.gov).
11
050
100150200250300350400450
1987
1989
1991
1993
1995
1997
1999
2001
2003
2005
2007
Year
Popu
latio
n Es
timat
e
183 bighorn released 178 bighorn released
Intensive lion removal begins
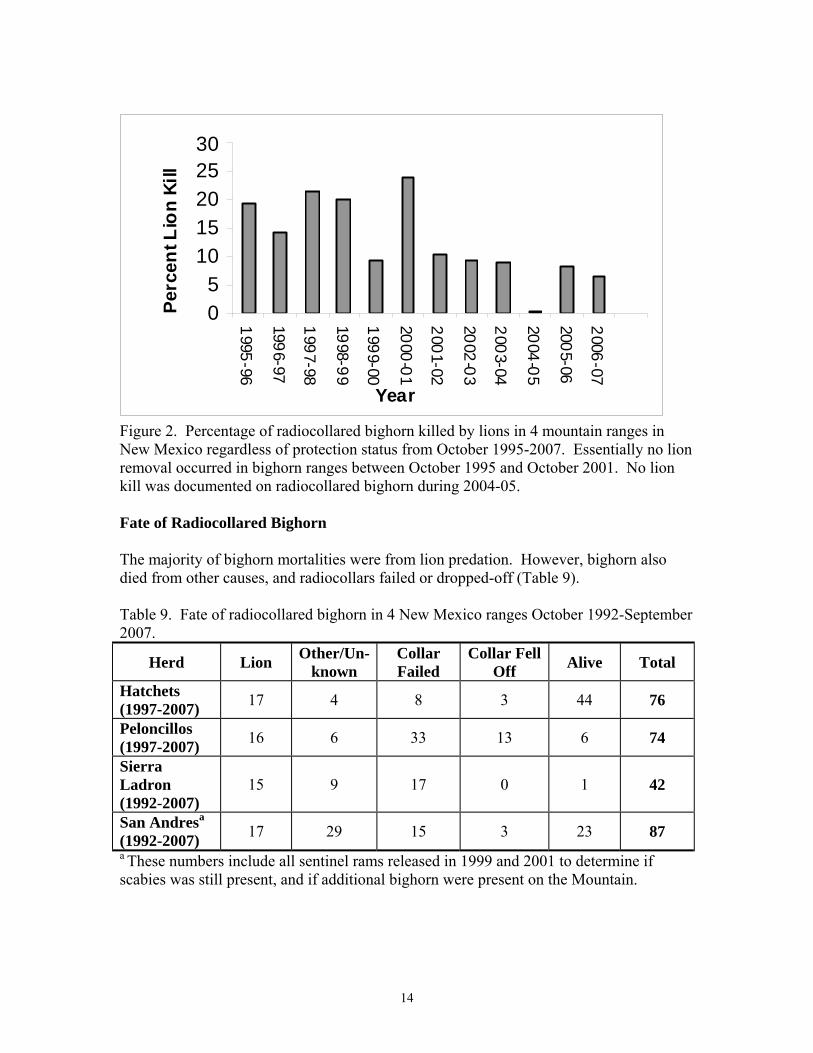
Figure 1. Population estimates of bighorn in New Mexico before and after implementation of the lion removal program 1987-2007 (183 bighorn released 1987-2001, and 178 bighorn released 2001-2007). Numbers of Radiocollared Bighorn Killed by Lions Between October 1999 and September 2007, 233 radiocollared bighorn were present in the 4 mountain ranges. During the 8-year period, 47 radiocollared bighorn were determined to have been killed by lions (Table 8). In the 3 herds without a disease outbreak (Peloncillo, Hatchets, Sierra Ladron) 30 of 40 (75%) radiocollared bighorn that died were killed by lions. In the San Andres, 17 of 46 (37%) radiocollared bighorn mortalities were from lion predation. A disease outbreak, with a poorly defined etiology, may have killed as many as 25 radiocollared bighorn in the San Andres. During the period of minimum protection 27 of 174 (15.5%) radiocollared bighorn were killed by lions (Table 8). During the period of maximum protection only 9 of 236 (3.8%) radiocollared bighorn were killed by lions (Figure 2). Note: Between October 1, 2004 and September 30, 2005 no radiocollared bighorn (n=60) were killed by lions in these 4 ranges for the first time in the last 13 years of monitoring. This followed the period of most intensive lion removal; 38 lions in the previous 2 years. In the last 3 years, the majority of lion predation has been on radiocollared bighorn in the Hatchet Mountains (9 of 14 lion kills). This mountain range has been the most difficult range to attain a measure of control. This is partially due to topography and perhaps to influx of lions from adjacent habitat including Mexico.
12
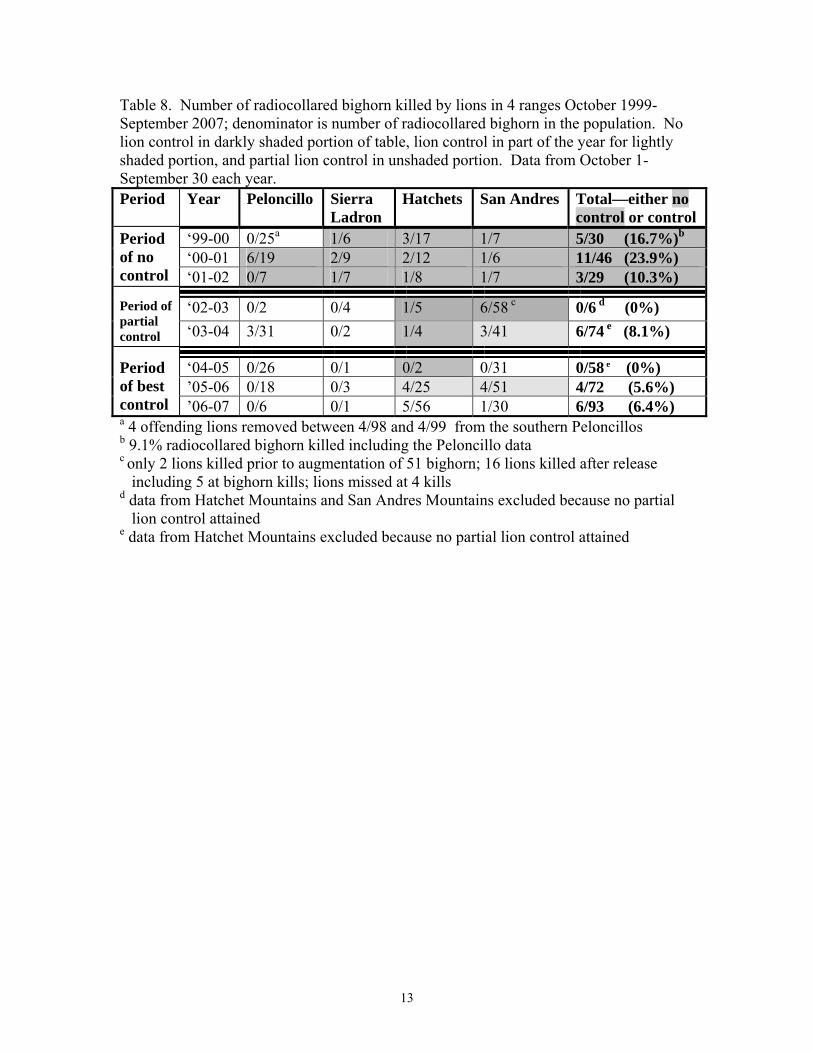
Table 8. Number of radiocollared bighorn killed by lions in 4 ranges October 1999-September 2007; denominator is number of radiocollared bighorn in the population. No lion control in darkly shaded portion of table, lion control in part of the year for lightly shaded portion, and partial lion control in unshaded portion. Data from October 1-September 30 each year. Period Year Peloncillo Sierra
Ladron Hatchets San Andres Total—either no
control or control ‘99-00 0/25a 1/6 3/17 1/7 5/30 (16.7%)b
‘00-01 6/19 2/9 2/12 1/6 11/46 (23.9%) Period of no control ‘01-02 0/7 1/7 1/8 1/7 3/29 (10.3%)
‘02-03 0/2 0/4 1/5 6/58 c 0/6 d (0%) Period of partial control ‘03-04 3/31 0/2 1/4 3/41 6/74 e (8.1%)
‘04-05 0/26 0/1 0/2 0/31 0/58 e (0%) ’05-06 0/18 0/3 4/25 4/51 4/72 (5.6%)
Period of best control ’06-07 0/6 0/1 5/56 6/93 (6.4%) 1/30 a 4 offending lions removed between 4/98 and 4/99 from the southern Peloncillos b 9.1% radiocollared bighorn killed including the Peloncillo data c only 2 lions killed prior to augmentation of 51 bighorn; 16 lions killed after release including 5 at bighorn kills; lions missed at 4 kills d data from Hatchet Mountains and San Andres Mountains excluded because no partial lion control attained e data from Hatchet Mountains excluded because no partial lion control attained
13
05
1015202530
1995-96
1996-97
1997-98
1998-99
1999-00
2000-01
2001-02
2002-03
2003-04
2004-05
2005-06
2006-07
Year
Perc
ent L
ion
Kill
Figure 2. Percentage of radiocollared bighorn killed by lions in 4 mountain ranges in New Mexico regardless of protection status from October 1995-2007. Essentially no lion removal occurred in bighorn ranges between October 1995 and October 2001. No lion kill was documented on radiocollared bighorn during 2004-05. Fate of Radiocollared Bighorn The majority of bighorn mortalities were from lion predation. However, bighorn also died from other causes, and radiocollars failed or dropped-off (Table 9). Table 9. Fate of radiocollared bighorn in 4 New Mexico ranges October 1992-September 2007.
Herd Lion Other/Un-known
Collar Failed
Collar Fell Off Alive Total
Hatchets (1997-2007) 17 4 8 3 44 76
Peloncillos (1997-2007) 16 6 33 13 6 74
Sierra Ladron (1992-2007)
15 9 17 0 1 42
San Andresa (1992-2007) 17 29 15 3 23 87 a These numbers include all sentinel rams released in 1999 and 2001 to determine if scabies was still present, and if additional bighorn were present on the Mountain.
14
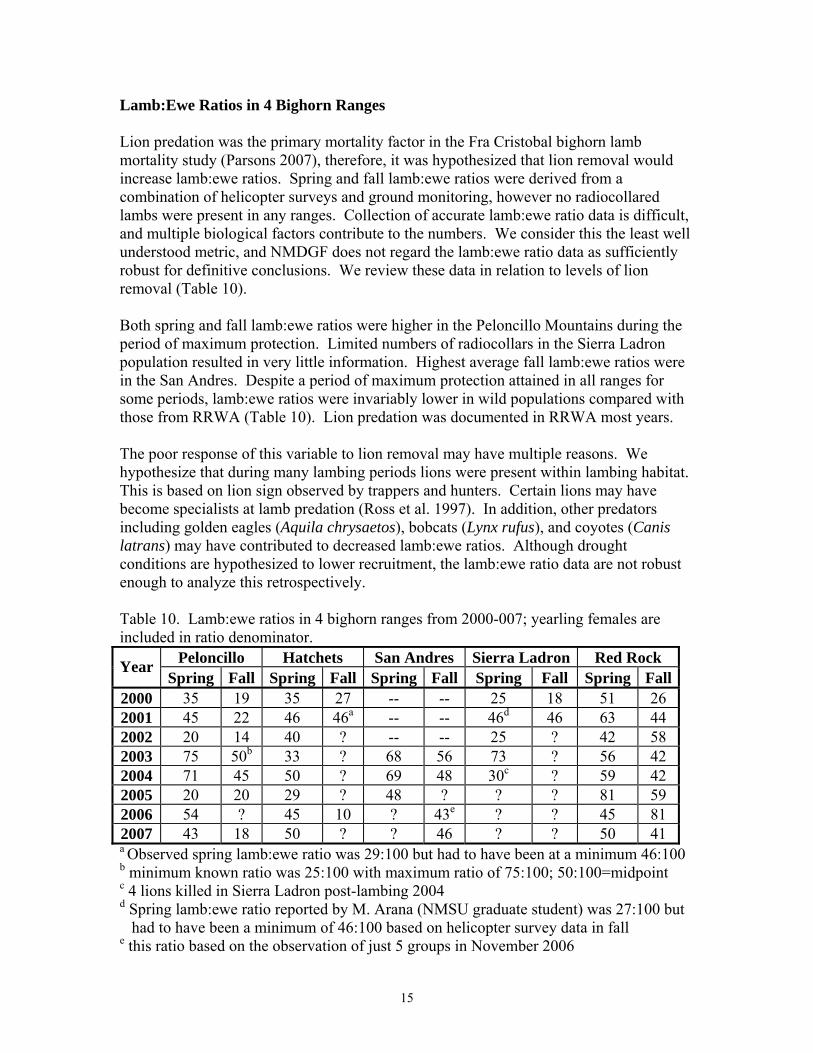
Lamb:Ewe Ratios in 4 Bighorn Ranges Lion predation was the primary mortality factor in the Fra Cristobal bighorn lamb mortality study (Parsons 2007), therefore, it was hypothesized that lion removal would increase lamb:ewe ratios. Spring and fall lamb:ewe ratios were derived from a combination of helicopter surveys and ground monitoring, however no radiocollared lambs were present in any ranges. Collection of accurate lamb:ewe ratio data is difficult, and multiple biological factors contribute to the numbers. We consider this the least well understood metric, and NMDGF does not regard the lamb:ewe ratio data as sufficiently robust for definitive conclusions. We review these data in relation to levels of lion removal (Table 10). Both spring and fall lamb:ewe ratios were higher in the Peloncillo Mountains during the period of maximum protection. Limited numbers of radiocollars in the Sierra Ladron population resulted in very little information. Highest average fall lamb:ewe ratios were in the San Andres. Despite a period of maximum protection attained in all ranges for some periods, lamb:ewe ratios were invariably lower in wild populations compared with those from RRWA (Table 10). Lion predation was documented in RRWA most years. The poor response of this variable to lion removal may have multiple reasons. We hypothesize that during many lambing periods lions were present within lambing habitat. This is based on lion sign observed by trappers and hunters. Certain lions may have become specialists at lamb predation (Ross et al. 1997). In addition, other predators including golden eagles (Aquila chrysaetos), bobcats (Lynx rufus), and coyotes (Canis latrans) may have contributed to decreased lamb:ewe ratios. Although drought conditions are hypothesized to lower recruitment, the lamb:ewe ratio data are not robust enough to analyze this retrospectively. Table 10. Lamb:ewe ratios in 4 bighorn ranges from 2000-007; yearling females are included in ratio denominator.
Peloncillo Hatchets San Andres Sierra Ladron Red Rock Year Spring Fall Spring Fall Spring Fall Spring Fall Spring Fall
2000 35 19 35 27 -- -- 25 18 51 26 2001 45 22 46 46a -- -- 46d 46 63 44 2002 20 14 40 ? -- -- 25 ? 42 58 2003 75 50b 33 ? 68 56 73 ? 56 42 2004 71 45 50 ? 69 48 30c ? 59 42 2005 20 20 29 ? 48 ? ? ? 81 59 2006 54 ? 45 10 ? 43e ? ? 45 81 2007 43 18 50 ? ? 46 ? ? 50 41 a Observed spring lamb:ewe ratio was 29:100 but had to have been at a minimum 46:100 b minimum known ratio was 25:100 with maximum ratio of 75:100; 50:100=midpoint c 4 lions killed in Sierra Ladron post-lambing 2004 d Spring lamb:ewe ratio reported by M. Arana (NMSU graduate student) was 27:100 but had to have been a minimum of 46:100 based on helicopter survey data in fall e this ratio based on the observation of just 5 groups in November 2006
15
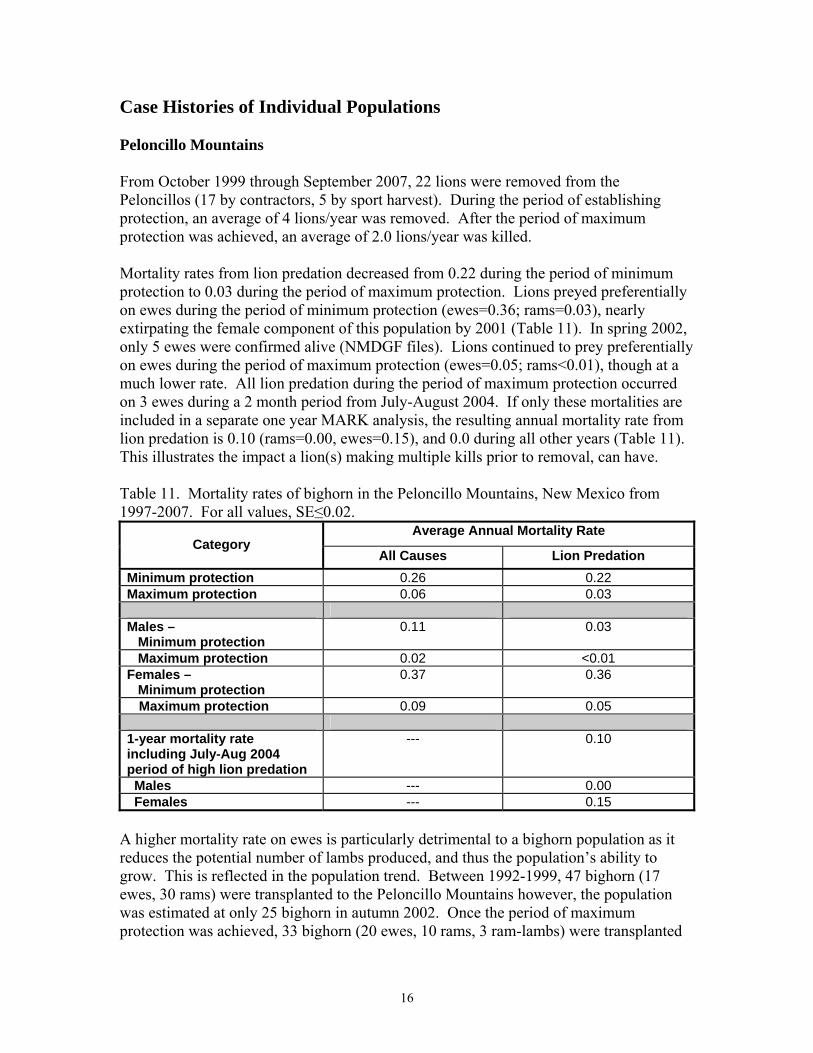
Case Histories of Individual Populations Peloncillo Mountains From October 1999 through September 2007, 22 lions were removed from the Peloncillos (17 by contractors, 5 by sport harvest). During the period of establishing protection, an average of 4 lions/year was removed. After the period of maximum protection was achieved, an average of 2.0 lions/year was killed. Mortality rates from lion predation decreased from 0.22 during the period of minimum protection to 0.03 during the period of maximum protection. Lions preyed preferentially on ewes during the period of minimum protection (ewes=0.36; rams=0.03), nearly extirpating the female component of this population by 2001 (Table 11). In spring 2002, only 5 ewes were confirmed alive (NMDGF files). Lions continued to prey preferentially on ewes during the period of maximum protection (ewes=0.05; rams<0.01), though at a much lower rate. All lion predation during the period of maximum protection occurred on 3 ewes during a 2 month period from July-August 2004. If only these mortalities are included in a separate one year MARK analysis, the resulting annual mortality rate from lion predation is 0.10 (rams=0.00, ewes=0.15), and 0.0 during all other years (Table 11). This illustrates the impact a lion(s) making multiple kills prior to removal, can have. Table 11. Mortality rates of bighorn in the Peloncillo Mountains, New Mexico from 1997-2007. For all values, SE≤0.02.
Average Annual Mortality Rate Category
All Causes Lion Predation Minimum protection 0.26 0.22 Maximum protection 0.06 0.03 Males – Minimum protection
0.11 0.03
Maximum protection 0.02 <0.01 Females – Minimum protection
0.37 0.36
Maximum protection 0.09 0.05 1-year mortality rate including July-Aug 2004 period of high lion predation
--- 0.10
Males --- 0.00 Females --- 0.15
A higher mortality rate on ewes is particularly detrimental to a bighorn population as it reduces the potential number of lambs produced, and thus the population’s ability to grow. This is reflected in the population trend. Between 1992-1999, 47 bighorn (17 ewes, 30 rams) were transplanted to the Peloncillo Mountains however, the population was estimated at only 25 bighorn in autumn 2002. Once the period of maximum protection was achieved, 33 bighorn (20 ewes, 10 rams, 3 ram-lambs) were transplanted
16
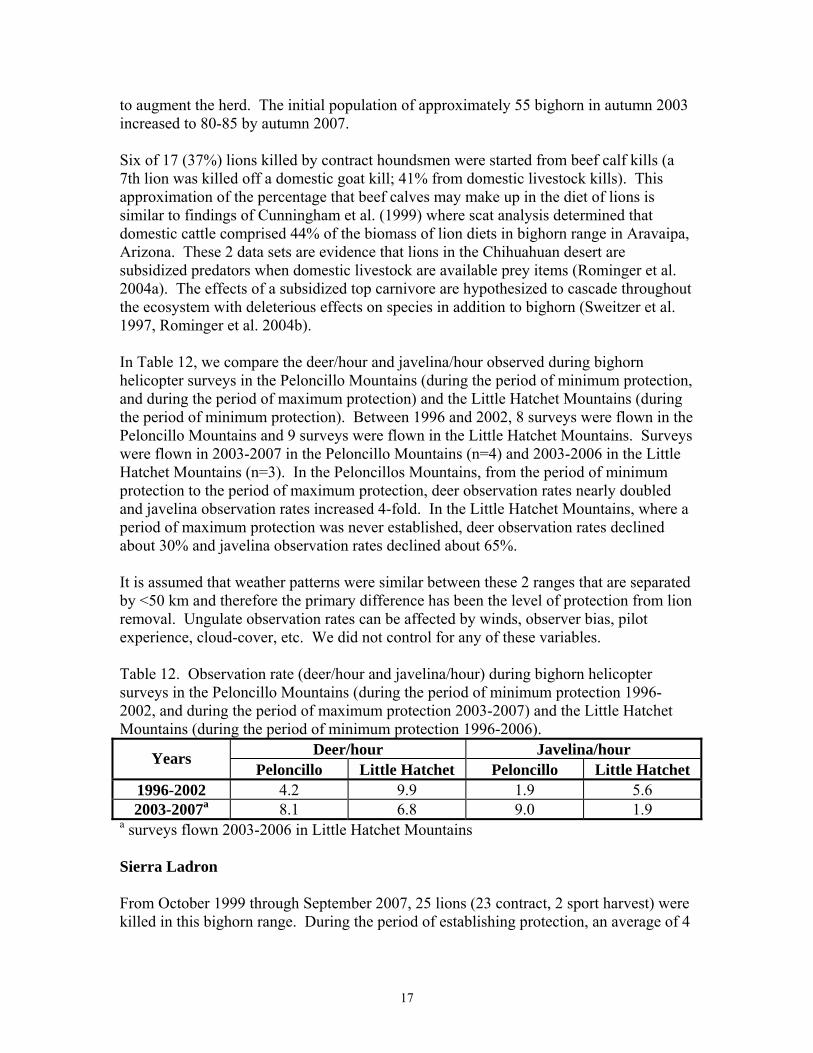
to augment the herd. The initial population of approximately 55 bighorn in autumn 2003 increased to 80-85 by autumn 2007. Six of 17 (37%) lions killed by contract houndsmen were started from beef calf kills (a 7th lion was killed off a domestic goat kill; 41% from domestic livestock kills). This approximation of the percentage that beef calves may make up in the diet of lions is similar to findings of Cunningham et al. (1999) where scat analysis determined that domestic cattle comprised 44% of the biomass of lion diets in bighorn range in Aravaipa, Arizona. These 2 data sets are evidence that lions in the Chihuahuan desert are subsidized predators when domestic livestock are available prey items (Rominger et al. 2004a). The effects of a subsidized top carnivore are hypothesized to cascade throughout the ecosystem with deleterious effects on species in addition to bighorn (Sweitzer et al. 1997, Rominger et al. 2004b). In Table 12, we compare the deer/hour and javelina/hour observed during bighorn helicopter surveys in the Peloncillo Mountains (during the period of minimum protection, and during the period of maximum protection) and the Little Hatchet Mountains (during the period of minimum protection). Between 1996 and 2002, 8 surveys were flown in the Peloncillo Mountains and 9 surveys were flown in the Little Hatchet Mountains. Surveys were flown in 2003-2007 in the Peloncillo Mountains (n=4) and 2003-2006 in the Little Hatchet Mountains (n=3). In the Peloncillos Mountains, from the period of minimum protection to the period of maximum protection, deer observation rates nearly doubled and javelina observation rates increased 4-fold. In the Little Hatchet Mountains, where a period of maximum protection was never established, deer observation rates declined about 30% and javelina observation rates declined about 65%. It is assumed that weather patterns were similar between these 2 ranges that are separated by <50 km and therefore the primary difference has been the level of protection from lion removal. Ungulate observation rates can be affected by winds, observer bias, pilot experience, cloud-cover, etc. We did not control for any of these variables. Table 12. Observation rate (deer/hour and javelina/hour) during bighorn helicopter surveys in the Peloncillo Mountains (during the period of minimum protection 1996-2002, and during the period of maximum protection 2003-2007) and the Little Hatchet Mountains (during the period of minimum protection 1996-2006).
Deer/hour Javelina/hour Years Peloncillo Little Hatchet Peloncillo Little Hatchet
1996-2002 4.2 9.9 1.9 5.6 2003-2007a 8.1 6.8 9.0 1.9
a surveys flown 2003-2006 in Little Hatchet Mountains Sierra Ladron From October 1999 through September 2007, 25 lions (23 contract, 2 sport harvest) were killed in this bighorn range. During the period of establishing protection, an average of 4
17
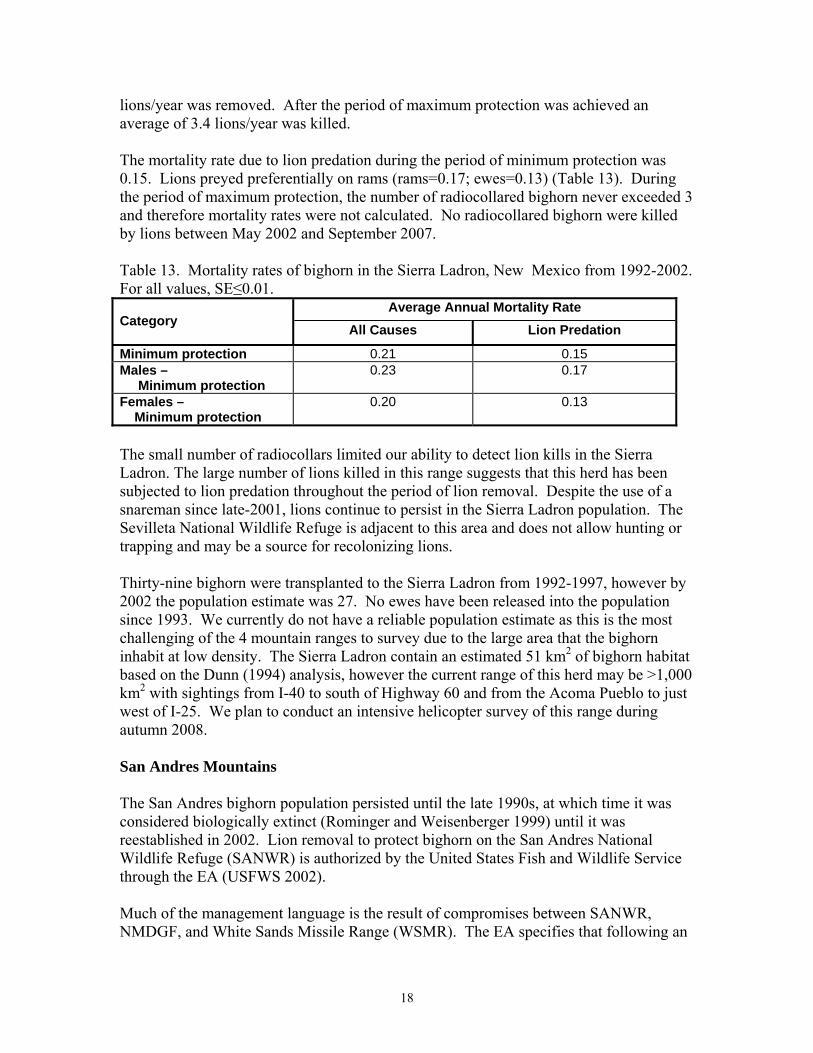
lions/year was removed. After the period of maximum protection was achieved an average of 3.4 lions/year was killed. The mortality rate due to lion predation during the period of minimum protection was 0.15. Lions preyed preferentially on rams (rams=0.17; ewes=0.13) (Table 13). During the period of maximum protection, the number of radiocollared bighorn never exceeded 3 and therefore mortality rates were not calculated. No radiocollared bighorn were killed by lions between May 2002 and September 2007. Table 13. Mortality rates of bighorn in the Sierra Ladron, New Mexico from 1992-2002. For all values, SE≤0.01.
Average Annual Mortality Rate Category All Causes Lion Predation
Minimum protection 0.21 0.15 Males – Minimum protection
0.23 0.17
Females – Minimum protection
0.20 0.13
The small number of radiocollars limited our ability to detect lion kills in the Sierra Ladron. The large number of lions killed in this range suggests that this herd has been subjected to lion predation throughout the period of lion removal. Despite the use of a snareman since late-2001, lions continue to persist in the Sierra Ladron population. The Sevilleta National Wildlife Refuge is adjacent to this area and does not allow hunting or trapping and may be a source for recolonizing lions. Thirty-nine bighorn were transplanted to the Sierra Ladron from 1992-1997, however by 2002 the population estimate was 27. No ewes have been released into the population since 1993. We currently do not have a reliable population estimate as this is the most challenging of the 4 mountain ranges to survey due to the large area that the bighorn inhabit at low density. The Sierra Ladron contain an estimated 51 km2 of bighorn habitat based on the Dunn (1994) analysis, however the current range of this herd may be >1,000 km2 with sightings from I-40 to south of Highway 60 and from the Acoma Pueblo to just west of I-25. We plan to conduct an intensive helicopter survey of this range during autumn 2008. San Andres Mountains The San Andres bighorn population persisted until the late 1990s, at which time it was considered biologically extinct (Rominger and Weisenberger 1999) until it was reestablished in 2002. Lion removal to protect bighorn on the San Andres National Wildlife Refuge (SANWR) is authorized by the United States Fish and Wildlife Service through the EA (USFWS 2002). Much of the management language is the result of compromises between SANWR, NMDGF, and White Sands Missile Range (WSMR). The EA specifies that following an
18
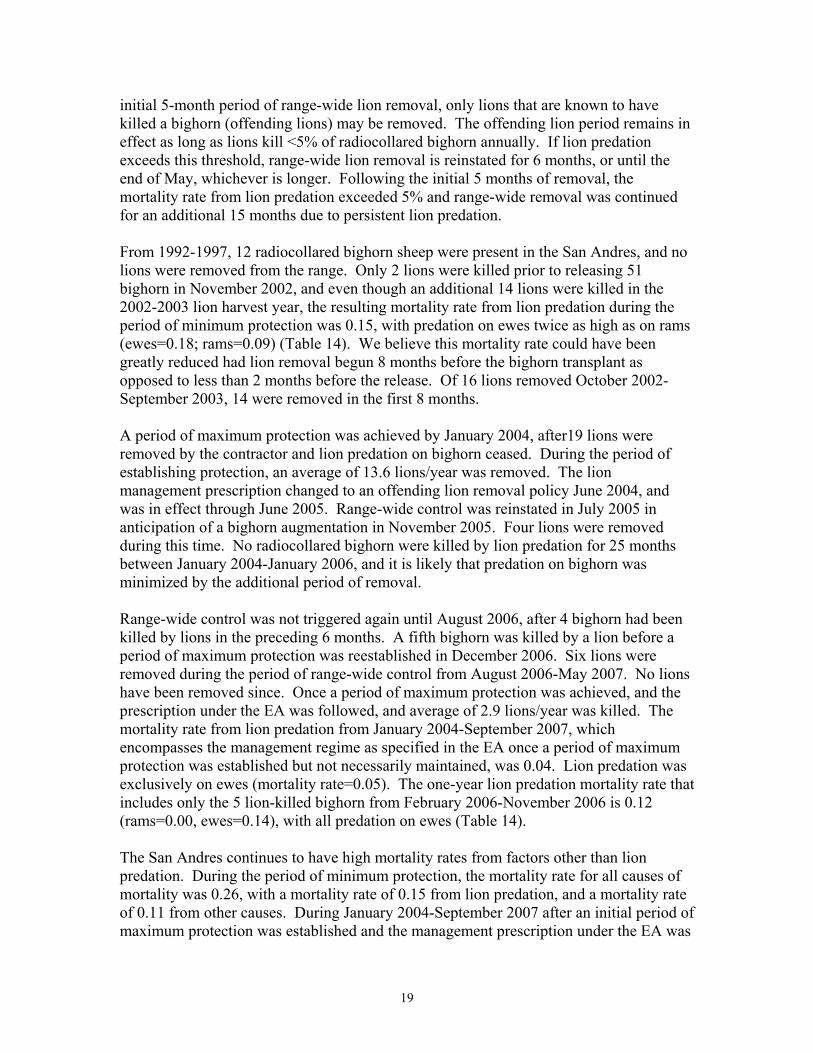
initial 5-month period of range-wide lion removal, only lions that are known to have killed a bighorn (offending lions) may be removed. The offending lion period remains in effect as long as lions kill <5% of radiocollared bighorn annually. If lion predation exceeds this threshold, range-wide lion removal is reinstated for 6 months, or until the end of May, whichever is longer. Following the initial 5 months of removal, the mortality rate from lion predation exceeded 5% and range-wide removal was continued for an additional 15 months due to persistent lion predation. From 1992-1997, 12 radiocollared bighorn sheep were present in the San Andres, and no lions were removed from the range. Only 2 lions were killed prior to releasing 51 bighorn in November 2002, and even though an additional 14 lions were killed in the 2002-2003 lion harvest year, the resulting mortality rate from lion predation during the period of minimum protection was 0.15, with predation on ewes twice as high as on rams (ewes=0.18; rams=0.09) (Table 14). We believe this mortality rate could have been greatly reduced had lion removal begun 8 months before the bighorn transplant as opposed to less than 2 months before the release. Of 16 lions removed October 2002-September 2003, 14 were removed in the first 8 months. A period of maximum protection was achieved by January 2004, after19 lions were removed by the contractor and lion predation on bighorn ceased. During the period of establishing protection, an average of 13.6 lions/year was removed. The lion management prescription changed to an offending lion removal policy June 2004, and was in effect through June 2005. Range-wide control was reinstated in July 2005 in anticipation of a bighorn augmentation in November 2005. Four lions were removed during this time. No radiocollared bighorn were killed by lion predation for 25 months between January 2004-January 2006, and it is likely that predation on bighorn was minimized by the additional period of removal. Range-wide control was not triggered again until August 2006, after 4 bighorn had been killed by lions in the preceding 6 months. A fifth bighorn was killed by a lion before a period of maximum protection was reestablished in December 2006. Six lions were removed during the period of range-wide control from August 2006-May 2007. No lions have been removed since. Once a period of maximum protection was achieved, and the prescription under the EA was followed, and average of 2.9 lions/year was killed. The mortality rate from lion predation from January 2004-September 2007, which encompasses the management regime as specified in the EA once a period of maximum protection was established but not necessarily maintained, was 0.04. Lion predation was exclusively on ewes (mortality rate=0.05). The one-year lion predation mortality rate that includes only the 5 lion-killed bighorn from February 2006-November 2006 is 0.12 (rams=0.00, ewes=0.14), with all predation on ewes (Table 14). The San Andres continues to have high mortality rates from factors other than lion predation. During the period of minimum protection, the mortality rate for all causes of mortality was 0.26, with a mortality rate of 0.15 from lion predation, and a mortality rate of 0.11 from other causes. During January 2004-September 2007 after an initial period of maximum protection was established and the management prescription under the EA was
19
followed, the mortality rate from all causes of mortality was 0.19, with a mortality rate of 0.04 from lion predation, and a mortality rate of 0.15 from other causes (Table 14). Two disease outbreaks apparently occurred, the first began in February 2003 and continued through March 2004 in which 9 radiocollared bighorn died. A second 2 month outbreak began in September 2006 in which 9 radiocollared bighorn died. The diagnostic laboratory concluded that pneumonia was the cause of death in 2 mortalities in each dieoff, though it is not known if it is the causative agent for all mortalities. Bighorn of both KNWR and RRWA origin died during these dieoffs, and bighorn from both transplants died during the second dieoff. Table 14. Mortality rates of bighorn in the San Andres Mountains, New Mexico from 1992-2007. For all values, SE≤0.01.
Average Annual Mortality Rate Category
All Causes Lion Predation
Minimum protection 0.26 0.15 Increased protection as specified in the EA
0.19 0.04
Males – Minimum protection
0.25 0.09
Increased protection as specified in the EA
0.10 0.00
Females – Minimum protection
0.26 0.18
Increased protection as specified in the EA
0.22 0.05
1-year mortality rate including only Feb-Nov 2006 period of high lion predation
--- 0.12
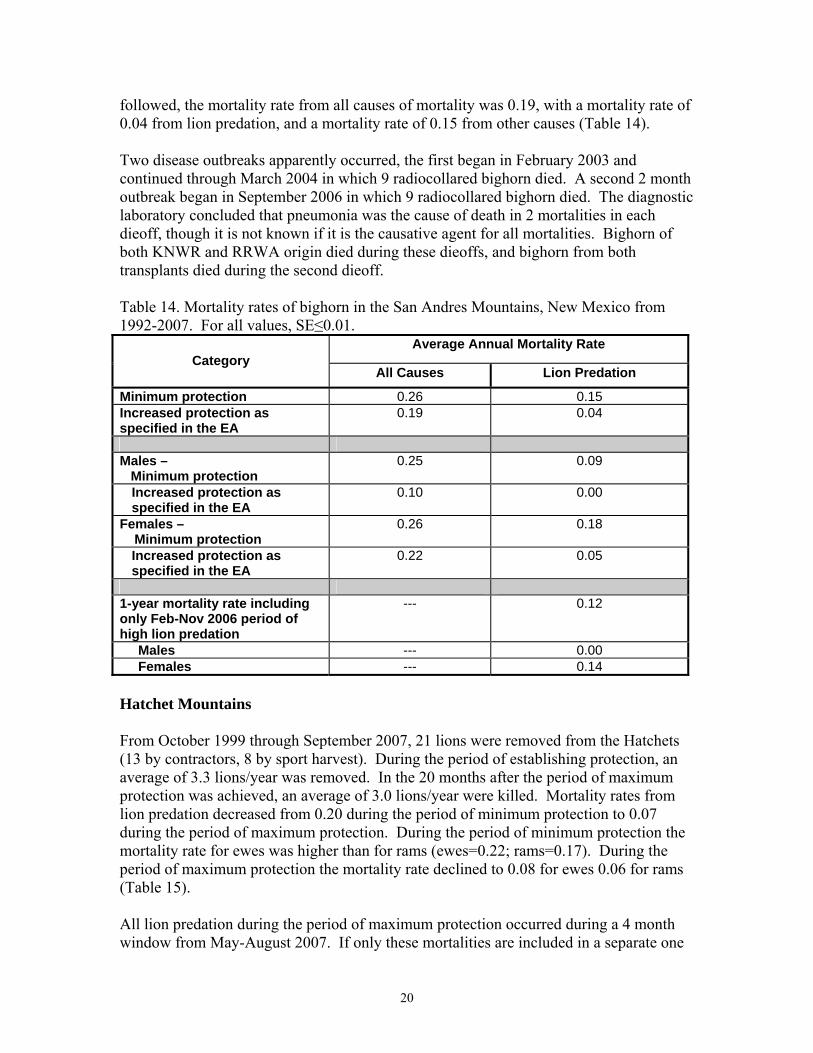
Males --- 0.00 Females --- 0.14 Hatchet Mountains From October 1999 through September 2007, 21 lions were removed from the Hatchets (13 by contractors, 8 by sport harvest). During the period of establishing protection, an average of 3.3 lions/year was removed. In the 20 months after the period of maximum protection was achieved, an average of 3.0 lions/year were killed. Mortality rates from lion predation decreased from 0.20 during the period of minimum protection to 0.07 during the period of maximum protection. During the period of minimum protection the mortality rate for ewes was higher than for rams (ewes=0.22; rams=0.17). During the period of maximum protection the mortality rate declined to 0.08 for ewes 0.06 for rams (Table 15). All lion predation during the period of maximum protection occurred during a 4 month window from May-August 2007. If only these mortalities are included in a separate one
20
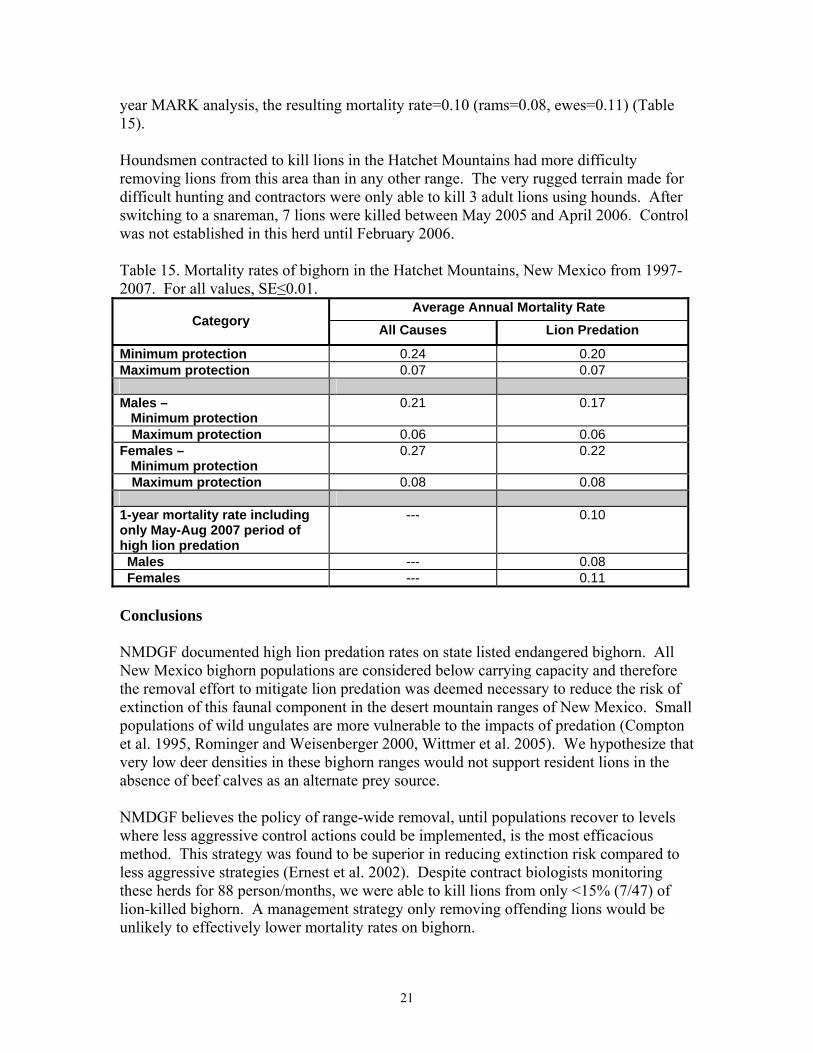
year MARK analysis, the resulting mortality rate=0.10 (rams=0.08, ewes=0.11) (Table 15). Houndsmen contracted to kill lions in the Hatchet Mountains had more difficulty removing lions from this area than in any other range. The very rugged terrain made for difficult hunting and contractors were only able to kill 3 adult lions using hounds. After switching to a snareman, 7 lions were killed between May 2005 and April 2006. Control was not established in this herd until February 2006. Table 15. Mortality rates of bighorn in the Hatchet Mountains, New Mexico from 1997- 2007. For all values, SE≤0.01.
Average Annual Mortality Rate Category All Causes Lion Predation
Minimum protection 0.24 0.20 Maximum protection 0.07 0.07 Males – Minimum protection
0.21 0.17
Maximum protection 0.06 0.06 Females – Minimum protection
0.27 0.22
Maximum protection 0.08 0.08 1-year mortality rate including only May-Aug 2007 period of high lion predation
--- 0.10
Males --- 0.08 Females --- 0.11 Conclusions NMDGF documented high lion predation rates on state listed endangered bighorn. All New Mexico bighorn populations are considered below carrying capacity and therefore the removal effort to mitigate lion predation was deemed necessary to reduce the risk of extinction of this faunal component in the desert mountain ranges of New Mexico. Small populations of wild ungulates are more vulnerable to the impacts of predation (Compton et al. 1995, Rominger and Weisenberger 2000, Wittmer et al. 2005). We hypothesize that very low deer densities in these bighorn ranges would not support resident lions in the absence of beef calves as an alternate prey source. NMDGF believes the policy of range-wide removal, until populations recover to levels where less aggressive control actions could be implemented, is the most efficacious method. This strategy was found to be superior in reducing extinction risk compared to less aggressive strategies (Ernest et al. 2002). Despite contract biologists monitoring these herds for 88 person/months, we were able to kill lions from only <15% (7/47) of lion-killed bighorn. A management strategy only removing offending lions would be unlikely to effectively lower mortality rates on bighorn.
21
Individual lion predation behavior appeared varied. In some instances when a spike in lion predation was observed, removal of 1 lion caused predation to cease. In other cases, removal of multiple lions on the mountain was necessary. In still other cases, it was believed that multiple lions were making kills, and some were leaving the mountain and returning several weeks later, making capture of these lions very difficult. This suggests that both incidental bighorn killers and specialist bighorn killers exist, and the resulting mortality can have a great impact on small populations of bighorn. It has been hypothesized that range-wide lion removal would create a vacuum resulting in a large influx of new lions (Logan et al. 1980). The number of lions/year/range removed decreased from an average of 6.2 during the period of establishing protection, to 2.8 during the period of maximum protection. This occurred in conjunction with a decrease both in lion sign observed, and in bighorn mortality rates from lion predation. Logan and Sweanor (2001) reported that it took 31 months for lions to repopulate the San Andres after removal of approximately 50% of the resident lion. Where lion removal has been most effective, annual mortality rates due to lion predation declined from 0.17 to 0.04. During periods with this substantially lower mortality rate populations have increased. However, it has taken 1-4 years to establish periods of maximum protection, and during this time lion predation continued. During the timeframe starting 1 year after lion removal was initiated, the mortality rate due to lions was 0.07. This lowered rate of predation enabled the statewide bighorn population to remain relatively stable. Bighorn translocations are what have allowed the statewide population to increase. Bighorn appear particularly vulnerable to predation during the first year after translocation. Effective pre-treatment of release sites by removing lions prior to translocations and continuing throughout the first year is recommended to increase probability of transplant success. Subsequent lion removal will be necessary to remove lions that recolonize. It is possible that fewer lions could be removed once the bighorn population became large enough to sustain limited predation without negative consequences. The least well understood variable is the effect of lion removal on lamb recruitment, and lamb:ewe ratios appear to have remained lower than predicted. We hypothesize that ‘specialist’ lions (Ross et al. 1997), may be very effective predators on bighorn neonates. Following 13 years of overall stable population trend between 1987-2001, the population has increased annually since 2001. The bighorn population estimate has increased from <170 in 2001 to >400 in 2007. This includes the releasing 178 bighorn from RRWA and KNWR during this time period. An additional 40-50 bighorn are scheduled for release in autumn 2009 from RRWA. It is hoped that the status of bighorn progresses from endangered species, to threatened species, to once again becoming a game animal in New Mexico. A statewide population of 500, with 3 populations or metapopulations ≥100, is required to delist this state-endangered species (NMDGF 2003). NMDGF has clearly stated that
22
due to the small number of populations and imminent risk of extinction, the lion control effort is a management action rather than a research project. However, the declining trend in bighorn mortality rates due to lion predation and the increasing statewide population, suggests that this management effort is accelerating recovery of this state-listed endangered species. Acknowledgements We acknowledge former NMDGF Director J. Maracchini and the State Game Commissioners for their support of this management action. We appreciate the financial contributions of the New Mexico Chapter of FNAWS, and 3 members of National FNAWS who contributed $31,000 to this project. This document was improved following the review of the 5-year interim report by K. Logan, Colorado Division of Wildlife. We thank all the lion contractors and bighorn sheep contractors for their dedication in the field. The report was reviewed by B. Thompson and R. Winslow.
23
Literature Cited Compton, B. B., P. Zager, and G. Servheen. 1995. Survival and mortality of translocated
woodland caribou. Wildlife Society Bulletin 23:490-496. Creeden, P. J., and V. K. Graham. 1997. Reproduction, survival, and lion predation in
the Black Ridge, Colorado National Monument desert bighorn herd. Desert Bighorn Council Transactions 41:37-43.
Cunningham, S. C., C. R. Gustavson, and W. B. Ballard. 1999. Diet selection of
mountain lions in southeastern Arizona. Journal of Range Management 52:202-207.
Dunn, W. C. 1994. Evaluation of desert bighorn sheep habitat in New Mexico. A
revision of the Final Report, New Mexico Department of Game and Fish Federal Aid in Wildlife Restoration Project W-127-R-7 Job 4. 43pp.
Ernest, H. B., E. S. Rubin, and W. M. Boyce. 2002. Tracking mountain lion predation of
desert bighorn sheep with fecal DNA. Journal of Wildlife Management 66:75-85. Fisher, A., E. Rominger, P. Miller, O. Byers. 1999. Population and habitat viability
assessment workshop for the desert bighorn sheep of New Mexico (Ovis canadensis): Final Report. IUCN/SSC Conservation Breeding Specialist Group, 12101 Johnny Cake Road, Apple Valley, MN 55124.
Goldstein, E. J., and E. M. Rominger. 2002. Status of desert bighorn sheep in New
Mexico—2001. Desert Bighorn Council Transactions 46:46-52. Goldstein, E. J., and E. M. Rominger. 2004. Lion sign surveys in 4 New Mexico desert
bighorn sheep ranges, 2002-2004. NMDGF Unpublished Report. Goldstein, E. J., and E. M. Rominger. 2007. Lion sign surveys in 4 New Mexico desert
bighorn sheep ranges, 2005-2006. NMDGF Unpublished Report. Hayes, C. L., E. S. Rubin, M. C. Jorgensen, R. A. Botta, and W. M. Boyce. 2000.
Mountain lion predation of bighorn sheep in the Peninsular Ranges, California. Journal of Wildlife Management 64:954-959.
Hecht, A., and P. R. Nickerson. 1999. The need for predator management in
conservation of some vulnerable species. Endangered Species UPDATE 16 (6):114-118.
Kamler, J. F., R. M. Lee, J. C. deVos, Jr., W. B. Ballard, and H. A. Whitlaw. 2002.
Survival and cougar predation of translocated bighorn sheep in Arizona. Journal of Wildlife Management 66:1267-1272.
24
Logan, K. A., L. L. Irwin, and R. Skinner. 1986. Characteristics of a hunted mountain lion population in Wyoming. Journal of Wildlife Management. 50:648–654.
Logan, K. A., and L. L. Sweanor. 2001. Desert Puma. Island Press. Washington D.C. Minteer, B.A. and J. P. Collins. 2005. Ecological ethics: building a new tool kit for
ecologists and biodiversity managers. Conservation Biology 19:1804-1812. Muñoz, D. 1983. San Andres National Wildlife Refuge: Annual narrative report. U.S.
Department of Interior Fish and Wildlife Service, Las Cruces, NM, USA. NMDGF. 2003. Plan for the recovery of desert bighorn sheep in New Mexico, 2003-
2013. New Mexico Department of Game and Fish, Santa Fe, NM 87504. NMDGF. 2006a. Comprehensive Wildlife Conservation Strategy for New Mexico.
New Mexico Department of Game and Fish, Santa Fe, NM 87504. NMDGF. 2006b. Cougar population assessment and harvest management matrix.
Adopted at the September 29, 2006 Meeting of the New Mexico State Game Commission.
Parsons, Z. 2007. Desert bighorn sheep lamb mortality in the Fra Cristobal Mountains,
New Mexico. M. S. Thesis. University of Montana, Missoula. Reiter, D. K., M. W. Brunson, and R. H. Schmidt. 1999. Public attitudes toward wildlife
damage management and policy. Wildlife Society Bulletin 27:746-758. Rominger, E. M., V. C. Bleich, and E. J. Goldstein. 2006. Bighorn sheep, mountain
lions, and the ethics of conservation. Conservation Biology 20:1341. Rominger, E. M. and W. C. Dunn. 2000. Reducing mountain lion predation on bighorn
sheep in four New Mexico mountain ranges: A study design. NMDGF Unpublished Report. 17pp.
Rominger, E. M., E. J. Goldstein, R. Beausoleil, and W. C. Dunn. 2002. Lion sign
surveys in 5 New Mexico bighorn sheep ranges, 1999-2001. NMDGF Unpublished Report. 10pp.
Rominger, E. M. and M. E. Weisenberger. 2000. Biological extinction and a test of the
“conspicuous individual hypothesis” in the San Andres Mountains, New Mexico. Pages 293-307 in Transactions of the 2nd North American Wild Sheep Conference. April 6-9, 1999, Reno, NV. 470pp.
Rominger, E. M., H. Whitlaw, D. Weybright, W. C. Dunn, and W. Ballard. 2004a. The
influence of mountain lion predation on bighorn sheep translocations. Journal of Wildlife Management 68:993-999.
25
Rominger, E. M., F. S. Winslow, E. J. Goldstein, D. L. Weybright, and W. C. Dunn.
2004b. Cascading effects of subsidized mountain lion populations in the Chihuahuan desert. Presented at the Carnivores 2004 Conference, Santa Fe, NM.
Ross, P. I., M. G. Jalkotzy, and M. Festa-Bianchet. 1997. Cougar predation on bighorn
sheep in southwestern Alberta during winter. Canadian Journal of Zoology. 74:771-775.
Smith, R. A. 1966. Records of the San Andres Refuge deer hunts. Desert Bighorn
Council Transactions 10:36-46. Sweitzer, R.A., S. H. Jenkins, and J. Berger. 1997. Near-extinction of porcupines by
mountain lions and consequences of ecosystem change in the Great Basin Desert. Conservation Biology 11:1407-1417.
USFWS. 2002. Mountain lion management to protect the state endangered desert
bighorn sheep. Final Environmental Assessment. 62pp. Wehausen, J. D. 1996. Effect of mountain lion predation on bighorn in the Sierra
Nevada and Granite Mountains of California. Wildlife Society Bulletin 24:471-479.
White, G. C., and K. P. Burnham. 1999. Program MARK: survival estimation from
populations of marked animals. Bird Study 46 Supplement:120-138. Wittmer, H. U., A. R. E. Sinclair, B. N. McLellan. 2005. The role of predation in the
decline and extirpation of woodland caribou. Oecologia 144:257-267.
26