evaluation of a natural experiment presented by: jon gabel, norc jeremy pickreign, norc paul...
TRANSCRIPT
Click icon to add picture
Evaluation of a Natural Experiment
Presented by:
Jon Gabel, NORCJeremy Pickreign, NORCPaul Fronstin, EBRIKaeley Shannon, NORC
A Total Replacement HSA Plan for Company X
2
• Examine how the adoption of a full replacement HSA plan affected• Claims expenses• Use of services• Employee out-of-pocket expenses• Use of preventive services
• Major contribution – follow performance for four years of an HSA full replacement plan.
Objectives
A Total Replacement HSA Plan for Company X: Evaluation of a Natural Experiment
3
• Company X offered traditional HMO and PPO plans to non-union active workers through 2006, and early retirees through 2007.
• In 2007, all non-union active workers and their dependents were transferred to an HSA plan.
• Higher Deducible • Higher OOP limit• Employer contribution to Savings Account
• In 2008, all early retirees were transferred to the HSA Plan.
The Natural Experiment
A Total Replacement HSA Plan for Company X: Evaluation of a Natural Experiment
4
• Monthly enrollment files for all sponsors and dependents from 2006-2010.
• Merged enrollment files with medical and pharmacy claims corresponding to all years.
• Medical claims files include ambulatory and inpatient claims.
• All beneficiaries enrolled during study years.• N= 50,514 actives and 8,571 retirees• Includes neo-natal, disabilities and decedents.
Database
A Total Replacement HSA Plan for Company X: Evaluation of a Natural Experiment

5
• Examine active and retiree trends.• Use continuously enrolled analytic file.• Descriptive
• Claims expenses per year• Utilization per year
– Use of select preventive services
Analysis
A Total Replacement HSA Plan for Company X: Evaluation of a Natural Experiment
6
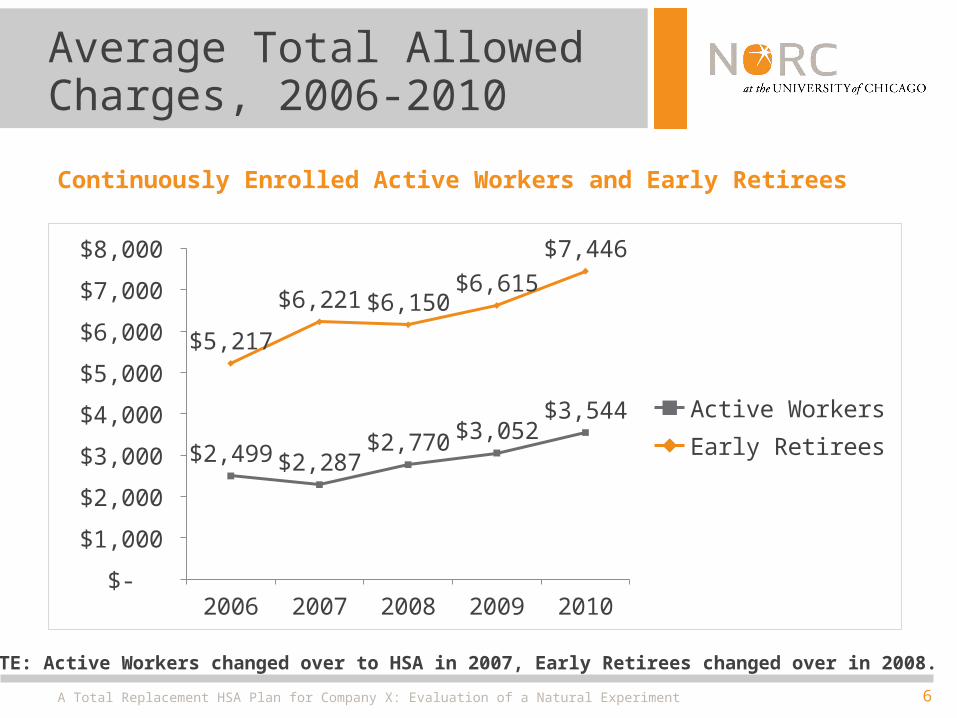
Average Total Allowed Charges, 2006-2010
Continuously Enrolled Active Workers and Early Retirees
A Total Replacement HSA Plan for Company X: Evaluation of a Natural Experiment
2006 2007 2008 2009 2010 $-
$1,000
$2,000
$3,000
$4,000
$5,000
$6,000
$7,000
$8,000
$2,499 $2,287 $2,770 $3,052
$3,544
$5,217
$6,221 $6,150 $6,615
$7,446
Active WorkersEarly Retirees
NOTE: Active Workers changed over to HSA in 2007, Early Retirees changed over in 2008.
7
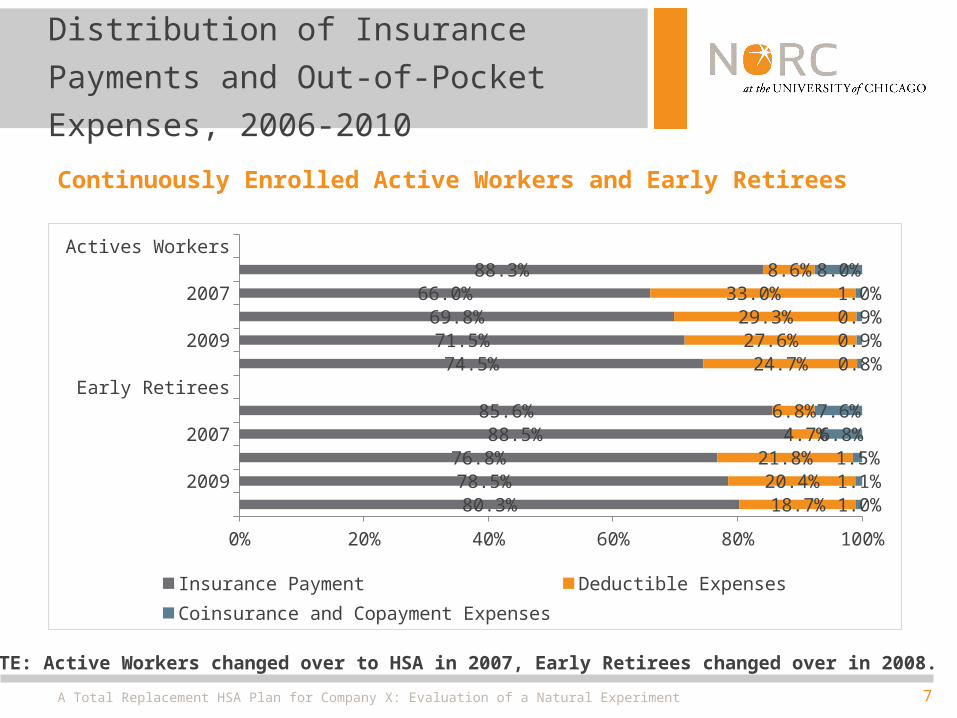
Distribution of Insurance Payments and
Out-of-Pocket Expenses, 2006-2010
Continuously Enrolled Active Workers and Early Retirees
A Total Replacement HSA Plan for Company X: Evaluation of a Natural Experiment
Actives Workers20062007200820092010
Early Retirees20062007200820092010
0% 20% 40% 60% 80% 100%
88.3%66.0%
69.8%71.5%74.5%
85.6%88.5%
76.8%78.5%80.3%
8.6%33.0%
29.3%27.6%24.7%
6.8%4.7%
21.8%20.4%18.7%
8.0%1.0%0.9%0.9%0.8%
7.6%6.8%
1.5%1.1%1.0%
Insurance Payment Deductible ExpensesCoinsurance and Copayment Expenses
NOTE: Active Workers changed over to HSA in 2007, Early Retirees changed over in 2008.
8
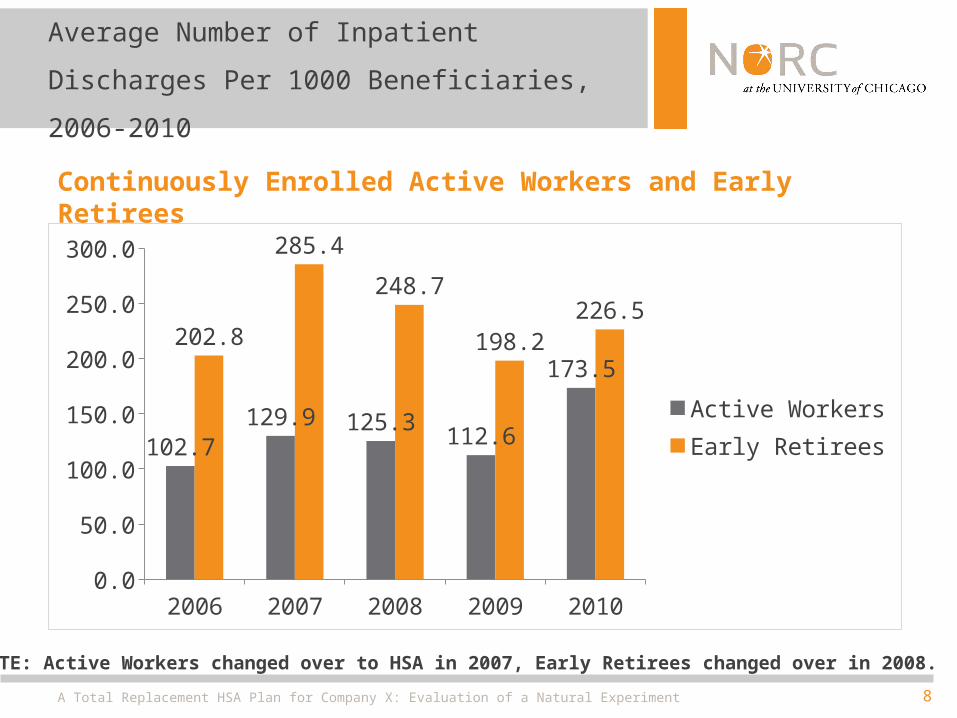
Average Number of Inpatient Discharges Per
1000 Beneficiaries, 2006-2010
2006 2007 2008 2009 20100.0
50.0
100.0
150.0
200.0
250.0
300.0
102.7129.9 125.3
112.6
173.5202.8
285.4
248.7
198.2226.5
Active WorkersEarly Retirees
Continuously Enrolled Active Workers and Early Retirees
A Total Replacement HSA Plan for Company X: Evaluation of a Natural Experiment
NOTE: Active Workers changed over to HSA in 2007, Early Retirees changed over in 2008.
9
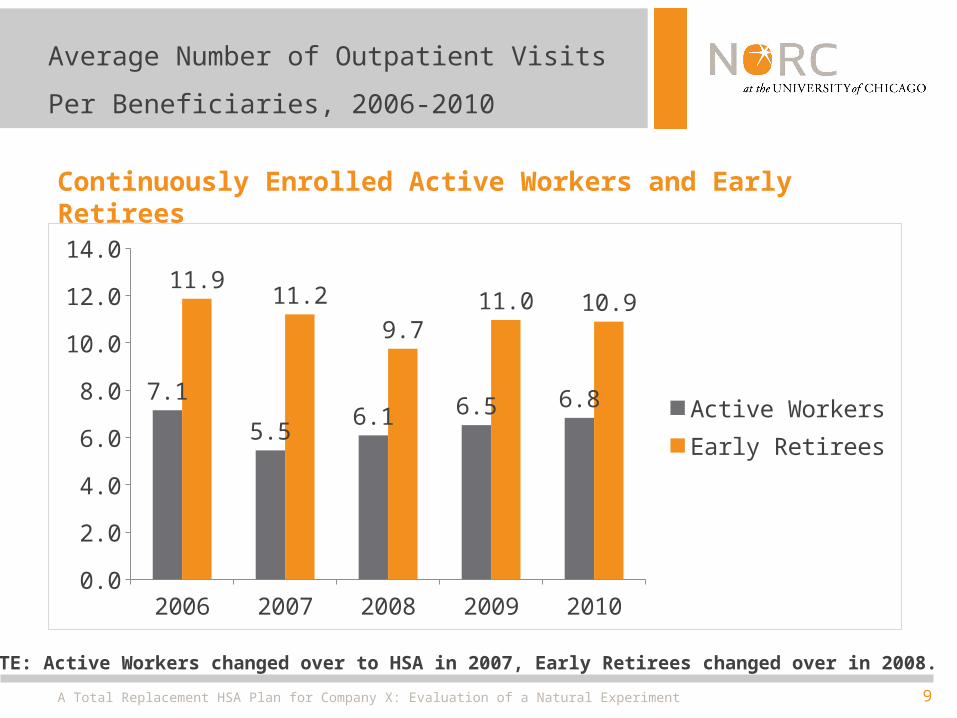
Average Number of Outpatient Visits Per
Beneficiaries, 2006-2010
2006 2007 2008 2009 20100.0
2.0
4.0
6.0
8.0
10.0
12.0
14.0
7.1
5.56.1 6.5 6.8
11.911.2
9.711.0 10.9
Active WorkersEarly Retirees
Continuously Enrolled Active Workers and Early Retirees
A Total Replacement HSA Plan for Company X: Evaluation of a Natural Experiment
NOTE: Active Workers changed over to HSA in 2007, Early Retirees changed over in 2008.
10
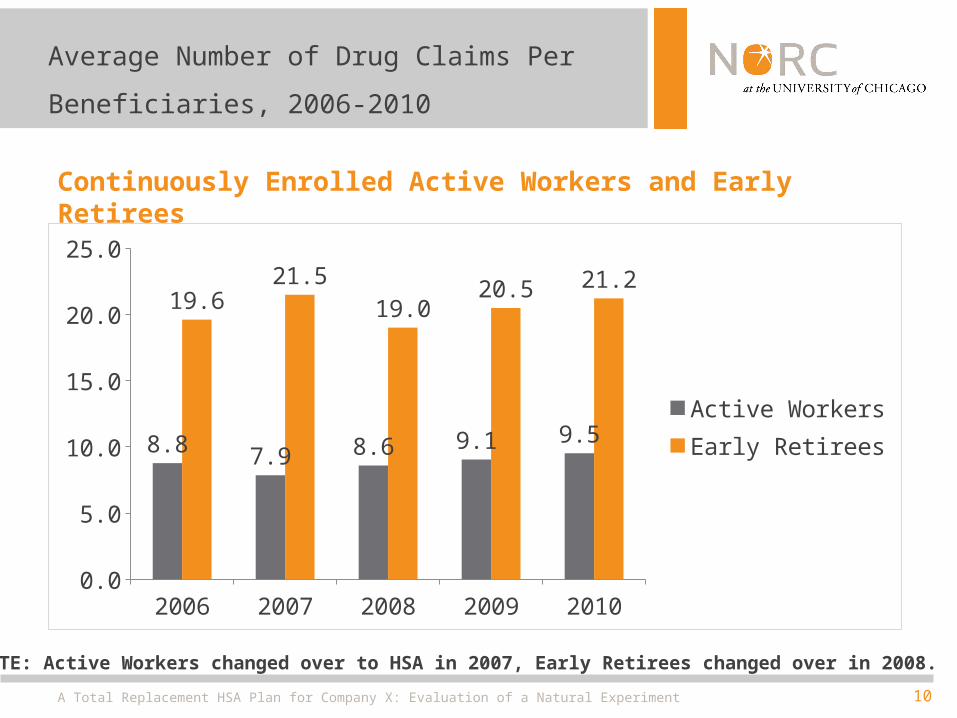
Average Number of Drug Claims Per
Beneficiaries, 2006-2010
2006 2007 2008 2009 20100.0
5.0
10.0
15.0
20.0
25.0
8.8 7.9 8.6 9.1 9.5
19.621.5
19.020.5 21.2
Active WorkersEarly Retirees
Continuously Enrolled Active Workers and Early Retirees
A Total Replacement HSA Plan for Company X: Evaluation of a Natural Experiment
NOTE: Active Workers changed over to HSA in 2007, Early Retirees changed over in 2008.
11
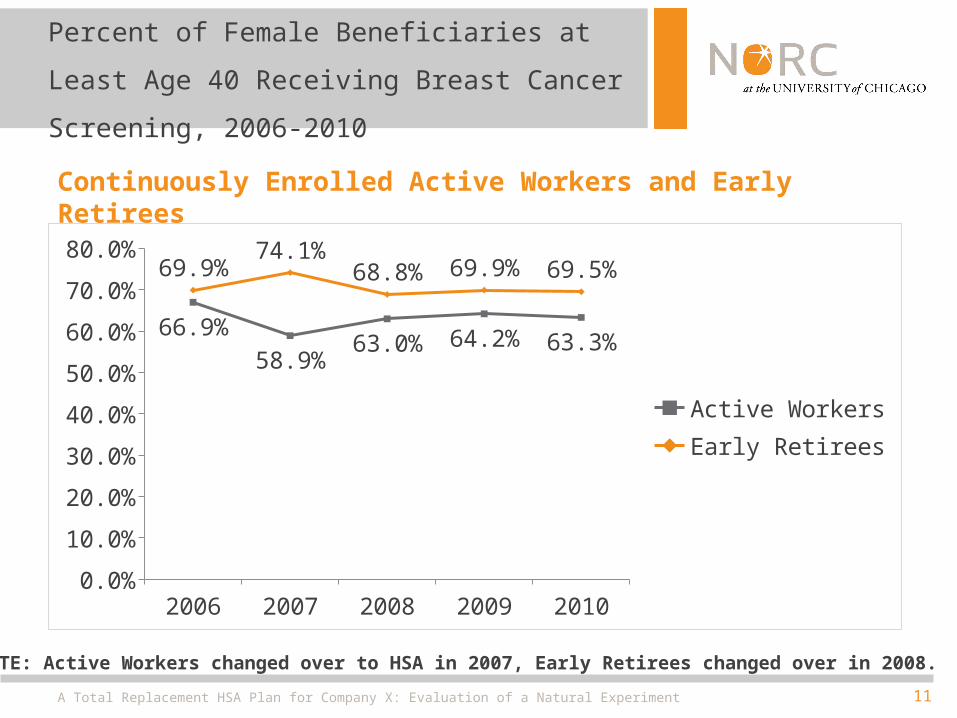
Percent of Female Beneficiaries at Least Age 40
Receiving Breast Cancer Screening, 2006-2010
2006 2007 2008 2009 20100.0%
10.0%
20.0%
30.0%
40.0%
50.0%
60.0%
70.0%
80.0%
66.9%
58.9%63.0% 64.2% 63.3%
69.9%74.1%
68.8% 69.9% 69.5%
Active WorkersEarly Retirees
Continuously Enrolled Active Workers and Early Retirees
A Total Replacement HSA Plan for Company X: Evaluation of a Natural Experiment
NOTE: Active Workers changed over to HSA in 2007, Early Retirees changed over in 2008.
12
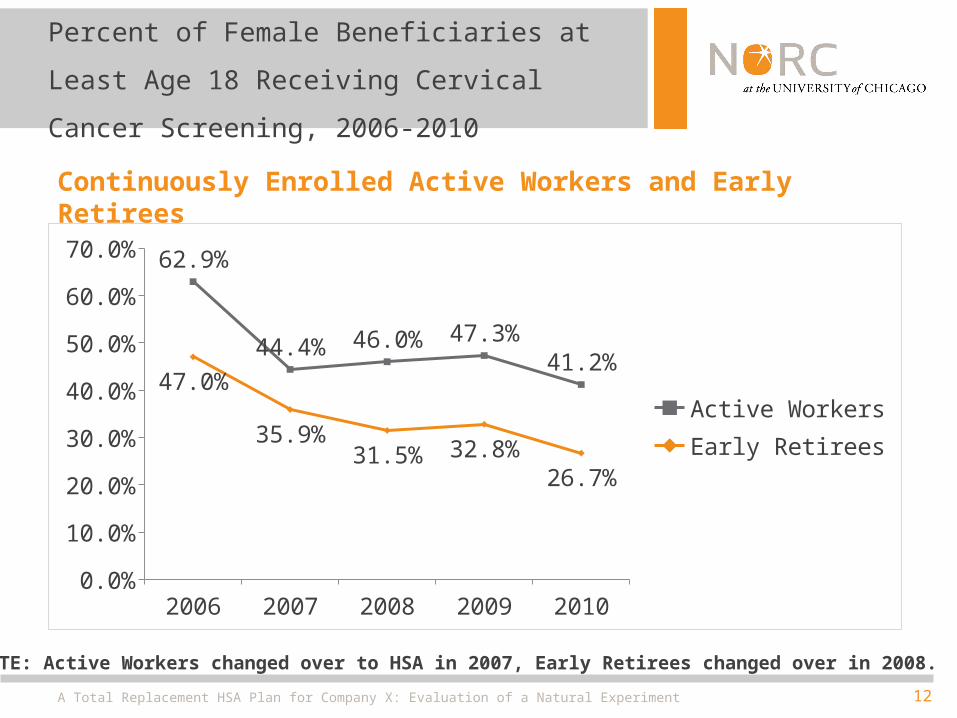
Percent of Female Beneficiaries at Least Age 18
Receiving Cervical Cancer Screening, 2006-2010
2006 2007 2008 2009 20100.0%
10.0%
20.0%
30.0%
40.0%
50.0%
60.0%
70.0%62.9%
44.4% 46.0% 47.3%41.2%47.0%
35.9%31.5% 32.8%
26.7%
Active WorkersEarly Retirees
Continuously Enrolled Active Workers and Early Retirees
A Total Replacement HSA Plan for Company X: Evaluation of a Natural Experiment
NOTE: Active Workers changed over to HSA in 2007, Early Retirees changed over in 2008.
13
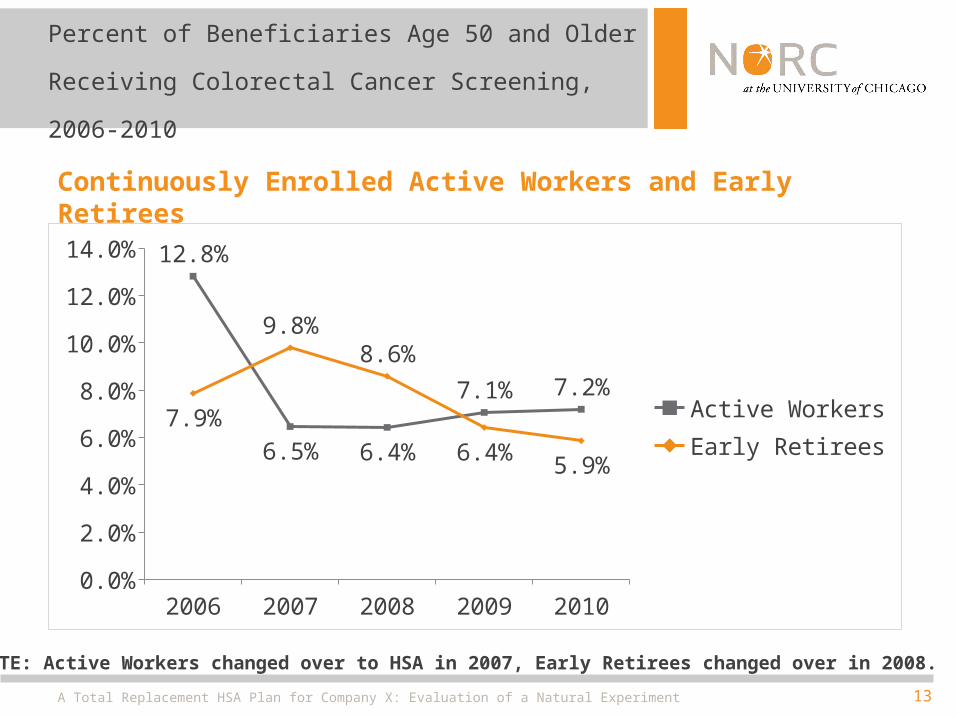
Percent of Beneficiaries Age 50 and Older Receiving
Colorectal Cancer Screening, 2006-2010
2006 2007 2008 2009 20100.0%
2.0%
4.0%
6.0%
8.0%
10.0%
12.0%
14.0% 12.8%
6.5% 6.4%
7.1% 7.2%7.9%
9.8%8.6%
6.4%5.9%
Active WorkersEarly Retirees
Continuously Enrolled Active Workers and Early Retirees
A Total Replacement HSA Plan for Company X: Evaluation of a Natural Experiment
NOTE: Active Workers changed over to HSA in 2007, Early Retirees changed over in 2008.
14
Summary
• Allowed charges declined for both actives and retirees following changeover to HSA plan.
• In subsequent years, increases in allowed charges were substantial.
• Outpatient visits and drug claims fell in first year of HSA but rose in subsequent years.
• Inpatient days were volatile during the study period.• In first year of HSA use of preventive services generally
declined, but rose for some services
Major Findings
A Total Replacement HSA Plan for Company X: Evaluation of a Natural Experiment

Thank You!