evaluation for loss of lubrication performance of black
TRANSCRIPT

ARL-TR-7815 ● SEP 2016
US Army Research Laboratory
Evaluation for Loss of Lubrication Performance of Black Oxide, Superfinished, and As-Ground Surfaces for Use in Rotorcraft Transmissions
by Mark R Riggs, Nikhil K Murthy, and Stephen P Berkebile Approved for public release; distribution is unlimited.
ii
NOTICES
Disclaimers
The findings in this report are not to be construed as an official Department of the Army position unless so designated by other authorized documents. Citation of manufacturer’s or trade names does not constitute an official endorsement or approval of the use thereof. Destroy this report when it is no longer needed. Do not return it to the originator.
ARL-TR-7815 ● SEP 2016
US Army Research Laboratory
Evaluation for Loss of Lubrication Performance of Black Oxide, Superfinished, and As-Ground Surfaces for Use in Rotorcraft Transmissions
by Mark R Riggs and Stephen P Berkebile Vehicle Technology Directorate, ARL Nikhil K Murthy Engility, Chantilly, Virginia Approved for public release; distribution is unlimited.

ii
REPORT DOCUMENTATION PAGE Form Approved OMB No. 0704-0188
Public reporting burden for this collection of information is estimated to average 1 hour per response, including the time for reviewing instructions, searching existing data sources, gathering and maintaining the data needed, and completing and reviewing the collection information. Send comments regarding this burden estimate or any other aspect of this collection of information, including suggestions for reducing the burden, to Department of Defense, Washington Headquarters Services, Directorate for Information Operations and Reports (0704-0188), 1215 Jefferson Davis Highway, Suite 1204, Arlington, VA 22202-4302. Respondents should be aware that notwithstanding any other provision of law, no person shall be subject to any penalty for failing to comply with a collection of information if it does not display a currently valid OMB control number. PLEASE DO NOT RETURN YOUR FORM TO THE ABOVE ADDRESS.
1. REPORT DATE (DD-MM-YYYY)
September 2016 2. REPORT TYPE
Technical Report 3. DATES COVERED (From - To)
2 October 2015–26 April 2016 4. TITLE AND SUBTITLE Evaluation for Loss of Lubrication Performance of Black Oxide, Superfinished, and As-Ground Surfaces for Use in Rotorcraft Transmissions
5a. CONTRACT NUMBER
5b. GRANT NUMBER
5c. PROGRAM ELEMENT NUMBER
6. AUTHOR(S)
Mark R Riggs, Nikhil K Murthy, and Stephen P Berkebile 5d. PROJECT NUMBER
5e. TASK NUMBER
5f. WORK UNIT NUMBER
7. PERFORMING ORGANIZATION NAME(S) AND ADDRESS(ES)
US Army Research Laboratory ATTN: RDRL-VTP Aberdeen Proving Ground, MD 21005-5066
8. PERFORMING ORGANIZATION REPORT NUMBER
ARL-TR-7815
9. SPONSORING/MONITORING AGENCY NAME(S) AND ADDRESS(ES)
10. SPONSOR/MONITOR'S ACRONYM(S)
11. SPONSOR/MONITOR'S REPORT NUMBER(S)
12. DISTRIBUTION/AVAILABILITY STATEMENT
Approved for public release; distribution is unlimited. 13. SUPPLEMENTARY NOTES
14. ABSTRACT
During a loss of lubrication event, gears and bearings no longer receive the proper amount of oil to prevent starved lubrication between contacting surfaces. This starved lubrication condition increases heat generation and decreases heat dissipation to facilitate a scuffing failure mode within the gear mesh. The time between the beginning of a loss of lubrication event and the initiation of scuffing is referred to as the time to failure. While a loss of lubrication condition can lead to catastrophic failure, the time to failure can be extended by varying the physical and chemical properties of the material and residual lubricant. This report compares the relative time to failure during loss of lubrication conditions for three 9310 gear steel surfaces: pristine as-ground, which serves as the baseline surface, as-ground with black oxide, and superfinished. Experiments are conducted using Mobil Jet II and AeroShell 555 rotorcraft lubricants with a ball-on-disc tribometer to simulate contact conditions relevant to rotorcraft transmissions experiencing loss of lubrication. The ball-on-disc tribometer monitors the coefficient of friction within the contact, and scuffing initiation is indicated by a sharp rise in the coefficient of friction. The results from high-speed loss of lubrication evaluations showed that a superfinished surface was able to delay the initiation of scuffing by up 13 times longer than an as-ground surface, while the black oxide showed a modest 14% improvement. 15. SUBJECT TERMS
loss of lubrication, LoL, black oxide, ISF, as-ground, scuffing, gears, rotorcraft, superfinishing
16. SECURITY CLASSIFICATION OF: 17. LIMITATION OF ABSTRACT
UU
18. NUMBER OF PAGES
42
19a. NAME OF RESPONSIBLE PERSON
Mark R Riggs a. REPORT
Unclassified b. ABSTRACT
Unclassified c. THIS PAGE
Unclassified 19b. TELEPHONE NUMBER (Include area code)
410-278-9604 Standard Form 298 (Rev. 8/98)
Prescribed by ANSI Std. Z39.18

Approved for public release; distribution is unlimited. iii
Contents
List of Figures iv
List of Tables v
Acknowledgments vi
1. Introduction 1
2. Procedure 2
2.1 Test Apparatus 2
2.2 Materials 3
2.3 Experimental Protocols 4
2.3.1 Load Capacity Protocol 4
2.3.2 Loss-of-Lubrication Protocol 5
2.3.3 Friction Mapping Protocol 7
2.4 Test Matrices 9
3. Results and Discussion 10
3.1 Load Capacity 10
3.2 Loss of Lubrication 11
3.2.1 High Speed 12
3.2.2 Mobil Jet II 14
3.2.3 AeroShell 555 14
3.2.4 Low Speed 15
3.3 Friction Mapping 15
3.4 Microscope Analysis 21
4. Summary and Conclusions 25
5. References 27
Appendix. Low-Speed Loss of Lubrication Raw Data 29
List of Symbols, Abbreviations, and Acronyms 33
Distribution List 34

Approved for public release; distribution is unlimited. iv
List of Figures
Fig. 1 Ball-on-disc tribometer ..........................................................................3
Fig. 2 Slip percentage and entrainment velocity for the mapping procedure ..8
Fig. 3 Typical time trace of traction coefficient vs. time during an HS LoL experiment............................................................................................11
Fig. 4 Example HS LoL raw data plot focused on the loss of lubrication portion of the experiment .....................................................................12
Fig. 5 HS LoL times to failure .......................................................................13
Fig. 6 HS LoL times to failure with a truncated Y-axis .................................13
Fig. 7 Example friction map, black oxide (first run) ......................................16
Fig. 8 Contour map of friction data for black oxide (first run) ......................17
Fig. 9 Final contour map for black oxide (final run) ......................................18
Fig. 10 Final contour map for ISF ....................................................................18
Fig. 11 Final contour map for radially as-ground ............................................19
Fig. 12 Subtraction for the first and last black oxide maps ..............................20
Fig. 13 Subtraction of contour maps for the first and last ISF #2 maps...........20
Fig. 14 Subtraction for the first and last maps as-ground radial ......................21
Fig. 15 Color images of radially ground disc (left), black oxide disc (center), ISF #2 disc (right). The top of the image is the outside of the disc. Areas marked as invalid map were used for a mapping procedure but the protocol was not properly followed. ..............................................22
Fig. 16 Images of the radially ground (left), ISF #2 (center) and black oxide (right) discs after experimentation .......................................................23
Fig. 17 Roughness of mapping tracks ..............................................................25
Fig. A-1 Black oxide low-speed loss of lubrication (LS LoL) experimental results ...................................................................................................30
Fig. A-2 Isotropic superfinishing (ISF) LS LoL experimental results ...............30
Fig. A-3 As-ground radial LS LoL experimental results ...................................31
Fig. A-4 As-ground circumferential LS LoL experimental results ....................31

Approved for public release; distribution is unlimited. v
List of Tables
Table 1 Surface materials process summary .......................................................4
Table 2 Load capacity protocol velocity conditions ...........................................4
Table 3 Load capacity protocol load stages ........................................................5
Table 4 HS LoL steady state conditions .............................................................6
Table 5 Original LS LoL loading progression during run-in ..............................6
Table 6 Revised load stages for the LS LoL protocol.........................................7
Table 7 HS LoL experiment matrix ....................................................................9
Table 8 LS experiment matrix ............................................................................9
Table 9 Load capacity results............................................................................10
Table 10 Roughness of mapping tracks ..............................................................24
Table A-1 LS LoL experimental results ................................................................32

Approved for public release; distribution is unlimited. vi
Acknowledgments
We would like to thank Brian Rich and his group at the Aviation Engineering Directorate/US Army Research, Development, and Engineering Command for his helpful suggestions and questions during review of this report. We would also like to thank Wedeven Associates, Inc., for their suggestions and comments in developing some of the protocol conditions.

Approved for public release; distribution is unlimited. 1
1. Introduction
A potential failure mode of interest in rotorcraft transmissions, “loss of lubrications” refers to the interruption of lubricant supply to one or more elements of the drive system, may result from one of many causes including ballistic impact. The US Army requires rotorcraft transmissions and gearboxes to be capable of operating for 30 min from the time the lubricant low-level warning system is activated, according to the US Army Aeronautical Design Standard (ADS)-50-PRF 5-4.3.5.1 The operating requirement aims to allow improperly lubricated gearboxes to sustain flight for an emergency landing.
Meeting the ADS-50-PRF requirement is challenging because metal-to-metal asperity contact between previously lubricated surfaces rapidly leads to scuffing. While the mechanism behind scuffing is not fully understood, it is thought to be caused by high sliding velocities and contact stresses, which produce intense frictional heating and localized welding.2 Additionally, losing the lubricant supply removes the mechanism responsible for dissipating frictional heat from the contacting surfaces through bulk lubricant flow. The combination of heat generation without the ability to dissipate the heat leads to a thermal runaway in the mechanical component. While there are several possible points of failure within the system due to a loss of lubrication event, this study chooses to focus on the effects within a gear mesh. Thermal runaway results in significant wear, through material loss and material transfer between gear teeth, and in plastic deformation. Plastic deformation results in a loss of the teeth’s profiles and the inability to transmit torque, which often leads to destruction of the component and loss of drive.3 One possible solution to increasing the time to scuffing is by varying the physical and chemical properties of the material and residual lubricant.
To evaluate this approach, 3 different types of American Iron and Steel Institute (AISI) 9310 gear steel surfaces, which is a common gear material for rotorcraft transmissions, were evaluated under a loss of lubrication condition. The surfaces are pristine as-ground, as-ground with black oxide, and superfinished. The pristine as-ground surface is a ground surface without additional treatment or wear. The black oxide and superfinishing processes are both surface treatments applied to pristine as-ground surfaces, which makes it a relevant baseline for comparison. Black oxide is commonly used in gearing systems as a surface treatment for corrosion resistance. Because of this, it is also a common surface treatment for qualification testing under the ADS-50-PRF by default. Superfinishing is evaluated

Approved for public release; distribution is unlimited. 2
because it creates a smooth surface to reduce asperity interaction within the boundary lubrication condition resulting from residual oil films on the steel surfaces.
2. Procedure
Gear contact conditions are simulated using a ball-on-disc tribometer to evaluate AISI 9310 aerospace gear steel samples with 3 evaluation protocols. Multiple protocols were conducted to give a well-rounded evaluation of the black oxide and superfinished surface treatments with respect to the pristine as-ground surface. The test apparatus, materials, and protocols are explained in Sections 2.1, 2.2, and 2.3, respectively.
2.1 Test Apparatus
The equipment used to evaluate the surfaces was a ball-on-disc tribometer.4 A ball-on-disc tribometer is capable of simulating gear contacts at high speed and high load with precise control over the operating conditions. Independent control of vertical load, oil flow, entrainment velocity, slip percentage, and geometric orientations enables the ball-on-disc tribometer to flexibly simulate gear and bearing contacts in a controlled and focused environment. The ball-on-disc tribometer specimen configuration is shown in Fig. 1, where the ball linear velocity (Ub) and disc linear velocity (Ud) are controlled with independent motors to create entrainment velocities (Ue) with controlled slip percentages (i.e., slide-to-roll ratios). The entrainment velocity is defined as the average of the ball and disc linear velocities and the slip percentage is the difference in ball and disc velocities divided by the average, as shown in Eq. 1. The ball thermocouple (Tb) and disc thermocouple (Td) give temperature readings of the specimen surface or the oil film, if one is present. When the ball and disc are rotating, the thermocouples remain stationary as they ride along the moving surfaces. An additional controlled parameter is the skew angle, which is the relative angle between the linear sliding velocities of the ball and disc. The orientation shown in Fig. 1 has a skew of 0° where the ball and disc linear velocities are parallel. Additional information regarding the ball-on-disc tribometer working envelope and geometric construction can be found in Riggs et al.4

Approved for public release; distribution is unlimited. 3
Fig. 1 Ball-on-disc tribometer
𝑆𝑆𝑆𝑆𝑆𝑆𝑆𝑆 𝑃𝑃𝑃𝑃𝑃𝑃𝑃𝑃𝑃𝑃𝑃𝑃𝑃𝑃𝑃𝑃𝑃𝑃𝑃𝑃 (%) = 𝑈𝑈𝑏𝑏−𝑈𝑈𝑑𝑑12� (𝑈𝑈𝑏𝑏+𝑈𝑈𝑑𝑑)
= 𝑈𝑈𝑏𝑏−𝑈𝑈𝑑𝑑𝑈𝑈𝑒𝑒
∗ 100% . (1)
2.2 Materials
The base material for the balls and discs is AISI 9310 alloy steel lubricated with Mobil Jet II (MJII) or AeroShell 555 (A555). AISI 9310 was chosen because it is a common gear material in rotorcraft transmissions. The balls are typically 20.64 mm in diameter and the standard disc diameter is 109.7 mm. MJII is a MIL-PRF-236995 oil formulated as a gas turbine lubricant and A555 is a DOD-PRF-857346 oil that is formulated with a higher extreme pressure requirement for helicopter transmissions. While MJII is a gas turbine oil, it is used because of its historical use within the development of ball-on-disc protocols for high-speed conditions and its ability to distinguish between surfaces that otherwise would have all performed well with the extreme pressure additives of A555. The balls and discs are case carburized to a Rockwell C hardness of HRC 61 ± 2.5. There are 2 types of pristine as-ground discs that are used as a baseline, where pristine refers to the as-ground surface’s lack of treatment or wear. The 2 types are distinguished by the dissimilar grinding lay directions: radial and circumferential. The circumferentially ground disc results in a surface velocity parallel to its grinding lay when the ball and disc surface velocities are parallel. The radially ground disc results in a surface velocity perpendicular to its grinding lay when the ball and disc surface velocities are parallel. The different grinding lays allow us to consider the orientation of the lay with respect to entrainment velocity with similar average surface roughness, Sa, values of 148 nm and 175 nm. The black oxide treatment, processed according to

Approved for public release; distribution is unlimited. 4
an original equipment manufacturer process, and isotropic superfinishing (ISF) treatment, processed by REM Surface Engineering, were applied to radially ground discs and a corresponding set of as-ground balls. The ISF specimens had an Sa roughness value averaging to be 55 nm. A competitor process for improved surface finish, micro machining process (MMP) superfinished by MicroTek, was also compared. The MMP specimens had an average disc Sa roughness of 24 nm. Detailed surface roughness values before and after testing are given in the microscope analysis section. It should be noted that there were three 9310 discs that were all superfinished with an ISF treatment; ISF #1 and ISF #3 were treated with an aerospace process, and ISF #2 was treated with an automotive process. A summary of the discs used within this paper and their process differences are shown below in Table 1.
Table 1 Surface materials process summary
Disc Grinding lay Process notes Sa (nm)
Black oxide Radial Boeing HP4-50 190
Superfinished Circumferential
ISF #1 (Aerospace) 52 ISF #2 (Automotive) 76 ISF #3 (Aerospace) 36
MMP 24
As-ground Radial None 148 Circumferential None 175
2.3 Experimental Protocols
The 3 evaluation protocols used to simulate relevant contact conditions are the load capacity (LC), loss-of-lubrication (LoL), and mapping protocols.
2.3.1 Load Capacity Protocol
The first performance evaluation is the LC protocol. This experiment acts as a screening test to evaluate the ability of the lubricant and material to support the stress at which the LoL protocol is run to survive the run-in portion of the LoL experiment. The LC protocol is run with the velocity parameters listed in Table 2 with increasing load stages, shown in Table 3, until scuffing initiation. If a scuff is not produced by stage 30, the contact is unloaded and its LC is determined to be greater than or equal to 2.38 GPa.
Table 2 Load capacity protocol velocity conditions
Description Entrainment velocity (m/s)
Slip (%)
Skew (°)
LC 7 71.4 39.3
Approved for public release; distribution is unlimited. 5
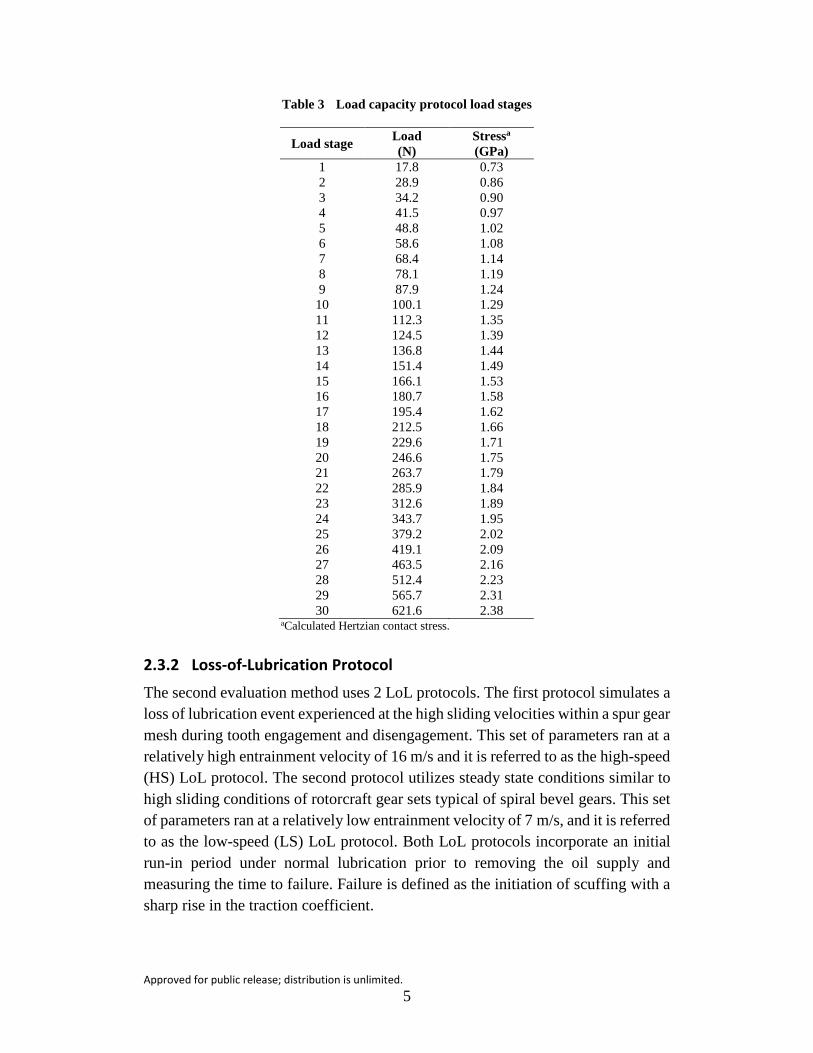
Table 3 Load capacity protocol load stages
Load stage Load (N)
Stressa (GPa)
1 17.8 0.73 2 28.9 0.86 3 34.2 0.90 4 41.5 0.97 5 48.8 1.02 6 58.6 1.08 7 68.4 1.14 8 78.1 1.19 9 87.9 1.24
10 100.1 1.29 11 112.3 1.35 12 124.5 1.39 13 136.8 1.44 14 151.4 1.49 15 166.1 1.53 16 180.7 1.58 17 195.4 1.62 18 212.5 1.66 19 229.6 1.71 20 246.6 1.75 21 263.7 1.79 22 285.9 1.84 23 312.6 1.89 24 343.7 1.95 25 379.2 2.02 26 419.1 2.09 27 463.5 2.16 28 512.4 2.23 29 565.7 2.31 30 621.6 2.38
aCalculated Hertzian contact stress.
2.3.2 Loss-of-Lubrication Protocol
The second evaluation method uses 2 LoL protocols. The first protocol simulates a loss of lubrication event experienced at the high sliding velocities within a spur gear mesh during tooth engagement and disengagement. This set of parameters ran at a relatively high entrainment velocity of 16 m/s and it is referred to as the high-speed (HS) LoL protocol. The second protocol utilizes steady state conditions similar to high sliding conditions of rotorcraft gear sets typical of spiral bevel gears. This set of parameters ran at a relatively low entrainment velocity of 7 m/s, and it is referred to as the low-speed (LS) LoL protocol. Both LoL protocols incorporate an initial run-in period under normal lubrication prior to removing the oil supply and measuring the time to failure. Failure is defined as the initiation of scuffing with a sharp rise in the traction coefficient.

Approved for public release; distribution is unlimited. 6
2.3.2.1 High-Speed Loss-of-Lubrication Protocol
The HS LoL protocol begins with a run-in period followed by a period of operation without oil. The entrainment velocity, slip percentage, skew, and load are held constant throughout a 10-min lubricated run-in period according to the parameters in Table 4. Thermal parameters are also controlled to operate with a disc temperature of 126 °C and the lubricant is also independently heated to 126 °C to avoid cooling the disc. Once the run-in period is completed, the oil supply is removed and the operating conditions in Table 4 are held constant until a sharp rise in the traction coefficient indicates the initiation of a scuffing failure. The HS LoL protocol is well developed and further discussion on this protocol can be found in Riggs et al.7.
Table 4 HS LoL steady state conditions
Description Entrainment
velocity (m/s)
Slip (%)
Skew (°)
Load (N)
Contact stress (GPa)
LoL 16 –100 0 100 1.29
2.3.2.2 Low-Speed Loss-of-Lubrication Protocol
The LS LoL protocol presented several challenges to provide unbiased results and it continues to be in the development stage. As in the HS LoL protocol, the LS LoL protocol also begins with a run-in period followed by a period of operation without oil, but a load schedule is adopted as shown in Table 5, rather than a single load. The velocity parameters are the same as the LC protocol, as shown in Table 2.
Table 5 Original LS LoL loading progression during run-in
Stage Elapsed time (s)
Load (N)
Stress (GPa)
1 60 20 0.76 2 60 40 0.95 3 60 60 1.09 4 60 80 1.20 5 60 100 1.29 6 60 120 1.38 7 450 140 1.45
Thermal parameters were controlled in the same way as the HS LoL protocol, but additional oil mitigation was necessary. When the oil supply was removed during the LoL stage, unwanted excess oil from the center of the disc still entered the contact. To solve this issue, the following process was adopted. Before starting the LoL portion of the LS LoL protocol, the contact was unloaded and the lubricant supply was turned off. The ball and disc were allowed to spin for 30 s to remove

Approved for public release; distribution is unlimited. 7
excess oil and then the motors were shutdown. Residual lubricant was physically wiped out of the oil slinger at the center of the disc and the test was resumed by bringing the motors back up to speed and loading the contact. The beginning of the LoL event was recorded as the moment 140 N was reached in the contact after reloading. This cleaning process resulted in additional load stages, which are presented in Table 6. The LS LoL protocol is under development because areas of concern developed for further oil mitigation requirements. In addition, a possible dependence on track diameter was observed that further highlighted the underdeveloped status of the LS LoL protocol. Therefore, these results are presented in the Appendix.
Table 6 Revised load stages for the LS LoL protocol
Stage Elapsed time (s)
Load (N)
Stress (GPa)
1 60 20 0.76 2 60 40 0.95 3 60 60 1.09 4 60 80 1.20 5 60 100 1.29 6 60 120 1.38 7 450 140 1.45 8 30 0 0 9 Until failure 140 1.45
2.3.3 Friction Mapping Protocol
Mapping experiments supplement the LoL data by showing a map of frictional behavior over a wide range of entrainment velocities and slide-to-roll ratios.8 This procedure provides data on friction across the gear tooth mesh, the operational speeds for different friction regimes (mixed, elastohydrodynamic), and the effects of running-in wear on the surface. The ball and disc velocity vectors are set to 0° (skew = 0°) with a 144-N load (1.46 GPa), and a disc temperature of 126 °C with an oil temperature of 80 °C. The slip percentage is ramped linearly from 0.02% to 102% over 90 s at an entrainment velocity of 8 m/s, held for 10 s at 8 m/s and 102% slip, and ramped back to 0.02% at 8 m/s. Once this ramp cycle is complete, the entrainment velocity is decreased 1 step, held for 10 s, and the ramp is repeated. This procedure continues for all entrainment velocity values shown in Fig. 2. Once all of the entrainment velocity steps are complete, one map has been created. A standard mapping protocol runs 5 maps on the same track to compare the friction values across maps to determine the extent of running-in during operation.

Approved for public release; distribution is unlimited. 8
Fig. 2 Slip percentage and entrainment velocity for the mapping procedure
Time (Seconds)
500 1000 1500 2000 2500 3000 3500
Slip
Per
cent
age
(%)
0
10
20
30
40
50
60
70
80
90
100
Time (Seconds)
0 500 1000 1500 2000 2500 3000 3500
Ent
rain
men
t Vel
ocity
(m/s
)
-1
0
1
2
3
4
5
6
7
8
9

Approved for public release; distribution is unlimited. 9
2.4 Test Matrices
Although 3 evaluation protocols are used, the main focus of the project is the LoL performance. Five repetitions are typically devoted to LoL experiments for each set of surfaces. This is because of their tendency to have a relatively large variance among experimental groupings due to inherent variability. For the high-speed parameters, only LoL performance was evaluated. The high-speed test matrix, shown in Table 7, allows for a comparison within different subsets of experimental variables through 2 oils, grinding lays, and superfinishing techniques. The black oxide was tested 3 times due to a limited materials supply and MMP with A555 was tested 7 times to gain additional confidence in the dramatic results. Three types of evaluations were done at low speed: 1) LC, 2) LoL, and 3) friction mapping as shown in Table 8. One repetition was devoted to each of the LC and friction mapping experiments as secondary evaluations and inherent repeatability.
Table 7 HS LoL experiment matrix
Surface Lubricant Repetitions
Circumferential as-ground MJII 5 A555
Radial as-ground MJII 5 A555
Black oxide MJII 5 A555 3
ISF #1, 3 MJII 5 A555
MMP MJII 5 A555 7
Table 8 LS experiment matrix
Surface Test Repetitions
Radial as-ground Load capacity 1
LS LoL 5 Friction mapping 1
Black oxide Load capacity 1
LS LoL 5 Friction mapping 1
ISF #2 Load capacity 1
LS LoL 5 Friction mapping 1

Approved for public release; distribution is unlimited. 10
Color microscope images were taken of the low-speed experiments on each disc after evaluation using a Zeiss LSM700 confocal microscope. Surface profiles of 2 regions were taken: the unaffected disc area and an area within the wear tracks left by the mapping protocol. These images were taken using a 50× lens with a numerical aperture of 0.95. The surface roughness, Sa, was calculated according to International Organization for Standardization (ISO) 25178 and was taken as the average of 3 separate 128- × 128-μm surface profiles.9
3. Results and Discussion
The results for the test matrix are presented by test protocol. Discussion follows each set of results for the experimental protocols to compare among surface finishes.
3.1 Load Capacity
The experimental results for the LC protocol are given as the load stage where failure is initiated. Failure is indicated by the traction coefficient increasing rapidly above 0.15 as scuffing initiates. If failure is not observed during the experiment, it is described as having “run out”. Each LC experiment was run with 9310 steel and MJII oil at the conditions given in Table 2.
Most LC experiments operated successfully through the maximum load stage of 622 N (2.38 GPa), as shown in Table 9. The black oxide failed one stage before reaching the maximum load stage, 566 N (2.31 GPa), for the first repetition and it completed all load stages for the second repetition. This result is consistent with the authors’ previous experience, as it is not uncommon for the failures to be observed at bordering load stages as additional experiments are conducted. We can conclude that the as-ground, ISF, and black oxide surfaces are capable of a load carrying capacity of 140 N (1.45 GPa), which is used for the steady state condition in the LS LoL protocol. Additionally, much higher loads can be sustained for all surfaces under these velocity and temperature conditions with MJII up to at least 566 N (2.31 GPa).
Table 9 Load capacity results
Experiment no. Surface finish Failure load stage (Stage #)
Failure load (N)
655 As-ground: radial Run-out N/A 712 As-ground: circumferential Run-out N/A 671 ISF Run-out N/A 675 Black oxide 29 566 707 Black oxide Run-out N/A

Approved for public release; distribution is unlimited. 11
3.2 Loss of Lubrication
The experimental results for the LoL protocol are given in the form of elapsed time from the oil supply shutoff until failure, called “time to failure”. Failure is defined by a rapid increase in the traction coefficient, which indicates scuffing initiation. An example HS LoL experiment, which is also applicable to LS LoL experiments, is shown in Fig. 3 with a zoomed-in view on the LoL portion of the experiment in Fig. 4. The sudden rise in the traction coefficient toward the beginning of the experiment corresponds with the ball entering contact with the disc and beginning the 10-min run-in period. The traction coefficient stabilizes a few seconds after contact and remains relatively constant throughout run-in. After the 10-min run-in period, the lubrication supply is shutoff and the time to failure begins. The traction coefficient steadily rises until a sharp increase indicates scuffing initiation. The experiment in Fig. 4 lasted 59.7 s before failure.
Fig. 3 Typical time trace of traction coefficient vs. time during an HS LoL experiment

Approved for public release; distribution is unlimited. 12
Fig. 4 Example HS LoL raw data plot focused on the loss of lubrication portion of the experiment
3.2.1 High Speed
The HS LoL protocol experiments summarized in Table 7 were evaluated and the results are shown in Figs. 5 and 6 with standard error bars. While the results for MJII and A555 are given in the same figures, the discussions are separated to focus on the differences caused by the 9310 steel surfaces. The observations and analysis for the LoL results require data concerning the surface roughness, which are taken from the microscope analysis section.

Approved for public release; distribution is unlimited. 13
Fig. 5 HS LoL times to failure
Fig. 6 HS LoL times to failure with a truncated Y-axis
0
200
400
600
800
1000
1200
Circ
umfe
rent
ial
As-G
roun
d
Radi
alAs
-Gro
und
Blac
k O
xide ISF
MM
P
Circ
umfe
rent
ial
As-G
roun
d
Radi
alAs
-Gro
und
Blac
k O
xide IS
F
MM
P
MJII A555
Tim
e to
Fai
lure
(s)
Surface Finish and Lubricant
High Speed Loss of Lubrication with 9310
0
50
100
150
200
250
Circ
umfe
rent
ial
As-G
roun
d
Radi
alAs
-Gro
und
Blac
k O
xide ISF
MM
P
Circ
umfe
rent
ial
As-G
roun
d
Radi
alAs
-Gro
und
Blac
k O
xide IS
F
MM
P
MJII A555
Tim
e to
Fai
lure
(s)
Surface Finish and Lubricant
High Speed Loss of Lubrication with 9310

Approved for public release; distribution is unlimited. 14
3.2.2 Mobil Jet II
The first major observation about the MJII data is the circumferentially as-ground surface could not reliably run-in without a scuffing failure. Because the LoL protocol could not reach the end of the run-in period without a scuffing failure, the circumferentially as-ground surface does not have time-to-failure data. In addition, 1 of the 5 tracks on the radially as-ground disc also did not survive run-in without scuffing. The second major observation is that the average time to failure for the superfinished sample was 3 times longer than the black oxide surface. This is because the smoother surface contributes substantially fewer asperity contacts to initiate scuffing within the residual fluid film lubrication contact. The third main observation is that the ISF #1 and MMP surfaces produced very similar times to failure despite the mixed lubrication regime for ISF #1 and the full film lubrication regime for MMP during run-in. The ISF #1 surface had an Sa roughness value of 52 nm compared to the MMP value of 24 nm. The surface roughness is important when considering the contact lubrication regime, as suggested by the lambda ratio. The lambda ratio was calculated with the minimum film thickness for the HS LoL parameters, using the Hamrock Dowson equation, divided by the composite surface roughness. Because the ball roughness was not measured, the composite surface roughness is assumed to be equal to the Sa values for each disc measurement on the pristine surface, 24 nm and 52 nm for the MMP and ISF #1 surfaces, respectively. The resulting lambda ratios are 4.5 and 2.1 for the MMP and ISF #1 surfaces, respectively. Typically, the mixed lubrication regime is estimated to start when the lambda ratio has a value below 3. A lambda value higher than 3 indicates a full film lubricated contact. The similar times to failure for MMP and ISF #1 indicate the difference in surface roughness between the 2 superfinished contacts does not have a large influence on the time to failure for MJII.
3.2.3 AeroShell 555
The first major observation about the A555 data in Figs. 5 and 6 is that the MMP surface lubricated with A555 has a significantly longer time to failure than all other combinations of surfaces and lubricants. This could be because of a combination of a smoother surface with an Sa roughness of 24 nm for the disc, compared to 36 nm for the ISF #3 disc, and additives used in the A555 lubricant formulation to pass the DOD-85734 specification. The lambda ratio was found to be 3.0 for the ISF #3 contact and 4.5 for the MMP contact. Without further study, we can currently only speculate that the slightly higher lambda ratio, which lies securely within the full film lubrication regime during run-in, may have been enough to allow the A555 extreme pressure additives to perform toward their full potential. The borderline mixed lubrication regime during run-in for the ISF #3 surface may have not allowed

Approved for public release; distribution is unlimited. 15
the extreme pressure additives to form the chemically induced protective barrier on the surface needed to produce a relatively long time to failure. Alternatively, perhaps there is a deeper chemical interaction between the steel surface and the lubricant that is being promoted by the MMP or hindered by the ISF process. These hypotheses are speculative and would need further experimental exploration to prove or disprove. The second major observation is a negligible difference between the circumferentially as-ground and radially as-ground times to failure. This is likely because of similar surface roughnesses that all cause a mixed lubrication regime during run-in. For example, a composite surface roughness, Sa, of 150 nm, similar to the radially ground disc, results in a lambda value of 0.73, which is well below the general guideline of 3 for a full film contact. The third observation is that black oxide lasts on average longer than pristine as-ground surfaces. This result is interesting in light of the increase in surface roughness during the black oxide process.
3.2.4 Low Speed
While the experimental results for the HS LoL experiments are presented within the body of this report, the raw data for the LS LoL experiments are included in the Appendix because of its underdeveloped protocol. The Appendix shows that the LS LoL protocol traction coefficient behavior varies between different surface treatments. The ISF traction coefficient generally increases to failure once lubrication has been removed, while the black oxide and as-ground surfaces increase and decrease in traction coefficient. This traction coefficient behavior may indicate the activation of lubricant chemistry when increasing asperity contact occurs as the residual oil film thickness diminishes over time. The LS LoL protocol is not fully developed and provided indications that the results may be biased in terms of track diameter. The HS LoL time-to-failure protocol is quite mature and has been compared favorably to more complex gear evaluations, leading us to have confidence in its ability to distinguish scuffing resistance performance in a loss of lubrication condition.
3.3 Friction Mapping
Friction maps provide a measurement of friction that can be expected across the gear mesh for different operational speeds throughout the mixed to elastohydrodynamic lubrication regimes. Differences in subsequent friction maps can be used to characterize the running-in process. The friction map data have been recorded for both increasing and decreasing slip values. We will be using the portion of the data when the slip percentage is increasing to be consistent and avoid possible hysteresis caused by additional run-in. This is why each plot is labeled

Approved for public release; distribution is unlimited. 16
with the test number followed by “Increase.” The first black oxide map is shown as an example in Fig. 7, with the traction coefficient plotted against the entrainment velocity and slip percentage. To view traction values for specific parameters and decipher small changes in the traction coefficient, a contour map is used, such as Fig. 8. In general, entrainment velocity correlates with rotational velocity of a gear pair, while slip percentage correlates with position in the gear mesh along the profile of the gear tooth. The pitch point in a gear contact correlates to a slip of 0%. These maps correspond to spur gear contacts since the relative surface velocities are all parallel.8
Fig. 7 Example friction map, black oxide (first run)
10080
60
Slip (%)
40
Test #0682 Increase
200
Entrainment velocity (m/s)
8
6
4
2
0.04
0.1
0.08
0.06
0.02
0
0
Trac
tion
coef
ficie
nt

Approved for public release; distribution is unlimited. 17
Fig. 8 Contour map of friction data for black oxide (first run)
The traction coefficient contour plots of the final, fifth, map for each surface are shown in Figs. 9–11. The traction coefficient in all 3 cases displays typical features: a rapid increase at low slip across all entrainment velocities, a large relatively flat area throughout most entrainment velocities indicating elastohydrodynamic lubrication, and an increase at low entrainment velocities across nearly all slip values, indicating the mixed lubrication regime where asperity contact occurs. These absolute traction coefficients show the ISF #2 surface has the lowest traction coefficient at most entrainment velocities in the elastohydrodynamic lubrication regime. However, the black oxide surface has the lowest traction coefficient at low entrainment velocity in the mixed lubrication regime. The final traction coefficients at low entrainment velocities seem to correlate to the roughness measured on the final experiment tracks, as shown in the microscope analysis section, since the black oxide is smoothest after running-in. This is because, at lower entrainment velocities, the roughness has a larger effect on the traction coefficient due to operation firmly in the mixed lubrication regime. The smaller differences in traction coefficient at higher entrainment velocities among the different surfaces is presumably due to reduction of asperity contact during operation in or closer to the elastohydrodynamic lubrication regime in which the lubricant film more fully separates the surfaces.
0.01 0.02 0.02 0.02 0.030.03 0.03 0.030.04 0.04 0.040.05 0.050.060.06
0.06
0.06
0.06
0.06
0.07
0.07
0.07
0.080.08
Test #0682 Increase
Entrainment velocity (m/s)
1 2 3 4 5 6 7
Slip
(%)
10
20
30
40
50
60
70
80
90

Approved for public release; distribution is unlimited. 18
Fig. 9 Final contour map for black oxide (final run)
Fig. 10 Final contour map for ISF
0.01 0.010.02 0.020.02 0.03 0.03 0.030.04 0.040.050.05
0.05
0.05
0.060.06
0.06
0.07
Test #0686 Increase
Entrainment velocity (m/s)
1 2 3 4 5 6 7
Slip
(%)
10
20
30
40
50
60
70
80
90
0.01 0.010.02 0.020.030.03
0.03
0.04
0.04
0.04
0.05
0.05
0.06
0.06
0.070.07
Test #0706 Increase
Entrainment velocity (m/s)
1 2 3 4 5 6 7
Slip
(%)
10
20
30
40
50
60
70
80
90
Approved for public release; distribution is unlimited. 19
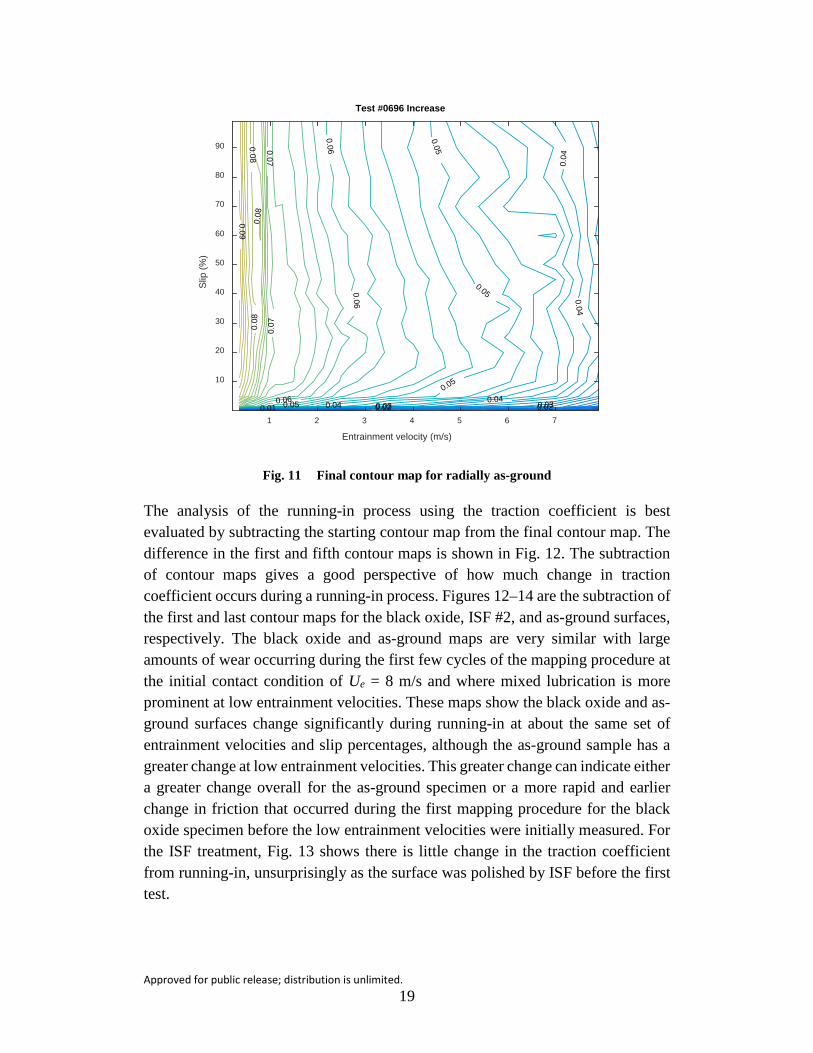
Fig. 11 Final contour map for radially as-ground
The analysis of the running-in process using the traction coefficient is best evaluated by subtracting the starting contour map from the final contour map. The difference in the first and fifth contour maps is shown in Fig. 12. The subtraction of contour maps gives a good perspective of how much change in traction coefficient occurs during a running-in process. Figures 12–14 are the subtraction of the first and last contour maps for the black oxide, ISF #2, and as-ground surfaces, respectively. The black oxide and as-ground maps are very similar with large amounts of wear occurring during the first few cycles of the mapping procedure at the initial contact condition of Ue = 8 m/s and where mixed lubrication is more prominent at low entrainment velocities. These maps show the black oxide and as-ground surfaces change significantly during running-in at about the same set of entrainment velocities and slip percentages, although the as-ground sample has a greater change at low entrainment velocities. This greater change can indicate either a greater change overall for the as-ground specimen or a more rapid and earlier change in friction that occurred during the first mapping procedure for the black oxide specimen before the low entrainment velocities were initially measured. For the ISF treatment, Fig. 13 shows there is little change in the traction coefficient from running-in, unsurprisingly as the surface was polished by ISF before the first test.
0.01 0.02 0.020.03 0.030.04 0.04
0.04
0.04
0.05
0.05
0.05
0.05
0.06
0.06
0.06
0.07
0.07
0.08
0.08
0.08
0.09
Test #0696 Increase
Entrainment velocity (m/s)
1 2 3 4 5 6 7
Slip
(%)
10
20
30
40
50
60
70
80
90

Approved for public release; distribution is unlimited. 20
Fig. 12 Subtraction for the first and last black oxide maps
Fig. 13 Subtraction of contour maps for the first and last ISF #2 maps
-0.004-0.0020 00.002 0.0020.004 0.004 0.004
0.004
0.00
4
0.0060.006 0.006
0.006
0.0060.006
0.006
0.00
6
0.00
6
0.006
0.006
0.008
0.008
0.00
80.008
0.008
0.0080.0080.008
0.008
0.010.01
0.01
0.01
0.01
0.01
20.
012
0.012
0.01
20.014
0.01
4
0.014
0.01
6
0.016
0.01
80.
020.
022
0.02
4
Test #0682 - Test#0686 Increase
Entrainment velocity (m/s)
1 2 3 4 5 6 7
Slip
(%)
10
20
30
40
50
60
70
80
90
-0.0020
0
0
0
0
0 0
0
0
0
0
0
0
0
0
0
0
0
0.00
20.
002
0.00
2
0.00
20.004
0.00
4
0.006
Test #0702 - Test#0706 Increase
Entrainment velocity (m/s)
1 2 3 4 5 6 7
Slip
(%)
10
20
30
40
50
60
70
80
90

Approved for public release; distribution is unlimited. 21
Fig. 14 Subtraction for the first and last maps as-ground radial
3.4 Microscope Analysis
The mapping disc tracks were analyzed with a Zeiss LSM700 confocal microscope, as described in the procedure section. Color images of the disc samples, showing example test tracks, can be seen in Figs. 15 and 16. The tracks in Fig. 15 are labeled with a protocol abbreviation for reference (LC=load capacity, OO=Oil Out/Low-Speed Loss of Lubrication). The black oxide disc differs from the radially ground disc in appearance by the dark purplish hue of the oxide layer. Figure 15 shows that the coating is somewhat uneven with a varying hue across the surface of the disc. To give a perspective of the disc tracks, Fig. 16 shows a picture of all 3 discs after experimentation. The coloration of the discs did not change over the course of experimentation, with the exception of a scar produced from the point contact at each track diameter. The 3 discs used for microscope analysis were the discs used for the mapping experiments because these mapping tracks were not marred by a scuffing failure and they were able to be measured for a meaningful roughness value.
-0.0020 00.002 0.002
0.002
0.002
0.004 0.0040.004
0.004
0.004
0.004
0.00
4 0.004
0.004
0.0060.006 0.006
0.006
0.00
6
0.006
0.006
0.006
0.006
0.00
6
0.0080.008
0.008
0.00
8
0.00
80.
008
0.01
0.01
0.01
0.01
0.01
0.012
0.01
2
0.01
2
0.012
0.01
2
0.01
2
0.01
40.
014
0.014
0.014
0.01
4
0.0140.016
0.01
6
0.01
6
0.016
0.01
6
0.018
0.01
8
0.01
8
0.018
0.01
8
0.02
0.02
0.02
0.02
Test #0692 - Test#0696 Increase
Entrainment velocity (m/s)
1 2 3 4 5 6 7
Slip
(%)
10
20
30
40
50
60
70
80
90

Approved for public release; distribution is unlimited. 22
Fig. 15 Color images of radially ground disc (left), black oxide disc (center), ISF #2 disc (right). The top of the image is the outside of the disc. Areas marked as invalid map were used for a mapping procedure but the protocol was not properly followed.

Approved for public release; distribution is unlimited. 23
Fig. 16 Images of the radially ground (left), ISF #2 (center) and black oxide (right) discs after experimentation
One group of observations that can be made from the optical images are related to the surface topography. The untested portions of the discs contain features characteristic to the individual finishing processes. The radially ground discs, with and without black oxide, have large grind marks aligned along the radius, whereas the ISF #2 disc has nearly isotropic surface features. These surface topographies are worn away within the track formed by the point contact during experiments.
The experiment tracks can be seen as bands running perpendicular to the radius of the disc with varying affects to the topography. The tracks can be divided into 2 categories: tests that ended due to scuffing and tests that did not. The LS LoL experiments ended due to scuffing along with one of the black oxide LC experiments. The remaining LC experiments and all of the mapping experiments did not initiate a scuffing failure. The scuffed tracks are all very dark with large scratches and crater-like features due to the localized tearing. The original surface features are not recognizable on the scuffed tracks. The tracks without scuffing tend to have a slight browning of the surface. The surface also tends to have a much brighter and more polished appearance for the radially ground discs, with and without black oxide. There is a very subtle difference between the track and unaffected surface for the nonscuffed ISF #2 experiments. Features of the original finish can be seen within the ISF #2 track along with wear created during the experiment. The direction of scuffing can be seen at an angle for the oil out and LC tests due to the skew parameter. Scratches form circumferentially on the mapping tracks because the experiments were run with parallel surface velocities. Scuff marks were produced on the ISF #2 ball and disc similar to a dotted line along the tracks with a uniform spacing because of skipping between the ball and disc likely due to small vibrations in the tribometer. These are generally only observed on the smoothest of samples. Finally, the LC experiments produced wider tracks due to larger applied loads.

Approved for public release; distribution is unlimited. 24
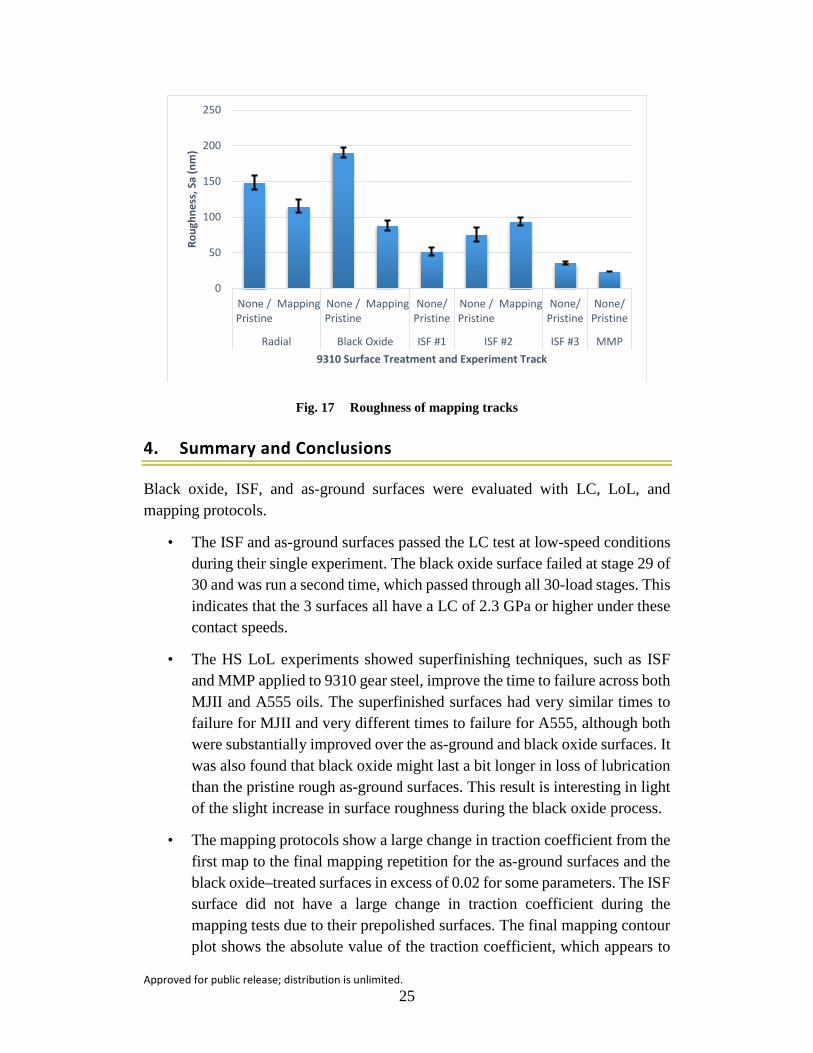
An important characteristic of the surface features is the roughness before and after experimentation. Table 10 and Fig. 17 show the arithmetic average of 3-D roughness, Sa, of the disc on the unaffected surface and the final surface roughness after the mapping experiment from the center of the tracks. In addition, the roughness values for each of the 3 ISF discs, as explained in the materials section, are given for reference across the ISF superfinished surfaces. The roughness of the unaffected ISF #2 surface is roughly half of the pristine radially ground and black oxide discs. The black oxide disc has a larger surface roughness than the radially ground disc due to the processing during coating. After the mapping experiments, the radially ground disc shows very little change in roughness, only decreasing 9% from Sa = 129 nm to Sa =117 nm. The black oxide disc had a much larger decrease in roughness, 62%, resulting in a final roughness lower than both the radially ground disc and the ISF #2 disc. The ISF #2 disc roughness actually increased to a value greater than the final black oxide roughness during the mapping procedure, although traction coefficient decreased.
Table 10 Roughness of mapping tracks
Disc Grinding lay Process notes Test Sa (nm)
Error (nm)
Sa
(μin) Error (μin)
Black oxide Radial Boeing HP4-50
None/pristine 190 7 4.83 0.18 Mapping 88 7 2.24 0.18
Superfinished Circumferential
ISF #1 (Aerospace) None/pristine 52 6 1.32 0.15
ISF #2 (Automotive)
None/pristine 76 10 1.93 0.25 Mapping 94 6 2.39 0.15
ISF #3 (Aerospace) None/pristine 36 2 0.91 0.05
MMP None/pristine 24 N/A 0.61 N/A
As-ground Radial None None/pristine 148 10 3.76 0.25
Mapping 115 9 2.92 0.23 Circumferential None None/pristine 175 16 6.89 0.63
Approved for public release; distribution is unlimited. 25
Fig. 17 Roughness of mapping tracks
4. Summary and Conclusions
Black oxide, ISF, and as-ground surfaces were evaluated with LC, LoL, and mapping protocols.
• The ISF and as-ground surfaces passed the LC test at low-speed conditions during their single experiment. The black oxide surface failed at stage 29 of 30 and was run a second time, which passed through all 30-load stages. This indicates that the 3 surfaces all have a LC of 2.3 GPa or higher under these contact speeds.
• The HS LoL experiments showed superfinishing techniques, such as ISF and MMP applied to 9310 gear steel, improve the time to failure across both MJII and A555 oils. The superfinished surfaces had very similar times to failure for MJII and very different times to failure for A555, although both were substantially improved over the as-ground and black oxide surfaces. It was also found that black oxide might last a bit longer in loss of lubrication than the pristine rough as-ground surfaces. This result is interesting in light of the slight increase in surface roughness during the black oxide process.
• The mapping protocols show a large change in traction coefficient from the first map to the final mapping repetition for the as-ground surfaces and the black oxide–treated surfaces in excess of 0.02 for some parameters. The ISF surface did not have a large change in traction coefficient during the mapping tests due to their prepolished surfaces. The final mapping contour plot shows the absolute value of the traction coefficient, which appears to
0
50
100
150
200
250
None /Pristine
Mapping None /Pristine
Mapping None/Pristine
None /Pristine
Mapping None/Pristine
None/Pristine
Radial Black Oxide ISF #1 ISF #2 ISF #3 MMP
Roug
hnes
s, S
a (n
m)
9310 Surface Treatment and Experiment Track

Approved for public release; distribution is unlimited. 26
show a correlation at low entrainment velocity between the traction coefficient and the surface roughness such that the traction coefficient is lower for surfaces that have a lower surface roughness after run-in.
Overall, the measurements demonstrate that superfinished specimens have the longest times to failure until the onset of scuffing at contact conditions representing the most critical high sliding portion of a gear mesh during a loss of lubrication event. The black oxide showed a slight improvement in loss of lubrication performance over its base radially ground counterpart, despite creating a rougher surface. This indicates the black oxide treatment may have a chemical effect that could also improve the survivability of a superfinished surface. We recommend evaluating a superfinished surface that has also been treated with black oxide to see if a cumulative effect can be achieved.
Approved for public release; distribution is unlimited. 27
5. References
1. ADS-50-PRF. Rotorcraft propulsion performance and qualification requirements and guidelines. St. Louis (MO): Army Aviation and Troop Command (US), 1996 Apr 15.
2. Davis J, editor. Gear materials, properties, and manufacture. Materials Park (OH): ASM International; 2005. Chapter 2, Gear tribology and lubrication; p. 19–38.
3. Transportation Safety Board of Canada. Main gearbox malfunction/collision with water: Cougar Helicopters Inc., Sikorsky S-92A, C-GZCH, St. John’s, Newfoundland and Labrador, 35 nm E, 12 March 2009. Gatineau (QC); 2010 Dec 29. Report No.: A09A0016.
4. Riggs M, Berkebile S, Hood A, Dykas B. Simulating army-relevant spur gear contacts with a ball-on-disc tribometer. Aberdeen Proving Ground (MD): Army Research Laboratory (US); 2015 Sep. Report No.: ARL-TR-7492.
5. MIL-PRF-23699G. Lubricating oil, aircraft turbine engine, synthetic base, NATO code numbers: O-152, O-154, O-156, and O-167. Lakehurst (NJ): Naval Air Warfare Center Aircraft Division (US); 2014 Mar 13.
6. DOD-PRF-85734A. Lubricating oil, helicopter transmission system, synthetic base. Patuxent River (MD): Naval Air Systems Command (US); 2004 June 29.
7. Riggs M, Berkebile S, Murthy N. Ball-on-disc tribometer's protocol development: loss of lubrication evaluation. Aberdeen Proving Ground (MD): Army Research Laboratory (US); 2016 Feb. Report No.: ARL-TR-7588.
8. Berkebile S, Murthy N. Friction mapping as a tool for measuring the elastohydrodynamic contact running-in process. Aberdeen Proving Ground (MD): Army Research Laboratory (US); 2015 Oct. Report No.: ARL-TR-7501.
9. ISO 25178 general product specification (GPS) – surface texture: areal – part 70: material measures. Geneva (Switzerland): International Organization for Standardization; 2014.

Approved for public release; distribution is unlimited. 28
INTENTIONALLY LEFT BLANK.

Approved for public release; distribution is unlimited. 29
Appendix. Low-Speed Loss of Lubrication Raw Data

Approved for public release; distribution is unlimited. 30
Fig. A-1 Black oxide low-speed loss of lubrication (LS LoL) experimental results
Fig. A-2 Isotropic superfinishing (ISF) LS LoL experimental results
Time (sec)
1000 1200 1400 1600 1800 2000 2200
Trac
tion
Coe
ffici
ent
0.035
0.04
0.045
0.05
0.055
0.06
0.065
0.07
0.075
data # =0676
data # =0678
data # =0679
data # =0680
data # =0681
Time (sec)
1000 1100 1200 1300 1400 1500
Trac
tion
Coe
ffici
ent
0.03
0.035
0.04
0.045
0.05
0.055
0.06
0.065
0.07
data # =0666
data # =0667
data # =0668
data # =0669
data # =0670

Approved for public release; distribution is unlimited. 31
Fig. A-3 As-ground radial LS LoL experimental results
Fig. A-4 As-ground circumferential LS LoL experimental results
Time (sec)
1000 1100 1200 1300 1400 1500 1600 1700 1800 1900
Trac
tion
Coe
ffici
ent
0.04
0.045
0.05
0.055
0.06
0.065
0.07
data # =0661
data # =0708
data # =0709
data # =0710
data # =0711
Time (sec)
1000 1100 1200 1300 1400 1500 1600
Trac
tion
Coe
ffici
ent
0.04
0.045
0.05
0.055
0.06
0.065
0.07
0.075
0.08
data # =0662
data # =0663
data # =0665
data # =0713
data # =0714

Approved for public release; distribution is unlimited. 32
Table A-1 LS LoL experimental results
Experiment no. Surface finish Time to failure (s)
Average time to failure
(s)
Error (±)
661
As-ground- radial
934
731 164 708 618 709 932 710 598 711 576 662
As-ground- circumferential
440
400 136 663 174 665 356 713 435 714 594 666
ISF
563
480 67 667 523 668 487 669 461 670 365 676
Black oxide
1158
853 214 678 1019 679 827 680 659 681 599

Approved for public release; distribution is unlimited. 33
List of Symbols, Abbreviations, and Acronyms
3-D 3-dimensional
A555 AeroShell 555
ADS Aeronautical Design Standard
AISI American Iron and Steel Institute
HS high speed
ISF isotropic superfinishing
ISO International Organization for Standardization
LC load capacity
LoL loss of lubrication
LS low speed
MJII Mobil Jet II
MMP micro machining process
Sa average surface roughness
Tb ball thermocouple
Td disc thermocouple
Ub ball linear velocity
Ud disc linear velocity
Ue entrainment velocity

Approved for public release; distribution is unlimited. 34
1 DEFENSE TECHNICAL (PDF) INFORMATION CTR DTIC OCA 2 DIRECTOR (PDF) US ARMY RESEARCH LAB RDRL CIO L IMAL HRA MAIL & RECORDS MGMT 1 GOVT PRINTG OFC (PDF) A MALHOTRA 3 DIR USARL (PDF) RDRL VTP M RIGGS N MURTHY S BERKEBILE