evaluating tourism marketing overview of key themes ... · pdf fileevaluating tourism...
TRANSCRIPT

Evaluating tourism marketing Overview of key themesSeptember 2012
©TNS 2012
KPIs for Tourism Marketing Evaluation – 2012 Handbook

What we will cover today…
1Landscape and strategic context
2Developing a framework for evaluating brand, response and ROI
3
©TNS 2012 2
3Key evaluation challenges for destinations and KPIs used
KPIs for Tourism Marketing Evaluation – 2012 Handbook

start
Stage
Preliminary desk research
• Including previous Handbook, E-Marketing Handbook and various other secondary data resources
ETC/UNWTO members’ survey
• Survey conducted
• Initial results analysed
ECM members’ survey
• Survey conducted
Initial structure of Handbook prepared
©TNS 2012
• Survey conducted
• Topline analysis conducted
In-depth interviews with key stakeholders
Draft Handbook
• Includes full analysis of all stages above – awaiting e-marketing results
Draft Handbook review
Final Handbook

Handbook inclusions
Key contents (not limited to):
Introduction (including the definition of marketing
Key Issues (including significant changes since the 2003 Handbook)
Approaches to Evaluation (General)
Current NTO Evaluation Techniques Inventory of known techniques used by NTOsResults of the ETC/UNTWO members survey
©TNS 2012
Results of the ETC/UNTWO members survey
Case Studies Tourism and non-tourism (if applicable)
Practical GuideModels and templates which NTOs could ‘lift off the page’, customise and use (i.e. specimen questionnaires and discussion guides etc.)

1Landscape and Strategic Context
©TNS 2012
KPIs for Tourism Marketing Evaluation – 2012 Handbook

The two key definitions…
Tourism marketing: promotion of destination through the range of marketing activities driven
by the tourism operator
©TNS 2012 6
Evaluation: the attempt to measure the impact that these promotional activities have on inbound
tourism to a destination
KPIs for Tourism Marketing Evaluation – 2012 Handbook

Evaluation needs to serve two key purposes
Continuously improveyour performance
Assess what you did
Look to both the past and the
future
‘The rear view mirror’ ‘the GPS’
©TNS 20127
� You need to be accountable for what you do
� Marketing activities require significant investment, and is therefore carefully scrutinised
� You to understand whether these activities are delivering on its objectives
� If not, you need to understand where any issues lie
� BUT accountability is only half the story
� By assessing what you did and learning what is most effective you can build a bank of knowledge
� That can ensure you achieve greater ROI in the future
KPIs for Tourism Marketing Evaluation – 2012 Handbook

Our world
©TNS 2012
Consumers are being turned off by one way conversation
What consumers are saying is shaping your brand
This requires both organisational and mind set change

The traditional marketing funnel
©TNS 2012
Depending on strategic context some DMOsfocus on specific parts of the customer journey. Strategic objectives, awareness and perception of the destination are all important factors
Source | Forrester | Engagement, a New Marketing Metric
KPIs for Tourism Marketing Evaluation – 2012 Handbook

In reality is a lot more complicated
©TNS 2012
Source | Forrester | Engagement, a New Marketing Metric
KPIs for Tourism Marketing Evaluation – 2012 Handbook

Path to purchase Path to purchase Which online or offline Which online or offline touchpointstouchpoints
did you use during the various did you use during the various
stages of the purchase cycle?stages of the purchase cycle?
Job number project name rpt/prop/ptn_FINALvc
11
� Finding the most efficient way to integrate and evaluate touchpoints

92%of UK online consumers research products online
88% Travel category dominates online research
59%
Job number project name rpt/prop/ptn_FINALvc 12
59%PC/Laptop users research a product/service they’d just seen advertised
Source: TNS Digital Life 2011 - UK (study of online consumers)
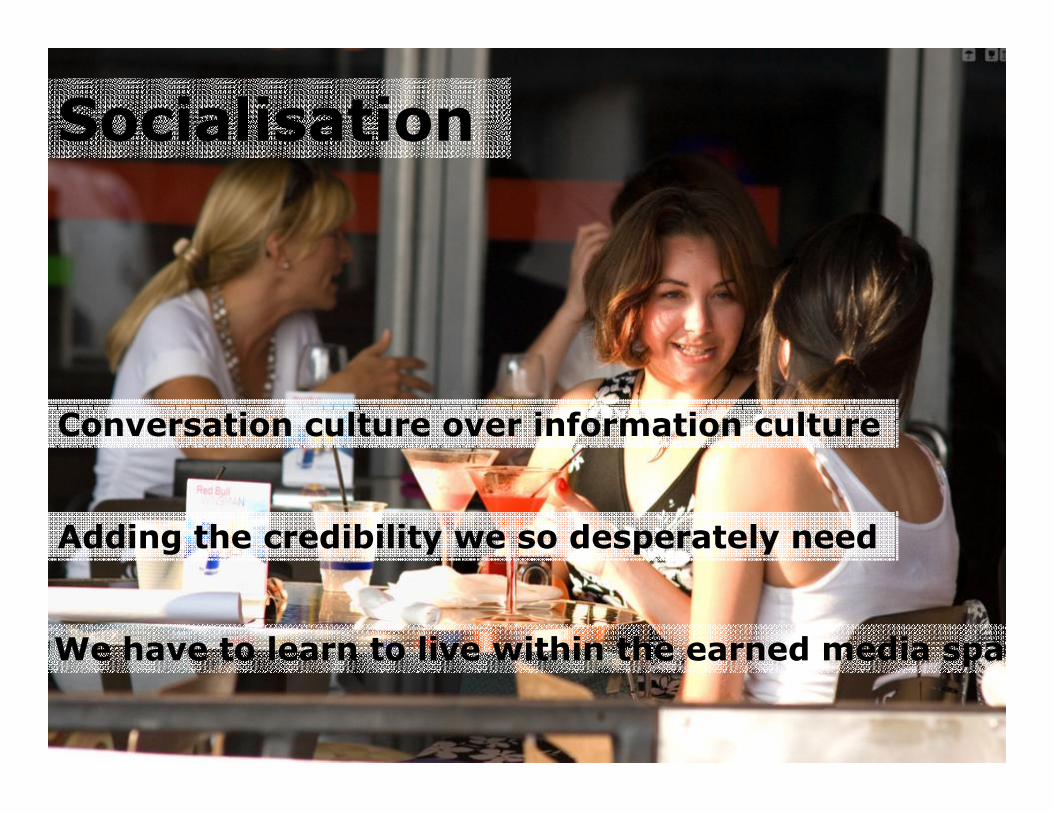
Socialisation
Conversation culture over information culture
©TNS 2012
Conversation culture over information culture
Adding the credibility we so desperately need
We have to learn to live within the earned media spac

Owned, paid and earned media
©TNS 2012
KPIs for Tourism Marketing Evaluation – 2012 Handbook

©TNS 2012Source: TRAVELSAT© benchmarking survey Provisional 2011 data. 15 000+ international
tourists from 30+ markets and visiting a destination for the first time
KPIs for Tourism Marketing Evaluation – 2012 Handbook

SEE
SEEK
SAY
interactions
DESTINATION
Evaluation needs to include measurements of this full environment
©TNS 2012
The See, Seek and Say interaction with destination brand now happens across multiple channels – both online and offline
KPIs for Tourism Marketing Evaluation – 2012 Handbook

Example of consumer marketing response metrics used by NTOs:
SEE
• Recall by media touch points
• Recognition of destination generated communications including overlap of the various media channels
SEEK
• Behaviour response (i.e. call to action based on strategy)
•Websites visited
•Word of mouth/reviews
SAY
•Word of mouth response
• Reviews posted
• Positive/neutral/negative?
©TNS 2012
including overlap of the various media channels
• Message takeout from communications
• Creative diagnostics
• Attitudinal response to communications
•Word of mouth/reviews recall
KPIs for Tourism Marketing Evaluation – 2012 Handbook

Implementing KPIs in this new environment is challenging
Campaign/creative exposure and evaluation
ROI
Number and success of partnerships
Social media metrics/website
Visitor satisfaction
How to design evaluation and
implement KPIs that
©TNS 2012
success of partnerships
Destination awareness,
preference, image
ArrivalsVisitor spend and length of
stay
Market share
metrics/websiteimplement KPIs that
best reflect the ‘milestones’ of strategy
KPIs for Tourism Marketing Evaluation – 2012 Handbook

2Developing a framework for evaluating brand, response and ROI
©TNS 2012
KPIs for Destination Marketing Evaluation – 2012 Handbook

The spectrum of evaluation and KPIs
©TNS 2012
Interim outcomes (such as marketing
impact)
Ultimate impact (visitors achieved as a result of
marketing)
Evaluation and KPIs – ‘milestones’ of strategy
KPIs for Destination Marketing Evaluation – 2012 Handbook

Defining objectives for specific marketing activities (aligned with organisational objectives)
Evaluation can be broken down into these basic phases:
Monitoring inputs (i.e. resources invested)
Monitoring outputs (i.e. marketing activities)
©TNS 2012 21
KPIs for Tourism Marketing Evaluation – 2012 Handbook
Monitoring outputs (i.e. marketing activities)
Measuring impact (i.e. quantifying benefits of activity and whether objectives have been met)
Measuring impact relative to inputs (i.e. benefits achieved in relation to costs)
Source: 2003 Handbook

The key marketing impact questions destinations are asking:
Audience
selectionMedia Mix
Message
Content
Message
execution
Did we reach the target audience? � �
Did they see it? Who was most likely to see it? � �
Did this change over time? (If applicable?) � �
Which media generated most cut through? (If applicable) � �
Key questions
Results used to optimise:
©TNS 2012
Which media generated most cut through? (If applicable) � �
Did it build our destination or just the category? � �
Did it change their perceptions of our destination? � � � �
Did they do anything about it? � � �
Was it what we wanted them to do? � � �
KPIs for Destination Marketing Evaluation – 2012 Handbook

Example of marketing metrics used by NTOs:
SEE
• Recall by media touch points
• Recognition of destination generated communications including overlap of the various media channels
SEEK
• Behaviour response (i.e. call to action based on strategy)
•Websites visited
•Word of mouth/reviews
SAY
•Word of mouth response
• Reviews posted
• Positive/neutral/negative?
©TNS 2012
including overlap of the various media channels
• Message takeout from communications
• Creative diagnostics
• Attitudinal response to communications
•Word of mouth/reviews recall
KPIs for Tourism Marketing Evaluation – 2012 Handbook

An example, Tourism Australia:
Organisational objectives:Achieve high growth scenario of the Tourism Industry Potential ($140 billion in overnight expenditure by 2020):
• Growth in leisure and business events visitors• Continued improvements in visitor value($per trip / $per night)• Gaining market share• Supporting supply side issues by applyingconsumer insights
Marketing objectives:Creating urgency to visit, increasing knowledge and building a strong image of what Australia has to offer potential visitors
It will do this through a variety of approachesand channels, including brand advertising,australia.com, public relations, promotions,events and advocacy programs that promotepositive word of mouth
A key channel is digital, which will be further strengthened
©TNS 2012 24
KPIs for Destination Marketing Evaluation – 2012 Handbook
consumer insightsstrengthened
Ultimate impact:Track its global performance through key KPIs such as:• Total overnight spend by all visitors• Market share of inbound trips against competitors• Visitor value – spend per night and spendper trip
Marketing impact:• Increased intention to visit and knowledge of Australia’s experiences and product• Stronger association of desired brand positioning• Generation of online and offline WOM• Increase in digital as a touchpoint

Consideration of key marketing and promotional activities currently involved in or likely to undertake:
- Brand communications - above the line activity and
advertising
- Digital marketing – SEO, paid search, display
advertising, social media and email
©TNS 2012 25
KPIs for Destination Marketing Evaluation – 2012 Handbook
advertising, social media and email
- Consumer PR and Promotions – such as consumer
shows
- Trade Promotions – including seminars,
familiarisation trips and trade shows

Digital marketing - what is the role of the DMO?
• Building on the authority you already have – both in the eyes of the customer (it is likely you are the official site) and Google (on the basis your domain already has some authority in terms of PageRank)
• Adding credibility – addressing some of the negative perceptions around being the ‘official’ site and being managed
©TNS 2012
perceptions around being the ‘official’ site and being managed by a Government Department
• Wrapping what you do and say in your destination brand – or more importantly your ‘point of view’ and the way you behave as a destination

Developing a user centric evaluation framework
Actions
• Brochures
“What are they doing when they
find us?”
“How do they feel about us?”
Advocacy
• Expressing opinions • Site visits
“Do people know about us?”
Awareness
©TNS 2012
• Brochures • Signing up • Bookmarking • Product search • Watching a video• Gallery views• Downloads
• Expressing opinions • Comments and posts • Content sharing • Posting on other profiles sites
• Site visits • Time spent • Pages viewed • Search keywords • Click through rates • Bounce rates
Source | iCrossing | Slideshare

En
ga
gem
en
t
Effort & Cost HighEffort & Cost Low
Developing a user centric evaluation framework
©TNS 2012
AWARENESS ACTIONS ADVOCACY
traf
fic
page
view
suniq
ue vi
sito
rsbounce
rate
buying
downlo
adin
g
regis
terin
gw
atch
ing a
vid
eo
site
links
positiv
e se
ntimen
tra
tings/
revi
ews/
reco
mm
endat
ions
men
tions
by
infu
ence
rs
Source | iCrossing | Slideshare

©TNS 2012
Source | iCrossing | Slideshare

Always on MeasurementPeriodic Research
Brand Platform Focused
Site Audit and EvaluationMultivariate and A/B Testing Card Sorting and IA/UXLaboratory Testing and Usability
Web Analytics Social AnalyticsMobile Analytics Email Analytics
©TNS 2012
Channel Focused
Keyphrase ResearchNetwork ResearchCompetitor IntelligenceBrand Monitoring
Organic Search Paid Search Display AdvertisingSocial Media Email

Return on investment
©TNS 2012
KPIs for Destination Marketing Evaluation – 2012 Handbook

What do we mean by ‘return’?
Financial Non-financial
©TNS 2012
Incremental profitAdditional sales
StrategicBehavioural

ROI can mean different things to different organisations – unfortunately there is no magic metric called ROI!
Increase in customer lifetime value (17%)
Ratio of advertising costs to sales revenue (34%)
Cost per sale generated (23%)
Post buy analysis comparing media plan to actual media delivery (21%)
Changes in attitudes toward the brand (51%)
Gross rating points delivered (25%) Number of leads generated (40%)
Cost per lead generated (34%)
©TNS 2012
Source: TNS European survey of clients across various industries
Incremental sales revenue generated by marketing activity (66%)
Changes in market share (49%)
Total sales revenue generated by marketing activities (55%)
Changes in purchase intention (55%)
(51%)
Changes in the financial value of brand equity (19%)
Changes in brand awareness (57%) Reach/frequency achieved (30%)

The general challenge of measuring ROI
• The most fundamental challenge - the issue of cause and effect
• It can be difficult to establish what impact marketing has had on sales of a product or service
• To accurately measure impact, you need to take into account all the confounding factors that might be affecting sales:
©TNS 2012
the confounding factors that might be affecting sales:
• E.g. competitor activity, pricing, general economic situation, distribution issues, etc…

This becomes more complex for tourism…
• In principle what we want to measure is the net gain to the tourism sector/economy from marketing activity
• Our product is complex and diverse - cause and effect can be hard to establish but also because the measurement of change itself can be difficult
You can confidently estimate the impact of a specific campaign on
©TNS 2012
• You can confidently estimate the impact of a specific campaign on visits to one attraction because the outcome is easily measured and role of other factors readily identifiable
• For general destination marketing, think of all the influencing factors - the weather, economic situation, flights, exchange rates, advertising spend for competing destinations and so on!

There is no ‘one size fits all’ solution
Simple & high level Detailed & complex
©TNS 2012

But there are opportunities to develop a framework that defines the outcomes and overall impact of specific
pieces of work within the context of the limitations that exist around specific types of activity and their
evaluation
©TNS 2012 37
KPIs for Destination Marketing Evaluation – 2012 Handbook
Let’s discuss…

Response or business driving activity (i.e. digital marketing, trade and consumer promotional programmes)
Possible to create measurement model that derives ROI for each specific programme or area of activity
Requires accurate evaluation of financial and resource inputs and business outcomes for each specific piece of
work
©TNS 2012 38
KPIs for Destination Marketing Evaluation – 2012 Handbook
A clear measurement model needs to be developed around each piece of response or business driving
activity that outlines business objectives, specific goals, key metrics and appropriate targets

Example: digital marketing ROI pyramid
©TNS 2012
Source | Altimeter Group

Brand communications
Likely to affect things like overall awareness of destination, perceptions and the extent to which the destination is ‘front of mind’ across the target audience
Brand tracking studies in markets where the destination is running a significant weight of advertising will help understand the overall effect those campaigns are
having
©TNS 2012 40
KPIs for Destination Marketing Evaluation – 2012 Handbook
It is however much more difficult to develop a robust model based on ROI for above the line activity
Broadcast channels work to create awareness and change perceptions rather than generate direct sales
They also create a ‘halo’ effect that supports response and business driving activity

Understanding ROI for brand communications
• Econometric modelling takes into account the factors which may impact on tourism revenue – however requires significant research effort and investment as well as long periods of survey and secondary data
©TNS 2012
• Direct calculation is a survey based approach and is the method used by the majority NTOs (in varying levels of sophistication)

Econometric modelling
• Used to estimate the relationship between an input – in this case the spend on tourism promotion and development – and the output – tourism revenues
• The analysis seeks to allow for all the other factors which may impact on tourism revenue
©TNS 2012
• Uses hard measures of output and relies on observed behaviour (visits and spending) rather than, say, subjective measures such as what people choose to tell about their intentions or motives in surveys

But look at the data you will need!
The types of data required would include but not be confined to the following (for a long period of time):
• A measure of outcome, such as number of visits and number of days
• Amount spent on tourism, per visit, per day
• Advertising spend by week
©TNS 2012
• Advertising spend by alternative promoters
• Weather (temperature, rainfall, etc.)
• Economic conditions (unemployment rates, GDP, Consumer Confidence)
• Other survey measures: such as advertising awareness etc.
And many assumptions – risk of ‘chaos theory’ kicking

An example of direct calculation on the other hand…
• Calculate the additional tourism spending which has resulted from marketing activities:
• This is done through survey data by assessing the decisions made by individuals and how they are influenced by promotions when making those decisions
• Promotional activity may produce a return to the investment if it
©TNS 2012
• Promotional activity may produce a return to the investment if it leads to (for example):
1. An increase in the number of leisure breaks taken in the destination
2. Longer breaks
3. People taking higher value/more expensive breaks

Example framework used by and NTO:
Establish weight of influence of marketing communications (including those not driven by NTO) versus other influences (such as word of mouth)
Understand how all below and above the line activity by NTO has influenced a decision about a holiday in that destination (if at all):
AwarenessDegree of influence (minor to major)How influenced (took a holiday, swapped from another destination, stayed longer, visited more places etc.)
©TNS 201245
longer, visited more places etc.)
Then:Increase in expenditure arising from promotional activity in total and by medium is calculatedIncrease in Gross Value Added (GVA) arising from expenditure is calculatedCompared with the cost of the promotional activity as a whole and by form

‘Influence’ can also be measured in the form of a re-contact survey which allows us to also establish actual conversion, the outcomes of which can be combined with value data to provide a reasonable assessment of
financial outcomes
©TNS 2012 46
KPIs for Destination Marketing Evaluation – 2012 Handbook
Conversion studies work if you don’t have a lot of markets and high incidence of the target – otherwise it
can be an expensive process!

If limited by evaluation scope/budget…
Marketing response (interim outcomes) can be used as a ‘proxy’ for return on investment from activity:
• Top of mind and prompted awareness of the destination
• Recall of specific ads and overall campaign
• Opinion of the campaign (ad diagnostics such as clear
©TNS 2012
• Opinion of the campaign (ad diagnostics such as clear messaging, increased interest in the destination)
• Action taken after seeing activity (spoke to others, looked for more information, booked)
• Impact on purchase cycle (i.e. awareness, preference, intention)
• Impact on brand image (i.e. changing perceptions)

3Key evaluation challenges for destinations and KPIs used
©TNS 2012
KPIs for Destination Marketing Evaluation – 2012 Handbook

Impact/ROI, new influence channels, efficiency and practicality are key evaluation challenges
Attributing direct cause and effect
between marketing efforts and tourism
impactparticularly combined
Related to this, measuring return on
investment –particularly combined
across channelsconsumer trends (i.e.
Constant adaption of evaluation methods
to include new technology and
consumer trends (i.e. social media)
What are the current challenges to your organisation when evaluating marketing activity?
©TNS 2012
Increasing efficiency of evaluation (with
reference to reducing costs)
Ensuring practical application of evaluation (and
hence organisational acceptance)

Mainly offline consumer marketing activities
Activity KPIs
Promotions in offline media
Mainly exposure – some campaign effectiveness (i.e. generate interest)
Outdoor/poster Mainly exposure – some campaign effectiveness (i.e. generate interest)
Direct mail Exposure and response rate
Note: only key activities shown
©TNS 2012
Direct mail Exposure and response rate
Press/PR Ad value
Exhibitions/fairs Attendance, knowledge and leads
Promotional literature Circulation
Tourist Information Centres
Visitor numbers and satisfaction

Activity KPIs
Cinema Exposure/effectiveness
Film Press coverage, increasing knowledge
Mobile (apps) Downloads/usage
Internet Visitors and click through
Direct (e) mail Subscribers and response rate (click through to newsletter)
Mainly online consumer marketing activities
Note: only key activities shown
©TNS 2012
Direct (e) mail Subscribers and response rate (click through to newsletter)
Radio Exposure and effectiveness
TV Exposure and effectiveness
Corporate website (own) Visitors, downloads and views (pages)
Press/PR Visitors and media value
Owned social media platforms Facebook key platform mentioned – fans, likes, posts. Twitter also but to a lesser extent – followers

Event centred activities
Activity KPIs
Convention/event support
Participants and satisfaction
Event support/sponsorship
Participants and media coverage
Note: only key activities shown
©TNS 2012
sponsorship
Event marketing (above, below and online)
Visitors, feedback and media coverage

Trade activities
Activity KPIs
Exhibitions and trade fairs
Number of visitors, exhibitors and satisfaction
Trade promotions Attendance and satisfaction
Event support Visitors/viewers and media coverage
Trade support Agreements/contracts and response levels to activity
Note: only key activities shown
©TNS 2012
Trade support Agreements/contracts and response levels to activity
Destination learning Participants, drop out rate, completion rate
Sales calls/company-specific meetings
Contacted, leads and agreements/contracts
Familiarisation trips Participants, follow up survey evaluation

MICE activities
Activity Commentary
Advertising Exposure, circulation, visitors to B2B website, click through
DVDs/VDOs/CD-ROMS Distribution
Exhibitions/trade fairs Visitors, exhibitors, leads, meetings and satisfaction
Literature Distribution and exposure
Note: only key activities shown
©TNS 2012
Literature Distribution and exposure
Press and PR Media value, exposure, planned events/participants
Sales promotions Business/leads generated
Sponsorship Reverted back to high level KPIs (i.e. destination knowledge) –not linked directly to sponsorship activity
Ambassador programmes Applications, members, generated visitors, guest nights
MICE event support Participants, events, macro economical return
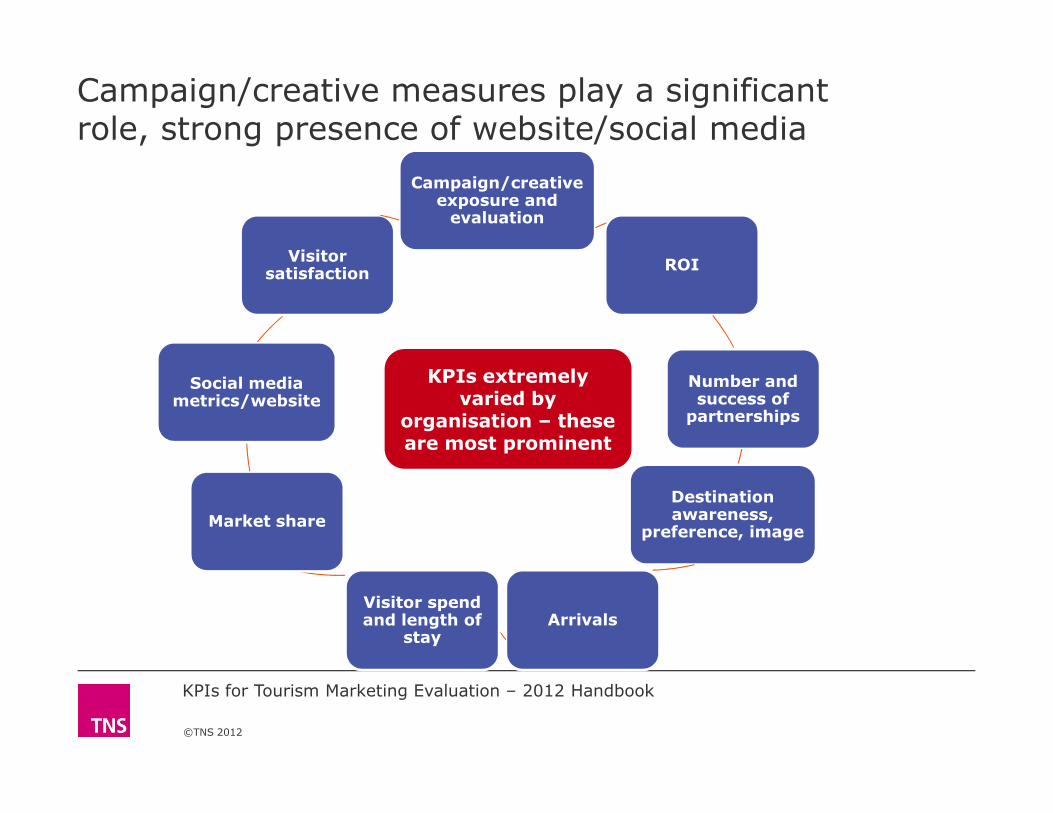
Campaign/creative measures play a significant role, strong presence of website/social media
Campaign/creative exposure and evaluation
ROI
Number and success of partnerships
Social media metrics/website
Visitor satisfaction
KPIs extremely varied by
©TNS 2012
success of partnerships
Destination awareness,
preference, image
ArrivalsVisitor spend and length of
stay
Market share
metrics/website varied by organisation – these are most prominent
KPIs for Tourism Marketing Evaluation – 2012 Handbook

Organisation 1
• Visitor overnight spend
• Market share
• Yield
• % target audience saw campaign
• % target audience
Organisation 2
• Increase in the number of tourist arrivals
• Dispersal
• Improvement of the image of the destination
• Better knowledge of
Organisation 3
• Website: unique visitors, bounce rate,
• Facebook: fans
• Mass media: monitoring of key words
• National Brand Index
©TNS 2012
• % target audience who took action as result of campaign
• Target audience arrivals and spend
• PR EAV
• Digital and social metrics
• Better knowledge of the destination
• Tourist investments
• Contribution of tourism sector to the GDP
• Job creation by the tourism sector
• National Brand Index
• Market research –pre/post tests (shifts in brand recognition)
KPIs for Tourism Marketing Evaluation – 2012 Handbook

start
Stage
Preliminary desk research
• Including previous Handbook, E-Marketing Handbook and various other secondary data resources
ETC/UNWTO members’ survey
• Survey conducted
• Initial results analysed
ECM members’ survey
• Survey conducted
Initial structure of Handbook prepared
©TNS 2012
• Survey conducted
• Topline analysis conducted
In-depth interviews with key stakeholders
Draft Handbook
• Includes full analysis of all stages above – awaiting e-marketing results
Draft Handbook review
Final Handbook

AppendixDigital metrics – courtesy of TEAM and the e-marketing Handbook
©TNS 2012
KPIs for Destination Marketing Evaluation – 2012 Handbook

©TNS 2012
Digital Metrics
Which ones are important?
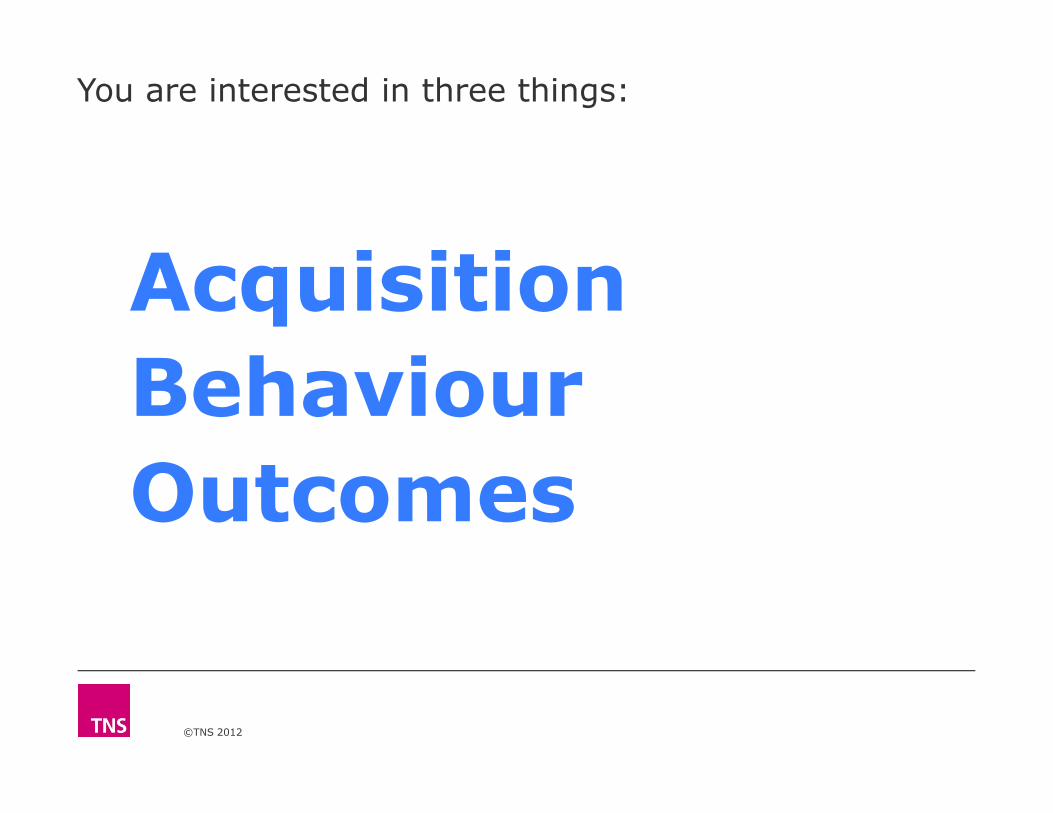
You are interested in three things:
Acquisition
Behaviour
©TNS 2012
Behaviour
Outcomes

Operations and Senior Management
Cost per Acquisition (CPA)
Click Through Rate (CTR %)
New Visits (%)
Bounce Rate (%)
Conversion Abandonment Rate (%)
Page Depth
Acquisition
Behaviour
©TNS 2012
Page Depth
Loyalty
Events / Visit
Conversion Rate
Days to Conversion
% Assisted Conversion
Behaviour
Outcomes

Thank-you!Questions?
©TNS 2012
KPIs for Destination Marketing Evaluation – 2012 Handbook

©TNS 2012
Campaign Activity Evaluation