evaluating the upset protrusion joining (upj) method … · evaluating the upset protrusion joining...
TRANSCRIPT

Stephen D. Logan
Global Automotive Lightweight Materials Detroit 2015 Conference
August 19, 2015
Evaluating the Upset Protrusion Joining (UPJ) Method to Join Magnesium Castings to Dissimilar Metals
© 2015 FCA US LLC All Rights Reserved

8/19/2015
2
Content
• Challenges of joining magnesium castings to dissimilar metals
• Benchmark joint performance results for magnesium die-castings to aluminum sheet material using a current state-of-the-art joining process
• Introduction of the UPJ joining process for joining magnesium castings to dissimilar metals
• UPJ joint performance results with comparisons to benchmark joint performance
© 2015 FCA US LLC All Rights Reserved

8/19/2015
3
Mass Reduction Potential (typical)
• High strength steels (5-10%) • SMC (20-30%) • Cast aluminum (25-35%) • Thermoplastic polymer composites (30-40%) • Sheet, extruded, and forged aluminum (40-50%) • Die cast magnesium (40-60%) • Sheet, extruded, and forged magnesium
(55-70%) • Carbon fiber prepreg composites (60-70%)
© 2015 FCA US LLC All Rights Reserved

8/19/2015
4
Best Practices
• Best practice is thin-wall die casting – Mg die casting can be very cost effective
• Reasonable material cost • High level of component integration capability
– Reduces investment and assembly costs • Compared to aluminum, thinner section capability
with less draft • 2-3 times longer die life than aluminum • Excellent dimensional integrity • No need to heat treat
© 2015 FCA US LLC All Rights Reserved

8/19/2015
5
Best Practices
• Common examples include: – Instrument panel structures
• As many as 20 stamped steel components combined into one die casting at slightly more than ½ the weight
– Steering wheel armatures – Steering column mounting brackets – Seat structures – Closure inner panels – Transmission and transfer case housings
© 2015 FCA US LLC All Rights Reserved

8/19/2015
6
Why Magnesium?
• Best mass reduction potential of all metals (comparable to carbon fiber composites at much lower cost) − Density
• Density - 1/4 that of steel (2/3 that of aluminum) − Weight for equivalent bending stiffness
• 62% lighter than steel (23% lighter than aluminum) − Bending stiffness for same weight
• 18 times stiffer than steel (2.3 times stiffer than aluminum) • For bending strength, reductions are similar to those for
stiffness depending on specific alloys being compared − In practice - lightest structural metal - capable of
substantial (40-60%) weight reductions over steel
© 2015 FCA US LLC All Rights Reserved

Best Prac,ces Example – Viper Front of Dash
Feature Integration
Steering column attachment
HVAC opening
Brake booster attachments
Pedal attachments
Wire harness attachments
IP structure attachments
Door hinge attachments
Hood hinge attachments
“A” pillar mounting attachments
Weight Reduction – 15.4 Kg (51%) Cost Reduction – ~30% Part Integration – 51 parts replaced by 10 parts Low volume application <5,000/yr
Viper Front of Dash
© 2015 FCA US LLC All Rights Reserved 7 8/19/2015

8/19/2015
8
Why Not Magnesium?
• Joining Difficulties • Galvanic corrosion • Coating compatibility
– Process sequence is critical • Limited infrastructure and supply base
– Primary material production largely limited to China
• Limited knowledge base – Especially wrt corrosion performance
These are confounding factors that must be addressed together
© 2015 FCA US LLC All Rights Reserved
8/19/2015
9
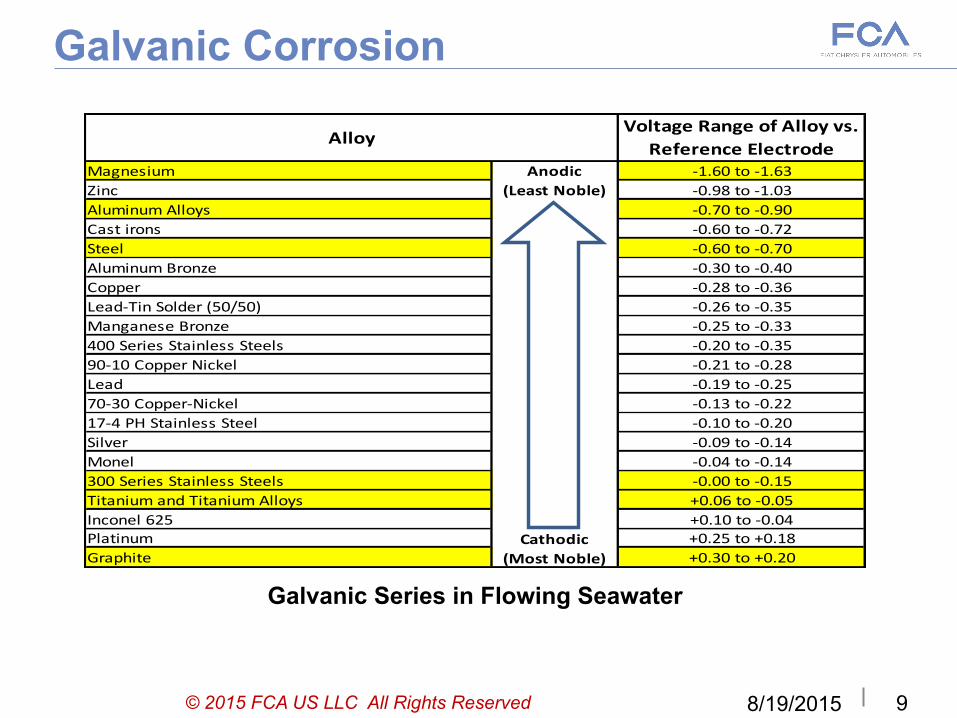
Galvanic Corrosion Voltage Range of Alloy vs.
Reference ElectrodeMagnesium -‐1.60 to -‐1.63Zinc -‐0.98 to -‐1.03Aluminum Alloys -‐0.70 to -‐0.90Cast irons -‐0.60 to -‐0.72Steel -‐0.60 to -‐0.70Aluminum Bronze -‐0.30 to -‐0.40Copper -‐0.28 to -‐0.36Lead-‐Tin Solder (50/50) -‐0.26 to -‐0.35Manganese Bronze -‐0.25 to -‐0.33400 Series Stainless Steels -‐0.20 to -‐0.3590-‐10 Copper Nickel -‐0.21 to -‐0.28Lead -‐0.19 to -‐0.2570-‐30 Copper-‐Nickel -‐0.13 to -‐0.2217-‐4 PH Stainless Steel -‐0.10 to -‐0.20Silver -‐0.09 to -‐0.14Monel -‐0.04 to -‐0.14300 Series Stainless Steels -‐0.00 to -‐0.15Titanium and Titanium Alloys +0.06 to -‐0.05Inconel 625 +0.10 to -‐0.04Platinum +0.25 to +0.18Graphite +0.30 to +0.20
Anodic (Least Noble)
Cathodic (Most Noble)
Alloy
Galvanic Series in Flowing Seawater
© 2015 FCA US LLC All Rights Reserved
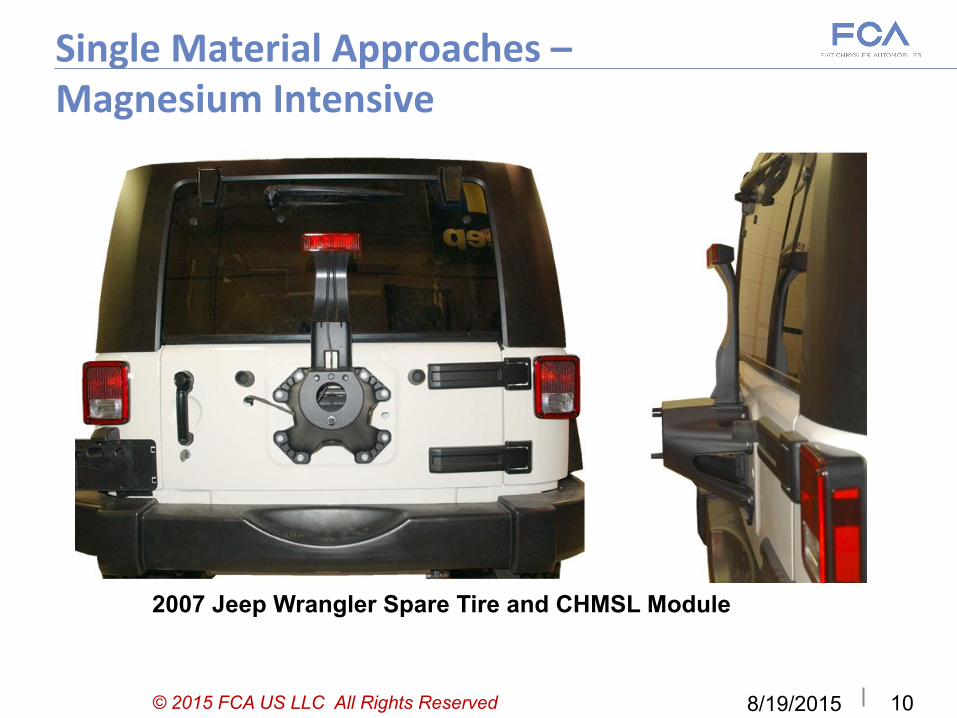
Single Material Approaches – Magnesium Intensive
© 2015 FCA US LLC All Rights Reserved
2007 Jeep Wrangler Spare Tire and CHMSL Module
10 8/19/2015
8/19/2015
11
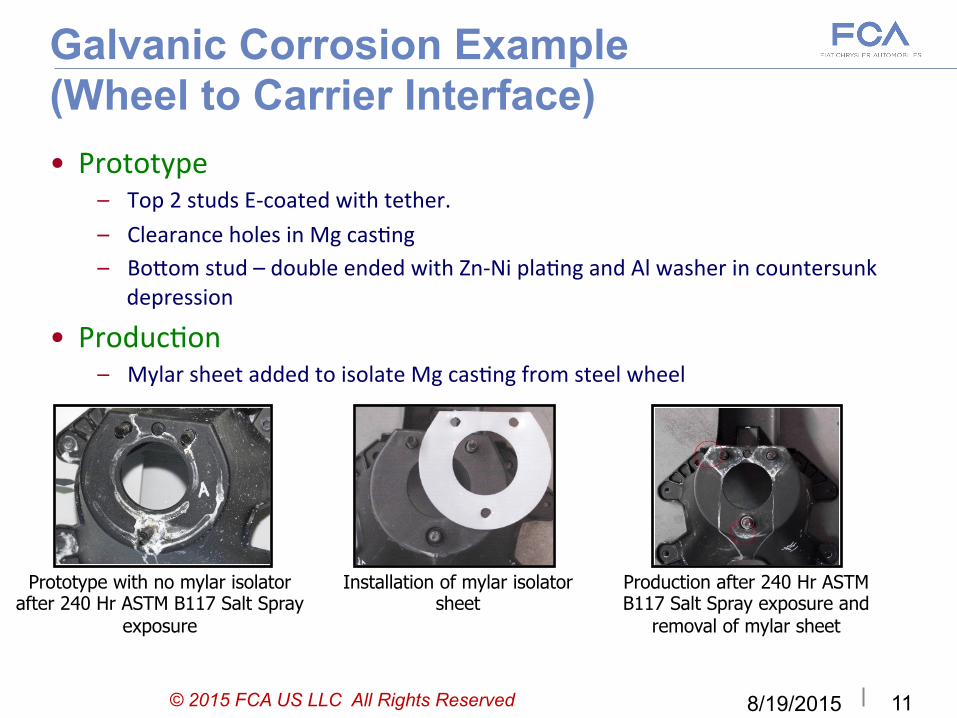
Galvanic Corrosion Example (Wheel to Carrier Interface)
© 2015 FCA US LLC All Rights Reserved
• Prototype – Top 2 studs E-‐coated with tether. – Clearance holes in Mg cas,ng – BoFom stud – double ended with Zn-‐Ni pla,ng and Al washer in countersunk
depression
• Produc,on – Mylar sheet added to isolate Mg cas,ng from steel wheel
Prototype with no mylar isolator after 240 Hr ASTM B117 Salt Spray
exposure
Production after 240 Hr ASTM B117 Salt Spray exposure and
removal of mylar sheet
Installation of mylar isolator sheet
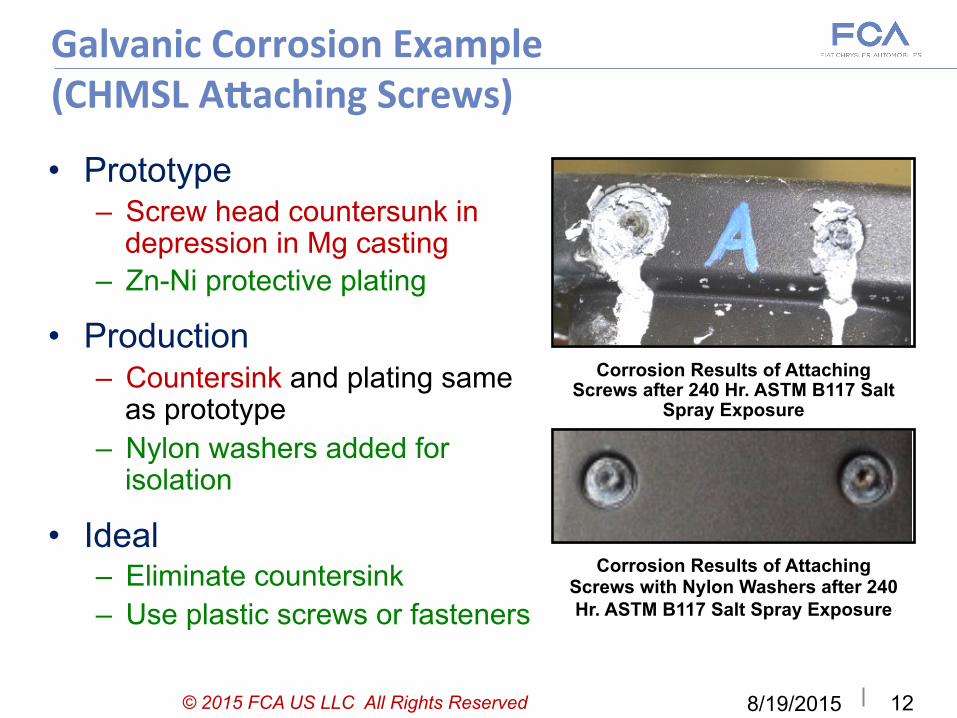
Galvanic Corrosion Example (CHMSL A>aching Screws)
• Prototype – Screw head countersunk in
depression in Mg casting – Zn-Ni protective plating
• Production – Countersink and plating same
as prototype – Nylon washers added for
isolation
• Ideal – Eliminate countersink – Use plastic screws or fasteners
Corrosion Results of Attaching Screws after 240 Hr. ASTM B117 Salt
Spray Exposure
Corrosion Results of Attaching Screws with Nylon Washers after 240 Hr. ASTM B117 Salt Spray Exposure
© 2015 FCA US LLC All Rights Reserved
12 8/19/2015

8/19/2015
13
Acknowledgment: "This material is based upon work supported by the Department of Energy under Award Number(s) DE-EE0006442." Disclaimer: "This report was prepared as an account of work sponsored by an agency of the United States Government. Neither the United States Government nor any agency thereof, nor any of their employees, makes any warranty, express or implied, or assumes any legal liability or responsibility for the accuracy, completeness, or usefulness of any information, apparatus, product, or process disclosed, or represents that its use would not infringe privately owned rights. Reference herein to any specific commercial product, process, or service by trade name, trademark, manufacturer, or otherwise does not necessarily constitute or imply its endorsement, recommendation, or favoring by the United States Government or any agency thereof. The views and opinions of authors expressed herein do not necessarily state or reflect those of the United States Government or any agency thereof."
Acknowledgement of Federal Support and Disclaimer
© 2015 FCA US LLC All Rights Reserved
8/19/2015
14
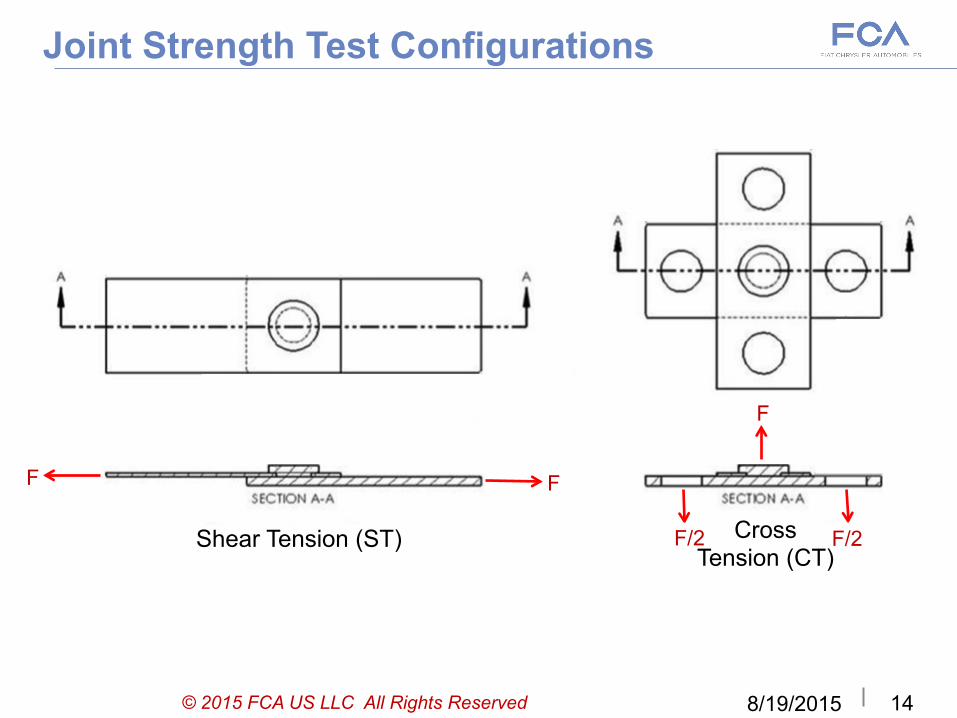
Joint Strength Test Configurations
© 2015 FCA US LLC All Rights Reserved
F F
F/2
F
F/2 Cross Tension (CT)
Shear Tension (ST)
8/19/2015
15
Benchmark Joint Performance
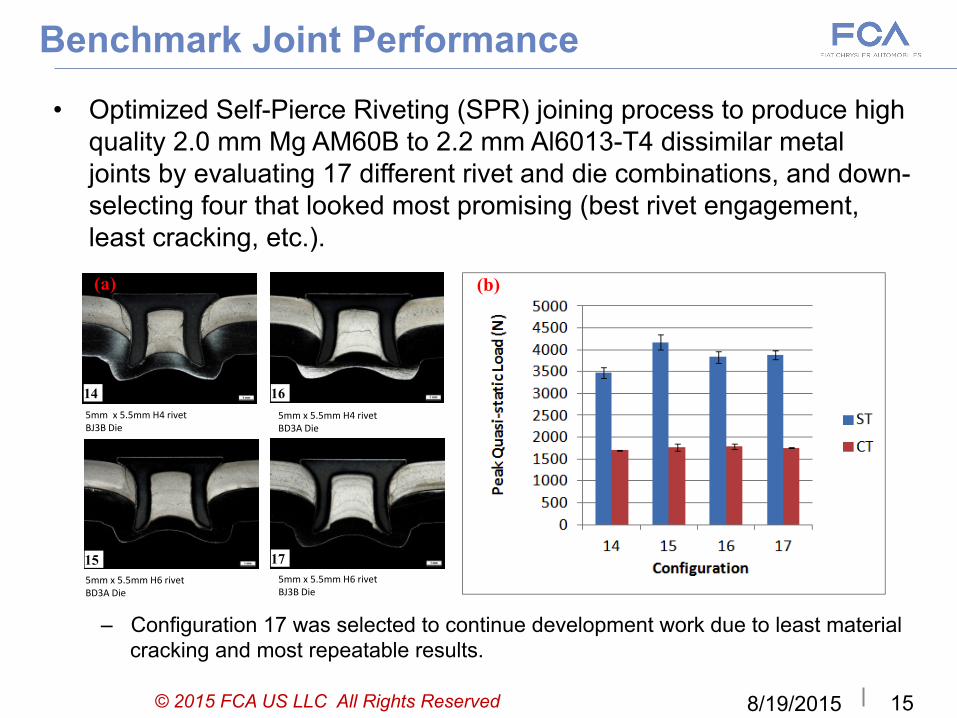
• Optimized Self-Pierce Riveting (SPR) joining process to produce high quality 2.0 mm Mg AM60B to 2.2 mm Al6013-T4 dissimilar metal joints by evaluating 17 different rivet and die combinations, and down-selecting four that looked most promising (best rivet engagement, least cracking, etc.).
– Configuration 17 was selected to continue development work due to least material
cracking and most repeatable results.
5mm x 5.5mm H4 rivetBJ3B Die
5mm x 5.5mm H6 rivetBJ3B Die
5mm x 5.5mm H6 rivetBD3A Die
5mm x 5.5mm H4 rivet BD3A Die
(a) (b)
15
14
17
16
© 2015 FCA US LLC All Rights Reserved

8/19/2015
16
Benchmark Joint Performance
• Shear and cross tension assemblies were subjected to 12 wks of an aggressive ASTM G85-A2 accelerated corrosion procedure that caused several assemblies to separate after only 6 wks of exposure.
© 2015 FCA US LLC All Rights Reserved
8/19/2015
17
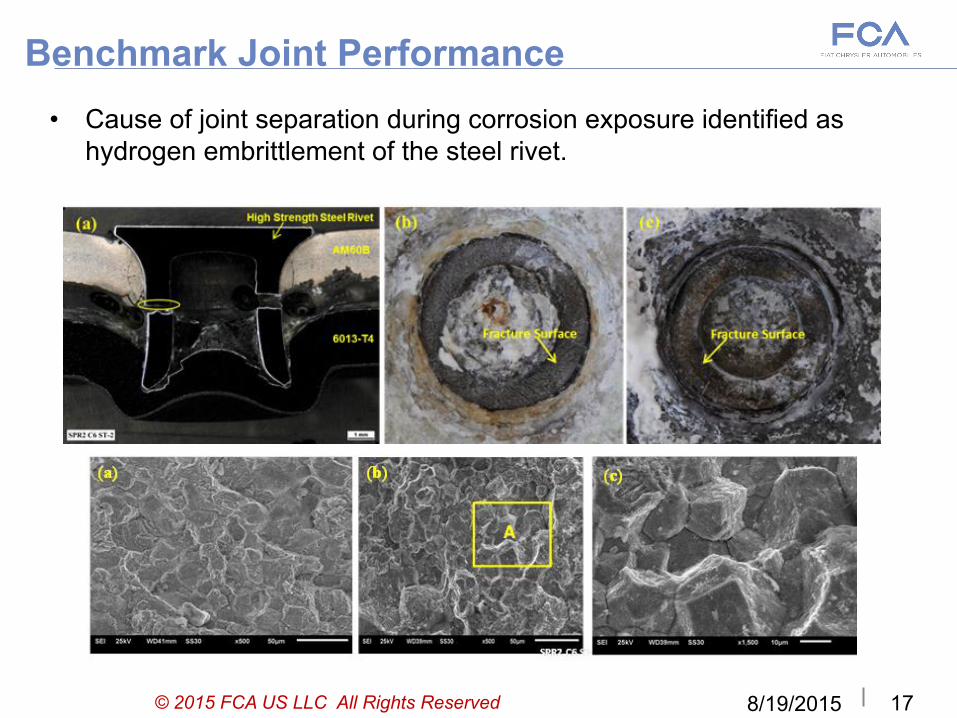
Benchmark Joint Performance • Cause of joint separation during corrosion exposure identified as
hydrogen embrittlement of the steel rivet.
© 2015 FCA US LLC All Rights Reserved
8/19/2015
18
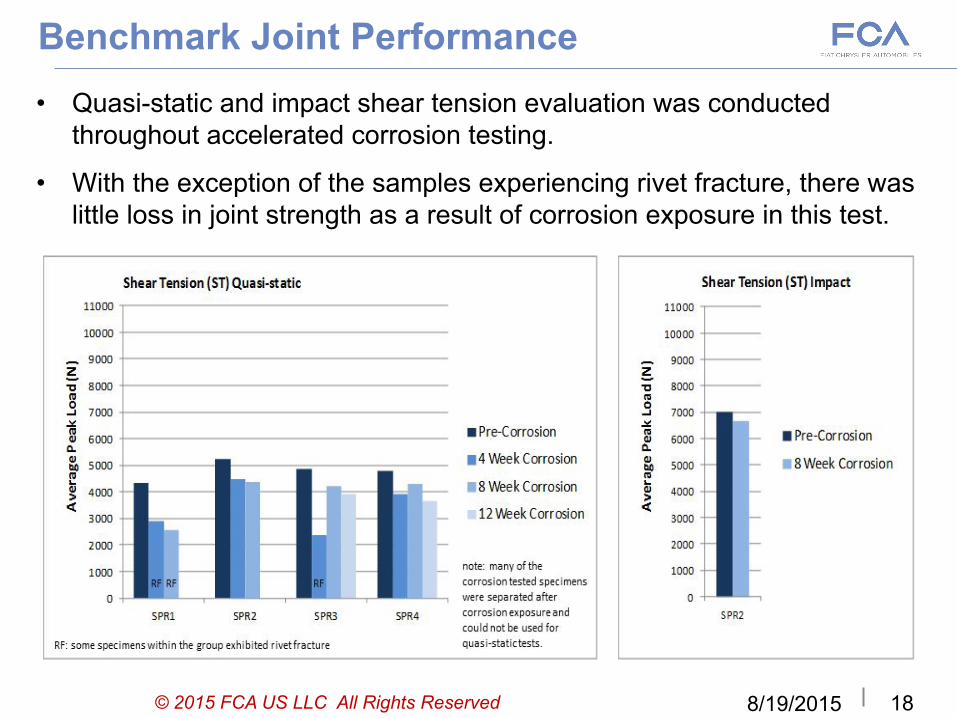
Benchmark Joint Performance • Quasi-static and impact shear tension evaluation was conducted
throughout accelerated corrosion testing.
• With the exception of the samples experiencing rivet fracture, there was little loss in joint strength as a result of corrosion exposure in this test.
© 2015 FCA US LLC All Rights Reserved

8/19/2015
19
Benchmark Joint Performance • Quasi-static and impact cross tension evaluation was conducted
throughout accelerated corrosion testing.
• As with the shear tension evaluation, with the exception of the samples experiencing rivet fracture, there was little loss in joint strength as a result of corrosion exposure in this test.
© 2015 FCA US LLC All Rights Reserved

8/19/2015
20
Benchmark Joint Performance • Fatigue performance at the end of accelerated corrosion testing.
© 2015 FCA US LLC All Rights Reserved
8/19/2015
21
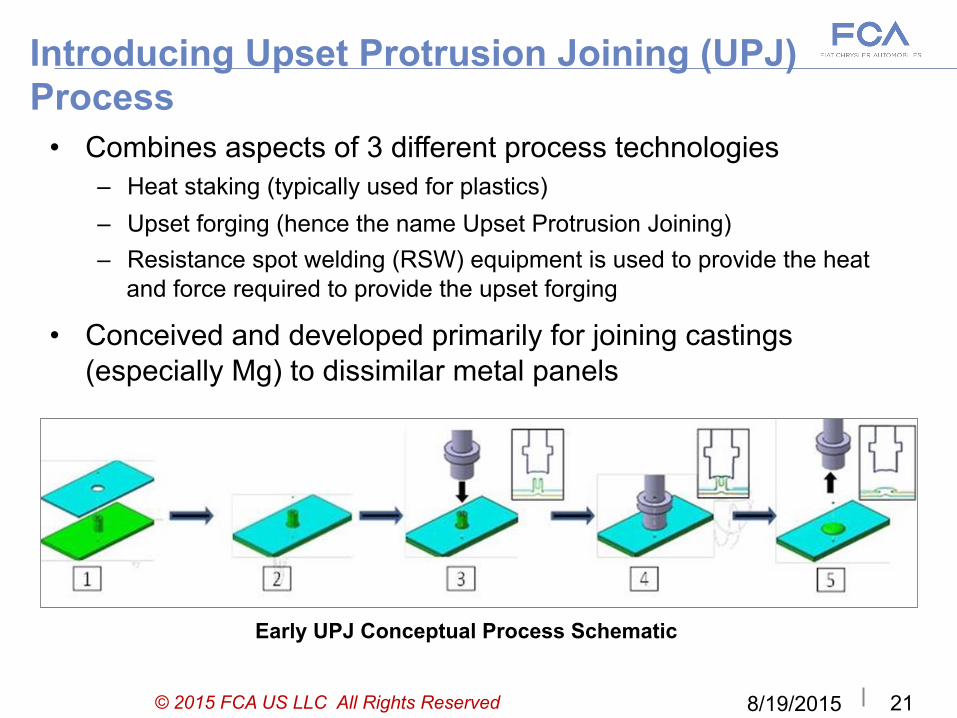
Introducing Upset Protrusion Joining (UPJ) Process
• Combines aspects of 3 different process technologies – Heat staking (typically used for plastics) – Upset forging (hence the name Upset Protrusion Joining) – Resistance spot welding (RSW) equipment is used to provide the heat
and force required to provide the upset forging
• Conceived and developed primarily for joining castings (especially Mg) to dissimilar metal panels
Early UPJ Conceptual Process Schematic
© 2015 FCA US LLC All Rights Reserved
8/19/2015
22
Upset Protrusion Joining (UPJ) Process • Advantages
– No intermetallic bonding required – Reduced risk of galvanic corrosion because of
• Elimination of steel fastener • Ability to coat cathode before joining to anode
• Disadvantages – Limited Types of Applications
• At least one component must be a casting • Attaching panel surface must be perpendicular to casting die direction at the
location of the joint
– Can be dimensionally challenging • The clearance holes in attaching panel must be large enough to accommodate
production and assembly processes between the two components • The boss head must be able to expand to be large enough to completely cover
the clearance hole in the attaching panel.
– Repair process will need to be developed
© 2015 FCA US LLC All Rights Reserved
8/19/2015
23
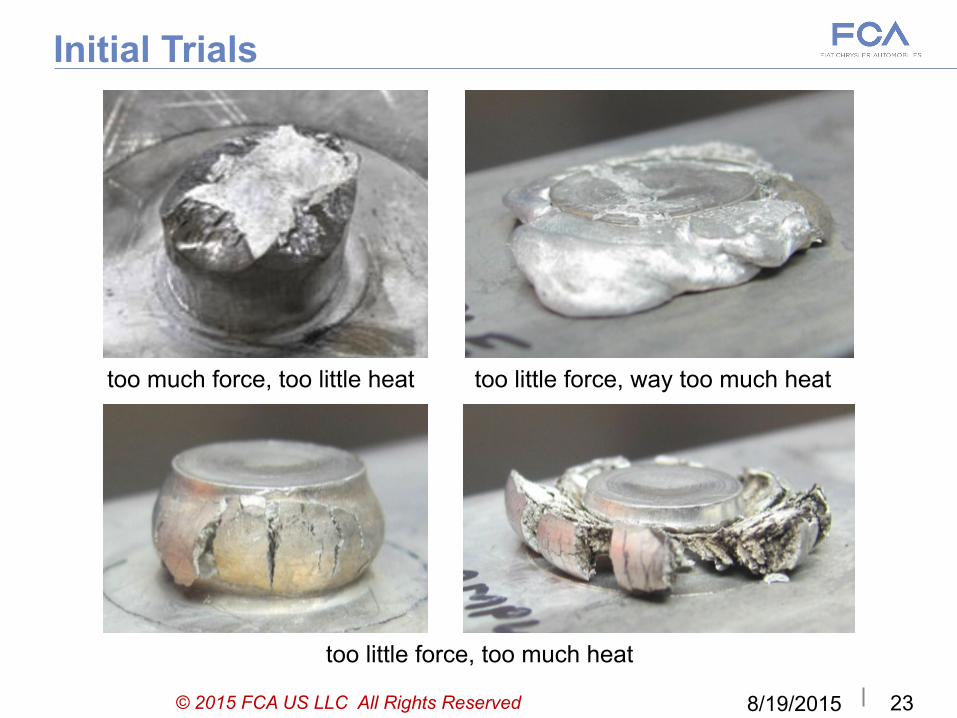
Initial Trials
© 2015 FCA US LLC All Rights Reserved
too much force, too little heat
too little force, too much heat
too little force, way too much heat
8/19/2015
24
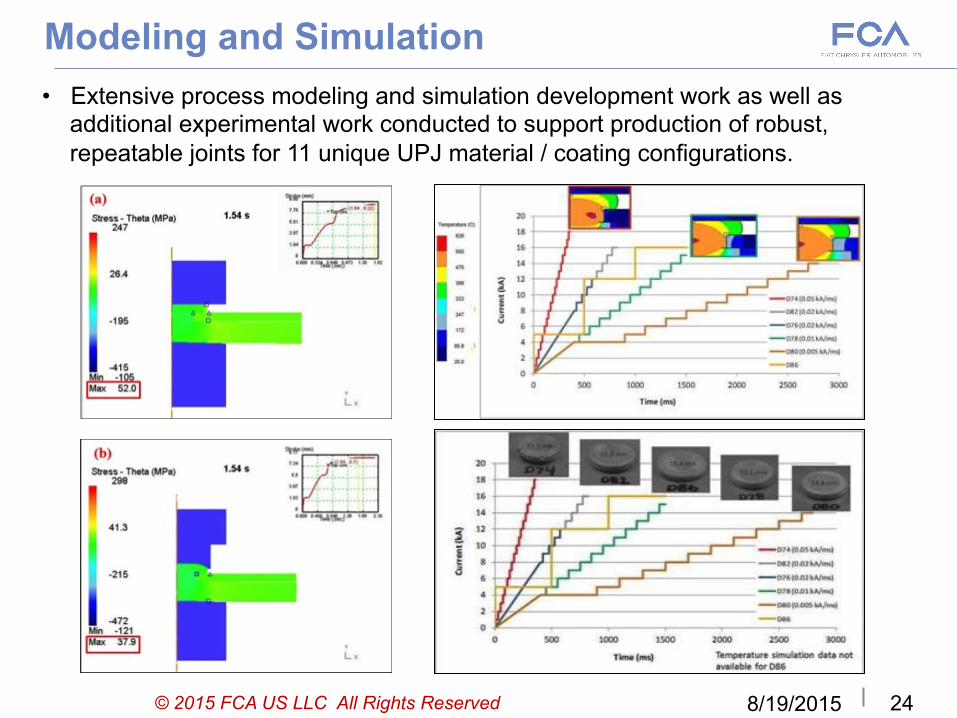
Modeling and Simulation • Extensive process modeling and simulation development work as well as
additional experimental work conducted to support production of robust, repeatable joints for 11 unique UPJ material / coating configurations.
© 2015 FCA US LLC All Rights Reserved
8/19/2015
25
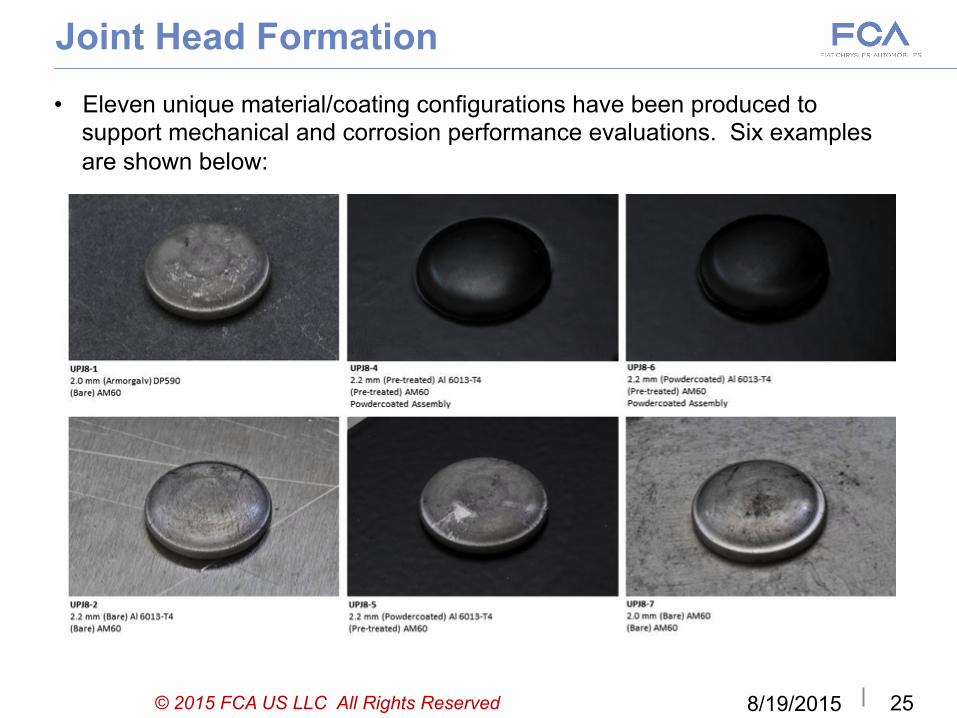
Joint Head Formation • Eleven unique material/coating configurations have been produced to
support mechanical and corrosion performance evaluations. Six examples are shown below:
© 2015 FCA US LLC All Rights Reserved
8/19/2015
26
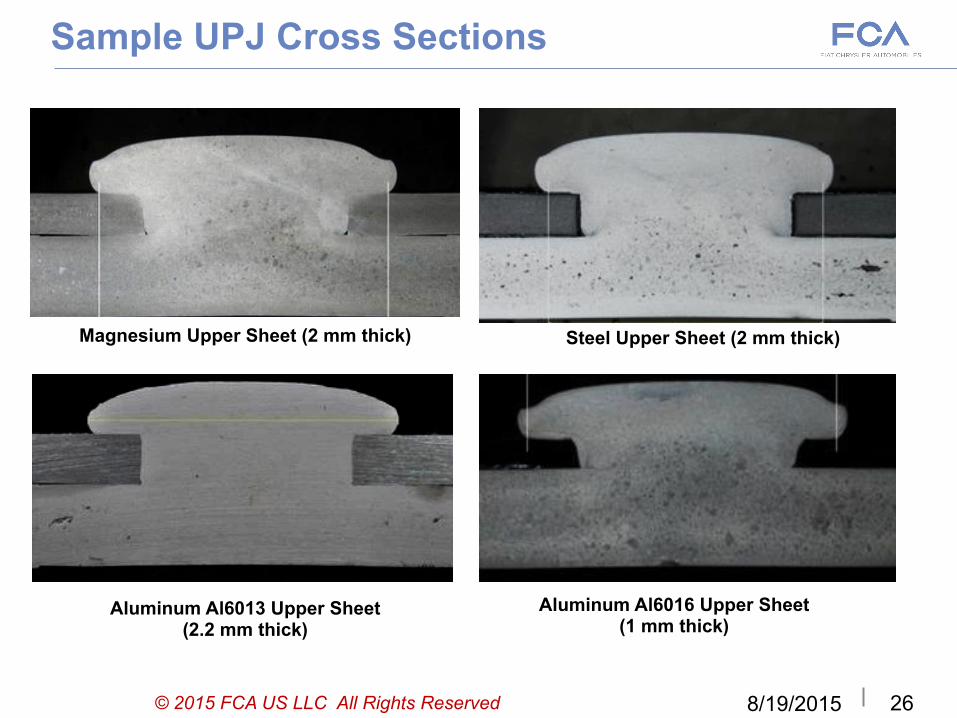
Sample UPJ Cross Sections
Magnesium Upper Sheet (2 mm thick)
Aluminum Al6013 Upper Sheet (2.2 mm thick)
Steel Upper Sheet (2 mm thick)
© 2015 FCA US LLC All Rights Reserved
Aluminum Al6016 Upper Sheet (1 mm thick)

8/19/2015
27
Corrosion Performance Comparison @ 6 wks Bare Mg AM60B / Bare Al6013
© 2015 FCA US LLC All Rights Reserved
SPR ST and CT Samples (4 samples separated) UPJ ST Sample Mg and Al (1 sample separated)

8/19/2015
28
Corrosion Performance Comparison @ 6 wks Pretreated Mg AM60B / Pretreated Al6013 / Coated Assy
© 2015 FCA US LLC All Rights Reserved
SPR ST and CT Samples (7 samples separated) UPJ ST and CT Samples (no separations)

8/19/2015
29
Quasi-Static Shear Tension Comparison
Quasi-Static Shear Tension Test Results of SPR (left) and UPJ (right) Joints Before and After Accelerated Corrosion Exposure to ASTM G85-A2
* - RF = Rivet Fracture
SPR1, UPJ8-2 = Bare Al6013 to bare AM60B SPR2, UPJ8-4 = Pretreated Al6013 to pretreated AM60B, with powdercoating after assembly SPR3, UPJ8-5 = Powdercoated Al6013 to pretreated AM60B, with no coating after assembly SPR4, UPJ8-6 = Powdercoated Al6013 to pretreated AM60B, with powdercoating after assembly
UPJ8-2 UPJ8-4 UPJ8-5 UPJ8-6
© 2015 FCA US LLC All Rights Reserved
8/19/2015
30
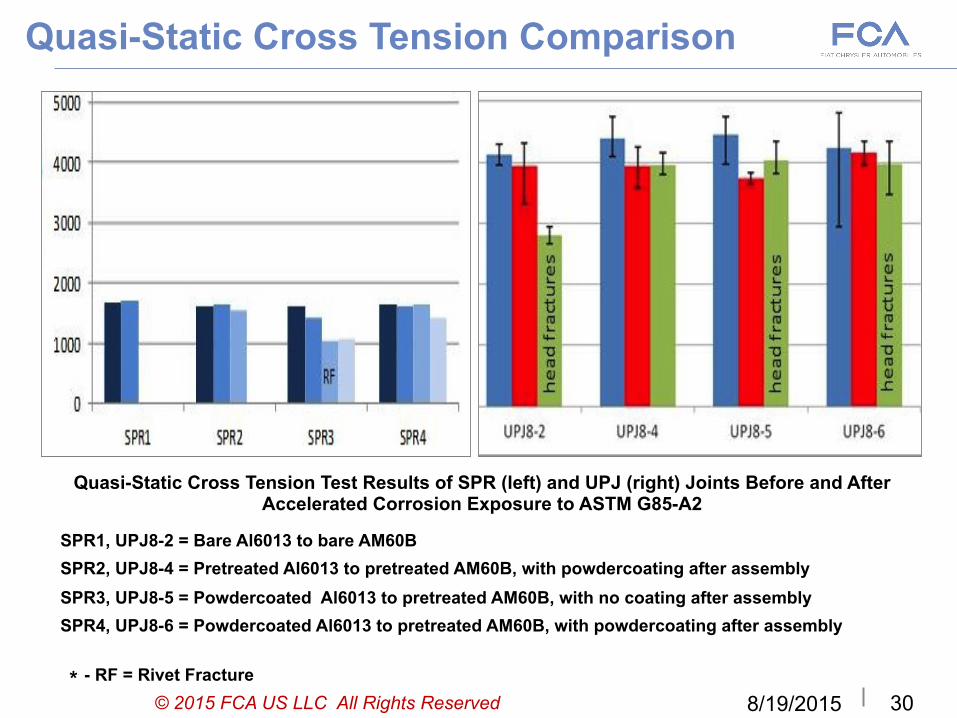
Quasi-Static Cross Tension Comparison
Quasi-Static Cross Tension Test Results of SPR (left) and UPJ (right) Joints Before and After Accelerated Corrosion Exposure to ASTM G85-A2
SPR1, UPJ8-2 = Bare Al6013 to bare AM60B SPR2, UPJ8-4 = Pretreated Al6013 to pretreated AM60B, with powdercoating after assembly SPR3, UPJ8-5 = Powdercoated Al6013 to pretreated AM60B, with no coating after assembly SPR4, UPJ8-6 = Powdercoated Al6013 to pretreated AM60B, with powdercoating after assembly
* - RF = Rivet Fracture © 2015 FCA US LLC All Rights Reserved
8/19/2015
31
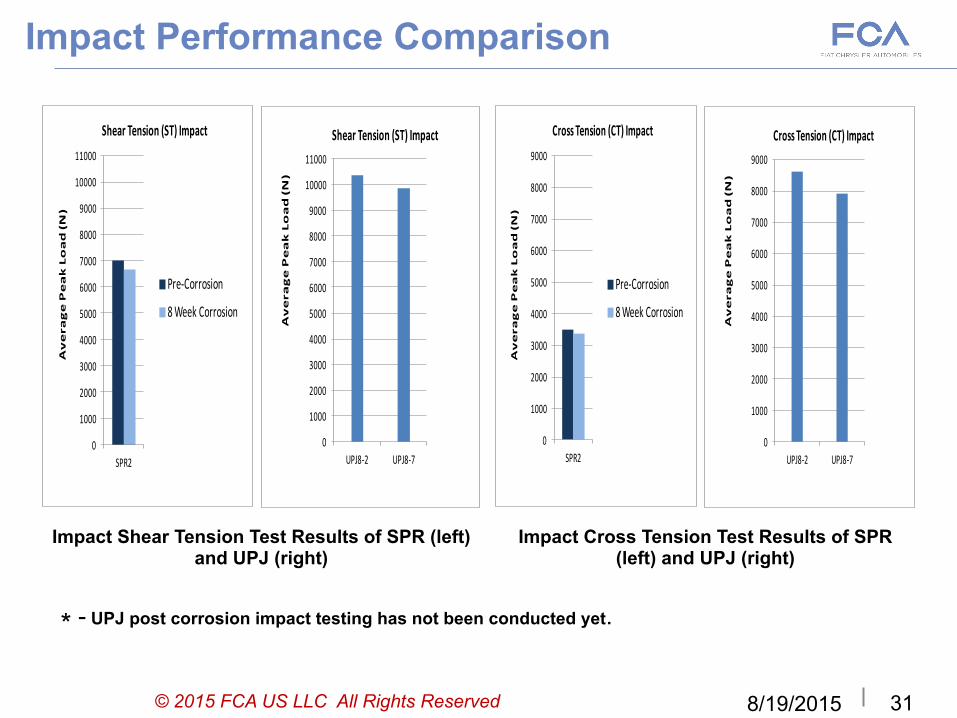
Impact Performance Comparison
#43 #42
0
1000
2000
3000
4000
5000
6000
7000
8000
9000
10000
11000
SPR2
Average Peak Load (N)
Shear Tension (ST) Impact
Pre-‐Corrosion
8 Week Corrosion
0
1000
2000
3000
4000
5000
6000
7000
8000
9000
10000
11000
UPJ8-‐2 UPJ8-‐7
Average Peak Load (N)
Shear Tension (ST) Impact
#43 #42
0
1000
2000
3000
4000
5000
6000
7000
8000
9000
SPR2
Average Peak Load (N)
Cross Tension (CT) Impact
Pre-‐Corrosion
8 Week Corrosion
0
1000
2000
3000
4000
5000
6000
7000
8000
9000
UPJ8-‐2 UPJ8-‐7
Average Peak Load (N)
Cross Tension (CT) Impact
Impact Shear Tension Test Results of SPR (left) and UPJ (right)
Impact Cross Tension Test Results of SPR (left) and UPJ (right)
* - UPJ post corrosion impact testing has not been conducted yet.
© 2015 FCA US LLC All Rights Reserved
8/19/2015
32
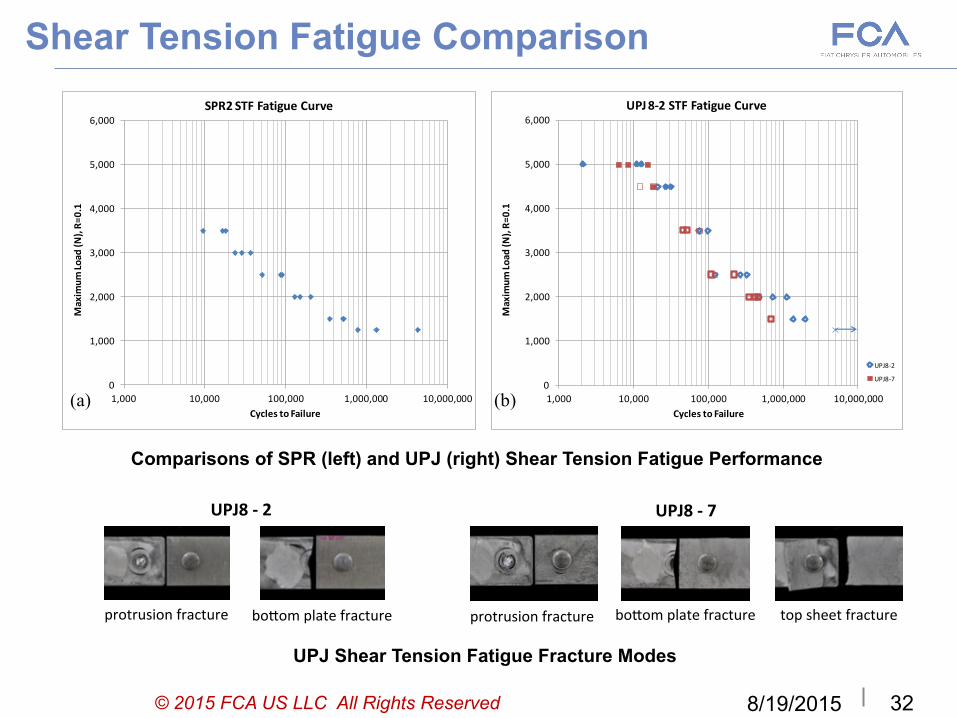
Shear Tension Fatigue Comparison
0
1,000
2,000
3,000
4,000
5,000
6,000
1,000 10,000 100,000 1,000,000 10,000,000
Maxim
um Lo
ad (N
), R=
0.1
Cycles to Failure
SPR2 STF Fatigue Curve
0
1,000
2,000
3,000
4,000
5,000
6,000
1,000 10,000 100,000 1,000,000 10,000,000
Maxim
um Lo
ad (N
), R=
0.1
Cycles to Failure
UPJ 8-‐2 STF Fatigue Curve
UPJ8-‐2
UPJ8-‐7
(a) (b)
Comparisons of SPR (left) and UPJ (right) Shear Tension Fatigue Performance
#193 #192
UPJ8 -‐ 2 UPJ8 -‐ 7
protrusion fracture protrusion fracture boFom plate fracture boFom plate fracture top sheet fracture
© 2015 FCA US LLC All Rights Reserved
UPJ Shear Tension Fatigue Fracture Modes

8/19/2015
33
Cross Tension Fatigue Comparison
0
200
400
600
800
1,000
1,200
1,400
1,600
1,800
2,000
2,200
10,000 100,000 1,000,000 10,000,000
Maxim
um Lo
ad (N
), R=
0.1
Cycles to Failure (stiffness reduction)
SPR2 CTF Fatigue Curve
0
200
400
600
800
1,000
1,200
1,400
1,600
1,800
2,000
2,200
1,000 10,000 100,000 1,000,000 10,000,000
Maxim
um Lo
ad (N
), R=
0.1
Cycles to Failure
UPJ 8-‐2 CTF Fatigue Curve
(a) (b)
Comparisons of SPR (left) and UPJ (right) Cross Tension Fatigue Performance (above) and Associated Failure Modes (below)
protrusion fracture top sheet fracture
© 2015 FCA US LLC All Rights Reserved

8/19/2015
34
• Magnesium has outstanding potential as a lightweight structural material alternative, especially when used with the die-casting process to integrate components and features. – However, significant challenges to increased use of magnesium include
joining, galvanic corrosion, and coatings performance.
• A new process known as upset protrusion joining (UPJ) has been developed by FCA US and its partners to reduce some of the joining challenges associated with joining Mg die-castings to similar and dissimilar metals.
• The UPJ process has been evaluated against a current light metal joining benchmark (SPR) for joining AM60B magnesium alloy test coupons to Al6013 aluminum sheet test coupons. – It should be noted that while SPR is currently used on a large number of
current production Al to Al applications, it is not currently used for joining Al to Mg.
– Evaluations included quasi-static, fatigue, impact, and corrosion performance comparisons.
Summary
© 2015 FCA US LLC All Rights Reserved

8/19/2015
35
• SPR joints displayed consistent joint strength in quasi-static, fatigue, and impact. However, several joints separated when subjected to an aggressive ASTM G85-A2 accelerated corrosion procedure. – Separation resulted from hydrogen embrittlement of the steel rivet.
• UPJ demonstrated significantly improved quasi-static and impact performance over SPR, especially in cross tension performance.
• UPJ demonstrated improved low cycle fatigue performance over SPR and similar high cycle fatigue performance.
• Corrosion performance evaluation of SPR and UPJ joints exposed to ASTM G85-A2 allows for the following conclusions: – For bare Mg AM60B to bare Al6013 joints, both SPR and UPJ joints can
separate in only 6 wks, though fewer separations are observed for UPJ. – For pretreated Mg AM60B to pretreated Al6013 joints, a substantial
number of SPR joints have separated by 6-wks while none of the UPJ joints have separated even after 8 wks.
– For pretreated Mg AM60B to coated Al6013 joints, neither SPR or UPJ showed any joint separations or substantial joint performance degradation even after 12 wks.
Summary
© 2015 FCA US LLC All Rights Reserved
8/19/2015
36
Collaboration Partners FCA US would like to acknowledge the following partners for their invaluable assistance in this program • U.S. Department of Energy and U.S. Department of Defense
– Provided substantial funding support to help this program be successful.
• AET Integration, Inc. – Industry Primary subcontractor to FCA US – Provided weld process development, machining services, joint evaluations, and
metallurgical services throughout the project as well as overseeing additional subcontractors, joining SPR coupons, overseeing process modeling simulation efforts, and providing testing and evaluation services for all testing except corrosion.
• Automotive Partnership Canada (APC) – Provided substantial funding support to McMaster University and Canmet Materials
to provide thermo-mechanical material characterization of magnesium alloys.
• McMaster University – University collaboration – Worked with Canmet to develop magnesium alloy thermo-mechanical compression
data and constitutive equations to support process modeling efforts.
• Canmet Materials (CMAT) – Canadian federal laboratory collaboration – Provided use of their Gleeble® test machines and technical assistance to McMaster
University researchers in order to obtain thermo-mechanical evaluation and characterization data from cylindrical compression test coupons.
© 2015 FCA US LLC All Rights Reserved