evaluating the safety benefits of a low cost driving...
TRANSCRIPT

Evaluating the Safety Benefits of a Low-Cost Driving Behavior Management System in
Commercial Vehicle Operations
June 2010

FOREWORD Motor vehicle crashes are often predictable and preventable. Yet, many drivers choose to behave in ways that put themselves and others at risk for a vehicle crash and/or serious injuries. At-risk driving behaviors include violating speed limits, excessive speed/lateral acceleration on curves, unplanned lane departures, frequent hard braking, close following distances, lateral encroachment (e.g., during attempted lane changes, perhaps due to improper mirror use), failure to yield at intersections, general disobedience of the rules-of-the-road, etc. Performing at-risk driving behaviors is likely to increase crash risk.
Behavioral approaches to safety have provided robust positive results when applied in organizations seeking to reduce employee injuries due to at-risk behaviors. However, almost all prior behavioral safety research has been applied in work settings where employees can systematically observe the safe versus at-risk behavior of their coworkers. In contrast, commercial truck and bus drivers typically work alone in relative isolation and thus require alternative strategies. Until recently, the primary problem with implementing behavior-based approaches has been getting quality behavioral data on driving behaviors. New technologies are available that provide objective measures of driver behavior. These in-vehicle technologies are able to provide continuous measures on a wide variety of driving behaviors previously unavailable to fleet safety managers. Some driving behavior management systems (DBMSs) use in-vehicle video technology to record driver behavior. These recordings can be used by fleet safety managers to provide feedback on safe and at-risk driving behaviors.
The Federal Motor Carrier Safety Administration funded this project to provide an independent evaluation of a commercially available low-cost DBMS. Participating drivers drove an instrumented vehicle for 17 consecutive weeks while they made their normal, revenue-producing deliveries. During the 4-week baseline phase, the DBMS recorded safety-related events; however, the feedback light on the event recorder was disabled and safety managers did not have access to the recorded safety-related events to provide feedback to drivers. During the 13-week intervention phase, the feedback light on the event recorder was activated and safety managers had access to the recorded safety-related events (following a recommended coaching protocol with drivers when necessary). The primary analyses in the current report determined the safety benefits of a commercially available low cost DBMS.
NOTICE This document is disseminated under the sponsorship of the U.S. Department of Transportation in the interest of information exchange. The United States Government assumes no liability for its contents or use thereof.
This report does not constitute a standard, specification, or regulation.
The United States Government does not endorse products or manufacturers. Trade or manufacturers’ names appear herein solely because they are considered essential to the objective of this report.

Technical Report Documentation Page 1. Report No. FMCSA-RRR-10-033
2. Government Accession No.
3. Recipient's Catalog No.
5. Report Date June 2010
4. Title and Subtitle EVALUATING THE SAFETY BENEFITS OF A LOW-COST DRIVING BEHAVIOR MANAGEMENT SYSTEM IN COMMERCIAL VEHICLE OPERATIONS 6. Performing Organization Code
7. Author(s) Jeffrey S. Hickman and Richard J. Hanowski
8. Performing Organization Report No.
10. Work Unit No. (TRAIS)
9. Performing Organization Name and Address Virginia Tech Transportation Institute 3500 Transportation Research Plaza (0536) Blacksburg, VA 24061
11. Contract or Grant No. DTMC75-07-D-00006, Task Order # 1 13. Type of Report and Period Covered Final Report July 2007–July 2009
12. Sponsoring Agency Name and Address U.S. Department of Transportation Federal Motor Carrier Safety Administration Office of Analysis, Research and Technology 1200 New Jersey Ave. SE Washington, DC 20590
14. Sponsoring Agency Code
15. Supplementary Notes This program was administered through the Federal Motor Carrier Safety Administration (FMCSA). The FMCSA Program Manager was Olu Ajayi and the Contracting Officer Technical Representative was Martin Walker, PhD. 16. Abstract This project provides an independent evaluation of a commercially available low-cost driving behavior management system. Participating drivers from two carriers (identified as Carrier A and Carrier B) drove an instrumented vehicle for 17 consecutive weeks while they made their normal, revenue-producing deliveries. During the 4-week baseline phase, the event recorder recorded safety-related events; however, the feedback light on the event recorder was disabled and safety managers did not have access to the recorded safety-related events to provide feedback to drivers. During the 13-week intervention phase, the feedback light on the event recorder was activated and safety managers had access to the recorded safety-related events and followed a recommended coaching protocol with drivers (when necessary). Carrier A significantly reduced the mean rate of recorded safety-related events/10,000 vehicle miles travelled (VMT) from baseline to intervention by 38.1 percent (p = 0.046), while Carrier B significantly reduced the mean rate of recorded safety-related events/10,000 VMT from baseline to intervention by 52.2 percent (p = 0.03). The results suggest the combination of onboard safety monitoring and behavioral coaching were responsible for the reduction in the mean rate of safety-related events/10,000 VMT at Carriers A and B.
17. Key Words behavioral safety, carrier safety, CMV, commercial motor vehicle, driver behavior, low-cost driving behavior management system, onboard safety monitoring, truck
18. Distribution Statement No restrictions
19. Security Classif. (of this report) Unclassified
20. Security Classif. (of this page) Unclassified
21. No. of Pages 68
22. Price N/A
Form DOT F 1700.7 (8-72) Reproduction of completed page authorized.

SI* (MODERN METRIC) CONVERSION FACTORS Table of APPROXIMATE CONVERSIONS TO SI UNITS
Symbol When You Know Multiply By To Find Symbol LENGTH In inches 25.4 millimeters mm Ft feet 0.305 meters m Yd yards 0.914 meters m Mi miles 1.61 kilometers km AREA in² square inches 645.2 square millimeters mm² ft² square feet 0.093 square meters m² yd² square yards 0.836 square meters m² Ac acres 0.405 hectares ha mi² square miles 2.59 square kilometers km²
VOLUME Note: Volumes greater than 1000 L shall be shown in m³
fl oz fluid ounces 29.57 milliliters mL Gal gallons 3.785 liters L ft³ cubic feet 0.028 cubic meters m³ yd³ cubic yards 0.765 cubic meters m³ MASS Oz ounces 28.35 grams g Lb pounds 0.454 kilograms kg T short tons (2000 lb) 0.907 megagrams (or “metric ton”) Mg (or “t”) TEMPERATURE temperature is in exact degrees °F Fahrenheit 5 × (F-32) ÷ 9
or (F-32) ÷ 1.8 Celsius °C
ILLUMINATION Fc foot-candles 10.76 lux lx Fl foot-Lamberts 3.426 candela/m² cd/m² Force and Pressure or Stress Lbf poundforce 4.45 Newtons N lbf/in² poundforce per square inch 6.89 kilopascals kPa
Table of APPROXIMATE CONVERSIONS FROM SI UNITS Symbol When You Know Multiply By To Find Symbol LENGTH Mm millimeters 0.039 inches in M meters 3.28 feet ft M meters 1.09 yards yd Km kilometers 0.621 miles mi AREA mm² square millimeters 0.0016 square inches in² m² square meters 10.764 square feet ft² m² square meters 1.195 square yards yd² Ha hectares 2.47 acres ac km² square kilometers 0.386 square miles mi² VOLUME mL milliliters 0.034 fluid ounces fl oz L liters 0.264 gallons gal m³ cubic meters 35.314 cubic feet ft³ m³ cubic meters 1.307 cubic yards yd³ MASS G grams 0.035 ounces oz Kg kilograms 2.202 pounds lb Mg (or “t”) megagrams (or “metric ton”) 1.103 short tons (2000 lb) T TEMPERATURE temperature is in exact degrees °C Celsius 1.8C + 32 Fahrenheit °F ILLUMINATION Lx lux 0.0929 foot-candles fc cd/m² candela/m² 0.2919 foot-Lamberts fl Force & Pressure or Stress N Newtons 0.225 poundforce lbf kPa Kilopascals 0.145 poundforce per square inch lbf/in²
* SI is the symbol for the International System of Units. Appropriate rounding should be made to comply with Section 4 of ASTM E380. (Revised March 2003, Section 508 accessible version August 2009).
ii

TABLE OF CONTENTS
ACRONYMS............................................................................................................................... VI
EXECUTIVE SUMMARY .......................................................................................................VII
1. .................................................................................................................1 INTRODUCTION1.1 .....................................................................1 BACKGROUND AND SIGNIFICANCE
1.1.1 ...................................................................... 2 Behavioral Approaches to Safety
1.2 ......................................................3 ON-BOARD SAFETY MONITORING DEVICES
1.2.1 ........................................................................................................... 4 Summary
2. ...............................................................................................................5 METHODOLOGY2.1 .................................................................................................5 TECHNOLOGY SCAN
2.2 ................................................................................5 PARTICIPANTS AND SETTING
2.2.1 ................................................................................................. 5 Power Analysis
2.2.2 ......................................................................................... 6 Participating Drivers
2.3 ...................................................................................................6 RESEARCH DESIGN
2.4 ..............................................................................................................7 PROCEDURES
2.4.1 ........................................................................................... 7 Driver Recruitment
2.4.2 .................................................................................................. 7 Driver Briefing
2.4.3 ................................................................... 8 Fleet Safety Manager Recruitment
2.4.4 ........................................................... 8 Fleet Safety Manager Training Seminar
2.4.5 ......................................................................... 9 Installation of Event Recorders
2.4.6 .................................................................................... 9 Data Collection Process
2.4.7 ................................................................................................ 12 Data Reduction
2.5 ......................................................................................................13 DATA ANALYSIS
HYPOTHESIS 1: There will be a significant reduction in the mean rate of safety-related events from baseline to intervention. .................................................. 13
HYPOTHESIS 2: There will be a significant reduction in the mean rate of severe safety-related events from baseline to intervention. ....................................... 14
3. ............................................................................................................................15 RESULTS3.1 .......................................................15 DRIVER DEMOGRAPHIC QUESTIONNAIRE
3.2 ..................................16 SAFETY MANAGER DEMOGRAPHIC QUESTIONNAIRE
3.2.1 ........................................ 16
HYPOTHESIS 1: There will be a significant reduction in the mean rate of safety-related events from baseline to intervention
3.2.2 ............................. 21
HYPOTHESIS 2: There will be a significant reduction in the mean rate of severe safety-related events from baseline to intervention
iii

iv
3.3 ..................................................................23 IN-STUDY DRIVER QUESTIONNAIRE
3.4 ..........................................................................25 POST-STUDY QUESTIONNAIRES
3.4.1 ............................................................................................................. 25 Drivers
3.4.2 ..................................................................................... 27 Fleet Safety Managers
3.5 ............................................................................................29 POST-HOC ANALYSES
4. .................................................................................33 SUMMARY AND CONCLUSIONS4.1 .................................................................................................................33 SUMMARY
4.2 ..........................................................................................................34 CONCLUSIONS
4.3 .............................................................................................37 RECOMMENDATIONS
ACKNOWLEDGEMENTS ........................................................................................................49
REFERENCES.............................................................................................................................51
LIST OF APPENDICES
APPENDIX A. DRIVER DEMOGRAPHIC QUESTIONNAIRE.........................................39
APPENDIX B. IN-STUDY QUESTIONNAIRE......................................................................41
APPENDIX C. POST-STUDY DRIVER QUESTIONNAIRE...............................................43
APPENDIX D. SAFETY MANAGER DEMOGRAPHIC QUESTIONNAIRE...................45
APPENDIX E. POST-STUDY SAFETY MANAGER QUESTIONNAIRE.........................47

LIST OF FIGURES Figure 1. Image. Event Recorder (Left) and Typical Installation of Event Recorder behind the
Vehicle’s Rearview Mirror (Right) ................................................................................10 Figure 2. Image. Front Camera View (Left) and Driver's Face View (Right)...............................10 Figure 3. Image. Screen Shot of the Event List Page ....................................................................11 Figure 4. Image. Screen Shot of the Event Analysis Page.............................................................12 Figure 5. Image. Scoring Options Available to Data Analysts during Data Reduction ................13 Figure 6. Image. Flow Diagram of Data Reduction Process .........................................................13 Figure 7. Graph. Mean Rate of Safety-Related Events/10,000 VMT across 17 Weeks of Data
Collection at Carrier A ...................................................................................................19 Figure 8. Graph. Mean Rate of Safety-Related Events/10,000 VMT across 17 Weeks of Data
Collection at Carrier B ...................................................................................................21 Figure 9. Graph. Mean Rate of Severe Safety-Related Events/10,000 VMT across 17 Weeks
of Data Collection at Carrier A ......................................................................................22 Figure 10. Graph. Mean Rate of Severe Safety-Related Events/10,000 VMT across 17 Weeks
of Data Collection at Carrier B ......................................................................................23 Figure 11. Graph. Frequency of Driver Comments in the Post-Study Driver Questionnaire........27 Figure 12. Graph. Mean Rate of Safety-Related Events/10,000 VMT during the Baseline and
Intervention Phases for Drivers in the Fleet Manager Coaching and No Fleet Manager Coaching Groups at Carrier A.........................................................................30
Figure 13. Graph. Mean Rate of Severe Safety-Related Events/10,000 VMT during the Baseline and Intervention Phases for Drivers in the Fleet Manager Coaching and No Fleet Manager Coaching Groups at Carrier A..........................................................31
LIST OF TABLES
Table 1. Selected Results from the Driver Demographic Questionnaire at Carriers A and B.......15 Table 2. Selected Results from Safety Manager Demographic Questionnaire at Carriers
A and B...........................................................................................................................16 Table 3. Frequency and Percentage of Safety-Related Events at Carrier A ..................................18 Table 4. Frequency and Percentage of Safety-Related Events at Carrier B ..................................20 Table 5. Selected Results from the In-Study Driver Questionnaire at Carriers A and B ..............24 Table 6. Selected Results from the Post-Study Driver Questionnaire at Carriers A and B...........26 Table 7. Selected Results from the Post-Study Safety Manager Questionnaire at Carriers
A and B...........................................................................................................................28
v

ACRONYMS
Acronym Definition ATRI American Transportation Research Institute
CMV commercial motor vehicle
DBMS Driving Behavior Management System
FMCSA Federal Motor Carrier Safety Administration
ICF Informed Consent Form
LTCCS Large-Truck Crash Causation Study
VMT Vehicle Miles Traveled
VTTI Virginia Tech Transportation Institute
vi

EXECUTIVE SUMMARY
INTRODUCTION
Motor vehicle crashes are often predictable and preventable. Yet, many drivers choose to behave in ways that put themselves and others at risk for a vehicle crash and/or serious injuries. One of the most significant studies on the factors that contribute to motor vehicle crashes was the Indiana Tri-Level Study (Treat et al., 1979). To provide insight into the factors that contribute to traffic crashes, collision data were examined across three different levels to assess causal factors as being definite, probable, or possible. The study determined that 90.3 percent of the crashes involved some type of human error, such as at-risk driving behavior, inadvertent errors, and impaired states. While the vehicles in Treat et al. (1979) were predominantly passenger vehicles, the same relationship can be found in heavy vehicles. The Large Truck Crash Causation Study (LTCCS) performed by the Federal Motor Carrier Safety Administration (FMCSA), assessed the causes of, and contributing factors to, crashes involving commercial motor vehicles (CMVs). The LTCCS (FMCSA, 2006) found that 87.3 percent of the critical reasons assigned to the large-truck driver were driver errors, including decision errors (38 percent; driver drove too fast for conditions), recognition errors (28.4 percent; driver did not recognize the situation due to not paying proper attention), non-performance errors (11.6 percent; driver fell asleep), and performance errors (9.2 percent; driver exercised poor directional control).
Behavioral Approaches to Safety A review of published behavioral safety studies by Sulzer-Azaroff and Austin (2000) found that 96.9 percent of the studies reviewed showed significant reductions in work-related injuries after the implementation of behavioral safety techniques. Geller (2001) found that behavioral safety programs are advantageous because they are easy to implement, easy to teach, and may be implemented in the setting where the problem occurs. Behavioral safety programs have successfully increased safety-related work behaviors in a variety of organizational settings. In a review of 53 occupational safety and health studies covering various safety approaches, Gustello (1993) found that behavioral safety approaches had the highest average reduction in injury rate (59.6 percent).
However, almost all prior behavioral safety research has been applied in work settings where employees can systematically observe the safe versus at-risk behaviors of their coworkers. In contrast, commercial truck and bus drivers typically work alone and in relative isolation and thus require alternative strategies. Implementing new behavior based strategies for truck drivers will require acquiring quality behavioral data on driving behaviors. If behavioral approaches can be integrated with technologies that monitor driver behavior, fleet safety managers would have an effective tool to improve safety-related behaviors that occur when there is little or no opportunity for interpersonal observation and feedback.
On-Board Safety Monitoring Devices New technologies are available that provide objective measures of driver behavior. These in-vehicle technologies are able to provide continuous measures on a wide variety of driving behaviors previously unavailable to fleet safety managers. Some driving behavior monitoring
vii

systems (DBMS) use in-vehicle video technology to record driver behavior. These recordings can be used by fleet safety managers to provide feedback on safe and at-risk driving behaviors. Behavioral approaches to safety are directed at modifying at-risk driving behaviors to reduce crash and injury risk. Thus, DBMSs have the potential to be used in conjunction with behavioral safety techniques to reduce a variety of at-risk behaviors. The current study provides an independent evaluation of a commercially available low-cost DBMS with CMV drivers.
METHOD
This quasi-experiment (i.e., no participant randomization) used a simple A4B13 design; where “A” and “B” referred to the baseline and intervention phases, respectively. The superscript refers to the number of weeks in each phase (i.e., “4” referred to four weeks). During the 4-week baseline phase, drivers from two carriers (identified in text as Carrier A and Carrier B) drove an instrumented vehicle during their normal, revenue-producing deliveries. An event recorder was configured to record safety-related events as normal; however, the feedback light (a light on the event recorder, visible to the driver, flashed each time an event was recorded) was disabled and no driver coaching occurred. Immediately following the 4-week baseline, the intervention phase began. During the 13-week intervention phase, drivers drove an instrumented vehicle during their normal, revenue-producing deliveries. During this time, the event recorder recorded safety-related events as normal and the DBMS program was enabled (i.e., the feedback light was activated and safety managers followed a recommended coaching protocol when necessary). As the independent evaluators in this research, procedures described below were limited to those performed by the authors.
Participants and Setting Carrier A was a long-haul carrier located in the Southeastern United States that primarily delivered dry goods. A total of 50 drivers had an event recorder installed in their trucks (36 drivers completed data collection). A total of 46 drivers at Carrier A signed an Informed Consent Form (ICF) that allowed researchers to send questionnaires to participating drivers. The mean age of these 46 drivers was 44 years old (range = 23 to 61 years old). Carrier B was a local/short-haul carrier located in the Northwestern United States that primarily delivered beverage and paper goods. A total of 50 drivers had an event recorder installed in their trucks (41 drivers completed data collection). A total of 30 drivers at Carrier B signed an ICF that allowed researchers to send questionnaires to participating drivers. The mean age of these 30 drivers was 50 years old (range = 27 to 71 years old).
Procedure Prior to the event recorders being installed in the vehicles, drivers attended an initial project briefing. The project briefing lasted approximately 2 hours and included details regarding the project, informed consent, how the DBMS worked, and the recommended coaching process. Drivers indicated their interest in participating in the study by signing the ICF. Drivers who signed the ICF were asked to complete a Driver Demographic Questionnaire. Fifty event recorders were installed in 50 trucks at both participating carriers. Prior to the start of the 4-week baseline phase, drivers were instructed to make their normal, revenue-producing deliveries. During this time, the event recorders captured safety-related events; however, the feedback lights
viii

on the recorders were deactivated, no coaching occurred, and fleet safety managers did not have access to the data collected by the event recorders (unless a crash occurred).
Prior to the start of the 13-week intervention phase, safety managers attended a training seminar that lasted approximately 3 hours. The safety manager training seminar included details regarding the project, informed consent, how the DBMS worked, how to use the technology vendor’s software, and how to “coach” drivers using the video data. Safety managers indicated their interest in participating in the study by signing the ICF. Safety managers who signed the ICF were asked to complete the Safety Manager Demographic Questionnaire. After the safety manager training seminar, the 13-week intervention phase began. During this phase, drivers were instructed to make their normal, revenue-producing deliveries. However, the feedback light on the event recorder was activated, safety managers coached drivers (when necessary), and safety managers had access to all the data collected by the event recorders during the 13-week intervention phase.
Data Collection Process
DriveCam®, a product vendor, was responsible for all data collection and reduction. The event recorder had two camera views: (1) driver’s face view, and (2) forward-facing view. The event recorder had three accelerometers (y-, x-, and z-axis) that triggered an event to be recorded. If the criterion was met or surpassed (e.g., greater than or equal to │0.5 g│), the event recorder saved 12 s of video (i.e., 8 s prior to the criterion being met or surpassed and 4 s after). The video and quantitative data were automatically sent to the vendor’s headquarters in San Diego, CA, via cellular transmission. Once received, the data were reviewed, reduced (i.e., data analysts marked the presence of specific variables pertaining to the event), and uploaded to a server. While all safety-related events were uploaded to the server for review, only those safety-related events that exceeded a certain threshold (or “Event Score”) were reviewed with the driver. Event Scores in the current study ranged from 0 to 11 (e.g., 0 = collision; 3 = driver unbelted; and 11 = driver involved in a near-crash, while talking on a cell phone and unbelted). Typically, an Event Score greater than or equal to 5 was marked to be reviewed by the safety manager to determine with the driver present; however, it was ultimately up to the safety manager which safety-related events were reviewed with the driver. Note that collisions were not reduced or scored by DriveCam personnel due to client liability concerns. Once on the server, the authors and safety managers had on-line access to the data via proprietary software. Researchers checked the software each day and recorded the frequency of safety-related events, severity, driving behaviors, date, driver#, and quantitative data.
RESULTS
Hypothesis 1: There will be a significant reduction in the mean rate of safety-related events from baseline to intervention
Carrier A
During the 4-week baseline phase, a total of 58 safety-related events were captured by event recorders (2 collisions and 56 risky driving events) from the 36 drivers who completed the study (14 drivers quit, resigned, withdrew, had a malfunctioning event recorder, and/or did not meet
ix

the criteria for inclusion in the analyses). These 36 drivers drove a total of 291,869 miles during the baseline phase. A rate was calculated to account for exposure (i.e., frequency of safety-related events/10,000 vehicle miles traveled [VMT]). The mean rate of safety-related events/10,000 VMT during the baseline phase was 1.9 safety-related events.
During the 13-week intervention phase, 141 safety-related events were captured by event recorders (2 collisions and 139 risky driving events) over the course of 1,170,721 miles. The mean rate of safety-related events/10,000 VMT during the intervention phase was 1.2. A paired sample t test found the 38.1 percent reduction in the mean rate of safety-related events/10,000 VMT from the baseline phase (1.9) to the intervention phase (1.2) to be statistically significant.
Carrier B
During the 4-week intervention phase a total of 65 safety-related events were captured by the event recorder (1 collision and 64 risky driving events) from the 41 drivers who completed the study (9 drivers quit, resigned, withdrew, had a malfunctioning event recorder, and/or did not meet the criteria for inclusion in the analyses). These 41 drivers drove a total of 162,492 miles during the baseline phase. As indicated above, a rate was calculated to account for exposure. The mean rate of safety-related events/10,000 VMT during the baseline phase was 4.02.
During the 13-week intervention phase, 117 safety-related events were captured by event recorder (2 collisions and 115 risky driving events) over the course of 615,403 miles. The mean rate of safety-related events/10,000 VMT during the intervention phase was 1.93. A paired sample t test found the 52.2 percent reduction in the mean rate of safety-related events/10,000 VMT from the baseline phase (4.0) to the intervention phase (1.93) to be statistically significant.
Note that additional analyses are presented in the main body of the current report. These include analyses of questionnaire data, severe safety-related events, and post-hoc analyses of drivers who did and did not receive feedback.
Hypothesis 2: There will be a significant reduction in the mean rate of severe safety-related events from baseline to intervention The mean rate of severe safety-related events (i.e., with an Event Score > 3) during the baseline and intervention phases were compared in Hypothesis 2. A “severe” event was defined as any safety-related event with an Event Score > 3. For each participant the frequency of severe safety-related events during the baseline phase was divided by the number of VMT during the baseline phase. The same procedures were used for data collected during the intervention phase. A paired sample t test was used to assess if there was a significant reduction in the mean frequency of severe safety-related events/10,000 VMT from baseline to intervention (α = 0.05).
Carrier A
At Carrier A there were a total of 16 severe safety-related events out of a total of 199 safety-related events (8.0 percent). The mean rate of severe safety-related events/10,000 VMT during the baseline phase was 0.22, while the mean rate of severe safety-related events/10,000 VMT during the intervention phase was 0.09. The 59.1 percent reduction in the mean rate of severe safety-related events/10,000 VMT from the baseline to the intervention phase was not statistically significant. The lack of sufficient statistical power could be the reason why
x

Hypothesis 2 was not supported at Carrier A. Note the power analysis indicated that 30 drivers would be sufficient to detect a significant difference; however, this analysis did not consider severe safety-related events. Nonetheless, despite the lack of a significant reduction, a 59.1 percent decrease in the mean rate of severe safety-related events/10,000 VMT is noteworthy.
Carrier B
At Carrier B there were a total of 28 severe safety-related events out of a total of 179 safety-related events (15.6 percent). The mean rate of severe safety-related events/10,000 VMT during the baseline phase was 0.36, while the mean rate of severe safety-related events/10,000 VMT during the intervention phase was 0.2. The 44.4 percent reduction in the mean rate of severe safety-related events/10,000 VMT from the baseline to the intervention phase was not statistically significant. As with the Carrier A results, Hypothesis 2 was not supported at Carrier B. As indicated above, this could be due to limited statistical power. However, as with the Carrier A findings, a substantial reduction of 44.4 percent in the mean rate of severe safety-related events/10,000 VMT was observed at Carrier B. While not significant, due to the small number of severe events, the percentage reduction in severe safety-related events at Carriers A and B have practical significance.
CONCLUSIONS
In interpreting these results, two issues are noteworthy. First, it appears Carrier B had superior decreases to Carrier A in the mean rate of safety-related events/10,000 VMT (based on percentage reduction); however, concluding differential intervention impact is risky because Carrier A drove more safely than Carrier B during the baseline phase (1.9 versus 4.0 safety-related events/10,000 VMT). For example, Carriers A and B likely experienced different safety-related environmental conditions due to the predominant roads driven. A naturalistic study by Hanowski, Olson, Hickman, and Dingus (2006) reported that long-haul drivers typically drive on rural divided roads (e.g., highways), while local/short-haul drivers typically drive on urban undivided roads. Nonetheless, both carriers had substantial safety improvements from the DBMS.
Second, drivers were aware the instrumented vehicles were recording their driving behaviors; thus, it is possible that drivers altered their performance accordingly (i.e., subject reactivity). However, it is unlikely this awareness influenced intervention impact as any reactivity to being observed is likely to be most prominent at the beginning of such procedures (Campbell, 1957). In fact, the data obtained during the baseline phase may have been understated, resulting in a less robust effect during the intervention phase. If this was the case, note that event recorders were installed in vehicles at Carriers A and B several weeks prior to the start of data collection. Thus, drivers would have become familiar with the presence of the event recorders by the time data collection began. As such, it is unlikely the results were impacted by reactivity effects since the strong, positive benefits of the DBMS in reducing safety-related events in this study were robust.
xi

xii
FUTURE RECOMMENDATIONS
The goal of the current study was to assess the efficacy of a commercially available low-cost DBMS in an applied setting while normal, revenue-producing deliveries were made. Thus, no attempt was made to deviate significantly from the existing DBMS. As prior research has found the combination of goal setting and feedback to be the optimal approach, future studies assessing the efficacy of a DBMS should consider the addition of goal setting training and directly assessing participants’ goals.
The current study did not assess implicit goal setting; thus, variations in goal setting among drivers could have been the reason for differential behavior change among drivers. The current DBMS was successful in significantly reducing the mean rate of safety-related events/10,000 VMT (by 37 and 52.2 percent at Carriers A and B, respectively). Though the safety benefits identified in this study were significant, it is possible that carriers may be reluctant to adopt such programs without a compelling case for return-on-investment. That is, though improved safety is a key outcome of the DBMS used in this study, it may not be sufficient to evoke widespread adoption of the technology. As such, the authors recommend that a follow-on cost-benefit analysis research be directed at assessing the return-on-investment of a DBMS. The authors recommend that such an assessment include the costs associated with implementing and maintaining the DBMS program as well as the direct (e.g., damage, health care, etc.) and indirect (e.g., legal fees, insurance costs, etc.) costs associated with reduced crashes and violations. If it can be shown that there a significant safety benefit from a DBMS and associated cost savings to carriers due to the associated reduction in safety events, then a strong case may be made for the efficacy of a DBMS program.
This current study was an exploratory study with limited scope and budget. The authors recommend that future follow-on studies consider utilizing a longer time frame for the baseline and intervention phases. This would provide ample opportunity to collect more data on safety-related events across both phases and possibly provide a better assessment of the intervention impacts of the DBMS program. Also, there is the possibility that driver behavior could be positively or negatively impacted during the study period by factors that are unrelated to the DBMS. Future studies should consider having a separate sample of truck drivers who are in the baseline condition throughout the entire study period. This would provide an alternate control group and help draw out the effect of other possible confounding factors.

1. INTRODUCTION
1.1 BACKGROUND AND SIGNIFICANCE
Motor vehicle crashes are often predictable and preventable. Yet, many drivers choose to behave in ways that put themselves and others at risk for a vehicle crash and/or serious injuries. At-risk driving behaviors include violating speed limits, excessive speed/lateral acceleration on curves, unplanned lane departures, frequent hard braking, close following distances, lateral encroachment (e.g., during attempted lane changes, perhaps due to improper mirror use), failure to yield at intersections, and general disobedience of the rules-of-the-road. Performing at-risk driving behaviors is likely to increase crash risk.
One of the most significant studies on the factors that contribute to motor vehicle crashes was the Indiana Tri-Level Study (Treat et al., 1979). To provide insight into the factors that contribute to traffic crashes, collision data were collected across three different levels to assess causal factors as being definite, probable, or possible. The study determined that 90.3 percent of the crashes involved some type of human error, such as at-risk driving behavior, inadvertent errors, and impaired states. Hendricks, Fell, and Freedman (1999) replicated the epidemiological method employed in the Indiana Tri-Level Study using the National Automotive Sampling System protocol. Similar to the Indiana Tri-Level Study, Hendricks, Fell, and Freedman found that human error was the most frequently cited contributing factor in these crashes (99.2 percent).
While the above studies were predominantly light-vehicle crashes, the same relationship can be found in heavy-vehicle crashes. The Large Truck Crash Causation Study (LTCCS), performed by the Federal Motor Carrier Safety Administration (FMCSA), assessed the causes of, and contributing factors to, crashes involving commercial motor vehicles (CMVs). The LTCCS (FMCSA, 2006) found that 87.3 percent of the critical reasons assigned to the large-truck driver were driver errors, including 38 percent that were decision errors (e.g., the truck driver was traveling too fast for conditions), 28.4 percent recognition errors (e.g., the truck driver did not recognize the situation due to not paying proper attention), 11.6 percent non-performance errors (e.g., the truck driver fell asleep), and 9.2 percent performance errors (e.g., the truck driver exercised poor directional control). Similarly, a naturalistic study by Hickman et al. (in press) found that 91.5 percent of the critical reasons assigned to the large-truck driver were driver errors, including 47.5 percent that were decision errors, 30.5 percent recognition errors, 11.9 percent performance errors, and 1.6 percent non-performance errors. Moreover, an American Trucking Research Institute (ATRI) study found similar support that driver behavior is the primary contributing factor in large-truck crashes (ATRI, 2005). The ATRI study analyzed data on 540,750 truck drivers—including driver traffic violations and convictions—gathered over a 3-year time frame to determine future crash predictability. The four convictions with the highest associations in future crash involvement were: (1) improper or erratic lane change, (2) failure to yield right of way, (3) improper turn, and (4) failure to maintain a proper lane. When a truck driver received a conviction for one of these behaviors, the likelihood of a future crash increased to between 91 to 100 percent. These studies suggest that driver behavior is the primary contributing factor in CMV crashes and that safety management approaches should focus on behavior to improve safety.
1

1.1.1 Behavioral Approaches to Safety Behavioral safety programs are advantageous because they are easy to implement, easy to teach, and may be implemented in the setting where the problem occurs (Daniels, 1999; Geller, 2001). Behavioral safety programs have been successfully used to increase safety-related work behaviors in a variety of organizational settings, including:
Pizza stores (Ludwig & Geller, 1991, 1997).
Paper mill (Fellner & Sulzer-Azaroff, 1984).
Mining industry (Fox, Hopkins, & Anger, 1987; Hickman & Geller, 2003).
Railroad (Peterson, 1984).
Gas pipeline company (McSween, 1995).
Manufacturing plants (Reber & Wallin, 1984).
Chemical research laboratory (Sulzer-Azaroff, 1978).
Food manufacturing plant (Komaki, Barwick, & Scott, 1978).
Infirmary at a residential center for mentally disabled individuals (Alavosius & Sulzer-Azaroff, 1986).
Building construction (Mattila & Hyödynmaa, 1988).
Telecommunication parts manufacturing plant (Sulzer-Azaroff, Loafman, Merante, & Hlavacek, 1990).
Shipyard (Saarela, 1990).
Utility company (Loafmann, 1998).
In a review of 53 occupational safety and health studies covering various safety approaches, Gustello (1993) found behavioral safety approaches had the highest average reduction in injury rate (59.6 percent) compared to other approaches. A review of published behavioral safety studies by Sulzer-Azaroff and Austin (2000) found that 96.9 percent of the studies reviewed showed significant reductions in work-related injuries after the implementation of behavioral safety techniques. Behavioral safety programs have also been shown to reduce workers’ compensation claims. Behavioral Science Technology, Inc. (1998) found a 70 percent reduction in workers’ compensation claims in the third year after the introduction of a behavioral safety program; and Hantula, Rajala, Kellerman, and Bragger (2001) showed reductions in workers’ compensation claims after the introduction of a behavioral safety intervention. Clearly, behavioral safety programs can be effective in reducing injuries and their associated costs.
Behavioral approaches to safety have provided robust positive results when applied in organizations seeking to reduce employee injuries due to at-risk behaviors. Primary techniques include peer observation and feedback, goal setting, and training and education sessions (Geller, 2001; Krause, Robin, & Knipling, 1999). Almost all prior behavioral safety research has been applied in work settings where employees can systematically observe the safe versus at-risk behavior of their coworkers. Drawbacks to this approach include: nonobjective, unreliable, or biased observation; the need for extensive training of observers; paid employee time needed to
2

make interpersonal behavioral observations; lack of motivation to make behavioral observationsand deliver feedback; and resistance to accept nonobjective and potentially biased feedback. These drawbacks are exacerbated in workers who operate heavy trucks and buses as they are typically solitary workers or workers with little supervision. Since most employees who operaa CMV as part of their job duties work alone, and because of the large human and economic costs associated with large-truck and passenger bus crashes, there would be great potential benefit from research developing practical behavioral safety techniques with CMV drivers.
te
The challenge, until recently, has been getting quality behavioral data on driving behaviors. Most CMV organizations use reactive approaches to assess safety outcomes. These include the frequency and severity of crashes and violations. However, crashes and violations only show a snapshot of driver behavior and it is too late to intervene on driver behavior after a crash occurs. A proactive approach focuses on specific driver behaviors—a leading indicator of driver safety that can address at-risk driving behaviors as they occur, prior to a crash and/or violation. If behavioral approaches can be integrated with technologies that monitor driver behavior, carrier safety managers would have an effective tool to improve safety-related behaviors that occur when there is little or no opportunity for interpersonal observation and feedback. Moreover, these data provide safety managers with leading indicators of driver safety; thus, safety managers can address potential safety issues prior to the occurrence of a crash and/or violation.
1.2 ON-BOARD SAFETY MONITORING DEVICES
New technologies are available that provide objective measures of driver behavior. These in-vehicle technologies provide continuous measures on a wide variety of driving behaviors previously unavailable to carrier safety managers. Some driving behavior management systems (DBMSs) use in-vehicle video technology to record driver behavior. These recordings can be used by safety managers to provide feedback on specific safe and at-risk driving behaviors. Behavioral approaches to safety posit that modification of safe and/or at-risk driving behaviors will greatly reduce crash and injury risk.
McGehee, Raby, Carney, Lee, and Reyes (2007) used in-vehicle video technology with newly licensed teen drivers. This technology provided novice teen drivers and their parents with a means of identifying their risky driving behaviors so that feedback could be provided to reduce future at-risk driving behaviors. McGehee et al. paired this new technology with parental feedback in the form of a weekly video review and a graphical report card. Each teen driver had his/her personal vehicle equipped with an event-triggered video device, designed to capture 20-second clips of the forward and cabin views whenever the vehicle exceeded lateral or forward threshold accelerations. Results indicated that the combination of video feedback and a graphical report card significantly decreased the rate of safety-related events in teen drivers. In the first 9 weeks of the intervention, the teen drivers reduced their rate of safety-relevant events from an average of 8.6 safety-related events per 1,000 VMT during baseline to 3.6 safety-related events per 1,000 VMT (58 percent reduction). The group further reduced the mean rate of safety-related events to 2.1 per 1,000 VMT in the following nine weeks (76 percent reduction). The decrease from 8.6 to 2.1 safety-related events per 1,000 miles was statistically significant (t = 4.15, p = 0.0007).
3

4
The McGehee et al. (2007) study illustrates the power of behavioral approaches to safety, in conjunction with DBMSs, to greatly reduce a variety of at-risk behaviors. Knipling, Hickman, and Bergoffen (2003) suggested the combination of DBMSs with other safety management techniques (especially behavioral safety techniques) is likely to be one of the most powerful approaches in reducing CMV crashes. The current study will provide an independent evaluation of a commercially available low-cost DBMS with CMV drivers.
1.2.1 Summary This research effort assessed the efficacy of a commercially available low-cost DBMS to determine the improvements in driving safety in CMV operations (measured through improved driver performance).
More specifically, a DBMS is comprised of three components: (1) in-vehicle video technology, (2) driving performance management software, and (3) driver counseling. The in-vehicle video technology records safety-related events (i.e., crashes, near-crashes, and safety-relevant conflicts) that involved the instrumented vehicles. Information about the safety-related event (e.g., level of longitudinal acceleration, video clip of event, etc.) is saved by the event recorder and accessed by safety managers via the performance management software. As part of the program, the safety managers engage the involved driver in counseling (also called coaching or feedback) aimed at correcting the driving behavior(s) that led to, or may have contributed to, the safety-related event. The safety manager may use the recorded and saved video and detailed information to pinpoint what the driver did or did not do to avoid the safety-related event, and coach the driver to avoid making the same mistake in the future.
This research is directed at determining if a commercially available low-cost DBMS was effective in reducing safety-related events caused by CMV drivers, including the methods necessary to accomplish this goal.

2. METHODOLOGY
2.1 TECHNOLOGY SCAN
Prior to the start of data collection, the authors investigated the available technology to identify commercially available low-cost DBMSs that could be used in the current study. As more than one technology vendor existed for a low-cost DBMS (i.e., less than $1,000), the authors published an online “Sources Sought” announcement on July 17, 2007, that was removed after 30 days. The announcement requested a brief proposal from interested technology vendors to participate in the current research project.
Of critical importance was the technology vendor’s willingness to provide, free of charge, the following:
At least 100 data collection units.
Installation of all data collection units.
All associated video data reduction from recorded events.
Safety manager and driver training.
All necessary support and/or maintenance.
Additionally, the technology vendor had to provide two CMV fleets (one long-haul; one local/short-haul) ready to participate in a pilot test of their system. DriveCam®, headquartered in San Diego, CA, was the only technology vendor to submit a proposal. After reviewing its proposal and conducting detailed discussions, this technology vendor was selected for this project.
2.2 PARTICIPANTS AND SETTING
2.2.1 Power Analysis Prior to the start of data collection, a power analysis was calculated on the number of required participants to detect a significant difference in the mean rate of safety-related events between the baseline and intervention phases. The Lipsey (1990) method was selected to calculate the sample size required to reach the estimated power, given estimates from the technology vendor’s prior research and given the hypothesized differences between baseline (e.g., data were collected, but no counseling occurred) and intervention phases (data were collected and counseling occurred when necessary). The Lipsey method uses the following equation:
Using this equation, Effect Size was the hypothesized effect size, XBaseline was the mean frequency of safety-related events during the baseline phase, XIntervention was the mean frequency of safety-related events during the Intervention phase, SBaseline
2 was the variance for the baseline phase, and S 2 was the variance for the intervention phase. A safety-related event was Intervention
5

operationally defined as an unexpected event resulting in a close call requiring fast action on thpart of the driver to avoid a crash, near-crash, or other traffic event. Safety-related events are likely to require emergency steering or braking, or both, by at least one of the drivers involvedSafety-related events are far more numerous than crashes, in which the driver could not avoid a collision through their emergency actions, or lack thereof (Hanowski, Keisler, & Wierwille, 2004).
e
.
The following estimated values were derived from the technology vendor’s prior research with over 21,000 drivers: XBaseline = 7.99; XIntervention = 1.87; S 2
Baseline = 48.44; and S 2Intervention = 5.46.
Using an alpha of 0.05 for a two-tailed t test and given the estimated effect size of 1.18, a power of 0.95 would be reached with 30 participants (Lipsey, 1990; page 91). Thus, an adequate sample of 50 participating drivers in each fleet type was chosen as a sufficient sample size to account for possible dropouts.
2.2.2 Participating Drivers e data (i.e., safety-related events), both participating carriers
al
s. A
2.3 RESEARCH DESIGN
This quasi-experiment used a simple A B design; where “A” and “B” refer to the baseline and intervention phases, respectively. The superscript refers to the number of weeks in each phase (i.e., “4” refers to 4 weeks). During the 4-week baseline phase, drivers drove an instrumented vehicle during their normal, revenue-producing deliveries. The event recorder was configured to record safety-related events as normal; however, the feedback light was disabled (under normal operation, a light on the event recorder flashed each time an event was recorded) and no driver counseling occurred. Immediately following the 4-week baseline, the 13-week intervention phase began, during which drivers drove an instrumented vehicle during their normal, revenue-producing deliveries. During this time, the event recorder recorded safety-related events as normal and the “coaching” program was enabled (i.e., the feedback light was activated and safety managers followed the recommended coaching protocol).
4 13
Given the sensitive nature of thsigned a non-disclosure agreement, which allowed the authors to collect data; however, both participating carriers were to remain anonymous in all research reports. Carrier A was a long-haul carrier located in the Southeastern United States that primarily delivered dry goods. A totof 50 drivers had an event recorder installed in their trucks at Carrier A (36 drivers completed data collection). A total of 46 drivers at Carrier A signed an informed consent form (ICF) that allowed researchers to send questionnaires to participating drivers. The mean age of these 46 drivers was 44 years old (range = 23–61 years old). Carrier B was a local/short-haul carrier located in the Northwestern United States. that primarily delivered beverage and paper goodtotal of 50 drivers had an event recorder installed in their trucks (41 drivers completed data collection). A total of 30 drivers at Carrier B signed an ICF that allowed researchers to send questionnaires to participating drivers. The mean age of these 30 drivers was 50 years old (range = 27–71 years old).
6

2.4 PROCEDURES
As indicated above, the authors were independent evaluators during the current research; thus, the procedures described below are limited to those performed by the authors.
2.4.1 Driver Recruitment As the participating carriers made a fleet decision to participate in the pilot test, each participating carrier made the final decision regarding which 50 vehicles (100 total) were instrumented with data collection equipment. Thus, the 100 drivers assigned to the instrumented trucks participated in the technology vendor’s safety program. As such, the authors sought each driver’s permission to send questionnaires and view identifiable video and quantitative data. Permission was received when drivers signed the ICF. Drivers who signed the ICF also completed a Driver Demographic Questionnaire (appendix A). Those drivers who declined to sign the ICF still participated in the pilot study; however, the authors did not send questionnaires to these drivers and received de-identified data from the technology vendor regarding safety-related events (i.e., no video and an anonymous driver #, such as ACH1).
Prior to the start of data collection and the installation of event recorders in each driver’s truck, the authors met with drivers to discuss the nature of the project, technology, benefits of participation, and informed consent rights. A detailed description of the driver briefing is shown below. Given that Carrier A was a long-haul carrier, it was difficult to have all drivers attend a group meeting. The regional safety manager at Carrier A scheduled several conference calls with drivers. During these conference calls, the researcher discussed the current project and answered drivers’ questions. A technology vendor representative also participated in the conference call. During the installation process at Carrier A, a researcher met with each driver to review informed consent procedures and the nature of the study. It was at this time that drivers indicated their willingness to participate in the study. As indicated above, a total of 46 drivers at Carrier A signed the ICF.
Carrier B scheduled a driver meeting at one of their fleet terminal locations. A researcher and technology vendor representative were present and reviewed the concepts described in the driver briefing below. This meeting was poorly attended and misinformation regarding the project spread quickly. Several weeks later the researcher traveled to Carrier B to meet each driver individually to describe the study and answer questions. A total of 30 drivers at Carrier B signed the ICF.
2.4.2 Driver Briefing The driver briefings lasted approximately 1.5–2 hours. These briefings involved both education and training through the use of visual (e.g., videos on a DVD) and lecture (e.g., PowerPoint slides) materials where appropriate. The driver briefing followed the technology vendor’s typical presentation agenda, but differed in two distinct ways: discussion about the feedback light and driver coaching being disabled during the baseline phase and enabled during the intervention phase, and informed consent instructions. The informed consent instructions included: confidentiality and anonymity of the data, freedom to withdraw from the study at any time, and instructions on how to maintain confidentiality and anonymity (e.g., do not report to any
7

unauthorized personnel that data collection equipment has been installed on the vehicle). The driver briefing agenda included the following topics:
Introduction and background material.
Facts about driving.
How the technology works.
An overview of how the program works.
The benefits of using the technology.
Examples of what the event recorder captures.
Informed consent procedures.
Final questions.
Participating drivers were also informed they would be solicited to complete two questionnaires during data collection. During the intervention phase, each driver who was involved in a coaching session with his/her safety manager was sent an In-Study Driver Questionnaire, which served as a manipulation check to assess if safety managers followed the coaching protocol (appendix B). Upon the completion of the intervention phase, participating drivers completed a Post-Study Driver Questionnaire (appendix C), which assessed participating drivers’ opinions and perceptions of the program. To increase participation, each completed and returned In-Study Driver Questionnaire was entered into a monthly raffle for $50.00 at each participating carrier, and each completed and returned Post-Study Driver Questionnaire was entered in a raffle for $50.00 at each participating carrier.
2.4.3 Fleet Safety Manager Recruitment Again, as each participating carrier made a fleet decision to participate in the technology vendor’s pilot test, each safety manager who had one of their drivers assigned to an instrumented truck participated in the technology vendor’s safety program. The authors sought each safety manager’s permission to send questionnaires. Permission was received when fleet safety managers signed the ICF. Safety managers who signed the ICF also completed a Safety Manager Demographic Questionnaire (appendix D). No fleet safety managers declined to sign the ICF.
Prior to the start of the Intervention phase and during the baseline phase, the authors met with the safety managers to discuss the nature of the project, technology, the recommended coaching protocol, use of performance software, benefits of participation, and informed consent rights. A detailed description of the safety manager briefing is below. At that time the safety managers indicated their willingness to participate in the study. Three safety managers at each participating carrier signed the ICF (6 total).
2.4.4 Fleet Safety Manager Training Seminar The safety manager training seminar lasted approximately 2–3 hours. This training seminar involved both education and training through the use of visual (e.g., videos on a DVD) and lecture (e.g., PowerPoint slides) materials. The fleet safety manager training seminar followed the technology vendor’s typical presentation agenda, but differed in two distinct ways:
8

discussion about the feedback light and driver counseling being disabled during the baseline phase and enabled during the intervention phase, and informed consent instructions. The informed consent instructions included: confidentiality and anonymity of the data, freedom to withdraw from the study at any time, and instructions on how to maintain confidentiality and anonymity (e.g., do not report to any unauthorized personnel that data collection equipment has been installed on the vehicle). The fleet safety manager training seminar included the following topics:
Introduction and background material.
Facts about driving.
How the technology works.
An overview of how the program works.
The benefits of using the technology.
Examples of what the event recorder captures.
Using the DBMS software.
Face-to-face coaching.
Informed consent procedures.
Final questions.
Participating fleet safety managers were also informed they would be solicited to complete one questionnaire during data collection. Upon the completion of the intervention phase, participating fleet safety managers completed a Post-Study Safety Manager Questionnaire (appendix E), which assessed participating fleet safety managers’ opinions and perceptions of the program. To increase participation, each safety manager who completed and returned the End of Study Safety Manager Questionnaire received a flat fee of $25.00.
2.4.5 Installation of Event Recorders Installation of event recorders commenced after the driver briefing. A total of 100 trucks (50 at each participating carrier) had an event recorder installed in each participating driver’s truck. The technology vendor was responsible for the installation process. The event recorders were sent via the U.S. Postal Service to each participating carrier. Once these event recorders were received, a technology vendor representative arrived on-site and trained carrier mechanics in the installation process and the steps involved in system validation (i.e., the event recorder was functioning and capable of transmitting data). The installation process was fairly easy and took approximately 60–120 min. Given the distributed nature of deliveries at each participating carrier and the time needed to install each event recorder, all 100 event recorders were installed over a period of several weeks. Note that data collection did not begin until all 50 event recorders were installed at each site. The event recorders were deactivated prior to the start of the baseline phase.
2.4.6 Data Collection Process The technology vendor was responsible for all data collection. The event recorder had two camera views: a driver face view and a forward-facing view. Figure 1 and Figure 2 show the
9

event recorder and the two camera views captured by the event recorder, respectively. The event recorder had three accelerometers (y-, x-, and z-axis) that triggered an event to be recorded. If a certain criterion was met or surpassed (e.g., greater than or equal to │0.5 g│) the event recorder saved 12 s of video (i.e., 8 s prior to the criterion being met or surpassed and 4 s after). The threshold was determined by the technology vendor, based on their prior experience with over 60,000 installed event recorders. Note the threshold value remained constant throughout data collection.
Figure 1. Image. Event Recorder (Left) and Typical Installation of Event Recorder behind the
Vehicle’s Rearview Mirror (Right)
Figure 2. Image. Front Camera View (Left) and Driver's Face View (Right)
The video and quantitative data from all 100 instrumented trucks were automatically sent to the technology vendor via cellular transmission. The received data were reviewed, reduced (i.e., data analysts marked the presence of specific variables pertaining to the event), and uploaded to a server. While all safety-related events were uploaded into the software for review, only those safety-related events that exceeded a certain threshold “Event Score” were requested to be reviewed by the safety manager with the driver in question. Event scores in the current study ranged from 0 to 11 (e.g., 0 = collision; 3 = driver unbelted; and 11 = driver involved in a near crash, while talking on a cell phone and unbelted). Typically, an Event Score greater than or equal to 5 was marked for review; however, Event Scores lower than 5 were also marked for review depending on the severity of the safety-rated event. Note that collisions were not reduced or scored by DriveCam personnel due to client liability concerns; however, all collisions were uploaded into the software for review by fleet safety managers. Once on the server, the authors
10

and safety managers had access to these data via the software (accessible via the Internet). The authors checked the software each day and recorded the frequency of safety-related events, the Event Score, driving behaviors, date, driver #, and quantitative data from participating drivers who signed an ICF and input these data into an internal database. Figure 3 and Figure 4 display screen shots of the Event List and Event Analysis pages, respectively, from the DBMS software.
Figure 3. Image. Screen Shot of the Event List Page
11

Figure 4. Image. Screen Shot of the Event Analysis Page
2.4.7 Data Reduction The technology vendor was responsible for all data reduction (except, as noted above, collision data was not reduced). Once the data were received, a trained data analyst reviewed the event. Data analysts underwent an extensive 5-week training regimen prior to reducing “real” data. The data analyst reviewed the event to determine if represented a valid safety-related event or a spurious trigger value (e.g., hit a pothole in the street, driving on a bumpy road, etc.). Spurious events were not reduced, while valid safety-related events were reduced by the trained data analyst. Data reduction involved reviewing the video and recording the trigger type, outcome, root cause, demeanor, risky behaviors, adverse weather conditions (if necessary), and any custom classifications determined by the client. Figure 5 displays the scoring options available to data analysts during data reduction. The date, time, fleet#, and driver ID # were all automatically tagged to the safety-related event. An Event Score was automatically determined, based on the inputs from the data analyst. Figure 6 displays a flow diagram of the data reduction steps once an event was captured by the event recorder. Safety-related event were uploaded approximately 24–48 hours from the time an event was captured by the event recorder in the instrumented truck.
12

Figure 5. Image. Scoring Options Available to Data Analysts during Data Reduction
Figure 6. Image. Flow Diagram of Data Reduction Process
EventCaptured
EventCaptured
Data Transmitted via
Cellular Service
Data Transmitted via
Cellular Service
Video Reviewed
Video Reviewed
EventReduced
EventReduced
EventUploadedto Server
EventUploadedto Server
NO
YES Authors & SafetyManager Access via HindSight software
NoFurther Action
Valid Event
2.5 DATA ANALYSIS
The current evaluation focused on determining if there was a reduction in safety-related events recorded by the event recorder that were attributed to the DBMS (i.e., the system and counseling). The key analyses to be conducted included a significant reduction in the frequency and severity of safety-related events during the baseline phase compared to the intervention phase; thus, there were two primary hypotheses. One potential challenge in the data analyses was how to deal with participating drivers who dropped out of the program (e.g., quit, terminated, etc.). For the proposed analyses, drivers who did not complete at least 3 weeks of data collection during the baseline phase and 4 weeks of data collection during the intervention phase were not included in any analyses. Below is a description of the study hypotheses.
HYPOTHESIS 1: There will be a significant reduction in the mean rate of safety-related events from baseline to intervention.
In Hypothesis 1, the mean rates of safety-related events during the baseline and intervention phases were compared. The dependent measure was the mean rate of safety-related events/10,000 VMT. Thus, for each participant the frequency of safety-related events during the baseline phase was divided by the number of VMT during data collection in the baseline phase. This normalized the data and accounted for missing days, dropouts, and/or exposure. The same procedures were used for data collected during the intervention phase. A paired sample t test was used to assess if a there was a significant reduction in the mean rate of safety-related events/10,000 VMT during the baseline compared to the intervention phase (α = 0.05).
13

14
HYPOTHESIS 2: There will be a significant reduction in the mean rate of severe safety-related events from baseline to intervention.
In Hypothesis 2, the mean rates of severe safety-related events (i.e., with an Event Score > 3) during the baseline and intervention phases were compared. The dependent measure was the mean rate of severe safety-related events/10,000 VMT. The Event Score is a proxy measure of safety-related event severity (i.e., the higher the Event Score, the greater the severity of the safety-related event). Thus, for each participant, the frequency of safety-related events with an Event Score > 3 during the baseline phase was divided by the number of VMT during the baseline phase. The same procedures were used for data collected during the intervention phase. A paired sample t test was used to assess if there was a significant reduction in the mean rate of severe safety-related events/10,000 VMT from the baseline phase to the intervention phase (α = 0.05).
3. RESULTS
3.1 DRIVER DEMOGRAPHIC QUESTIONNAIRE
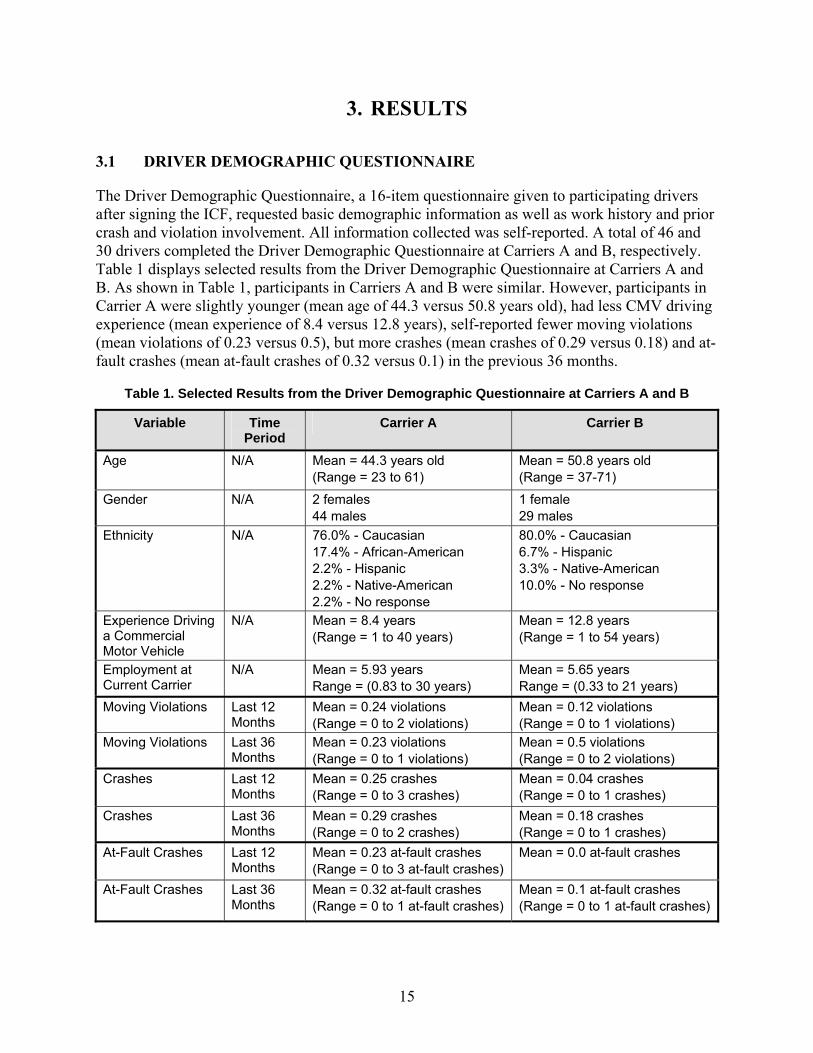
The Driver Demographic Questionnaire, a 16-item questionnaire given to participating drivers after signing the ICF, requested basic demographic information as well as work history and prior crash and violation involvement. All information collected was self-reported. A total of 46 and 30 drivers completed the Driver Demographic Questionnaire at Carriers A and B, respectively. Table 1 displays selected results from the Driver Demographic Questionnaire at Carriers A and B. As shown in Table 1, participants in Carriers A and B were similar. However, participants in Carrier A were slightly younger (mean age of 44.3 versus 50.8 years old), had less CMV driving experience (mean experience of 8.4 versus 12.8 years), self-reported fewer moving violations (mean violations of 0.23 versus 0.5), but more crashes (mean crashes of 0.29 versus 0.18) and at-fault crashes (mean at-fault crashes of 0.32 versus 0.1) in the previous 36 months.
Table 1. Selected Results from the Driver Demographic Questionnaire at Carriers A and B
Variable Time Period
Carrier A Carrier B
Age N/A Mean = 44.3 years old (Range = 23 to 61)
Mean = 50.8 years old (Range = 37-71)
Gender N/A 2 females 44 males
1 female 29 males
Ethnicity N/A 76.0% - Caucasian 17.4% - African-American 2.2% - Hispanic 2.2% - Native-American 2.2% - No response
80.0% - Caucasian 6.7% - Hispanic 3.3% - Native-American 10.0% - No response
Experience Driving a Commercial Motor Vehicle
N/A Mean = 8.4 years (Range = 1 to 40 years)
Mean = 12.8 years (Range = 1 to 54 years)
Employment at Current Carrier
N/A Mean = 5.93 years Range = (0.83 to 30 years)
Mean = 5.65 years Range = (0.33 to 21 years)
Moving Violations Last 12 Months
Mean = 0.24 violations (Range = 0 to 2 violations)
Mean = 0.12 violations (Range = 0 to 1 violations)
Moving Violations g Violations
Last 36 Months
Mean = 0.23 violations (Range = 0 to 1 violations)
Mean = 0.5 violations (Range = 0 to 2 violations)
Crashes Last 12 Months
Mean = 0.25 crashes (Range = 0 to 3 crashes)
Mean = 0.04 crashes (Range = 0 to 1 crashes)
Crashes Last 36 Months
Mean = 0.29 crashes (Range = 0 to 2 crashes)
Mean = 0.18 crashes (Range = 0 to 1 crashes)
At-Fault Crashes Last 12 Months
Mean = 0.23 at-fault crashes (Range = 0 to 3 at-fault crashes)
Mean = 0.0 at-fault crashes
At-Fault Crashes Last 36 Months
Mean = 0.32 at-fault crashes (Range = 0 to 1 at-fault crashes)
Mean = 0.1 at-fault crashes (Range = 0 to 1 at-fault crashes)
15

3.2 SAFETY MANAGER DEMOGRAPHIC QUESTIONNAIRE
The Safety Manager Demographic Questionnaire, a 10-item questionnaire given to participating safety managers after signing the ICF, requested basic demographic information as well as work history and prior crash and violation involvement. All information collected was self-reported. A total of two and three safety managers completed the Safety Manager Demographic Questionnaire at Carriers A and B, respectively.
Table 2 displays selected results from the Safety Manager Demographic Questionnaire at Carriers A and B. As shown in Table 2, safety managers at Carrier A had more management experience (mean years of 16.6 versus 5.9) and tenure at the participating carrier (mean years of 18.8 versus 2.1) than safety managers at Carrier B (in fact, the primary safety manager at Carrier B had been at Carrier B for less than one year). This discrepancy was evident during the initial roll-out of this study. It appeared that safety managers at Carrier A had developed a good rapport and level of trust with the drivers. The drivers at Carrier A were less suspicious and more willing to “give the DBMS a chance” than the drivers at Carrier B. It was evident that safety managers at Carrier B did not have the same level of trust or rapport with their drivers. Drivers at Carrier B were suspicious of the DBMS program and actively subverted the program. For example, at Carrier B there were 278 events where the driver blocked the driver face camera, while drivers at Carrier A had 10 of these events. Drivers at both carriers were instructed to not block the driver face camera while participants were operating the truck.
Table 2. Selected Results from Safety Manager Demographic Questionnaire at Carriers A and B
Variable Carrier A Carrier B
Age Mean = 45 years old Mean = 33.7 years old
Gender 2 females 3 males
Ethnicity 100% - Caucasian 100% - Caucasian
Experience as a Manager in Commercial Motor Vehicle
Mean = 16.6 years (Range = 14 to 19.2 years)
Mean = 5.9 years (Range = 3 to 10.6 years)
Employment at Current Carrier Mean = 18.8 years Range = (14 to 23.6 years)
Mean = 2.1 years Range = (0.4 to 4 years)
3.2.1 HYPOTHESIS 1: There will be a significant reduction in the mean rate of safety-related events from baseline to intervention
As indicated above, the mean frequency of safety-related events during the baseline and intervention phases were compared in Hypothesis 1. The dependent measure was the mean rate of safety-related events/10,000 VMT. Thus, for each participant the frequency of safety-related events during the baseline phase was divided by the number of VMT traveled during data collection in the baseline phase. This normalized the data and accounted for missing days, dropouts, and/or exposure. The same procedures were used for data collected during the Intervention phase. A paired sample t test was used to assess if a there was a significant
16

reduction in the mean frequency of safety-related events during the baseline compared to the intervention phase (α = 0.05).
3.2.1.1 Carrier A
Frequency of Safety-Related Events: A total of 36 drivers at Carrier A, from the original 50, were included in the data analyses. A total of 14 drivers quit, resigned, withdrew, had a malfunctioning event recorder, and/or did not meet the minimum requirements to be included in the data analyses. There were technical issues with several of the event recorders at Carrier A. These technical issues precluded five drivers from being included in the data analyses and an additional eight drivers included in the data analyses had missing safety-related events during the baseline phase. Thus, the frequency of safety-related events in the baseline phase was lower than if these event recorders had functioned properly.
Table 3 shows the frequency and percentage of event type, root cause, and risky driving behavior coded by data analysts. The percentages in Table 3 add up to more than 100 percent as more than one root cause and/or risky behavior could be selected for each safety-related event. During the 4-week baseline phase, a total of 58 valid safety-related events were captured by the event recorder (2 collisions and 56 risky driving events). During the 13-week intervention phase, a total of 141 valid safety-related events were captured by the event recorder (2 collisions and 139 risky driving events). Note that it is difficult to interpret on the raw frequencies of safety-related events given the unbalanced data collection periods in the baseline and intervention phases (4 versus 13 weeks). As such, the data were normalized (as shown below) to allow more appropriate comparisons between the baseline and intervention phases.
17

Table 3. Frequency and Percentage of Safety-Related Events at Carrier A
Variable Type Variable Baseline Phase
N
Baseline Phase
%
Intervention Phase
N
Intervention Phase
%
Event Type Collision 2 3.4 2 1.4 Event Type Risky Driving 56 96.6 139 98.6
Root Cause Blind Area Not Checked 0 0.0 2 1.4 Root Cause Cell Phone 5 8.6 10 7.1 Root Cause Food/Drink 3 5.2 1 0.7 Root Cause Not Looking Far Ahead 1 1.7 9 6.4 Root Cause Not Scanning Roadway 1 1.7 0 0.0 Root Cause Not Scanning Intersection 3 5.2 3 2.1 Root Cause Judgment Error 2 3.5 0 0.0 Root Cause Mirrors Not Checked 0 0.0 1 0.7 Root Cause No Root Cause 43 74.1 115 81.6
Risky Behavior Driver Unbelted 21 36.2 34 24.1 Risky Action Following Too Close 20 34.5 78 55.3 Risky Action Traffic Violation 2 3.5 6 4.2 Risky Action Poor Lane Selection 1 1.7 0 0.0
Normalized Data: The 36 drivers at Carrier A drove a total of 291,869 VMT during the baseline phase. A rate was calculated to account for exposure (i.e., frequency of safety-related events / VMT). Figure 7 displays the mean rate of safety-related events/10,000 VMT per week across the 17 weeks of data collection. As shown in Figure 7, the mean rate of safety-related events/10,000 VMT during the baseline phase was 1.9 safety-related events. During the intervention phase, these same 36 drivers drove a total of 1,170,721 miles. The mean rate of safety-related events/10,000 VMT during the intervention phase was 1.2 safety-related events. A paired sample t test found the mean rate of safety-related events/10,000 VMT during the intervention phase (1.2 safety-related events/10,000 VMT) was significantly lower than the mean rate of safety-related events/10,000 VMT during the baseline phase (1.9 safety-related events/10,000 VMT; t(35) = 1.7, p = 0.046). Hypothesis 1 was supported at Carrier A since the 38.1 percent reduction in the mean rate of safety-related events/10,000 VMT from the baseline to intervention phase was significant.
18

Figure 7. Graph. Mean Rate of Safety-Related Events/10,000 VMT across 17 Weeks of Data
Collection at Carrier A
3.2.1.2 Carrier B
Frequency of Safety-Related Events: A total of 41 drivers at Carrier B, from the original 50, were included in the data analyses. A total of nine drivers quit, resigned, withdrew, had a malfunctioning event recorder, and/or did not meet the minimum requirements to be included in the data analyses. Table 4 shows the frequency and percentage of event type, root cause, and risky actions coded by data reductionists. The percentages in Table 4 add up to more than 100 percent as more than one root cause and/or risky action could be selected for each safety-related event. During the 4-week baseline phase, 65 valid safety-related events were captured by the event recorder (1 collision and 64 risky driving events). During the 13-week intervention phase, a total of 117 valid safety-related events were captured by the event recorder (2 collisions and 115 risky driving events). As indicated above, it is difficult to make interpretations on the raw frequencies of safety-related events given the unbalanced data collection periods in the baseline and intervention phases.
19

Table 4. Frequency and Percentage of Safety-Related Events at Carrier B
Variable Type Variable
Baseline Phase
N
Baseline Phase
%
Intervention Phase
N
Intervention Phase
%
Event Type Collision 1 1.5 2 1.7 Event Type Risky Driving 64 98.5 115 98.3
Root Causes Blind Area Not Checked 8 12.3 1 0.9 Root Causes Cell Phone 2 3.1 6 5.1 Root Causes Food/Drink 1 1.5 3 2.6 Root Causes Not Looking Far Ahead 1 1.5 17 14.5 Root Causes Not Scanning Roadway 2 3.1 9 7.7 Root Causes Not Scanning Intersection 0 0.0 8 6.8 Root Causes Judgment Error 0 0.0 1 0.9 Root Causes No Root Cause 51 78.5 75 64.1
Risky Behavior Driver Unbelted 49 75.4 31 26.5 Risky Action Following Too Close 5 7.7 44 37.6 Risky Action Traffic Violation 3 4.6 10 8.5 Risky Action Unsafe Speed 1 1.5 0 0.0 Risky Action Failed to Keep an Out 0 0.0 1 0.9
Normalized Data: The 41 drivers at Carrier B drove a total of 162,492 miles during the baseline phase. As indicated above, a rate was calculated to account for exposure. Figure 8 displays the mean rate of safety-related events per week across the 17 weeks of data collection. As shown in Figure 8, the mean rate of safety-related events/10,000 VMT during the baseline phase was 4.02 safety-related events. During the intervention phase, these same 41 drivers drove a total of 615,403 miles. The mean rate of safety-related events/10,000 VMT during the Intervention phase was 1.93 safety-related events. A paired sample t test found the mean rate of safety-related events/10,000 VMT during the intervention phase (1.9 safety-related events/10,000 VMT) was significantly lower than the mean rate of safety-related events/10,000 VMT during the baseline phase (4.0 safety-related events/10,000 VMT; t(40) = 1.88, p = 0.03). Hypothesis 1 was also supported at Carrier B since the 52.2 percent reduction in the mean rate of safety-related events/10,000 VMT from the baseline to intervention phase was significant.
20

Figure 8. Graph. Mean Rate of Safety-Related Events/10,000 VMT across 17 Weeks of Data Collection at Carrier B
3.2.2 HYPOTHESIS 2: There will be a significant reduction in the mean rate of severe safety-related events from baseline to intervention
As indicated above, the mean rate of severe safety-related events (i.e., with an Event Score > 3) during the baseline and intervention phases were compared in Hypothesis 2. A “severe” event was defined as any safety-related event with an Event Score > 3. For each participant the frequency of severe safety-related events during the baseline phase was divided by the number of miles during the baseline phase. The same procedures were used for data collected during the intervention phase. A paired sample t test was used to assess if there was a significant reduction in the mean frequency of severe safety-related events/10,000 VMT from baseline to intervention (α = 0.05).
3.2.2.1 Carrier A
Drivers at Carrier A had 16 severe safety-related events out of a total of 199 safety-related events (8.0 percent). Figure 9 displays the mean rate of severe safety-related events/10,000 VMT across the 17 weeks of data collection at Carrier A. The mean rate of severe safety-related events/10,000 VMT during the baseline phase was 0.22, while the mean rate of severe safety-related events/10,000 VMT during the intervention phase was 0.09. The 59.1 percent reduction in the mean rate of severe safety-related events/10,000 VMT from the baseline to the Intervention phase was not significant (paired sample t test(35) = 1.19, p = 0.121). The lack of sufficient statistical power could be the reason why Hypothesis 2 was not supported at Carrier A. Note the power analysis above indicated that 30 drivers would be sufficient to detect a significant difference; however, this analysis did not consider severe safety-related events.
21

Nonetheless, despite the lack of a significant reduction, a 59.1 percent decrease in the mean rate of severe safety-related events/10,000 VMT is noteworthy.
Figure 9. Graph. Mean Rate of Severe Safety-Related Events/10,000 VMT across 17 Weeks of Data
Collection at Carrier A
3.2.2.2 Carrier B
Drivers at Carrier B had 28 severe safety-related events out of 179 safety-related events (15.6 percent). Figure 10 displays the mean rate of severe safety-related events/10,000 VMT across the 17 weeks of data collection. The mean rate of severe safety-related events/10,000 VMT during the baseline phase was 0.36, while the mean rate of severe safety-related events/10,000 VMT during the intervention phase was 0.2. The 44.4 percent reduction in the mean rate of severe safety-related events/10,000 VMT from the baseline to the intervention phase was not significant (paired sample t test(40) = 1.02, p = 0.16). As with the Carrier A results, Hypothesis 2 was not supported at Carrier B. As indicated above, this could be due to limited statistical power. However, as with the Carrier A findings, a substantial reduction of 44.4 percent in the mean rate of severe safety-related events/10,000 VMT was observed at Carrier B. While not significant, due to the small number of severe events, the percentage reduction in severe safety-related events at Carriers A and B have practical significance.
22

Figure 10. Graph. Mean Rate of Severe Safety-Related Events/10,000 VMT across 17 Weeks of Data
Collection at Carrier B
3.3 IN-STUDY DRIVER QUESTIONNAIRE
The In-Study Driver Questionnaire was a 10-item questionnaire that served as a manipulation check of fleet safety managers’ adherence to the recommended coaching protocol provided by the researchers and assessed drivers’ perceptions of the coaching process (appendix B). A researcher contacted drivers, via phone and/or email, to complete the In-Study Driver Questionnaire each time they participated in a coaching session with the safety manager (note that only drivers who signed an ICF were contacted by researchers). As the independent evaluators, contact between the authors and the participating carriers was held to a minimum and only involved essential communication. Thus, the authors relied on the associated software for indication of a coaching session (i.e., the safety manager would check a box and/or make a notation to indicate coaching had taken place).
Carrier A safety managers conducted 32 coaching sessions during the study’s intervention phase. The average time between the safety-related event and the coaching session was 5.8 days at Carrier A. Twenty-five of the coaching sessions involved a driver who signed an ICF; thus, eligible to complete the In-Study Driver Questionnaire. Although there was an incentive for completing the In-Study Questionnaire and researchers attempted to contact drivers several times, only 10 In-Study Driver Questionnaires were completed at Carrier A (40 percent).
Carrier B safety managers conducted 37 coaching sessions during the intervention phase. The average time between the safety-related event and the coaching session was 10.1 days at Carrier B. Twenty-eight of the coaching sessions involved a driver who signed an ICF; thus,
23

eligible to complete the In-Study Driver Questionnaire. Fourteen In-Study Driver Questionnaires were completed at Carrier B (50 percent).
Table 5 shows selected results from the In-Study Driver Questionnaire at Carriers A and B. The first four items in Table 5 illustrate the recommended coaching protocol: review the video with the driver, clearly identify the “root cause” in the safety-related event, identify ways to prevent the safety-related event in the future, and keep the coaching session positive. As can be seen in Table 5, safety managers at each carrier differed vastly in their ability to follow the coaching protocol.
Table 5. Selected Results from the In-Study Driver Questionnaire at Carriers A and B
Item Carrier A Carrier B
1) Reviewed video during coaching session 8 out of 10 (80%) 1 out of 14 (7%)
2) How clearly was the “root cause” identified Mean = 7.1 (Moderately Clear)
Mean = 1.0 (Very Unclear)
3) Identified ways to prevent future events 9 out of 10 (90%) 1 out of 14 (7%)
4) The coaching session was positive Mean = 6.25 (Positive)
Mean = 3.0 (Moderately Negative)
5) How likely are you to use the information learned in coaching session
Mean = 7.8 (Moderately Likely)
Mean = 2.0 (Very Unlikely)
6) Length of coaching session Mean = 10 minutes Mean = 10 minutes
Of the completed and returned In-Study Driver Questionnaires, 80 percent of the drivers at Carrier A indicated the fleet safety manager at Carrier A reviewed the video of the safety-related event during the coaching session, whereas only 7 percent of the drivers at Carrier B indicated the same. The second item asked drivers to indicate, on a nine-point scale (1 = Very Unclear; 9 = Very Clear), how clearly the root cause in the safety-related event was identified by the fleet safety manager. As shown in Table 5, drivers at Carrier A indicated the root cause in the safety-related event was identified “moderately clearly” by fleet safety managers at Carrier A, whereas drivers at Carrier B indicated “very unclear.” The third item asked drivers to indicate (yes or no) if the fleet safety manager identified ways to prevent the safety-related event in the future. Ninety percent of drivers at Carrier A indicated that fleet safety managers at Carrier A identified ways to prevent the safety-related event in the future, whereas only 7 percent of the drivers at Carrier B indicated the same. The fourth item asked drivers to indicate, on a nine-point scale (1 = Very Negative; 9 = Very Positive), if the fleet safety manager kept the coaching session positive. As shown in Table 5, drivers at Carrier A indicated that fleet safety managers at Carrier A kept the coaching session “positive,” whereas drivers at Carrier B indicated “moderately negative.” Lastly, the fifth item asked drivers to indicate, on a nine-point scale (1 = Very Unlikely; 9 = Very Likely), how likely they were to use the information learned in the coaching session. Drivers at Carrier A indicated they were “moderately likely” to use the information learned during the coaching session, whereas drivers at Carrier B indicated “very unlikely.”
24

Note that data were only obtained from a small portion of the coaching sessions at Carriers A and B. Thus, the results should be interpreted with caution. The results from the In-Study Driver Questionnaire suggest that fleet safety managers at Carrier A adhered to the coaching protocol, while fleet safety managers at Carrier B did not. However, drivers at Carrier B experienced a 52.2 percent reduction in the mean rate of safety-related events/10,000 VMT from the baseline to the Intervention phase. There was essentially no difference between those drivers who received a coaching session (as indicated by the fleet safety manager) and those who did not receive a coaching session at Carrier B. For example, very few drivers who received a coaching session at Carrier B viewed a video of the safety-related event. Feedback usually entailed a message from the fleet safety manager to all participating drivers via the dispatching device (e.g., please obey Carrier B’s policy on safety-belt use). Thus, all drivers at Carrier B received some sort of feedback and information that they were being monitored. It appears this was sufficient to reduce significantly the mean rate of safety-related events/10,000 VMT. Conversely, the coaching sessions at Carrier A had a powerful effect on safety-related events, as will be shown in the post-hoc analyses below.
3.4 POST-STUDY QUESTIONNAIRES
Post-study questionnaires were sent to drivers and fleet safety managers at both carriers who signed an ICF. The post-study questionnaires assessed perceptions and opinions regarding the DBMS. The Post-Study Driver Questionnaire had 11 items, while the Post-Study Safety Manager Questionnaire had 14 items.
3.4.1 Drivers A total of 13 and 9 drivers at Carriers A and B, respectively, completed the Post-Study Driver Questionnaire. Table 6 shows selected results from the Post-Study Driver Questionnaire at Carriers A and B. As can be seen in Table 6, drivers at Carriers A and B differed in their perceptions and opinions regarding the DBMS. These perceptions and opinions of the DBMS were likely influenced by drivers’ rapport and trust with their safety managers and the differences at each carrier in following the coaching protocol. Again, as data were only obtained from a small portion of drivers at Carriers A and B, these results should be interpreted with caution.
25

Table 6. Selected Results from the Post-Study Driver Questionnaire at Carriers A and B
Item Carrier A Carrier B
1) Reviewed video during coaching session 12 out of 13 (92.3%) 3 out of 9 (25%)
2) Video was helpful in identifying risky driving behavior*
Mean = 8.0 (Very Helpful)
Mean = 4.3 (Neutral)
3) Trusted the accuracy of the video* Mean = 7.0 (Moderately Trustful)
Mean = 5.3 (Neutral)
4) Clarity of the root cause Mean = 7.0 (Moderately Clear)
Mean = 6.0 (Clear)
5) Safer driver after participating in program Mean = 7.2 (Moderately Safer)
Mean = 7.1 (Moderately Safer)
6) DBMS was useful in reducing risky driving behavior
Mean = 6.7 (Useful)
Mean = 5.7 (Neutral)
7) Overall opinion of DBMS Mean = 7.4 (Moderately Positive)
Mean = 5.9 (Positive)
* based on drivers who answered “yes” to the first item.
As in the In-Study Driver Questionnaire, drivers at Carrier A were more likely than drivers at Carrier B to have reviewed video of a safety-related event during the coaching session (92.3 percent versus 25 percent). The second item asked drivers to indicate, on a nine-point scale (1 = Very Useless; 9 = Very Helpful), if the video was helpful in identifying the risky driving behavior (note this was only answered by drivers who reported viewing a video during a coaching session). Drivers at Carrier A reported the video was “very helpful” in identifying the risky driving behavior, while drivers at Carrier B were “neutral”. The third item asked drivers to indicate, on a nine-point scale (1 = Extremely Distrustful; 9 = Extremely Trustful), if they trusted the accuracy of the video shown in the coaching session (note this was only answered by drivers who reported viewing a video during a coaching session). Drivers at Carrier A reported they found the accuracy of the video “moderately trustful”, while drivers at Carrier B were “neutral”.
The fourth item asked drivers to indicate, on a nine-point scale (1 = Very Unclear; 9 = Very Clear), how clearly fleet safety managers identified the root cause in the safety-related event. Drivers at Carrier A reported that fleet safety managers at Carrier A were “moderately clear” in identifying the root cause in the safety-related event, while drivers at Carrier B indicated fleet safety managers were “clear”. The fifth item asked drivers to indicate, on a nine-point scale (1 = Much Riskier; 9 = Much Safer), if they were safer drivers after participating in the DBMS program. Drivers at Carriers A and B reported they believed they were “moderately safer” drivers after participating in the program. The sixth item asked drivers to indicate, on a nine-point scale (1 = Completely Useless; 9 = Extremely Useful), if the DBMS was useful in reducing their risky driving behavior. Drivers at Carrier A reported the DBMS was “useful” in reducing their risky driving behaviors, while drivers at Carrier B thought it was “neutral”. The seventh item asked drivers to indicate, on a nine-point scale (1 = Very Negative; 9 = Very Positive), their overall opinion of the DBMS. Drivers at Carrier A reported that, overall, the DBMS was “useful”, while drivers at Carrier B found it to be “neutral”.
26
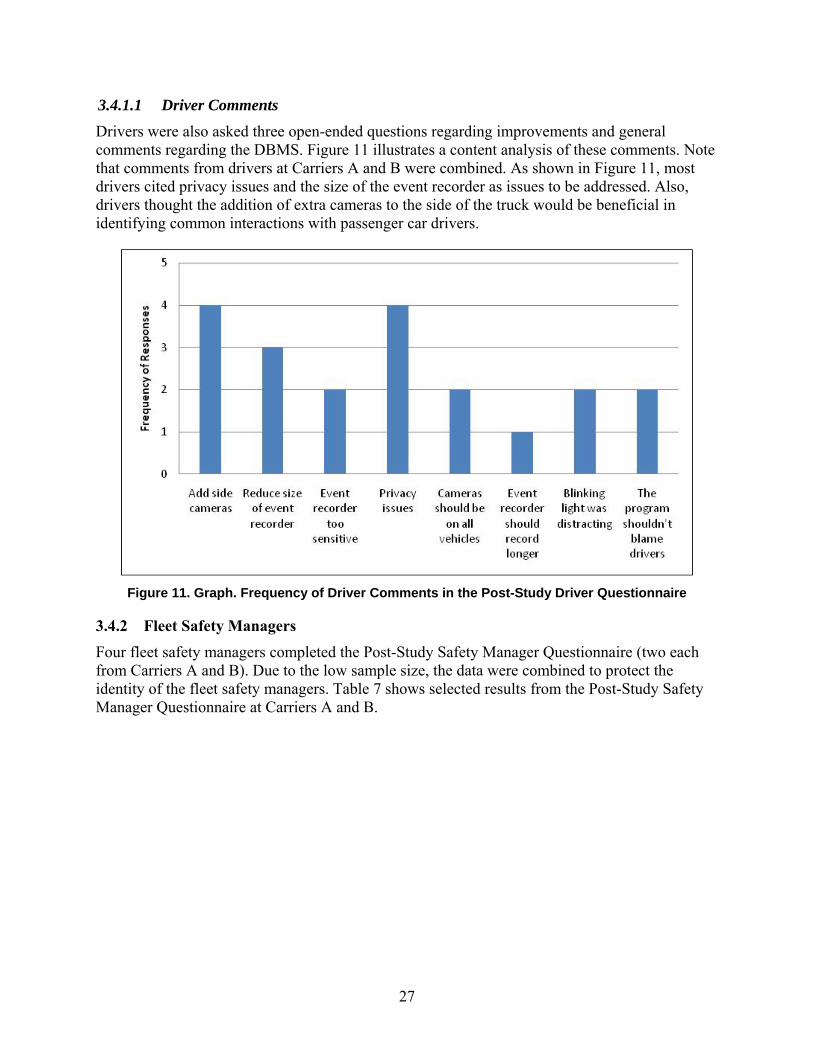
3.4.1.1 Driver Comments
Drivers were also asked three open-ended questions regarding improvements and general comments regarding the DBMS. Figure 11 illustrates a content analysis of these comments. Note that comments from drivers at Carriers A and B were combined. As shown in Figure 11, most drivers cited privacy issues and the size of the event recorder as issues to be addressed. Also, drivers thought the addition of extra cameras to the side of the truck would be beneficial in identifying common interactions with passenger car drivers.
Figure 11. Graph. Frequency of Driver Comments in the Post-Study Driver Questionnaire
3.4.2 Fleet Safety Managers Four fleet safety managers completed the Post-Study Safety Manager Questionnaire (two each from Carriers A and B). Due to the low sample size, the data were combined to protect the identity of the fleet safety managers. Table 7 shows selected results from the Post-Study Safety Manager Questionnaire at Carriers A and B.
27

Table 7. Selected Results from the Post-Study Safety Manager Questionnaire at Carriers A and B
Item Carriers A and B
Time consumption involved in coaching drivers Mean = 7.0 (Moderately Time Consuming)
Interactions with drivers while reviewing videos with drivers Mean = 7.0 (Moderately Positive)
Driver interest in reviewing videos Mean = 7.8 (Moderately Interested)
Difficulty in identifying the root cause in safety-related event Mean = 3.3 (Easy)
Improved in management of drivers as a result of the DBMS program Mean = 6.5 (Improved)
Recommend DBMS program to other safety managers 4 out of 4 (100%)
Drivers who participated in the DBMS program are safer drivers Mean = 6.3 (Safer)
Was the DBMS useful in identifying drivers’ risky driving behaviors Mean = 8.8 (Extremely Useful)
Overall opinion of the DBMS program Mean = 7.3 (Moderately Positive)
The first item in Table 7 asked fleet safety managers to indicate, on a nine-point scale (1 = Not Time Consuming; 9 = Very Time Consuming), the time consumption involved in coaching drivers. Fleet safety managers found the coaching process “moderately time consuming.” The second item asked fleet safety managers to indicate, on a nine-point scale (1 = Very Negative; 9 = Very Positive), their interactions with drivers while reviewing the video of the safety-related event. Fleet safety managers reported their interactions with drivers while reviewing the safety-related event as “moderately positive.” The third item asked fleet safety managers to indicate, on a nine-point scale (1 = Very Indifferent; 9 = Very Interested), their perceptions of drivers’ interest in reviewing the video of the safety-related event. Fleet safety managers reported that drivers were “moderately interested” in reviewing the video of the safety-related event. The fourth item asked fleet safety managers to indicate, on a nine-point scale (1 = Very Easy; 9 = Very Difficult), the difficulty in identifying the root cause in the safety-related event. Fleet safety managers reported that identifying the root cause in the safety-related event was “easy.”
The fifth item asked fleet safety managers to indicate, on a nine-point scale (1 = Much Worse; 9 = Much Improved), their improved management of drivers as a result of the DBMS. Fleet safety managers reported an “improved” management approach as a result of the DBMS. The sixth item asked fleet safety managers to indicate, yes or no, if they would recommend the DBMS to other fleet safety managers. All fleet safety managers indicated they would recommend the DBMS to other fleet safety managers. The seventh item asked fleet safety managers to indicate, on a nine-point scale (1 = Much Riskier; 9 = Much Safer), if drivers who participated in the DBMS program were safer drivers. Fleet safety managers reported that drivers
28

who participated in the DBMS program were “safer” drivers. The eighth item asked fleet safety managers to indicate, on a nine-point scale (1 = Completely Useless; 9 = Extremely Useful), if the DBMS was useful in identifying drivers’ risky driving behaviors. Fleet safety managers reported the DBMS was “extremely useful” in identifying drivers’ risky driving behaviors. The ninth item asked fleet safety managers to indicate, on a nine-point scale (1 = Very Negative; 9 = Very Positive), their overall opinion of the DBMS. Fleet safety managers reported that, overall, the DBMS program was “moderately positive.”
3.4.2.1 Fleet Safety Manager Comments
Fleet safety managers were also asked five open-ended questions regarding improvements and general comments regarding the DBMS program. Several fleet safety managers indicated the quality of the videos needed to be improved. Fleet safety managers cited poor video quality at night and the need for better perception of the vehicle in space. Fleet safety managers also indicated the length of the video recording (12 s) should be increased. Most fleet safety managers found the software user-friendly; however, several fleet safety managers were frustrated by slow downloads during “peak” hours. Overall, fleet safety managers found the camera to be a very useful tool in identifying their drivers’ at-risk driving behaviors. Privacy issues could be alleviated, if the event recorder was active only during the operation of the vehicle and not while drivers were in the sleeper berth. Note that drivers were allowed to cover the camera while they were in the sleeper berth; however, the camera was still active and could record audio and video if activated. This was a prominent issue with drivers (i.e., privacy while not on the job).
3.5 POST-HOC ANALYSES
Additional analyses were performed on data from Carrier A (note: these were not indicated in the work plan, thus, there were no specific hypotheses). Drivers at Carrier A were grouped into one of two groups: (1) drivers who participated in a coaching session where a video was reviewed (n = 13 drivers) and (2) drivers who did not participate in a coaching session where a video was reviewed or did not participate in a coaching session of any kind (n = 23 drivers). Figure 12 displays the mean rate of safety-related events/10,000 VMT during the baseline and intervention phases for drivers who received a coaching session with review of video (i.e., Fleet Manager Coaching) and those drivers who did not receive a coaching session with review of a video (i.e., No Fleet Manager Coaching). As shown in Figure 12, drivers in the Fleet Manager Coaching group had a mean rate of 1.65 safety-related events/10,000 VMT during the baseline phase and a mean rate of 0.95 safety-related events/10,000 VMT during the intervention phase. The 42.4 percent reduction in the mean rate of safety-related events/10,000 VMT from the baseline to the intervention phase was significant (paired sample t test(12) = 2.13, p = 0.027).
As shown in Figure 12, drivers in the No Fleet Manager Coaching group had a mean rate of 2.11 safety-related events/10,000 VMT during the baseline phase and a mean rate of 1.39 safety-related events/10,000 VMT during the intervention phase. The 34.1 percent reduction in the mean rate of safety-related events/10,000 VMT from the baseline to the intervention phase was not significant (paired sample t test(22) = 1.13, p = 0.136). Thus, the coaching sessions that did not include videos and/or the feedback light alone were insufficient to reduce (to a statistically significant level) the mean rate of safety-related events/10,000 VMT at Carrier A. Again, note
29
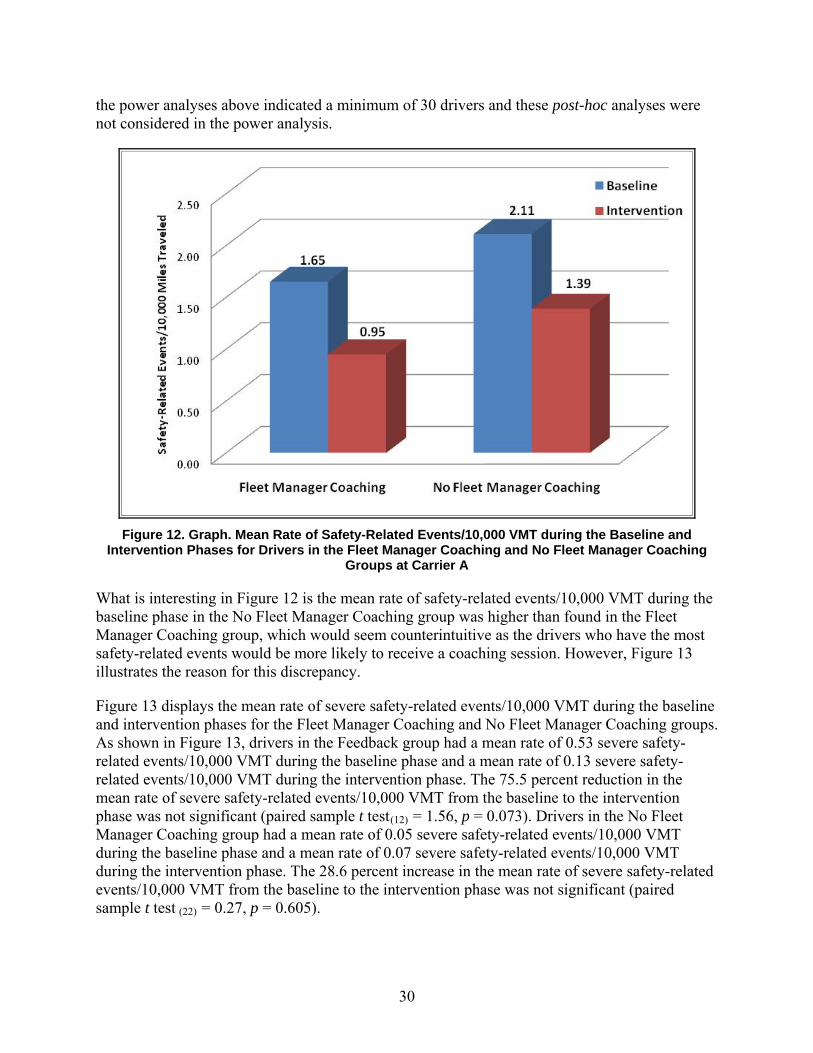
the power analyses above indicated a minimum of 30 drivers and these post-hoc analyses were not considered in the power analysis.
Figure 12. Graph. Mean Rate of Safety-Related Events/10,000 VMT during the Baseline and
Intervention Phases for Drivers in the Fleet Manager Coaching and No Fleet Manager Coaching Groups at Carrier A
What is interesting in Figure 12 is the mean rate of safety-related events/10,000 VMT during the baseline phase in the No Fleet Manager Coaching group was higher than found in the Fleet Manager Coaching group, which would seem counterintuitive as the drivers who have the most safety-related events would be more likely to receive a coaching session. However, Figure 13 illustrates the reason for this discrepancy.
Figure 13 displays the mean rate of severe safety-related events/10,000 VMT during the baseline and intervention phases for the Fleet Manager Coaching and No Fleet Manager Coaching groups. As shown in Figure 13, drivers in the Feedback group had a mean rate of 0.53 severe safety-related events/10,000 VMT during the baseline phase and a mean rate of 0.13 severe safety-related events/10,000 VMT during the intervention phase. The 75.5 percent reduction in the mean rate of severe safety-related events/10,000 VMT from the baseline to the intervention phase was not significant (paired sample t test(12) = 1.56, p = 0.073). Drivers in the No Fleet Manager Coaching group had a mean rate of 0.05 severe safety-related events/10,000 VMT during the baseline phase and a mean rate of 0.07 severe safety-related events/10,000 VMT during the intervention phase. The 28.6 percent increase in the mean rate of severe safety-related events/10,000 VMT from the baseline to the intervention phase was not significant (paired sample t test (22) = 0.27, p = 0.605).
30

Figure 13. Graph. Mean Rate of Severe Safety-Related Events/10,000 VMT during the Baseline and Intervention Phases for Drivers in the Fleet Manager Coaching and No Fleet Manager Coaching
Groups at Carrier A
Limited power restricted the ability to detect a statistically significant difference. However, Figure 13 illustrates that those drivers involved in higher severity safety-related events, thus in need of a coaching session, received a coaching session where the video of the safety-related event was reviewed. Though the results were not significant, the trend was clearly in the right direction and, in fact, accounted for a 75.5 percent reduction in the rate of severe safety-related events/10,000 VMT in the Fleet Manager Coaching group. These sub-analyses were only performed at Carrier A as there was objective and anecdotal evidence that Carrier A followed the coaching protocol provided by the researchers. These sub-analyses were not performed at Carrier B as there was essentially no difference between those drivers who received a coaching session (as indicated by the fleet safety manager) and those who did not. As shown above, very few drivers who received a coaching session at Carrier B included review of the video. Feedback usually entailed a message from the safety manager to all participating drivers via the dispatching device (e.g., please obey Carrier B’s policy on safety-belt use).
31

32
[This page intentionally left blank.]

4. SUMMARY AND CONCLUSIONS
4.1 SUMMARY
In this quasi-experiment (i.e., lack of random assignment of drivers) the effectiveness of a DBMS to decrease the risky driving behaviors of local/short-haul and long-haul truck drivers was evaluated. Almost all prior behavioral safety research has targeted work behaviors in settings where employees can systematically observe the safe versus at-risk behavior of their coworkers (e.g., Geller, 1998; Krause, Hidley, & Hodson, 1996). However, employees who work in relative isolation or have little oversight from a supervisor or peer require a process where objective data can be obtained to provide feedback and coaching.
The current study addressed this limitation with a commercially available low-cost DBMS. The technology vendor provided in-vehicle video technology to record behavior of drivers for two carriers (identified as Carrier A and Carrier B). These recordings were used by fleet safety managers to provide feedback on the safe and at-risk driving behaviors of participating drivers. During the 4-week baseline phase, the event recorder recorded safety-related events; however, the feedback light on the event recorder was disabled and safety managers did not have access to the recorded safety-related events to provide feedback to drivers. During the 13-week intervention phase, the feedback light on the event recorder was activated and safety managers had access to the recorded safety-related events and followed the coaching protocol with drivers (when necessary).
Based on a total of 1,462,590 and 777,895 miles driven at Carriers A and B, respectively, the DBMS was effective in decreasing the mean rate of safety-related events/10,000 VMT. At Carrier A, the mean rate of safety-related events/10,000 VMT during the intervention phase was significantly reduced by 37 percent compared to the baseline phase. Similarly, drivers at Carrier B significantly reduced the mean rate of safety-related events/10,000 VMT during the Intervention phase by 52.2 percent compared to the baseline phase. Thus, Hypothesis 1 was supported.
Unfortunately, Hypothesis 2, a significant reduction in the severity of safety-related events, was not supported statistically because of the low number of severe safety-related events. Nonetheless, at Carrier A, the mean rate of severe safety-related events/10,000 VMT during the intervention phase was reduced by 59.1 percent compared to the baseline phase. Similarly, drivers at Carrier B reduced the mean rate of severe safety-related events/10,000 VMT during the Intervention phase by 44.4 percent compared to the baseline phase. Although these reductions were not statistically significant, they are noteworthy and in the expected direction and, with additional data, would be expected to result in statistical, as well as practical, significance.
The power of the videos in reducing safety-related events was shown in post-hoc analyses at Carrier A. Drivers in the Fleet Manager Coaching group at Carrier A significantly reduced the mean rate of safety-related events/10,000 VMT by 42.4 percent from the baseline to the intervention phase. The 34.1 percent reduction in the mean rate of safety-related events/10,000 VMT from the baseline to the intervention phase with drivers in the No Fleet Manager Coaching
33

group at Carrier A was substantial, though not statistically significant. These findings show that a DBMS can lead to practical safety benefits, but the recommended coaching program can further bolster the results achieved. Put another way, the coaching sessions where drivers reviewed a video of a safety-related event resulted in significant safety benefits, whereas the feedback light alone and/or coaching sessions without videos were less robust.
What is interesting is that the mean rate of safety-related events/10,000 VMT during the baseline phase in the No Fleet Manager Coaching group was higher than the Fleet Manager Coaching group. At first this seems counterintuitive as the drivers who have the most events would be more likely to receive a coaching session. However, the drivers in the Fleet Manager Coaching group had a rate of severe safety-related events/10,000 VMT that was 10 times higher than drivers in the No Feedback group. This illustrated that drivers in the Fleet Manager Coaching group were involved in more severe safety-related events, and thus were in need of a coaching session (which they received). Drivers in the Fleet Manager Coaching group at Carrier A reduced the mean rate of severe safety-related events/10,000 VMT from the baseline to the intervention phase by 75.5 percent (remarkable, though not significant, due to lack of statistical power). Drivers in the No Fleet Manager Coaching group increased the mean rate of severe safety-related events/10,000 VMT from the baseline to the intervention phase by 28.6 percent; however, this was also found to be non-significant. Though the results in the Fleet Manager Coaching group were not significant, the trend was clearly in the right direction and accounted for a 75.5 percent reduction in the rate of severe safety-related events/10,000 VMT. While not significant, due to the small number of severe events, the percentage reduction in severe safety-related events in the Fleet Manager Coaching groups at Carrier A has practical significance.
4.2 CONCLUSIONS
In interpreting these results, eight issues are noteworthy. First, while it appears Carrier B had substantial decreases, compared to Carrier A, in the mean rate of safety-related events/10,000 VMT (based on percentage reduction), concluding differential intervention impact is risky because Carrier A drove more safely than Carrier B during the baseline phase (1.9 versus 4.0 safety-related events/10,000 VMT). For example, drivers at Carrier A and B likely experienced different safety-related environmental conditions due to the predominant roads driven. A naturalistic study by Hanowski, Olson, Hickman, and Dingus (2006) reported that long-haul drivers typically drive on rural divided roads (e.g., highways), while local/short-haul drivers typically drive on urban undivided roads.
Second, drivers were aware the instrumented vehicles were recording their driving behaviors; thus, the issue of “subject reactivity” should be considered. However, it is unlikely this awareness influenced intervention impact as any reactivity to the event recorders or the DBMS was constant across both phases, and any effect of reactivity to being observed is likely to be most prominent at the beginning of such procedures (Campbell, 1957). In fact, the data obtained during the baseline phase may have been understated (i.e., if behavior was affected because drivers were conscious that a camera was present, the impact would be felt much more during the early stages of the study—the baseline phase. As a camera is in place over time, drivers become less conscious of it. As such, subject reactivity would diminish as the study progresses, resulting in a less robust effect during the intervention phase.) Third, technical difficulties with
34

the event recorders at Carrier A likely had an adverse effect on the positive impact of the intervention. Missing events due to these technical difficulties during the baseline phase would have likely increased the mean rate of safety-related events/10,000 VMT during the baseline phase, thereby increasing the impact of the DBMS intervention at Carrier A.
Fourth, although evidence suggests that safety managers at Carrier B did not strictly adhere to the coaching protocols, drivers significantly reduced the mean rate of safety-related events/10,000 VMT from the baseline phase to the Intervention phase. Why? The results from the post-hoc analyses at Carrier A suggest that drivers in the No Feedback group did not experience a significant reduction in the mean rate of safety-related events/10,000 VMT. This group included drivers that received a coaching session, but did not review a video in the coaching session (similar to the drivers in Carrier B). However, this is a flawed comparison as drivers in the No Feedback group at Carrier A also included drivers that received no feedback of any kind. In fact, all drivers at Carrier B received some feedback, though informally, through dispatching device messages and other communication devices. Apparently, this was sufficient to alter the driving behaviors at Carrier B. However, the high rate of sabotage casts some doubt on the results at Carrier B (278 events at Carrier B; 2 and 276 events in the baseline and intervention phases, respectively). As the driver face camera was blocked, data reductionists could not discern driver behaviors; thus, in-cab driver behaviors were unknown during these events. While out-of-cab driving behaviors, such as following too close, could be seen in these situations (and were reduced as such), drivers’ in-cab behaviors could not be seen (e.g., cell phone use, asleep at the wheel, driver unbelted, etc.). It is likely that some of these in-cab, at-risk driving behaviors were ongoing during these events; however, data reductionists were blind to their occurrence as the driver face camera was obstructed.
Fifth, the results replicate those found by McGehee et al. (2007), who also used a DriveCam system with novice teen drivers. However, there were some critical differences between the current study and McGehee at al. The participants in McGehee et al. were novice teen drivers who were still acquiring basic knowledge and skills in regards to driving a motor vehicle, whereas the participants in the current study were experienced professional drivers (the mean rate of safety-related events/10,000 VMT was 10-fold greater with the novice teen drivers compared to the experienced professional drivers in the current study). McGehee et al. also included social comparison feedback during the intervention (i.e., feedback on the performance of the other teen drivers in the study); this was not part of the coaching protocol in the current study. Williams and Geller (2000) found that the addition of social comparison feedback regarding workers’ safety performance was sufficient to improve safety-related behaviors beyond levels attained with individual behavioral feedback alone. Williams and Geller explained their unexpected finding by assuming that social comparison feedback added a motivational element to select the safe alternatives. While the individual feedback provided the teen drivers with specific information on safe versus at-risk driving behaviors, the public accountability provided by general comparisons with similar teen drivers provided an effective motivational consequence.
Sixth, the current study relied on the power of feedback to alter drivers’ at-risk driving behaviors. The delivery of feedback to increase safety-related work behaviors has received great attention in the organizational behavior management literature (Fellner & Sulzer-Azaroff, 1984; Ludwig & Geller, 1991, 1997; Reber & Wallin, 1984; Williams & Geller, 2000). However, the
35

motivational effects of feedback have been questioned. Bandura (1986) suggested that dissatisfaction with one’s prior attainments can motivate increased effort and vigilance. Without goals people do not have a standard against which to compare prior behavior; thus, self-evaluative reactions are not engaged. Without feedback people do not have information allowing them to gauge progress toward the goal. Therefore, goals or feedback alone do not activate self-regulatory processes (Bandura & Cervone, 1983; Cervone & Wood, 1995).
A weakness in studies that use feedback as an intervention component is their failure to assess goal setting. A goal is an object, aim, or endpoint of action that describes what people are trying to accomplish. Several reviews and meta-analyses have supported the basic tenets of goal-setting theory (Locke, Shaw, Saari, & Latham, 1981; Tubbs, 1986; Wood, Mento, & Locke, 1987). The basic theory proposes that goals and performance have a linear relationship (i.e., higher goals lead to higher performance). Locke and Bryan (1969) had participants drive an instrumented car over a prescribed course for three trips. During trips two and three, goals were assigned to different driving behaviors. However, participants received feedback on all driving-related behaviors. Participants only improved on those driving behaviors for which the experimenter assigned goals. Several reviews of the goal-setting literature have supported the interdependent relationship of goals and feedback (Locke & Latham, 1990; Tubbs, 1986; Wood, Mento, & Locke, 1987). Locke and Latham hypothesized that participants in feedback-only interventions reporting beneficial behavior change were spontaneously setting goals. They further state, “The unmistakable message of such [feedback] interventions must be, here is something which you should improve!” (p. 196).
The current study made no attempt to assess drivers’ goals and/or provide goal-setting training. The authors served as independent evaluators, and the purpose of the study was to assess a commercially available DBMS; no attempt was made to revise the carriers’ existing safety program. Moreover, assessment of drivers’ goal-setting behavior in the current study would have introduced an element not present in the existing safety program, thereby providing an inaccurate assessment of the this DBMS program. This aspect might be addressed in future studies assessing the efficacy of DBMSs.
Seventh, the “safety climate” at each carrier was different and these differences likely influenced drivers’ perceptions of the DBMS (as shown in the questionnaires and the differences in implementing the project). While both carriers had similar scores in FMCSA’s Safety Status Measurement System (an analysis system that combines current and historical safety performance data to measure the relative safety fitness of interstate commercial motor carriers), thus similar safety cultures, the difference in each safety manager’s rapport and trust with drivers was evident. While “safety culture” refers to the underlying beliefs and values of workers in relation to safety (Glendon, Clarke, & McKenna, 2006), “safety climate” refers to workers’ perceptions of how safety is managed in the workplace (Cox & Cheyne, 2000). It is likely that drivers at Carrier B were not ready for the DBMS and initial efforts might have focused on improving the relationship between drivers and the new safety manager. The authors recommend that carriers considering implementing a DBMS evaluate their safety culture prior to implementing any safety intervention, especially one that monitors driver behavior via video cameras. Drivers may view this as an invasion of their privacy and/or a “blame the driver” program.
36

Eighth, only a portion of the trucks at each carrier were instrumented with event recorders. Safety managers decided a-priori which trucks were instrumented in event recorders. This (and the limited time frame) limits the ability to assess the potential “fleet-wide” safety benefits of the DBMS.
Taking these eight considerations into account, the findings from this study are quite remarkable and the associated safety benefits are not typical of other safety technology interventions (Blanco et al., 2009; Fitch et al., 2008). The safety improvements found in this study, depending on the analysis, ranged from a 34.1 percent reduction to a 75.5 percent reduction in safety-related events. While in some analyses the power to assess statistical significance were absent, the practical significance of these favorable results should not be dismissed. Safety benefits on the scale found in this study highlight the potential for DBMSs to have a robust impact in reducing truck crashes on our nation’s highways.
4.3 RECOMMENDATIONS
The goal of the current study was to assess the efficacy of a commercially available low-cost DBMS in an applied setting while normal, revenue-producing deliveries were made. Thus, no attempt was made to deviate significantly from the existing DBMS program. As prior research has found the combination of goal setting and feedback to be the optimal approach; the authors recommend that future studies assessing the efficacy of a DBMS consider the addition of goal-setting training and direct assessment of participants’ goals. The current study did not assess implicit goal setting; thus, variations in goal setting among drivers could have been the reason for differential behavior change among drivers.
The current DBMS was successful in significantly reducing the mean rate of safety-related events/10,000 VMT (by 37 and 52.2 percent at Carriers A and B, respectively); however, carrier managers may be more inclined to adopt a DBMS that shows an advantageous return-on-investment. The authors recommend that such an assessment include the costs associated with implementing and maintaining the DBMS as well as the direct (e.g., damage, health care, etc.) and indirect (e.g., legal fees, insurance costs, etc.) costs associated with reduced crashes and violations.
The authors recommend that future studies assess the potential fleet-wide safety benefits of a DBMS. Data collection should last at least 1 year (possibly longer) and all participating carrier CMVs should be instrumented with data collection equipment. This will limit selection bias and allow an appropriate assessment of the safety benefits of the DBMS.
37

38
[This page intentionally left blank.]

APPENDIX A. DRIVER DEMOGRAPHIC QUESTIONNAIRE
Driver#______________ Date: _____________
Instructions: Thank you for taking the time to fill in this questionnaire! It should take you about 10 minutes to complete. Please answer each of the following items as honestly as possible. THERE ARE NO RIGHT OR WRONG ANSWERS. Select your answers quickly and do not spend too much time thinking about your answers. If you change an answer, erase the first one well. The information you provide will be kept confidential and will NOT be shared with anyone outside the VTTI research team.
1. What is your age?: ___________ years 2. Gender (Check one): Male Female
3. What is your highest level of education (please check one):
Did not complete High School High School graduate or GED Some College 2yr College degree 4yr College degree Masters degree Professional degree Doctorate degree
4. Do you wear contact lenses? (Check one) No Yes (Lens color:________________)
5. Do you wear glasses when driving? No Yes
6. Which of the following groups is most representative of your background? (Check one)
African/American Asian/American Caucasian/American Pacific Islander Hispanic/American Native American Middle Eastern Other:_____________
7. Is English your language of preference for: Reading? (check one) No Yes
Speaking? (check one) No Yes
8. How long have you been driving commercial vehicles? _____years _____months
9. How long have you been working for this company? _____years _____months
10. How long did you work for your previous employer (your job before this one)? _____years _____months 11. Are you a member of a union (Check one)? No Yes, which one? ___________ 12. Type of license and endorsements held: License:________________ Endorsements: _______________
13. How many moving violations have you had in the: Last 12 months_____ Last 36 months_____
14. How many vehicular crashes (personal or work) have you been involved in during the: Last 12 months___
Last 36 months___
15. How many of these crashes in Question 14 were considered “your fault” during the: Last 12 months_____ Last 36 months_____
39

40
[This page intentionally left blank.]

APPENDIX B. IN-STUDY QUESTIONNAIRE
Instructions: Thank you for taking the time to complete this survey! It should take you about five minutes to complete. Please leave blank any information you are not sure of or do not feel comfortable providing. The information you provide will be kept anonymous and will NOT be shared with any safety managers or other drivers. By completing and returning this questionnaire you will be entered into the bi-monthly raffle for $50.
Driver Number:___________________________________
Date:___________
Event#__________
Description of Event:________________________________________________________________________________________________________________________________________________________________________________________________________________________________________________________________________
1. Did you review video from this event? No Yes 2. Did you review any prior events (if any) during this training session? No Yes N/A 3. Was the event an example of risky or safe driving behavior? Safe Risky 4. How clearly was the “root cause” of the event communicated to you (please circle)?
1 2 3 4 5 6 7 8 9 Very Unclear Neutral Very Clear
5. Did you agree with the manager’s viewpoint? No Yes 6. Did the manager identify ways the event could be prevented in the future? No Yes 7. How likely are you to use the information discussed in the coaching session (please circle)?
1 2 3 4 5 6 7 8 9 Very Unlikely Neutral Very Likely
8. Did you feel like the coaching session was positive (please circle)? 1 2 3 4 5 6 7 8 9
Very Negative Neutral Very Positive 9. Did you have any comments regarding the event? No Yes
a. If YES, briefly describe them:______________________________________________________ ____________________________________________________________________________________________________________________________________________________________________________________________________________________________________________________________________________________________________________________________________________________________________________________________________________________________________________________________________________________________________________________________________________________________ 10. How long was the coaching session? _____minutes
41

42
[This page intentionally left blank.]

APPENDIX C. POST-STUDY DRIVER QUESTIONNAIRE
Instructions: Thank you for taking the time to complete this survey! It should take you about five minutes to complete. Please leave blank any information you are not sure of or do not feel comfortable providing. The information you provide will be kept anonymous and will NOT be shared with safety managers or other drivers. By completing and returning this questionnaire you will be entered into a raffle for $50.
Driver Number:___________________________________
Date:___________
1. Did you ever review a video(s) from an event with your manager? Yes No (If No, Skip to Question 5)
2. Overall, did you find the video(s) to be helpful in identifying risky driving behavior (on a scale of 1 to 9, please circle)?
1 2 3 4 5 6 7 8 9
Extremely Unhelpful Neutral Extremely Helpful
3. Overall, how much did you trust the accuracy of the video(s) (on a scale of 1 to 9, please circle)?
1 2 3 4 5 6 7 8 9
Extremely Distrustful Neutral Extremely Trustful
4. Overall, how clearly was the “root cause” of the event(s) communicated to you (on a scale of 1 to 9, please circle)?
1 2 3 4 5 6 7 8 9
Extremely Unclear Neutral Extremely Clear
5. Overall, do you feel like you are a safer driver after participating in this program (on a scale of 1 to 9, please circle)?
1 2 3 4 5 6 7 8 9
Much Riskier No Change Much Safer
6. Overall, what do you think about this safety process (on a scale of 1 to 9, please circle)?
1 2 3 4 5 6 7 8 9
Extremely Negative Neutral Extremely Positive
7. Overall, did you find this system useful in reducing some of your risky driving habits (on a scale of 1 to 9, please circle)?
1 2 3 4 5 6 7 8 9
Extremely Useless Neutral Extremely Useful
43

8. What improvements would you make to the technology used to capture events (i.e., video)? __________________________________________________________________________________________________________________________________________________________________________________________________________________________________________________________________________________________________________________________________________________________________________________________________________________________________________________________________________________________________________________________________________
9. What improvements would you make to the coaching process (if applicable)?_______________________________________________________________________________________________________________________________________________________________________________________________________________________________________________________________________________________________________________________________________________________________________________________________________________________________________________________________________________________________________________________________________________________________________________________________________________________
10. What, if anything, would you change about this safety process? ________________________________________________________________________________________________________________________________________________________________________________________________________________________________________________________________________________________________________________________________________________________________________________________________________________________________________________________________________________________________________________________________________________________________________________________________________________________________________________________________________________________________________________________
11. Any general comments?_______________________________________________________________________________________________________________________________________________________________________________________________________________________________________________________________________________________________________________________________________________________________________________________________________________________________________________________________________________________________________________________________________________________________________________________________________________________________________________________________________________________________________________
Thank you for your time. This will count as one entry in the raffle.
44

APPENDIX D. SAFETY MANAGER DEMOGRAPHIC QUESTIONNAIRE
Date: _____________
Instructions: Thank you for taking the time to fill in this questionnaire! It should take you about 10 minutes to complete. Please answer each of the following items as honestly as possible. THERE ARE NO RIGHT OR WRONG ANSWERS. Select your answers quickly and do not spend too much time thinking about your answers. If you change an answer, erase the first one well. The information you provide will be kept confidential and will NOT be shared with anyone outside the VTTI research team.
1. What is your age?: ___________ years 2. Gender (Check one): Male Female
3. What is your highest level of education (please check one):
Did not complete High School High School graduate or GED Some College 2yr College degree 4yr College degree Masters degree Professional degree Doctorate degree
4. Which of the following groups is most representative of your background? (Check one)
African/American Asian/American Caucasian/American Pacific Islander Hispanic/American Native American Middle Eastern Other:_____________
5. Is English your language of preference for: Reading? (check one) No Yes
Speaking? (check one) No Yes
6. How long have you been a manager in commercial vehicle operations? _____years _____months
7. How long have you been working for this company? _____years _____months
8. How many moving violations have you had in the: Last 12 months_____ Last 36 months_____
9. How many vehicular crashes (personal or work) have you been involved in during the: Last 12 months___ Last 36 months___
10. How many of these crashes in Question 9 were considered “your fault” during the: Last 12 months_____
Last 36 months_____
45

46
[This page intentionally left blank.]

APPENDIX E. POST-STUDY SAFETY MANAGER QUESTIONNAIRE
Instructions: Thank you for taking the time to complete this survey! It should take you about five minutes to complete. Please leave blank any information you are not sure of or do not feel comfortable providing. The information you provide will be kept anonymous and will NOT be shared with any managers or drivers. You will be paid a flat fee of $25 for completing this questionnaire
Date:___________ 1. Overall, how time consuming did you find coaching drivers (please circle)?
1 2 3 4 5 6 7 8 9 Not Time Consuming Moderate Very Time Consuming
2. Overall, how would you describe your interactions with drivers while reviewing the video events (please circle)?
1 2 3 4 5 6 7 8 9 Very Negative Neutral Very Positive
3. Overall, do you feel drivers were interested in reviewing the video events (please circle)? 1 2 3 4 5 6 7 8 9
Very Indifferent Neutral Very Interested
4. Overall, did you find it difficult to communicate the “root cause” of the event to drivers (please circle)? 1 2 3 4 5 6 7 8 9
Very Easy Neutral Very Difficult
5. Overall, do you feel like you’ve improved in your management of drivers after participating in this study (please circle)?
1 2 3 4 5 6 7 8 9 Much Worse Neutral Much Improved
6. Would you recommend this safety process to other fleet safety managers? No Yes a. If “No or “Yes”,
why?_____________________________________________________________________________________________________________________________________________________________________________________________________________________________________________________________________________________________________________________________________________________________________________________________________________________________________________________________________________________
7. Overall, do you believe drivers who participated in this project have become safer drivers? 1 2 3 4 5 6 7 8 9
Much Riskier Neutral Much Safer
8. Overall, what do you think about this safety process (please circle)? 1 2 3 4 5 6 7 8 9
Very Negative Neutral Very Positive
9. Overall, did you find this system useful in identifying drivers’ risky driving habits (please circle)? 1 2 3 4 5 6 7 8 9
Completely Useless Neutral Extremely Useful
47

48
10. What improvements would you make to the technology used to capture events (i.e., video)? ____________________________________________________________________________________________________________________________________________________________________________________________________________________________________________________________________________________________________________________________________________________________________________________________________________________________________________________________________________________________________________________________________
11. What improvements would you make to the software used to review video events with drivers? ____________________________________________________________________________________________________________________________________________________________________________________________________________________________________________________________________________________________________________________________________________________________________________________________________________________________________________________________________________________________________________________________________
12. What improvements would you make to the coaching process? ____________________________________________________________________________________________________________________________________________________________________________________________________________________________________________________________________________________________________________________________________________________________________________________________________________________________________________________________________________________________________________________________________
13. What, if anything, would you change about this safety process? __________________________________________________________________________________________________________________________________________________________________________________________________________________________________________________________________________________________________________________________________________________________________________________________________________________________________________________________________________________________________________________________________________________________________________________________________________________________
14. General comments? ____________________________________________________________________________________________________________________________________________________________________________________________________________________________________________________________________________________________________________________________________________________________________________________________________________________________________________________________________________________________________________________________________
Thank you for your time

ACKNOWLEDGEMENTS This project would not have been possible without the participation of the trucking fleets and drivers that participated in the current study.
49

50
[This page intentionally left blank.]

REFERENCES Alavosius, M.P., & Sulzer-Azaroff, B. (1986). The effects of performance feedback on the safety
of client lifting and transfer. Journal of Applied Behavior Analysis, 19(3):261-267.
American Transportation Research Institute. (2005). Predicting Truck Crash Involvement: Developing a Commercial Driver Behavior-Based Model and Recommended Countermeasures. Alexandria, VA: American Transportation Research Institute.
Bandura, A.E. (1986). Social foundations of thought and action: A social cognitive theory. Upper Saddle River, NJ: Prentice Hall.
Bandura, A.E., & Cervone, D. (1983). Self-evaluative and self-efficacy mechanisms governing the motivations effects of goal systems. Journal of Personality and Social Psychology, 45(5):1017–1028.
Behavioral Science Technology, Inc. (1998). Ongoing Studies of the Behavioral Accident Prevention Process® Technology (3rd edition). Ojai, CA: Behavioral Science Technology, Inc.
Blanco, M., Bocanegra, J.L., Morgan, J.F., Fitch, G.M., Medina, A., Olson, R.L., Hanowski, R.J., Daily, B. & Zimmermann, R.P. (2009). Assessment of a drowsy driver warning system for heavy-vehicle drivers: Final report (Report no. DOT 811 117). Washington, DC: National Highway Safety Administration, USDOT. Retrieved August 28, 2009 from: http://www.nhtsa.dot.gov/staticfiles/DOT/NHTSA/NRD/Multimedia/PDFs/Crash%20Avoidance/2009/811117.pdf
Campbell, D.T. (1957). Factors relevant to the validity of experiments in social settings. Psychological Bulletin, 54(4):279–312.
Cervone, D., & Wood, R. (1995) Goals, feedback, and the differential influence of self-regulatory processes on cognitively complex performance. Cognitive Therapy and Research, 19(5):519–545.
Cox, S.J., & Cheyne, A.J.T. (2000). Assessing safety culture in offshore environments. Safety Science, 34(1–3):111–129.
Daniels, A.C. (1999). Performance Management. Tucker, GA: Performance Management Publications.
FMCSA. (2006). Report to Congress on the Large Truck Crash Causation Study. Washington, DC: Federal Motor Carrier Safety Administration, USDOT. Retrieved October 6, 2009 from: http://www.fmcsa.dot.gov/facts-research/research-technology/report/ltccs-2006.pdf
Fellner, D.J., & Sulzer-Azaroff, B. (1984). Increasing industrial safety practices and conditions through posted feedback. Journal of Safety Research, 15(1):7-21.
Fitch, G.M., Rakha, H.A., Arafeh, M., Blanco, M., Gupta, S.K., Zimmermann, R.P., & Hanowski, R.J. (2008). Safety benefit evaluation of a forward collision warning system: Final report (Report No. DOT HS 810910). Washington, DC: National Highway Traffic Safety Administration, USDOT. Retrieved October 6, 2009 from: http://www.nhtsa.dot.gov/staticfiles/DOT/NHTSA/NRD/Multimedia/PDFs/Crash%20Avoidance/2008/DOT-HS-810-910.pdf
51

Fox, D.K., Hopkins, B.L., & Anger, W.K. (1987). The long-term effects of a token economy on safety performance in open-pit mining. Journal of Applied Behavior Analysis, 20(3):215–224.
Geller, E.S. (2001). The Psychology of Safety Handbook. Boca Raton, FL: CRC Press.
Glendon, A.I., Clarke, S.G. & McKenna, E.F. (2006) Human Safety and Risk Management, Boca Raton, FL: CRC Press.
Gustello, S J. (1993). Do we really know how well our occupational accident prevention programs work? Safety Science, 16:445–463.
Hanowski, R.J., Olson, R.L., Hickman, J.S., & Dingus, T.A. (2006). The 100-car naturalistic driving study: A descriptive analysis of light vehicle/heavy vehicle interactions from the light vehicle driver’s perspective, data analysis results (Report No. FMCSA-RRR-06-004). Washington, DC: Federal Motor Carrier Safety Administration, USDOT. Retrieved August 26, 2009, from: http://www.fmcsa.dot.gov/facts-research/research-technology/report/100-car-naturalistic-study/
Hanowski, R.J., Keisler, A.S., & Wierwille, W.W. (2004). Light vehicle-heavy vehicle interactions: A preliminary assessment using critical incident analysis (Report No. FMCSA-RT-04-004). Washington, DC: Federal Motor Carrier Safety Administration. Available from National Technical Information Service (http://www.ntis.gov/ via order number: PB2004-105922)
Hantula, D.A., Rajala, A.K., Kellerman, E.G., & Bragger, J.L. (2001). The value of workplace safety: A time-based utility analysis model. Journal of Organizational Behavior Management, 21(2):79–97.
Hendricks, D.L., Fell, J.C., & Freedman, M. (1999). The relative frequency of unsafe driving acts in serious traffic crashes. Washington, DC: National Highway Traffic Safety Administration, USDOT. Retrieved October 6, 2009 from: http://www.nhtsa.dot.gov/people/injury/research/UDAshortrpt/UDAsummtechrept.pdf
Hickman, J.S., & Geller, E.S. (2003). A safety self-management intervention in mining operations. Journal of Safety Research, 34(3):299–308.
Hickman, J.S., Kipling, R.R., Olson, R.L., Fumero, M.C., Blanco, M., & Hanowski, R.J. (in press). Heavy vehicle-light vehicle interaction data collection and countermeasure research project: Preliminary analysis of data collected in the drowsy driver warning system field operational test. Washington, DC: Federal Motor Carrier Safety Administration, USDOT.
Knipling, R.R., Hickman, J.S., & Bergoffen, G. (2003). Synthesis 1: Effective Commercial Truck and Bus Safety Management Techniques. Transportation Research Board Commercial Truck and Bus Synthesis Program Project MC-02, ISSN 1544-6808, ISBN 0-309-08754-6. Washington DC: Transportation Research Board.
Komaki, J., Barwick, K.D., & Scott, L.R. (1978). A behavioral approach to occupational safety: Pinpointing and reinforcing safe performance in a food manufacturing plant. Journal of Applied Psychology, 63(4):434–445.
52

Krause, T.R., Hidley, J.H., & Hodson, S.J. (1996). The Behavior-Based Safety Process: Managing Involvement for An Injury-Free Culture (2nd edition). New York, NY: Van Nostrand Reinhold.
Krause, T. R., Robin, J. L. & Knipling, R. R. (1999). The potential application of behavior-based safety in the trucking industry (Report no. FHWA-MC-99-071). Washington, DC: Federal Highway Administration, USDOT. Retrieved October 6, 2009 from: http://isddc.dot.gov/OLPFiles/FHWA/009241.pdf
Lipsey, M.W. (1990). Design sensitivity: Statistical power for experimental research. Newbury Park, CA: Sage Publications.
Loafmann, B. (1998). Behavior-based safety: Power and pitfalls. Professional Safety, 43:20-23.
Locke, E.A., & Bryan, J.F. (1969). The directing function of goals in task performance. Organizational Behavior and Human Performance, 4:35–42.
Locke, E., and Latham, G. (1990). A theory of goal setting and task performance. Englewood Cliffs, NJ: Prentice-Hall.
Locke, E.A., Shaw, K.N., Saari, L.M., & Latham, G.P. (1981). Goal setting and task performance: 1969–1980. Psychological Bulletin, 90(1):125–152.
Ludwig, T.D., & Geller, E.S. (1997). Managing injury control among professional pizza deliverers: Effects of goal-setting and response generalization. Journal of Applied Psychology, 82(2):253–261.
Ludwig, T.D., & Geller, E.S. (1991). Improving the driving practices of pizza deliverers: Response generalization and moderating effects of driving history. Journal of Applied Behavior Analysis, 24:31–34.
Mattila, M., & Hyödynmaa, M. (1988). Promoting job safety on building: An experiment on the behavior analysis approach. Journal of Occupational Accidents, 9:255–267.
McGehee, D.V., Raby, M., Carney, C., Lee, J.D., & Reyes, M.L. (2007). Extending parental mentoring using an event-triggered video intervention in rural teen drivers. Journal of Safety Research, 38(2):215–227.
McSween, T.E. (1995). The Values-Based Safety Process: Improving Your Safety Culture with a Behavioral Approach. New York, NY: Van Nostrand Reinhold.
Peterson, D. (1984). An experiment in positive reinforcement. Professional Safety, 29(5):30–35.
Reber, R.A., & Wallin, J.A. (1984). The effects of training, goal-setting and knowledge of results on safe behavior: A component analysis. Academy of Management Journal, 27(3):544–560.
Saarela, K.L. (1990). An intervention program utilizing small groups: A comparative study. Journal of Safety Research, 21(4):149–156.
Sulzer-Azaroff, B. (1978). Behavioral ecology and accident prevention. Journal of Organizational Behavior Management, 2:11–44.
Sulzer-Azaroff, B., & Austin, J. (2000). Behavior-based safety and injury reduction: A survey of the evidence. Professional Safety, 45(7):19–24.
53

54
Sulzer-Azaroff, B., Loafman, B., Merante, R.J., & Hlavacek, A.C. (1990). Improving occupational safety in a large industrial plant: A systematic replication. Journal of Organizational Behavior Management, 11:99–120.
Treat, J.R.., Tumbas, N.S., McDonald, S.T., Shinar, D., Hume, RD., Mayer, RE., Stansifer, RL., & Catellan, N.J. (1979). Tri-level study of the causes of traffic accidents: Volume I: Causal factor tabulations and assessment (Document No. DOT HS-805 085). Washington, DC: National Highway Traffic Safety Administration, USDOT.
Tubbs, M.E. (1986). Goal setting: A meta-analytic examination of the empirical evidence. Journal of Applied Psychology, 71(3):474–483.
Williams, J.H., & Geller, E.S. (2000). Behavior-based intervention for occupational safety: Critical impact of social comparison feedback. Journal of Safety Research, 31(3):135–142.
Wood, R.E., Mento, A.J., & Locke, E.A. (1987). Task complexity as a moderator of goal effects: A meta-analysis. Journal of Applied Behavior, 72(3):416–425.