evaluating the impact of the physical fidelity of the
TRANSCRIPT

Clemson UniversityTigerPrints
All Dissertations Dissertations
5-2017
Evaluating the Impact of the Physical Fidelity of theLearning Environment on Skill Acquisition,Retention, and ApplicationMyrtede AlfredClemson University, [email protected]
Follow this and additional works at: https://tigerprints.clemson.edu/all_dissertations
This Dissertation is brought to you for free and open access by the Dissertations at TigerPrints. It has been accepted for inclusion in All Dissertations byan authorized administrator of TigerPrints. For more information, please contact [email protected].
Recommended CitationAlfred, Myrtede, "Evaluating the Impact of the Physical Fidelity of the Learning Environment on Skill Acquisition, Retention, andApplication" (2017). All Dissertations. 1871.https://tigerprints.clemson.edu/all_dissertations/1871

EVALUATING THE IMPACT OF THE PHYSICAL FIDELITY OF THE LEARNING ENVIRONMENT ON SKILL ACQUISITION, RETENTION, AND APPLICATION
________________________________________________________________________
A Dissertation Presented to
the Graduate School of Clemson University
________________________________________________________________________
In Partial Fulfillment of the Requirements for the Degree
Doctor of Philosophy Industrial Engineering
________________________________________________________________________
by Myrtede C. Alfred
May 2017 ________________________________________________________________________
Accepted by: Dr. David. M. Neyens, Committee Chair
Dr. Anand Gramopadhye, Committee Co-chair Dr. Joel Greenstein
Dr. Marissa Shuffler-Porter

ii
ABSTRACT
Simulations are believed to support learning outcomes by increasing student
engagement and providing a more immersive and interactive learning environment.
Research into the effectiveness of simulations as learning tools has found tangible
benefits, including increased learner engagement and conceptual gains. Simulations also
offer the benefits of a safer and more accessible learning environment, where students
can practice until the point of proficiency. While simulations have been used extensively
in workforce education, there is limited research that compares learning outcomes –
affective, skill-based, and cognitive - when learning in the physical environment is
substituted with learning in a simulated environment, particularly for technical skills.
Educators and researchers have questioned whether simulations provide learners with the
same quality of education as learning in a physical environment. Simulations lack the
nuances that exist in the real world and may also oversimplify a complex system. Its ideal
representation of a system may create issues for learners when they encounter issues in
the real world environment that they never experienced in the simulation. Consequently,
learners may doubt that the principles demonstrated in a simulation are applicable in the
real world. Proponents of physical laboratories argue that simulations limit students from
experiencing hands-on manipulation of real materials and that they lack the necessary
detail and realism to effectively teach proper laboratory technique.
This research works to fill this gap by investigating how individuals transfer
learning in simulated environments to the real world. Affective, cognitive and skill-based
learning outcomes were used to evaluate acquisition, transfer and retention. There are
iii
three primary aims of this research. The first aim was to identify how the physical fidelity
of the learning environment impacted learning outcomes, including transfer, and whether
the goal orientation and cognitive ability of the learner influenced the relationship
between the physical fidelity of the learning environment and learning outcomes. The
second aim of this research was to understand the mechanisms through which the
physical fidelity of the learning environment impacted proficiency outcomes. The third
aim of the study was to understand how the physical fidelity of the learning environment
impacted retention. The findings from these aims offer substantive contributions about
how simulations affect learning, transfer, and retention outcomes. This research has
implications for the design and implementation of simulated environments in engineering
and technical disciplines, specifically courses delivered in an online setting. Whether
positive or negative, these results can help identify potential issues and provide insight on
what aspects of the transition from learning in simulations to working in the real world
create the greatest stumbling blocks for students.

iv
DEDICATION
To my mom, Marie Emmanuela Delourdes Alfred, for instilling us with the value of education. To my dad, George Alfred, for working more hours than there are in a day to support us. To my siblings – Rico, Andy, Jerry, Marco, Cleo, Tania, and Tash – for your unshakeable faith in me. To my many nieces and nephews for keeping me young. And to
my nephew Johnny (Junior) and everything he would have achieved.

v
ACKNOWLEDGEMENTS
I did not expect to spend more than a year and half in Clemson but with the support of so
many people I now go by Dr. Alfred. So first off, I thank my family – my parents,
siblings and cousins (Mike, Solvin, Edna, and Purchawna) - for all of their support
throughout this process and through my life. And thanks to the folks who are like family
– Bina and Esther. Thanks to all of my teachers who prepped me for this, specifically,
Ms. T, Mrs. & Mr. Peoples, and Dr. Dana Farrow. Thanks to folks who encouraged me to
stay for my PhD (Dr. G, Kapil, Dr. Neyens, and my BGSA family). Thanks to my
committee members for their guidance these past several years - Dr. Neyens, Dr. G, Dr.
Greenstein and Dr. Shuffler. Special thanks to Dr. Moore (my unofficial committee
member). My IE family (Sree, Melissa P, Sushmita, Sagar, Rekha, Venkat, and Shruti).
My labmates - Sijun, Ali, Elizabeth, Puneeth, Katie, Courtney, and Forrest. Much thanks
to all of the IE staff who saved me time and time again – Saundra, Beverly, Kristina,
Martin, Brandon, Jenny, and Debora. Thanks to the folks at CWD who introduced me to
this research and helped with my get my study on EducateWorkforce – Zach, Rebecca,
and Eddie. My CI students. Special thanks to Dr. Frankie Felder who helped me through
some tough times. MSSI folks - Jerry Knighton, Leslie Doss, and Leon Wiles. Thanks to
Dr. Dumas who has been a major supporter for me in her short time here. My BGSA
family and our advisor, Benardo Dargan. And last but definitely not least, I have to
acknowledge the card carrying members of #TeamMyrtede – Ricky, VeeAnder, April,
Shakira, Maurice, Shea Butter John, Melva, Short Shaun, Tall Shaun, Evan, Jaylin, &
Nicole; having y’all here has made my Clemson experience unforgettable.

vi
TABLE OF CONTENTS
Page
TITLE PAGE ..................................................................................................................... i
ABSTRACT ..................................................................................................................... ii
DEDICATION ................................................................................................................ iii
ACKNOWLEDGEMENTS ............................................................................................. iv
LIST OF FIGURES ......................................................................................................... vi
LIST OF TABLES ........................................................................................................ viii
CHAPTER ONE: INTRODUCTION ............................................................................... 1
CHAPTER TWO: LITERATURE REVIEW ................................................................... 7
CHAPTER THREE: DISSERTATION STUDY ONE .................................................. 25
CHAPTER FOUR: DISSERTATION STUDY TWO .................................................... 48
CHAPTER FIVE: DISSERTATION STUDY THREE .................................................. 71
CHAPTER SIX: GENERAL CONCLUSIONS ............................................................. 99
APPENDICES .............................................................................................................. 113
A: Pretest ........................................................................................................... 114 B: Demographic survey .................................................................................... 116 C: Goal orientation instrument .......................................................................... 118 D: Post instruction self-efficacy instrument ...................................................... 120 E: Posttest .......................................................................................................... 121 F: Construction task .......................................................................................... 123 G: Construction task (T1) ................................................................................. 124 H: Construction task (T2) ................................................................................. 125 I: Posttest (T1) .................................................................................................. 126 J: Posttest (T2) ................................................................................................. 130 K: Transition notes for participants in the 2D and 3D simulations .................. 134
REFERENCES ............................................................................................................. 135

vii
LIST OF FIGURES
Figure Page
2.1. Training Transfer Model ........................................................................................... 8
2.2. Model of the Proposed Research ............................................................................ 23
3.1 Arduino 2D Breadboard ........................................................................................... 30
3.2. NI Multisim Breadboard ......................................................................................... 30
3.3. 800 Point Solderless Breadboard ............................................................................ 31
3.4. Mean SE with Standard Errors for Each Condition ................................................ 33
3.5. LGO and Physical Fidelity Interaction on Construction Time ............................... 38
4.1. Feedback Provided to Participants Working in 3D Breadboard Environment ....... 65
5.1. Educate Workforce Student Dashboard .................................................................. 75
5.2. Setup of Study for 2D and 3D participants ............................................................. 75
5.3. Timeline of Procedures for Dissertation Study ....................................................... 77
5.4. Posttest Scores Based on Measurement Occasion .................................................. 84
5.5. Interaction between Fidelity and Measurement Occasion for Design Score .......... 85
5.6. Transitions between Error Categories from T0 (post) – T1 (2-week) .................... 88
5.7. Transitions between Error Categories from T2 (2-week) – T3 (4-week) ............... 88
6.1. Research Aims ........................................................................................................ 99
6.2. Comparison of mean self-efficacy time per condition .......................................... 104

viii
LIST OF TABLES
Table Page
3.1. ANOVA for Participants’ Self-efficacy Following Instruction and Practice. ........ 33
3.2. ANOVA for Participants’ Gain Score from the Pretest to the Posttest. ................. 34
3.3. Frequency of Errors in Participants’ Circuit Design Task. ..................................... 34
3.4. ANOVA for Participants’ Construction Time on the Physical Breadboard ........... 36
3.5. Frequency of Errors in Participants’ Circuit Construction Grades. ........................ 37
4.1. Representative Sample of Participants.................................................................... 49
4.2. High Level Categories Generated from Memos and Transcripts ........................... 55
4.3. Properties and Dimensions for Each of the Categories .......................................... 56
5.1. ANOVA for Gain Score.......................................................................................... 79
5.2. Comparison of Cognitive ability for Pretest Scores ............................................... 79
5.3. ANOVA for Design Score ...................................................................................... 80
5.4. Comparison of Cognitive Ability for Design Score ............................................... 80
5.5. Mean construction time per condition .................................................................... 81
5.6. ANOVA for Construction Time ............................................................................. 81
5.7. Mean construction time based on cognitive ability ................................................ 81
5.8. Tests of Model Effects for Design Score ................................................................ 82
5.9. Parameter Estimates for Design Score .................................................................... 82
5.10. Test of Model Effects for Posttest Scores ............................................................. 83
5.11. Parameter Estimates for Posttest Scores ............................................................... 83
5.12. Tests of Fixed Effects for Design Score (T0-T2) ................................................. 85

ix
5.13. Mean Design Score Based on Measurement Occasion......................................... 85
5.14. Parameter Estimates for Design Score .................................................................. 86
5.15. Fixed Effects for Construction Time .................................................................... 86
5.16. Parameter Estimates for Design Score .................................................................. 87
5.17. Fixed Effects for Circuit Construction ................................................................. 89
6.1. Comparison of mean construction time per condition ......................................... 104
1
CHAPTER ONE
INTRODUCTION
The use of technology has led to unprecedented changes in secondary, higher, and
workforce education. For example, virtual schools enable high school students to earn
their diplomas online, and, similarly, online degree programs have become increasingly
more commonplace in higher education. In the professional world, organizations
leverage online courses and webinars to provide their employees with continuing and
just-in-time educational opportunities. This learning environment, which has historically
been defined as having a delivery mechanism with at least 80% of the course content
delivered online, has evolved significantly over the past decade (Kentor, 2015). Early
platforms were primarily asynchronous, utilizing chatrooms and discussion boards. Now
it is common to see synchronous online education with instructors holding lectures and
discussion in virtual classrooms.
Online education has also been highly effective in increasing educational
opportunities for students, particularly nontraditional students who, for example, are
older, attend school part-time, or are financially independent (Allen & Seaman, 2007). In
addition, it has frequently focused on such conceptual programs as MBAs, public
administration, and education programs (Allen & Seaman, 2006). On the other hand,
engineering and other technical fields have lagged behind other disciplines in using
online delivery for course and laboratory instruction (Bourne, Harris, & Mayadas, 2005).
Because presenting such technical course material in an online setting necessitates
adaptation, it is important to develop and subsequently evaluate online education

2
technologies and pedagogies to ensure they are effective in imparting technical skills
(Bernard et al., 2004). Identifying whether these technical and hands-on tasks can be
effectively learned in simulated environments is an important first question that needs to
be addressed before expanding course offerings in online education.
More specifically, designing effective simulated laboratories is instrumental in
supporting the development of a robust online engineering, science and technical
curriculum as such instruction is a key educational component in these disciplines.
Laboratories were initially developed with the belief that understanding how to apply
science to solve real world problems requires both theory and practice (Auer, Pester,
Ursutiu, & Samoila, 2003). As a result, their instructional space focuses on
demonstrating laboratory techniques, developing analytical thinking and connecting
theory to practice for students (Woodfield et al., 2005); thus, using the physical
equipment and components during instruction represents the highest level of physical
fidelity with the actual working world as physical laboratories provide students with the
opportunity to experience the sensory characteristics of the tools and components and, in
some instances, learn in an environment closely corresponding to that in which they will
be used (Zacharia, 2007; Zacharia & Olympiou, 2011). Additionally, such physicality, i.
e. the actual manipulation of physical material, is believed to be important for learning
(Zacharia & Olympiou, 2011).
Although simulated laboratories are increasingly used in science and engineering
education (Gillet, De Jong, Sotiriou, & Salzmann, 2013), they have been primarily
employed to supplement classroom education (Finkelstein et al., 2005), not as stand-

3
alone educational delivery systems. These laboratories provide several advantages over
physical ones, including creating a safe environment that allows learners to practice at
their own pace and on their own schedule until they reach the point of proficiency
(Krueger, 1991; Zacharia, 2007). Just as important, simulated laboratories can also be
delivered in an online setting that allows increased diversity and access to higher
education, increased efficiency of delivery, and improved personalization of the learning
process (Henderson, Selwyn, and& Aston, 2015). In addition, simulations can support
learning outcomes by increasing student engagement and providing a more immersive
and interactive learning environment (Adams et al., 2005). However, one issue with the
use of these labs, especially for technical tasks, is whether they provide the same quality
of education. Although simulations have had a long history of use in workforce
education, the nature of those industries does not allow direct comparison between
learning in real-world and simulated environments (Stone, 2001), in part because they
have primarily been used in industries where engaging in real-world training would be
dangerous, expensive, or potentially unethical.
The research comparing learning outcomes between the physical and simulated
environment is limited, particularly for technical skills. The majority of the studies
investigating learning in 2D and 3D simulations have focused on conceptual gains, with
none specifically evaluating transfer and retention outcomes (Campbell et al., 2002;
Finkelstein et al., 2005; Zacharia, 2007; Zacharia & Olympiou, 2011; Jaakola, Nurmi,
and Veermans, 2011). In this context, learning is defined as the acquisition of knowledge
following a period of instruction, while retention refers to the length of time it is

4
remembered and transfer indicates the ability of students to apply their knowledge
outside of the learning environment (Baldwin & Ford, 1988). The research reported here
seeks to understand whether individuals who learn a technical task in a 2D or 3D
simulated environment achieve comparable learning, transfer, and retention outcomes as
those who learn in a physical environment. The comparison of 2D and 3D simulations is
particularly novel as the studies evaluating the influence of increasing fidelity on learning
outcomes is limited. Fidelity in this context refers to the degree which a virtual or
simulated environment corresponds to the real world (Alexander, Brunye, Sidman, and
Weil 2005).
As the effectiveness of technology in relation to learning outcomes is also
influenced by learner characteristics such as cognitive ability and prior knowledge, this
research investigates these attributes on learning, retention and transfer. In particular,
learner characteristics impact learning strategies, effort, and perseverance (De Raad &
Schouwenburg, 1996), attributes that can subsequently influence the effectiveness of an
instructional program as well as its learning outcomes (Anderson, 1982; Noe, 1986;
Snow, 1989). While there are many characteristics which can potentially influence
learning and transfer outcomes, this study focused on goal orientation, engagement, and
cognitive ability. Currently, there is limited research investigating the possible
moderation effects of these characteristics on the relationship between fidelity and the
various outcomes.
Both simulations and physical instruction have benefits and disadvantages. The
impetus for exploring whether a technical curriculum can be effectively learned in
5
simulated environments stems from both the increasing use of technology in education
and the educational opportunities it can create. The overall goal of this research is to
provide insight in terms of what design characteristics are important for developing
effective simulations for lab instruction and how institutions can support this form of
instruction.
Research Aims
More specifically, this research investigating learning, transfer, and retention outcomes
for participants learning at different levels of physical fidelity involves the following
three primary aims:
• Aim 1: Identify how the physical fidelity of the learning environment impacted
skill acquisition and transfer and determine whether the goal orientation and
cognitive ability of the learner moderated these relationships. This aim was
assessed using an experimental study that compared learning outcomes among
participants learning to construct a circuit on a breadboard under three different
levels of physical fidelity: a 2D simulation, a 3D simulation, and physical
components.
• Aim 2: Identify how the physical fidelity of the learning environment and the
transition from the simulated environment to the physical environment
contributed to differences in the learning outcomes achieved by the participants.
This aim was evaluated by interviewing a representative sample of participants
from the first study about their experiences learning under different levels of

6
fidelity and their transition from the simulated environments to the physical
environment.
• Aim 3: Evaluate how the physical fidelity of the learning environment impacts
retention. This aim was examined using an experimental study that compared
retention outcomes at the 2-week and 4-week intervals among participants
learning to construct a circuit on a breadboard using a 2D simulation, a 3D
simulation, or physical components.
These research aims will provide insights about the effects of physical fidelity on
learning, transfer, and retention outcomes. Prior to developing the studies to evaluate
these aims, a comprehensive literature review was conducted to gain the context and
information needed to thoroughly understand the research area. Chapter 2 discusses the
relevant literature concerning laboratory instruction and the use of 2D and 3D simulations
in laboratory instruction, specifically in science and engineering. Goal orientation and
cognitive ability and their influence on these outcomes were also reviewed. The third
chapter discusses the initial dissertation experiment evaluating the influence of physical
fidelity on learning and transfer outcomes, while the fourth chapter describes the
qualitative analysis conducted to determine how the transition from the simulated
environments to the physical environment contributed to the learning outcomes achieved
by participants, and the fifth chapter discusses the last study which evaluated the effect of
the physical fidelity of the learning environment on retention. The final chapter discusses
conclusions, broader impacts, and potential areas for future research.

7
CHAPTER TWO
LITERATURE REVIEW
This literature review focuses on research on the impact of the physical fidelity of
the learning environment on learning, retention and transfer outcomes within the larger
instructional model and how this relationship may be influenced by specific learner
characteristics. It is organized into two sections: (a) the impact of physical fidelity on
instructional (learning and retention) and transfer outcomes and (b) the impact of learner
characteristics on instructional and transfer outcomes. Baldwin and Ford’s model of
training transfer is introduced first as it was the primary conceptual model used in this
research and because it served as a means to organize the research analysis and to discuss
the study findings.
Conceptual Model of Transfer
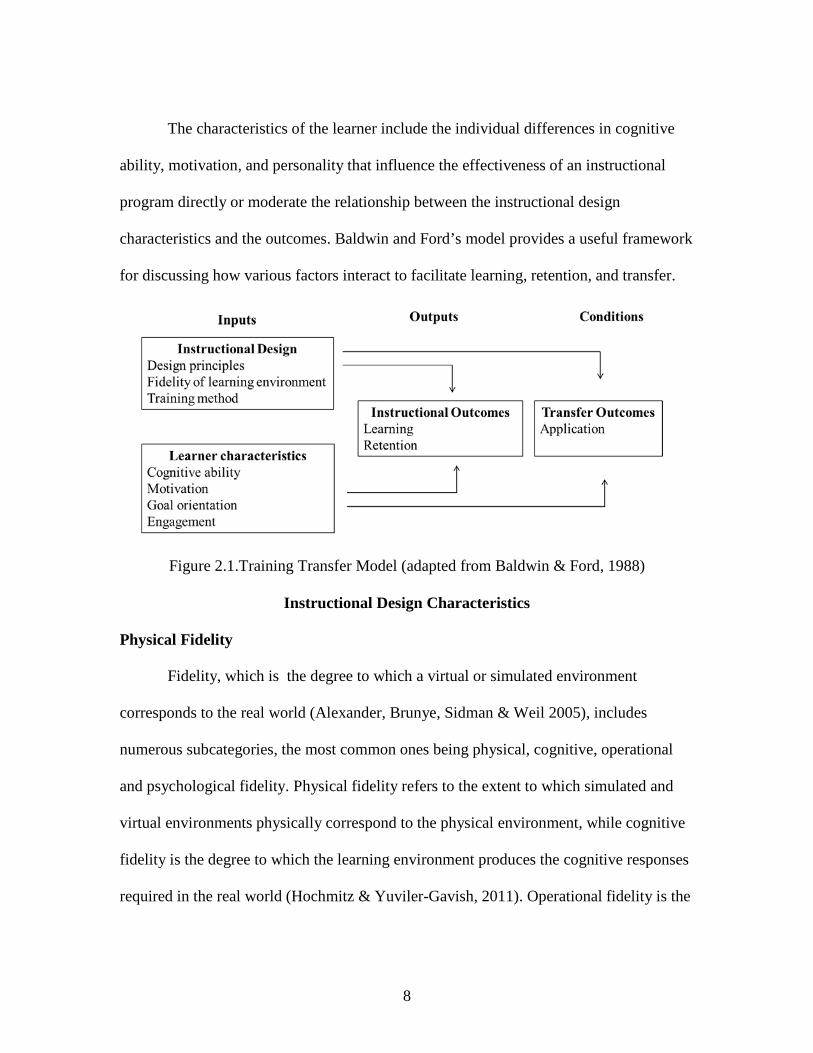
The most commonly cited model of transfer, the one developed by Baldwin and
Ford (1988), describes its goals in terms of the instructional and transfer outcomes as
seen in Figure 2.1. Its instructional outcomes include the learning and retention of
knowledge or a skill, while transfer outcomes include generalization, defined as the
application of a skill outside of the learning environment, and maintenance, which is the
continued use of a skill following instruction (Baldwin & Ford, 1988). Transfer is further
impacted by the external conditions requiring it. Both instructional and transfer
outcomes are a function of the two inputs of instructional design and learner
characteristics. Instructional design involves the learning principles, the instruction and
the delivery method that are selected and combined to create an instructional program.
8
The characteristics of the learner include the individual differences in cognitive
ability, motivation, and personality that influence the effectiveness of an instructional
program directly or moderate the relationship between the instructional design
characteristics and the outcomes. Baldwin and Ford’s model provides a useful framework
for discussing how various factors interact to facilitate learning, retention, and transfer.
Figure 2.1.Training Transfer Model (adapted from Baldwin & Ford, 1988)
Instructional Design Characteristics
Physical Fidelity
Fidelity, which is the degree to which a virtual or simulated environment
corresponds to the real world (Alexander, Brunye, Sidman & Weil 2005), includes
numerous subcategories, the most common ones being physical, cognitive, operational
and psychological fidelity. Physical fidelity refers to the extent to which simulated and
virtual environments physically correspond to the physical environment, while cognitive
fidelity is the degree to which the learning environment produces the cognitive responses
required in the real world (Hochmitz & Yuviler-Gavish, 2011). Operational fidelity is the

9
extent to which the simulated environment requires the execution of tasks necessary for
performance, and psychological fidelity is the extent to which learners perceive similar
meanings in the two environments (Baldwin & Ford, 1988). The relative importance of
these types of fidelity in any given situation depends on the nature of the task (Stone,
2001). For example, a high level of physical fidelity is of important for technical skills,
while psychological fidelity is more important for tasks that require decisions to made
under stress.
While previous research has established the efficacy of using both low and high
fidelity simulations for instruction, those studies were conducted primarily in such
industries as aviation, the military, and healthcare (specifically surgery) where learning in
a real-world environment is less viable due to cost, safety, and ethical concerns. As a
result, there is limited research comparing outcomes when learning in the physical
environment is substituted with learning in a simulated environment for skill-based
outcomes (Triona & Klahr, 2003). Further, the majority of the studies investigating
learning in 2D and 3D environments has focused on conceptual learning, with few
evaluating transfer and none evaluating retention outcomes (Campbell et al., 2002:
Finkelstein et al., 2005; Jaakkola, Nurmi, & Veermans, 2011), perhaps explaining why
engineering and technical education has been slow to employ online delivery for course
and laboratory instruction (Bourne, Harris, & Mayadas, 2005). Further research is need to
explore such questions as how and which skillsets can be effectively learned in simulated
environments and whether specialized pedagogies need to be developed to support an
online technical curriculum including simulated lab experiences (Bernard et al., 2004).

10
Lab-based instruction. Lab-based instruction is a key educational feature in the
science, engineering, and technical disciplines (Jaakkola & Nurmi, 2008) as it provides
the opportunity for students to test and apply the theories they have learned during
lectures (Auer, Pester, Ursutiu, & Samoila, 2003). During laboratory-based activities,
students engage in active learning, conduct experiments, and apply problem-solving skills
that facilitate the application of theory in practical situations (Auer et al., 2003; Feisel &
Rosa, 2005). This use of physical equipment and materials during instruction represents
the highest level of fidelity. In addition, physical laboratories also allow students to
experience the sensory characteristics of the equipment and experiments and gain
familiarity with the environment in which they will be used (Zacharia, 2007; Zacharia &
Olympiou, 2011).
Despite being widely used in science education, researchers have questioned the
effectiveness of laboratory instruction (Jaakkola & Nurmi, 2008). Working with physical
components and learning through physical manipulation can lead students to develop
inaccurate mental models, specifically for complex phenomena, because they can only
view processes on the surface without understanding the invisible ones in the system that
support theoretical understanding. This weakness in physical instruction represents one of
the most commonly acknowledged strengths of simulated instruction.
Simulation-based instruction. Simulated labs, which are being increasingly used
effectively in education (Finkelstein et al, 2005; Gillet et al., 2013), allow students to
conduct their lab activity online using a simulation, a computer-based representation of a
process, system or phenomenon that can be executed and then analyzed (Brey, 2008).

11
Although a simulation can be developed in a virtual environment, its purpose is to model
a process, not physically imitate the system it represents. As a result, simulations and
simulated labs can vary significantly in their level of physical fidelity. Such simulations
can include 2D, 3D, and virtual laboratories that provide instructional support to students
primarily in the science, engineering, medical, and technical fields. Past research has
found that these environments can foster attention and engagement in students more
readily than some of the more traditional methods (Stone, 2001; Adams, Reid, LeMaster,
McKagan, Perkins, Dubson, & Weiman, 2008), suggesting that when simulations
incorporate interactivity, animation, and a meaningful context, they can create a
“powerful learning environment” (Adams et al., 2008, pg. 418).
One of the primary advantages of simulations is that they can “make the invisible
visible” (for example showing the current flow of an electric circuit), helping students
learn complex relationships (Finkelstein et al., 2005; Jaakkola, Nurmi, & Veermans,
2011). Simulations also help students to learn in an ideal environment where they can
focus on exploring concepts without the complications associated with malfunctioning
laboratory equipment (Finkelstein et al., 2005), and they can also provide a safe, more
accessible environment in which learners can explore and practice at their own pace
(Jaakkola & Nurmi, 2008).
One criticism of simulated labs, however, is that they necessitate students learning
in an environment that is fundamentally different from the one in which they may
ultimately work (Jaakkola & Nurmi, 208). Furthermore, simulations lack the nuances
that exist in the real world and may also oversimplify a complex system. Their ideal

12
representation of a system, while potentially beneficial for learning, may create issues for
students when they encounter problems in the real-world environment that they never
experienced in the simulation. Additionally, Couture (2004) found that learners may
doubt that the principles demonstrated in a simulation are applicable to the real world.
The Effect of Fidelity on Learning Outcomes
Proponents of physical laboratories argue that the use of computer-based
interactive simulations limits students from experiencing the hands-on manipulation of
real materials, thus distorting reality (Scheckler, 2003). This physicality, which is “the
actual and active touch of concrete material,” is believed to be important for learning
(Zacharia & Olympiou, 2011, p. 318). Woodfield et al. (2005) also argued that
simulations lack the necessary detail and realism to effectively teach proper laboratory
technique. However, proponents of computer simulations suggest that it is the active
manipulation, rather than the physicality, that is the most important element of laboratory
instruction (Resnick, 1998). In addition, Triona and Klahr (2003) suggested that only for
perceptual-motor skills are physical practice necessary. For other skills, however,
physically manipulating components is not necessary for the information processing and
practice needed to acquire them.
Several studies have evaluated using simulated environments in laboratory
instruction as a supplement, a substitute, or in some combination with a physical
laboratory. For example, Martinez-Jimenez et al. (2003) found that educational software,
including virtual laboratories, was a beneficial supplemental tool for helping students
prepare for laboratory work, results supported by Dalgarno et al. (2009), who found

13
that a simulated chemistry laboratory could act as an effective tool for helping students
become familiar with the laboratory environment prior to attending class. The study
conducted by Finkelstein et al. (2005) using Physics Education Technology (PhET)
simulations, on the other hand, found that contextually appropriate simulations may be
more effective than real lab equipment in terms of educational outcomes. Their study
compared students who learned to build circuits using a computer simulation with those
who learned to build circuits using physical components, finding that the former on
average needed less time to build an electrical circuit than those who had learned in a
physical laboratory setting. In addition, they also demonstrated better competence when
writing about phenomena associated with electrical circuits.
Campbell et al. (2002) also compared learning outcomes associated with electric
circuits in a simulation versus a physical laboratory, finding that a combination of
simulation and physical experiences resulted in better performance on a written
evaluation than a physical laboratory alone but there were no significant differences in
task completion. Other research has also found that students who learned about electricity
concepts using a combination of simulation and physical laboratory experiences achieve
superior learning outcomes (declarative knowledge gains) compared to those students
learning solely in a physical environment or in a simulated environment (Campbell et al.,
2002; Zacharia, 2007; Jaakola, Nurmi, & Veermans, 2011).
Though not specifically discussing simulation in relation to physical laboratory
instruction, Clark argued that media does not influence learning outcomes as long as the
instructional method is controlled (1994); however, several studies comparing learning in
14
simulated and physical environments have not controlled the methods used. For example
in Finkelstein’s study, students learning about circuits using the PhET simulations were
able to learn about current flow as the simulations made the invisible visible but no
comparable alternative, such as a video animation, was mentioned as being provided for
students learning circuits in the physical condition. As a result, students using the former
may have learned more, contributing to the conceptual gains found in this study. The
research reported here focuses on the ability of the student to learn the hands-on and
technical aspects of the lab activity versus the conceptual benefits that can be provided by
2D and 3D simulations.
Prior research in workforce education has demonstrated that higher levels of
fidelity are not necessary, and sometimes even detrimental, to learning and transfer
(Alexander et al., 2005). In fact, Alexander et al. (2005) cautioned against the assumption
that increasing fidelity will lead to improved outcomes. According to Richards and
Taylor (2015), additional studies are needed to compare the educational benefits of 2D
versus 3D environments, research that is important because the differences in fidelity
between these two represent differences in software maintenance and development costs
as well as technological requirements for the system on which the simulation operates. If
comparable learning outcomes could be achieved using a 2D simulation, this option may
be a better alternative.
However, early research conducted by Regian et al. (1992) concluded that
instruction using 2D simulation might be less effective than 3D as translating the
representation from the former to the latter may result in additional cognitive load for
15
learners. In some cases 2D representations will be inherently deficient if the data it must
imitate are three-dimensional (Richards & Taylor, 2015). Sampaio et al. (2010) suggested
that for technical fields like engineering, the use of 3D representations may lead to better
learning outcomes than 2D representations. However, while 3D representations provide
more flexibility and realism, their increased complexity makes it harder for students to
interact with them and can degrade performance (Stuerzlinger & Wingrave, 2011).
Novices, in particular, may struggle to grasp all of the information being conveyed in
higher levels of fidelity (Gillet et al., 2013). Further, technical issues like poor resolution
and lag in the 3D environment can lead to performance deficiencies (Kenyon & Afenya,
1995). As this analysis suggests, additional research is needed to determine what aspects
of 2D and 3D representations of tasks are beneficial for learning as well as the contexts
and domains best suited for these types of technologies (Richards & Taylor, 2015).
The Impact of Physical Fidelity on Retention Outcomes
There is no extant literature that specifically investigates the effects of the
physical fidelity of the learning environment on retention outcomes. However, Ricci et al.
(1996) offers insights on the retention in computer-based environments, their study
finding that participants who studied a task using a computer game saw more significant
improvement between the pretest and the retention assessment than those who used
textbooks (Ricci, Salas, & Canon-Bowers, 1996). Of the six attributes the researchers
identified as potentially contributing to the effectiveness of games for retention, three –
immediate feedback, novelty, and dynamic interaction – could also apply to simulated
learning environments.

16
Farr (1986) and Arthur et al. (1998) also identified different factors and task
characteristics that influence retention or, conversely, decay, the loss of knowledge or a
skill following a period of nonuse (Arthur, Bennett, Stanush, & McNelly, 1998). The
most influential factors for decay are periods of nonuse and overlearning, with this
attribute having a positive relationship with degree of nonuse and a negative relationship
with degree of overlearning (O’Hara, 1990; Arthur et al., 1998). Decay can be evaluated
in terms of the amount and the rate of loss (Farr, 1986), with a typical decay curve
demonstrating rapid loss immediately after acquisition and a slowing as the retention
period increases until it reaches an asymptote near the pre-instruction level (O’Hara,
1990).
Other factors found to influence decay include the task characteristics and the
retention assessment (Arthur et al., 1998). Task characteristics include closed-loop vs
open-loop and cognitive vs physical tasks. Closed-loop tasks involve discrete responses
and, thus, have a defined beginning and end, while open-loop ones involve continuous
responses without a defined beginning or ending. Arthur et al. (1998) found that open-
loops tasks were more susceptible to decay, while Farr (1986) found the opposite, that
closed-loop tasks were more susceptible. Cognitive tasks require mental operations, and
physical tasks require mental exertion and coordination, meaning the latter exhibit less
decay than the former (Arthur et al., 1998). Procedural skills, which are particularly
susceptible to rapid and expansive loss, decay faster than psychomotor skills (O’Hara,
1990; Ginzburg & Dar-El, 2000). In terms of retention assessment, tasks involving

17
recognition are less susceptible to decay than tasks involving recall. In addition, tasks
evaluated behaviorally exhibited less decay than those evaluated cognitively.
The Impact of Physical Fidelity on Transfer
Ricci et al., (1996) suggested that the evaluations completed immediately
following instruction alone do not present a clear assessment of learning as measures that
include transfer. In addition to learning outcomes, this research seeks to explore how
learning in a simulation affects transfer, the ability of students to apply their learning in
the real-world. Some researchers support low physical fidelity, suggesting that it helps
reduce cognitive load by omitting potentially over-simulating details, meaning students
can concentrate solely on what needs to be learned (Zacharia & Olympiou, 2011; Pass &
Sweller, 2014). Proponents of high fidelity, however, suggest it supports transfer as the
correspondence between the 3D simulation and the real world facilitates recognition,
helping to activate the requisite schemas developed using the simulation (Zacharia &
Olympiou, 2011).
Few of these studies, however, have evaluated transfer outcomes. Finkelstein et
al. (2005) found that students who learned using simulations achieved better transfer
outcomes (lower construction times) while Campbell et al. (2002) did not find significant
differences in the construction time among those who learned in the physical
environment and those who learned in a combined setting (both simulated and physical
instruction). More important to the research reported here, both studies evaluated the
outcomes using teams rather than individual learners.

18
Several theories offer insight into how the physical fidelity of the learning
environment may impact transfer. Thorndike’s identical elements theory posits that there
will be a high positive transfer when identical stimulus and response elements are used in
the learning and transfer environments (Goldstein & Ford, 2002) because learners are
essentially practicing the task which they will have to execute (Yamnill & McLean,
2001). If the stimuli differ, which may be due to the fidelity, but the response is the
same, learners may be able to generalize what they have learned and apply it to the
transfer environment. This identical elements theory supports utilizing a high level of
physical fidelity but only for the tasks or its aspects that need to be transferred. This
conclusion is also supported by Farr (1986), who suggested that for relationships among
complex abstract phenomena, the physical fidelity of the system only needs to be
sufficient to encourage accurate mental representations of the relationships.
According to the general principles theory, transfer is facilitated when students
are taught the rules and theories underlying the skills they are learning (Baldwin & Ford,
1988). Simulations, depending on the design of the software, may provide an advantage
by helping students to develop a better conceptual understanding of the task under study
in addition to fostering more in-depth exploration of a phenomenon (Adams et al., 2008).
While the identical elements theory has been regarded as explaining near transfer, the
application of learning to similar problems, the general principles theory is more
applicable to far transfer, the ability to apply learning to new problems (Yamnill &
McLean, 2001).

19
Cognitive load theory (CLT) also provides relevant insight on how different
learning environments can impact transfer, positing that the acquisition of a skill is
constrained by an individual’s limited information processing resources. Environments or
instructional techniques that impose an additional cognitive burden on students, referred
to as extraneous cognitive load, are detrimental to learning (Paas & Sweller, 2014). While
the effects of this extraneous load may vary based on individual characteristics such as
cognitive ability or prior experience, there is currently not enough evidence to suggest
whether there is an inherent increase in load due to the physical fidelity of the learning
environment. Conversely, environments that increase the germane cognitive load, i. e.
those resources devoted to learning, can facilitate skill acquisition and transfer (van
Merriënboera, Schuurmanb, de Croock, & Paas, 2002).
Influence of Learner Characteristics on Instructional and Transfer Outcomes
Past research has found that learner characteristics, both dispositional attributes
such as cognitive ability and fluid characteristics like level of engagement, have been
found to impact the effectiveness of an instructional program and its instructional
objectives (Anderson, 1982; Noe, 1986; Snow, 1989). Specifically, learner characteristics
have been found to impact learning strategies, effort, and perseverance (De Raad &
Schouwenburg, 1996), with more recent research finding that these individual
characteristics include cognitive abilities, personality traits, and prior knowledge (Shute
& Towle, 2003).
The relationship between the learning environment and learner characteristics on
outcomes is referred to as aptitude-treatment interaction (ATIs). Aptitude is a construct

20
explaining the learner’s cognitive ability, prior knowledge and personality traits, and
treatment describes the condition or environment that fosters learning (Cronbach &
Snow, 1977). With the increasing use of technology in education, there is a renewed
interest in ATIs as researchers seek to understand which learner characteristics are most
important for designing adaptive learning systems (Shute & Towle, 2003). Currently, the
research investigating the interaction of learner characteristics and physical fidelity (e.g.,
2D simulation, 3D simulation, or physical labs) on learning, transfer, and retention
outcomes is limited. To address this limitation, this study focused on two learner
characteristics – cognitive ability and goal orientation. Goal orientation was selected as
the personality trait explored here because it has demonstrated positive effects on
learning and performance (Kozlowski, Gully, Brown, Salas, Smith & Nason, 2001);
similarly, cognitive ability has consistently been found to have a major influence on
learning outcomes (Clarke & Voogel, 1985; Kozlowski et al., 2001).
Cognitive Ability
Cognitive ability is an individual’s capacity to perform higher-order mental
processes such as critical thinking, problem-solving, and self-monitoring (Clark &
Voogel, 1985). Individuals with higher cognitive ability learn and retain more
information and are also better able to generalize and apply their knowledge in the real
world (Busato, Prins, Elshout, & Hamaker, 2000; Clark & Voogel, 1985). Some research
suggests that learners with lower cognitive ability experience more decay for abstract,
theoretical concepts than higher ability learners (Farr, 1986), findings suggesting that the
latter students should achieve better learning, retention, and transfer outcomes.

21
In addition, prior research has also suggested that individuals with lower
cognitive abilities may need a more structured learning environment while individuals
with a higher cognitive ability can perform as well in an less structured one (Snow,
1989). Thus, physical, classroom based-instruction may be more beneficial for learners
with lower cognitive ability than the less structured and more autonomous nature of a 2D
or 3D simulated environment, particularly when they are used in an online setting.
Furthermore, the cognitive load theory suggests that the extraneous cognitive load created
by instructional design elements may be detrimental to learning, especially for lower
cognitive ability learners who may already have reduced information processing
capabilities (Clark & Voogel, 1985; Paas & Sweller, 2014). For example, the increased
complexity of the 3D environment may negatively influence an individuals’ ability to
learn a task an well as negatively impacting transfer as it increases their extraneous
cognitive load as well.
Goal Orientation
Goal orientation is used to explain how an individual approaches an achievement
task (Elliot & Dweck, 1988). A relatively stable dispositional trait that can be influenced
by situational variables, it is commonly conceptualized as performance goal orientation
(PGO) and learning or mastery goal orientation (LGO) (Button et al., 1996), with PGO
being further subdivided into performance-approach and performance-avoid (Brett &
VandeWalle, 1999). The goal orientation of individuals learning a new task or working in
an unfamiliar environment influences both their willingness to work through challenges
and their performance expectations (Elliott & Dweck, 1988). An orientation towards
22
performance goals can impede the learning of more involved task relationships as these
students focus on a narrow set of concepts. As a result, they may perform well initially or
during instruction but are unable to generalize or apply the skills in other contexts
(Kozlowski et al., 2001). An orientation towards learning goals leads learners to acquire
the knowledge and skills required for competency. In addition, it also fosters a desire to
explore relationships in greater depth, thus alleviating the fear of making mistakes while
building task-specific self-efficacy (Kozlowski et al., 2001). Evaluating how goal
orientation affects the ability to learn can provide insights on what type of learning
environment, physical, 2D, or 3D, will lead to the best learning outcomes.
Goal orientation has also been linked to skill transfer. According to Stevens and
Gist (1997), mastery-oriented learners demonstrated greater skill maintenance in transfer,
while more recently Kozlowski et al. (2001) found that although LGO had a stronger
correlation in performance (r = 0.14 versus r = 0.098), both orientations had a similar
correlation (r= 0.243 versus r= 0.253) for performance generalization. As this body of
research suggests, individuals with stronger LGOs typically attain better outcomes.
Addressing the Gaps in the Literature Through the Research Aims
As this analysis of the literature suggests, there is a need for additional research
identifying how simulated environments of varying levels of physical fidelity influence
instructional outcomes; what roles, if any, physicality plays; how learner characteristics
influence these relationships; and what happens as learners transition from working in a
simulated environment to a physical environment. The research reported here can offer
substantive contributions in those areas by addressing its aims of 1) identifying how the

23
physical fidelity of the learning environment impacts instructional (learning and
retention) and transfer outcomes, 2) identifying any moderating effects of learner
characteristics and 3) identifying how the physical fidelity of the learning environment
and the transition from the simulated environment to the physical environment contribute
to differences in the learning outcomes achieved by participants. Based on the literature
review and the aims of this research, the model seen below in Figure 2.2 was
operationalized and applied to the studies reported here.
Figure 2.2 Operationalization of Training Transfer model employed for this research (Adapted from Baldwin & Ford, 1988)
Chapter Summary
This literature review, organized using the model of transfer developed by
Baldwin and Ford (1988), first covered the extant literature on the impact of physical
fidelity on instructional and transfer outcomes. The efficacy of 2D and 3D simulated

24
environments were explored along with several theories of transfer. Next, the chapter
examined several important learner characteristics, cognitive ability and goal orientation,
that may impact these outcomes and moderate the relationship between physical fidelity
and the outcomes. Finally, this review discussed how the three research aims address the
gaps in the literature, providing the operationalized model that served as the framework
for the research studies presented here.

25
CHAPTER THREE
DISSERTATION STUDY ONE
Purpose
The purpose of this first study was to address aim one by exploring how
individual performance of a task differed depending on the physical fidelity (referred to
here simply as fidelity) of the instructional environment and how this relationship was
influenced by cognitive ability and goal orientation. Specifically, this study investigated
how learning to construct an electrical circuit using a 2D breadboard simulation, a 3D
breadboard, or a physical breadboard impacted instructional objectives. These objectives
were assessed using affective, cognitive and skill-based outcomes.
Although previous research has identified value in using simulations as a
supplement or in combination with laboratory education, little research has specifically
investigated the differences in outcomes between 2D and 3D simulations or the influence
of learner characteristics (Kim et al., 2013; Richards & Taylor, 2015). The study
reported here aimed to explore the role of the fidelity of the learning environment by
comparing learning outcomes associated with learning in a 2D, 3D, and a physical
environment. This research also aimed to investigate the impact of goal orientation and
cognitive ability on learning outcomes for participants learning in those three
environments. The work of this chapter was submitted to the International Journal of
Industrial Ergonomics.

26
Methods
Participants
Participants for this study included 48 undergraduate and graduate students from a
public mid-sized Southeastern University, recruited using word of mouth, flyers, and
email blasts. To be eligible, participants could not have been currently enrolled in or have
taken a circuits-based class during the previous academic year. Additionally, each
participant must have been able to self-report an ACT or SAT score. Of the participants,
engineering students represented approximately 33%, while undergraduates accounted
for 50% and females comprised 62.5% of the participants. Approximately 79% of the
participants reported that they were in the 18-27 year-old category, while the remaining
21% were 28 years old or older. The majority of the participants (92%) reported having
little to no prior experience working with circuits. Although 33% of the participants were
engineering majors, depending on their specific major and year, they may not have taken
a circuits or physics course. This study was approved by Clemson University IRB (#
IRB2015-001).
Experimental design
This study utilized a pretest-posttest between subjects design. The fidelity of the
learning environment (with three levels, physical, 2D simulation, and 3D) was the
between subjects variable. While the primary independent variable (IV) of interest was
the fidelity, the covariates included pretest scores, cognitive ability, and goal orientation.
The pretest scores were used to control for individual differences in baseline knowledge
and any exposure to electrical circuits that was not restricted by the study design. In order

27
to facilitate a holistic evaluation of learning, the dependent measures included affective
outcomes, cognitive outcomes, and skill-based outcomes (Kraiger et. al, 1993). The
affective measure was self-efficacy (measure using a Likert scale), which is the
participant’s belief in his/her ability to perform a task (Guthrie & Schwoerer, 1994). The
cognitive outcomes were gain scores (posttest score – pretest score) and circuit design
(measured as a grade). Gain scores indicate the improvement from the pretest score to the
posttest score, and the skill-based outcomes were construction time (minutes) and circuit
construction (grade).
Participants’ SAT scores were used as a proxy for cognitive abilities. Those who
did not take the SAT were allowed to use their composite ACT score. Past research has
demonstrated that both the SAT (r = 0.82) and the ACT (r=0.77) have a strong correlation
with cognitive ability (Noftle & Robins, 2007; Koenig, Frey, & Detterman, 2008). A
strong correlation (r=0.87) has also been demonstrated between composite ACT and total
SAT scores (Dorans, 1999). For consistency, ACT composite scores were converted to
total SAT scores for the analysis using the conversion chart developed by Dorans (1999).
This conversion was used for only six participants. Both learning and performance goal
orientations were assessed using an eight- question instrument developed by Button et al.
(1996). The reliability of these questionnaires, indexed by Cronbach’s alpha, was 0.72 for
PGO and 0.78 for LGO. Self-efficacy was measured using a six-question instrument with
a reliability of α = .82 (Guthrie & Schwoerer, 1994). All questions used five-point Likert
scales anchored by strongly disagree and strongly agree.
28
Procedures
After completing the consent form, participants completed a 5-question multiple
choice, paper-based pretest examining their knowledge of basic electrical concepts
(Appendix A). The pretest included questions on defining electrical concepts (e.g.,
voltage, resistance, and current), identifying circuit diagram symbols (e.g., switches,
resistors, battery, and LEDs), designing a circuit diagram, demonstrating an
understanding of breadboard functionality, and applying Ohm’s law. Each question had
four answer options. Next, they completed a demographic survey, where they reported
their SAT/ACT score, and the goal orientation instruments (Appendices B and C).
Students subsequently watched a 28-minute video lecture on circuit analysis and basic
circuit construction. This video included three sections, each with individual learning
objectives and practice exercises.
Following this instruction, students watched two videos demonstrating how to
construct a circuit. The construction video participants watched depended on the
condition to which they were randomly assigned. That is, participants in the physical
condition watched a video of a researcher using the physical components, and similar
demonstrations were used for the 2D and 3D conditions involving their respective
technology. Participants in the physical condition practiced constructing circuits using an
800-point solderless breadboard (Figure 3.1), while participants in the 2D condition
practiced using a 2D breadboard simulation (123D Circuits Arduino 2D Breadboard)
(Figure 3.2) and participants in the 3D condition practiced using a 3D breadboard
(National Instrument Multisim Educational Edition Version 13) (Figure 3.3).

29
During these videos, participants were shown how to use Ohm’s law to calculate
the resistor values needed for their circuit, how to design their circuit diagram and how to
construct their circuit. Because students in the 2D and 3D conditions also had to learn to
use the software, the instructional videos for each of the conditions varied in length. In
total, they ranged from 7 to 17 minutes. The study set-up included a computer
workstation with two monitors so that participants could watch the video on one screen
while constructing their practice circuits on the second. Participants navigated the 2D
simulation and 3D environments using a mouse and keyboard. Students in all conditions
used comparable circuit components – LEDs, switch, resistors, and batteries - and had
access to the instructional videos during their practice sessions.
Participants were given three practice activities to complete. One of these practice
activities instructed participants to complete a series circuit using a three-prong switch,
while the second had participants construct a parallel circuit and the last activity
demonstrated how to construct a parallel circuit with the switch at one connection.
During these practice sessions, they were provided with feedback concerning the
accuracy of their calculations and the construction of the circuit and were referred to the
appropriate video for review for any errors they made. The participants were not allowed
to continue the experiment until they had successfully completed the practice activities.
Although this requirement led to varying practice times, it was essential that participants
demonstrated a minimum level of proficiency before continuing.
Following these practice sessions, the participants completed a post-survey
assessing their self-efficacy and a 5-question multiple choice, paper-based posttest

30
(Appendices D and E). The posttest was of the same structure and length, and used the
same types of questions as the pretest. Finally, the participants from all conditions
constructed a simple circuit including a switch and 3 LEDs on a physical breadboard
without access to the video lectures (Appendix F). Students had to first design the circuit
and use Ohm’s law to determine the correct amount of resistance needed based on the
voltage source they selected (a 9 volt battery or a 1.5 volt AA battery) The circuit needed
to be constructed such that the two LEDs were connected in series and powered by a
switch and the third LED was connected in parallel. While completing this construction
task, they were video recorded using a GoPro Hero4 Black camera positioned above them
to record an aerial view of their work surface without being intrusive.
Figure 3.1. A screen shot of the Arduino 2D Breadboard (123d.circuits.io)
Figure 3.2. A screen shot of the NI Multisim Breadboard (http://www.ni.com/multisim/)

31
Figure 3.3. 800 Point Solderless Breadboard
Results
Analysis
The data were analyzed using SPSS 22, and ANOVAs were used to analyze the
effects of the predictor variables on self-efficacy, gain scores, and construction time. In
addition, an ordered logistic regression was used to analyze the effects of the predictor
variables on circuit design grade and circuit construction grade. The circuit design and
circuit construction were graded for accuracy on a three-level scale, no errors (correct),
minor errors, and major errors. All of the models were evaluated at the alpha = .05 level.
Prior to analysis, the data were evaluated to ensure they met the assumptions –
independence, normality, and homogeneity of variance – needed for an ANOVA as well
as the assumptions, including proportional odds, of an ordered logistic regression. These
assumptions were met, and, therefore, the analysis methods were deemed appropriate.
While this study involved 48 total participants, the data for one participant, who was in
the physical condition, were removed because he failed to report his SAT or ACT score
as required by the study. Furthermore, three additional participants withdrew from the
study, resulting in a different sample size for the circuit design and the construction

32
activities. The total number of participants in each condition for all dependent measures
was 15 in the physical condition, 16 in the 2D condition, and 13 in the 3D condition.
Results
Participants were given a pretest to assess their knowledge of circuit theory and
construction. A one-way ANOVA found no significant differences, F(2,44) =.123, p =
.884, in the pretest scores of participants in the three conditions, suggesting no detectable
differences in their pre-existing knowledge.
The first research question focused on the impact of the fidelity of the learning
environment on affective, learning, and skill-based learning outcomes. The first
dependent variable assessed was self-efficacy, an affective outcome. The predictor
variables included in this model were fidelity, LGO, and PGO. Four participants did not
complete the self-efficacy survey, resulting in a total of 43 observations analyzed. Based
on the ANOVA results, fidelity (F(2,39)=3.809 (p=.031)), was a significant predictor
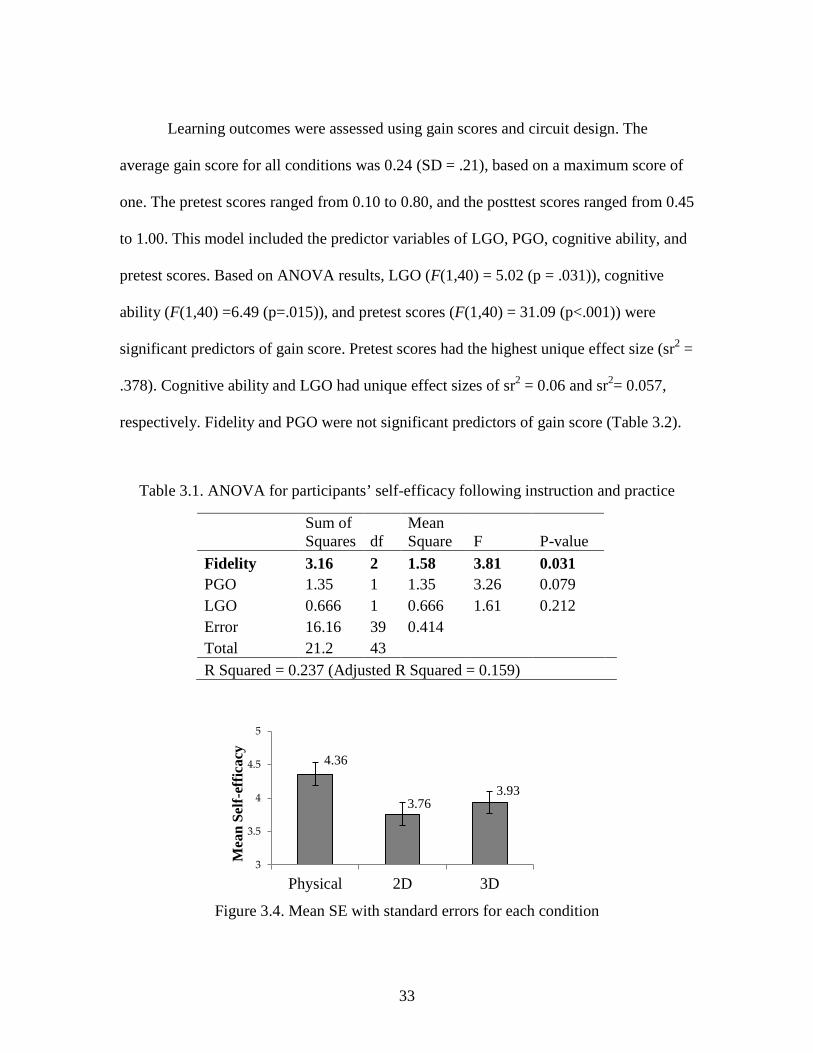
(Table 3.1). The mean self-efficacy was 4.36 (SD= .58) for participants in the physical
condition, 3.76 (SD=.67) for participants in the 2D condition, and 3.93 (SD=.75) for
participants in the 3D condition (Figure 3.4). Subsequent post hoc analysis completed
using the least significant differences (LSD) test revealed significant differences in self-
efficacy between participants in the physical condition and participants in the 2D
condition, (p=.014), and between participants in the physical condition and the 3D
condition, (p=.038). LGO and PGO were not significant predictors of self-efficacy.
Fidelity had a unique effect size of sr2 = .378.
33
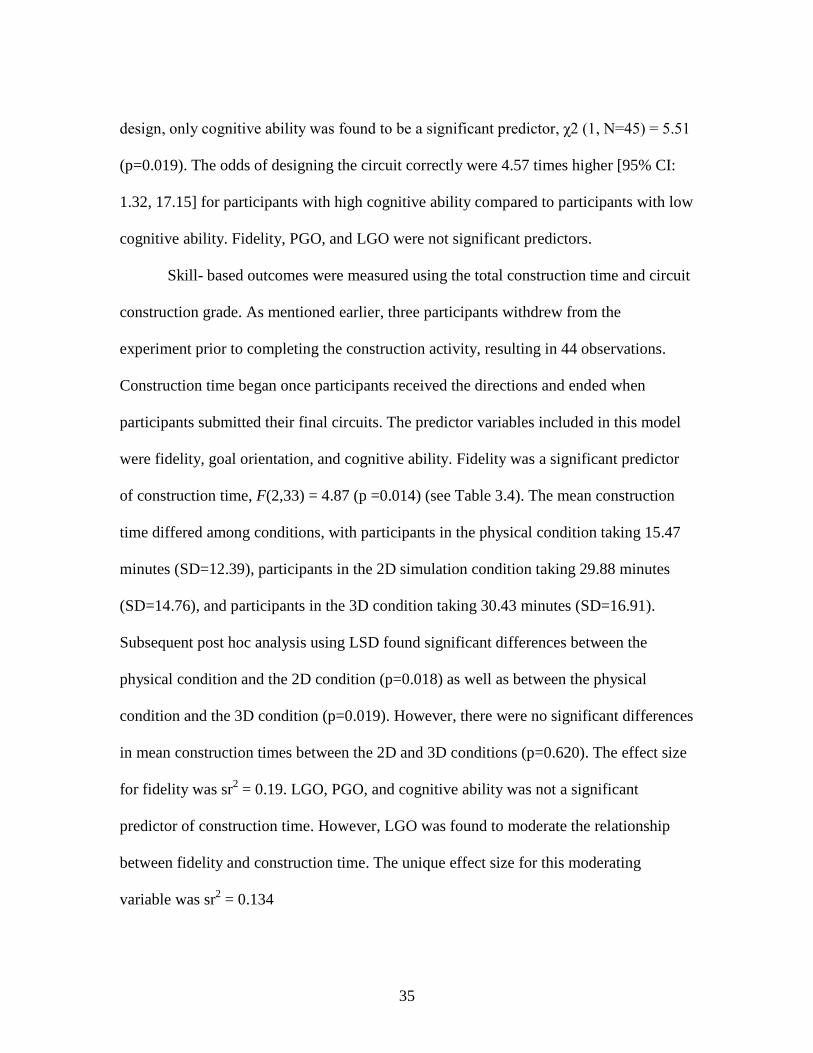
Learning outcomes were assessed using gain scores and circuit design. The
average gain score for all conditions was 0.24 (SD = .21), based on a maximum score of
one. The pretest scores ranged from 0.10 to 0.80, and the posttest scores ranged from 0.45
to 1.00. This model included the predictor variables of LGO, PGO, cognitive ability, and
pretest scores. Based on ANOVA results, LGO (F(1,40) = 5.02 (p = .031)), cognitive
ability (F(1,40) =6.49 (p=.015)), and pretest scores (F(1,40) = 31.09 (p<.001)) were
significant predictors of gain score. Pretest scores had the highest unique effect size (sr2 =
.378). Cognitive ability and LGO had unique effect sizes of sr2 = 0.06 and sr2= 0.057,
respectively. Fidelity and PGO were not significant predictors of gain score (Table 3.2).
Table 3.1. ANOVA for participants’ self-efficacy following instruction and practice
Sum of Squares df
Mean Square F P-value
Fidelity 3.16 2 1.58 3.81 0.031 PGO 1.35 1 1.35 3.26 0.079 LGO 0.666 1 0.666 1.61 0.212 Error 16.16 39 0.414 Total 21.2 43 R Squared = 0.237 (Adjusted R Squared = 0.159)
Figure 3.4. Mean SE with standard errors for each condition
4.36
3.76 3.93
3
3.5
4
4.5
5
Physical 2D 3D
Mea
n Se
lf-ef
ficac
y

34
Table 3.2. ANOVA for participants’ gain score from the pretest to the posttest
Sum of Squares df Mean Square F P-valueFidelity 0.07 2 0.034 1.52 0.232 LGO 0.11 1 0.113 4.86 0.031 PGO 0.00 1 0.005 0.23 0.886 Cognitive ability 0.15 1 0.118 5.10 0.015 Pretest score 0.70 1 0.741 32.0 <0.001 Error 0.90 40 0.023 Total 1.98 46 R Squared = 0.544 (Adjusted R Squared = 0.476)
Circuit design was graded on a scale ranging from major errors to no errors (Table
3.3). Major errors included such mistakes as designing a series circuit instead of a parallel
circuit, while minor errors included using incorrect symbols. As one participant
completed the diagram prior to withdrawing from the study, there were a total of 45
observations for this model. The majority of participants (51%) were able to correctly
design the circuit (Table 3.3). An ordered logistic regression was used to analyze the
effects of fidelity, cognitive ability, LGO and PGO on circuit design grades (no errors,
minor errors, and major errors). The test of parallel lines for the ordered logistic model
was found to be insignificant, suggesting the proportional odds assumption was met
(p=0.161).
Table 3.3. Frequency of errors in participants’ circuit design task Condition No errors Minor Errors Major Errors Total Physical 9 5 1 152D 7 6 3 163D 7 5 2 14Total 23 16 6 45
To make the interpretation of the results more meaningful, the continuous
variables were dichotomized into high and low values based on a median split. For circuit
35
design, only cognitive ability was found to be a significant predictor, χ2 (1, N=45) = 5.51
(p=0.019). The odds of designing the circuit correctly were 4.57 times higher [95% CI:
1.32, 17.15] for participants with high cognitive ability compared to participants with low
cognitive ability. Fidelity, PGO, and LGO were not significant predictors.
Skill- based outcomes were measured using the total construction time and circuit
construction grade. As mentioned earlier, three participants withdrew from the
experiment prior to completing the construction activity, resulting in 44 observations.
Construction time began once participants received the directions and ended when
participants submitted their final circuits. The predictor variables included in this model
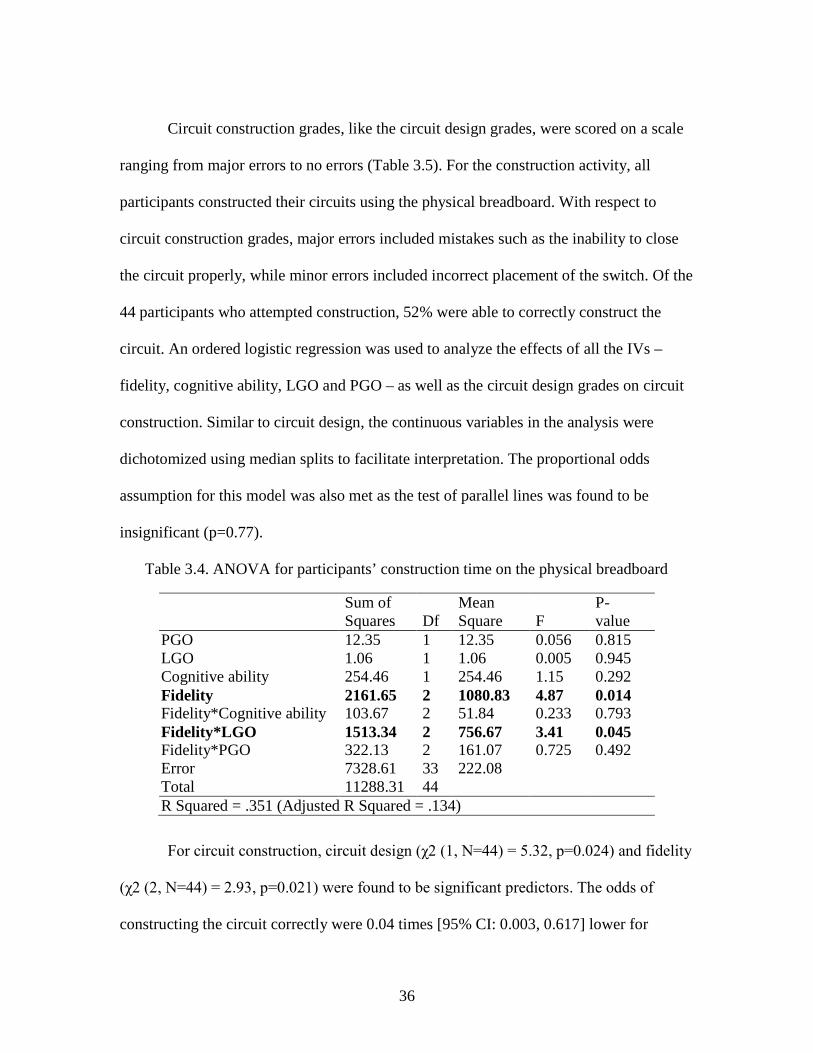
were fidelity, goal orientation, and cognitive ability. Fidelity was a significant predictor
of construction time, F(2,33) = 4.87 (p =0.014) (see Table 3.4). The mean construction
time differed among conditions, with participants in the physical condition taking 15.47
minutes (SD=12.39), participants in the 2D simulation condition taking 29.88 minutes
(SD=14.76), and participants in the 3D condition taking 30.43 minutes (SD=16.91).
Subsequent post hoc analysis using LSD found significant differences between the
physical condition and the 2D condition (p=0.018) as well as between the physical
condition and the 3D condition (p=0.019). However, there were no significant differences
in mean construction times between the 2D and 3D conditions (p=0.620). The effect size
for fidelity was sr2 = 0.19. LGO, PGO, and cognitive ability was not a significant
predictor of construction time. However, LGO was found to moderate the relationship
between fidelity and construction time. The unique effect size for this moderating
variable was sr2 = 0.134
36
Circuit construction grades, like the circuit design grades, were scored on a scale
ranging from major errors to no errors (Table 3.5). For the construction activity, all
participants constructed their circuits using the physical breadboard. With respect to
circuit construction grades, major errors included mistakes such as the inability to close
the circuit properly, while minor errors included incorrect placement of the switch. Of the
44 participants who attempted construction, 52% were able to correctly construct the
circuit. An ordered logistic regression was used to analyze the effects of all the IVs –
fidelity, cognitive ability, LGO and PGO – as well as the circuit design grades on circuit
construction. Similar to circuit design, the continuous variables in the analysis were
dichotomized using median splits to facilitate interpretation. The proportional odds
assumption for this model was also met as the test of parallel lines was found to be
insignificant (p=0.77).
Table 3.4. ANOVA for participants’ construction time on the physical breadboard
For circuit construction, circuit design (χ2 (1, N=44) = 5.32, p=0.024) and fidelity
(χ2 (2, N=44) = 2.93, p=0.021) were found to be significant predictors. The odds of
constructing the circuit correctly were 0.04 times [95% CI: 0.003, 0.617] lower for
Sum of Squares Df
Mean Square F
P- value
PGO 12.35 1 12.35 0.056 0.815 LGO 1.06 1 1.06 0.005 0.945 Cognitive ability 254.46 1 254.46 1.15 0.292 Fidelity 2161.65 2 1080.83 4.87 0.014 Fidelity*Cognitive ability 103.67 2 51.84 0.233 0.793 Fidelity*LGO 1513.34 2 756.67 3.41 0.045 Fidelity*PGO 322.13 2 161.07 0.725 0.492 Error 7328.61 33 222.08 Total 11288.31 44 R Squared = .351 (Adjusted R Squared = .134)
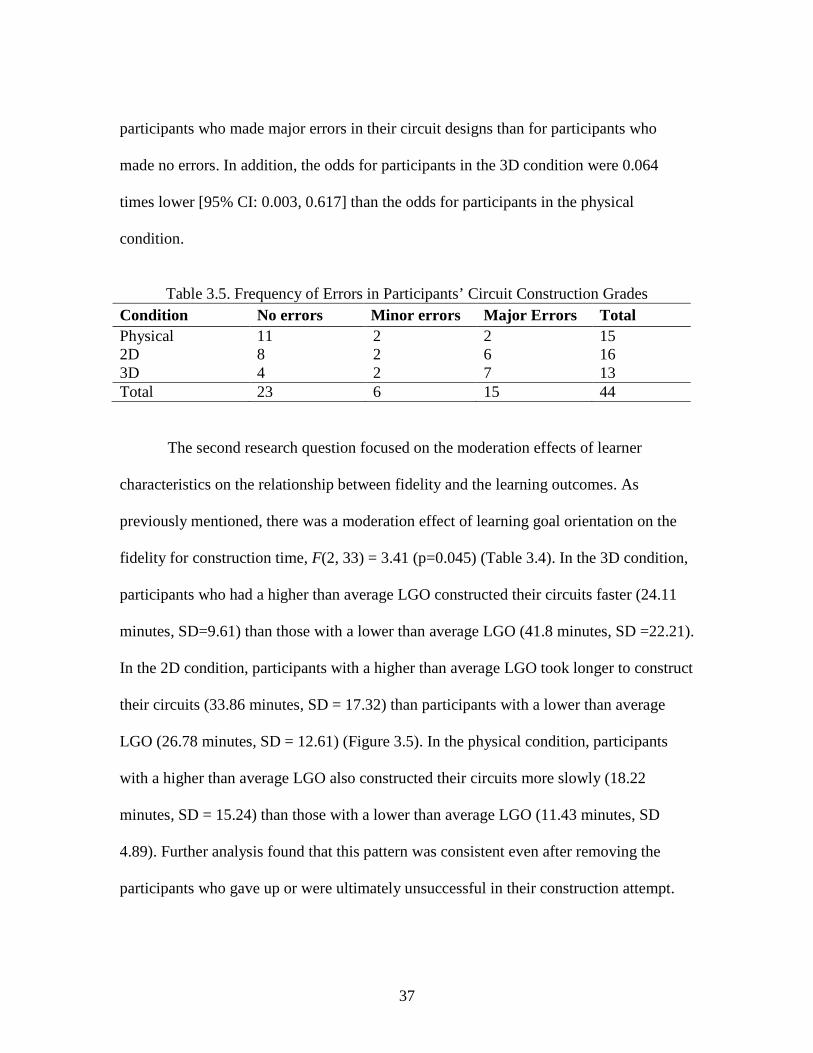
37
participants who made major errors in their circuit designs than for participants who
made no errors. In addition, the odds for participants in the 3D condition were 0.064
times lower [95% CI: 0.003, 0.617] than the odds for participants in the physical
condition.
Table 3.5. Frequency of Errors in Participants’ Circuit Construction Grades Condition No errors Minor errors Major Errors Total Physical 11 2 2 15 2D 8 2 6 16 3D 4 2 7 13 Total 23 6 15 44
The second research question focused on the moderation effects of learner
characteristics on the relationship between fidelity and the learning outcomes. As
previously mentioned, there was a moderation effect of learning goal orientation on the
fidelity for construction time, F(2, 33) = 3.41 (p=0.045) (Table 3.4). In the 3D condition,
participants who had a higher than average LGO constructed their circuits faster (24.11
minutes, SD=9.61) than those with a lower than average LGO (41.8 minutes, SD =22.21).
In the 2D condition, participants with a higher than average LGO took longer to construct
their circuits (33.86 minutes, SD = 17.32) than participants with a lower than average
LGO (26.78 minutes, SD = 12.61) (Figure 3.5). In the physical condition, participants
with a higher than average LGO also constructed their circuits more slowly (18.22
minutes, SD = 15.24) than those with a lower than average LGO (11.43 minutes, SD
4.89). Further analysis found that this pattern was consistent even after removing the
participants who gave up or were ultimately unsuccessful in their construction attempt.

38
Figure 3.5. Interaction between LGO and Physical Fidelity on Construction Time
Discussion
The aim of this study was to investigate how learning in different levels of fidelity
influenced affective, cognitive, and skill-based learning outcomes. This breakdown of
learning outcomes is distinct from the existing literature evaluating the impact of
simulated learning environment in that the results of these previous studies have focused
predominantly on cognitive outcomes using gain or posttest scores (Zacharia, 2007;
Jaakola & Nurmi, 2008; Jaakola, Nurmi, & Veermans, 2011). The results of this study
demonstrated that the fidelity of the learning environment did impact the affective and
skill-based learning outcomes but not the cognitive outcomes (i.e., gain scores and circuit
design grades). Participants in the physical condition had higher self-efficacy, constructed
the circuit faster and had higher odds of successful construction than participants in both
the 2D and 3D conditions. However, fidelity was not a significant predictor of cognitive
outcomes – gain score and circuit design. With, the exception of self-efficacy, which has
not been previously studied, these findings were consistent with previous research.
0
10
20
30
40
50
60
Low LGO High LGO
Con
stru
ctio
n T
ime
(min
utes
)
Physical2D3D

39
There is no literature that specifically evaluates the impact of fidelity on self-
efficacy; however, previous research has suggested that self-efficacy may be influenced
by instructional interventions (Zimmerman, 2000). Fidelity exhibited a sizable unique
effect size on participants’ self-efficacy. Participants in the physical condition had a
higher self-efficacy than the participants in both the 2D and 3D conditions. While
individuals in the physical condition had the advantage of fidelity for the circuit
construction task as it was completed on a physical breadboard, the participants did not
know this beforehand. Because participants recognized that constructing a circuit is a
hands-on task, it is possible that those in the 2D and 3D conditions realized that what
they learned would inherently be different from how the task would be performed in the
real world and, as a result, had a lower self-efficacy. This lower self-efficacy potentially
impacted participants’ effort and persistence on the circuit design and construction task
(Zimmerman, 2000). Additionally, participants with lower self-efficacy are more
susceptible to adverse emotional reactions if they encounter challenges (Zimmerman,
2000).
Fidelity was also a significant predictor of construction time and circuit
construction. Participants in the physical condition were able to construct the circuit
twice as fast as participants in either the 2D or 3D condition and were more likely to
construct the circuit correctly. While many studies have investigated conceptual gains
associated with learning in 2D and 3D environments, few have looked at skill-based
outcomes. Campbell et al., (2002) found no significant differences in the ability of
students to complete the laboratory assignment between participants learning under

40
different levels of fidelity. Finkelstein et al., (2005) found that participants who had
learned to construct circuits in a 2D simulation were able to complete their laboratory
assignment faster than those who learned using physical components. One major
difference between the present study and the two prior studies is that participants in those
studies worked in teams whereas participants in this study worked individually.
Additionally, participants in the prior studies had to complete a full laboratory
assignment, including a construction task and report, whereas participants in this study
just completed a circuit construction task as a measure of skill-based outcomes.
The identical elements theory may explain this difference in construction time
between participants in the three conditions as it posits that there will be a higher positive
transfer when the instruction environment is identical to the performance environment
(Goldstein & Ford, 2002). Participants who practiced in the physical condition had the
benefit of a higher level of fidelity, a situation which likely contributed to their ability to
construct the circuit much faster than participants in the other two conditions. Participants
in the 2D and 3D conditions likely needed additional time to acclimate to working with
physical components. Additionally, some tasks that participants had to perform in the
physical environment were not required in the 2D and 3D environments. For example, in
the simulated environments, participants did not have to read resistors bands to identify
the resister’s resistance but were able to input the resistance values needed for a specific
resistor. Although students were shown how to read resistors during the video lecture,
those in the 2D and 3D environments did not receive additional practice with that aspect
of the task. As a result, some participants transitioning from the simulated environments
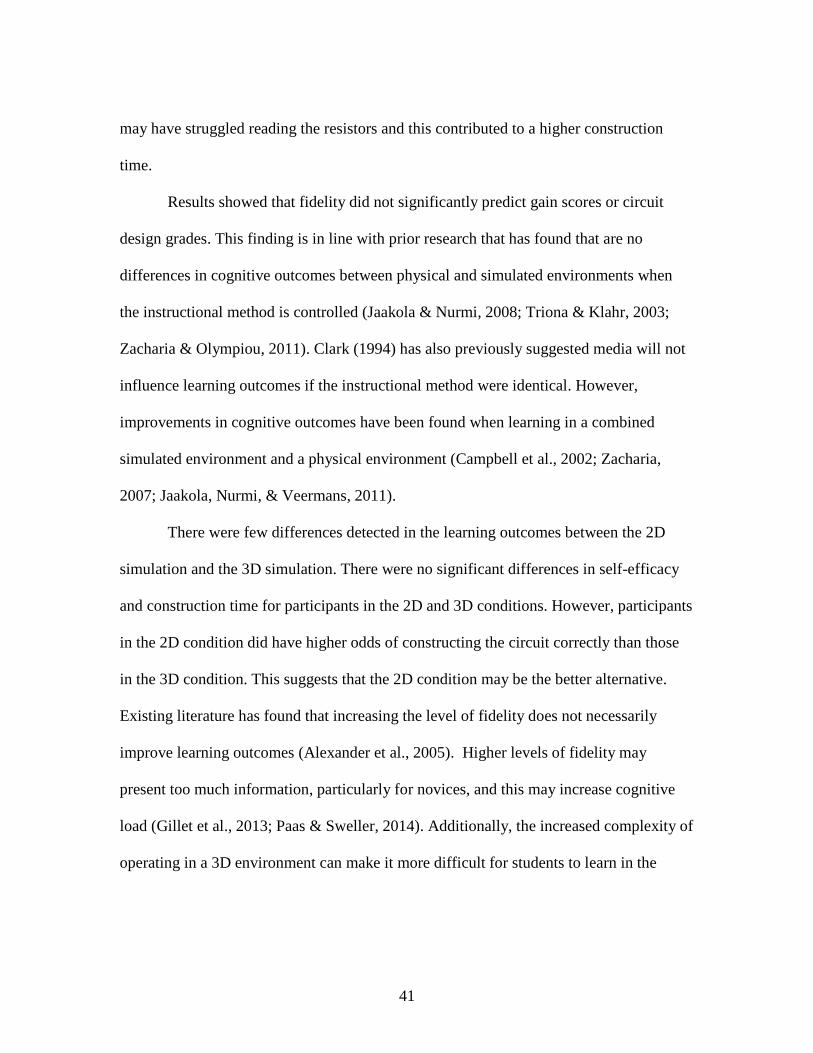
41
may have struggled reading the resistors and this contributed to a higher construction
time.
Results showed that fidelity did not significantly predict gain scores or circuit
design grades. This finding is in line with prior research that has found that are no
differences in cognitive outcomes between physical and simulated environments when
the instructional method is controlled (Jaakola & Nurmi, 2008; Triona & Klahr, 2003;
Zacharia & Olympiou, 2011). Clark (1994) has also previously suggested media will not
influence learning outcomes if the instructional method were identical. However,
improvements in cognitive outcomes have been found when learning in a combined
simulated environment and a physical environment (Campbell et al., 2002; Zacharia,
2007; Jaakola, Nurmi, & Veermans, 2011).
There were few differences detected in the learning outcomes between the 2D
simulation and the 3D simulation. There were no significant differences in self-efficacy
and construction time for participants in the 2D and 3D conditions. However, participants
in the 2D condition did have higher odds of constructing the circuit correctly than those
in the 3D condition. This suggests that the 2D condition may be the better alternative.
Existing literature has found that increasing the level of fidelity does not necessarily
improve learning outcomes (Alexander et al., 2005). Higher levels of fidelity may
present too much information, particularly for novices, and this may increase cognitive
load (Gillet et al., 2013; Paas & Sweller, 2014). Additionally, the increased complexity of
operating in a 3D environment can make it more difficult for students to learn in the
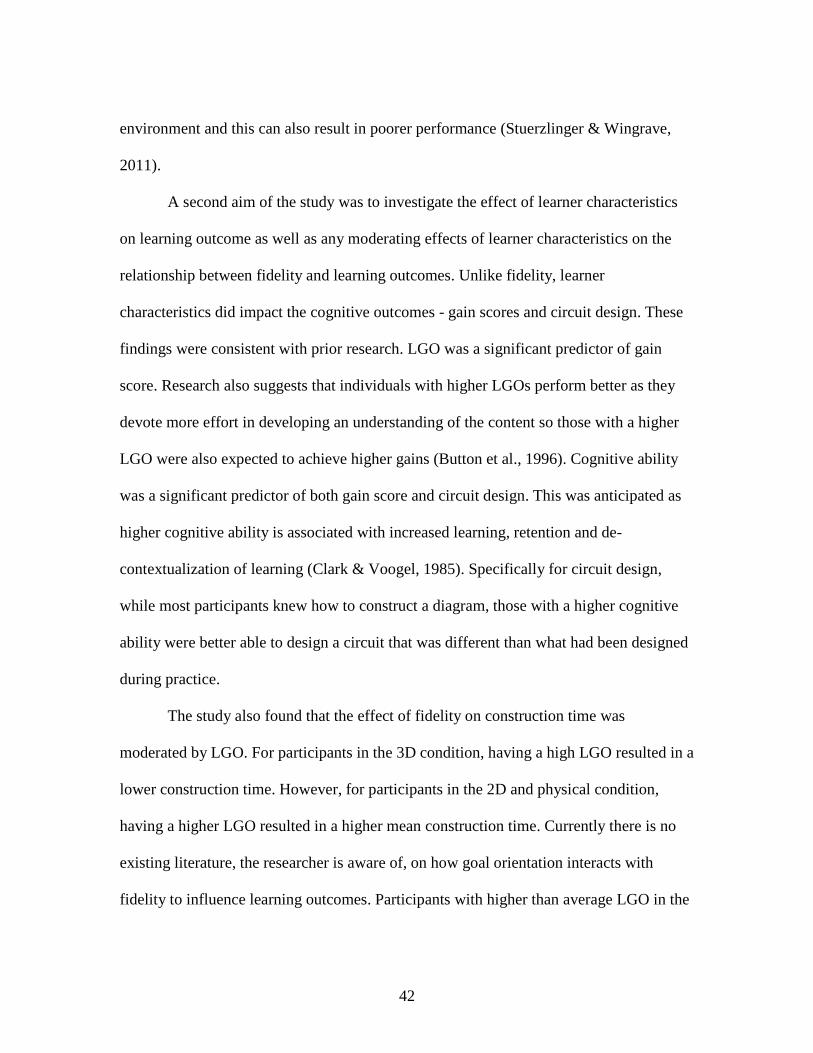
42
environment and this can also result in poorer performance (Stuerzlinger & Wingrave,
2011).
A second aim of the study was to investigate the effect of learner characteristics
on learning outcome as well as any moderating effects of learner characteristics on the
relationship between fidelity and learning outcomes. Unlike fidelity, learner
characteristics did impact the cognitive outcomes - gain scores and circuit design. These
findings were consistent with prior research. LGO was a significant predictor of gain
score. Research also suggests that individuals with higher LGOs perform better as they
devote more effort in developing an understanding of the content so those with a higher
LGO were also expected to achieve higher gains (Button et al., 1996). Cognitive ability
was a significant predictor of both gain score and circuit design. This was anticipated as
higher cognitive ability is associated with increased learning, retention and de-
contextualization of learning (Clark & Voogel, 1985). Specifically for circuit design,
while most participants knew how to construct a diagram, those with a higher cognitive
ability were better able to design a circuit that was different than what had been designed
during practice.
The study also found that the effect of fidelity on construction time was
moderated by LGO. For participants in the 3D condition, having a high LGO resulted in a
lower construction time. However, for participants in the 2D and physical condition,
having a higher LGO resulted in a higher mean construction time. Currently there is no
existing literature, the researcher is aware of, on how goal orientation interacts with
fidelity to influence learning outcomes. Participants with higher than average LGO in the

43
2D and physical conditions were perhaps more meticulous and as a result, spent more
time ensuring their circuit was constructed correctly. These participants may have also
been more willing to explore during the construction process. One possible explanation
why participants in the 3D condition did not exhibit the same pattern related to
construction time concerns a specific feature of the 3D software. The 3D software
provided participants with feedback about their connections when they were constructing
their circuit; participants with a low LGO may have depended more heavily on this
feedback than those with a high LGO and as a result took longer to construct their circuit
with the physical components. Prior research has found that providing a high level of
feedback during instruction can hinder independent performance (Goodman & Wood,
2004).
Limitations
There are several limitations associated with this study. First, the sample size was
relatively low (16 per condition) and was reduced further due to the withdrawal of several
participants. As a result, the power of the analysis was not ideal. Although both
undergraduate and graduate students were used to create a more diverse group of
participants, a more representative sample would have included non-traditional students
and students in associate’s and certification programs. Non-traditional students are more
likely to enroll in online courses than traditional students (Allen & Seaman, 2007) and
represent a prime target for computer-based hands-on laboratories. Furthermore, there
were characteristics of the software design, rather than an innate characteristic of 2D
simulations and 3D learning environments, that may have been detrimental to

44
participants’ performance when they transitioned from the simulated environment to the
physical environment. For example, both the 2D and 3D software allowed participants to
type in the resistance value needed for the circuit. Although using a resistor color code
sheet was introduced in the video lecture and participants were shown a demonstration of
how to read the resistor color codes, participants in the 2D and 3D conditions did not
have to practice selecting a resistor using a resistor color code sheet. This potentially
made it more difficult for them when they transitioned to working on the physical
breadboard. These issues do, however, provide insights regarding how the design of
simulated environments can be improved to support learning and transfer. The software
packages used in this study were off the shelf and thus there were differences between the
2D and 3D environments that could not be resolved. The major difference was that the
3D environment used a dual view with a circuit schematic and the breadboard that
provided participants with feedback concerning which circuit components were
connected correctly. There may have also been small differences in how a user would
interact with the system in the 2D and 3D environments. Lastly, constructing a circuit is a
very specific task that few students are required to perform as part of a course or on the
job. Even the majority of the participants who were engineering majors, many of whom
are required to complete a survey circuits course, expressed doubt in their ability to work
with circuits. While this task was chosen, in part, to build on the findings of previous
research, this limits the generalizability of the results. While it may be compared to other
cognitive procedural tasks, future research should evaluate the extent to which the results

45
from this study are generalizable across tasks and other types of laboratory-based
instruction.
Conclusions
This study found that fidelity impacted the affective and skill-based learning
outcomes for participants learning to construct a circuit on a breadboard. Individuals who
learned to construct a circuit using a physical breadboard had higher self-efficacy and
performed better on skill-based learning outcomes than individuals who learned in the 2D
or 3D conditions. While these findings suggest that instruction using physical
components was superior, there is evidence of transfer for those who learned to construct
a circuit in a simulated environment. Of the 29 participants in the simulated conditions
who attempted construction, 12 were able to effectively transition into the physical
workspace despite needing to identify differences between the two environments and
adjust their processes based on these differences. Some acclimation to the physical
environment will be necessary; enhancements in both the 2D and 3D software could help
address some of the issues participants faced when they transitioned.
Simulated laboratories do have some practical benefits over physical laboratories.
Simulated laboratories can be offered in an online setting and do not require the
equipment and facilities needed for physical laboratories. The maintenance costs for these
environments may also be lower than physical laboratories. Learners have increased
access as instructors and/or teaching assistants do not need to be present. Safety can be a
major concern as well as cost, two factors which may limit the students’ ability to
experiment and explore using the physical tools and equipment. This study also found

46
that the 3D condition offered no significant advantages over a 2D simulation for teaching
students how to construct a circuit on a breadboard. Participants in these two conditions
were comparable in terms of affective (self-efficacy) and skill-based outcomes
(construction time). However, participants in the 2D environment had higher odds of
constructing their circuit correctly than those using the 3D. Therefore, it may not be
necessary to devote the time and resources to develop, implement, and maintain 3D
environments when comparable results can be achieved in 2D environments.
While the fidelity of the learning environment influenced the affective and skill-
based outcomes, learner characteristics impacted the cognitive-based outcomes. An
interaction effect was also found between fidelity and LGO for construction time. These
results suggest that identifying and evaluating learner characteristics may help achieve
better results when selecting the learning environment. However, there are additional
learner characteristics, such as spatial ability, that may also influence performance when
using different levels of fidelity. Future research should continue to identify which
learner characteristics are most important and how they impact various learning
outcomes.
Identifying whether more technical and hands-on tasks can be effectively learned
in simulated environments is an important question for expanding course offerings in
online education and subsequently increasing access and educational equity. Online
education has been highly effective in increasing educational opportunities for students,
particularly nontraditional students (such as those who are older, attend school part-time,
or are financially independent) (Allen & Seaman, 2007). However, at the postsecondary

47
level, many of the online courses offered by traditional universities focus primarily on
conceptual learning (e.g., business, education, and health programs) (Allen & Seaman,
2006). Non-traditional students wanting a technical degree may be constrained to course
offerings at their nearest educational institution because few institutions currently offer
technical curricula in online settings. The results of this study provide insights about
whether, and potentially how, hands-on tasks can be effectively taught in online
laboratory settings.
Chapter Summary
This chapter addressed the first aim of this research by identifying how the
physical fidelity of the instructional environment impacted learning outcomes for
participants learning to construct a circuit on a breadboard. This study also investigated
how that relationship was influenced by cognitive ability and goal orientation. Although
there was evidence of transfer, participants learning in the physical condition, on average,
made fewer errors in the circuit design and construction, and constructed the circuit faster
than participants in the 2D and 3D conditions. Participants in the physical condition also
reported a higher self-efficacy than participants in the simulated conditions. These
findings, however, provide little insight about what specific characteristics of the
simulated and physical environments influenced these outcomes (affective and skill-
based). In the next study, semi-structured interviews were conducted with a subset of the
participants from this first study to understand how the fidelity of the learning
environment influenced their perceived proficiency and transition during the construction
task.

48
CHAPTER FOUR
DISSERTATION STUDY TWO
Purpose
This study explored how the physical fidelity of the learning environment and the
transition from the simulated to the physical environment contributed to differences in the
outcomes achieved by the participants. This study addressed the second aim of the
research conducted for this dissertation. The work reported in this chapter was published
in the 2016 Conference Proceedings of the American Society for Engineering Education
(Alfred, Morris, Neyens, Gramopadhye, 2016).
Methods
Participants
This study, approved by the Institutional Review Board of Clemson University (IRB
# 2015-001), used a purposeful sample of 20 participants who had participated in the
original study (Table 4.1). The participants were selected to ensure that the study
included:
• Representatives of those in the physical, 2D, and 3D conditions• Undergraduates and graduate students• Males and females• Students of color and white students• Engineering and non-engineering majors• Successful and unsuccessful in completing the construction task
Table 4.1. Representative Sample of Participants Level of physical fidelity Class Gender Race Major Construction
Physical 2D 3D Grad F Students of Color
Engineering Successful
6 (30%) 8 (40%) 6 (30%) 13 (65%) 10 (50%) 12 (60%) 7 (35%) 12 (60%)
49
Procedures
Once participants signed the consent form, they were given a short overview
explaining the purpose of the study. They were then informed of its structure and were
provided with an opportunity to ask questions. After this brief summary, a semi-
structured interview was conducted with each of the participants on their understanding
of the circuit construction task, their process for constructing the circuit, and their
troubleshooting strategy. The participants were also asked about their emotional state
during the study as well as their motivation for taking part in it. This interview was audio
recorded and then transcribed by a transcription service blind to the objectives of the
study. Each transcript was verified, and any mistakes or inconsistencies in the
transcription were corrected by the research team.
Following each interview, the researcher wrote memos about some of the key
ideas from the interview as outlined by the qualitative research process (Strauss &
Corbin, 1990). After several interviews the researcher revisited the notes from the
individual interviews and then compared the notes to identify trends (Rubin & Rubin,
1995). This process was repeated with every four sets of interviews and again at the end
of the interview process. In the research memos, the lead researcher also reflected on
these interpretations, noting her own thoughts, feelings, and preconceptions about the
phenomena being studied.
After all 20 interviews were completed, the researcher defined an initial set of
concepts using the memos as well as the transcriptions. Thoughts, quotes and
paraphrased excerpts from the various interviews were grouped based on similarity using

50
an affinity diagram. These groups of concepts were then used to define categories to
represent higher level abstract concepts that are similar in nature but can be contrasted
based their properties (Strauss & Corbin, 1990).
The categories generated from this process were then used to code the
transcriptions using Dedoose, a qualitative and mixed methods research software.
Sentence fragments, sentences, and entire sections of interview data were coded based on
the main idea being conveyed by the participant. This open coding process was
completed by two members of the research team. Following individual coding, the two
coders reviewed several of the coded transcriptions to compare results. Interrater
agreement was not calculated as the coders sought consensus on the codes selected for
each transcribed interview. The research team then identified the properties and
dimensions of the categories. Properties that were redundant or could not be analyzed
across dimensions were eliminated. Finally, themes were developed from the data based
on similarities in the categories as well as their properties.
Results
Analysis
The initial concepts were derived from both participant quotes and the
researcher’s memos by focusing on key aspects of the interviews, the memos written for
each, and the trends identified from revisiting these memos. Below is an example of a
direct quote from a participant discussing his affect after successfully constructing the
circuit. The bolded statement in the bracket represents the concepts identified.

51
“When it finally ... like we had a part where it lit up, something had to light up.
And it felt good when it lit up [“joy”], you know, like, "I did it. I kilt it." In my
head, you know? Like, "I'm the best at this. [“confidence”]
Here is another statement from a participant describing how her learning style helped
shaped her approach to the circuit construction task.
“I mean I'm a much more sort of like, visual conceptual thinker and learner
[“learning style”]. So it always helps me if I have a pen and I draw either where
I'm, where I think I'm at or where I want to go. So, sometimes I would draw like,
you know um, if we learned, here's how you set up a ser- a simple series circuit. I
might draw that before like, I started [“strategy”]. So then I could be like, "Okay,
if it's a series, and I need like, three bolts, then I need to put like, a thing here, a
thing here and a thing here."
The researcher’s memos also provided a source of data as it summarized some of the
major points of an interview as shown in the examples below.
Spoke about the simplicity of working in the 3D environment [“simplicity”].
Performing well in the 3D environment and struggling in the physical
environment led him to believe “there’s something wrong with the breadboard”
[“attribution”]. Also discussed a downward slope of confidence [“confidence”].
Better understanding of circuit concepts then most participants [“circuit
knowledge”]. Well in-tuned with differences between 2D simulation and physical
environment. Mentioned the need for “mental rotation” because orientation of
breadboard in 2D simulation differed from orientation of breadboard in training

52
[“differences in learning environment”]. Prior experience with circuits shaped
view of 2D simulation [“past experience”].
Once these concepts were identified, they were grouped based on similarity. For
example, participants’ discussion of their confidence, anxiety or frustration was placed
into a one group. Participants’ discussion of their major, learning preference or
personality was placed into another group.
The groupings were then analyzed to determine a broad category that best fit all
of the concepts in the group. In the first example listed above, confidence, anxiety, and
frustration were categorized under affect. In the second example, major, learning
preference, and personality were categorized as self-descriptions. After developing and
revising the categories, a final list of nine categories were selected to code the interviews
and are shown in Table 4.2.
The 20 interviews were then coded individually by two members of the research
team using Dedoose. Once all interviews were coded, the properties and dimensions of
the categories were defined. Properties describe the general characteristics of a category,
while dimensions describe the location of the property along a range or continuum
(Strauss & Corbin, 1990). For two categories, motivation and emotional state, the
researchers used well-defined properties from the extant literature. Motivation was
analyzed base on the orientation – extrinsic to intrinsic – and level – low to high (Ryan
& Deci, 2000). Emotional state was evaluated in terms of valence – negative to positive
– and arousal – low to high (Kensinger, 2004). The researchers defined the properties and
dimensions for the remaining seven categories as shown in Table 4.3.

53
The research team then began searching for the trends among the categories and
the properties within them that were most influenced by the physical fidelity of the
learning environment. Some of the categories, such as past experience with circuits and
general circuit knowledge, although varying widely among participants, appeared
unrelated to the physical fidelity as the students described prior courses and informal
settings where they learned about circuits at various levels of breadth and depth.
Motivation was less varied but was also unrelated to the different levels of fidelity, with
participants discussing their relationship with the researcher, general interests in research,
financial incentives, and “research karma,” which is participating in the research studies
of others so that others will participant in your own research study, as their reasons for
participating. For the self-description category, participants tended to relate their major,
their learning preference and/or their personality to their performance. Some also used
these descriptions to explain their preferences for one learning environment (such as the
physical) over the other (such at the 2D or 3D environments).
The categories most affected by physical fidelity were the ones that described
characteristics of the learning environment, attributions, affect, strategies and tactics, with
the first three having the highest level of co-occurrence. Strategies and tactics, while not
having a high level of co-occurrence, were the categories that were difficult for the
coders to distinguish. Based on reviewing these categories, their properties and their
dimensions as well as their relationship, the researchers identified three primary themes
of support, physical transition, and emotional transition for explaining how the physical
fidelity of the learning environments impacted performance.

54
Table 4.2. High Level Categories Generated from Memos and Transcripts
Category Description Example concepts
Past experience with circuits Past experience working with or learning about circuits
Electrical engineering course, physics lab, circuits kit
General circuit knowledge
General description of concepts related to circuit construction and analysis
Ohm’s law, parallel circuit, series circuit, forward voltage
Characteristics of the learning environment
Attributes of the physical, 2D or 3D environments that participants like/dislike or influenced their performance in any way
Simplicity, feedback, exploration
Attributions
Description of a reason for their struggles and successes during the construction task
Self, training, environment, equipment
Self-descriptions
Description of personality, field of study, learning style, physical characteristics, interests etc.
Major/program, career field, learning style, personality
Affect
Description of a particular emotion experienced during the study
Confidence, frustration, joy, anxiety
Strategies
Description of a primary overall approach for constructing circuits on the physical breadboard
Methodical, trial and error, memorization, visualization
Tactics
Description of the breakdown of the process by step when constructing the circuit on the physical breadboard
Collect all resources first, check one connection at a time, double-check the circuit before energizing
Motivation
When the participant mentions his/her motivation for taking part in the study and persevering through the study
Relationship with researcher, intrinsic, incentive

55
Table 4.3. Properties and Dimensions for each of the Categories Category Properties Dimension
Past experience with circuits
• Experience• Date of experience• Type of experience
• Limited to extensive• Long ago to recent• Informal to formal
General circuit knowledge
• Understanding• Type
• Rudimentary toadvanced
• Theoretical to practicalCharacteristics of the learning environment
• Support• Engagement
• Low to high• Weak to strong
Attributions
• Attribution• Knowledge• Direction
• Internal to external• Declarative to
procedural• Negative to positive
Self-descriptions • Origin • Innate to learned
Affect • Valence• Arousal
• Negative to positive• Low to high
Strategies • Process • Unplanned to plannedTactics • State • Mental to physical
Motivation • Orientation• Level
• Extrinsic to intrinsic• Low to high
Results
Theme 1: Level of support
Participants in the simulated environments, specifically the 3D environment, often
referred to higher levels of support in these environments compared to the physical
environment. Participants who practiced in the 3D condition spoke of its specific
attributes that benefitted them during practice such as the different views of the
breadboard as well as the ability to zoom in and out. They specifically referred to this,
saying:
“I liked the, the virtual environment cuz you couldn't kind of, um, you didn't have
a ... You could kinda flip it and view however you wanted. You didn't have this

56
pure kind of, I guess, isometric view. You could look at it on the side. You could
look at it in all sorts of, um, visual angles so it was easier to visualize the circuits
in the virtual angle vers- er, in the virtual environment versus in the real world
where you had to kinda ... Well, you can't, like, turn a circuit upside down,
obviously, otherwise all the components would fall out and you have to start over
again and you'd probably break some components.”
“Um, and I think that was much more difficult to discern from the physical
breadboard than from the computer model. Um, again just that aerial view that
you only have from the physical model was, I guess slightly uncomfortable.
Whereas in the digital one you could manipulate and look at it from the side and
zoom in.”
Participants in the 2D and 3D conditions also referred to the simplicity of working in
those environments. As one put it:
“But, um, I was a lot faster on the computer than I was in real life, because I was
trying to recall in my brain, like, "Okay, this was on the fifth hole," or whatever,
and I had to, like, count it, and just, like, physically it was hard for me to, like,
connect the pieces. Um, whereas, like, on the computer, it was easier, just, like,
select where I wanted the wires to go, instead of having, like, make sure the wires
would stretch to this hole, and make sure that they were in the holes all the way.
Um, so the transition wasn't bad. Um, but I definitely preferred the CAD [3D] one
to the physical one.”
57
However, the primary difference in the level of support between the physical
environment and simulated environment concerned the level of feedback. Participants in
both the simulated environments, but more so in the 3D environment, benefitted greatly
from the positive feedback they received while they were practicing.
“I felt, again, that, um, that that positive reinforcement of knowing that like, okay
I'm getting the answers right, I'm, you know, getting all these green lights in my
drawing, my sketch or whatever and then it's like working in the simulation
[3D].”
“And that was one of my issues was – you know- making sure it was connected
well enough in the physical environment so that that light could come on and that
could -that sometimes made me second guess myself and wonder if I was actually
putting it on correctly and wondering, "What did I do wrong?" Whereas, like I
said, in the computer environment, you click go and if it's set up correctly, that
light's going to come on. So, I really liked the feedback that I got from the
computer environment [2D]”
However, participants also reflected on not having this feedback in the physical
environment and how it influenced their performance. One participant summed up the
issue well stating:
“I think having the instant feedback that you get in the simulation [3D] when it
turned red or green like when you’re doing it that you know that it's hooked up
right. Not having that in an actual like physical breadboard was tricky because
like, oh, I don't know why this isn't working because you can't figure out where
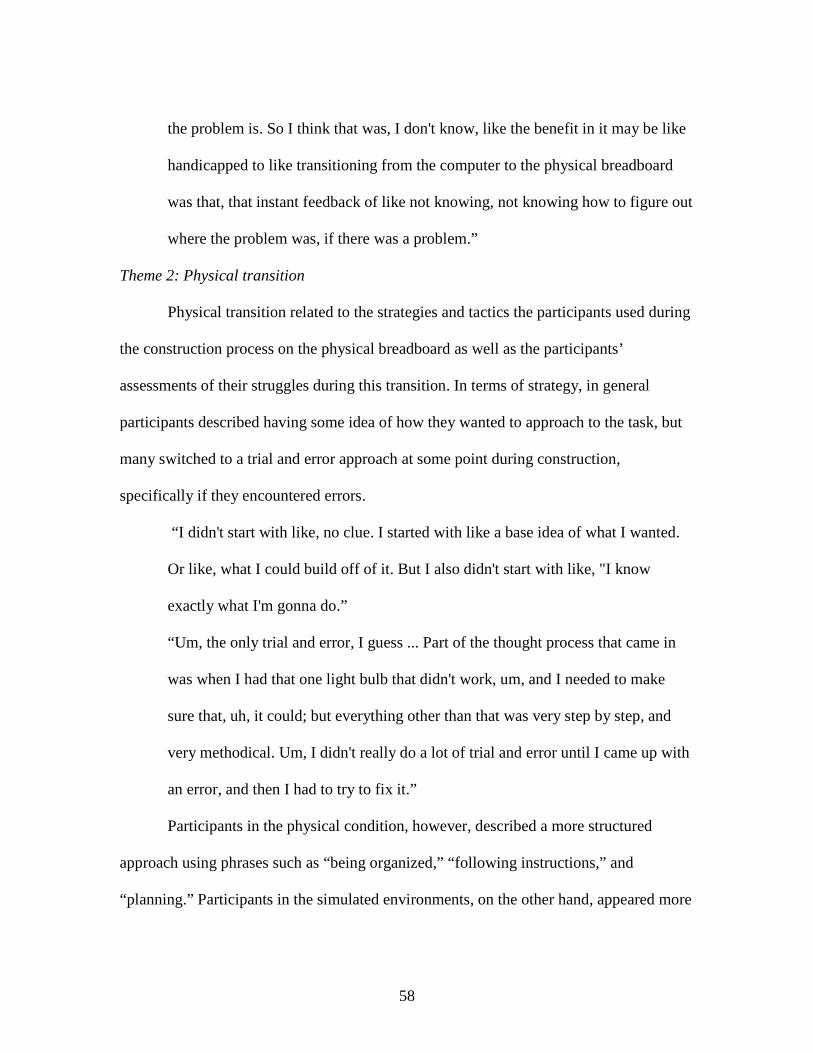
58
the problem is. So I think that was, I don't know, like the benefit in it may be like
handicapped to like transitioning from the computer to the physical breadboard
was that, that instant feedback of like not knowing, not knowing how to figure out
where the problem was, if there was a problem.”
Theme 2: Physical transition
Physical transition related to the strategies and tactics the participants used during
the construction process on the physical breadboard as well as the participants’
assessments of their struggles during this transition. In terms of strategy, in general
participants described having some idea of how they wanted to approach to the task, but
many switched to a trial and error approach at some point during construction,
specifically if they encountered errors.
“I didn't start with like, no clue. I started with like a base idea of what I wanted.
Or like, what I could build off of it. But I also didn't start with like, "I know
exactly what I'm gonna do.”
“Um, the only trial and error, I guess ... Part of the thought process that came in
was when I had that one light bulb that didn't work, um, and I needed to make
sure that, uh, it could; but everything other than that was very step by step, and
very methodical. Um, I didn't really do a lot of trial and error until I came up with
an error, and then I had to try to fix it.”
Participants in the physical condition, however, described a more structured
approach using phrases such as “being organized,” “following instructions,” and
“planning.” Participants in the simulated environments, on the other hand, appeared more
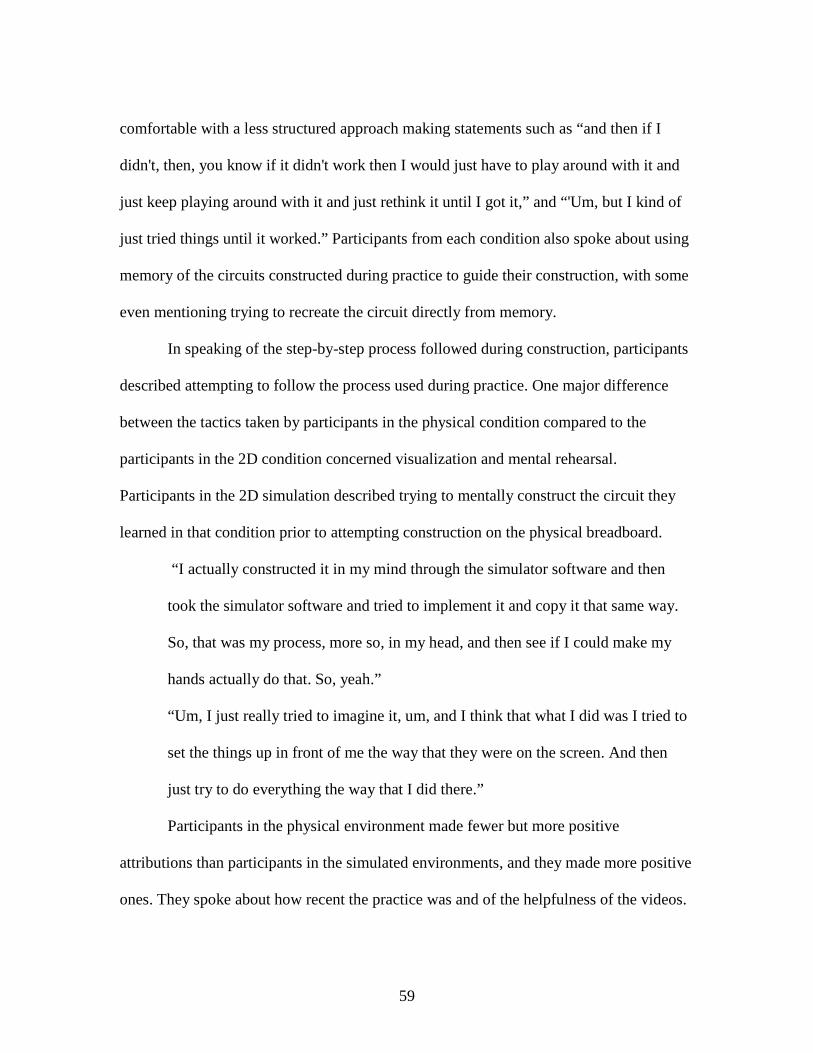
59
comfortable with a less structured approach making statements such as “and then if I
didn't, then, you know if it didn't work then I would just have to play around with it and
just keep playing around with it and just rethink it until I got it,” and “'Um, but I kind of
just tried things until it worked.” Participants from each condition also spoke about using
memory of the circuits constructed during practice to guide their construction, with some
even mentioning trying to recreate the circuit directly from memory.
In speaking of the step-by-step process followed during construction, participants
described attempting to follow the process used during practice. One major difference
between the tactics taken by participants in the physical condition compared to the
participants in the 2D condition concerned visualization and mental rehearsal.
Participants in the 2D simulation described trying to mentally construct the circuit they
learned in that condition prior to attempting construction on the physical breadboard.
“I actually constructed it in my mind through the simulator software and then
took the simulator software and tried to implement it and copy it that same way.
So, that was my process, more so, in my head, and then see if I could make my
hands actually do that. So, yeah.”
“Um, I just really tried to imagine it, um, and I think that what I did was I tried to
set the things up in front of me the way that they were on the screen. And then
just try to do everything the way that I did there.”
Participants in the physical environment made fewer but more positive
attributions than participants in the simulated environments, and they made more positive
ones. They spoke about how recent the practice was and of the helpfulness of the videos.

60
When discussing some of the reasons for their struggles, participants in the simulated
environments spoke primarily of gaps in their procedural knowledge.
“But I always felt that I can get it. Because I had the knowledge of doing it. Um,
but there's something that either, I may have missed that. I, I felt that there was
something more wrong with the breadboard or something that I was doing wrong,
procedurally rather than what I had learned to do.”
“Um, so I think the most frequent obstacle at least that I perceived was that I
wasn't using the correct wires to complete the circuit. Or for whatever reason my
arrangement of the different components on the breadboard were, were not right.
Um, so I would try and go back to what I had learned the digital model”
Participants in the simulated environments also spoke of some difficulty related to
manipulating components in the physical condition.
“I think the, the, the main difference I think between the so the, you know,
clicking and the 2-dimensional environment was easier because the components
in the physical environment was, were so much smaller.”
“I just found it, in this case, I found it harder because the components were small.
If the components had the same sort of values, and they were just enlarged, um,
by a scale of ... A factor of 5 or 10 say, it'd be a lot, a lot easier for me to work
with.”
Another issue that impacted participants’ transition from the simulated
environments to the physical environment was the orientation of the breadboard and the

61
components. Below two participants note how the change in orientation impacted their
affect and performance.
“I do know that it annoyed me that the orientation was different but I don't, I
guess I'm not a 100% sure whether or not it was the fact that the module and the
simulation were flipped or the, or the simulation and the physical board were
flipped…”
“Um, I think just the orientation of some components like the switch uh, I don't
recall precisely. But I think there is some ... I had trouble with the orientation of
something.”
Theme 3: Emotional transition
Participants transitioning from the simulated environments to the physical
environment described a wide range of emotions related to this transition. Some spoke of
the downward shift of confidence that resulted from performing without obstacles in the
simulated environment and then struggling to construct the circuit in the physical
environment.
“It took me a really long time. Be- uh, there was something related to ... I felt that
I was very close every time I had it. Because I felt uh, uh, throughout the um,
computerized part of that experiment, I got everything right away. And everything
always worked right away.”
“So, just after trying several times, it was like okay, probably I missed something.
Probably I just don't get it, even though I'm supposed to get it. So, it was more
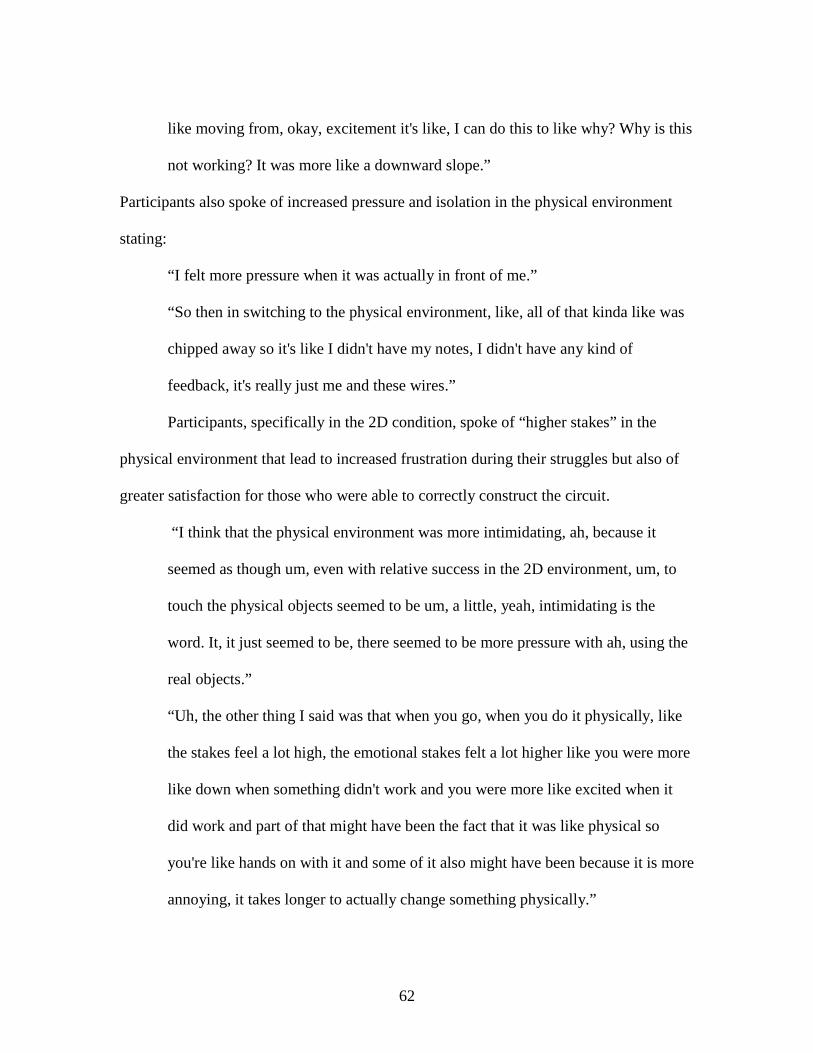
62
like moving from, okay, excitement it's like, I can do this to like why? Why is this
not working? It was more like a downward slope.”
Participants also spoke of increased pressure and isolation in the physical environment
stating:
“I felt more pressure when it was actually in front of me.”
“So then in switching to the physical environment, like, all of that kinda like was
chipped away so it's like I didn't have my notes, I didn't have any kind of
feedback, it's really just me and these wires.”
Participants, specifically in the 2D condition, spoke of “higher stakes” in the
physical environment that lead to increased frustration during their struggles but also of
greater satisfaction for those who were able to correctly construct the circuit.
“I think that the physical environment was more intimidating, ah, because it
seemed as though um, even with relative success in the 2D environment, um, to
touch the physical objects seemed to be um, a little, yeah, intimidating is the
word. It, it just seemed to be, there seemed to be more pressure with ah, using the
real objects.”
“Uh, the other thing I said was that when you go, when you do it physically, like
the stakes feel a lot high, the emotional stakes felt a lot higher like you were more
like down when something didn't work and you were more like excited when it
did work and part of that might have been the fact that it was like physical so
you're like hands on with it and some of it also might have been because it is more
annoying, it takes longer to actually change something physically.”

63
“Well I think that ah, one of the things that I liked in the, in the more, in the, sort
of in the tactile, in the physical environment is that um, you know, right or wrong,
whatever the, whatever the process um, I think there's a way of seeing, like of
actually experiencing success or failure. So, seeing the light comes on, um, while
there may be more risk, more seeming risk, or you know, like um presumed risk,
the, the reward is greater to actually physically make a light come on seems to be
um, a better payoff than ah, a program you know in the 2 dimensional
environment telling you that you've successfully completed it as opposed to, you
know, sort of seeing the, the product of that.”
Discussion
Three themes emerged from the analysis, level of support, physical transition and
emotional transition. The level of support focused on attributes of both simulated
environments that helped the participants successfully complete the practice activities,
specifically, positive feedback, zooming capabilities, alternate viewpoints and simple
manipulation of components. The attribute of the learning environment seen as having
the most influence on performance was feedback. In the 3D environment, participants
were able to switch views between the circuit diagram and the breadboard to ensure that
they were constructing the circuit correctly. The diagram used green lines for the correct
connections and red for the incorrect ones (Figure 4.1). This feedback provided by the
simulated environments appears to have both beneficial and detrimental effects.
Participants found it helpful to have feedback during the practice session,
particularly in the 3D environment, as it provided visual information concerning the

64
location of an error made while they were constructing a circuit on the virtual
breadboard. However, the lack of feedback in the physical seemed to create two issues
for participants: it hindered their ability to identify the source of the error when the circuit
was not functioning and it reduced their willingness to troubleshoot. Extant literature has
already identified this dual effect of feedback specificity, i.e. the amount of information
provided to learners in feedback messages (Goodman & Wood, 2004), with previous
studies suggesting that high feedback specificity is beneficial for immediate performance
but reduces the learning opportunities needed for independent performance (Kensinger,
2004).
A. Breadboard view
B. Diagram view
Figure 4.1. Feedback Provided to Participants Working in 3D Breadboard Environment
The theme of physical transition focused on the approach participants used during
the construction process on the physical breadboard and its effectiveness, rated on a scale
ranging from methodical to trial and error. Most participants used an approach that fell
somewhere in the middle; however, participants in the simulated environments appeared
more comfortable using a trial and error approach than those using the physical
breadboard. One possible explanation for this difference involves the adaptations
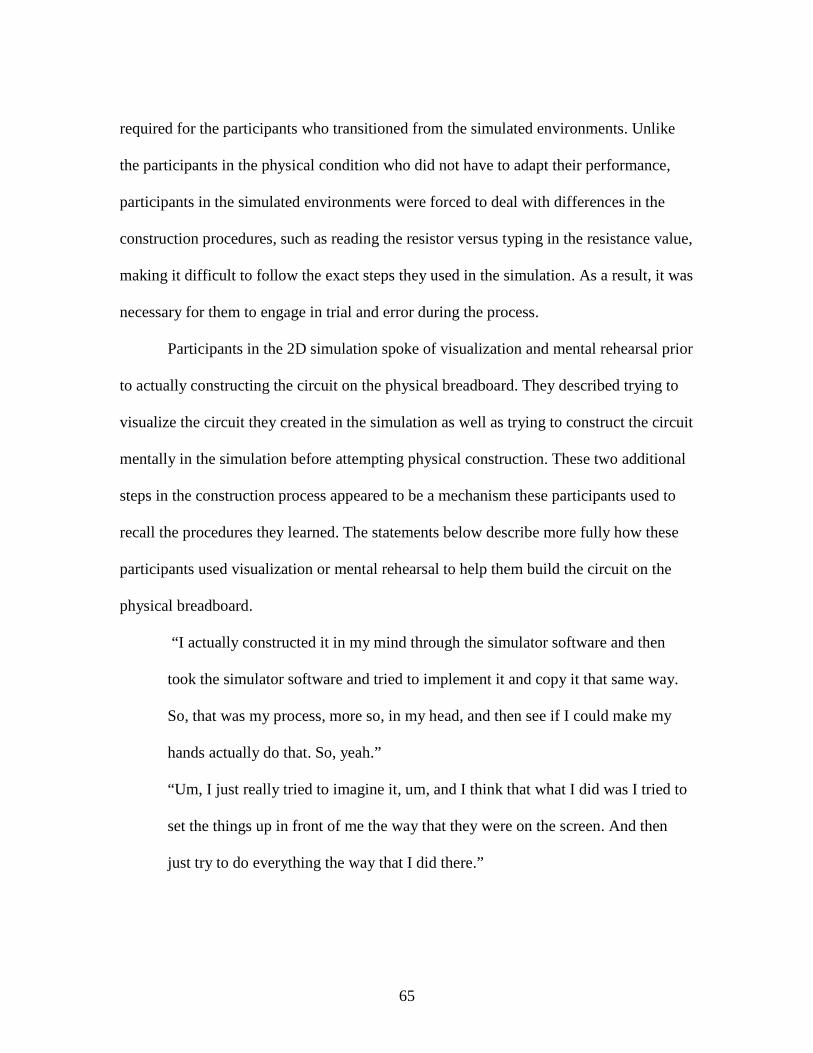
65
required for the participants who transitioned from the simulated environments. Unlike
the participants in the physical condition who did not have to adapt their performance,
participants in the simulated environments were forced to deal with differences in the
construction procedures, such as reading the resistor versus typing in the resistance value,
making it difficult to follow the exact steps they used in the simulation. As a result, it was
necessary for them to engage in trial and error during the process.
Participants in the 2D simulation spoke of visualization and mental rehearsal prior
to actually constructing the circuit on the physical breadboard. They described trying to
visualize the circuit they created in the simulation as well as trying to construct the circuit
mentally in the simulation before attempting physical construction. These two additional
steps in the construction process appeared to be a mechanism these participants used to
recall the procedures they learned. The statements below describe more fully how these
participants used visualization or mental rehearsal to help them build the circuit on the
physical breadboard.
“I actually constructed it in my mind through the simulator software and then
took the simulator software and tried to implement it and copy it that same way.
So, that was my process, more so, in my head, and then see if I could make my
hands actually do that. So, yeah.”
“Um, I just really tried to imagine it, um, and I think that what I did was I tried to
set the things up in front of me the way that they were on the screen. And then
just try to do everything the way that I did there.”

66
While working with and manipulating the small physical components created
some issues, the orientation of the breadboard appeared to be particularly problematic.
The orientation of the breadboard in the 2D simulation, which was horizontal, could not
be changed, while the default orientation of the breadboard in the 3D environment, also
horizontal, could be changed. For the physical construction, the breadboard was arranged
vertically, but participants could, and several did, change the orientation. Participants
who did not immediately change the orientation of the breadboard potentially
experienced an unnecessary increase in cognitive load (Paas & Sweller, 2003). This
increase in cognitive load may have been exacerbated for participants in the 2D
conditions as they already had the additional task of translating “the representation from
2-D to 3-D” (Regian et al., 1992).
Another theme that emerged related to the affect of participants in the 2D
simulation describes the affect of participants when they transitioned from the simulated
environment to the physical one. Participants described two predominant emotional states
related to this transition, a decrease in confidence and a heightened emotional divergence.
Participants who performed successfully in the simulated environments during practice
and then struggled in the physical condition described experiencing a “downward slope”
of confidence. This drop in confidence was not simply the result of encountering
obstacles but the feeling of being ill-prepared and unable to overcome these difficulties.
Previous research has suggested that information processing capabilities are reduced
when dealing with negative emotions (Heimbeck et al., 2003). More germane to this
study, previous research in training has also found that learners who completed an

67
instructional program without obstacles struggle when faced with challenges in the
performance environment (Heimbeck et al., 2003). Goodman and Wood (2004) suggest
that in order to generalize performance, learners have to be able to adjust to different
performance conditions, including making errors and resolving them without assistance.
Participants in the 2D simulation also described a heightened emotional
divergence when they transitioned from the simulated environment to the physical
breadboard, indicating they became frustrated when they could not get the circuit to work
in the physical condition, describing this feeling as increased “pressure.” They also
described increased satisfaction and a “greater reward” when they were able to solve the
circuit in the physical condition. For these participants, the perceived “stakes were
higher” when they were working in the physical environment. Part of the reason for this
feeling is summed up by one participant who described the 2D simulation as feeling
“simulated.” Another participant, who also learned in the 2D environment, described the
physical environment as “real.” As a result, the emotional intensity for these participants
was lower in the simulated environments.
A second explanation deals with the task itself. Constructing a circuit on a
breadboard is a hands-on task. Having to do this “hands-on” task in a simulated
environment potentially detracted from both the emotional engagement in the
environment as well as the participants’ perceptions of their ability to complete the task.
This conclusion is supported by the previous study as participants in the simulated
environments had statistically significantly lower self-efficacy than those in the physical
environment (Alfred et al., 2016).

68
Limitations
Several months passed between the initial study and the follow-up study, and as a
result, participants struggled to articulate the specific details related to their circuit
construction process. Several of the participants knew the lead researcher outside of the
study, situation that potentially affected the interview data. While a representative
sample of 20 participants was interviewed, it may have been beneficial to conduct more
interviews. In addition, the interviews were conducted by only one researcher.
Conclusions
The physical fidelity of the learning environment impacted the participants’
attributions, affect, and strategies and tactics. Although most participants in the 2D
simulation and 3D breadboard environments enjoyed working in those conditions,
learning how to construct a circuit in either of those conditions contributed to procedural
knowledge gaps, decreased ability to identify errors, and heightened levels of frustration
that were detrimental to performance. Some participants noted these limitations,
suggesting that the computer conditions might be best used to help students develop a
conceptual understanding. However, those limitations may be resolved with
improvements in the design of the software. Specifically, the design of 2D and 3D
environments need to reduce the level of support provided to participants. For example,
the 3D breadboard software could progressively decrease the feedback provided so that
learners have the help they need early in practice but are not hindered as they prepare for
the transition to the real world.

69
Both the 2D simulation and the 3D breadboard software could also facilitate the
transition by requiring similar procedures to those in the physical environment. For
example, allowing participants to choose the correct resistor by reading a resistance sheet
is a more difficult task, than having to type in the resistance value. In addition, the
simulated environments can make the participants aware of differences they may
encounter when they transition. Transitions from these environments can be made more
smoothly if participants are aware of such issues in the physical environment as blown
LEDs, dead batteries, and burnt connections on the breadboard that do not occur in the
simulated environments. If participants are knowledgeable of these potential issues, they
can better troubleshoot issues in their construction.
However, some differences remain that require students to acclimate to the
physical properties of the breadboard. One example is physically manipulating the
components and inserting them properly into the breadboard as this process simply does
not translate from the simulated environment. The other physical difference involves the
orientation of the breadboard. A simple fix in the 2D simulation would be to allow
participants’ to orient the breadboard vertically or horizontally based on their preference.
However, participants were able to overcome most of these differences as demonstrated
in the initial study.
The other difference between the 2D and 3D environments and the physical one
concerned the participants’ affect while working in the simulated environments.
Participants described feeling “intimidated,” “more pressure,” and having “higher
stakes,” when transitioning from the simulated environments to the physical one. While
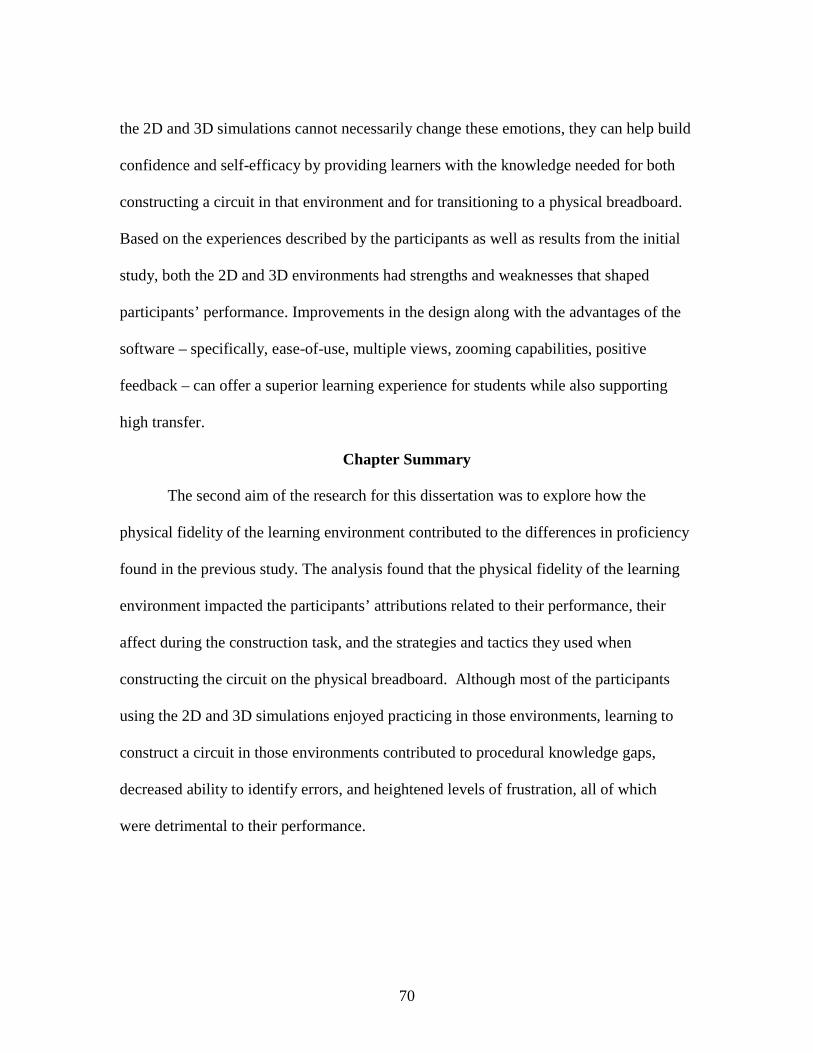
70
the 2D and 3D simulations cannot necessarily change these emotions, they can help build
confidence and self-efficacy by providing learners with the knowledge needed for both
constructing a circuit in that environment and for transitioning to a physical breadboard.
Based on the experiences described by the participants as well as results from the initial
study, both the 2D and 3D environments had strengths and weaknesses that shaped
participants’ performance. Improvements in the design along with the advantages of the
software – specifically, ease-of-use, multiple views, zooming capabilities, positive
feedback – can offer a superior learning experience for students while also supporting
high transfer.
Chapter Summary
The second aim of the research for this dissertation was to explore how the
physical fidelity of the learning environment contributed to the differences in proficiency
found in the previous study. The analysis found that the physical fidelity of the learning
environment impacted the participants’ attributions related to their performance, their
affect during the construction task, and the strategies and tactics they used when
constructing the circuit on the physical breadboard. Although most of the participants
using the 2D and 3D simulations enjoyed practicing in those environments, learning to
construct a circuit in those environments contributed to procedural knowledge gaps,
decreased ability to identify errors, and heightened levels of frustration, all of which
were detrimental to their performance.

71
CHAPTER FIVE
DISSERTATION STUDY THREE
Purpose
The purpose of the study was to evaluate the retention of individuals learning in
different levels of physical fidelity as defined in research aim three. To address this goal,
a 4-week longitudinal study was conducted.
Methods
Leveraging the results of Study 1
Improvements in the instructional design of the video lecture, practice exercises,
and activities were made based on issues discovered in the first study. These changes
included breaking the 28 minute video lecture into three shorter videos with 2-3 practice
exercises after each section. These changes also included providing opportunities for
participants in all conditions to become comfortable determining the resistance value of
through-hole resistors and providing participants in the simulated environments with
transition notes to help them understand differences they may encounter when working
with physical circuits (Appendix K).
Participants
This study included a total of 70 participants, both undergraduates and graduate
students. However, students who completed an electrical circuits course in the past
academic year were not eligible to participate. In addition, participants had to be able to
self-report their SAT or ACT scores. Participation was voluntary, and the participants
received a $20 gift card for each session they participated in. A majority of the

72
participants (n=64, 91.4%) were undergraduates, with a mean age of 20.27 (SD=2.28).
Females accounted for 61.4% of the participants, and 60 participants (85.7%) reported
having very little to no experience prior experience working with circuits. This study was
approved Clemson University IRB (IRB2016-041).
Experimental design
This study used a 3 x 3 repeated measures design with the level of physical fidelity
(2D, 3D, and physical) as the between-subjects factor and the measurement occasion (T0,
T1, T2) as the within-subjects factor. Pretest scores, cognitive ability, and goal
orientation were used as covariates in the analysis. The dependent measures for this study
included self-efficacy, gain scores (score), circuit design (grade), circuit time and
construction (grade), which was scored as “no errors,” “minor errors,” and “major
errors.”
Participants’ SAT or ACT scores were used as measures of cognitive ability, with
the ACT composite scores being converted to total SAT scores for these 10 participants
using the equivalence chart developed by Dorans (1999). Both goal orientations, LGO
and PGO, were assessed using an eight-question instrument developed by Button et al.
(1996). The reliability for these questionnaires was α = 0.72 for PGO and α = 0.78 for
LGO. Post instruction self-efficacy was assessed using a six-question instrument with a
Cronbach’s alpha of α = .82 (Guthrie & Schwoerer, 1994). The questions for all of these
instruments used a five-point Likert scale ranging from strongly disagree to strongly
agree.

73
Procedures
Upon arrival to the study location, participants first completed the consent form,
after which the researcher explained the study procedure and gave the participants their
user IDs for logging into the learning management system, Educate Workforce, which
housed the course material for the study (Figure 5.1). Once the participants were logged
in, they completed a survey that included demographic questions and goal orientation
questions (Appendices B and C). Participants also reported their SATs or ACT scores on
the demographic survey instrument. Next, the participants completed a five-question
online pretest (Appendix A) that included questions related to electrical circuit concepts
(e.g., voltage, resistance, and current), circuit diagrams and symbols, breadboard
functionality, and Ohm’s law. Each question had four answer options.
After the pretest students watched a 3 brief video lectures, totaling 28 minutes,
which covered basic circuit analysis. Participants also completed 2-3 practice questions
related to the topics covered in each lecture. These practice questions were graded
immediately by the system and feedback, including the correct answer, was provided.
Following the presentations, the participants were given the opportunity to practice
constructing a circuit on a breadboard based on their assigned condition. Those assigned
to the 2D simulation condition used an Arduino 2D breadboard from 123D Circuits
(123d.circuits.io), while those assigned to the 3D condition practiced constructing a
circuit using National Instrument Multisim Educational Edition version 13, and
participants in the physical condition practiced using a 800 point solderless breadboard.
These were the same breadboards used in first study.

74
Through videos, participants were shown how to use Ohm’s law to calculate the
resistance values needed for series and parallel connections, how to translate a specified
circuit into a diagram, and how to construct a circuit using the physical or simulated
breadboards. Because students in the 2D and 3D conditions also had to learn to use the
software, the instructional videos for each of the conditions varied in length. In total, this
study involved six videos, 2 for each condition, ranging from 7 to 17 minutes.
The equipment for this study included a computer workstation with dual monitors
to allow participants to construct their circuits as they watched the demonstrations
(Figure 5.2). In the 2D and 3D environments, participants navigated using the mouse and
keyboard. Participants in the all three conditions had comparable components LEDS,
resistors, batteries, and switches for constructing their circuits during the practice
sessions.
Participants were given three practice activities to complete. During these
practice sessions, they were provided with feedback on the accuracy of their calculations
and the construction of the circuit and were referred to the appropriate video for review
for any errors they made. The participants were not allowed to continue the experiment
until they successfully completed the practice activities. Although this requirement led to
varying practice times, it was essential that participants demonstrate a minimum level of
proficiency before continuing to the construction task. Following these practice sessions,
the participants completed a survey assessing their post instruction self-efficacy and a 5-
question multiple choice, online posttest (Appendices D and E). The posttest was of the
same structure and length as the pretest and used similar questions.

75
Figure 5.1. Educate Workforce Student Dashboard
Figure 5.2. Setup of study for 2D and 3D participants

76
Participants in all conditions then constructed a circuit on a physical breadboard
(Appendix F). During this task, they did not have access to their notes or the instructional
videos. During the construction, participants were video recorded using a GoPro Hero4
Black camera, which was positioned above the construction area. Once the students
completed this activity, they were thanked for their participation and given a gift card.
At the two-week (T1) and four-week (T2) intervals following the initial training,
participants returned to complete an additional posttest and construction task (Figure 5.3).
The circuit constructed for T1 was a circuit with two LEDs and one switch such that the
it alternated power between the LEDs (Appendix G). For T2, the circuit involved three
LEDs and one switch such that two LEDs were connected in series and the third was
powered by the switch (Appendix H). The test format for T1 and T2 were the same as for
T0 – five questions with four answer choices (Appendices I and J). Four of the questions
for both posttests were comparable to the questions in the initial posttest. The new
question for the T1 posttest asked participants to identify the circuit diagram for a
described circuit, while the new question for T2 asked participants to identify the issue
with a constructed circuit using two images. In addition for both T1 and T2, participants
completed a brief survey asking whether they had practiced building circuits or learned
more about circuits after T0 and T1, respectively. The T1 times for participants ranged
between 12 and 15 days. For the T2 participants they ranged from 26 to 29 days.

77
Figure 5.3. Timeline of Procedures for Dissertation Study
Results
Analysis
The data analysis was conducted using SPSS 22. Prior to analysis, the data was
evaluated to verify that it met the assumptions for an ANOVA. All analysis was
conducted at the alpha =.05 level. Outliers were identified using residuals, leverage
values and Cook’s Distance.
T0. ANOVAs were used to determine the main effects of the IVs (physical
fidelity) and covariates (cognitive ability, pretest scores, and goal orientation) on self-
efficacy, gain score, circuit design, circuit construction, and construction time. To
facilitate interpretation, continuous variables were categorized using median splits.
T1 – T2. Mixed model ANOVAs were used to determine the main effects of the
IVs (physical fidelity and time) and covariates (cognitive ability, pretest scores, goal
orientation, and engagement) on posttest scores, circuit design, circuit construction, and
construction time. Mixed models were used because the analysis included both between
subject and within subject variables.

78
For the retention analysis, only participants who were able to construct the circuit
correctly were invited to return for T1 and T2. Of the 70 participants in the study, 50
participants (71.4%) met the minimum proficiency requirements. However, only 40
participants continued for the retention analysis --14 participants in the physical
condition, 14 in the 2D condition and 12 in the 3D condition. Each participant completed
three sessions except for one who missed the second session and one who missed the
third session. Before T1 and T2, participants completed a two question retention survey
to determine whether they continued to learn about circuit concepts or practice
constructing circuits during the retention periods. The majority of these participants 37
(92.5%) were undergraduates, with a mean age of 20.18 years old (SD=2.15). Females
accounted for 50% of the participants. Approximately 83% (n=33) reported having very
little to no experience prior experience working with circuits.
T0 Results
A one-way ANOVA found no significant differences in the pretest scores of
participants in the three conditions, F(2, 69) = .945 p =.394. The one participant who
failed to report her SAT/ACT score was not included in this and subsequent analysis.
Self-efficacy (SE). One outlier was found and removed from the analysis, and one
participant did not complete the SE instrument for a total of 67 data points. The analysis
found no significant differences in the mean SE of the participants in the three conditions,
F(2, 66) = 2.53, p =.084.
Gain score. The mean pretest scores for all participants was .43 (SD = .22), and
the mean posttest score was .71 (SD =.25) for an average gain of .29 (SD =.26). Only the

79
pretest score was a significant predictor of gain score, F (1, 63) = 19.72, p =.003, (Table
5.1). Participants with a low pretest score (.40 or less) achieved higher gains than
participants with a high pretest score (above .40) (Table 5.2). The unique effective size
for pretest scores was sr2 = .115.
Design score. Four participants did not complete the design task. Two of these
participants withdrew from the study, and the other two could not complete the practice
activities and were withdrawn by the researcher. Two outliers were also removed from
the analysis. The mean design score for T0 was 87.31 (SD = 12.73). Only cognitive
ability, F(1,59) = 9.42, p =.012, was a significant predictor of design score (Table 5.3).
Participants with high cognitive ability scored 8.74 points higher than participants with
low cognitive ability (Table 5.4). The effect size for cognitive ability was sr2 = .083.
Table 5.1. ANOVA for Gain Score
Parameter Sum of Squares df
Mean Square F P-value
Intercept 1.609 1 1.609 29.097 .000 Fidelity .290 2 .145 2.620 .081 Pretest scores .525 1 .525 9.493 .003 LGO .060 1 .060 1.078 .303 Cognitive ability .168 1 .168 3.041 .086 Error 3.485 63 .055 Total 4.577 68 R Squared = .239 (Adjusted R Squared = .178)
Table 5.2. Comparison of Pretest Scores for Gain Scores
Mean Std.
Error
95% Confidence Interval Lower Bound
Upper Bound
Low pretest score .354 .036 .282 .426 High pretest score .172 .047 .078 .265

80
Table 5.3. ANOVA for Design Score
Parameter Sum of Squares df Mean Square F P-value
Intercept 479524.76 1 479524.76 2331.019 .000 Cognitive ability 1194.23 1 1194.23 5.805 .019 LGO 143.46 1 143.45 .697 .407 Condition 794.99 2 397.50 1.932 .154 Error 12137.16 59 205.71 Corrected Total 14430.98 63 R Squared = .159 (Adjusted R Squared = .102)
Table 5.4.Comparison of Cognitive Ability for Design Score
Mean Std.
Error
95% Confidence Interval Lower Bound
Upper Bound
Low cognitive ability 82.20 2.55 77.09 87.31 High cognitive ability 90.94 2.54 85.84 96.03
Construction time. Four participants did not complete the construction activity,
meaning a total of 65 observations were analyzed for construction time. The mean
construction time was 19.60 minutes (SD =10.16) (Table 5.5). The ANOVA conducted
found significant differences in construction time among participants based on fidelity,
F(2, 58) = 4.70, p =.013, and cognitive ability, F(2, 58) = 7.06, p =.010 (Table 5.6). Post
hoc analysis conducted using LSD found significant differences in construction time
between participants in the physical condition and those in the 2D condition (p=.007).
Participants with high cognitive ability constructed their circuits 6.54 minutes faster than
participants with low cognitive ability (Table 5.7). The effect size for fidelity was sr2 =
.214, and the effect size for the cognitive ability was sr2=.093.

81
Table 5.6. ANOVA for Construction Time
Parameter Sum of Squares df
Mean Square F P-value
Intercept 24583.93 1 24583.93 283.17 .000 Fidelity 816.43 2 408.22 4.70 .013 Cognitive Ability 613.05 1 613.05 7.06 .010 LGO 86.57 1 86.57 .997 .322 Condition * LGO 133.41 2 66.71 .768 .468 Error 5035.44 58 86.82 Total 6609.60 64 R Squared = .238 (Adjusted R Squared = .159)
Table 5.7. Contrast for Cognitive Ability for Construction Time Mean Std. Deviation N
Low cognitive ability 22.82 11.37 33 High cognitive ability 16.28 7.57 32
Construction. A multinomial logistic regression model found that design score (χ2
(2, N = 63) = 8.35, p=.005) and fidelity (χ2 (2, N = 63) = 7.33, p=.026) were significant
predictors of correct circuit construction (Table 5.8). The odds of constructing a circuit
without errors were 6.93 times higher [95% CI: .1.64, 35.41] for participants in the 2D
condition. The odds of constructing a circuit with no errors for participants with high
design scores were 5.21 times higher [95% CI: .1.63, 18.65] than for participants with
low design scores (Table 5.9).
Table 5.5. Mean Construction Time per Condition Condition Mean Std. Deviation N Physical 15.18 6.51 22 2D 23.19 9.98 21 3D 20.59 11.97 22 Total 19.60 10.16 65

82
Table 5.8. Tests of Model Effects for Design Score
Parameter Likelihood
Ratio χ2 df P-valueFidelity 7.33 2 .026 Cognitive ability 3.19 1 .074 Design score 7.87 1 .005 Construction time 2.17 1 .141
Table 5.9. Parameter Estimates for Design Score
Parameter B Std.
Error Hypothesis Test
Exp(B)
95% Profile Likelihood
Confidence Interval for Exp(B)
Wald χ2 df P-value Lower Upper Threshold Major errors .347 .707 .241 1 .623 1.42 .357 5.94
Minor errors 2.09 .754 7.67 1 .006 8.07 1.92 38.05 2D 1.94 .775 6.24 1 .012 6.93 1.64 35.41 3D .775 .669 1.34 1 .247 2.17 .600 8.48 High cognitive ability .916 .517 3.14 1 .076 2.50 .915 7.03 High design score 1.65 .616 7.20 1 .007 5.21 1.63 18.65 High construction time -.782 .539 2.12 1 .145 .458 .155 1.29
T0 – T2 Results
Posttest scores. The first learning outcome assessed over time was the posttest
scores. Two participants were removed from this analysis as a result of their responses on
the retention survey. A baseline model was run to calculate the overall mean of
participants’ posttest scores and the intraclass correlation (ICC), which measures the
percentage of the total variance between persons (intercept) and within persons (residual).
This model found that 30% of the variation occurred between subjects. Multilevel
analysis found that cognitive ability, F(1,40) =4.14, p=.048, and measurement occasion,

83
F(2, 34) =9.12, p=.001, were significant predictors of posttest scores (Table 5.10).
Participants with high cognitive ability scored an average of 10.40 points higher than
participants with low cognitive ability (Table 5.11). At T1, participants scored 17.37
points lower than participants at T0. Participants decreased by an additional 0.52 points at
T2 (Figure 5.4). Post hoc analysis conducted using LSD found that the differences in
means were significant between T0 and T1 (p=.001) and between T0 and T2 (p=.001).
Table 5.10. Test of Model Effects for Posttest Scores
Parameter Numerator
df Denominator
df F P-valueIntercept 1 56.34 532.39 .000 Cognitive ability 1 40.44 4.14 .048 LGO 1 40.44 .247 .622 Fidelity 2 40.44 .505 .607 Measurement occasion 2 32.58 9.12 .001
Table 5.11. Parameter Estimates for Posttest Scores
Parameter Estimate Std.
Error df T P-value95% Confidence Interval
Lower Bound Upper Bound Intercept 81.50 5.29 39.46 15.42 0.00 70.81 92.19 Cognitive ability -10.40 5.11 40.44 -2.04 0.05 -20.72 -0.08LGO -2.78 5.60 40.44 -0.50 0.62 -14.10 8.532D -0.26 6.60 40.44 -0.04 0.97 -13.60 13.07 3D 5.31 6.07 40.44 0.88 0.39 -6.95 17.57 T1 -17.37 4.81 33.78 -3.61 0.00 -27.15 -7.58T2 -17.89 4.72 33.04 -3.79 0.00 -27.50 -8.29

84
Figure 5.4. Posttest scores based on measurement occasion
Design score. For the analysis of the design score, one outlier was removed and
two additional participants were removed based on the retention survey (the same two
removed from the previous analysis). The ICC for design scores was 4.6%. Measurement
occasion was a significant predictor of this score, F(2, 33) = 20.604), p<.001 (Table
5.12). The mean score at T0 was 90.09, and participants lost 11.06 points at T1 and
another 8.27 points at T2 (Table 5.13). Post hoc analysis conducted using LSD found
significant differences between the design scores at T0 and T1 (p<.001), T0 and T2
(p<.001), and T1 and T2 (p<.007).
The interaction between measurement occasion and fidelity, F(4, 43) = 4.77, p
=.003, was also a significant predictor of design score (Table 5.12). In the physical
condition, participants had the highest mean design score (96.79, SD = 2.08) initially, but
this score declined steeply after two weeks (72.25, SD = 14.65) and again after 4-weeks
(65.92, SD = 21.74) so that these participants had the lowest scores at the end of the
76.84
59.47 58.95
40
50
60
70
80
90
100
Post 2 week 4 week
Posttest scores

85
retention period (Figure 5.5). The design scores for participants in the 2D condition
decreased more steadily from 88.15 (SD = 11.13) at T0 to 78.08 (SD = 17.22) at T2. In
the 3D conditions participants’ scores were fairly consistent after two weeks, 84.46
(SD=9.85) to 83.13 (12.50) but declined significantly after four weeks to 69.92
(SD=16.69).
Table 5.12. Tests of Fixed Effects for Design Score
Parameter Numerator
df Denominator
df F P-valueIntercept 1 38.161 2502.771 .000 Measurement occasion 2 41.789 24.239 .000 LGO 1 31.507 .047 .830 Cognitive ability 1 31.567 2.664 .113 Fidelity 2 39.094 .252 .779 Fidelity * Measurement occasion 4 54.182 5.899 .001
Table 5.13. Mean Design Score Based on Measurement Occasion
Measurement occasion Mean Std.
Deviation N T0 89.76 9.96 37 T1 78.31 13.73 36 T2 71.10 18.92 36 Total 79.81 16.43 109
Figure 5.5. Interaction between fidelity and measurement occasion for design score
6065707580859095
100
T0 (Post) T1 (2 week) T2 (4 week)
Mean Design Score Based on Condition Physical2D3D

86
Table 5.14. Parameter Estimates for Design Score
Parameter Estimate Std.
Error df t P-value
95% Confidence Interval Lower Bound
Upper Bound
Intercept 98.81 2.91 31.76 33.99 0.00 92.89 104.74 T1 -24.54 3.75 39.55 -6.55 0.00 -32.11 -16.97T2 -31.50 5.15 43.39 -6.11 0.00 -41.89 -21.11Low LGO 0.65 2.99 31.51 0.22 0.83 -5.44 6.73Low Cognitive ability -4.48 2.74 31.57 -1.63 0.11 -10.07 1.11 2D -9.44 3.76 30.91 -2.51 0.02 -17.10 -1.773D -12.33 3.55 29.64 -3.48 0.00 -19.58 -5.082D * T1 15.62 5.19 39.55 3.01 0.01 5.12 26.123D * T1 23.52 5.39 40.14 4.36 0.00 12.63 34.412D * T2 21.42 7.26 44.08 2.95 0.01 6.79 36.043D * T2 16.96 7.29 43.39 2.33 0.03 2.27 31.65
Construction time. The overall mean for construction time was 26.29 minutes
(SD =16.9), and the ICC for construction time was 26.5%. Only cognitive ability, F(1,
35) = 8.96, p =.005, was a significant predictor of construction time over the
measurement occasions (Table 5.15). Participants with lower cognitive ability took an
average of 9.8 minutes longer to construct their circuits than participants with high
cognitive ability (Table 5.16).
Table 5.15. Fixed Effects for Construction Time
Source Numerator
df Denominator
df F P-valueIntercept 1 40.97 230.55 .000 Measurement occasion 2 30.27 1.41 .260 Cognitive ability 1 35.08 8.96 .005 LGO 1 35.12 .000 .983 Fidelity 2 40.63 .995 .379 Fidelity * Measurement occasion 4 30.90 .949 .449

87
Table 5.16. Parameter Estimates for Construction Time
Parameter Estimate Std.
Error df t P-value
95% Confidence Interval Lower Bound
Upper Bound
Intercept 14.14 3.74 28.19 3.78 0.00 6.48 21.80 T2 6.14 4.38 27.67 1.40 0.17 -2.84 15.13 T1 8.71 4.67 32.73 1.87 0.07 -0.78 18.21 Low Cognitive ability 9.80 3.28 35.09 2.99 0.01 3.15 16.45 Low LGO 0.08 3.47 35.12 0.02 0.98 -6.98 7.13 3D 8.69 4.81 23.46 1.81 0.08 -1.25 18.63 2D 7.06 4.67 23.84 1.51 0.14 -2.58 16.69 2D * T1 -9.43 6.60 32.73 -1.43 0.16 -22.86 4.01 2D * T2 -10.87 6.20 27.69 -1.75 0.09 -23.57 1.83 3D * T1 -3.49 6.99 33.84 -0.50 0.62 -17.70 10.72 3D * T2 -6.56 6.36 27.11 -1.03 0.31 -19.61 6.48
Construction. At T0, 24 participants made no errors, and 16 made minor errors.
None of the 20 participants who made major errors at T0 participated in T1 or T2. From
T0 to T1, 78% of the participants who made no errors at T0 also made no errors at T1
(Figure 5.6). One participant who made no errors in T0 did not participant in T1. Of the
participants who minor errors at T0, 69% made no errors at T1. Four participants (25%)
who made minor errors at T0 made major errors at T1. Only 9% of participants made
major errors at T1 after making no errors at T0.
At T1, 28 participants made no errors, 4 participants made minor errors, and 6
participants made major errors. From T1 – T2, 68% of the participants who made no
errors at T1 did not make errors in T2 (Figure 5.7). All four participants who made minor
errors at T1 made no errors at T2. None of the participants who made no errors at T1
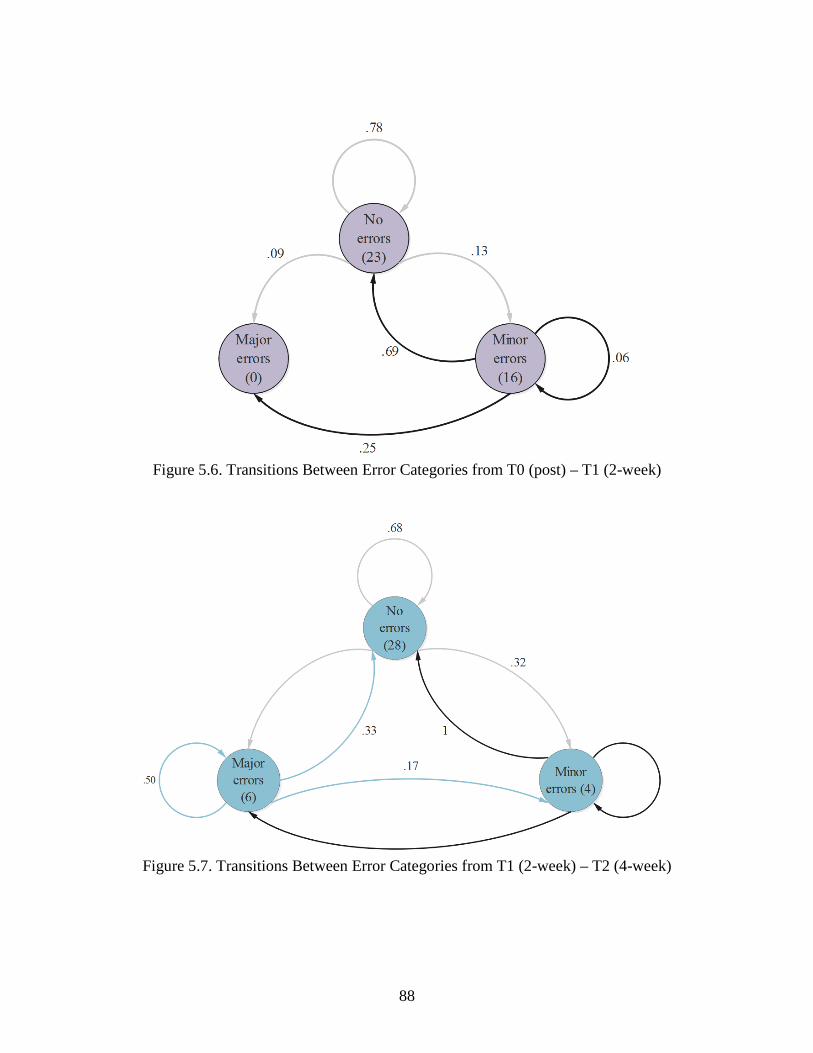
88
Figure 5.6. Transitions Between Error Categories from T0 (post) – T1 (2-week)
Figure 5.7. Transitions Between Error Categories from T1 (2-week) – T2 (4-week)

89
major errors at T2. Half of the participants who made majors errors at T1 also made
major errors at T2, 33% made no errors and 17% made minor errors. A multilevel
multinomial logistic regression for construction found that only LGO, F(2, 100) =3.532,
p =.033, was a significant predictor of construction over time (Table 5.17). Participants
with a lower than average LGO had 0.058 lower odds [95% CI : 0.004, 0.785] of
constructing their circuit without errors during the retention period.
Table 5.17. Fixed Effects for Circuit Construction
Source Numerator
df Denominator
df F P-valueModel 12 104 1.28 .240 Measurement occasion 4 104 1.20 .315 Cognitive ability 1 88 0.71 .496 LGO 2 104 3.53 .033 Fidelity 4 92 1.93 .112
Discussion
T0
This study investigated how learning in different levels of fidelity influenced
retention outcomes, an area that has seen little to no previous research. To explore this
issue, it first evaluated learning outcomes post-instruction before looking at the learning
outcomes again after 2-week and 4-week intervals.
Self-efficacy is an important learning outcome as it affects an individual’s effort
and persistence concerning a particular task (Zimmerman, 2000). Fidelity was not found
to be a significant predictor of this outcome, perhaps because of improvements in

90
instructional design. For example, in this study, all participants had the opportunity to
practice determining the value of the resistors and learned about differences between
working in the simulated and physical environments. These changes may have helped
participants feel more prepared to work in the physical environment.
In this study, only pretest scores were significant predictors of gain scores. In
general, posttest scores were higher than pretest scores for the participants, with
participants with lower pretest scores achieving higher gains across all conditions (Table
5.2). Similar to SE, these differences were potentially the result of improvements in the
design of the instruction. In the study, the practice questions the participants responded
to were in a separate section. If they answered incorrectly, the correct answer was
provided along with an explanation and a note about where to find the information in the
video lecture. This change allowed participants to become more active in their learning,
potentially helping them learn the material better and reducing the impact of cognitive
ability (Prince, 2004).
Only cognitive ability was a significant predictor of design score. The circuit
participants were required to design was a bit more complex than the ones used during
practice. As a result, although most participants probably understood how to draw a
circuit diagram in general, those with higher cognitive ability were able to draw the
required diagram with minor or no errors. This finding supports research on far transfer
which found that participants with higher intellect are better able to apply principles and
concepts they have learned to novel situations (Clark & Voogel, 1985).

91
Participants in the physical condition constructed their circuits faster than
participants in the 2D conditions. Participants who practiced with physical components
had the benefit of a higher level of fidelity, which facilitated the transition from practice
(Goldstein & Ford, 2002). The identical elements theory posits high positive transfer
when the instruction environment is identical to the performance environment as learners
are basically practicing the task which they will need to perform (Yamnill & McLean,
2001). Participants in the 2D and 3D conditions probably needed time to acclimate to the
nuances of working with physical components. Some of these nuances, which were
specifically described in the second study, included working with the smaller
components, having to physically manipulate components and insert them properly in the
breadboard, and adjusting to the breadboard orientation (Alfred, Lee, Neyens, &
Gramopadhye, 2016).
In terms of circuit construction, participants in the 2D condition in this study
exhibited higher odds of constructing their circuits without errors than the participants in
the other two conditions. This finding was not expected as identical elements theory
suggests that, similar to construction time, participants in the physical condition should
have the advantage because they practiced using a physical breadboard. Based on the
construction time, however, it is possible that participants in the 2D condition spent more
time working to submit their circuit without errors. So it appears that while 2D
participants took more time to construct their circuits, they constructed them correctly at
a rate comparable to, if not higher, than participants learning in the physical environment.

92
Overall, this study found significant improvements in learning outcomes for the
participants in the simulated environments. Revisions in the instructional design that
included making participants active learners and using scaffolding techniques potentially
contributed to increased self-efficacy, reduced construction time, and a higher success
rate for participants learning in the simulated environments.
T0 – T2
Of the 50 participants who completed their circuits with no or minor errors who
were invited to participant in the second part of the study, 40 participants completed the
4-week retention analysis. The non-qualification rate (20 out of 70) was highest in the 3D
condition (12) and it was also higher for women (15) than for men (5). One possible
cause for this is that the complexity of working in the 3D environment may have
increased the cognitive load for participants with limited experiences working in that type
of environment and the majority of women (60%) reported having little to no experience
working in the 3D environment. Differences in attrition could be related to the lower
spatial abilities of women (Feng, Spence, & Pratt, 2007). Women also exhibit lower self-
efficacy for engineering tasks (Marra et al., 2009). This may have also influenced their
perseverance and effort (Zimmerman, 2000). There were 10 additional participants who
qualified but elected not to return for the retention analysis. This resulted in a dropout
ratio of 20% which is not uncommon in longitudinal analysis.
The results found that the posttest scores exhibited a steep decline in retention
during the first two weeks, with the decay leveling off at the 4-week period. Design
scores decreased overall, but the rate of decline was different across the three conditions.
93
Construction time was not significantly different across measurement occasions, and
circuit construction was fairly consistent.
The posttest scores indicated that measurement occasion and cognitive ability
were significant predictors. Participants’ scores decreased by 16.5 points in 2-weeks and
by another point two weeks later as most participants incorrectly answered questions
related to the application of Ohm’s law and breadboard functionality. The trend in the
decrease of posttest scores was consistent with a typical decay curve which exhibits rapid
loss immediately after acquisition but a slower loss as the retention period increases
(O’Hara, 1990). Participants with high cognitive ability scored an average of 10 points
higher than participants with low cognitive ability, a finding consistent with past research
which has shown that cognitive ability is related to both learning and retention (Clark &
Voogel, 1985). Participants with high cognitive ability learn more and retain more than
participants with lower cognitive ability regardless of the learning environment.
The second cognitive outcome assessed was design score. Measurement occasion
and the interaction between measurement occasion and fidelity were significant
predictors. Overall, participants’ design scores decreased during the 4-week retention
period and there was greater variation in the scores than at T0. Like the posttest,
participants scores decreased because they were not applying Ohm’s law correctly and
also because they did not draw the diagram as specified. This result is consistent with
research that has found decay in cognitive learning outcomes (Arthur et al., 1998).
However, this decay curve did not follow the same pattern exhibited by the posttest
scores due to a moderation effect. The decrease in design scores at T1 and T2 were not

94
consistent across conditions (Figure 5.5). Participants in the physical condition had the
highest initial mean scores, but their scores dropped dramatically after two weeks and
dropped again after 4-weeks such that participants in this condition had the lowest mean
design score (65.02) of the three conditions at the end of the retention period. The design
scores for the participants in the 2D condition dropped from T0-T1 and then again less
steeply from T1-T2. These participants had the highest mean design score (78.08) at the
end of the four weeks. Participants in the 3D condition had the lowest mean design score
at T0, but their mean score did not decrease significantly from T0-T1. However, their
scores then dropped by 13 points to an average of 69.92 at the end of the four weeks. This
is an interesting moderation effect as it was not anticipated that the fidelity would
influence any of the cognitive outcomes because the instruction content was controlled
(Clark, 1994).
If learning in the simulated environments indeed helped participants with their
conceptual understanding, it seems that these effects should have also impacted their
initial design score, but this was not the case. One potential explanation for why the 2D
and 3D environments supported retention is that participants in these environments
engaged in additional practice that helped them retain the information. In the second
study, participants described using visualization and mental rehearsal prior to
constructing their circuits (Alfred et al., 2016). Research has found that mental practice is
an effective way to improve performance, particularly for cognitive tasks (Driskell &
Moran, 1994). These beneficial effects also include retention, although they decline over
time as well.

95
While participants in the physical condition constructed their circuit faster at T0,
the influence of fidelity on construction time declined. Fidelity was not a significant
predictor of construction time across measurement occasions; only cognitive ability. This
result may be related to both retention and far transfer. To be able to construct the circuit
correctly, participants needed to remember the basics of circuit construction – how the
breadboard and components work and how to choose the appropriate resistor. Participants
also needed to be able to apply Ohm’s law to different types of circuit connections –
series, parallel, and combination. Participants with high cognitive ability were able to do
this faster because they retained more of the information related to circuit construction or
were better able to apply what they had learned to build a new circuit while participants
with low cognitive ability may have had to remind themselves of this information
through trial and error.
In general, once participants understood how to construct the circuit they were
able to continue to do so with minimal errors in spite of the condition in which they
originally learned. Following T0, only six participants made major errors in their
construction during T1. Of the six participants, three were in the 3D condition, two were
in the 2D condition, and one was in the physical condition. Only three of those
participants again made major errors in their circuits in T2, one participant from each
condition, and only learning goal orientation was a significant predictor of constructing
circuits without errors over the retention period. In this study, LGO was not a significant
predictor of any of the other learning outcomes. Prior research has found, however, that
an orientation towards learning goals helps with construction because it encourages

96
learners to acquire the knowledge and skills required for competency. An LGO also
fosters a desire to explore relationships in greater depth and helps participants build their
self-efficacy (Kozlowski et al., 2001).
Limitations
There are several limitations associated with this study. First, because participants
had to achieve a minimum level of proficiency for the retention analysis, the sample size
was reduced from 70 to 40, and as a result, the power of the analysis was not ideal. The
number of participants in each condition was unequal, meaning the design was also
unbalanced. Due to a higher dropout rate in the 3D environment, the last 10 participants
had a higher probability of being in the 3D condition as more participants were needed
for the retention analysis. The proficiency requirement reduced the variation in the
sample to include participants who performed higher; thus, the data for the retention
analysis at T0 were positively skewed. In addition, the majority of the participants were
freshmen and sophomores so this potentially limits the generalizability of the results.
Although efforts were made to address various issues with the simulation
software through revisions to the instructional design, there were still characteristics of
both the 2D and 3D simulations that may have been detrimental to participants’
performance. For example, neither the 2D nor 3D environment incorporated a battery
holster; as a result, participants had to figure out how to connect the holster during the
construction task, a situation that probably increased their construction time and may
have resulted in issues with their circuit if they did not align the positive and negative
terminals of the holster correctly. Additionally, the 3D environment had a dual view with

97
the completed schematic on one tab and the breadboard on the other tab and it allowed
participants to verify that their circuit components were connected correctly using
feedback provided on the schematic view. This feature was not present in the 2D
environment as both the 3D and the 2D software were purchased off the shelf.
At T1, 13 participants did not complete the retention survey, and 10 did not
complete the retention survey at T2. As a result, the researcher was unaware if they
continued to study circuits outside of the research environment, potentially impacting the
retention results. However, the overall trends and findings from the retention analysis are
consistent with the existing literature on retention and skill decay.
Conclusions
Supporting the findings of Arthur et al. (1998), this study found a greater level of
decay in the outcomes evaluated cognitively than those evaluated behaviorally. Although
the majority of participants could construct the circuit correctly, they exhibited less
proficiency in designing their circuit and performing the requisite calculations for their
circuit diagram at T2. This conclusion was reflected in the learning outcomes assessed.
Participants’ posttest scores and design scores decreased over time while their
construction time and circuit construction remained relatively stable. Learner
characteristics seemed to have more influence when in the evaluation of the retention
outcomes while the effects of the fidelity, as a main effect, became insignificant for most
of the learning outcomes. The interaction between fidelity and measurement occasion for
the design scores suggests that fidelity may also influence participants’ conceptual

98
understanding. Participants in the simulated environments had higher design scores at the
end of the retention period.
Chapter Summary
This chapter addressed the third aim of this research by exploring how the
physical fidelity of the instructional environment impacted retention outcomes and how
this relationship was influenced by cognitive ability and learning goal orientation. First,
the analysis focused on the cross-sectional outcomes to understand the effects of the IVs
immediately after instruction; subsequently, it focused on changes in these outcomes over
a 4-week period. The analysis found the fidelity of the learning environment affected
circuit construction and construction time post instruction (T0) but not during the
retention period. Cognitive ability significantly predicted construction time post
instruction and during the retention period while LGO only influenced circuit
construction over time. Posttest scores and design scores both decreased significantly
during the retention period. This analysis also provided evidence that improvements in
the instructional design can yield significant improvements in the learning outcomes for
participants learning in simulated environments.

99
CHAPTER SIX
CONCLUSIONS, BROADER IMPACTS, AND FUTURE RESEARCH
The three primary aims of this research were to identify how the physical fidelity
of the learning environment impacted instructional (learning and retention) and transfer
outcomes and whether these relationships were influenced by learner characteristics. This
research also explored how the transition from the simulated environment to the physical
one affected participants’ construction process for an electrical circuit and the learning
outcomes they achieved. The first study addressed Aim 1, the second Aim 2, and the
third Aim 3 as seen in Figure 6.1 below.
Figure 6.1. Research aims
Overall discussion
The analysis of the results from the first study found that the physical fidelity of
the learning environment impacted the affective (self-efficacy) and skill-based learning
outcomes (construction and construction time) for participants learning to construct a

100
simple circuit on a breadboard. More specifically, participants learning in the physical
environment had a higher self-efficacy and shorter construction time, and were more
likely to construct their circuit without errors than participants in the simulated
environments. Although these findings suggest learning using the physical components
was superior, the study also found evidence of transfer for participants who learned using
the 2D and 3D simulations. Approximately 41% of participants (12 of 29) in the
simulated environments who attempted construction were able to effectively transition
into the physical workspace despite differences in the environments and issues with the
instructional design. While the fidelity influenced the affective and skill-based outcomes,
learner characteristics impacted the cognitive outcomes (gain score and design score).
Cognitive ability was a significant factor for both outcomes, and an interaction effect was
also found between fidelity and LGO for construction time, suggesting that evaluating
learner characteristics may help improve results when selecting the learning environment.
The analysis of the results from the second study found that the physical fidelity
of the learning environment impacted the participants’ affect, strategies, and tactics
concerning the circuit construction process. Participants experienced some level of
isolation, intimidation or pressure when they transitioned from the 2D and 3D conditions
to the physical environment. Although most participants using the simulations enjoyed
practicing in those conditions, learning to construct a circuit in those conditions was
associated with knowledge gaps, inability to identify and troubleshoot issues, and
increased levels of negative affect that hurt performance. Some participants suggested
that simulations are best used as a supplement to help conceptual understanding.

101
However, the limitations of the environment were created by the software, not innate
features of simulated learning, meaning that both the 2D and 3D simulations can facilitate
the transition with minor changes in the design. In addition, these environments can also
facilitate transfer by helping participants understand differences they may encounter in
the physical environment. However, the transition to the physical environment should not
be in a test environment as it can create unnecessary stress and anxiety as found in the
second study. These negative emotions, in turn, incurred cognitive resources that
potentially detracted from performance (Valiente et al., 2012).
The analysis of the results from the third study demonstrated that while the
fidelity of the learning environment impacted construction and construction time initially,
the differences decreased over time. The retention analysis indicated no significant main
effects for fidelity only an interaction effect with measurement occasion for the design
score, suggesting that once the participants became proficient at constructing the circuit,
the original learning environment was no longer relevant. However, the interaction effect
suggests that the learning environment may continue to influence cognitive outcomes.
Learner characteristics, specifically cognitive ability, were found to be a significant
predictor of both learning (design score) and retention (posttest score, construction time)
outcomes. More specifically, learning goal orientation (LGO) predicted circuit
construction, and the measurement occasion was a significant factor in the participants’
posttest scores and design scores. Although the majority of participants could construct
the circuit correctly, they exhibited less proficiency in designing their circuits and
performing the requisite calculations for their circuit diagram. Posttest scores exhibited

102
the behavior of a typical decay curve, a rapid decline initially followed by a less steep
one over time (Arthur et al., 1998).
Design scores decreased overall, but the rate of decline was different across the
three conditions. The interaction between fidelity and measurement occasion for design
score suggested that fidelity may also influence participants’ conceptual understanding.
Early research on computer-based learning environments found evidence supporting that
these environments can be used as “cognitive tools for learning” (Lajoie 1993, p. 285).
Because the simulations used in the study did not offer some of the typical advantages of
simulations such as displaying invisible phenomena and increased interactivity, it was
hypothesized that the mental rehearsal and visualization used by participants who learned
in this environment supported retention of the concepts related to circuit design (Alfred et
al., 2016). Construction time was not significantly different across measurement
occasions, and circuit construction was also fairly consistent, these findings from the
retention analysis supporting Arthur et al. (1998), who found that cognitive outcomes
decay more rapidly than physical ones and that outcomes assessed cognitively will
demonstrate more decay than those assessed behaviorally.
The analysis of the first experiment found in Chapter 3 and the second in Chapter
5 found both consistent and conflicting results. Unlike in the first experiment, fidelity
was not found a significant predictor of self-efficacy (SE) in experiment two. While
participants in the physical and 3D conditions had similar SE in the studies, participants
in the 2D condition had a much higher post instruction SE (Figure 6.2) in the second
study. These differences were potentially attributable to improvements in the

103
instructional design - specifically providing the 2D participants with transition notes and
allowing them to practice reading resistors – that helped them to feel more confident in
their ability to work with circuits. These differences in SE may also be attributable to
differences in the participant profiles. Although the gender ratio was comparable and
most participants in both studies had little to no prior experience working with circuits,
the second experiment involved a younger predominantly undergraduate participant
population, their age potentially influencing their experience and comfort working in
simulated environments.
In the first study, both cognitive ability and pretest scores impacted gain scores,
with the latter having the higher unique effect size. In the second experiment, only pretest
scores were a significant predictor of gain score (Table 5.1). Another change made in the
second experiment was to include 2-3 practice exercises after each video lecture. Having
participants complete these activities helped make them active learners (Prince, 2004).
This change may also have offset the gains attributable to cognitive ability. For both
studies, cognitive ability was also the only significant predictor of design score, a result
that was expected as both studies used the same construction activity. In both participants
with a high cognitive ability were better able to design the specified circuit than those
with a lower one.

104
Figure 6.2. Comparison of mean SE by condition between experiment 1 and 2
Table 6.1. Comparison of mean construction time per condition Experiment 1 Experiment 2
Condition Mean N Std.
Deviation Mean N Std.
Deviation Physical 15.47 15 12.39 15.18 22 6.51 2D 29.88 16 14.76 23.19 21 9.98 3D 30.43 13 16.91 20.59 22 11.97
In addition, consistent with the first study, the second experiment also found that
fidelity was a significant predictor of construction time and correct circuit construction.
In the first experiment, the participants in the physical condition constructed their circuits
in half the time as those in the 2D and 3D environments (Table 6.1). In experiment two,
the construction time among the participants was closer in range, with only participants in
4.36
3.76 3.93
3
3.5
4
4.5
5
Physical 2D 3DM
ean
Self-
effic
acy
Participant SE - Experiment 1
4.31 4.17 3.95
3
3.5
4
4.5
5
Physical 2D 3D
Mea
n Se
lf-E
ffic
acy
Participant SE - Experiment 2

105
the 2D condition constructing their circuit significantly slower than those in the physical
condition. However, overall, the participants in experiment two constructed their circuits
faster than those in the first study. These differences in construction time were, in part,
due to the fact that participants in the simulated environment in experiment one spent
several minutes trying to determine the resistance of the through-hole resistors (Alfred,
Lee, Neyens, & Gramopadhye, under review). Video data analysis also found that
participants in the physical condition took a more methodical approach to circuit
construction while participants in the 2D and 3D conditions employed a trial-and-error
approach, which resulted in a higher mean construction time for these participants.
The video lecture for the first study showed participants how to read a resistor and
included an embedded practice activity. In experiment two, all participants saw this
demonstration and took part in a practice activity in which they were required to find the
value of physical through-hole resistors. This was one form of scaffolding that was
incorporated into the experiment two to facilitate transfer for participants learning in the
simulated environments. This change probably reduced the construction time for
participants in the simulated environments. In the first study, LGO also moderated the
relationship between fidelity and construction time. This effect, however, was not found
in experiment two.
The two experiments also found differences in circuit construction among the
participants in the three conditions. As previously mentioned, the initial construction task
was the same for both experiments. In experiment two, participants in the 2D condition
had higher odds of constructing their circuit without errors. This finding may be related

106
to their longer construction time. They may have simply spent more time working to
ensure their circuit was correct. The first experiment did not find significant differences
in the odds of constructing a circuit without error for participants in the physical (11) and
2D conditions (8). Participants in the 3D condition, however, had lower odds, .064 times
[95% CI: .003, .617], than participants in the physical condition. In the second
experiment, these participants constructed their circuits without error at a comparable rate
to participants in the physical condition and at a time that was not significantly different.
However, in both experiments, only participants in the 3D condition dropped out or were
withdrawn because they could not complete the practice activities – 3 in experiment one
and 4 in experiment two. Some participants struggled to work in the 3D environment.
The environment may have added an extraneous load, explaining why it would have been
detrimental to learning and why some participants could not establish proficiency (Paas
& Sweller, 2014). In the first experiment, the participants who dropped had very little
experience working with circuits but at least a little experience working in 3D
environments. In the second experiment, all the participants who dropped had no
experience working with circuits, and three reported having no experience working in 3D
environments, with the fourth having very little. Prior research has found that the
increased complexity of 3D environments may make it difficult for students to interact
with it and beginners in particular may struggle to comprehend all the information being
conveyed (Stuerzlinger & Wingrave, 2011; Gillet et al., 2013).
107
Conclusions
This research found that fidelity impacted skill-based learning outcomes while the
learner characteristics, particularly cognitive ability, impacted both cognitive and skill-
based learning outcomes. The improvements in the performance of participants in the
second study demonstrated that instructional design is particularly important for
participants learning in simulated learning environments. In addition to good
instructional design, simulated learning environments should account for individual
differences and try to minimize the cognitive load for learners when they transition to the
real-world environment. This may be particularly important for participants who do not
have as much experience or exposure to simulated environments. Over time, the effect of
fidelity faded, but cognitive ability remained a significant predictor. This finding
suggested that once participants understood how to construct a circuit, the condition they
originally learned in was no longer a factor in their circuit construction and time.
However, learning in the 2D or 3D simulations potentially helped students develop a
stronger conceptual understanding that supported retention.
Another finding from this analysis was that learning to construct a circuit in a 3D
environment offered no advantage over the 2D simulation. Constructing a circuit is
primarily a 2D task, so working in a 3D environment may add no value and this may be
the case for 2D tasks in general. Participants in these two conditions were comparable in
terms of affective (self-efficacy) and skill-based outcomes (construction time). However,
participants in the 2D environment had higher odds of constructing their circuit correctly
in both experiments than those who learned in the 3D environment. Also, 2D

108
environments are typically less expensive to develop and maintain and can operate on
less powerful computers.
Based on the results, some acclimation to the physical environment would be
beneficial for learners using a simulated environment. The second experiment found that
improvements in the instructional design led to improved learning and transfer outcomes
for participants who learned in these environments. However, further enhancements in
both the 2D and 3D simulations could further facilitate the transition. In general, because
simulated environments represent an abstraction of reality, designers have to decide
which simplifications a simulation should employ to support learning outcomes without
negatively impacting transfer and retention. For example, both the 2D and 3D
environments should force learners to practice reading resistors from a resistance
calculation sheet as opposed to typing in the value and the 2D condition could allow
learners to orient the breadboard horizontally or vertically depending on their preference.
Additionally, learners should be allowed to operate in the physical environment without
the immediate pressure of performance as doing so could potentially ease the anxiety and
pressure participants described in the second study.
Despite learners’ having to make some adjustments, simulated laboratories have
several practical benefits over physical laboratories. Simulated laboratories can be
offered in an online setting and do not require the equipment and facilities needed for
physical laboratories. The maintenance costs for these environments may also be lower
than physical laboratories. Further, learners have increased access as instructors and/or
teaching assistants do not need to be present. Finally, simulated environments can address

109
the safety concern as well as cost, two factors which may limit the students’ ability to
experiment and explore using the physical tools and equipment.
Broader Impacts and Research Contributions
Non-traditional students wanting a technical degree may be constrained to course
offerings at their nearest educational institution because few institutions currently offer
technical curricula in online settings. The results of this research have implications for the
design and implementation of simulations in instructional settings, particularly for
technical tasks. The findings provide insights about how tasks can be taught effectively in
simulated environments as well as information about how the physical fidelity of the
learning environment impacts learning outcomes. In the first study, participants who
learned to construct the circuit using the physical components achieved better results than
those who learned in either the 2D or 3D simulation. With a few minor modifications in
the instructional content, the third study found comparable results between participants in
the 2D simulation and the physical conditions, while participants in the 3D simulation,
although improved, still demonstrated the lowest level of proficiency. These findings
have important implications for access to educational opportunities. In addition to
increasing the number and range of courses that can be taught in an online setting, it can
potentially attract and retain student populations – older, minority, full-time workers-
with high dropout rates (Hirschy et al., 2011). These students are likely to enroll in online
courses. This setting can also help provide educational opportunities to students, such as
those living in rural areas, who also have limited access to different programs due to their
geographic locations. With the push for free community college gaining traction around

110
the country and with states such as Tennessee and Oregon already offering this option,
well-designed simulated learning environments represent an opportunity to support
engineering and technical education in this climate. Additionally, simulated labs can
provide learning opportunities to students in impoverished school districts that cannot
fund the labs and required materials or offer online courses for their students.
This research also has implications for personalized education. Advanced
personalized education has been identified as one of the grand engineering challenges
developed by the National Academy of Engineering (“NAE Grand Challenges for
Engineering,” 2016). In addition to identifying the impact of physical fidelity on learning
outcomes, this research also sought to understand how specific learner characteristics
interacted with the relationship between physical fidelity and learning outcomes. As
technology continues to become more prominent in education, it will become
increasingly more important to understand not just whether it is effective but for what
tasks and for which individuals it is most effective. This research begins to answer these
questions by providing evidence about how the cognitive ability and goal orientation of
the learner impacted the effectiveness of the learning in simulated environments.
Directions for future work
While most previous research conducted on simulated learning environments has
concentrated on conceptual learning, this research focused on the use of simulated
environments to develop technical skills. However, it is just a first step, with several key
areas requiring future study. First, future research should continue to investigate the use
of simulated environments for technical tasks, evaluating whether the findings from this
111
study are consistent across different tasks. The nature of the task probably influences its
ability to be learned effectively in an online environment. For example, hands-on tasks,
such as welding, with a strong motor component could result in different transfer
outcomes. Secondly, because the relationship between the physical fidelity of the
learning environment and transfer may be dependent on the specific characteristics of the
learner, such as current skill level (Alexander et al., 2005), it is also important to continue
to investigate the relative importance of these characteristics. In addition, because the
appropriate level of fidelity may change depending on specific task characteristics or the
learner’s progress, researchers should investigate varying the level of fidelity to
determine its influences on instructional and transfer outcomes at different stages in the
learning process.
One of the unanticipated findings from the analysis concerned the emotional
transition participants faced when moving from the simulated environments to the real-
world environment. The research found that participants learning in the simulated
environments experienced feelings of isolation and anxiety when they transitioned to
working with physical components. Although self-efficacy was measured following
instruction, it appeared that self-efficacy evolved during the construction process with
some learners losing confidence in their ability to construct the circuit. In addition to
identifying the appropriate level of fidelity required to achieve the desired level of
proficiency and skill transfer in learners, instructors and designers also have to consider
the emotional transition learners must manage as they transition from the simulated
environments to the physical environment. For the research task, how they managed these

112
emotions was less crucial for their success, but for critical tasks it will be very important
to help learners manage their emotions and maintain their self-efficacy through this
transition. Future work should examine the affect of students as they learn a skill in a
simulated environment and how their emotions evolve as they attempt to transfer skills
learned in simulated environments to real-world applications.

113
APPENDICES
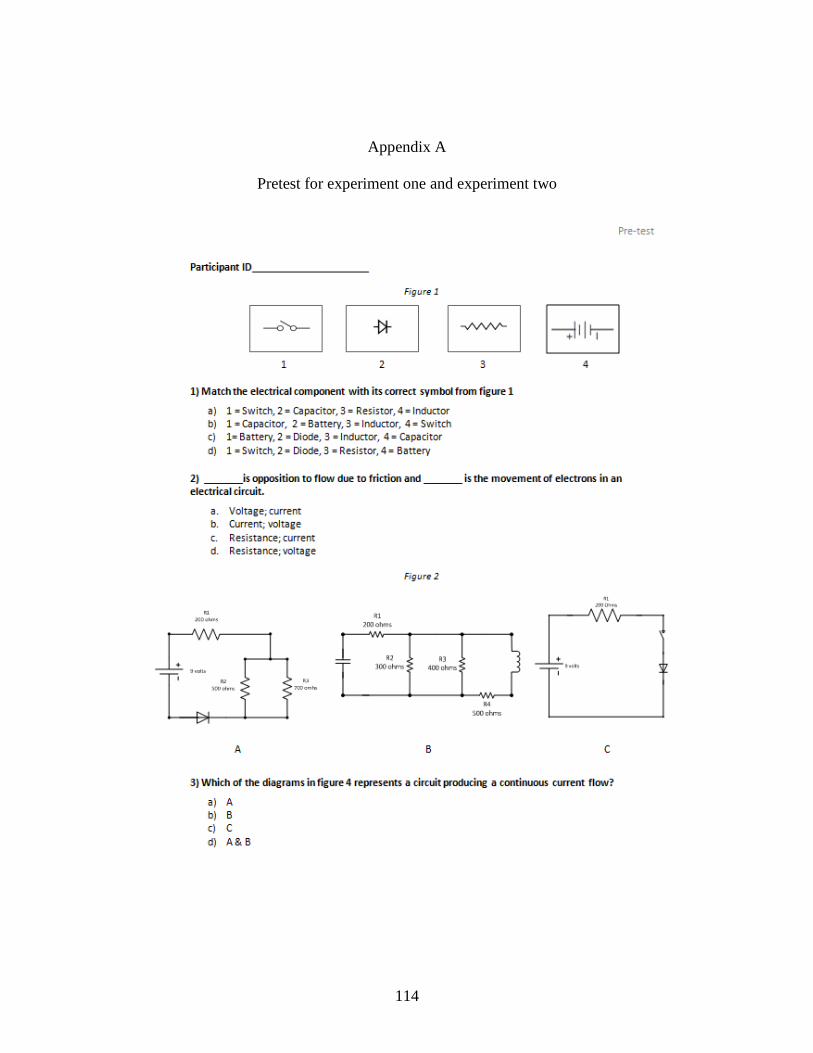
114
Appendix A
Pretest for experiment one and experiment two

115

116
Appendix B
Demographic survey

117

118
Appendix C
Goal Orientation Survey

119

120
Appendix D
Post instruction self-efficacy instrument
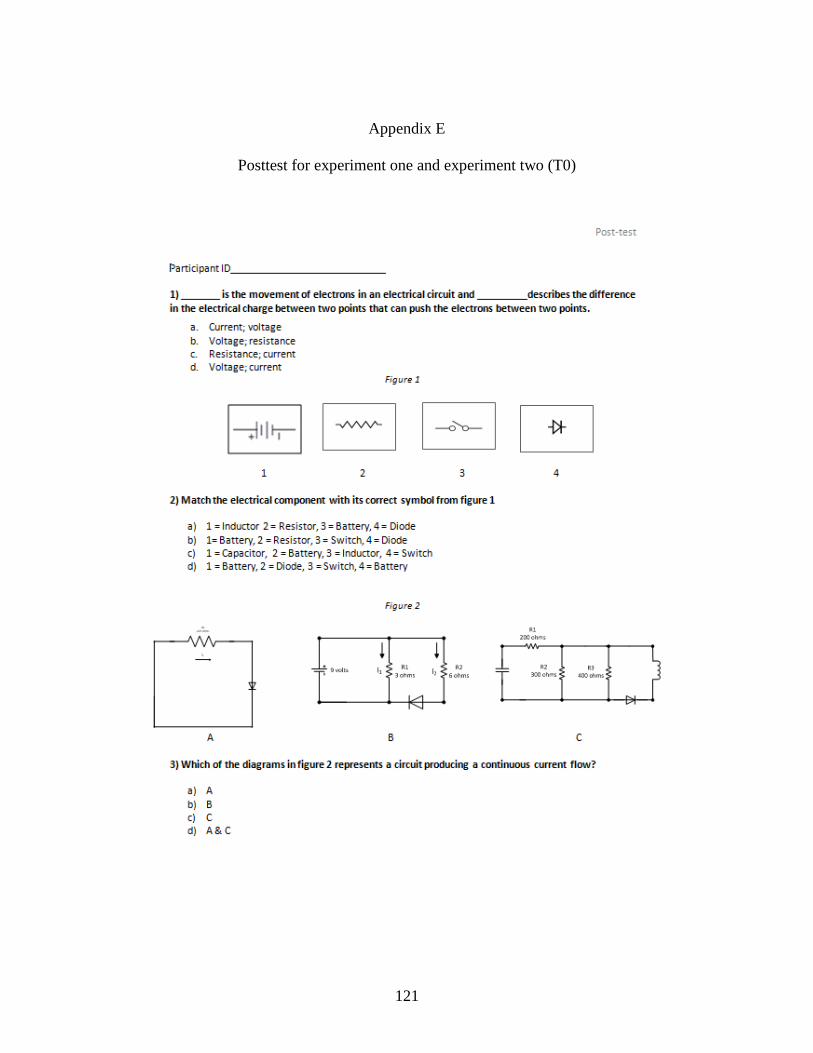
121
Appendix E
Posttest for experiment one and experiment two (T0)

122

123
Appendix F
Construction task for experiment one and experiment three (T0)

124
Appendix G
Construction task (T1)
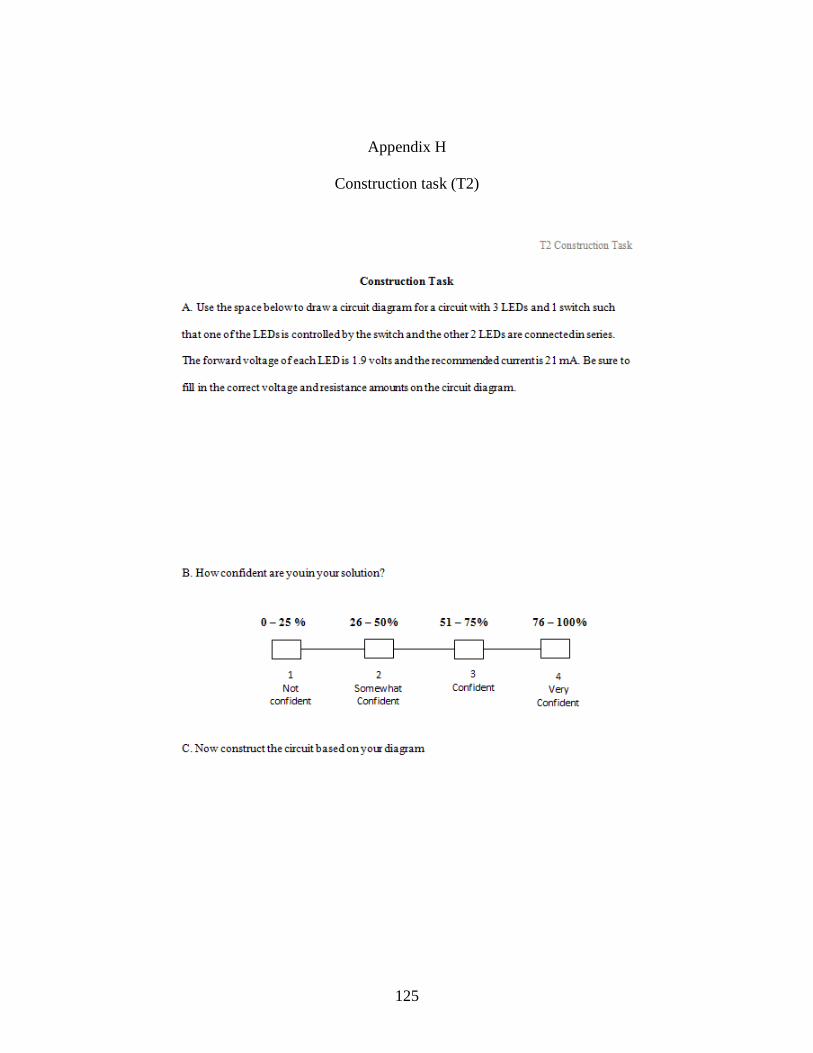
125
Appendix H
Construction task (T2)

126
Appendix I
Posttest (T1)
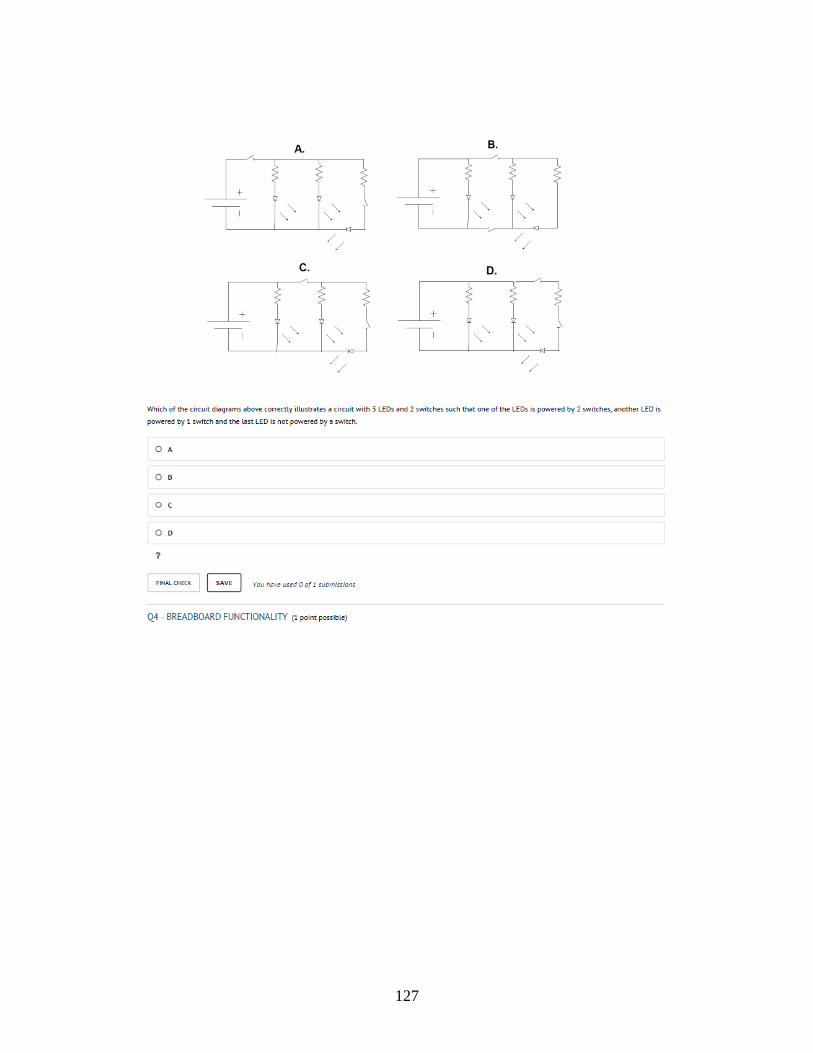
127
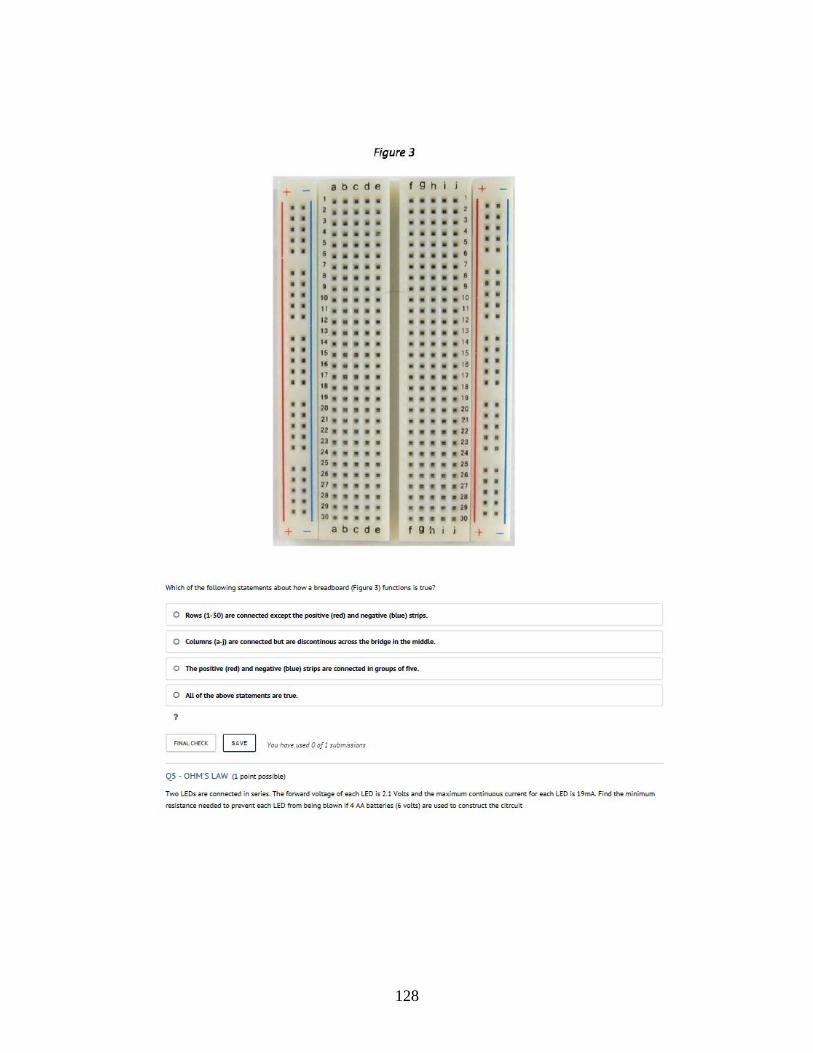
128

129

130
Appendix J
Posttest (T2)

131

132

133
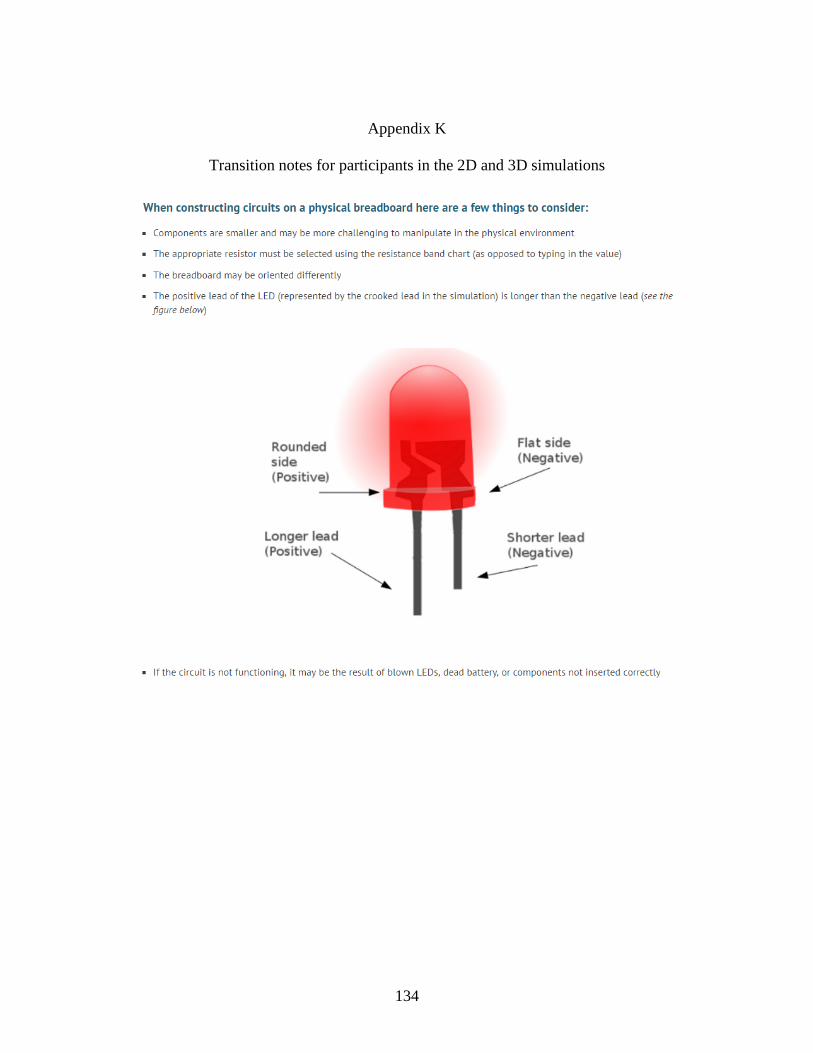
134
Appendix K
Transition notes for participants in the 2D and 3D simulations

135
REFERENCES
Adams, W. K., Reid, S., LeMaster, R., McKagan, S. B., Perkins, K. K., Dubson, M., & Wieman, C. E. (2008). A study of educational simulations part 1-engagement and learning. Journal of Interactive Learning Research, 19(3), 397.
Alexander, A. L., Brunyé, T., Sidman, J., & Weil, S. A. (2005). From gaming to training: A review of studies on fidelity, immersion, presence, and buy-in and their effects on transfer in pc-based simulations and games. DARWARS Training Impact Group, 5, 1-14.
Alfred, M. C., & Lee, M. B., & Neyens, D. M., & Gramopadhye, A. K. (2016). Understanding Learner’s Mental Models of a Task as Shaped by the Physical Fidelity of a Learning Environment Paper presented at 2016 ASEE Annual Conference & Exposition, New Orleans, Louisiana. 10.18260/p.27101
Alfred, M. C., & Lee, M. B., & Neyens, D. M., & Gramopadhye, A. K. (under review). Learning in Simulated Environments: A Comparison to Learning in a Physical Environments Using Video Data Analysis. Submitted to the Human Factors and Ergonomics 61st Annual Meeting, Austin, TX.
Alfred, M., D.M. Neyens & A. Gramopadhye (2015). The Impact of Training Methods on Skill Acquisition and Transfer. Proceedings of the Human Factors and Ergonomics Society 59th Annual Meeting, Los Angeles, CA.
Allen, I. E., & Seaman, J. (2006). Growing by degrees: Online education in the United States, 2005. Sloan Consortium (NJ1).
Allen, I. E., & Seaman, J. (2007). Making the grade: Online education in the United States, 2006. Sloan Consortium. PO Box 1238, Newburyport, MA 01950.
Anderson, J. R. (1982). Acquisition of cognitive skill. Psychological review,89(4), 369. Arthur Jr, W., Bennett Jr, W., Stanush, P. L., & McNelly, T. L. (1998). Factors that
influence skill decay and retention: A quantitative review and analysis. Human performance, 11(1), 57-101.
Bernard, R. M., Abrami, P. C., Lou, Y., Borokhovski, E., Wade, A., Wozney, L., ... & Huang, B. (2004). How does distance education compare with classroom instruction? A meta-analysis of the empirical literature. Review of educational research, 74(3), 379-439.
Bourne, J., Harris, D., & Mayadas, F. (2005). Online engineering education: Learning anywhere, anytime. Journal of Engineering Education, 94(1), 131.
Brett, J. F., & VandeWalle, D. (1999). Goal orientation and goal content as predictors of performance in a training program. Journal of Applied Psychology, 84(6), 863.
Campbell, J. O., Bourne, J. R., Mosterman, P. J., & Brodersen, A. J. (2002). The effectiveness of learning simulations for electronic laboratories. Journal of Engineering Education, 91(1), 81-87
Clark. R.E (1994). Media will never influence learning. Educational technology research and development, 42(2), 21-29.
Clark, R. E., & Voogel, A. (1985). Transfer of training principles for instructional design. ECTJ, 33(2), 113-123.

136
Couture, M. (2004). Realism in the design process and credibility of a simulation‐based virtual laboratory. Journal of Computer Assisted Learning, 20(1), 40-49.
Cronbach, L. J., & Snow, R. E. (1977). Aptitudes and instructional methods: A handbook for research on interactions. Irvington.
Dalgarno, B., Bishop, A. G., Adlong, W., & Bedgood, D. R. (2009). Effectiveness of a virtual laboratory as a preparatory resource for distance education chemistry students. Computers & Education, 53(3), 853-865.
De Raad, B., & Schouwenburg, H. C. (1996). Personality in learning and education: A review. European Journal of personality, 10(5), 303-336.
Dorans, N. J. (1999). Correspondences between ACT™ and SAT® I scores. ETS Research Report Series, 1999(1), i-18.
Driskell, J. E., Copper, C., & Moran, A. (1994). Does mental practice enhance performance?.
Elliott, E. S., & Dweck, C. S. (1988). Goals: an approach to motivation and achievement. Journal of personality and social psychology, 54(1), 5.
Farr, M. J. (1986). The long-term retention of knowledge and skills: a cognitive and instructional perspective (No. IDA-M-205). INSTITUTE FOR DEFENSE ANALYSES ALEXANDRIA VA.
Feisel, L. D., & Rosa, A. J. (2005). The role of the laboratory in undergraduate engineering education. Journal of Engineering Education,94(1), 121-130.
Feng, J., Spence, I., & Pratt, J. (2007). Playing an action video game reduces gender differences in spatial cognition. Psychological science, 18(10), 850-855.
Goldstein, I. L., & Ford, J. K. (2002). Training in organizations: Needs assessment, development, and evaluation Wadsworth. Belmont, CA.
Goodman, J. S., & Wood, R. E. (2004). Feedback specificity, learning opportunities, and learning. Journal of Applied Psychology, 89(5), 809..
Goodman, J. S., Wood, R. E., & Hendrickx, M. (2004). Feedback specificity, exploration, and learning. Journal of Applied Psychology, 89(2), 248.
Guthrie, J. P., & Schwoerer, C. E. (1994). Individual and contextual influences on self-assessed training needs. Journal of Organizational Behavior, 15(5), 405-422.
Heimbeck, D., Frese, M., Sonnentag, S., & Keith, N. (2003). Integrating errors into the training process: The function of error management instructions and the role of goal orientation. Personnel Psychology, 56(2), 333-361.
Henderson, M., Selwyn, N., & Aston, R. (2015). What works and why? Student perceptions of ‘useful’digital technology in university teaching and learning. Studies in Higher Education, 1-13.
Hirschy, A. S., Bremer, C. D., & Castellano, M. (2011). Career and Technical Education (CTE) Student Success in Community Colleges A Conceptual Model. Community College Review, 39(3), 296-318.
Hochmitz, I., & Yuviler-Gavish, N. (2011). Physical fidelity versus cognitive fidelity training in procedural skills acquisition. Human Factors: The Journal of the Human Factors and Ergonomics Society, 53(5), 489-501.

137
Jaakkola, T., & Nurmi, S. (2008). Fostering elementary school students’ understanding of simple electricity by combining simulation and laboratory activities. Journal of Computer Assisted Learning, 24(4), 271-283.
Jaakkola, T., Nurmi, S., & Veermans, K. (2011). A comparison of students' conceptual understanding of electric circuits in simulation only and simulation‐laboratory contexts. Journal of research in science teaching, 48(1), 71-93.
Kensinger, E. A. (2004). Remembering emotional experiences: The contribution of valence and arousal. Reviews in the Neurosciences, 15(4), 241-252.
Kenyon, R. V., & Afenya, M. B. (1995). Training in virtual and real environments. Annals of Biomedical Engineering, 23(4), 445-455.
Kim, J., Lee, A., & Ryu, H. (2013). Personality and its effects on learning performance: Design guidelines for an adaptive e-learning system based on a user model. International Journal of Industrial Ergonomics, 43(5), 450-461.
Koenig, K. A., Frey, M. C., & Detterman, D. K. (2008). ACT and general cognitive ability. Intelligence, 36(2), 153-160.
Kozlowski, S. W., Gully, S. M., Brown, K. G., Salas, E., Smith, E. M., & Nason, E. R. (2001). Effects of training goals and goal orientation traits on multidimensional training outcomes and performance adaptability. Organizational behavior and human decision processes, 85(1), 1-31.
Kraiger, K., Ford, J. K., & Salas, E. (1993). Application of cognitive, skill-based, and affective theories of learning outcomes to new methods of training evaluation. Journal of applied psychology, 78(2), 311.
Krueger, M. W. (1991). Artificial Reality II. Reading: Addison-Wesley. Lajoie, S. P. (1993). Computer environments as cognitive tools for enhancing learning.
Computers as cognitive tools, 261-288. Marra, R. M., Rodgers, K. A., Shen, D., & Bogue, B. (2009). Women engineering
students and self-efficacy: A multi-year, multi-institution study of women engineering student self-efficacy. Journal of Engineering Education, 98(1), 27.
Martínez-Jiménez, P., Pontes-Pedrajas, A., Climent-Bellido, M. S., & Polo, J. (2003). Learning in chemistry with virtual laboratories. Journal of Chemical Education, 80, 346.
NAE Grand Challenges for Engineering. 2016. Retrieved from http://www.engineeringchallenges.org/
Noe, R. A. (1986). Trainees' attributes and attitudes: Neglected influences on training effectiveness. Academy of management review, 11(4), 736-749.
Noe, R. A. (1986). Trainees' attributes and attitudes: Neglected influences on training effectiveness. Academy of management review, 11(4), 736-749.
Noftle, E. E., & Robins, R. W. (2007). Personality predictors of academic outcomes: big five correlates of GPA and SAT scores. Journal of personality and social psychology, 93(1), 116.
O'HARA, J. M. (1990). The retention of skills acquired through simulator-based training. Ergonomics, 33(9), 1143-1153.
Paas, F., & Sweller, J. (2014). Implications of cognitive load theory for multimedia learning. The Cambridge handbook of multimedia learning, 27, 42.

138
Paas, F., Renkl, A., & Sweller, J. (2003). Cognitive load theory and instructional design: Recent developments. Educational psychologist, 38(1), 1-4.
Prince, M. (2004). Does active learning work? A review of the research. Journal of engineering education, 93(3), 223-231.
Regian, J. W., Shebilske, W. L., & Monk, J. M. (1992). Virtual Reality: An Instructional Medium for Visual-Spatial Tasks. Journal of Communication, 42(4), 136-149.
Resnick, M. (1998). Technologies for lifelong kindergarten. Educational technology research and development, 46(4), 43-55.
Ricci, K. E., Salas, E., & Cannon-Bowers, J. A. (1996). Do computer-based games facilitate knowledge acquisition and retention?. Military Psychology, 8(4), 295.
Richards, D., & Taylor, M. (2015). A Comparison of learning gains when using a 2D simulation tool versus a 3D virtual world: An experiment to find the right representation involving the Marginal Value Theorem. Computers & Education, 86, 157-171.
Rubin, H. J., & Rubin, I. S. (1995). The art of hearing data. Thousand Oaks. Ryan, R. M., & Deci, E. L. (2000). Intrinsic and extrinsic motivations: Classic definitions
and new directions. Contemporary educational psychology, 25(1), 54-67. Sampaio, A. Z., Ferreira, M. M., Rosário, D. P., & Martins, O. P. (2010). 3D and VR
models in Civil Engineering education: Construction, rehabilitation and maintenance. Automation in Construction, 19(7), 819-828.
Scheckler, R. K. (2003). Virtual labs: a substitute for traditional labs?. International journal of developmental biology, 47(2-3), 231-236.
Shute, V., & Towle, B. (2003). Adaptive e-learning. Educational Psychologist, 38(2), 105-114.
Snow, R. E. (1986). Individual differences in the design of educational programs. American
Snow, R. E. (1989). Aptitude-treatment interaction as a framework for research on individual differences in learning.
Stevens, C. K., & Gist, M. E. (1997). Effects of Self-efficacy and Goal-Orientation Training on Negotiation Skill Maintenance: What are the Mechanisms?. Personnel Psychology, 50(4), 955-978.
Stone, R. J. (2001). Haptic feedback: A brief history from telepresence to virtual reality. In Haptic Human-Computer Interaction (pp. 1-16). Springer Berlin Heidelberg.
Strauss, A. L., & Corbin, J. M. (1990). Basics of qualitative research (Vol. 15). Newbury Park, CA: Sage.
Stuerzlinger, W., & Wingrave, C. A. (2011). The value of constraints for 3D user interfaces. In Virtual Realities (pp. 203-223). Springer Vienna.
Triona, L. M., & Klahr, D. (2003). Point and click or grab and heft: Comparing the influence of physical and virtual instructional materials on elementary school students' ability to design experiments. Cognition and Instruction, 21(2), 149-173.
Valiente, C., Swanson, J., & Eisenberg, N. (2012). Linking Students’ Emotions and Academic Achievement: When and Why Emotions Matter. Child Development Perspectives, 6(2), 129–135. http://doi.org/10.1111/j.1750-8606.2011.00192.x

139
Van Merriënboer, J. J. G., Schuurman, J. G., De Croock, M. B. M., & Paas, F. G. W. C. (2002). Redirecting learners' attention during training: Effects on cognitive load, transfer test performance and training efficiency. Learning and Instruction, 12(1), 11-37.
Woodfield, B. F., Andrus, M. B., Andersen, T., Miller, J., Simmons, B., Stanger, R., ... & Bodily, G. (2005). The virtual ChemLab project: A realistic and sophisticated simulation of organic synthesis and organic qualitative analysis. J. Chem. Educ, 82(11), 1728.
Yamnill, S., & McLean, G. N. (2001). Theories supporting transfer of training. Human resource development quarterly, 12(2), 195-208.
Zacharia, Z. C. (2007). Comparing and combining real and virtual experimentation: an effort to enhance students' conceptual understanding of electric circuits. Journal of Computer Assisted Learning, 23(2), 120-132.
Zacharia, Z. C., & Olympiou, G. (2011). Physical versus virtual manipulative experimentation in physics learning. Learning and Instruction, 21(3), 317-331.
Zimmerman, B. J. (2000). Self-efficacy: An essential motive to learn. Contemporary educational psychology, 25(1), 82-91.