evaluating the impact of methane in soil gas on the ...neiwpcc.org/neiwpcc_docs/devaull - vi of...
TRANSCRIPT

1
Use this area for cover image (Maximum height 6.5cm & width 8cm)
Evaluating the Impact of Methane in Soil Gas on the Potential for Vapor Intrusion of Petroleum Hydrocarbons Methane from Biofuels – Webinar, NEIWPCC
Wednesday, October 8 from 1:30 – 4:00 (EDT)
George DeVaull [email protected]
25 minutes

2
Webinar Outline
1. Introduction 2. An approach to evaluate the impact of methane in soil gas
on the potential for vapor intrusion of petroleum hydrocarbons – George DeVaull, Shell Global Solutions US Inc.
3. Emergency response to spills – Mark Toso, Minnesota PCA a. How methane is formed in the subsurface using case
studies of sites b. Remediation, surface spills, and ecological impacts
4. Recent research on ethanol blended fuel spills and potential for methane generation and transport – Bill Rixey, University of Houston

3
By way of Acknowledgement:
Wilson, J. T., M. Toso, D. Mackay, N. de Sieyes, G. E. DeVaull, What’s the Deal with Methane at LUST Spill Sites? Parts 1& 2: LUSTLine, #72, February 2013; #71, September 2012.
Ma, J., W. G. Rixey, G. E. DeVaull, B. P. Stafford, P. J. J. Alvarez, Methane Bioattenuation and Implications for Explosion Risk Reduction along the Groundwater to Soil Surface Pathway above a Plume of Dissolved Ethanol, Environ. Sci. Technol., 2012, 46, 6013–6019.
Sihota, N.J., O. Singurindy, and K. U. Mayer, 2011. CO2 efflux measurements for evaluating source zone natural attenuation rates in a petroleum hydrocarbon contaminated aquifer, Environ. Sci. Technol., 45:482-488.
Sepich, J. E., Methane Soil Gas Identification and Mitigation, ASCE San Antonio, April 20, 2012.
Eklund, B., Proposed Regulatory Framework for Evaluating the Methane Hazard due to Vapor Intrusion, EM Magazine, Air & Waste Management Asso., awma.org, February 2011, 10-14.

4
Overview: Potential Methane Issues
Potential Sources: Biogenic methane from organic sources Natural gas transmission and distribution systems Reservoirs and storage, coal, petroleum, natural gas
Representative Examples: Measurement of shallow methane in the course of a vapor intrusion investigation Risk evaluation of some motor fuels (>E20) for methane and vapor intrusion potential
KEY
IDEAS: • Determine how much methane is okay. • Both concentration and flux (or flow) are important.

5
Biogenic Methane: What’s the issue?
Biogenic methane generation – makes gas:
ethanol (liquid) methane (gas) carbon dioxide (gas)
Example (with some steps missing):
Similar for other organics, including petroleum
(gas) (gas) (gas) (gas or liquid)
Compare to methane oxidation: can be equal volume or decrease

6
Methane – Scenarios / Conceptual Model
• flammable liquid releases to enclosed spaces; explosion overpressure consequences; emergency response; mitigation methods; climate change
NOT COVERED
cess pool in crawl space
bubbling / gassy water well effervescent tap water
shallow methane source vapor source
building enclosure
surface
soil layer
Focus Area Here: Shallow Soil Gas to Enclosure Migration

7
Overview: Risks and Hazards
Methane Hazards: Direct: Flammability
In enclosures; not within soil gas
LFL (LEL) – Lower Flammability Limit: 5.4% v/v in air (21% O2)
Toxicity Asphyxiation (O2 displacement ); same as some other gases (N2, He,
Ar, …)
For methane toxicity criteria are higher than flammability criteria
Indirect: Effect on other chemicals
O2 demand – for biodegradable chemicals
induced advection
PART 1
PART 2

8
Methane Flammability: Concentration and Flow (or Flux)
Concentration Within enclosure - flammable > 5.4%v/v In soil gas – potentially flammable once mixed with air >
14.1%v/v
Flux or Flow Enclosure (crawlspace) > 5 to 95 L/min ; 0.8 to 3.3 m/day Enclosure (residential) > 57 to 230 L/min ; 0.34 to 1.4 m/day KEY
POINT: • Flammability requires both high methane concentrations and high flow or flux.
• Values above for 100% LFL. • ‘Safety factors’ (e.g. 10% LFL for human-occupied spaces) often applied.
PART 1

9
Hazard Screening: Methane in Shallow Soils
Review / existing information: known risks & hazards of methane Comparison to guidance on mine safety, natural gas distribution systems, municipal landfill gas migration, feedlots, methane seeps, regional ordinances Table: screening criteria
Table based on Eklund (2011) and Sepich (2008)
1

10
Methane Soil Gas Hazard Screening: Interpretation
Other Comparisons / Notes / Examples Guidance: California DTSC “manure” A Guidance Prepared for the Evaluation of Biogenic Methane in Constructed Fills and Dairy Sites, California EPA, Department of Toxic Substances Control, March 28, 2012
San Diego – rescinded ordinance 1999. Methane discovered in San Diego housing developments; 2001. Ordinance imposed.
June 2002. MTRANS (Methane Transport Model)
April 2005. San Diego County repeals ordinance requiring methane gas testing on mass graded lots within the unincorporated areas of the County.
GET Soil Gas Criteria (<5%, <30%) overestimates potential enclosure risk Differential Pressure (2-in H2O) okay for relatively
impermeable caps (intact concrete, silt, clay); otherwise might need adjustment
Other possible options:

11
Methane Detection: care needed in measurement
Landfill Gas meters, handheld meters 3.41um (nominal) absorption
band For methane
Responds to other hydrocarbon gasses
Also responds to ethanol
Carbon Filter Trap ? In front of detector
Traps most hydrocarbons
Ethanol not sorbed by carbon
Methane absorption
Ethanol absorption
Hexane absorption
Jewell, K., J. T. Wilson, Ground Water Monitoring & Remediation, 31, 2011, 82–94.
http://webbook.nist.gov
IR Spectrum
• Petroleum and ethanol also detected by IR gas meters!

12
Soil Gas Modeling: can use a combination of methods
*errors increase for higher concentration, concentrations, and pressure gradients Ref: Thorstenson and Pollock (1989)
1

13
Example: Field Data
Vertical profile – methane in soil gas Lundegard, et al., 2000
71% CH4 + 23% CO2 = 94% at depth
78% N2 in air must have been displaced
Peclet number
Data
Solution of Stefan-Maxwell equations Unidirectional diffusion of (CO2 + CH4) in stagnant air (N2 + O2)
Model
Thorstenson and Pollock (1989)
1
mole fraction

14
Additional Parameter: Nitrogen Gas
Low values of differential pressure are hard to measure The potential for significant advection may also be evaluated by measure of nitrogen (N2) in soil gas. Nitrogen is nearly conserved Ensure the N2 value is measured directly; or reasonably
estimable by a balance of all of the other gases and vapors.
for diffusive flow
1

15
0
0.5
1
1.5
2
2.5
3
0 10 20 30 40 50 60 70
Dept
h (m
)
Methane (%)
Methane: in wet soils
VadoseLayer
CapillaryFringe
Porosity = 0.38Soil Moisture = 0.342
Porosity = 0.38Soil Moisture = 0.12
0.001% CH4 (1 ppm)
10% CH4
70% CH4
Pevadose = 0.1 (>1) diffusion-dominant
Pecap = 1.1 (>1) advection-dominant
295 cm
5 cm
CH4 flux = 0.005 m3/m2-day
Example 70% Methane at bottom of a (wet) capillary fringe Peclet numbers Add (in layers): Petotal = Pecap + Pevadose = 1.2 ( >1 ) advection-dominated

16
Conclusions: Methane Flammability
Methane Screening Concentrations in soil gas can be relatively high (5%, 30%) and still conservative [that is, overestimating potential flammability risk]. Advective contribution Flux can be high enough to generate a pressure gradient Differential pressure criteria (2-in water) can be measurable
under an intact cap (concrete, clay) Measure of nitrogen deficit in subsurface soil gas can also
indicate displacement / advection due to methane gas flow
In Soil Gas Screening: PART 1
KEY IDEAS:
• Acceptable methane screening values are high (>5%, > 30%. • Both concentration and flux (or flow) are important.

17
Potential effect of methane
Scenario: Methane
dominant oxygen sink
dominant source of advection
Benzene Low levels
Sand Soil Typical concrete foundation Source to foundation: 3m Apply :
‘Oxygen-Limited Aerobic Biodegradation’
With Methane Advection
PART 2 On transport and degradation of other chemicals (benzene)

18
Screening methods
Exclusion Distances (source to foundation separation distances) Examples: 6 ft dissolved phase source, 15 ft LNAPL source • EPA OUST Draft Guidance, reports http://www.epa.gov/oust/cat/pvi/
• Lahvis et al., 2012: Vapor Intrusion Screening Criteria for Application at Petroleum UST Release Sites. Groundwater Monitoring and Remediation.
Developed from a field-measured data set which includes
gasoline releases at up to 10% ethanol Ethanol which can generate methane These Exclusion Distances are valid for up to E10 (10%
ethanol)

19
Modeling
Use: Advective-Diffusion Solution with Oxygen-limited
Biodegradation Derived algebraic solution for oxygen-limited aerobic biodegradation
with imposed advection.
Very similar to ‘BioVapor’ model with imposed advection.
Impose additional constraints: Maximum 100%v/v soil gas sum
Advection is due only to soil gas concentration gradients; imposes an upper bound advection from Stephan-Maxwell equation for singly advective diffusion (advecting methane, stagnant air)
2

20
Sensitivity Analysis
As an example, without advection – Use the same type of nomagram to interpret the effect of advection
In Soil Gas Screening
3D: Abreu 2009: GWM&R & API Publ. 4555 Basement Scenario Matched Parameters Except “Depth”
all aerobic all anaerobic
For methane: •Apply this type of analysis using one selected source depth (3 m) and a range of source advection rates
•Plot on this slide: the source advection rate is zero.
2

21
Model Results – Sensitivity Analysis Effect of Methane Source on Benzene Attenuation Factor (Example)
2
22
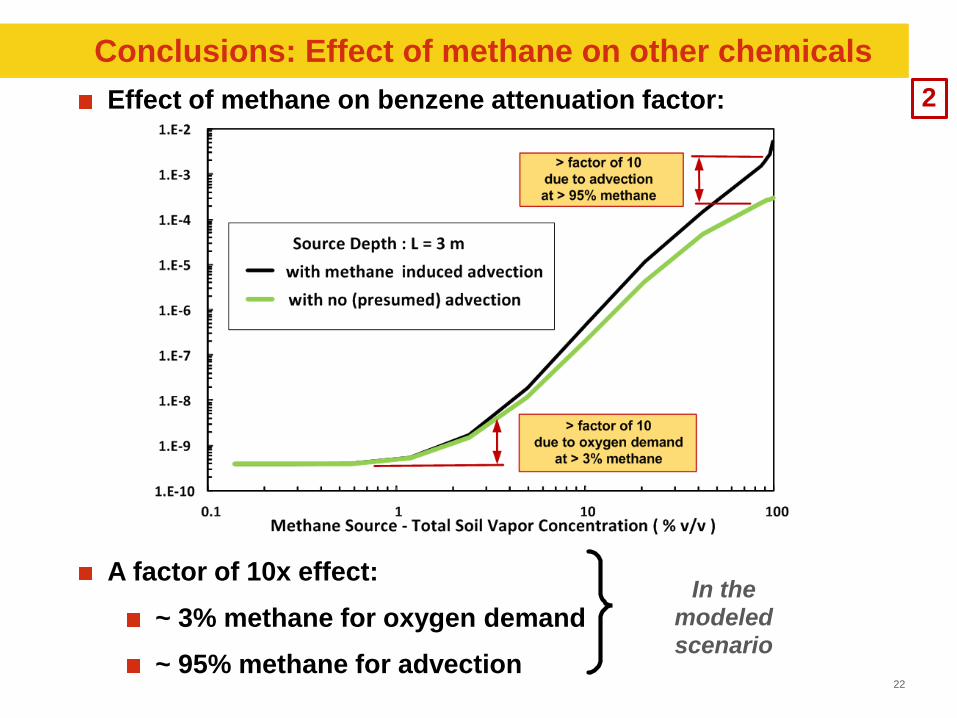
Conclusions: Effect of methane on other chemicals Effect of methane on benzene attenuation factor:
A factor of 10x effect: ~ 3% methane for oxygen demand ~ 95% methane for advection
In the modeled scenario
2

23
Still worried about effect of methane?
Some vapor intrusion models can still be applicable e. g. BioVapor (www.api.org) : diffusion, oxygen-limited biodegradation Include methane concentration in the source composition Check that vapor transport is ‘diffusion’ dominated
that is, relatively low source concentration
If conceptual model matches the site conditions, and modeled indoor air estimates for constituents of concern are acceptable, should be okay.
On transport of other biodegradable chemicals?

24
Conclusions: Effect of methane on benzene Effect of oxygen demand is more significant than advection for biodegradable chemicals Low (Total) Source concentration alone will ‘screen’ sites
At higher methane source concentrations High oxygen demand higher attenuation ratios Higher induced advection higher attenuation ratios Potential enclosure impacts may be greater than expected Need: More estimates, more sensitivity evaluations
KEY POINT:
• Low Source Concentration Low Oxygen Demand
Low Advection
2

25
End
Reserved slides follow
Thank you

26
Methane: Modeled Scenarios Presence of methane indicates (biogenic) gas generation & potential for source advection conceptual models illustrating the potential effects of
advective velocity on soil vapor intrusion
backup slide

27
Modeling: Soil gas flow high concentration of methane in soil gas; possible induced advection
• At high concentrations the diffusion rate of each gas is coupled to the diffusion rate of every other gas.
Key point:
Advective-Diffusion Eq. – no concentration constraint Fick’s law – no advection
backup slide

28
Example: Field Data
• Water-well soil gas data sampling. Inficon Micro 3000 GC analysis. • Data courtesy John Wilson(August 2013). • For gas samples taken 30 to 40 min into purging:
• Oxygen is low in MW-2 & MW-9; moderate in MW-1. • Nitrogen (5.1 to 20.5 %v/v) is significantly less than atmospheric (79%v/v) throughout. This indicates displacement of nearly conserved atmospheric gases, probably by methane gas.
• The nitrogen value has been confirmed to be through calibrated GC analysis and not estimated by difference (which is done by some labs / methods).
•The total vapors including gases and vapors sum to 93.2 to 98.1 % v/v. This is marginally lower than 100%, but nearly complete.
backup slide

29
Modeling: Implementation
Binary non-reactive gas flow mathematical solution Anything more complex numerical solution Favorable comparison:
MIN3P-Dusty (Molins and Mayer, 2007) to Thorstenson and Pollock (1989)
Acknowledgement MIN3P Dusty : Parisa Jourabchi (Golder), Uli Mayer (UBC)
backup slide

30
Methane emission flux - survey
Potential Identified Issues from Consolidated survey:
Active Municipal Landfills, Manure, Ethanol, Ethanol/Petroleum, Petroleum
Source size & methane generation rate still matter
Upper Range: 0.33 to 3.3 m/day
Lower Range: 0.033 to 0.3 m/day
backup slide

31
I. Flammability: Methane Concentration
5.4% methane in air is flammable (LFL)
Need at least 14.1% methane in soil gas (the rest: N2, CO2, etc.) to mix with air (21% O2) to yield a flammable mixture.
Air (21% O2)
14.1% CH4, balance inert
Mixture:12.6% O2,5.4% CH4
(flammable)
Soil gas is not flammable; Flame is ‘quenched’ in in the soil matrix 30 CFR § 57.22003, MSHA Illustration 27
KEY POINT:
• Flammability requires high methane concentrations in ‘open’ space (not soil gas).
‘Safety factors’ (10% LFL for occupied space)
backup slide

32
Screening methods presume prior site assessment, characterization, and evaluation
Sources: Buried organic matter Municipal landfills,
leachate Released petroleum,
ethanol, organic liquids Coal deposits, Peat soils Made land, fill areas Swamp land, Rice fields Septic tanks, Drainage
fields Livestock containment,
Manure pits Sewage and sewer gas Gas transmission and
distribution lines
Factors: Source volume Gas generation rates Biodegradation Composition Gases present (CH4, CO2,
…) VOCs present
Slbilit Ptil
Pathway Linkages: Air connected soils Capping, Foundations Vapor diffusion Gas advection Sewers, Vents Gas ebullition On-site, off-site Sumps, Dry wells, Vaults Foundation cracks, Utility
pemetrations
Factors: Diffusion rates,
Permeability Wet/dry soils Preferential flow Natural and man-made
geology, Hydrogeology Atmospheric pressure
changes Rising/falling water tables Soil gas venting Dewatering Paving Hardscape
Receptors: Occupied enclosures Crawlspaces Basements Current and future land use Soil flora, Soil fauna
Factors: Air exchange rates Residential / commercial Background
concentrations Enclosure emission
sources Hazards, exposure Direct toxicity Flammability Oxygen displacement Acute, chronic
A developed and validated conceptual model: backup
slide

33
Differential Pressure Criteria
0
0.1
0.2
0.3
0.4
0.5
0.001 0.01 0.1 1 10 100
differential pressure (in H2O)
scenario: crawlspacespecified methane flux : 0.34 m / day
1.0E
-13
1.0E
-14
1.0E
-15
1.0E
-16
1.0E
-17
1.0E
-18
2 in H2O criteria
cap
air p
erm
eabi
lity
cap
soil (sand)
Dept
h (m
)
concretecracked concrete
sand various poly liners
silt clayCapMaterial
backup slide

34
II. Flammability: Methane Flux (or Flow)
Estimated methane fluxes (and flows) for potential flammability:
Approximately ~ 0.33 to 3.3 m/day to reach 5.4%v/v methane in enclosure
Advection required (relative to diffusion) at these flux velocities
Lower ranges with applied safety factors; higher ranges if ‘crack’ flow not entire foundation area
enclosure criteria (%v/v)
Methane Flow
(L/min)
Methane Darcy Flux (m3/m2-day)
(m/day)
residential building 5.4 57 to 230 0.82 to 3.3 0.54 5.4 to 21.7 0.078 to 0.31
crawlspace 5.4 5 to 95 0.34 to 1.4 0.54 0.5 to 9.0 0.033 to 0.13
Qf / Af = Lmix · ER / (1/XCH4 - 1)
air flow area
mixing height
exchange rate
mole fraction
backup slide

35
Parameter definition and selection 1-D geometry modeled
For each layer (foundation, soil):
Within each layer, an area-weighted average: backup
slide

36
Model Scenario: Shallow Methane
Layered Compartments (one-dimensional):
Enclosure
Mixing and dilution
Stagnant gases: Air (N2, O2, Ar)
Foundation (or cap)
Specified resistance to flow [range]
diffusion coefficient, permeability
Soil Layer
Advection, diffusion, no (bio)degradation
Sand [diffusion coefficient, high permeability]
Source
Generation (CH4, CO2) at depth; upward flux specified (worst-case for flammability is all methane)
Steady-state unidirectional diffusion in a binary gas mixture 1
backup slide

37
Methane Hazard: modeled results
• Soil gas concentration criteria (<5 & <30%) overestimates potential risk [below indicated depths]
Key point:
1
backup slide

38
Differential Pressure 2-in H2O differential pressure criteria Presumes pneumatic
connection between soil and enclosure
Requires a relatively impervious cap From calculated pressure
drop
15 cm capping material
• Differential pressure criteria require capped surface (concrete, silt, clay); may adjust downward for more permeable surfaces
Key point:
1
backup slide