evaluating the impact of bim on project performance...evaluating the impact of bim on project...
TRANSCRIPT
Evaluating the Impact of BIM on Project Performance
Computer Integrated Construction (CIC) Research Program - White Paper 1
October 27, 2017
Bryan Franz, Ph.D. Assistant Professor
University of Florida [email protected]
John Messner Ph.D. Charles & Elinor Matts Professor The Pennsylvania State University
Summary This white paper presents the results of a study to examine the impact of Building Information Modeling (BIM) use adoption and BIM Project Execution Planning (PEP) on project performance. The core research questions guiding the study were: (1) Does increased BIM use adoption improve project performance, as measured by cost, schedule and quality metrics? and (2) What role does BIM PEP have in the successful implementation of BIM on a project? By leveraging a data from over 200 projects, these questions were answered via detailed statistical analysis, including a multiple regression analysis. The results clearly show a significant positive relationship between BIM use adoption and the speed of delivery, perceived facility quality and group cohesion within the project team, when controlling for project complexity. There was no evidence to suggest that the level of participation in BIM PEP by members of the project team moderated those relationships. Instead BIM PEP participation was a significant predictor of BIM use adoption. Projects implementing PEP with either a designer-contractor team or the full project team were associated with increased BIM use adoption, when compared to projects that did not implement PEP. Despite these key findings, this study revealed a need for a new approach to capturing process data across projects to enable more detailed future analysis. Prior research, including the data set used in this study, was designed to test macro-level relationships and omits many of the details about the specific processes or implementation aspects that drive day-to-day actions. Transitioning to collect a more focused data set, aimed at the micro-level of BIM and PEP implementation, and potentially lean construction practices, would enable a better understanding of the value these tools bring to projects.
Purpose There is an intuitive understanding among project managers, owners and designers that how you execute and incorporate BIM uses into a project is equal to or more important than the uses themselves. This intuition led to the development of several planning resources, one of them being the BIM Project

2
Execution Planning Guide1 developed in 2011. This BIM Project Execution Planning (PEP) approach has been widely adopted in the industry and incorporated into the U.S. National BIM Standard2. This also became the foundation for many elements in the National Institute of Building Sciences’ (NIBS) recently released National BIM Guide for Owners3. Now that BIM adoption is maturing, and these planning resources have been in the hands of practitioners for several years, there is a need to assess the impact that BIM and the PEP process are having on project performance.
Background BIM has fundamentally changed how we approach design, construction and operations in the building construction industry. Over the past decade, the use of intelligent, parametric models has surged. In the U.S. for example, over 70% of architects, engineers and contractors reported using BIM on their projects in 2012, up from only 28% in 20074. Much of this dramatic increase is the result of architects and contractors using BIM to reduce document errors, improve work flows and support coordination during construction. According to McGraw Hill’s SmartMarket Report, contractors perceive the top project benefits of BIM to be: reduced errors and omissions (41% of those surveyed), collaboration with owners and design firms (35%), reduced rework (31%), reduced construction cost (23%), better cost control and predictability (21%) and reduced overall project duration (19%). There is a growing interest among practitioners to measure these benefits and demonstrate the value that BIM brings to projects. There are an increasing number of studies that have looked into value on specific case studies, or value of isolated BIM uses on projects. This paper discusses an approach aimed at looking at a large dataset of projects, and identifying the impact of BIM on overall project outcome across the projects.
Methods This research is an extension of a previous study focused on the evaluation of core project delivery strategies that influence overall project performance. Within the previous study, data from a large sampling of projects (204 projects in the final dataset) were collected and verified via conversations with the owners of each project. These projects were distributed across the U.S. and not contained to a specific geographic area. They were all completed between 2008 and 2013, with approximately 60% being publically funded. The projects ranged in size from about 10,000-square feet at the smallest to over 550,000-square feet at the largest, with 57% falling below 150,000-square feet. All types of vertical construction were found in the sample; however the most common facilities included education (27% of the sample), offices (20%), health care (16%), lodging (13%) and commercial (10%). Additional data demographics are summarized in the source study5. A guide titled Maximizing Success in Integrated Projects: An Owner’s Guide was also developed from those results.6 1 Computer Integrated Construction Research Program. (2011). BIM Project Execution Planning Guide, Version 2.1. The Pennsylvania State University, available at http://bim.psu.edu. 2 BuildingSMART Alliance. (2015). National BIM Standard – United States, Version 3, National Institute of Building Sciences, Washington, DC. 3 National Institute of Building Sciences. (2017). National BIM Guide for Owners, Washington, DC, available at http://www.nibs.org/page/nbgo. 4 Construction, McGraw-Hill. (2012). The business value of BIM in North America: multi-year trend analysis and user ratings (2007-2012). Smart Market Report. 5 Franz, B., Leicht, R., Molenaar, K., and Messner, J. (2017). Impact of team integration and group cohesion on project delivery performance. Journal of Construction Engineering and Management, 143(1). 6 Leicht, R., Molenaar, K., Messner, J., Franz, B. and Esmaeili, B. (2016). “Maximizing Success in Integrated Projects: An Owner’s Guide.” Version 1.0, Pennsylvania State Univ. Available at http://bim.psu.edu/delivery.

3
This extension of the previous research used multiple linear regression to test two theoretical models. Both models represented alternate explanations for how BIM use adoption and PEP may impact project performance. The first theoretical model, shown in Figure 1.a, tested whether PEP had an interaction effect with BIM use adoption. The second theoretical model, shown in Figure 1.b, tested whether PEP was better represented as a predictor of BIM use adoption. The existing data set contained information on each project’s delivery process, including BIM use, PEP participation, and various measures of performance. For our analysis, performance was represented by five metrics in the existing data set that best aligned with the project benefits of BIM: construction unit cost, project cost growth, project delivery speed, group cohesion and facility quality. While most of these metrics are well-known in the construction industry, the last two (i.e., group cohesion and facility quality) require additional explanation. Both were derived from the previous research and are considered ‘latent’ variables. That is, they cannot be directly observed or measured, and must be inferred from a related set of indicators. Group cohesion was inferred from three rating-type questions posed to owners about the strength of team chemistry, timeliness of communication, and commitment to project-level goals. Thus, an increase in group cohesion corresponded to an increase in each of these indicators. Similarly, facility quality was inferred from three rating-type questions to owners about their satisfaction with the building structure and envelope, interior finishes and environmental systems.
a. b.
Figure 1. Theoretical models tested in this research The existing data set had five BIM use variables, each one representing a different high-level BIM use. These variables were binary, taking a value of 1 when the BIM use was found on the project and 0 otherwise. A summary of these high-level BIM uses and several specific application areas are provided in Table 1. BIM use adoption was represented by summing the number of BIM uses on each project, where each use was weighted by its perceived value to owners, designers and contractors. The weightings were adapted from Kreider et al.’s7 survey of BIM practitioners. The existing data set also had five PEP variables, each one representing a project team member participating in the PEP process. These variables were also binary, taking a value of 1 when the project team member participated in PEP and 0 otherwise. No data was available on why BIM PEP was used on the project (e.g., contractually required, based on complexity) or how faithfully the process was followed. However, based on patterns in the available data, we created grouped categories to better represent how each team approached PEP: No PEP, contractor only PEP, designer and contractor PEP, and full team PEP. Each of these variables, as well as the chosen project performance metrics is summarized in Appendix A.
7 Kreider, R., Messner, J., and Dubler, C. (2010). “Determining the frequency and impact of applying BIM for different purposes on building projects.” Proc., 6th Int. Conf. on Innovation in Architecture, Engineering and Construction (AEC), Pennsylvania State Univ., University Park, PA, USA.
BIM Use Adoption
Project Performance
BIM PEP
BIM Use Adoption
Project Complexity
BIM PEP
Project Performance

4
Table 1. High-level BIM uses and specific application areas
Architectural Design Engineered System Design MEP Coordination 4D Scheduling Facility Management Design Authoring Design Review Existing Conditions Programming
Building System Analysis Construction System Design Site Analysis Energy Analysis Lighting Analysis Mechanical Analysis
3D Coordination
Phase Planning Site Utilization
Asset Management Maintenance Scheduling Space Management
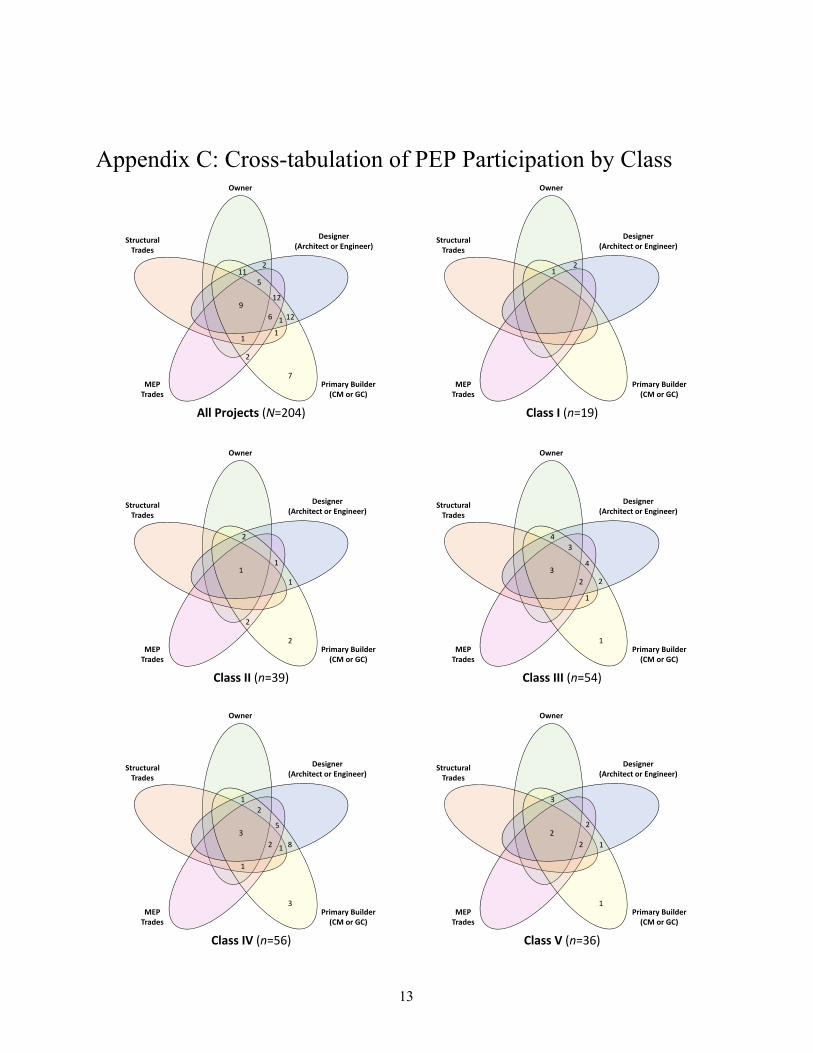
Results BIM Demographics. Across all 204 projects in the existing data set, 146, or 71.8%, reported having at least one BIM use. Of those, the most common combination of uses were: architectural design with engineered system design and MEP coordination (34.2%), and MEP coordination only (21.2%). A total of eight projects reported all five BIM uses. Only 70, or 47.9%, of the projects using BIM also implemented a PEP process. Of those, the most common combinations of participating team members were: designer, with the primary contractor and MEP trade subcontractors (17.1%), designer with the primary builder (17.1%), and the owner with the designer and primary contractor (15.7%). Nine projects had full team participation in PEP. Separating these projects by class of project delivery strategy reveals several trends in BIM use (see Appendices B and C). The concept of delivery strategies was developed in the previous research8 as a reaction to the growing number of hybrid delivery methods being used in practice. A set of eight delivery characteristics related to contract arrangement, payment terms and procurement practices were examined to identify common patterns in how owners organize their projects. The result was five ‘classes’ of project delivery strategy that each represent a different combination of those eight characteristics. Of the 19 Class I projects in our data set, 10, or 52.6%, used BIM. Class I project most closely resemble a hard bid, design-bid-build delivery strategy. In this class, the most common BIM uses were architectural design and MEP coordination, both used in isolation. A PEP process was very rare in this class, appearing on only three projects, or 30% of those projects using BIM. When PEP was implemented, it was always led by the owner or designer, without participation from the primary contractor or subcontracted trades. Of the 39 projects classified as Class II, 24, or 61.5%, used BIM. Class II shares the most similarities with a prequalified bid, design-bid-build or late involvement CM at risk delivery. The most common BIM use in this class was MEP coordination, which was often adopted in combination with another use, such as architectural design or engineered system design. A PEP process was implemented more frequently than Class I, showing up in 9 projects, or 37.5% of those using BIM. When implemented, PEP was always led by the primary contractor and commonly involved the designer. Trade subcontractors rarely participated. Of the 54 Class III projects studied, 42, or 77.8%, used BIM. Class III resembles a classic CM at risk, where the CM is hired early is design with an open book contract (i.e. cost plus or GMP). Nearly all of
8 Franz, B. and Leicht, R. (2016). An alternative classification of project delivery methods used in the United States building construction industry. Construction Management and Economics, 34(3): 160-173.

5
these projects (97.6%) used BIM for MEP coordination, frequently with another two uses. PEP was implemented on 20, or 47.6%, of the projects using BIM and was predominantly led by a team of the design and contractor, with some participation from MEP and structural trade subcontractors. Of the 56 Class IV projects, 45, or 80.4% used BIM. Closely aligned with a lump sum design-build delivery, nearly half of the Class IV projects (47.7%) used BIM for architectural design, engineered system design and MEP coordination. PEP was implemented on 60% of the projects using BIM, the highest percentage of all classes. The process was led by the designer and primary contractor and often involved the MEP and structural trade subcontractors. Lastly, of the 36 projects classified as Class V, 23, or 63.9% used BIM. Class V projects share many similarities with CM risk that hired trades early in design, as well as open book design-build and even IPD. Similar to Class III, nearly all projects (95.7%) used BIM for MEP coordination, with the most common combination also including architectural design and engineered system design. A PEP process was found on 11, or 46.8%, of the projects that used BIM. When implemented, PEP was led by the often led by the primary contractor, paired with the designer and MEP trade subcontractors. A summary of the frequency of BIM and PEP use, by class, is provided in Table 2.
Table 2. Summary of BIM and PEP use by class of project delivery strategy
Class I II III IV V
Approximation Low Bid DBB Prequalified DBB / Late CMR CMR Lump Sum DB GMP DB / Early
Trade CMR / IPD Projects in data set 19 39 54 56 36 No. using BIM 10 (53%) 24 (62%) 42 (78%) 45 (80%) 23 (64%) No. using PEP 3 (30%) 9 (38%) 20 (48%) 26 (60%) 11 (47%)
Interaction regression analysis. Five multiple linear regressions (project cost growth, construction unit cost, project delivery speed, group cohesion and facility quality) were performed to test for an interaction effect with BIM PEP as a moderator of the relationship between BIM use adoption and project performance (see Appendix D). Of these, the regression model predicting project cost growth was not significant (F=1.78, p=0.09). The remaining four regression models that predicted construction unit cost, project delivery speed, group cohesion and facility quality were significant; however, there was little evidence to support an interaction effect with BIM PEP participation (see Figure 1.a). BIM use adoption was the only significant predictor of construction unit cost (p<.01), when controlling for participation in PEP and its interaction effect with BIM use adoption. An increase in one unit of BIM use adoption was associated with an average increase of 12.5% in construction unit cost, although the amount of variance explained was low (R2=8.3%). However, since the analysis did not control for project type or building complexity, this may be a spurious relationship. BIM use adoption may be more common on complex projects, which often have higher unit costs that those with lower complexity. BIM use adoption was also the only significant predictor of project delivery speed (p<.01), when controlling for participation in PEP and its interaction effect with BIM use adoption. When BIM use adoption was increased by one unit, the average project delivery speed increased by 19.4%. The amount of variance explained was also low (R2=11.6%).
6
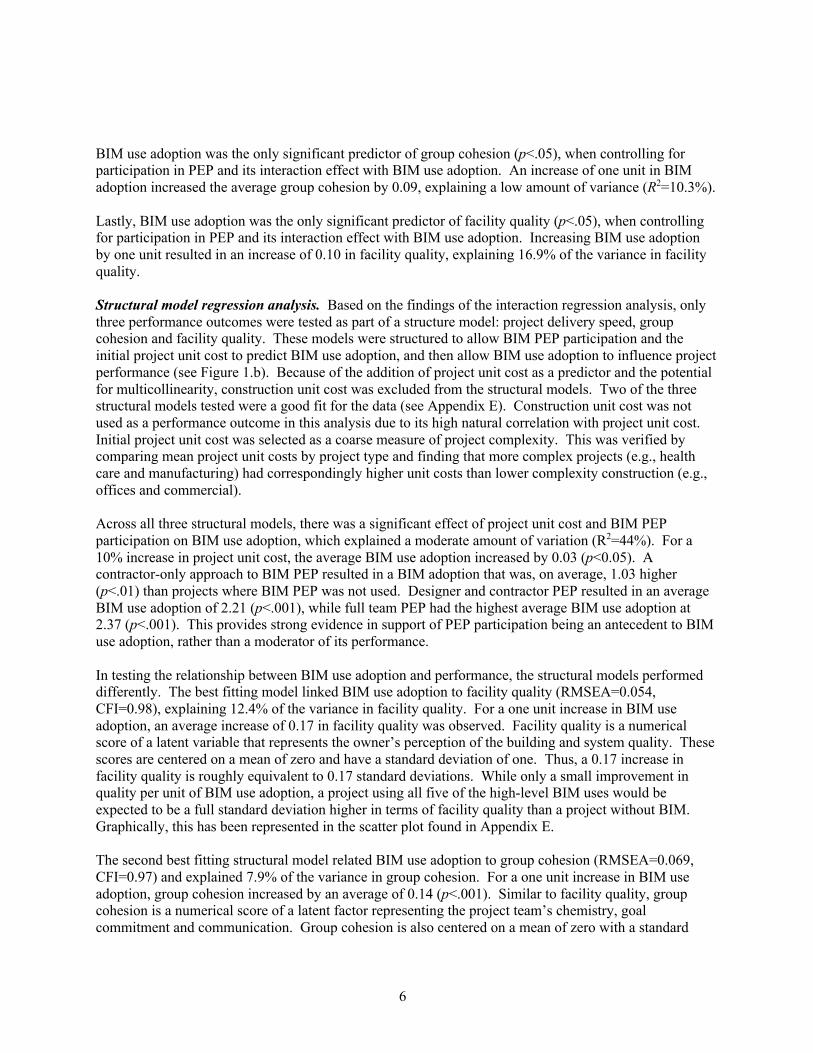
BIM use adoption was the only significant predictor of group cohesion (p<.05), when controlling for participation in PEP and its interaction effect with BIM use adoption. An increase of one unit in BIM adoption increased the average group cohesion by 0.09, explaining a low amount of variance (R2=10.3%). Lastly, BIM use adoption was the only significant predictor of facility quality (p<.05), when controlling for participation in PEP and its interaction effect with BIM use adoption. Increasing BIM use adoption by one unit resulted in an increase of 0.10 in facility quality, explaining 16.9% of the variance in facility quality. Structural model regression analysis. Based on the findings of the interaction regression analysis, only three performance outcomes were tested as part of a structure model: project delivery speed, group cohesion and facility quality. These models were structured to allow BIM PEP participation and the initial project unit cost to predict BIM use adoption, and then allow BIM use adoption to influence project performance (see Figure 1.b). Because of the addition of project unit cost as a predictor and the potential for multicollinearity, construction unit cost was excluded from the structural models. Two of the three structural models tested were a good fit for the data (see Appendix E). Construction unit cost was not used as a performance outcome in this analysis due to its high natural correlation with project unit cost. Initial project unit cost was selected as a coarse measure of project complexity. This was verified by comparing mean project unit costs by project type and finding that more complex projects (e.g., health care and manufacturing) had correspondingly higher unit costs than lower complexity construction (e.g., offices and commercial). Across all three structural models, there was a significant effect of project unit cost and BIM PEP participation on BIM use adoption, which explained a moderate amount of variation (R2=44%). For a 10% increase in project unit cost, the average BIM use adoption increased by 0.03 (p<0.05). A contractor-only approach to BIM PEP resulted in a BIM adoption that was, on average, 1.03 higher (p<.01) than projects where BIM PEP was not used. Designer and contractor PEP resulted in an average BIM use adoption of 2.21 (p<.001), while full team PEP had the highest average BIM use adoption at 2.37 (p<.001). This provides strong evidence in support of PEP participation being an antecedent to BIM use adoption, rather than a moderator of its performance. In testing the relationship between BIM use adoption and performance, the structural models performed differently. The best fitting model linked BIM use adoption to facility quality (RMSEA=0.054, CFI=0.98), explaining 12.4% of the variance in facility quality. For a one unit increase in BIM use adoption, an average increase of 0.17 in facility quality was observed. Facility quality is a numerical score of a latent variable that represents the owner’s perception of the building and system quality. These scores are centered on a mean of zero and have a standard deviation of one. Thus, a 0.17 increase in facility quality is roughly equivalent to 0.17 standard deviations. While only a small improvement in quality per unit of BIM use adoption, a project using all five of the high-level BIM uses would be expected to be a full standard deviation higher in terms of facility quality than a project without BIM. Graphically, this has been represented in the scatter plot found in Appendix E. The second best fitting structural model related BIM use adoption to group cohesion (RMSEA=0.069, CFI=0.97) and explained 7.9% of the variance in group cohesion. For a one unit increase in BIM use adoption, group cohesion increased by an average of 0.14 (p<.001). Similar to facility quality, group cohesion is a numerical score of a latent factor representing the project team’s chemistry, goal commitment and communication. Group cohesion is also centered on a mean of zero with a standard

7
deviation of one. In other words, a project team using all five high-level BIM uses would be expected to be about 0.75 standard deviations higher in group cohesion than a project team not using BIM. The last structural model related BIM use adoption to project delivery speed. For a one unit increase in BIM use adoption, the average project delivery speed increased by 8.9% (p<.001). However, this model had only a marginal fit (RMSEA=0.174, CFI=0.85) to the data and explained 10.2% of the variation in project delivery speed.
Discussion The results suggest that BIM PEP has a complicated relationship with BIM adoption and ultimately project performance. We found little evidence supporting the theory of BIM PEP as a moderator of the link between BIM use adoption and performance. However, there is an argument that these findings are limited by the available data, rather than a misspecification of the theoretical model. The available data set contained only participation information (i.e., who was involved with the BIM PEP process) and did not specify how PEP was implemented, whether the plan was a contractual requirement, or whether or not the plan was followed. In other words, an interaction model, by definition, is concerned with the process and would likely perform better with more process-specific data. While the data was not suggestive of interaction effects, there was strong evidence that BIM PEP participation was directly related to BIM use adoption. Projects with more stakeholders involved in the PEP process had more BIM use adoption, either by implementing higher value BIM uses or a broader range of BIM uses. At the same time, BIM use adoption had a significant positive impact on facility quality, group cohesion and project delivery speed. Taken together, these suggest a hybrid model, where PEP participation and project complexity have an early role in determining BIM uses, while the PEP process moderates the effect of BIM use adoption on project performance (see Figure 2).
Figure 2. Hybrid model of BIM’s impact on project performance
From a measurement perspective, costs are notoriously difficult to compare across projects and there are many factors that can impact the final cost of a project. Typical measures of cost like the ones used in this study (i.e., unit cost or cost growth), are often blind to these factors. They absorb the costs of owner-directed changes, scope variation due to project type, weather delays and unforeseen conditions that are often outside of the project team’s control. In other words, unit cost and cost growth are coarse measures of cost performance that may conceal important benefits from BIM implementation. For this reason, it was unsurprising to see inconsistent relationships between BIM use adoption and cost growth or construction unit cost. This type of research would benefit from a finer representation of project cost, which may take the form of a standardized unit cost that controls for project differences, such as the ratio of floor to wall area or of direct to indirect costs. Cost growth may also be categorized to better understand the sources of cost unpredictability.
BIM Use Adoption
Project Complexity
BIM PEP Participation
Project Performance
BIM PEP Process

8
Conclusions This study examined the role of BIM use adoption and PEP participation in improving project performance. There was no significant direct effect of BIM use adoption on project cost growth. However, an increase in BIM use adoption on projects did have a significant direct effect on increasing project delivery speed, facility quality and group cohesion, when controlling for differences in each project’s unit cost. Participation in the BIM PEP process was found to have only a minimal interaction effect with BIM use adoption. Specifically, a BIM PEP process where the designer and primary contractor both participated resulted in slightly higher facility quality and group cohesion for the same level of BIM adoption, when compared to not using a BIM PEP process. We conclude that there is no evidence that BIM PEP participation is a moderator of the relationship between BIM use adoption and project performance. Instead, when considered as a predictor of BIM use adoption, BIM PEP participation had a significant direct effect. A BIM PEP process with the participation of either the designer and contractor or the full team had higher average BIM use adoption than projects without PEP. This suggests that deeper team involvement from the MEP and structural trades can encourage the project to adopt more or higher value BIM uses.
Future Direction
The industry could benefit from additional studies that obtain and leverage a data set that is targeted specifically to the application of BIM and PEP processes. The existing data set used in this study was originally collected to observe macro-level trends in project performance, attributable to differences in project delivery. As a result, data on BIM uses and the BIM PEP process found on each project was limited. We know what high-level BIM uses were adopted, if any, and who participated in a BIM PEP process. Analysis of this data provided empirical support for three of the five project benefits of BIM perceived by practitioners: faster delivery, enhanced collaboration and improved quality. However, there was no data on how each BIM use was implemented (e.g., level of development, specific sub-uses) or how the BIM PEP was leveraged to integrate those uses into design and construction workflows (e.g., information exchanges, responsibility assignments). Similarly, we were not able to determine if BIM use adoption was performed voluntarily or required by contract, and suppose that project outcomes could vary drastically depending on whether practitioners enthusiastically embrace BIM or were in a situation of begrudgingly fulfilling a contractual requirement. An additional study with data collection objectives aimed specifically at the micro-level of BIM and PEP implementation, and potentially lean construction practices, would enable a more accurate assessment of the influence of BIM and lean practices on project performance.
Acknowledgements
We thank the Charles Pankow Foundation for their support of this research, as well as the Design-Build Institute of American and BIMForum for their contributions. We also thank our collaborators on the initial delivery method study including Keith Molenaar from the University of Colorado at Boulder, Robert Leicht at Penn State, and Behzad Esmaeili at George Mason University. Finally, we wish to thank the members of our Advisory Panel: Greg Gidez (Chair), Luciana Burdi, Steve Hutsell, Ricardo Khan, Kurt Maldovan, Russell Manning, Thai Nguyen, and James Vandezande, who provided valuable advice related to interpreting the findings. Any opinions, findings and conclusions or recommendations expressed in this paper are those of the authors and do not necessarily reflect the view of the sponsors, collaborators, or Advisory Panel members.

9
Citation
Franz, B. and Messner, J. (2017) “Evaluating the Impact of BIM on Project Performance.” Computer Integrated Construction (CIC) Research Program, The Pennsylvania State University, University Park, PA, available at http://cic.psu.edu/publications.
Definitions
BIM Use Adoption: A measure that sums the number of BIM uses on a project, weighted by the perceived value of each use. The equation used to calculate this measure is as follows:
BIMUseAdoption = 1.03(𝐴𝑟𝑐ℎ𝑖𝑡𝑒𝑐𝑡𝑢𝑟𝑎𝑙𝐷𝑒𝑠𝑖𝑔𝑛) + 0.92(𝐸𝑛𝑔𝑖𝑛𝑒𝑒𝑟𝑒𝑑𝑆𝑦𝑠𝑡𝑒𝑚𝐷𝑒𝑠𝑖𝑔𝑛) + 1.60(𝑀𝐸𝑃𝐶𝑜𝑜𝑟𝑑𝑖𝑎𝑛𝑡𝑖𝑜𝑛) +1.15(4𝐷𝑆𝑐ℎ𝑒𝑑𝑢𝑙𝑖𝑛𝑔) + 0.47(𝐹𝑎𝑐𝑖𝑙𝑖𝑡𝑦𝑀𝑎𝑛𝑎𝑔𝑒𝑚𝑒𝑛𝑡)
Each BIM use is treated as 1 if it was implemented on the project, and a zero otherwise. For example, if Architectural Design and Engineered System Design were both implemented, the BIM Use Adoption measure would be equal to 1.03 + 0.92, or 1.95.
Delivery Speed: A measure of the rate at which a project is design and constructed, obtained by dividing the gross building area by the overall project duration in months.
BIM Project Execution Plan: A structured process to develop infrastructure in the form of communication procedures, technology and quality control, to support the BIM implementation.
Project Delivery Strategy: A classification of approaches to project delivery that were derived by examining patters in eight characteristics related to contract arrangement, payment terms and procurement practices. Five ‘classes’ of project delivery strategy were identified and each represents a different combination of those eight characteristics, as follows:
Class of Delivery StrategyCharacteristics I II III IV V
Single contract for design and construction ü üBuilder was hired at SD or earlier ü ü üTrades were hired at SD or earlier ü üBuilder was prequalified ü ü ü üTrades were prequalified ü ü ü üBuilder selected based on cost of work ü ü üTrades selected based on cost of work ü ü ü üBuilder had an open book contract ü ü
Always found in Class
Never found in Class

10
Appendix A: Existing Data Set Variable Summary
BIM Use Adoption by Timing of GC/CM Involvement
No. of Obs. Mean Std.
Dev.
Pre-design 65 2.40 1.78 Conceptual design (0-15%) 47 2.48 1.60 Schematic design (15-30%) 24 2.03 1.45 Design development (30-60%) 16 2.10 1.62 Construction documents (60-90%) 14 1.43 1.50 Bidding (90-100%) 38 1.34 1.38
BIM Use Adoption by GC/CM Procurement Method
No. of Obs. Mean Std.
Dev.
Open bid 17 1.46 1.28 Prequalified bid 36 1.57 1.57 1-Stage request for proposal 36 2.13 1.78 2-stage request for proposal 83 2.50 1.52 Sole source 32 1.89 1.84
BIM Use Adoption by GC/CM Selection Criteria
No. of Obs. Mean Std.
Dev.
Price of work only 14 0.96 1.07 Best value with Price of work 108 2.01 1.64 Best value with fees and GCs 42 2.44 1.60 Qualifications only (non-price) 38 2.20 1.68
BIM Use Adoption by GC/CM Contract Type
No. of Obs. Mean Std.
Dev.
Lump sum 94 1.81 1.67 Cost plus a fee (% or fixed) 13 2.39 1.97 Guaranteed maximum price 97 2.32 1.55

11
Performance Metrics No. of
Obs. Mean Std. Dev.
Project delivery speed (SF/Month) 204 5,889 6,250 Project cost growth (%) 195 3.6 7.5 Construction unit cost ($/SF) 179 345.5 225.3 Facility quality (Factor score) 204 3.3 0.79 Group cohesion (Factor score) 204 2.2 0.78
BIM Uses No. of
Obs. Mean Std. Dev.
Architectural design1 204 0.51 0.50 Engineered system design1 204 0.42 0.49 MEP coordination1 204 0.63 0.48 4D scheduling1 204 0.09 0.28 Facility management1 204 0.14 0.35
BIM use adoption2 204 2.09 1.64 1 Binary variable takes a value of 1 if the BIM use was present, else 0 2 Weighted sum of BIM uses = 1.03*Architectural Design + 0.92*Engineered
System Design + 1.60*MEP Coordination + 1.15*4D Scheduling + 0.47*Facility Management
BIM PEP Participation No. of
Obs. Mean Std. Dev.
Owner1 204 0.14 0.35 Designer1 204 0.28 0.45 Primary contractor1 204 0.33 0.47 MEP subcontractors1 204 0.17 0.38 Structural subcontractors1 204 0.09 0.28
No PEP 204 0.66 0.47 Contractor only PEP 204 0.06 0.24 Contractor and Designer PEP 204 0.12 0.32 Full team PEP 204 0.16 0.37 1 Binary variable takes a value of 1 if the team member participated in PEP, else 0

12
Appendix B: Cross-tabulation of BIM Uses by Class
All Projects (N=204)
Class I (n=19)
Class II (n=39)
Class III (n=54)
Class IV (n=56)
Class V (n=36)
Architectural Design
Engineered System Design
MEP Coordination
4D Scheduling
Facility Management
8
10 5
1
1
31
125 50
4 2
821
1
31
3
2 1
1
1
3
Architectural Design
Engineered System Design
MEP Coordination
4D Scheduling
Facility Management
Architectural Design
3 2
1
8
1 6
1
2
Engineered System Design
MEP Coordination
4D Scheduling
Facility Management
Architectural Design
4 1
3
9
1 14
1
4 2
12
Engineered System Design
MEP Coordination
4D Scheduling
Facility Management
Architectural Design
4
1
3
8
221
1
3 1
1
Engineered System Design
MEP Coordination
4D Scheduling
Facility Management
Architectural Design
1
1
1
3
93 1
13
Engineered System Design
MEP Coordination
4D Scheduling
Facility Management
13
Appendix C: Cross-tabulation of PEP Participation by Class
All Projects (N=204)
Class I (n=19)
Class II (n=39)
Class III (n=54)
Class IV (n=56)
Class V (n=36)
Owner
Designer(Architect or Engineer)
Primary Builder (CM or GC)
Structural Trades
MEP Trades
2
6
7
115
9121
1
2
1
12
Owner
21
Designer(Architect or Engineer)
Primary Builder (CM or GC)
Structural Trades
MEP Trades
Owner
2
2
11
2
1
Designer(Architect or Engineer)
Primary Builder (CM or GC)
Structural Trades
MEP Trades
Owner
2
1
43
32
1
4
Designer(Architect or Engineer)
Primary Builder (CM or GC)
Structural Trades
MEP Trades
Owner
2
3
12
381
1
5
Designer(Architect or Engineer)
Primary Builder (CM or GC)
Structural Trades
MEP Trades
Owner
2
1
3
21
2
Designer(Architect or Engineer)
Primary Builder (CM or GC)
Structural Trades
MEP Trades

14
Appendix D: Interaction Model Regression Results
Dir
ect E
ffec
tsIn
tera
ctio
n E
ffec
ts
Dep
ende
nt V
aria
ble
Fdf
pR
2C
onst
ant
BIM
Use
Ad
optio
nC
ont.
Onl
y P
EPD
esig
ner+
C
ont.
PEP
Full
Team
PE
PBI
M x
Con
t. O
nly
PEP
BIM
x D
esig
ner
+ C
ont.
PEP
BIM
x F
ull
Team
PEP
Con
stru
ctio
n U
C (L
og)
2.12
7, 1
71.0
378.
32.
34**
*.0
51**
.098
.159
.079
-.051
-.043
-.016
Proj
ectc
ost g
row
th1.
787,
187
.093
6.3
3.48
***
-.231
18.5
**-7
.51
6.77
-5.5
0*2.
12-1
.45
Del
iver
y sp
eed
(Log
)3.
677,
196
.001
11.6
3.36
***
.077
**-.1
15.4
03.4
42.0
22-.0
88-.0
85
Gro
up c
ohes
ion
3.88
7, 1
96.0
0112
.21.
96**
*.0
85-.6
83-1
.39
-.252
.152
.413
.136
Faci
lity
qual
ity5.
697,
196
.000
16.9
3.03
***
.102
*-.1
59-.8
55-.5
53-.0
62.3
22.2
23
* p<
.05,
**
p<.0
1, *
**p<
.001
1
1.52
2.53
3.54
4.55
01
23
45
Quality of Facility
BIM
Use
Ado
ptio
n (W
eigh
ted)
BIM
PxP
Inte
ract
ion
with
BIM
Use
Ado
ptio
n
Full
Team
PEP
Des
igne
r and
Con
tract
or P
EPC
ontra
ctor
Onl
y PE
PN
o PE
P
0
0.51
1.52
2.53
3.5
01
23
45
Group Cohesion
BIM
Use
Ado
ptio
n (W
eigh
ted)
BIM
PE
P In
tera
ctio
n w
ith B
IM U
se A
dopt
ion
Full
Team
PEP
Des
igne
r and
Con
tract
or P
EPC
ontra
ctor
Onl
y PE
PN
o PE
P
0
0.51
1.52
2.53
3.54
01
23
45
LOG Project Delivery Speed (SF/Month)
BIM
Use
Ado
ptio
n (W
eigh
ted)
BIM
PE
P In
tera
ctio
n w
ith B
IM U
se A
dopt
ion
Full
Team
PEx
PD
esig
ner a
nd C
ontra
ctor
PEP
Con
tract
or O
nly
PEP
No
PEP

15
Appendix E: Structural Model Regression Results
BIM Use Adoption
Project Unit Cost (Log10)
Contractor Only PEP
Designer and Contractor PEP
Full Team PEP
Quality of Facility
.719*
1.033**
2.209***
2.368***
.169***
RMSEA = 0.054, CFI = .984χ2
(4) = 6.353, p = 0.174
R2 = 44.0 R2 = 12.4
0
1
2
3
4
5
6
0 1 2 3 4 5 6
Qua
lity
of F
acili
ty
BIM Use Adoption (Weighted)
Full Team PEPDesigner and Contractor PEPContractor Only PEPNo PEP
0
σ
2σ
3σ
-σ
-2σ
-3σ
BIM Use Adoption
Project Unit Cost (Log10)
Contractor Only PEP
Designer and Contractor PEP
Full Team PEP
Project Delivery Speed
(Log10)
.719*
1.033**
2.209***
2.368***
.089***
RMSEA = 0.174, CFI = .848χ2
(4) = 28.651, p = 0.000
R2 = 44.0 R2 = 10.2
2
2.5
3
3.5
4
4.5
5
0 1 2 3 4 5 6
Proj
ect D
eliv
ery
Spee
d (L
og10
)
BIM Use Adoption (Weighted)
Full Team PEPDesigner and Contractor PEPContractor Only PEPNo PEP
BIM Use Adoption
Project Unit Cost (Log10)
Contractor Only PEP
Designer and Contractor PEP
Full Team PEP
Group Cohesion
.719*
1.033**
2.209***
2.368***
.136***
RMSEA = 0.069, CFI = .971χ2
(4) = 7.912, p = 0.095
R2 = 44.0 R2 = 7.9
* p<.05, ** p<.01, ***p<.001 -1
0
1
2
3
4
5
0 1 2 3 4 5 6
Gro
up C
ohes
ion
BIM Use Adoption (Weighted)
Full Team PEPDesigner and Contractor PEPContractor Only PEPNo PEP
0
σ
2σ
3σ
-σ
-2σ
-3σ