evaluating the accuracy of a geographic closed-ended ... · evaluating the accuracy of a geographic...
TRANSCRIPT

TSpace Research Repository tspace.library.utoronto.ca
Evaluating the accuracy of a geographic
closed-ended approach to ethnicity measurement, a practical alternative
Omand JA, Carsley S, Darling PB, Parkin PC, Birken CS, Urquia ML, Khovratovich M, Maguire JL; TARGet Kids! Collaboration.
Version Post-print/accepted manuscript
Citation (published version)
A. Omand, Jessica & Carsley, Sarah & Darling, Pauline & C. Parkin, Patricia & S. Birken, Catherine & L. Urquia, Marcelo & Khovratovich, Marina & L. Maguire, Jonathon. (2014). Evaluating the accuracy of a geographic closed-ended approach to ethnicity measurement, a practical alternative. Annals of Epidemiology. 24. 10.1016/j.annepidem.2013.12.015.
Copyright/License This work is licensed under the Creative Commons Attribution-NonCommercial-NoDerivatives 4.0
International License. To view a copy of this license, visit http://creativecommons.org/licenses/by-nc-nd/4.0/.
How to cite TSpace items
Always cite the published version, so the author(s) will receive recognition through services that track citation counts, e.g. Scopus. If you need to cite the page number of the author manuscript from TSpace
because you cannot access the published version, then cite the TSpace version in addition to the published version using the permanent URI (handle) found on the record page.
This article was made openly accessible by U of T Faculty. Please tell us how this access benefits you. Your story matters.

1
EVALUATING THE ACCURACY OF A GEOGRAPHIC CLOSED-ENDED
APPROACH TO ETHNICITY MEASUREMENT, A PRACTICAL ALTERNATIVE
Jessica A. Omand, (RD MSc PhD candidate)1,2,3; Sarah Carsley (MSc)4; Pauline B. Darling, (RD
PhD)1,3; Patricia C. Parkin, (MD FRCPC) 4,5,6,7; Catherine S. Birken, (MD MSc FRCPC) 4,5,6,7;
Marcelo L. Urquia (MSc PhD)3,8; Marina Khovratovich (MD)4; Jonathon L. Maguire, (MD MSc
FRCPC) 1,2,3,4,5,6,7 on behalf of the TARGet Kids! Collaboration*
Affiliations: 1 Department of Nutritional Sciences, University of Toronto; 2 Department of
Pediatrics, St. Michael’s Hospital; 3 Keenan Research Centre of the Li Ka Shing Knowledge
Institute of St. Michael’s Hospital; 4 Division of Pediatric Medicine and the Pediatric Outcomes
Research Team, The Hospital for Sick Children; 5 Department of Pediatrics, University of
Toronto; 6 Child Health Evaluative Sciences, The Hospital for Sick Children Research Institute; 7 Institute of Health Policy, Management and Evaluation, University of Toronto; 8 Dalla Lana
School of Public Health, University of Toronto, Toronto, Canada
Address correspondence to: Jessica Omand RD, Pediatric Ambulatory Clinic, Department of
Pediatrics, St. Michael’s Hospital, 61 Queen St. East 2nd Floor, Toronto ON M5C 2T2,
([email protected]), 416-937-4480.
TARGet Kids! Collaboration*
Principal Investigators: Dr. Catherine Birken, Dr. Jonathon Maguire and Dr. Patricia Parkin.
Site Investigators: Tony Barozzino, Gary Bloch, Ashna Bowry, Douglas Campbell, Sohail
Cheema, Brian Chisamore, Karoon Danayan, Anh Do, Michael Evans, Mark Feldman, Sloane
Freeman, Moshe Ipp, Sheila Jacobson, Tara Kiran, Holly Knowles, Eddy Lau, Fok-Han Leung,
Julia Morinis, Sharon Naymark, Patricia Neelands, Michael Peer, Marty Perlmutar, Navindra
Persaud, Michelle Porepa, Noor Ramji, Alana Rosenthal, Janet Saunderson, Michael Sgro, Susan
Shepherd, Carolyn Taylor, Sheila Wijayasinghe, Ethel Ying, Elizabeth Young.
This work was supported by the Canadian Institutes of Health Research [grant numbers 248319,
221549].
Running title: Diagnostic accuracy of a geographic approach to ethnicity measurement
Word count: 2561
Abstract word count: 193
Number of tables and figures: total 7 (3 tables and 4 figures)

2
Abstract
Purpose: Measuring ethnicity accurately is important for identifying ethnicity variations in
disease risk. We evaluated the degree of agreement and accuracy of maternal ethnicity measured
using the new standardized closed-ended geographically based ethnicity question and geographic
reclassification of open-ended ethnicity questions from the Canadian census.
Methods: A prospectively designed study of respondent agreement of mothers of healthy
children age 1-5 years recruited through the TARGet Kids! practice based research network. For
the primary analysis, the degree of agreement between geographic reclassification of the
Canadian census maternal ethnicity variables and the new geographically based closed-ended
maternal ethnicity variable completed by the same respondent was evaluated using a kappa
analysis.
Results: 862 mothers who completed both measures of ethnicity were included in the analysis.
The kappa agreement statistic for the two definitions of maternal ethnicity was 0.87 (95% CI:
0.84-0.90) indicating good agreement. Overall accuracy of the measurement was 93%.
Sensitivity and specificity ranged from 83-100% and 96-100% respectively.
Conclusion: The new standardized closed-ended geographically based ethnicity question
represents a practical alternative to widely used open-ended ethnicity questions. It may reduce
risk of misinterpretation of ethnicity by respondents, simplify analysis and improve the accuracy
of ethnicity measurement.
Key words: ethnicity, children, child health, pediatrics, measurement error, kappa statistic
Abbreviations and acronyms:
- TARGet Kids! - The Applied Research Group for Kids
- SAS – Statistical analysis software

3
1. Introduction
Ethnicity is a frequently measured descriptor of populations.1 Categorizing ethnicity
accurately in increasingly diverse populations is challenging yet important for identifying
ethnicity variations in disease risk.1 Ethnicity has been defined as the social group to which an
individual belongs and identifies with or is perceived to belong to as a result of shared
characteristics including geographic, ancestral origins and cultural commonality with shared
beliefs, values and practices.2,3 Ethnicity has been considered different from racial classification
in that it implies that groups differ by cultural dimensions.4-6 It has also been suggested that if
data are needed on features relating to race, such as skin pigmentation, this should be measured
directly and separated from the concept of ethnicity.7
Measuring geographic ethnicity is challenging because a standardized method of
accurately classifying geographic ethnicity is not currently available.5 Self-reported ethnicity
using open-ended questions is commonly used for ethnicity measurement in national censuses
including the Canadian census.7-9 However, open-ended questions introduce considerable
analytic challenges such as classification error due to non-uniform or non-useful responses (for
example responses for religious affiliations), spelling errors, illegible handwriting and
repetition.4-7,10,11 Further, analyzing open-ended responses is complex and may not be necessary
for capturing a finite number of geographic ancestral origins. A closed-ended geographic
ethnicity question could offer a number of advantages including easier interpretation, decreased
analytic burden and standardization.10,12 However, changing the measurement of ethnicity from
open-ended to a standardized closed-ended question presents a challenge to maintaining the
continuity of ethnicity measurement over time.5,13

4
To overcome the limitations of existing open-ended ethnicity questions, we developed a
new standardized closed-ended geographically based ethnicity question. The objective of this
study was to assess the degree of agreement and accuracy between the new standardized closed-
ended ethnicity question and the open-ended ethnicity question in a cohort of Canadian mothers
and their children.7,8
2. Methods
2.1 Design
In this prospectively designed study of respondent agreement, mothers of healthy
children completed the open-ended ethnicity question and the new standardized close-ended
geographically based ethnicity question on two separate occasions.
2.2 Participants
Mothers of healthy children 1 to 5 years of age were recruited during a routine health
maintenance children’s doctor’s visit through the TARGet Kids! primary care practice based
research network in Toronto, Canada, the most culturally diverse city in Canada, between
December 2008 and June 2012.14 All families attending routine health care appointments were
approached to enroll in TARGet Kids! TARGet Kids! is a collaboration between University of
Toronto child health outcomes researchers and primary care physicians from the Department of
Paediatrics and the Department of Family and Community Medicine. Mothers were included in
this study if they had completed TARGet Kids! questionnaires on two separate occasions.
Mothers were excluded from this study if their child had severe developmental delay or chronic
illness (except for asthma), could not verbally communicate in English, had incomplete maternal
ethnicity data or reported having multiple ethnicities.
5
2.3 Measurements
Trained research assistants administered questionnaires to mothers at each of the 5
TARGet Kids! primary care clinics. Ethnicity was measured using two sources on the same
respondents at least 1 year apart to minimize recall bias. The open-ended ethnicity question,
based on the Canadian census, was collected between December 2008 and September 2011 and
the new geographically based closed-ended ethnicity question was collected between September
2011 and July 2012.
The first ethnicity measurement, the open-ended ethnicity questions based on the
Canadian census, was used as the reference standard as it is commonly used in national census.7,8
We reclassified maternal ethnicity from mothers’ responses to the open-ended question based on
the new closed-ended geographically based ethnicity categories (see next section for the
development of these ethnicity categories). Geographic reclassification of the open-ended
questions was based on responses to three Canadian census questions relating to the parent’s
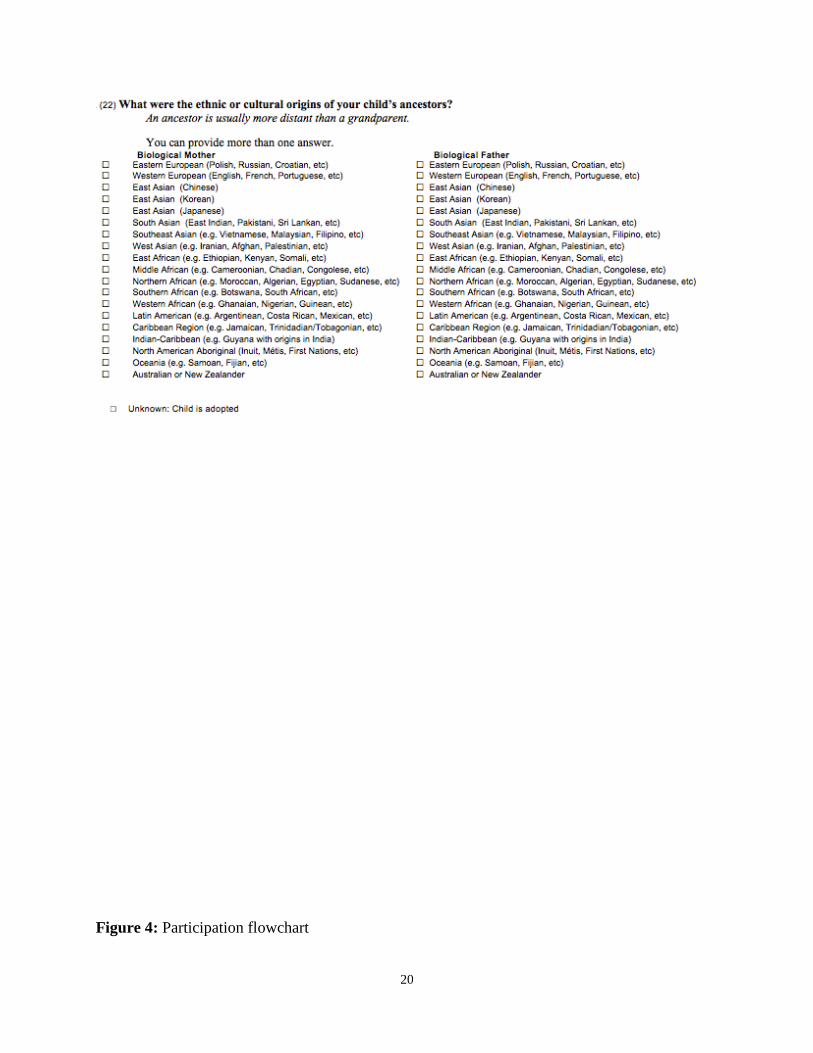
ethnicity, race and country of birth. Ethnicity: “What were the ethnic or cultural origins of your
child’s ancestors (an ancestor is usually more distant than a grandparent)?” Race: “Are
biological parents of your child (please answer for both parents): White, Chinese, South Asian
(e.g. East Indian, Pakistani, Sri Lankan, etc.), Black, Filipino, Latin American, Southeast Asian
(e.g. Vietnamese, Cambodian, Malaysian, etc.), Arab, West Asian (e.g. Iranian, Afghan, etc.),
Korean, Japanese, Other (please specify) or unknown child is adopted?” Country of birth:
“Where were your child’s biological parents born?” (see Figure 1). Two investigators (JO, SC)
independently reclassified responses of these three questions into 19 geographically based
ethnicity categories using the systematic process outlined in Figure 2: Eastern European,
Western European, East Asian (Chinese), East Asian (Korean), East Asian (Japanese), South

6
Asian, Southeast Asian, West Asian, East African, Middle African, Northern African, Southern
African, Western African (African sub-categories were), Latin American, Caribbean Region,
Indian-Caribbean, North American Aboriginal, Oceania and Australia or New Zealand8,15,16
Where open-ended responses were ‘White, Canadian and born in Canada’ we made the
assumption that individuals were of Western European ancestry. Differences in categorization
between reviewers were discussed and resolved by consensus 100% of the time. The reviewers
were blind to the response to the second closed-ended geographically based ethnicity questions.
The second ethnicity measurement was based on maternal response to the new
geographically based closed-ended maternal ethnicity question, (see figure 3),“What were the
ethnic or cultural origins of your child’s ancestors? (An ancestor is usually more distant than a
grandparent)”, responses included the 19 geographically based ethnicity categories: Eastern
European, Western European, East Asian (Chinese), East Asian (Korean), East Asian (Japanese),
South Asian, Southeast Asian, West Asian, East African, Middle African, Northern African,
Southern African, Western African (African sub-categories were based on United Nations
geographical divisions15), Latin American, Caribbean Region, Indian-Caribbean, North
American Aboriginal, Oceania and Australia or New Zealand.8,16 Authors JO, JM and MU, who
have different ethnic backgrounds, consulted with ethnicity experts and created the new closed
ended ethnicity question based on the United Nations geographic regions of the world15 which
could be collapsed into commonly used existing ethnicity categorizations (South Asian, Latin
American, West Asian, Chinese etc.).17
Research assistants at each TARGet Kids! site were provided with a list of countries that
fall under each geographic based ethnicity category to assist parents with categorization.
Ethnicity categories were identical for both the first ethnicity measurement (geographically

7
reclassified maternal response to open-ended Canadian census ethnicity questions) and the
second ethnicity measurement (parental response to the new geographically based closed-ended
maternal ethnicity question).
Maternal age, child age and sex, median household income and maternal foreign-born
status variables were measured to describe the study population. Maternal age was reported in
years, child’s age in months and sex as male or female. Median neighborhood household income
was calculated using the six-digit postal codes for each participant in order to obtain the median
after tax neighborhood household income (using the Statistics Canada Postal Code Conversion
File and data from the 2006 Canadian Census), which was used as a proxy for individual level
household income.18,19 Maternal foreign-born status was measured by the open-ended question
“Where were your child’s biological parents born?”
2.4 Statistical Analysis
Descriptive statistics including maternal age, child age and sex, median neighborhood
household income as well as maternal foreign-born status were performed. Frequency
distributions for the geographic ethnicity categories reclassified from the Canadian census open-
ended maternal ethnicity questions and reported from the new geographically based closed-
ended maternal ethnicity question were generated. The proportions of subjects who had non-
informative responses and whose ethnicity could not be geographically classified from the
Canadian census ethnicity questions were also calculated.
To determine the degree of agreement between geographic reclassification of the
Canadian census maternal ethnicity variables and the new geographically based closed-ended
maternal ethnicity variable a kappa analysis was performed. The kappa statistic reflects the
degree of agreement between the two ethnicity measurements, while removing the effect of
8
random agreement due to chance.20,21 Kappa values above 0.75 are considered to have a high
level of agreement.22,23 The sensitivity, specificity and overall accuracy of maternal ethnicity
from the re-classified Canadian census questions were calculated using the new geographically
based closed-ended maternal ethnicity variable as the reference. Sensitivity measures the degree
to which geographic reclassification of the Canadian census questions correctly classified an
individual with the same ethnicity response on the new close-ended geographically based
maternal ethnicity question, (ie. Western European in both measures).24 Specificity measures the
degree to which geographic reclassification of the Canadian census questions correctly classified
an individual with a different ethnicity response on the new close-ended geographically based
maternal ethnicity question (ie. not Eastern European in both measures when participant is, for
example, Western European).24 Overall accuracy was defined as the overall percent of
individuals that were classified correctly and calculated by summing the number of subjects
classified correctly for each ethnicity category, and dividing this by the total number of subjects
included in the analysis.25 To identify systematic trends in re-classification error we calculated
the percent of subjects misclassified for each ethnicity (number of subjects re-classified
incorrectly / total number of subjects with that ethnicity based on the new geographically based
closed ended ethnicity question). Ethnicities with > 10% misclassifications were explored.
Data was analyzed using SAS 9.3 for Windows (SAS Institute Inc. Cary, NC USA). The
study was approved by the Research Ethics Board of St. Michael’s Hospital and the Hospital for
Sick Children, Toronto, Canada and all parents/guardians of participating children provided
written consent to participate in this study.

9
3. Results
3617 children had responses to the open-ended maternal ethnicity question; this includes
all recruits to TARGet Kids! between Dec 2008 and July 2011. 170 participants could no be
reclassified due to non-sensible responses for example responses for religious affiliations could
not be accurately categorized into geographic ethnicity categories, spelling errors, and illegible
handwriting. This left 3447 children. 1777 children had responses to the new geographically
based closed-ended maternal ethnicity question; this includes children attending follow-up
appointments and new recruits between September 2011 and June 2012. 1047 mothers had
children who participated in TARGet Kids! on two occasions and had responses to both the
Canadian census open-ended maternal ethnicity questions and the new geographically based
closed-ended maternal ethnicity question between 2008 and June 2012. Of these respondents 185
were excluded due to multiple ethnicities and 862 mothers were included in the analysis (see
Figure 4).
Mean maternal age was 34 years, mean child age at baseline was 26 months (range: 12-
75 months) and 50% of the children were male. The median neighborhood household income
was $57,000 (range: 16,000 – 269,000) and 268 mothers (31%) were born outside of Canada (see
table 1).
374 (43%) of the open-ended ethnicity responses from the Canadian census required use
of data from additional questions (i.e. race or country of birth) in order to reclassify the
participant’s ethnicity into the new standardized closed-ended geographically based ethnicity
categorization.

10
The frequency distributions for maternal ethnicity are outlined in table 2 by both
measures of ethnicity. The most common ethnicities were Western European (n=569, 66%),
Eastern European (n=99, 11%), East Asian (Chinese) (n=47, 5%), South Asian (n=41, 5%), and
Southeast Asian (n=40, 5%).
3.1 Agreement between measures of ethnicity
There was good agreement between the two maternal ethnicity measurements - kappa
0.87, 95% CI: 0.84-0.90.22 The overall accuracy, for the re-classification of the open-ended
Canadian census ethnicity questions was 93%. The sensitivity and specificity of the re-classified
open ended Canadian census maternal ethnicity questions ranged from 83-100% and 96-100%
respectively (see table 2).
3.2 Ethnicity misclassification
Ethnicities with > 10% misclassifications were explored. We incorrectly classified
Eastern European as Western European 31 out of 125 times (25%), West Asian as Eastern
European 2 out of 9 times (22%), West Asian as South Asian 1 out of 9 times (11%), Latin
American as Western European 4 out of 28 times (14%), Caribbean as Indian-Caribbean 1 out of
8 times (12%), Indian-Caribbean as Caribbean 1 out of 1 times and North American Aboriginal
as Western European 2 out of 3 times (67%).
4. Discussion
Classifying ethnicity is important for describing ethnicity variation in disease risk of
populations.1 Governments and private organizations have used a number of different
classifications of ethnicity (see Table 3).8,26-28 We have created a new standardized closed-ended

11
geographically based ethnicity question based on world geographic regions defined by the
United Nations to overcome many of the barriers inherent in open-ended ethnicity questions. In
this study, we have evaluated the degree of agreement between the new standardized closed-
ended geographically based ethnicity question and geographic reclassification of the open-ended
ethnicity related questions from the Canadian census. Geographic reclassification of maternal
ethnicity from existing open-ended Canadian census questions resulted in good agreement with,
the new standardized closed-ended geographically based question with a high degree of
accuracy.
Measuring ethnicity from open-ended questions has the advantage of allowing
participants to self-define their ethnicity. However, open-ended questions introduce considerable
analytical challenges in interpreting responses. Further, open-ended questions can result in non-
sensible, non-useful or arbitrary responses particularly when the respondent misunderstands the
question. A closed-ended question, on the other hand, is more objective, limits the respondent to
answer based on pre-defined categories, minimizes risk of misunderstanding and simplifies
analysis and reporting. Our new standardized closed-ended geographically based ethnicity
question offers a number of advantages over open-ended ethnicity questions including
simplifying data cleaning, statistical analysis and interpretation. It is also possible to collapse the
new standardized closed-ended geographically based ethnicity categories into commonly used
ethnicity categorizations (South Asian, Latin American, West Asian, Chinese) or combined with
questions about skin pigmentation to identify race (White, Black) (see table 3).
Our findings suggest that existing open-ended census questions can be converted to the
new standardized closed-ended geographically based ethnicity question with fidelity. This may
12
facilitate harmonizing responses from open-ended census based ethnicity questions with the new
standardized closed ended question allowing for consistency of measurement over time.
The most common problems we faced with reclassifying ethnicity from open-ended
questions resulted from non-uniform or non-useful open-ended responses and errors resulting
from participant misunderstanding of the open-ended questions. For example, 11% of
respondents to the open-ended Canadian census ethnicity question identified their ethnicity as
Canadian, 2% as Caucasian and 7% as a religious affiliation requiring us to use race or country
of birth questions to classify ethnicity. Further, 16% of subjects (n=541) identified ethnicity as a
White, Canadian, and born in Canada and were assumed to be of Western European ethnicity.
This assumption may explain why Eastern European was incorrectly classified as Western
European 25% of the time. Such errors may not have occurred if the question had been closed-
ended and without the option of ‘Canadian’ as a response. Thus, prospective measurement of
ethnicity using the new standardized closed-ended geographically based ethnicity question may
decrease ethnicity measurement error.
An ongoing challenge related to measuring ethnicity by a closed-ended question is that
individuals may not know the geographical origin of their ancestors. However, a participant who
is unaware of their ancestral origins would likely respond inaccurately to an open-ended
ethnicity question as well.
This study has several limitations. The large number of subjects with European ancestry
and the relatively small number of subjects with African, Caribbean, and Aboriginal ancestry
resulted in less power to detect misclassification of the open-ended questions in individuals with
these ethnicities. Further, some ethnicity categories, such as North American Aboriginal, the
numbers are small and these results should be interpreted with caution. A language barrier could

13
have precluded some families from participating in this study. However, only 0.4% of eligible
children were excluded because of language barrier. The median household income in this study
was $57,000 suggesting a relatively high SES among participating families.29 However, this is
lower than the median household income in Toronto for families with children which, according
to Canadian 2010 census, was $68,110 in 2010.30
Although open- and closed-ended responses were separated in time by at least one year to
minimize recall bias, it is possible that individuals may perceive their ethnicity differently over
time due to a change in immigration status, nationality, intermarriage or assimilation. However,
response to a question regarding ancestral geographical origin should not change. Although the
standardized closed-ended geographically based ethnicity question offers many analytic
advantages over open-ended questions, it may take respondents longer to complete the closed
ended question as the respondent may not be familiar with geographic classification. Finally,
although multiple ethnicity responses were allowed with both open- and closed-ended questions,
these individuals (representing 18% of mothers) were excluded from our analysis due to small
numbers of each mixed ethnicity category.
We hope the new standardized closed-ended geographically based ethnicity question will
be useful for groups involved in primary data collection particularly among ethnically diverse
populations where accurate measurement of ethnicity is most challenging yet increasingly
important.

14
5. Conclusion
The new standardized closed-ended geographically based ethnicity question represents a
practical alternative to widely used open-ended ethnicity questions. Reclassification of open-
ended ethnicity questions from the Canadian census resulted in good agreement with the new
standardized closed-ended question. The new standardized closed-ended geographically based
ethnicity question may reduce risk of misinterpretation of ethnicity by respondents, simplify
analysis and improve the accuracy for which ethnicity is measured.

15
Acknowledgements
Sources of funding: This work was supported by an unrestricted master’s award from the
Canadian Institutes of Health Research (CIHR), priority announcement Nutrition and Dietetic
Research (SHOPP) in partnership with the Canadian Foundation for Dietetic Research. Overall
support for the TARGet Kids! programme was provided by the CIHR Institute of Human
Development, Child and Youth Health (IHDCYH) and the Institute of Nutrition Metabolism and
Diabetes (INMD), as well as the St. Michael’s Hospital Foundation. The Paediatric Outcomes
Research Team (PORT) is supported by a grant from The Hospital for Sick Children Foundation.
The funding agencies had no role in the design, collection, analyses or interpretation of the study
results.
Conflict of interest: The authors have no financial relationships relevant to this article and no
conflicts of interest to disclose.
Authors’ contributions: All authors identified on this manuscript are responsible for the reported
research and helped design the research study. J.A.O. and J.L.M. analyzed the data. J.A.O.,
J.L.M. and M.U developed the measurement tool. P.B.D., P.C.P. and C.S.B. helped to refine the
study design. M.K., and S.C. coordinated data collection and supervised the field activities. All
authors contributed to the interpretation of the results. J.A.O. and J.L.M. drafted the manuscript.
All authors read and approved the final manuscript as submitted.
Acknowledgements: The authors thank the practitioners, paediatric and family medicine
practices and families who are currently involved in the TARGet Kids! research network.
TARGet Kids! Collaboration Site Investigators: Tony Barozzino, Gary Bloch, Ashna Bowry,
Douglas Campbell, Sohail Cheema, Brian Chisamore, Karoon Danayan, Anh Do, Michael
Evans, Mark Feldman, Sloane Freeman, Moshe Ipp, Sheila Jacobson, Tara Kiran, Holly
Knowles, Eddy Lau, Fok-Han Leung, Julia Morinis, Sharon Naymark, Patricia Neelands,
Michael Peer, Marty Perlmutar, Navindra Persaud, Michelle Porepa, Noor Ramji, Alana
Rosenthal, Janet Saunderson, Michael Sgro, Susan Shepherd, Carolyn Taylor, Sheila
Wijayasinghe, Ethel Ying and Elizabeth Young.
Steering Committee: Tony Barozzino, Brian Chisamore, Mark Feldman and Moshe Ipp.
Research Team (Managers/Coordinators/Research Assistants): Azar Azad, Tonya D’Amour,
Sarah Carsley, Julie DeGroot, Kanthi Kavikondala, Marina Khovratovich, Tarandeep Malhi,
Magda Melo, Subitha Rajakumaran, Juela Sejdo and Laurie Thompson.
Applied Health Research Centre: Muhammad Mamdani, Andreas Laupacis, David Klein, Gerald
Lebovic, Kevin Thorpe, Magda Melo, Kim Phu, Judith Hall and Rino La Grassa, Bryan
Boodhoo, Nike Onabajo, Karen Pope.

16
References
1. Cruickshank J, Beevers D. Ethnic Factors in Health and Disease. Boston, MA: Wright;
1989.
2. Bhopal R. Glossary of terms relating to ethnicity and race: for reflection and debate. J
Epidemiol Community Health. 2004;58(6):441-445.
3. U.S. Department of Health and Human Services Office of Minority Health. Assuring
Cultural Competence in Health Care: Recommendations for National Standards and
Outcomes-Focused Research Agenda. Washington, DC: U.S. Government Printing
Office: ;2000.
4. Kaufman J, Cooper R. Commentary: Considerations for Use of Racial/Ethnic
Classifications in Etiology Research. Am J Epidemiol. 2001;154(4):291-298.
5. Statistics Canada and U.S. Bureau of the Census. Challenges of Measuring an Ethnic
World: Science, Politics and Reality. U.S. Government Printing Office, Washington, DC.
1993.
6. Winker MA. Measuring Race and Ethnicity: Why and How? JAMA. 2004;292(13).
7. Statistics Canada. Ethnic Origin Reference Guide, 2006 Census. 2011;
http://www12.statcan.gc.ca/census-recensement/2006/ref/rp-guides/ethnic-ethnique-
eng.cfm. Accessed September, 2012.
8. Statistics Canada. Canadian Community Health Survey. 2004;
http://www.statcan.gc.ca/concepts/health-sante/content-contenu-eng.htm. Accessed April
10th, 2012.
9. Morning A. Ethnic Classification in Global Perspective: A Cross-National Survey of the
2000 Census Round. Popul Res Policy Rev. 2008;27(2):239-272.
10. Jackson S. Research Methods: A Modular Approach. Belmont, California: Thomson
Wadsworth; 2008.
11. Unite for Sight. Survey Methodologies. 2011; http://www.uniteforsight.org/global-health-
university/survey-methodologies - _ftn3. Accessed September, 2012.
12. Converse JM, Presser S. Survey questions: handcrafting the standardized questionnaire.
California: Sage Publications Inc; 1986.
13. Statistics Canada. Previous standard - Ethnicity. 2012;
http://www.statcan.gc.ca/concepts/definitions/previous-anterieures/ethnicity-ethnicite2-
eng.htm. Accessed September, 2012.
14. Census. Immigration in Canada: A Portrait of the Foreign-born Population, 2006 Census.
2006; http://www12.statcan.ca/census-recensement/2006/as-sa/97-557/index-eng.cfm.
15. United Nations. United Nations Statistical Divisions. 2011;
http://unstats.un.org/unsd/methods/m49/m49regin.htm. Accessed October 9th, 2012.
16. Statistics Canada. Appendix C: Comparison of ethnic origins disseminated in 2006, 2001
and 1996. 2008; http://www12.statcan.gc.ca/census-recensement/2006/ref/dict/app-
ann003-eng.cfm. Accessed June 17, 2012.
17. O'Reilly J, Yau M, Manning S. 2008 Parnet Census, Kindergarten-Grade 6: System
overview and detailed findings Toronto District School Board: Research Report. 2009.
18. Faculty of Arts and Science, University of Toronto. Canadian Census Analyser 2010.
http://dc.chass.utoronto.ca/census/index.html. Accessed October, 2012.
19. Hanley GE, Morgan S. On the validity of area-based income measures to proxy
household income. BMC health services research. 2008;8:79.

17
20. Cohen J. A coefficient of agreement for nominal scales. Educ Psychol Measurement.
1960;20(1):37-46.
21. Schoenback VJ. Sources of error: A systematic framework for identifying potential
sources and impact of distortion in observational studies, with approaches to maintaining
validity. 2001; http://www.epidemiolog.net/. Accessed October 10th, 2012.
22. Landis J, Koch G. The Measurement of Observer Agreement for Categorical Data.
Biometrics. 1977;33(1):159-174.
23. Green AM. Kappa Statistics for Multiple Raters Using Categorical Classifications.
Westat, Inc, Research Triangle Park, N.C.
24. Parikh R, Mathai A, Parikh S, Sekhar GC, Thomas R. Understanding and using
sensitivity, specificity and predictive values. Indian J Ophthalmol. 2008;56(1):45-50.
25. Congalton RG. A Review of Assessing the Accuracy of Classifications of Remotely
Sensed Data. Remote Sens. Environ. 1991;37:35-46.
26. Ford ME, Kelly PA. Conceptualizing and categorizing race and ethnicity in health
services research. Health Serv Res. Oct 2005;40(5 Pt 2):1658-1675.
27. Centers for Disease Control and Prevention. National Health and Nutrition Examination
Survey: Note on 2007-2010 Sampling Methodology. 2011;
http://www.cdc.gov/nchs/nhanes/nhanes2007-2008/sampling_0708.htm. Accessed March
8, 2013.
28. Toronto District School Board. Student Census Survey. 2011;
http://www.tdsb.on.ca/_site/ViewItem.asp?siteid=310&menuid=39563&pageid=33197.
Accessed March 8, 2013.
29. Toronto Social Development Finance & Administration. Profile of Low Income in the
City of Toronto. 2010;
http://www.toronto.ca/demographics/pdf/poverty_profile_2010.pdf. Accessed March 7,
2013.
30. Statistics Canada. Median total income, by family type, by census metropolitan area.
2012; http://www.statcan.gc.ca/tables-tableaux/sum-som/l01/cst01/famil107a-eng.htm.
Accessed November 21st, 2012.
31. Statistics Canada. The Arab Community in Canada. 2007;
http://www.statcan.gc.ca/pub/89-621-x/89-621-x2007009-eng.htm. Accessed March 7,
2013.
Figure 1: Canadian census ethnicity questions8

18
Figure 2: Process for reclassification of the open-ended Canadian census maternal ethnicity
responses according to the new standardized closed-ended geographically based ethnicity
categories

19
Figure 3: New standardized closed-ended geographically based ethnicity question
20
Figure 4: Participation flowchart

21
Table 1: Baseline demographics for children included in the analysis

22
Participants included in the analysis
n = 862
Characteristic Median (CI) or N (%)
Child’s age (months) 26 (12 - 75)
Maternal age (years) 34 (14 – 63)
Sex (males) 426 (50%)
Median household income ($) 57,000 (16,000–269,000)
Maternal foreign-born 268 (31%)
Maternal Ethnicity
Eastern European
Western European
East Asian (Chinese)
East Asian (Korean)
East Asian (Japanese)
South Asian
Southeast Asian
West Asian
East African
Middle African
Northern African
Southern African
Western African
Latin American
Caribbean Region
Indian-Caribbean
North American Aboriginal
Oceania
Australian or New Zealander
99 (11%)
569 (66%)
47 (5%)
11 (1%)
12 (1%)
41 (5%)
40 (5%)
6 (1%)
2 (0.2%)
0
0
0
0
26 (3%)
7 (1%)
1 (0.1%)
1 (0.1%)
0
0

23
Table 2: Frequency of maternal ethnicity categories and sensitivity and specificity of the
ethnicity measurements
Geographic
reclassification of open-
ended ethnicity from the
Canadian census
n = 862
New standardized
closed-ended
geographically based
ethnicity
n = 862
Sensitivity
(true positive) /
(true positive +
false negative)
Specificity
(true negative) /
(true negative +
false positive)
Maternal Ethnicity n (%) n (%) Estimated
value
(95% CI)
Estimated
value
% (95% CI) Eastern European
Western European
East Asian (Chinese)
East Asian (Korean)
East Asian (Japanese)
South Asian
Southeast Asian
West Asian
East African
Middle African
Northern African
Southern African
Western African
Latin American
Caribbean Region
Indian-Caribbean
North American Aboriginal
Oceania
Australian or New Zealander
99 (11%)
569 (66%)
47 (5%)
11 (1%)
12 (1%)
41 (5%)
40 (5%)
6 (0.7%)*
2 (0.2%)*
0
0
0
0
26 (3%)
7 (0.8%)*
1 (0.1%)*
1 (0.1%)*
0
0
125 (15%)
539 (62%)
48 (6%)
13 (2%)
11 (1%)
42 (5%)
33 (4%)
9 (1%)*
2 (0.2%)*
0
0
0
0
28 (3%)
8 (0.9%)*
1 (0.1%)*
3 (0.3%)*
0
0
93 (87-98)
94 (91-95)
96 (84-99)
100 (68-100)
92 (60-99.6)
95 (82-99)
83 (67-92)
NA
NA
NA
NA
NA
NA
92 (73-99)
NA
NA
NA
NA
NA
96 (94-97)
96 (94-98)
99.6 (98.8-99.9)
99.8 (99.1-99.9)
100 (99-100)
99.6 (98.8-99.9)
100 (99-100)
NA
NA
NA
NA
NA
NA
99.5 (99.7-99.8)
NA
NA
NA
NA
NA
* Results should be interpreted with caution as some ethnicity categories have small sample sizes
NA = not applicable. We did not calculate sensitivity or specificity for ethnicities categories with n<10

24
TABLE 3: Examples of how the new standardized closed-ended geographically based
ethnicity question can be collapsed into commonly used ethnicity categorizations
Canadian
Census
(CCHS)*
New standardized
closed-ended
geographically based
ethnicity question
American
Census
(NHANES)**
New standardized
closed-ended
geographically based
ethnicity question
White Eastern European
Western European
Australian or New
Zealander
Non-Hispanic
white
Eastern European
Western European
Australian or New
Zealander
Black East African
Middle African
Southern African
Western African
Caribbean Region
Non-Hispanic
black
East African
Middle African
Northern African
Southern African
Western African
Caribbean Region
Latin
American
Latin American Mexican
American
Latin American
Other Hispanic N/A
South Asian South Asian
Indian-Caribbean
Other race
including
multiracial
South Asian
Southeast Asian
Oceania
West Asian
East Asian (Korean)
East Asian (Japanese)
East Asian (Chinese)
North
American Aboriginal
Indian-Caribbean
Southeast
Asian
Filipino
Southeast Asian
Oceania
West Asian
Arab
West Asian
Northern African 31
Korean East Asian (Korean)
Japanese East Asian (Japanese)
Chinese East Asian (Chinese)
Other North
American Aboriginal
* Canadian Community Health Survey (CCHS) 8
** National Health and Nutrition Examination Survey (NHANES) 27