evaluating family group decision making: strengthening ... · pdf filehow to measure? were the...
TRANSCRIPT

Evaluating family group decision making: Strengthening practice through measuring and monitoring fidelity
Panel Presentation at the National Child Welfare Evaluation Summit
August 29-31, 2011 Washington DC

Panel Objectives
• Assist those attending to consider the value as well as the necessary strategies for measuring and implementing the assessment of fidelity to family group decision making in their agency, county or state.
Achievement of Family Group Conferencing (FGC) Objectives: Survey Development JOAN PENNELL, PHD, MSW

FAMILY GROUP CONFERENCING What is it?
• Family group = natural + formed group • Voluntary group process • Participatory decision making • Intervention to widen circle of support
What it is NOT? • Group therapy • Mediation between parties • Legal proceedings
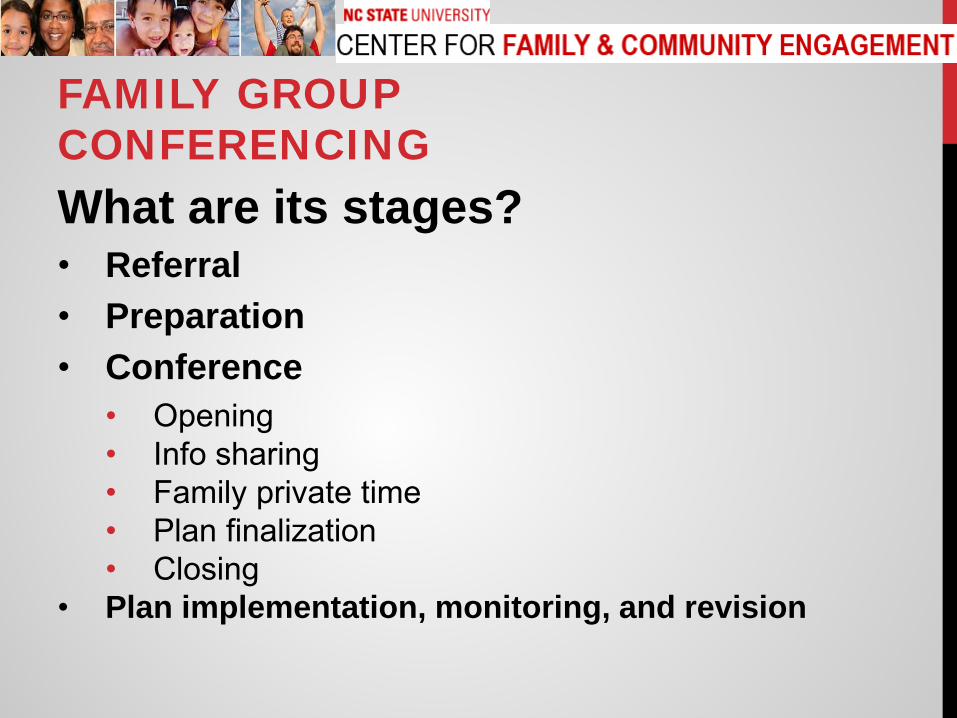
FAMILY GROUP CONFERENCING What are its stages? • Referral • Preparation • Conference
• Opening • Info sharing • Family private time • Plan finalization • Closing
• Plan implementation, monitoring, and revision
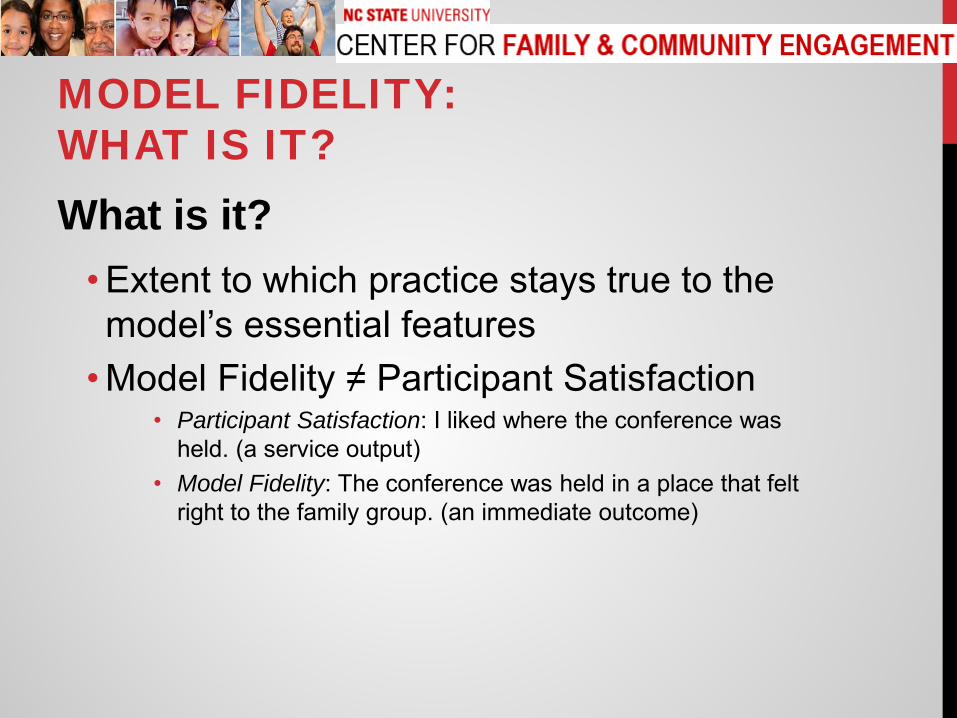
MODEL FIDELITY: WHAT IS IT? What is it?
• Extent to which practice stays true to the model’s essential features
• Model Fidelity ≠ Participant Satisfaction • Participant Satisfaction: I liked where the conference was
held. (a service output) • Model Fidelity: The conference was held in a place that felt
right to the family group. (an immediate outcome)

MODEL FIDELITY: HOW TO MEASURE? Were the main steps carried out? • Planned activities versus actual outputs
• Check list of preparation tasks for FGC coordinators/facilitators:
• Discussed family with referring worker • Contacted family representative and explained FGC
process • Developed invitation list with family • etc.
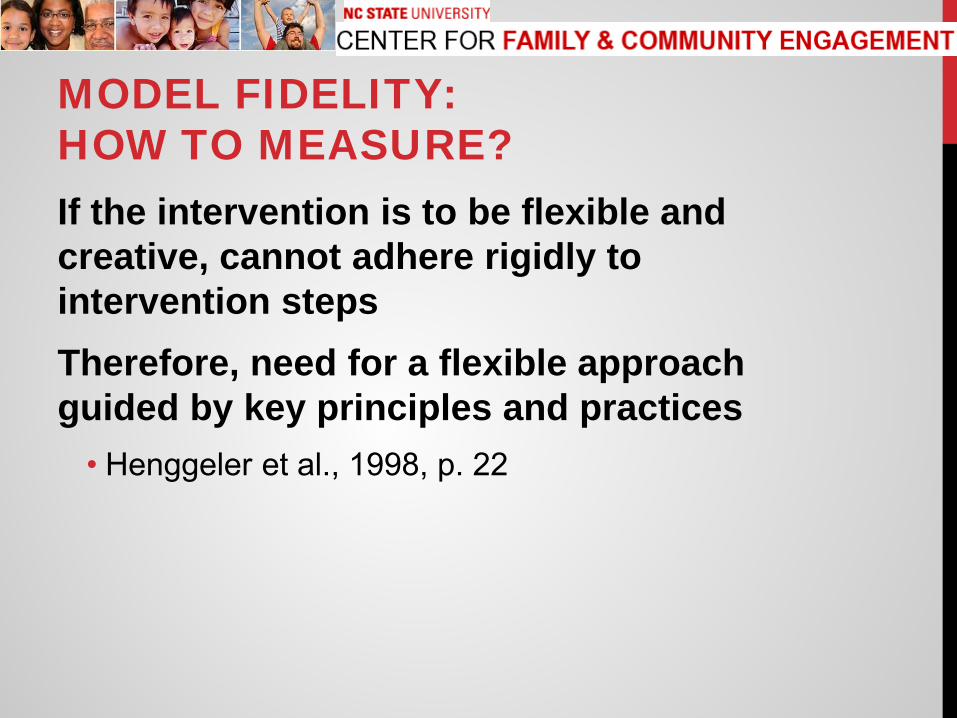
MODEL FIDELITY: HOW TO MEASURE? If the intervention is to be flexible and creative, cannot adhere rigidly to intervention steps Therefore, need for a flexible approach guided by key principles and practices
• Henggeler et al., 1998, p. 22
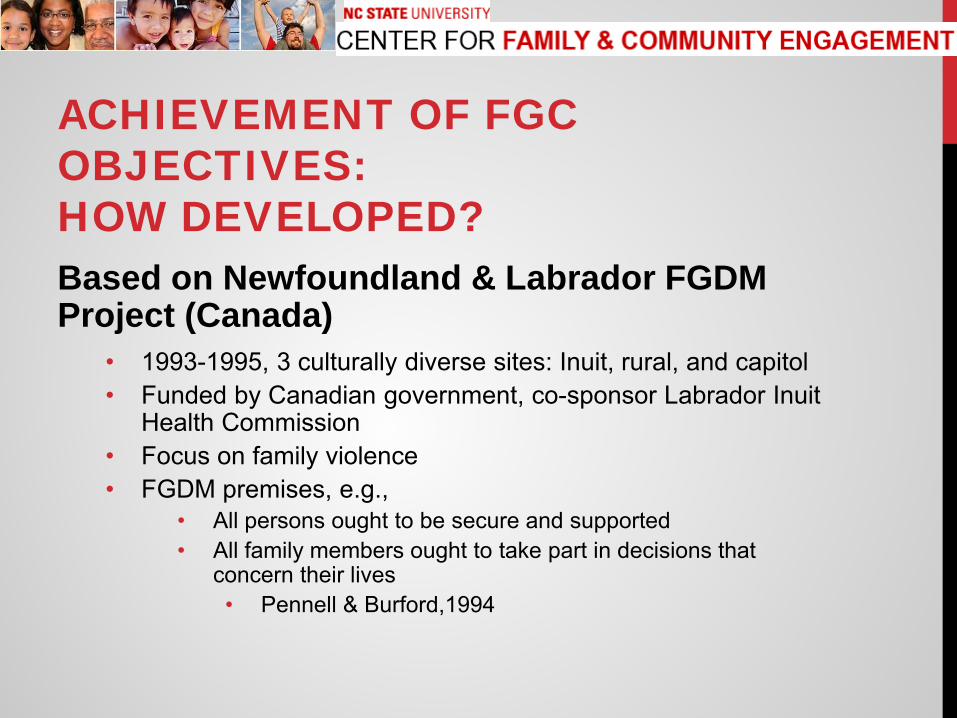
ACHIEVEMENT OF FGC OBJECTIVES: HOW DEVELOPED? Based on Newfoundland & Labrador FGDM Project (Canada)
• 1993-1995, 3 culturally diverse sites: Inuit, rural, and capitol • Funded by Canadian government, co-sponsor Labrador Inuit
Health Commission • Focus on family violence • FGDM premises, e.g.,
• All persons ought to be secure and supported • All family members ought to take part in decisions that
concern their lives • Pennell & Burford,1994
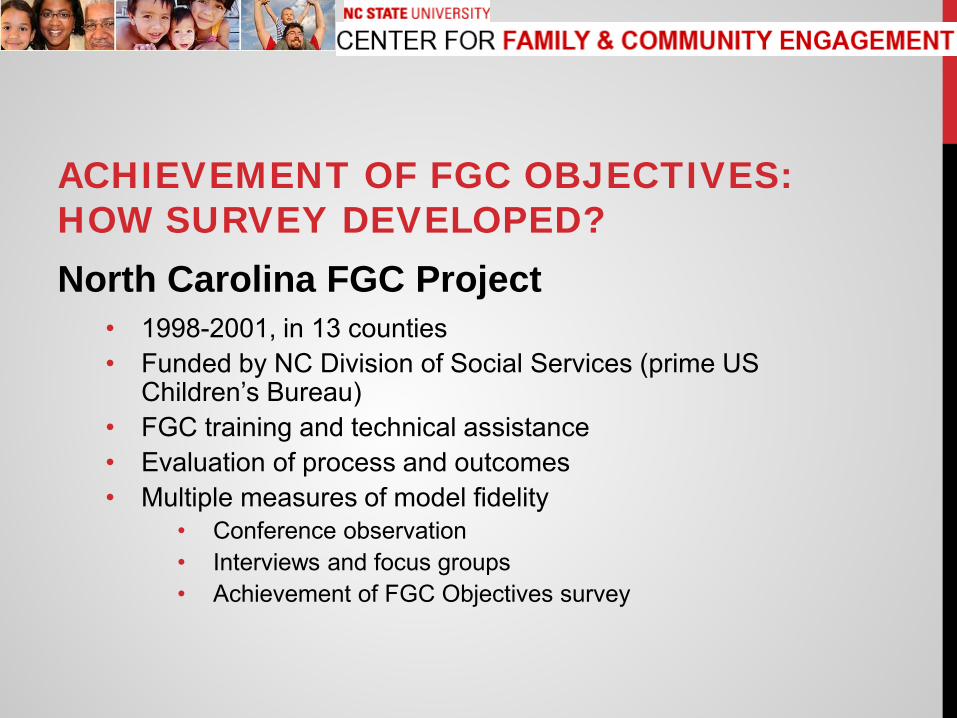
ACHIEVEMENT OF FGC OBJECTIVES: HOW SURVEY DEVELOPED? North Carolina FGC Project
• 1998-2001, in 13 counties • Funded by NC Division of Social Services (prime US
Children’s Bureau) • FGC training and technical assistance • Evaluation of process and outcomes • Multiple measures of model fidelity
• Conference observation • Interviews and focus groups • Achievement of FGC Objectives survey

ACHIEVEMENT OF FGC OBJECTIVES: HOW SURVEY DEVELOPED?
FGC PRINCIPLE
Have the conference belong to the family group
RELATED PRACTICES
Give reasons for conference that family group and professionals agree with Hold conference in place and way that fits family’s culture Invite more family group than service providers

ACHIEVEMENT OF FGC OBJECTIVES: HOW SURVEY DEVELOPED?
PRACTICE
Hold conference in place and way that fits family’s culture
SURVEY ITEMS
The conference was held in a place that felt right to the family group. The conference was held in a way that felt right to the family group (ex., the right food, right time of day).
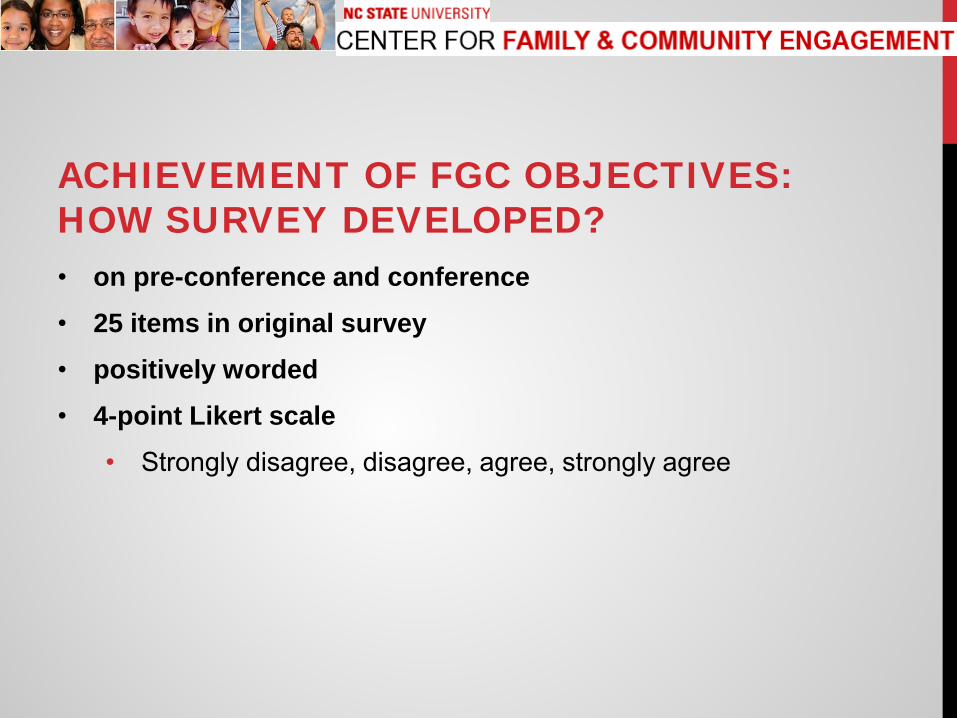
ACHIEVEMENT OF FGC OBJECTIVES: HOW SURVEY DEVELOPED? • on pre-conference and conference
• 25 items in original survey
• positively worded
• 4-point Likert scale
• Strongly disagree, disagree, agree, strongly agree
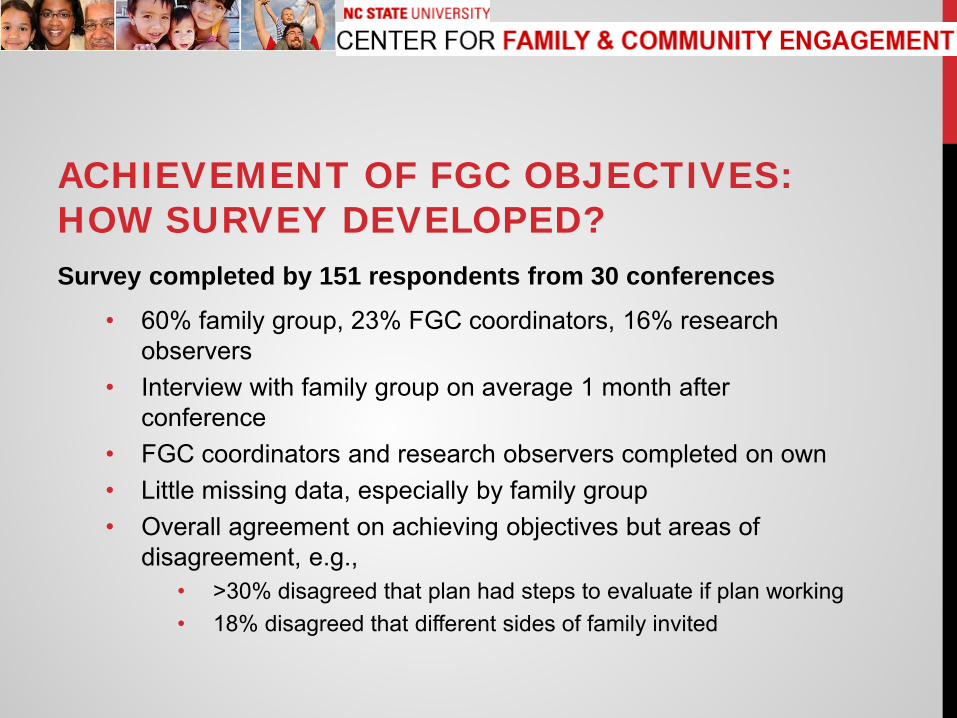
ACHIEVEMENT OF FGC OBJECTIVES: HOW SURVEY DEVELOPED? Survey completed by 151 respondents from 30 conferences
• 60% family group, 23% FGC coordinators, 16% research observers
• Interview with family group on average 1 month after conference
• FGC coordinators and research observers completed on own • Little missing data, especially by family group • Overall agreement on achieving objectives but areas of
disagreement, e.g., • >30% disagreed that plan had steps to evaluate if plan working • 18% disagreed that different sides of family invited
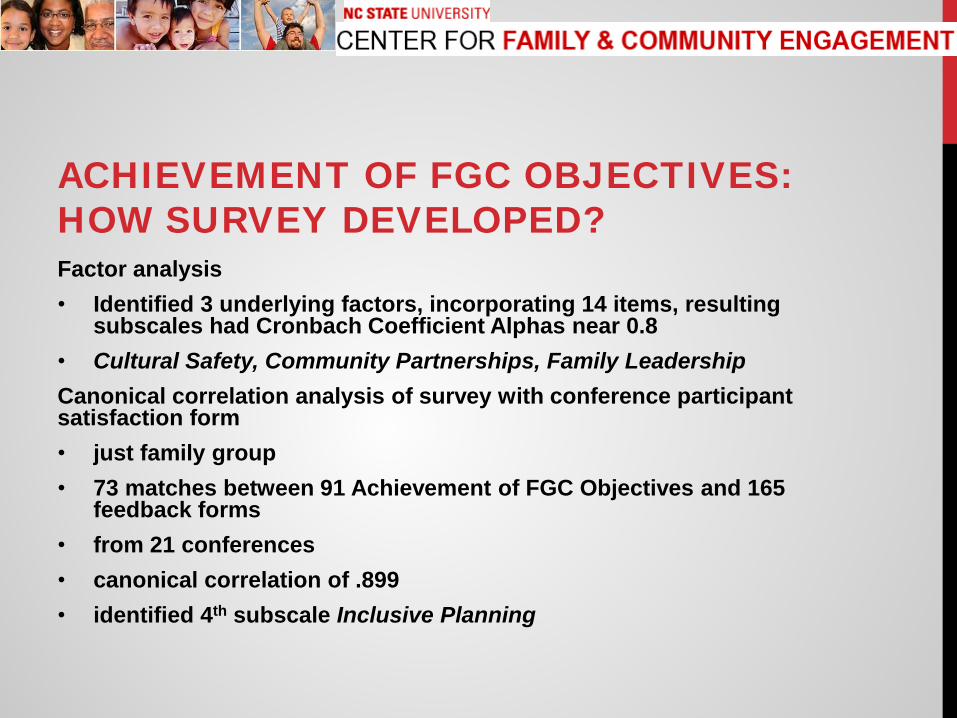
ACHIEVEMENT OF FGC OBJECTIVES: HOW SURVEY DEVELOPED? Factor analysis • Identified 3 underlying factors, incorporating 14 items, resulting
subscales had Cronbach Coefficient Alphas near 0.8 • Cultural Safety, Community Partnerships, Family Leadership Canonical correlation analysis of survey with conference participant satisfaction form • just family group • 73 matches between 91 Achievement of FGC Objectives and 165
feedback forms • from 21 conferences • canonical correlation of .899 • identified 4th subscale Inclusive Planning
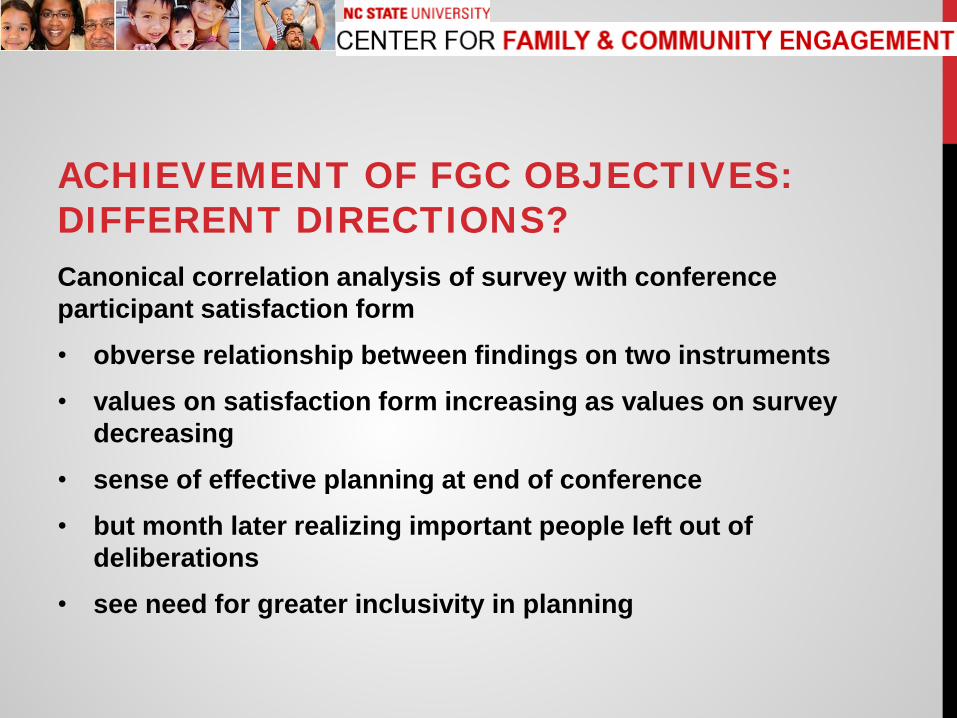
ACHIEVEMENT OF FGC OBJECTIVES: DIFFERENT DIRECTIONS? Canonical correlation analysis of survey with conference participant satisfaction form
• obverse relationship between findings on two instruments
• values on satisfaction form increasing as values on survey decreasing
• sense of effective planning at end of conference
• but month later realizing important people left out of deliberations
• see need for greater inclusivity in planning
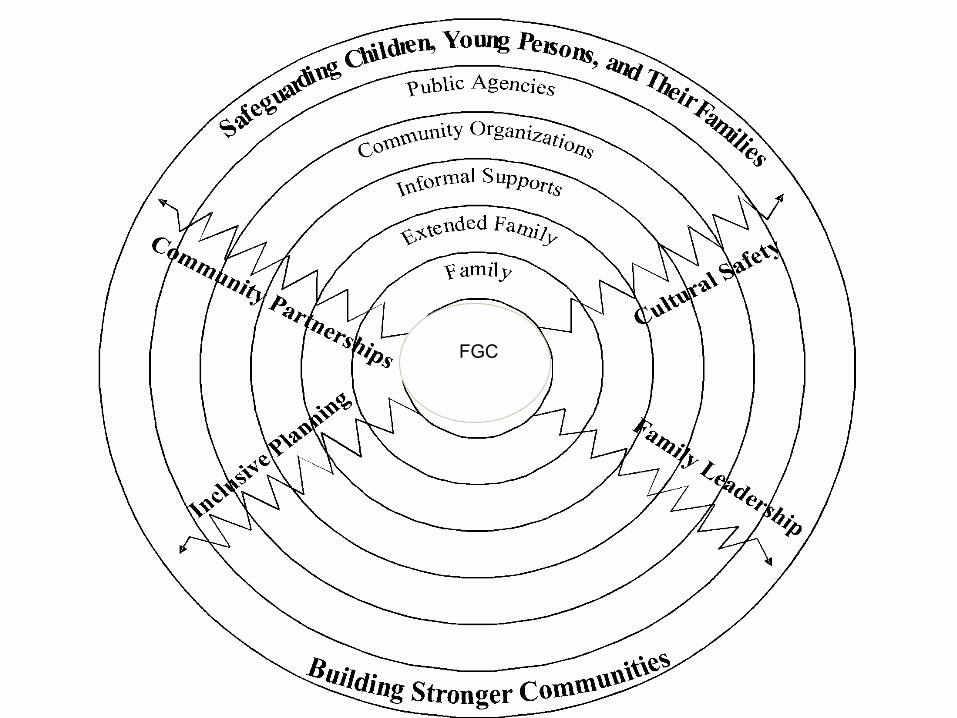
FGC

CONTACT INFORMATION Joan Pennell, MSW, PhD Professor & Director Center for Family & Community Engagement North Carolina State University phone: 919-513-0008 fax: 919-513-7980 www.cfface.org
Evaluating family group decision making: Strengthening practice through measuring and monitoring fidelity
Measuring fidelity to FGDM in Pennsylvania
Mary E. Rauktis, PhD. Child Welfare Education and Research Programs, School of Social Work 8.30.2011 National Child Welfare Evaluation Summit August 29-31, 2011 Washington DC
Pennsylvania Model
• Based on the Family Unity Model and the Family Group Conferencing process established in New Zealand
• Decentralized or “grass roots” approach to adoption and implementation rather than legislative or financial mandate
• As of 2010, 65 of the 67 counties in Pennsylvania are implementing Family Group Decision Making (FGDM)
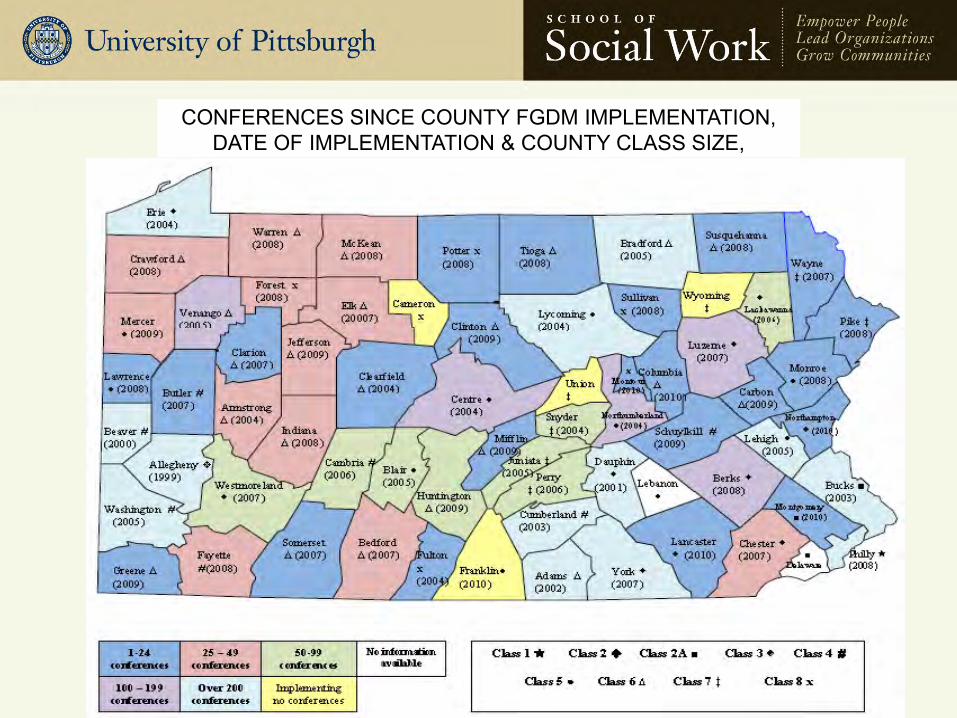
CONFERENCES SINCE COUNTY FGDM IMPLEMENTATION, DATE OF IMPLEMENTATION & COUNTY CLASS SIZE,
December 2010
Fidelity to FGDM Model Measurement Wish List
• Free , brief & self-administered
• Reliable
• Able to be completed by a wide range of individuals
• Good psychometric properties--face and construct validity
• Able to be scanned
Entire process had to be cost neutral –no additional funds or support

• Achievement of Family Group Conferencing Objectives (Pennell) •17 items using a 4-point strongly disagree to strongly agree •Worded positively and all in the same direction •The “family group” is the object of the rating rather than the individual
•Scan form

Feasibility Problems
• Unanimous dislike of the “look and feel” of the scan form
• Difficulties with object change & language
• FGDM professionals felt that the ordering of responses was not consistent with the values of FGDM
• Providers uncomfortable with how information would be used

Steps • Held networking conference calls with
FGDM coordinators and facilitators throughout the state to gather information & build support for fidelity
• Did cognitive interviewing with family members
• Examined completed surveys & descriptive analyses
• Applied Item Response Theory (IRT) methodology
Cognitive Interviewing
• Focuses on the cognitive processes that respondents use to answer survey questions; covert processes that are normally hidden, as well as overt, observable ones, are studied
• Helps to weed out “noise” or responses to un-intended stimuli in items
• Conducted by members of evaluation subcommittee
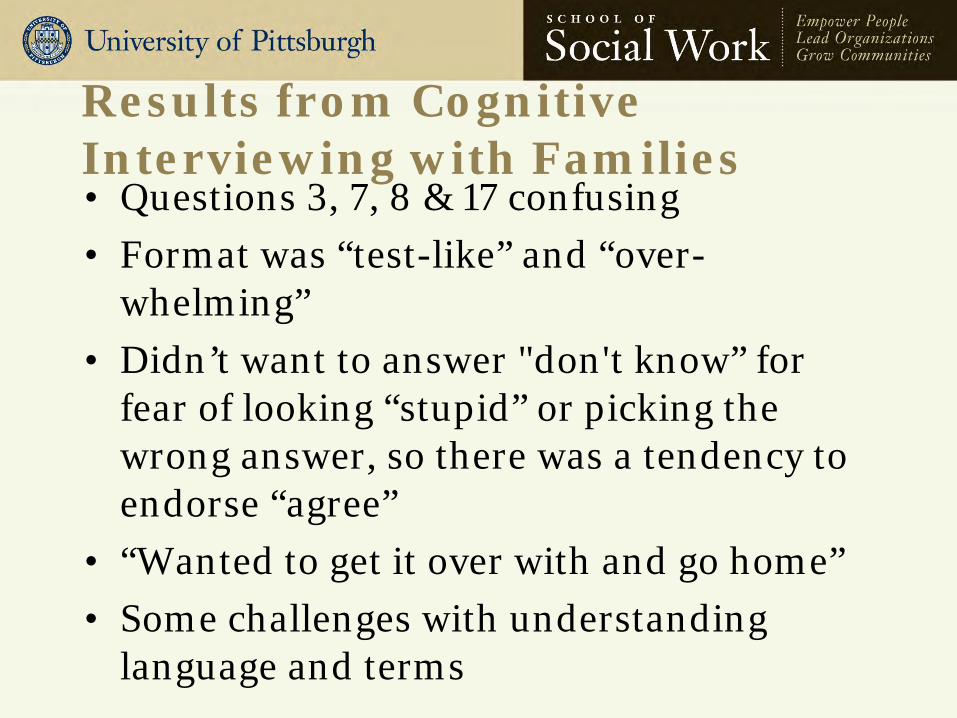
Results from Cognitive Interviewing with Families • Questions 3, 7, 8 & 17 confusing
• Format was “test-like” and “over-whelming”
• Didn’t want to answer "don't know” for fear of looking “stupid” or picking the wrong answer, so there was a tendency to endorse “agree”
• “Wanted to get it over with and go home”
• Some challenges with understanding language and terms

Visual Inspection of Surveys & Descriptive Analysis • “Messy” surveys were not scanning
• 11% of the respondents endorsing the “other” in relationship code or two codes resulting in not being scanned
• Missing data: Item 17 had 25% missing data
• Missing demographic data
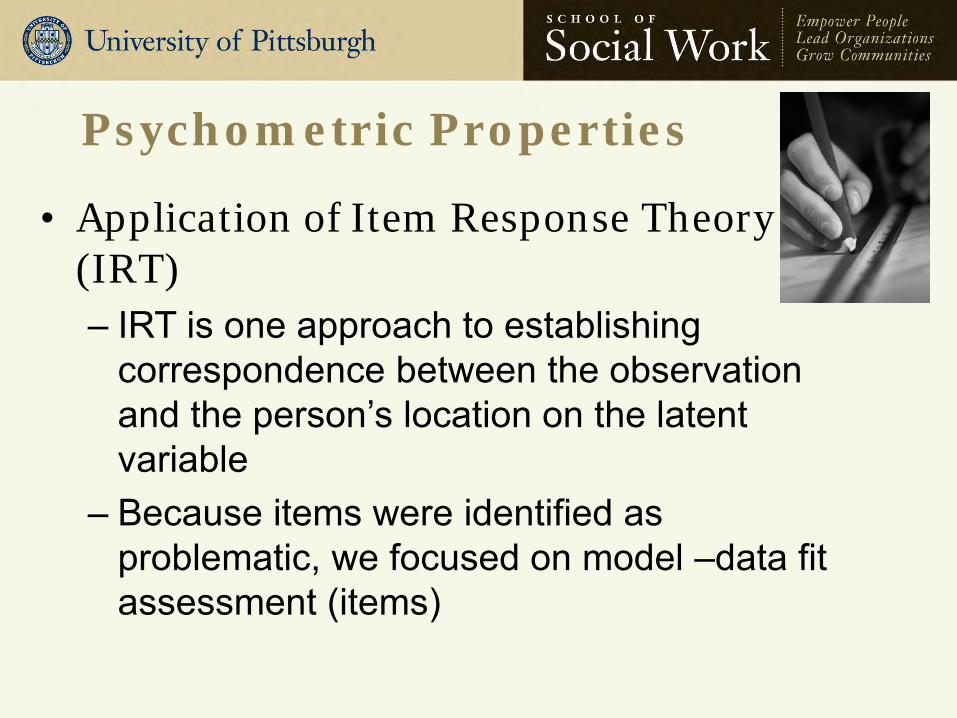
Psychometric Properties
• Application of Item Response Theory (IRT) – IRT is one approach to establishing
correspondence between the observation and the person’s location on the latent variable
– Because items were identified as problematic, we focused on model –data fit assessment (items)
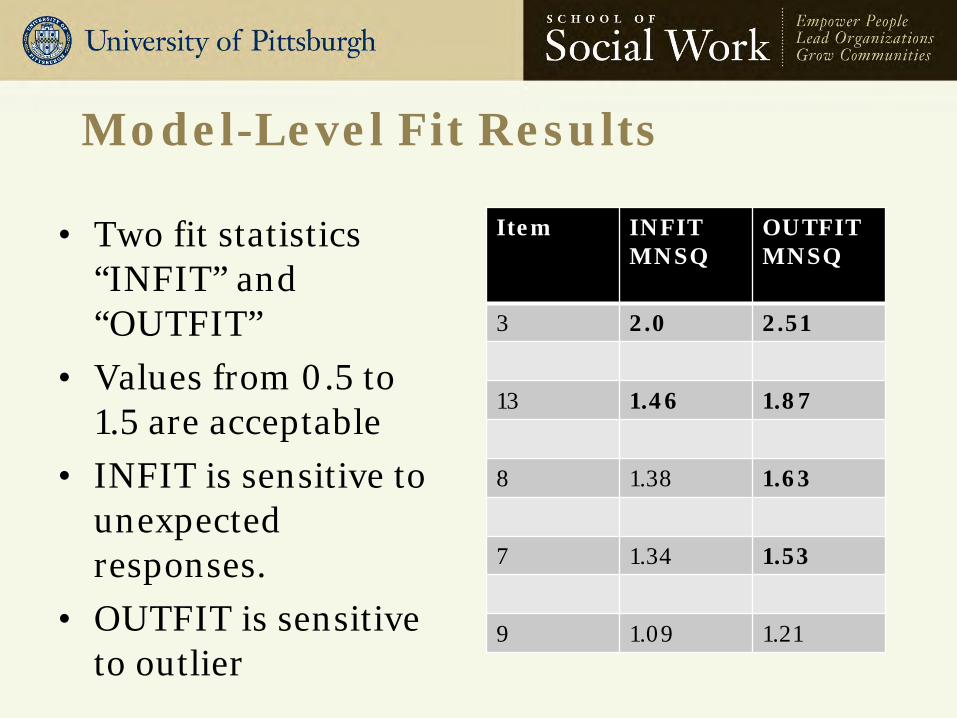
Model-Level Fit Results
• Two fit statistics “INFIT” and “OUTFIT”
• Values from 0.5 to 1.5 are acceptable
• INFIT is sensitive to unexpected responses.
• OUTFIT is sensitive to outlier
Item INFIT MNSQ
OUTFIT MNSQ
3 2.0 2.51
13 1.46 1.87
8 1.38 1.63
7 1.34 1.53
9 1.09 1.21
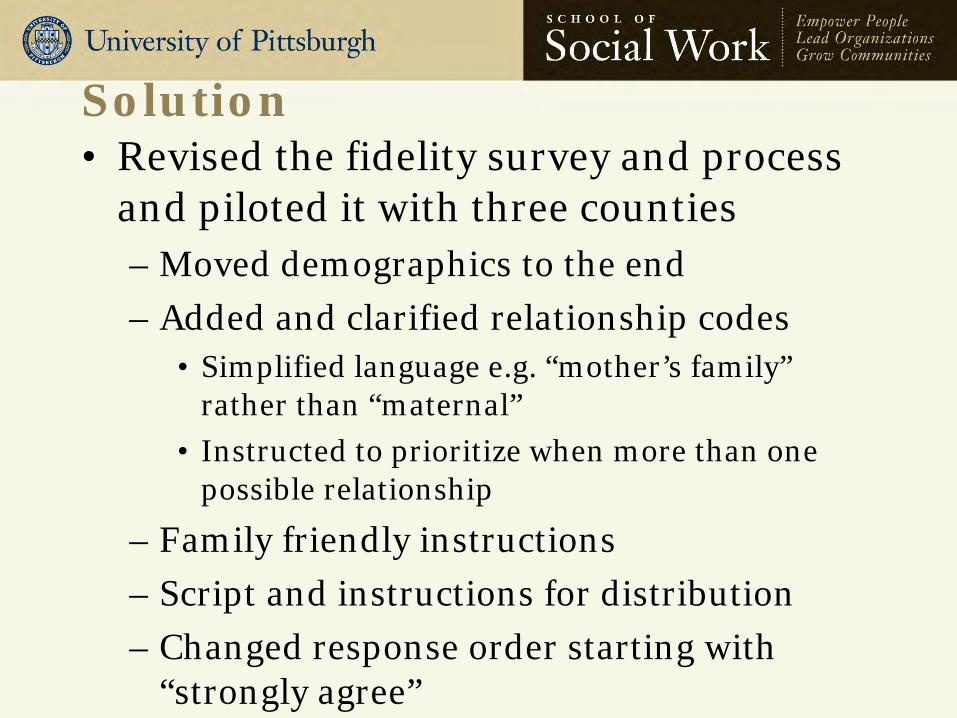
Solution • Revised the fidelity survey and process
and piloted it with three counties – Moved demographics to the end
– Added and clarified relationship codes • Simplified language e.g. “mother’s family”
rather than “maternal”
• Instructed to prioritize when more than one possible relationship
– Family friendly instructions
– Script and instructions for distribution
– Changed response order starting with “strongly agree”
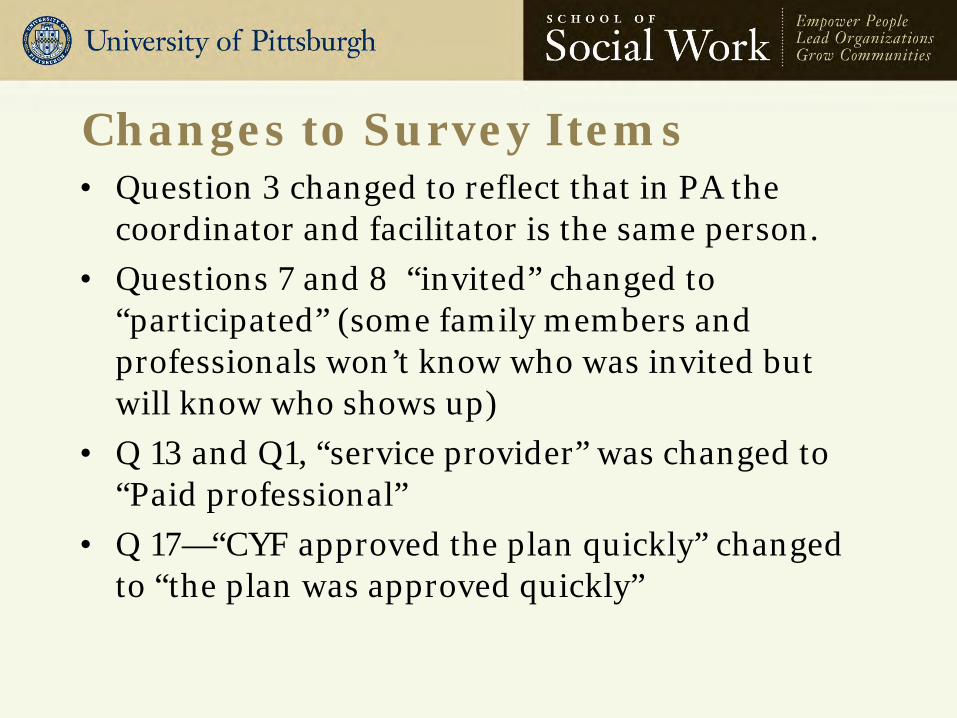
Changes to Survey Items • Question 3 changed to reflect that in PA the
coordinator and facilitator is the same person.
• Questions 7 and 8 “invited” changed to “participated” (some family members and professionals won’t know who was invited but will know who shows up)
• Q 13 and Q1, “service provider” was changed to “Paid professional”
• Q 17—“CYF approved the plan quickly” changed to “the plan was approved quickly”

• Revised (pilot) • Non-revised

Analysis of the Pilot Data
• What is the internal consistency?
• Does the percentage of missing data improve?
• Does changing the order of the responses (strongly agree to strongly disagree) impact the values?
• Does the factor structure look similar to that found in the North Carolina group?

Pilot Results
• 703 surveys from 98 FGDM conferences
• Alpha coefficient =.93, suggesting good internal consistency
• The amount of missing data slightly improved
Pilot (n=700)
Study (n=6,765)
Item 3 13% 17%
Item 7 10% 11%
Item 8 10% 13%
Item 17 17% 25%

County B County D
County V
Mean Pilot (n) 1.40 (120) 1.43 (532) 1.41 (39)
Mean Study (n) 1.56 (437) 1.60 (1,310) 1.56 (172)
Mode Pilot 1.0 1.0 1.0
Mode Study 2.0 1.0 Multiple modes
Range Pilot 1.0 2.0 1.0
Range Study 2.0 3.0 3.0
SD Pilot .374 .394 .397
SD study .387 .488 .502

Factor Structure
• Principle Components Analysis – 2 factors extracted using PCA
– Oblique rotation resulted in the simplest structure
• Factor 2 had three items that were about family empowerment .
• Factor 1 had the culture, safety and partnership items.

Future Work • Implemented the
revised survey in the state in 2011
• Analyze the entire group, using IRT & looking at extreme persons, extreme items , item fit and also how it differentiates
• Confirm factor structure but look at different groups e.g. families, professionals, youth

Lessons Learned • Don’t under-estimate the transition to
measuring fidelity
• Look and feel is important
• Changes in administration method should be done cautiously
• Cognitive interviewing & IRT were worth the time investment
• Pilot any new measure or change

Contact Information Mary E Rauktis Ph.D.
Research Assistant Professor
The University of Pittsburgh
School of Social Work
Child Welfare Education and Research Programs office 412.648.1225 fax 412.624.1159
http://www.socialwork.pitt.edu/

Evaluating family group decision making: Strengthening practice through measuring and monitoring fidelity. Measuring fidelity to FGDM in Pennsylvania
Shauna Reinhart, MPA Child Welfare Education & Research Programs University of Pittsburgh, School of Social Work 8/30/2011 National Child Welfare Evaluation Summit

Making it happen
• Real-world; real-time evaluation.
• 67 counties; >= 67 ways to practice.
• Multiple stakeholders; little consensus.
• PA’s statewide data collection system
• We can do it; because they believe.
Making it happen
• Real-world; real-time evaluation.
• 67 counties; >= 67 ways to practice.
• Multiple stakeholders; little consensus.
• PA’s statewide data collection system
• We can do it; because they believe.

Making it happen
• Trusting the process.
• Reporting.
• Follow-up & Outcomes.
• They believe; may not be able to do it.
• The “right” questions & “right” report.

Using the data
• From the counties’ perspective. – Reporting to PA’s Office of Children, Youth
& Families.
– Internal CQI.
• From a statewide perspective. – Are we widening the circle?
– Are families leading the process?
Pennsylvania’s Practice
FGDM PA’s website http://www.pacwcbt.pitt.edu/FGDM.htm
FGDM Evaluation Webpage: http://www.pacwcbt.pitt.edu/FGDM_EvaluationPage.htm
FGDM Discussion Board http://www.ilp.pitt.edu/FGDM_Board/login.asp?target=default.asp