evaluating experiential financial apability education: a ... · pdf fileevaluating...
TRANSCRIPT

Evaluating Experiential Financial Capability Education: A Field Study of My Classroom
Economy
Financial Empowerment Innovation Fund Research Contract # TOS-14-F-0028
September 15, 2016
Mike Batty, J. Michael Collins, Collin O’Rourke, Elizabeth Odders-White
The authors are grateful to the U.S. Department of the Treasury Financial Empowerment Innovation Fund (# TOS-14-F-0028) for supporting this project. We thank Aaron Standish, K–12 Financial Literacy Coordinator and the staff and teachers of the School District of Palm Beach County, who made this project a reality. We are grateful to the Vanguard Group for developing My Classroom Economy and providing materials and training to teachers of the School District of Palm Beach County as part of this evaluation. We also thank John Stevenson and the staff of the University of Wisconsin Survey Center, who coordinated the data collection instruments. Note: The content of this document does not represent the official views or policies of the U.S. Department of the Treasury. The views and opinions expressed herein are those of the authors and do not necessarily represent official Treasury positions or policy. In addition, for co-author Batty, the analysis and conclusions do not indicate concurrence by the Board of Governors of the Federal Reserve System or its research staff. About the U.S. Treasury Department Office of Consumer Policy: The Office of Consumer Policy (OCP) develops and coordinates the U.S. Treasury Department’s legislative and regulatory policies regarding retail financial services offered by banks and nonbanks financial companies. The office also examines emerging trends in financial services, including the expanding use of technology and data. In addition, OCP administers the Financial Empowerment Innovation Fund to support the development, testing and evaluation of new strategies to promote access to financial services and improve the financial capability of American Families.
Contents
Executive Summary 3
Introduction 5
Field Study 7
Evaluation Setting: The School District of Palm Beach County 7
Data and Methods 8
Program Implementation 10
Teacher Surveys at the End of the Study Period 11
Teacher Feedback at the End of the School Year 11
Student Use of MCE 13
Student Outcomes: Assessment Measures 14
Financial Knowledge 15
Budgeting 16
Propensity to Plan 16
Self-Control 16
Financial Socialization 17
Economic Experience 17
Student Outcomes: Estimation Approach 17
Results 18
Student Outcomes 19
Parent-Reported Outcomes 21
Discussion 23
Conclusions 24
References 25
Appendix A. Financial Knowledge Quiz 28
Appendix B. IRT Scoring for Quiz Questions 30
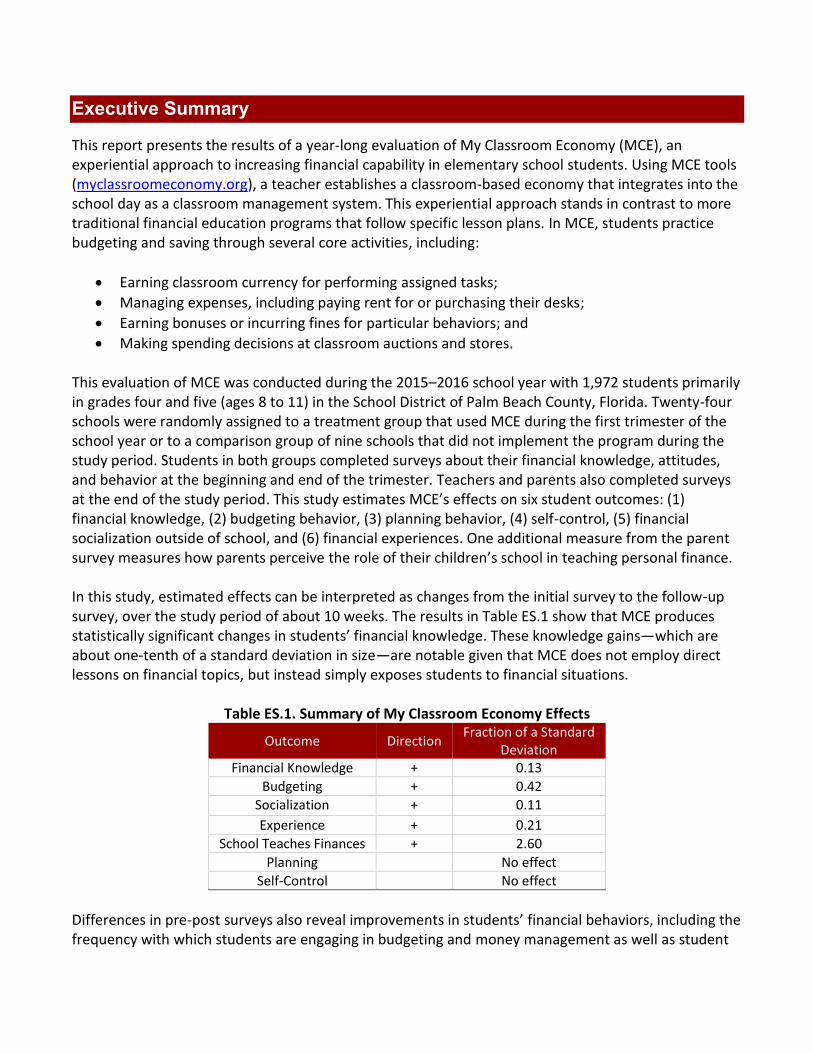
Executive Summary
This report presents the results of a year-long evaluation of My Classroom Economy (MCE), an experiential approach to increasing financial capability in elementary school students. Using MCE tools (myclassroomeconomy.org), a teacher establishes a classroom-based economy that integrates into the school day as a classroom management system. This experiential approach stands in contrast to more traditional financial education programs that follow specific lesson plans. In MCE, students practice budgeting and saving through several core activities, including:
Earning classroom currency for performing assigned tasks;
Managing expenses, including paying rent for or purchasing their desks;
Earning bonuses or incurring fines for particular behaviors; and
Making spending decisions at classroom auctions and stores. This evaluation of MCE was conducted during the 2015–2016 school year with 1,972 students primarily in grades four and five (ages 8 to 11) in the School District of Palm Beach County, Florida. Twenty-four schools were randomly assigned to a treatment group that used MCE during the first trimester of the school year or to a comparison group of nine schools that did not implement the program during the study period. Students in both groups completed surveys about their financial knowledge, attitudes, and behavior at the beginning and end of the trimester. Teachers and parents also completed surveys at the end of the study period. This study estimates MCE’s effects on six student outcomes: (1) financial knowledge, (2) budgeting behavior, (3) planning behavior, (4) self-control, (5) financial socialization outside of school, and (6) financial experiences. One additional measure from the parent survey measures how parents perceive the role of their children’s school in teaching personal finance. In this study, estimated effects can be interpreted as changes from the initial survey to the follow-up survey, over the study period of about 10 weeks. The results in Table ES.1 show that MCE produces statistically significant changes in students’ financial knowledge. These knowledge gains—which are about one-tenth of a standard deviation in size—are notable given that MCE does not employ direct lessons on financial topics, but instead simply exposes students to financial situations.
Table ES.1. Summary of My Classroom Economy Effects
Outcome Direction Fraction of a Standard
Deviation Financial Knowledge + 0.13
Budgeting + 0.42
Socialization + 0.11
Experience + 0.21
School Teaches Finances + 2.60
Planning No effect
Self-Control No effect
Differences in pre-post surveys also reveal improvements in students’ financial behaviors, including the frequency with which students are engaging in budgeting and money management as well as student
reports of discussing financial management at home and outside of school. Students in schools with MCE also report taking part in more economic experiences, such as using a bank account. Parents of students in MCE schools report that their children’s school is more likely to teach personal finance topics. The size of these effects ranges, but all are statistically significant and positive. However, there is no measurable effect of MCE on students’ reporting that they plan for the future or on self-reported levels of self-control, although both of these items may draw on more engrained behaviors that involve broader issues than simply financial management experience. Together, the findings suggest that experiential financial learning can have positive effects that equal or exceed those of more formal grade school financial literacy efforts. MCE also has the added advantage of serving as a classroom management system, ideally integrating with teachers’ day-to-day efforts to promote positive behaviors. The approach imposes fewer requirements than more traditional financial education programs and requires less effort overall from teachers in terms of training and support. Surveys and interviews with teachers show the program enjoys strong support among teachers who participated in the pilot and the evaluation; in fact, 95% of teachers reported that they plan to continue using the program. Thus, MCE and similar approaches show promise as a relatively efficient mechanism to promote financial capability among K–12 students.
Introduction
The development of financial capability for all Americans remains an elusive goal (Lusardi & Mitchell, 2014). About 35 states have some form of personal finance education (Council for Economic Education, 2014). Over the past decade, education policies have shifted from high school programs to financial education in earlier grades. For example, the National Association of State Boards of Education’s Commission on Financial and Investor Literacy issued a report in 2006 recommending that states “consider infusing financial and investor education throughout the K–12 curriculum” (p. 20). Similarly, in 2012, the Federal Financial Literacy and Education Commission launched its Starting Early for Financial Success initiative, citing the large potential benefits of reaching young people.1 Existing research supports focusing on youth (Lusardi, Mitchell & Curto 2010). Reviews of the literature on children’s cognitive development and economic understanding (see, for example, Schug, 1987; Webley, 2005; or Scheinholtz, Holden, & Kalish, 2012) indicate not only that children can understand financial concepts but also that their understanding is well developed by age 12. Moreover, many children control some financial resources by this age (see, e.g., Doss, Marlowe, & Godwin, 1995) and need training and guidance in how to manage them. While other studies have examined the effects of financial programs for older students (see Peng, et al., 2007; Brown et al., 2014; Totenhagen, et al., 2015), elementary school age students are less frequently studied (see Batty, Collins, & Odders-White, 2015a for a review). Relatedly, Drever et al. (2015) argue that financial knowledge is only one piece of the puzzle; the formation of financial attitudes and habits—which commonly occurs during childhood—is another potentially important driver of adult financial outcomes. The process through which young people acquire these values, norms, and behaviors is typically referred to as financial or economic socialization (Danes, 1994). Naturally, much of this socialization occurs in families, as parents or other influential adults model financial behaviors or discuss family finances (see Gudmunson and Danes [2011] for a review). Research suggests that financial behaviors and self-confidence improve when parents provide financial guidance and oversight (e.g., Pliner, Darke, Abramovitch, & Freedman, 1994; Grinstein-Weiss, Spader, Yeo, Taylor, & Books Freeze, 2011; Kim & Chatterjee, 2013). Moreover, Otto (2013) observes that several studies document a relation between financial socialization and savings behavior in adolescence, although the impact on saving behavior in adulthood is less clear (Ashby, Schoon, & Webley, 2011). Although families clearly play a critical role in financial socialization, providing financial education in elementary school may enable educators to counteract misinformation received outside of school, helping students establish positive attitudes early (Suiter & Meszaros, 2005), ideally before negative habits can take hold (Schug & Walstad, 1991). The topic of how parental socialization and the role of non-school based experiences influence young people are an important area of study in general (see Grusec & Davidov, 2007). The role of socialization with younger children related to financial capability is an important, further application of this work (see Van Campenhout, 2015, Shim, et al., 2010, and Jorgense & Savla, 2010).
1 See https://www.treasury.gov/connect/blog/Pages/flec-starting.aspx and https://www.treasury.gov/resource-center/financial-
education/Documents/Starting%20Early%20Research%20Priorities%20May%202013.pdf.
While are strong arguments in favor of introducing financial education in elementary schools, the curriculum in most schools is focused largely on math and language skills (Suiter & Meszaros, 2005). This leaves only minimal time for other topics. Moreover, many teachers feel unprepared to deliver personal finance instruction (Collins & Odders-White, 2015; Way & Holden, 2009); therefore, alternative educational approaches that focus more on financial socialization and rely less on dedicated lesson plans or teacher expertise can fill an important need. One example of such an approach is bank-at-school programs. Many school districts offer in-school banking programs, facilitated through national organizations such as Save for America, via state-sponsored programs like the Delaware and Illinois Bank at School programs, or through independent partnerships between schools and local financial institutions. These initiatives offer children the chance to practice managing money with their own accounts (Johnson & Sherraden, 2007) and may enhance student learning by providing young people opportunities to apply what they learn in financial management programs, thereby increasing the relevance of the material and improving student engagement (Batty, Collins, & Odders-White, 2015a; Wiedrich, Collins, Rosen, & Rademacher, 2014). While bank-at-school programs show promise, however, they require establishing partnerships that some school districts and financial institutions are uncomfortable with. This discomfort may limit the ability to bring these programs to scale. In this report, we consider an alternative program that, like in-school banking, is experiential in nature and emphasizes financial socialization but is simpler to administer. In My Classroom Economy (MCE), students practice making financial decisions in a classroom-based economy that teachers implement as a classroom management system. To date, no rigorous studies have examined the impact of a simulated economy on elementary school students’ financial knowledge, attitudes, or behavior. Historically, the focus of education policy has been on high school financial literacy programs, not younger ages. Studies document knowledge gains from high school financial education (e.g., Harter & Harter, 2009; Walstad, Rebeck, & MacDonald, 2010. Bruhn, de Souza Leao, Legovini, Marchetti, & Zia (2013) document significant improvements in behavior following a high school financial education intervention, as do Brown and colleagues (2015). A meta-analysis conducted by Fernandes, Lynch, & Netemeyer (2014) suggests that these interventions have very small impacts on financial behaviors, however. There are only a handful of formal evaluations of economic or financial education programs targeted to elementary school students (e.g., Harter & Harter, 2009; Sherraden, Johnson, Guo, & Elliott, 2011; Batty et al., 2015a). Collectively, these studies document increases in financial knowledge among upper-grade elementary students following a classroom financial education program and find some evidence of positive changes in student attitudes and behaviors. We build on this work by conducting a randomized, controlled trial that assesses the impact of MCE on several hypothesized antecedents of financial well-being, including financial knowledge, financial attitudes and habits (socialization), and other salient characteristics, such as propensity to plan and self-control.
Field Study
In October 2014, the U.S. Department of the Treasury’s Office of Consumer Policy awarded a contract to support this evaluation through its Financial Empowerment Innovation Fund. In late 2014, the study team began conversations with the School District of Palm Beach County’s (SDPBC) K–12 Financial Literacy Coordinator, who had expressed interest in participating in the evaluation. The Florida Department of Education had established new financial literacy standards for grades K–12 (the Financial Literacy strand of the Next Generation Sunshine State Standards for Social Studies) earlier that year. The District was interested in MCE because it offered teachers a novel way to meet those new standards. With data-sharing and research agreements in place, SDPBC started implementing MCE in fourth-, fifth-, and a small number of third-grade classrooms in the first trimester of the 2015–2016 school year. We selected this age group for the evaluation for several reasons. First, cognitive development theory and related research suggest that the elementary years may be a window of opportunity when education can influence financial behavior later in life. Studies of cognitive development show that skills related to saving money (ownership, conservation, planning, deferred consumption) are formed in early childhood (Webley & Nyhus, 2006; Scheinholtz et al., 2012). From a developmental perspective, the period between ages 5 and 7 (commonly referred to as the “5–7 shift”) is associated with marked growth in self-control, planning, and formal decision-making abilities. Students by age 8 to 10 are likely to be able to participate actively in MCE and also take part in assessment activities (see Melton, 2013). From a practical perspective, primary school students tend to spend most of the day with their primary teacher, making elementary school a more natural environment to implement a classroom economy than later grades, where students move from room to room more often. In this evaluation, participating schools were randomly assigned to two groups, one that started implementing MCE during the first trimester of that year and another that did not implement the program until later in the year. Data were collected from both groups during the first trimester, allowing for a comparison of outcomes between the two groups. The sections below provide more detail about the setting for the evaluation and the project implementation.
Evaluation Setting: The School District of Palm Beach County
Florida school districts are county based and typically cover large geographic areas. In the more heavily populated areas of Florida, the school districts are among the largest in the country in terms of enrollment. With a total enrollment of more than 175,000 students, the School District of Palm Beach County (SDPBC), headquartered in West Palm Beach, is the twelfth largest district in the country, with 5,000 elementary teachers and a total staff of nearly 23,000 (Snyder et al., 2016). Geographically, the district is similar in size to the State of Delaware. Figure 1 shows the location of Palm Beach County in Florida and the location of schools assigned to the treatment and comparison groups within the County.

Figure 1: Location of Palm Beach County, Florida and Study Schools
The SDPBC serves a diverse student base across its 276 schools. Among the District’s more than 85,000 primary level students, 33% are white, 28% black, and 33% Hispanic, with the remainder from Asian, American Indian, or other backgrounds. A full 61% of K–5 students qualified for free or reduced lunch in 2015, and 18% were English Language Learners (Palm Beach Schools, 2016).
Data and Methods
As shown in Table 1, this study analyzes data on 1,972 students across 115 classrooms in 24 schools. The 15 schools in the MCE (treatment) group, which started using the program during the first trimester, comprise 1,187 students across 69 classrooms; the comparison group, which started using the program later in the school year, was slightly smaller, with 785 students in 46 classrooms at 9 schools. In addition, 763 parents completed surveys at the end of the study period, including 364 in the MCE group and 399 in the comparison group.
Table 1: Study Sample Sizes
Students Classrooms Schools Parents
MCE 1,187 69 15 364
Comparison 785 46 9 399
Total 1,972 115 24 763 Source: Student and Parent Surveys.
Table 2 compares classrooms between the two groups. One measure of school socioeconomic status (SES) is the percent of students at the school receiving free and reduced-price school lunches. This is a means-tested program, and schools with higher proportions of subsidized meals also have higher rates of low-income families and lower SES levels overall. Overall, the average rate of free and reduced-priced school lunch was 51% across all 24 schools in the study. MCE schools tended to have higher rates (60%) relative to the comparison schools (42%). Math performance was similar between the two
Treatment
Comparison
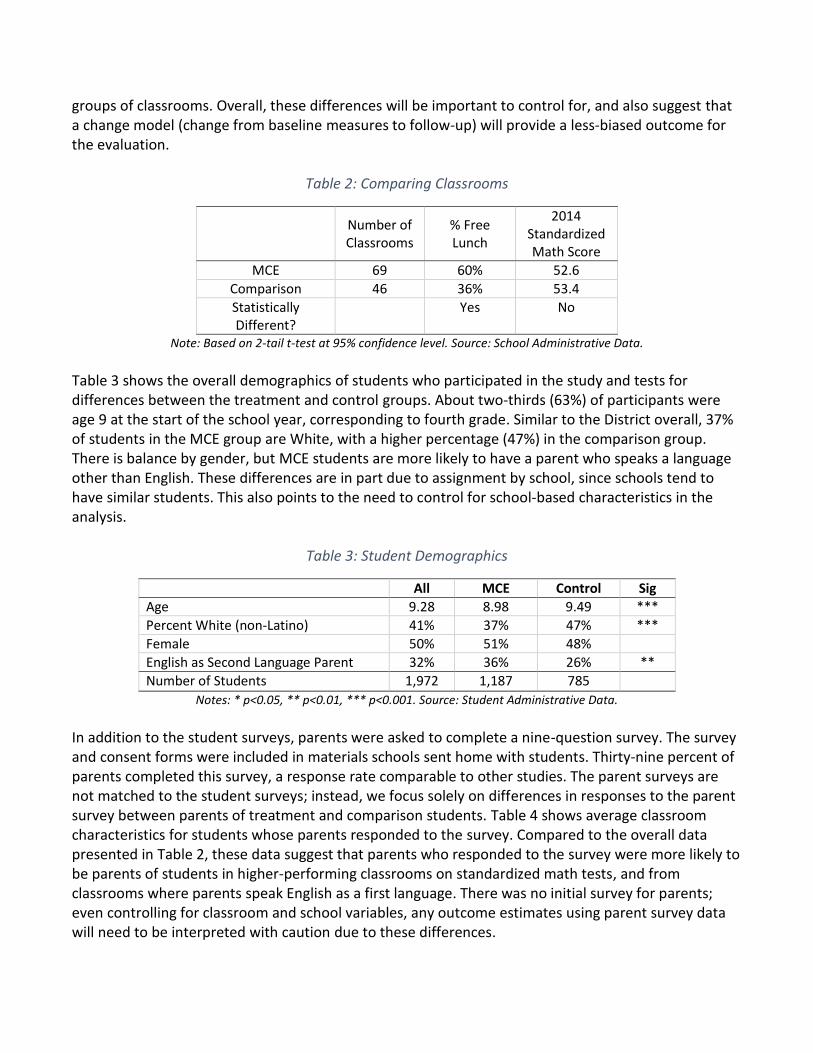
groups of classrooms. Overall, these differences will be important to control for, and also suggest that a change model (change from baseline measures to follow-up) will provide a less-biased outcome for the evaluation.
Table 2: Comparing Classrooms
Number of Classrooms
% Free Lunch
2014 Standardized Math Score
MCE 69 60% 52.6
Comparison 46 36% 53.4
Statistically Different?
Yes No
Note: Based on 2-tail t-test at 95% confidence level. Source: School Administrative Data.
Table 3 shows the overall demographics of students who participated in the study and tests for differences between the treatment and control groups. About two-thirds (63%) of participants were age 9 at the start of the school year, corresponding to fourth grade. Similar to the District overall, 37% of students in the MCE group are White, with a higher percentage (47%) in the comparison group. There is balance by gender, but MCE students are more likely to have a parent who speaks a language other than English. These differences are in part due to assignment by school, since schools tend to have similar students. This also points to the need to control for school-based characteristics in the analysis.
Table 3: Student Demographics
All MCE Control Sig
Age 9.28 8.98 9.49 ***
Percent White (non-Latino) 41% 37% 47% ***
Female 50% 51% 48%
English as Second Language Parent 32% 36% 26% **
Number of Students 1,972 1,187 785
Notes: * p<0.05, ** p<0.01, *** p<0.001. Source: Student Administrative Data.
In addition to the student surveys, parents were asked to complete a nine-question survey. The survey and consent forms were included in materials schools sent home with students. Thirty-nine percent of parents completed this survey, a response rate comparable to other studies. The parent surveys are not matched to the student surveys; instead, we focus solely on differences in responses to the parent survey between parents of treatment and comparison students. Table 4 shows average classroom characteristics for students whose parents responded to the survey. Compared to the overall data presented in Table 2, these data suggest that parents who responded to the survey were more likely to be parents of students in higher-performing classrooms on standardized math tests, and from classrooms where parents speak English as a first language. There was no initial survey for parents; even controlling for classroom and school variables, any outcome estimates using parent survey data will need to be interpreted with caution due to these differences.

Table 4: Comparing Parents Responding to Survey
Number of
Parents
2014 Standardized Math Score
% Non-White % Parents ESL
MCE 364 55.7 46% 34%
Comparison 386 54.8 44% 31%
Statistically Different? Yes No Yes Note: Based on 2-tail t-test at 95% confidence level. Source: Parent Survey
Financial knowledge, attitudes, and behavior are measured using in-class assessments completed by students. The survey questions (see Appendix A) were developed based on validated measures presented in prior studies and were pretested with similarly aged children (Batty, Collins, & Odders-White, 2015b). The survey processes and timing were the same for both the MCE and comparison groups. The University of Wisconsin Survey Center (UWSC) distributed and collected the surveys at schools. For the baseline surveys, the UWSC distributed surveys to schools on Monday, August 31, 2015, and collected them on Thursday and Friday of that week, giving teachers multiple days to administer the surveys in their classrooms. The UWSC returned the week of November 9, the last week of the District’s first trimester for elementary students, to distribute and collect student follow-up surveys, following a similar schedule. Parent surveys were distributed that same week. To ensure privacy, parents were directed to mail their surveys back to the UWSC, using a provided prepaid postage mailer. The University of Wisconsin-Madison Institutional Review Board monitored all data management and confidentiality procedures. Unique identification codes were used to match baseline and follow-up surveys, but the datasets provided to the research team do not identify individual students. The process was designed to comply with the Family Educational Rights and Privacy Act (FERPA) and SDPBC School Board Policy 2.142. All data collection instruments were also reviewed and approved under the Federal Office of Management and Budget Paperwork Reduction Act (OMB Control #1505-0252).
Program Implementation
Teachers and schools were recruited by the SDPBC’s K–12 Financial Literacy Coordinator, who promoted the upcoming evaluation to principals, assistant principals, and teachers toward the end of the 2014–2015 school year. Five three-hour trainings were held at four locations throughout Palm Beach County the week before school started in August 2015. Teachers were strongly encouraged to attend one of the trainings, which provided hands-on opportunities for teachers to prepare MCE materials for their classrooms. In addition to printed MCE materials, teachers received folders, cash boxes, and other basic supplies. By the end of the training, each teacher had at least one assembled student packet and other materials to use as a template; in some cases, teachers were able to assemble most or all of their classroom materials during these trainings.
To understand teachers’ experiences implementing MCE during the course of the evaluation, three sets of data were analyzed: a teacher survey collected by the research team in November 2015, a teacher feedback survey collected by the district in May 2016, and six teacher interviews. Overall, these data sources document the success of the evaluation design, along with high teacher satisfaction with the program.
Teacher Surveys at the End of the Study Period
Sixty teachers who implemented MCE during the study period completed the nine-question teacher survey. Ninety-four percent of the responding teachers were women, and nearly one-quarter of respondents had been teaching professionally for more than 20 years (24%), with another 36% having taught for between 11 and 20 years. The survey also included questions specific to the implementation of MCE. A total of 58% of teachers felt “very” or “extremely” prepared to teach students about personal finances. Further, 30% rated their overall experience with MCE as excellent, 52% as good, 17% as adequate, and just 2% (one teacher) as poor. In line with this high satisfaction, 95% of teachers reported that they planned to continue using the program. A majority (52%) of teachers reported giving students opportunities to earn income more than once per day. Although a small percentage of teachers (10%) reported giving students opportunities to buy items at a store or auction once a week or more often, 40% reported doing so once every other week, in line with suggested guidelines from the training.
Teacher Feedback at the End of the School Year
At the end of the 2015–2016 school year, the district surveyed teachers about their experiences with MCE; 72 teachers completed this survey, including 50 who started implementing MCE in the first trimester and 22 who used it later in the year. Teachers again indicated high satisfaction with the MCE program, with nearly all respondents reporting that they continued to use the program for the rest of the 2015–2016 school year and 93% planning to use it in the future. Respondents also reported high satisfaction with the resources they had access to, including printed program materials, myclassroomeconomy.org, and in-service teacher training. Teachers did struggle with the time required to administer the program. Although only 8% of respondents “strongly” agreed that MCE takes too much time, another 44% “somewhat” agreed. Managing banking was cited as the most difficult aspect of the program. In addition to the teacher feedback survey, six teachers participated in telephone interviews about their experiences with MCE. The interviews took place at the end of the school year and focused on teachers’ backgrounds and reasons for getting involved in the program, the process of implementing MCE in their classrooms, their perceptions about MCE’s effectiveness, and their overall feedback about the program. Three primary themes emerged:
Teachers do not need experience with financial education to be successful with MCE. Previous studies have documented a lack of training and confidence among teachers tasked with implementing financial literacy (e.g., Way & Holden, 2009). Interviewees’ reasons for getting

involved in the program varied, reflecting the fact that some teachers signed up for MCE voluntarily, while others were required or strongly encouraged to do so by their school administrators. Multiple interviewees indicated that the classroom management aspects of MCE were important to their decision to get involved, though the financial literacy aspect was also valued. Importantly, the interviewees had limited experience implementing financial literacy programs when they signed on to use MCE. These teachers reported having little prior experience teaching financial education, though multiple interviewees had used in-class reward systems in the past. Teachers appreciated that students were able to practice keeping track of money, forming goals, and saving towards purchases. Teachers also reported that MCE lends itself to discussions with students about money management. The teachers who were interviewed described MCE as running more smoothly over time as they gained experience with it. Overall, MCE may be more attractive to teachers than traditional financial education programs, especially to the extent that the program also serves as a classroom management system.
Teacher time constraints are a challenge for implementation. MCE serves as a classroom management system, helping teachers establish classroom rules and promote positive behaviors. Ideally, it integrates seamlessly into the day-to-day activities of the classroom. The teachers interviewed reported that the flexibility of MCE allowed them to customize the program for their classrooms, but the process of customizing and implementing MCE required time and attention. Teachers customized the program by developing the list of behaviors earning bonuses and fines, choosing between a classroom store with preset prices or an auction, developing the list of jobs available to students, and adjusting the pacing or scheduling of the program. Interviewees’ implementation of MCE was dynamic, with adjustments made during the school year. Although many of the classroom management activities supported by MCE would have occurred without it, interviewees still reported some challenges around the amount of time required to run the program, especially earlier in the year as students were getting accustomed to it, on top of all the other demands of starting the school year.
Based on the interviews, managing rent and collecting fines fit rather seamlessly into classroom management, but other core activities could prove time-consuming. In particular, interviewees reported that student banking on payday and running classroom auctions or stores required significant classroom time, sometimes leading to these activities being delayed, a finding that is consistent with the survey results. On payday, students receive their paychecks, fill out deposit slips, update their bank logs, and complete their deposits with the banker. Although multiple interviewees speculated that the design of the bank log was confusing to students, one interviewee reformatted the log and continued to have the same challenges. Some teachers tried using a form of automated direct deposit of paychecks to facilitate the process. Overall, interviewees agreed that the program became more efficient as they used it, but nonetheless required a significant time commitment, further straining their already burdened schedules.
Teachers had positive experiences with MCE and received positive feedback from students and parents. The teachers interviewed all reported positive experiences with MCE and also
reported that students had positive experiences. Multiple interviewees reported getting positive feedback from their students’ parents about their use of MCE. This positive feedback loop resulted in most teachers indicating in surveys that they will continue the program in the future, even after the study is completed and in spite of the time it requires.
Student Use of MCE
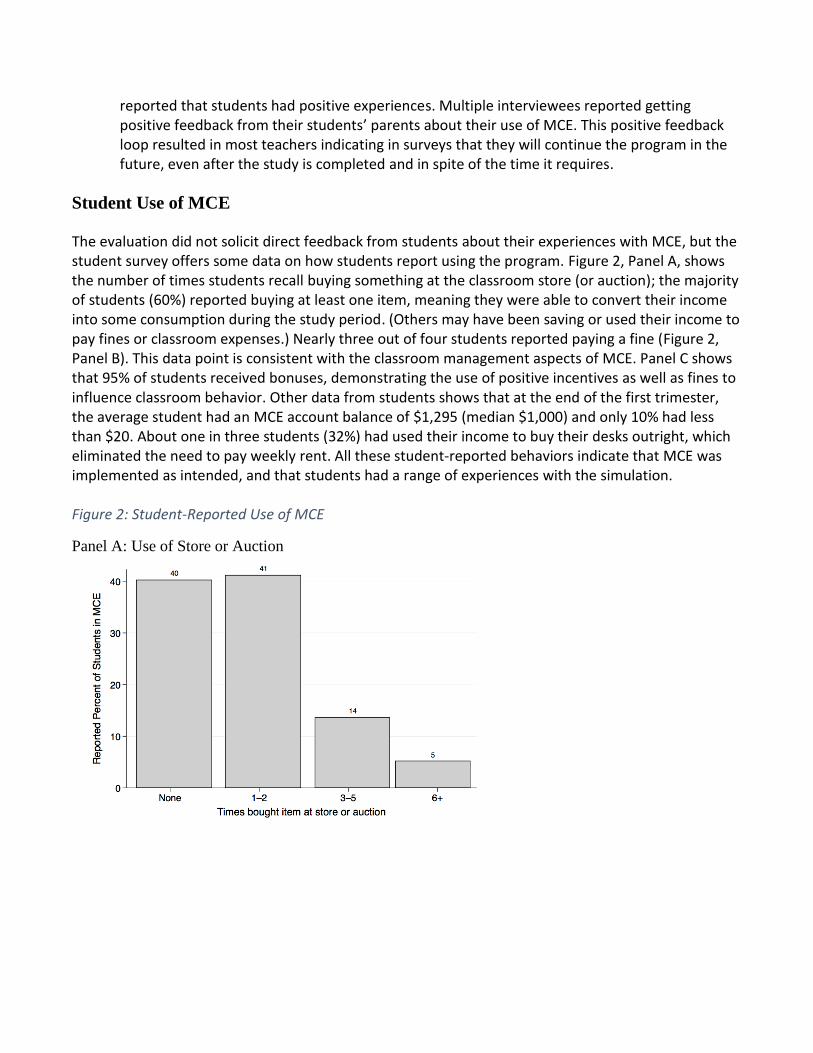
The evaluation did not solicit direct feedback from students about their experiences with MCE, but the student survey offers some data on how students report using the program. Figure 2, Panel A, shows the number of times students recall buying something at the classroom store (or auction); the majority of students (60%) reported buying at least one item, meaning they were able to convert their income into some consumption during the study period. (Others may have been saving or used their income to pay fines or classroom expenses.) Nearly three out of four students reported paying a fine (Figure 2, Panel B). This data point is consistent with the classroom management aspects of MCE. Panel C shows that 95% of students received bonuses, demonstrating the use of positive incentives as well as fines to influence classroom behavior. Other data from students shows that at the end of the first trimester, the average student had an MCE account balance of $1,295 (median $1,000) and only 10% had less than $20. About one in three students (32%) had used their income to buy their desks outright, which eliminated the need to pay weekly rent. All these student-reported behaviors indicate that MCE was implemented as intended, and that students had a range of experiences with the simulation. Figure 2: Student-Reported Use of MCE
Panel A: Use of Store or Auction

Panel B: Fines Paid
Panel C: Bonuses Earned
Source: Student Survey (MCE group only).
Student Outcomes: Assessment Measures
This evaluation assesses six student-level outcomes using measures adapted from prior studies:
1. Financial Knowledge (13-item quiz) 2. Budgeting Behavior (5-item scale) 3. Propensity to Plan (4-item scale) 4. Self-Control (5-item scale) 5. Financial Socialization (2-item scale) 6. Economic Experiences (5-item scale)

Table 5 provides summary statistics for each outcome at baseline across all students in the evaluation. The reliability column shows the scale’s internal reliability using Cronbach’s alpha, a test statistic used to gauge how well the questions describe a common characteristic. All measures were pretested prior to the study with other groups of students to refine the items included and to test each scale’s internal consistency, or how closely related items are as a group, and its validity, or how well the scale performs relative to other measures of similar outcomes.
Table 5: Baseline Summary Statistics
Outcome Mean St Dev Reliability
Financial Knowledge 50.00 18.90 0.63^
Budgeting 3.56 0.78 0.68
Propensity to Plan 3.42 0.81 0.60
Self-Control 3.52 0.71 0.52
Financial Socialization 2.50 1.07 0.47
Economic Experience 0.52 0.26 0.48 ^ Using correct-incorrect summed scale (0–13), not the estimated score.
Source: Student Survey
Financial Knowledge
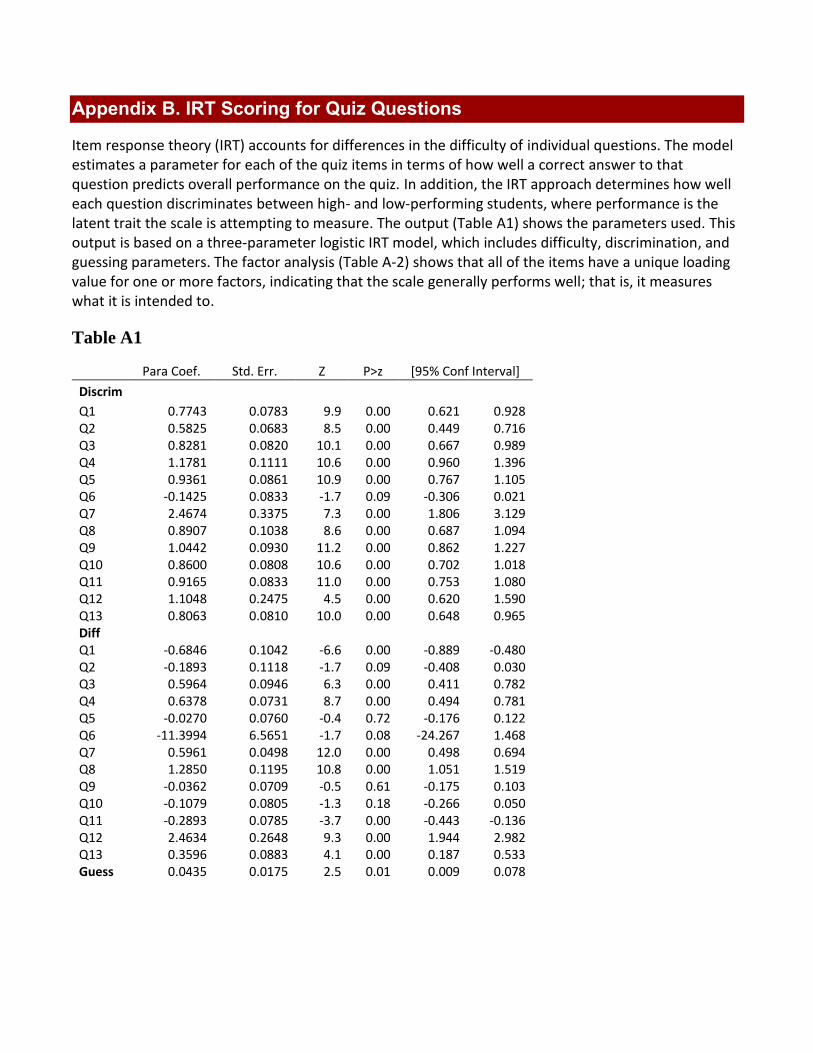
Although MCE does not employ direct lessons on financial topics, the exposure to financial situations that it provides could improve students’ financial knowledge or motivate students to pursue that knowledge on their own. The financial knowledge scale that participating students completed for the MCE evaluation is composed of 13 quiz items that were pretested with similarly aged students. The quiz (see Appendix A) includes questions related to owning and renting, budgeting, and opportunity costs, as well as basic financial numeracy, compound interest, profit and loss, account balances, and the costs of common items. The quiz items test objective financial knowledge rather than subjective self-assessments of knowledge. Evaluations of education methods often summarize students’ performance by simply totaling the number correct responses. This “classical test theory” treats all questions the same, regardless of the relative difficulty of each question. In this study, a classical test approach would produce scores between 0 and 13, depending on the number of questions a student answered correctly. In contrast, item response theory (IRT) is a technique used to generate a knowledge scale that accounts for differences in the difficulty of each question (Devellis, 2016). We use a three-parameter logistic model to analyze quiz results, where the three factors account for how difficult each item is, how well each item contributes to the overall scale, and how often students show a pattern of guessing. The scores are transformed to produce a mean of 50, so the scale resembles a 0–100 test score statistic, where 100 is a high score. The resulting standardized score is based on parameters estimated from the initial quiz; changes in scores from the baseline to follow-up allow for a consistent knowledge measure. The model and parameters, as well as a principal components factor table, are provided in Appendix B.2
2 This model codes missing answers as incorrect responses. Each item in the 13-question scale was skipped by about 10% to 20% of students, although just over one-third (35%) of students skipped the question about compound interest.
Budgeting
In classrooms using MCE, students earn money and must manage expenses. Students manage their cash flow in order to purchase items from the auction or classroom store, cover fines, and pay rent for or purchase their desks. This practice could translate into changes in how students understand budgeting. To test this possibility, we estimate a scale that assesses five outcomes, each with five categorical responses. These five items form a normalized scale of 1 to 5 (ordered so higher scores correspond to greater budgeting behavior). Since these are subjective and not objective quiz items of varying difficulty, the scale is simply the mean response across the five items. The items include:
How important is it to keep track of how much money you earn and spend using a budget?
How often do you have a plan for how you will spend money?
How good are you at making decisions about how to spend your money?
How confident are you about making decisions that deal with money?3
How good are you at keeping track of what you spend your money on?
Propensity to Plan
Along with potential benefits around instilling the importance of budgeting, the experience of having to earn money and manage expenses within the MCE program may promote a more general desire or inclination to plan ahead. Thus, the student survey included four questions about how often the student engages in general planning behaviors. The outcome is a normalized scale (averaged across the four items) of responses from 1 to 5 (ordered so higher scores correspond to greater planning). The items include:
How often do you set goals for yourself?
How often do you set goals for the next few days for what you want to achieve?
How often do you have a plan for how your free time will be used in the next few days?
How much better does it make you feel to have your free time planned out for the next few days?
Self-Control
MCE allows students to practice self-control, and students receive feedback about the consequences of their decisions. This experiential approach may produce a stronger response than simply telling students about the benefits of avoiding behaviors such as excessive impulse spending. The survey included a set of five questions that measure self-control, three related to money management and two to more general behavior. The outcome again is a normalized scale of responses from 1 to 5 (ordered so higher scores correspond to greater control). The five items include:
How hard is it for you to avoid spending any money you have right away?
3 A pretest showed that confidence is an important item for this scale; although the question does not reference budgeting behavior directly, it was asked in the context of questions about budgeting and planning.
How likely are you to stop and think about something before you do it?
How often do you ask yourself if you really need something before you buy it?
Before making a choice, how often do you tend to think about the good things and the bad things about the choice?
How much would you rather save money for a rainy day than spend it now on something fun?
Financial Socialization
We include two items related to financial socialization. These measures relate to whether a student’s family talks about money at home. In many homes, money is not a topic of frequent discussion. MCE allows students to experience economic and financial issues (for instance, income and the impact of fines and bonuses) in a safe setting, potentially leading to discussions at home that parents would not otherwise initiate. The outcome is a normalized scale of responses from 1 to 5 across these two items:
How often does your family talk about how you spend money?
How often do you talk to your family about financial issues?
Economic Experience
Finally, we attempt to measure students’ financial experiences outside the MCE setting. It is plausible that students’ experiences with MCE might motivate them to look for ways to earn real income, save, or take on more financial tasks independently. The student survey includes five yes or no questions that form a normalized 0-1 scale of responses (ordered so higher scores correspond to more experiences). The items include:
In the last month, have you gotten money from a job?4
In the last month, have you gotten money from your family for doing chores?
Do you currently have a bank account in your own name?
In the last month, have you received spending money or money as a gift?
Do you make your own decisions about how to spend your money?
Student Outcomes: Estimation Approach
We use regression analysis to examine the impact of MCE on each of the outcomes assessed. Assignment to use MCE during the first trimester of the school year (“treatment”) occurred at the school level. Therefore, we use MCE school dummies to estimate the effects of MCE, as follows:
𝑌𝑖,2 − 𝑌𝑖,1 = 𝛼 + 𝛽𝑀𝐶𝐸𝑖 + 𝛿𝑌𝑖,1 + 𝛾𝑋𝑖,1 + 휀𝑖
4 Students could be reflecting on their jobs as part of MCE rather than on economic behaviors outside of school; students in the MCE group would have been assigned jobs around the time of the baseline survey and would have held their jobs for several weeks by the follow-up survey. Since the analysis is of changes in scales, this one item should not introduce significant bias.

Where 𝑌𝑖,𝑡 is the outcome of interest for student 𝑖 at time 𝑡 (baseline or follow-up); 𝑀𝐶𝐸𝑖 is an
indicator for MCE participation; and 𝑋𝑖,1 is a set of demographic characteristics including student race, student gender, student age, and student scores on a standardized math test in the prior school year. We are primarily interested in the estimate of 𝛽, which represents the causal effect of MCE on the change in each outcome from baseline to follow-up. This approach controls for time-invariant student characteristics and for the influences of baseline responses and demographics on changes in responses for all participants, regardless of MCE participation. Overall, this is a robust and relatively conservative approach that allows us to isolate the effect of a student being in a school assigned to the MCE group during the study period. We also estimate several additional models that reveal how MCE’s effects may vary by demographic characteristics. These sub-groups are based on prior studies showing the potential for heterogeneous effects due to certain existing cognitive or experiential differences. These include gender based on prior work showing women and girls experience financial issues in different ways than men and boys (Edwards, Allen, & Hayhoe, 2007; Lusardi, et al., 2010). Another sub-group is students from non-English speaking households; these students may have differential benefits from experiential learning methods (Crosnoe and Turley, 2011). Students from lower income areas or households may also differentially benefit from economic experiences in the classroom (Sherraden, et al., 2011). Finally, because so many financial and economic decisions require quantitative reasoning, the relationship between math ability and MCE effects is explored (Agarwal & Mazumder, 2013). In each case, we add an interaction term that is the product of the MCE indicator and the characteristic of interest; we also include the characteristic as an independent control variable if it is not already part of 𝑋𝑖,1 or 𝑌𝑖,𝑡. These models include:
Female and MCE (a 0–1 indicator if the student is female)
ESL and MCE (a 0–1 indicator if the student’s parent or guardian speaks English as a second
language)
School SES and MCE (the fraction of students at a school that receive free or reduced-price
lunch; ranges from 13% to 99% across schools in the evaluation)
Math score and MCE (each student’s 2014 Florida standardized math test score, ranging
from 1 to 99)
Results
For ease of interpretation, we express effect sizes as the fraction of the standard deviation of the outcome. For example, 0.10 indicates one-tenth of a standard deviation. These effect sizes are commonly called sigma units and are used in studies of the effects of educational programs to gauge the size of impacts from an intervention. We also show the confidence interval around each point estimate for the effect size. All estimates are based on a 95% confidence interval (the 5% significance level). When the confidence interval includes zero, the estimate is not significant at the 5% level.
In each table below, the leftmost column provides the overall Intention-to-Treat (ITT) estimate for a student assigned to an MCE classroom. However, we are also interested in testing whether the average effects also hold for the subgroups of particular interest. The columns to the right of the overall estimate include the interactions of MCE and gender (female), language (ESL), economic status (SES), and student scores on the 2014 standardized math test. The interaction terms estimate the incremental impact of MCE for these students relative to other groups. In other words, a negative coefficient indicates that the program had a smaller effect on that subgroup, not that MCE was detrimental to them. We only discuss subgroup interactions in cases where the estimates are statistically meaningful.
Student Outcomes
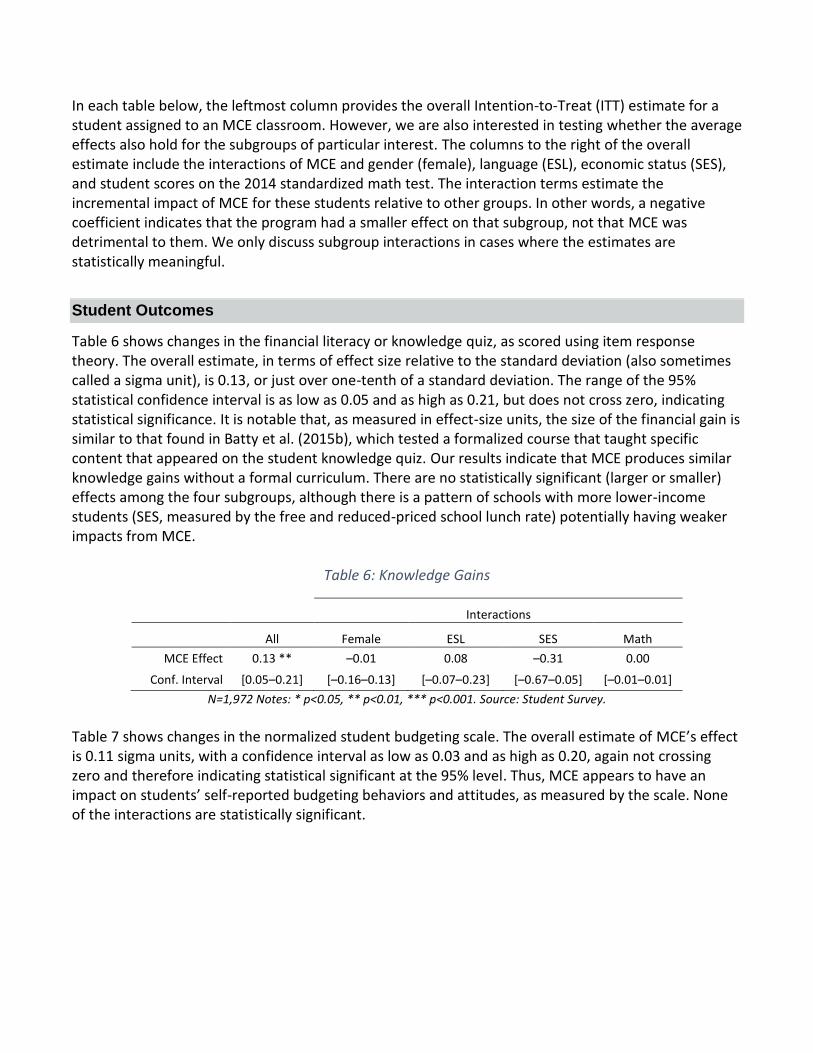
Table 6 shows changes in the financial literacy or knowledge quiz, as scored using item response theory. The overall estimate, in terms of effect size relative to the standard deviation (also sometimes called a sigma unit), is 0.13, or just over one-tenth of a standard deviation. The range of the 95% statistical confidence interval is as low as 0.05 and as high as 0.21, but does not cross zero, indicating statistical significance. It is notable that, as measured in effect-size units, the size of the financial gain is similar to that found in Batty et al. (2015b), which tested a formalized course that taught specific content that appeared on the student knowledge quiz. Our results indicate that MCE produces similar knowledge gains without a formal curriculum. There are no statistically significant (larger or smaller) effects among the four subgroups, although there is a pattern of schools with more lower-income students (SES, measured by the free and reduced-priced school lunch rate) potentially having weaker impacts from MCE.
Table 6: Knowledge Gains
Interactions
All Female ESL SES Math
MCE Effect 0.13 ** –0.01 0.08 –0.31 0.00
Conf. Interval [0.05–0.21] [–0.16–0.13] [–0.07–0.23] [–0.67–0.05] [–0.01–0.01]
N=1,972 Notes: * p<0.05, ** p<0.01, *** p<0.001. Source: Student Survey.
Table 7 shows changes in the normalized student budgeting scale. The overall estimate of MCE’s effect is 0.11 sigma units, with a confidence interval as low as 0.03 and as high as 0.20, again not crossing zero and therefore indicating statistical significant at the 95% level. Thus, MCE appears to have an impact on students’ self-reported budgeting behaviors and attitudes, as measured by the scale. None of the interactions are statistically significant.
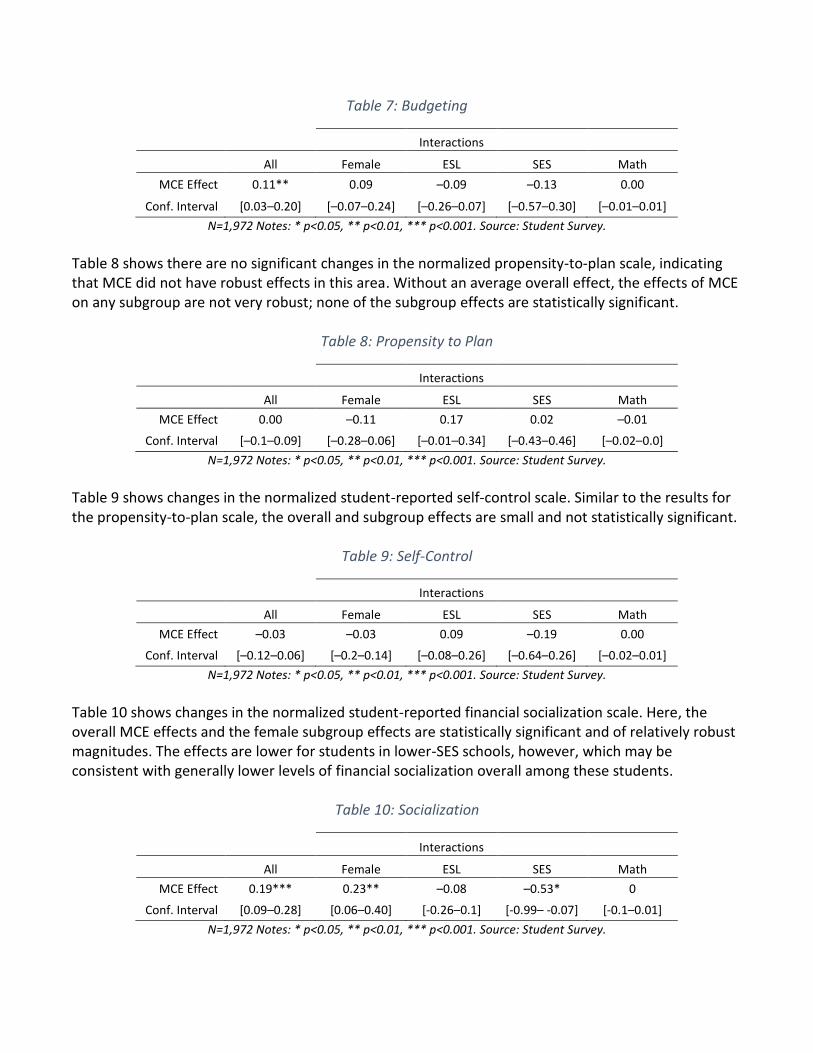
Table 7: Budgeting
Interactions
All Female ESL SES Math
MCE Effect 0.11** 0.09 –0.09 –0.13 0.00
Conf. Interval [0.03–0.20] [–0.07–0.24] [–0.26–0.07] [–0.57–0.30] [–0.01–0.01]
N=1,972 Notes: * p<0.05, ** p<0.01, *** p<0.001. Source: Student Survey.
Table 8 shows there are no significant changes in the normalized propensity-to-plan scale, indicating that MCE did not have robust effects in this area. Without an average overall effect, the effects of MCE on any subgroup are not very robust; none of the subgroup effects are statistically significant.
Table 8: Propensity to Plan
Interactions
All Female ESL SES Math
MCE Effect 0.00 –0.11 0.17 0.02 –0.01
Conf. Interval [–0.1–0.09] [–0.28–0.06] [–0.01–0.34] [–0.43–0.46] [–0.02–0.0]
N=1,972 Notes: * p<0.05, ** p<0.01, *** p<0.001. Source: Student Survey.
Table 9 shows changes in the normalized student-reported self-control scale. Similar to the results for the propensity-to-plan scale, the overall and subgroup effects are small and not statistically significant.
Table 9: Self-Control
Interactions
All Female ESL SES Math
MCE Effect –0.03 –0.03 0.09 –0.19 0.00
Conf. Interval [–0.12–0.06] [–0.2–0.14] [–0.08–0.26] [–0.64–0.26] [–0.02–0.01]
N=1,972 Notes: * p<0.05, ** p<0.01, *** p<0.001. Source: Student Survey.
Table 10 shows changes in the normalized student-reported financial socialization scale. Here, the overall MCE effects and the female subgroup effects are statistically significant and of relatively robust magnitudes. The effects are lower for students in lower-SES schools, however, which may be consistent with generally lower levels of financial socialization overall among these students.
Table 10: Socialization
Interactions
All Female ESL SES Math
MCE Effect 0.19*** 0.23** –0.08 –0.53* 0
Conf. Interval [0.09–0.28] [0.06–0.40] [-0.26–0.1] [-0.99– -0.07] [-0.1–0.01]
N=1,972 Notes: * p<0.05, ** p<0.01, *** p<0.001. Source: Student Survey.
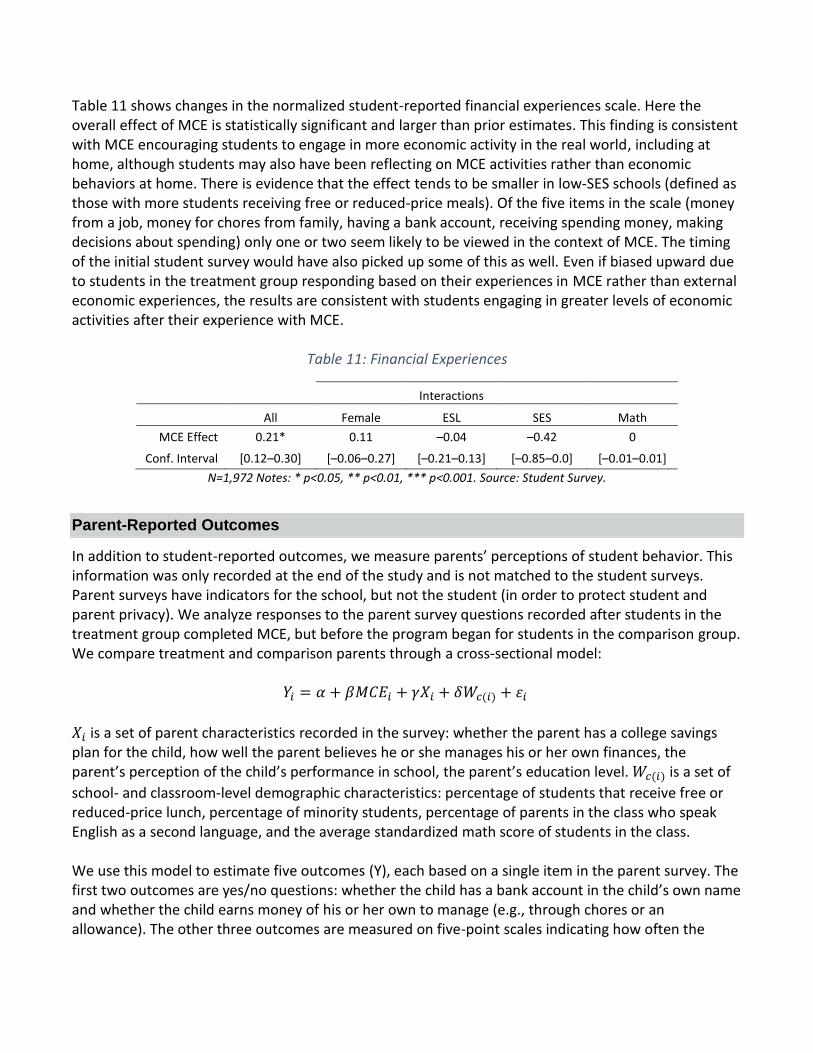
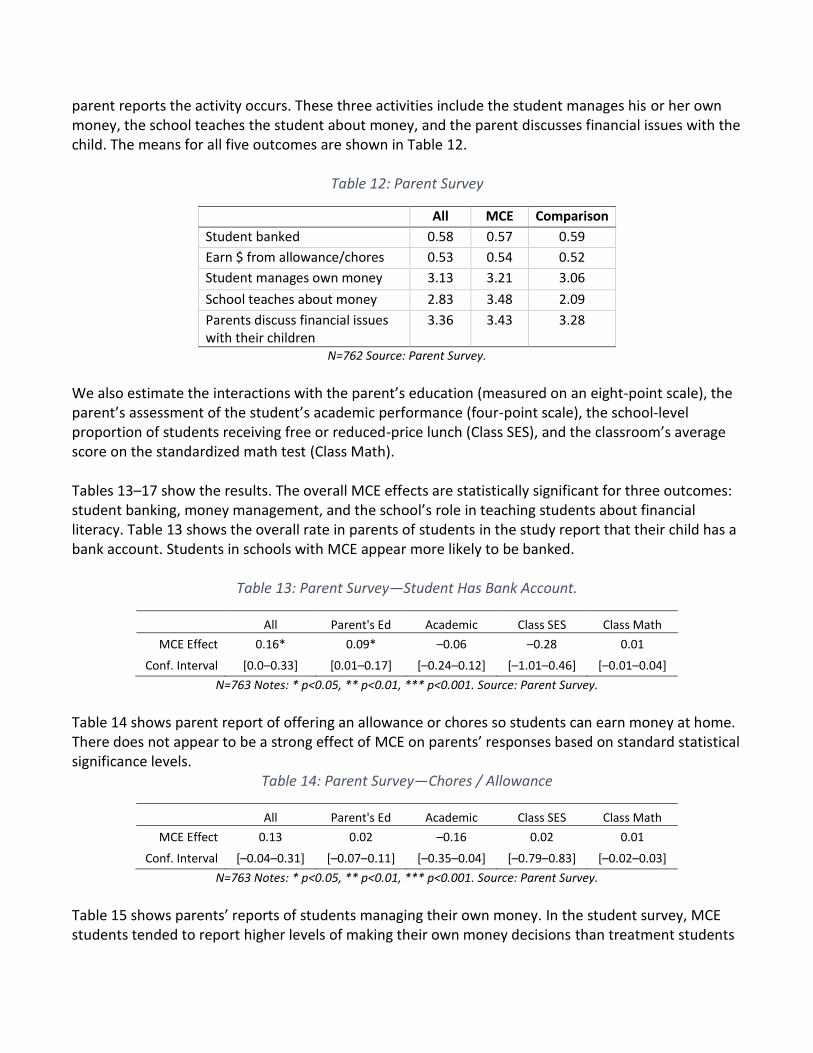
Table 11 shows changes in the normalized student-reported financial experiences scale. Here the overall effect of MCE is statistically significant and larger than prior estimates. This finding is consistent with MCE encouraging students to engage in more economic activity in the real world, including at home, although students may also have been reflecting on MCE activities rather than economic behaviors at home. There is evidence that the effect tends to be smaller in low-SES schools (defined as those with more students receiving free or reduced-price meals). Of the five items in the scale (money from a job, money for chores from family, having a bank account, receiving spending money, making decisions about spending) only one or two seem likely to be viewed in the context of MCE. The timing of the initial student survey would have also picked up some of this as well. Even if biased upward due to students in the treatment group responding based on their experiences in MCE rather than external economic experiences, the results are consistent with students engaging in greater levels of economic activities after their experience with MCE.
Table 11: Financial Experiences
Interactions
All Female ESL SES Math
MCE Effect 0.21* 0.11 –0.04 –0.42 0
Conf. Interval [0.12–0.30] [–0.06–0.27] [–0.21–0.13] [–0.85–0.0] [–0.01–0.01]
N=1,972 Notes: * p<0.05, ** p<0.01, *** p<0.001. Source: Student Survey.
Parent-Reported Outcomes
In addition to student-reported outcomes, we measure parents’ perceptions of student behavior. This information was only recorded at the end of the study and is not matched to the student surveys. Parent surveys have indicators for the school, but not the student (in order to protect student and parent privacy). We analyze responses to the parent survey questions recorded after students in the treatment group completed MCE, but before the program began for students in the comparison group. We compare treatment and comparison parents through a cross-sectional model:
𝑌𝑖 = 𝛼 + 𝛽𝑀𝐶𝐸𝑖 + 𝛾𝑋𝑖 + 𝛿𝑊𝑐(𝑖) + 휀𝑖
𝑋𝑖 is a set of parent characteristics recorded in the survey: whether the parent has a college savings plan for the child, how well the parent believes he or she manages his or her own finances, the parent’s perception of the child’s performance in school, the parent’s education level. 𝑊𝑐(𝑖) is a set of
school- and classroom-level demographic characteristics: percentage of students that receive free or reduced-price lunch, percentage of minority students, percentage of parents in the class who speak English as a second language, and the average standardized math score of students in the class. We use this model to estimate five outcomes (Y), each based on a single item in the parent survey. The first two outcomes are yes/no questions: whether the child has a bank account in the child’s own name and whether the child earns money of his or her own to manage (e.g., through chores or an allowance). The other three outcomes are measured on five-point scales indicating how often the
parent reports the activity occurs. These three activities include the student manages his or her own money, the school teaches the student about money, and the parent discusses financial issues with the child. The means for all five outcomes are shown in Table 12.
Table 12: Parent Survey
All MCE Comparison
Student banked 0.58 0.57 0.59
Earn $ from allowance/chores 0.53 0.54 0.52
Student manages own money 3.13 3.21 3.06
School teaches about money 2.83 3.48 2.09
Parents discuss financial issues with their children
3.36 3.43 3.28
N=762 Source: Parent Survey.
We also estimate the interactions with the parent’s education (measured on an eight-point scale), the parent’s assessment of the student’s academic performance (four-point scale), the school-level proportion of students receiving free or reduced-price lunch (Class SES), and the classroom’s average score on the standardized math test (Class Math). Tables 13–17 show the results. The overall MCE effects are statistically significant for three outcomes: student banking, money management, and the school’s role in teaching students about financial literacy. Table 13 shows the overall rate in parents of students in the study report that their child has a bank account. Students in schools with MCE appear more likely to be banked.
Table 13: Parent Survey—Student Has Bank Account.
All Parent's Ed Academic Class SES Class Math
MCE Effect 0.16* 0.09* –0.06 –0.28 0.01
Conf. Interval [0.0–0.33] [0.01–0.17] [–0.24–0.12] [–1.01–0.46] [–0.01–0.04]
N=763 Notes: * p<0.05, ** p<0.01, *** p<0.001. Source: Parent Survey.
Table 14 shows parent report of offering an allowance or chores so students can earn money at home. There does not appear to be a strong effect of MCE on parents’ responses based on standard statistical significance levels.
Table 14: Parent Survey—Chores / Allowance
All Parent's Ed Academic Class SES Class Math
MCE Effect 0.13 0.02 –0.16 0.02 0.01
Conf. Interval [–0.04–0.31] [–0.07–0.11] [–0.35–0.04] [–0.79–0.83] [–0.02–0.03]
N=763 Notes: * p<0.05, ** p<0.01, *** p<0.001. Source: Parent Survey.
Table 15 shows parents’ reports of students managing their own money. In the student survey, MCE students tended to report higher levels of making their own money decisions than treatment students
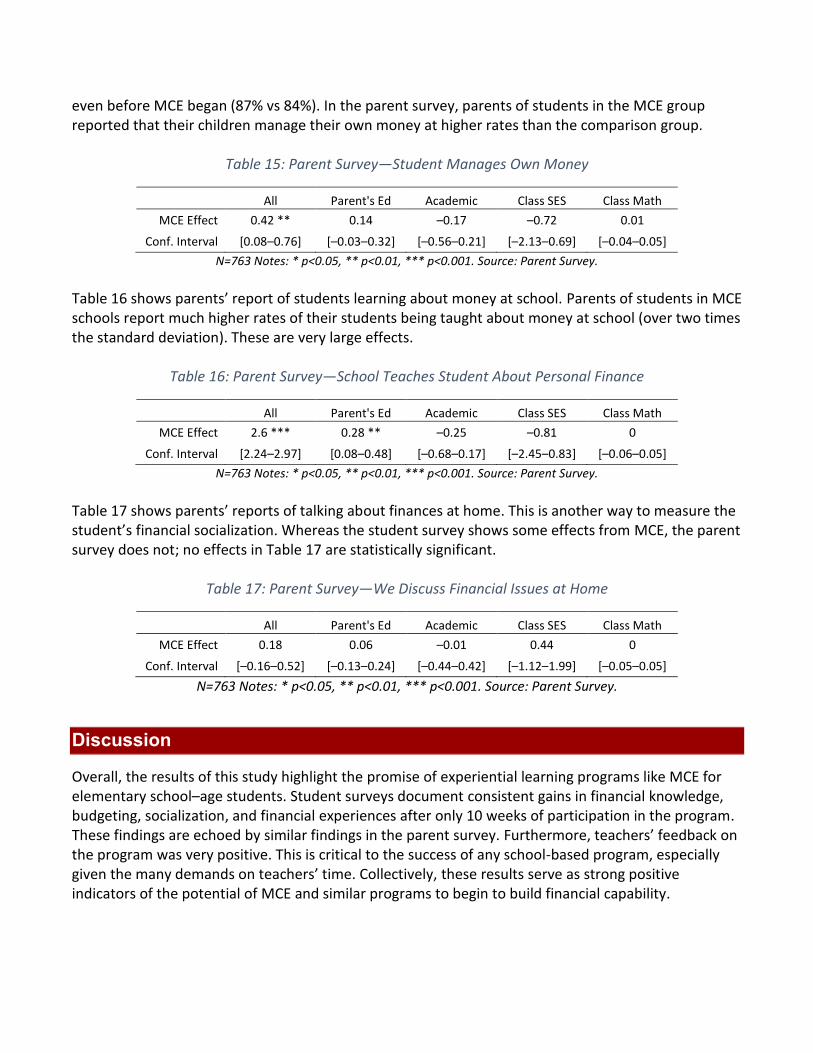
even before MCE began (87% vs 84%). In the parent survey, parents of students in the MCE group reported that their children manage their own money at higher rates than the comparison group.
Table 15: Parent Survey—Student Manages Own Money
All Parent's Ed Academic Class SES Class Math
MCE Effect 0.42 ** 0.14 –0.17 –0.72 0.01
Conf. Interval [0.08–0.76] [–0.03–0.32] [–0.56–0.21] [–2.13–0.69] [–0.04–0.05]
N=763 Notes: * p<0.05, ** p<0.01, *** p<0.001. Source: Parent Survey.
Table 16 shows parents’ report of students learning about money at school. Parents of students in MCE schools report much higher rates of their students being taught about money at school (over two times the standard deviation). These are very large effects.
Table 16: Parent Survey—School Teaches Student About Personal Finance
All Parent's Ed Academic Class SES Class Math
MCE Effect 2.6 *** 0.28 ** –0.25 –0.81 0
Conf. Interval [2.24–2.97] [0.08–0.48] [–0.68–0.17] [–2.45–0.83] [–0.06–0.05]
N=763 Notes: * p<0.05, ** p<0.01, *** p<0.001. Source: Parent Survey. Table 17 shows parents’ reports of talking about finances at home. This is another way to measure the student’s financial socialization. Whereas the student survey shows some effects from MCE, the parent survey does not; no effects in Table 17 are statistically significant.
Table 17: Parent Survey—We Discuss Financial Issues at Home
All Parent's Ed Academic Class SES Class Math
MCE Effect 0.18 0.06 –0.01 0.44 0
Conf. Interval [–0.16–0.52] [–0.13–0.24] [–0.44–0.42] [–1.12–1.99] [–0.05–0.05]
N=763 Notes: * p<0.05, ** p<0.01, *** p<0.001. Source: Parent Survey.
Discussion
Overall, the results of this study highlight the promise of experiential learning programs like MCE for elementary school–age students. Student surveys document consistent gains in financial knowledge, budgeting, socialization, and financial experiences after only 10 weeks of participation in the program. These findings are echoed by similar findings in the parent survey. Furthermore, teachers’ feedback on the program was very positive. This is critical to the success of any school-based program, especially given the many demands on teachers’ time. Collectively, these results serve as strong positive indicators of the potential of MCE and similar programs to begin to build financial capability.
In general, the positive impact associated with participation in MCE does not differ across subgroups—that is, student and parents from a variety of backgrounds see similar effects in response to MCE. The effects are not concentrated among higher-SES schools, or even among students who are more proficient at math. School-based assignment to MCE is not ideal to test for subgroup effects, however, and how experiential learning affects more economically vulnerable students is an issue that may benefit from further exploration. MCE is designed to run the length of a school year, giving students more opportunities to make financial decisions and receive feedback, and allowing teachers to incorporate more sophisticated elements of personal finance. The 10-week version of the program used for this study generated effects similar in magnitude to those from a prior study that evaluated the effects of formal, classroom-based financial education lessons (Batty, Collins, & Odders-White, 2015). The full, year-long version of MCE would likely show more substantial effects, and with decreasing effects on classroom time as the year goes on. Indeed, the natural advantage of a simulated economy is that it can operate as a classroom management system without requiring the development of additional curricula. Experiential simulations like MCE could be operated concurrently with a traditional financial education curriculum. The combination of experiential learning and classroom work from elementary grades into junior high and high school may have promise as a flexible strategy that can continue to engage students as they develop and practice financial capability. A student who experiences MCE at age 9 and 10, in-school banking and coursework through age 14, and a combination of experiential and classroom learning at ages 15 to 18 might be most likely to develop stronger financial capability in adulthood. Engaging parents more directly could enhance the development of financial capability even further.
Conclusions
MCE yields consistent gains in fourth- and fifth-grade student’s financial knowledge, budgeting, socialization, and financial experiences after 10 weeks. The size of these effects ranges, but they are all statistically significant and positive. There was no measurable effect of MCE on student’s self-reported planning for the future or self-reported levels of self-control, although both may engage more engrained behaviors that involve broader issues than simply financial management. The program could serve as an important component of a comprehensive effort to develop financial capability and promote financial well-being. The effects are promising and teachers liked the program, showing low levels of resistance or barriers to implementation. The approach seems to be practical and to have real impact on knowledge and behavior.

References
Agarwal, S., & Mazumder, B. (2013). Cognitive abilities and household financial decision making. American Economic Journal: Applied Economics,5(1), 193-207.
Ashby, J., Schoon, I., & Webley, P. (2011). Save now, save later? European Psychologist, 16(3), 227–237. Batty, M., Collins, J. M., & Odders-White, E. (2015a). Experimental evidence on the effects of financial
education on elementary school students' knowledge, behavior, and attitudes. The Journal of Consumer Affairs, 49(1), 69–96.
Batty, M., Collins, J.M., & Odders-White, E. (2015b). Validity and Reliability of Elementary Student Financial Education Outcome Measures. Working paper, UW-Madison Center for Financial Security, July 31.
Brown, A. M., Collins, J. M., Schmeiser, M. D., & Urban, C. (2014). State mandated financial education and the credit behavior of young adults.Divisions of Research & Statistics and Monetary Affairs Federal Reserve Board, Washington, DC, Finance and Economics Discussion Series, (2014-68).
Bruhn, M., de Souza Leao, L., Legovini, A., Marchetti, R., & Zia, B. 2013. The impact of high school financial education: Experimental evidence from Brazil. Washington, DC: World Bank Group. Retrieved from http://papers.ssrn.com/sol3/papers.cfm?abstract_id=2367083
Collins, J. M., & Odders-White, E. (2015). A framework for developing and testing financial capability education programs targeted to elementary schools. The Journal of Economic Education, 46(1), 105–120.
Council for Economic Education. 2014. Survey of the states: The state of K–12 economic and financial education in the United States. Retrieved from http://councilforeconed.org/policy-and-advocacy/survey-of-the-states/
Crosnoe, R., & Turley, R. N. L. (2011). K-12 educational outcomes of immigrant youth. The Future of Children, 21(1), 129-152.
Danes, S. M. (1994). Parental perceptions of children’s financial socialization. Financial Counseling and Planning, 5(1), 27–146.
DeVellis, R. F. (2016). Scale development: Theory and applications, 4th ed. Thousand Oaks, CA: Sage Publications.
Doss, V. S., Marlowe, J., & Godwin, D. D. (1995). Middle‐school children's sources and uses of money. Journal of Consumer Affairs, 29(1), 219–241.
Drever, A., Odders-White, E., Kalish, C., Else-QUEST, N., Hoagland, E., & Nelms, E. (2015). Foundations of financial well-being: Insights into the role of executive function, financial socialization, and experience-based learning in childhood and youth. The Journal of Consumer Affairs, 49(1), 13–38.
Edwards, R., Allen, M. W., & Hayhoe, C. R. (2007). Financial attitudes and family communication about students' finances: The role of sex differences. Communication Reports, 20(2), 90–100.
Fernandes, D., Lynch Jr., J. G., & Netemeyer, R. G. (2014). Financial literacy, financial education, and downstream financial behaviors. Management Science, 60(8), 1861–1883.
Grinstein-Weiss, M., Spader, J., Yeo, Y. H., Taylor, A., & Books Freeze, E. (2011). Parental transfer of financial knowledge and later credit outcomes among low- and moderate-income homeowners. Children and Youth Services Review, 33(1), 78–85.

Grusec, J. E., & Davidov, M. (2007). Socialization in the family: The roles of parents. In J. E. Grusec & P. D. Hastings (Eds.), Handbook of socialization: Theory and research (pp. 284–308). New York and London: Guilford Press.
Gudmunson, C. G., & Danes, S. M. (2011). Family financial socialization: Theory and critical review. Journal of Family and Economic Issues, 32(4), 644–667.
Harter, C. L., & Harter, J. F. R. (2009). Assessing the effectiveness of financial fitness for life in eastern Kentucky. Journal of Applied Economics & Policy, 28(1), 20–33.
Johnson, E., & Sherraden, M. S. (2007). From financial literacy to financial capability among youth. Journal of Sociology and Social Welfare, 34(3), 119–146.
Jorgensen, B. L., & Savla, J. (2010). Financial literacy of young adults: The importance of parental socialization. Family Relations 59(4), 465–478.
Kim, J., & Chatterjee, S. (2013). Childhood financial socialization and young adults' financial management. Journal of Financial Counseling and Planning, 24(1), 61.
Lusardi, A., & Mitchell, O. S. (2014). The economic importance of financial literacy: Theory and evidence. Journal of Economic Literature, 52(1), 5–44.
Lusardi, A., Mitchell, O. S., & Curto, V. (2010). Financial literacy among the young. Journal of Consumer Affairs, 44(2), 358–380.
Melton, G. B. (2013). The nature and scope of child research: Learning about children’s lives. In A. Ben-Arieh, J. Cashmore, G. S. Goodman, & N. K. Worley (Eds.), The SAGE handbook of child research (pp. 3–28). London: Sage.
National Association of State Boards of Education’s Commission on Financial and Investor Literacy (2006). Who will own our children? The report of the NASBE Commission on Financial and Investor Literacy. Retrieved from http://www.nasbe.org/wp-content/uploads/Financial_Literacy_Final_NASBE.pdf.
Otto, A. (2013). Saving in childhood and adolescence: Insights from developmental psychology. Economics of Education Review, 33, 8–18.
Palm Beach County School District (2016) Gold Report Summary Report - PFS-SF-22 Retrieved from: www.palmbeachschools.org
Peng, T.-C. M., Bartholomae, S., Fox, J. J., & Cravener, G. (2007). The impact of personal finance education delivered in high school and college courses. Journal of Family and Economic Issues, 28(2), 265–284.
Pliner, P., Darke, P., Abramovitch, R., & Freedman, J. (1994). Children's consumer behavior in a store with unattractive merchandise: The “caveat emptorium.” Journal of Economic Psychology, 15(3), 449–465.
Scheinholtz, L., Holden, K., & Kalish, C. (2012). Cognitive development and children’s understanding of personal finance. In D. J. Lamdin (Ed.), Consumer knowledge and financial decisions: Lifespan perspectives (pp. 29–47). New York, NY: Springer New York.
Schug, M. (1987). Children's Understanding of Economics. The Elementary School Journal., 87(5), 507-518.
Schug, M., & Walstad, W. (1991). Teaching and learning economics. In J. Shaver (Ed.), Handbook of Research on Social Studies Teaching and Learning, 411–419. New York” MacMillian Reference Books

Sherraden, M. S., Johnson, L., Guo, B., & Elliott, W. (2011). Financial capability in children: Effects of participation in a school-based financial education and savings program. Journal of Family and Economic Issues, 32(3), 385–399.
Shim, S., Barber, B. L., Card, N. A., Xiao, J. J., & Serido, J. (2010). Financial socialization of first-year college students: The roles of parents, work, and education. Journal of Youth and Adolescence, 39(12), 1457–1470.
Snyder, T. D., de Brey, C., & Dillow, S. A. (2016). Digest of Education Statistics 2014, NCES 2016-006. National Center for Education Statistics. Washington DC: Department of Education.
Suiter, M., & Meszaros, B. (2005). Teaching about saving and investing in the elementary and middle school grades. Social Education, 69(2), 92–95.
Totenhagen, C. J., Casper, D. M., Faber, K. M., Bosch, L. A., Wiggs, C. B., & Borden, L. M. (2015). Youth financial literacy: A review of key considerations and promising delivery methods. Journal of Family and Economic Issues, 36(2), 167–191.
Van Campenhout, G. (2015). Revaluing the role of parents as financial socialization agents in youth financial literacy programs. Journal of Consumer Affairs, 49(1), 186–222.
Walstad, W. B., Rebeck, K. E. N., & MacDonald, R. A. (2010). The effects of financial education on the financial knowledge of high school students. Journal of Consumer Affairs, 44(2), 336–357.
Way, W. L., & Holden, K. C. (2009). Teachers’ background and capacity to teach personal finance: Results of a national study. Journal of Financial Counseling and Planning Volume, 20(2), 64–78.
Webley P. (2005) Children’s understanding of economics. In M. Barrett & E. Buchanan-Barrow (Eds). Children’s Understanding of Society Hove:Psychology Press
Webley, P., & Nyhus, E. K. (2006). Parents’ influence on children’s future orientation and saving. Journal of Economic Psychology, 27(1), 140–164.
Wiedrich, K., Collins, J. M., Rosen, L., & Rademacher, I. (2014). Financial education & account access among elementary students: Findings from the Assessing Financial Capability Outcomes (AFCO) youth pilot. Retrieved from https://www.treasury.gov/resource-center/financial-education/Documents/Financial%20Education%20%20Account%20Access%20Among%20Elementary%20Students%20Findings%20from%20the%20Assessing%20Financial%20Capability%20Outcomes%20You%E2%80%A6.pdf
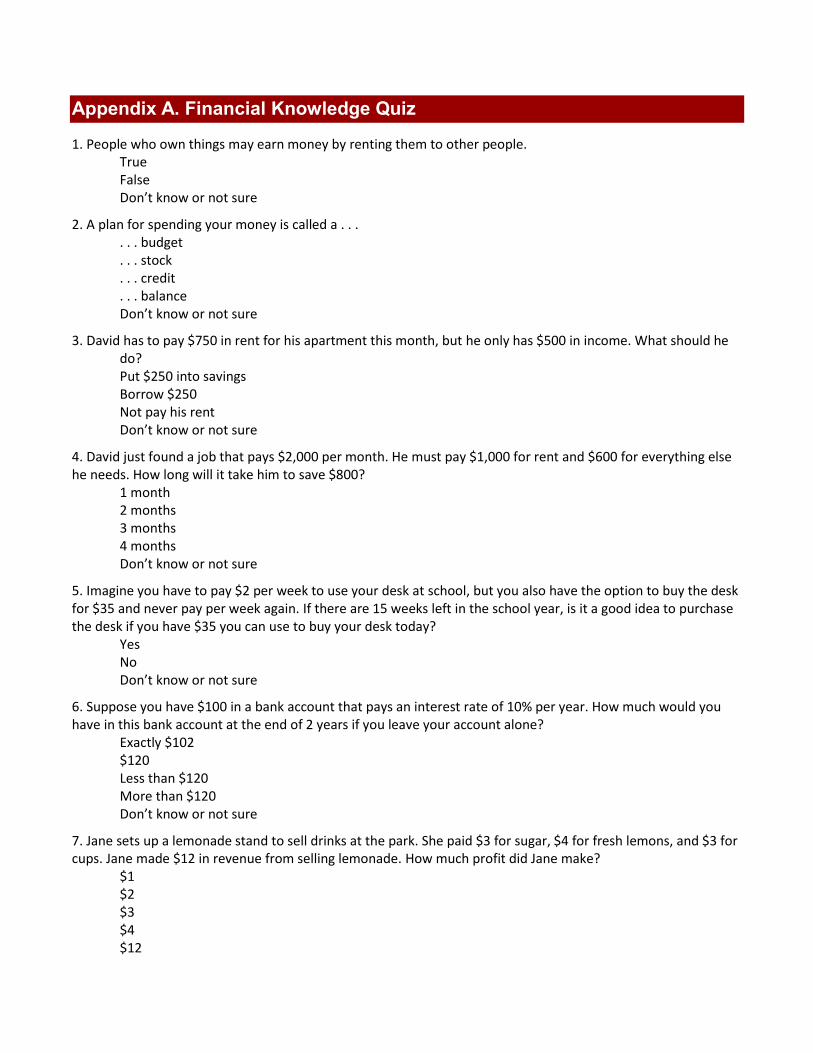
Appendix A. Financial Knowledge Quiz
1. People who own things may earn money by renting them to other people. True False Don’t know or not sure
2. A plan for spending your money is called a . . . . . . budget . . . stock . . . credit . . . balance Don’t know or not sure
3. David has to pay $750 in rent for his apartment this month, but he only has $500 in income. What should he do?
Put $250 into savings Borrow $250 Not pay his rent Don’t know or not sure
4. David just found a job that pays $2,000 per month. He must pay $1,000 for rent and $600 for everything else he needs. How long will it take him to save $800? 1 month 2 months 3 months 4 months Don’t know or not sure
5. Imagine you have to pay $2 per week to use your desk at school, but you also have the option to buy the desk for $35 and never pay per week again. If there are 15 weeks left in the school year, is it a good idea to purchase the desk if you have $35 you can use to buy your desk today? Yes No Don’t know or not sure
6. Suppose you have $100 in a bank account that pays an interest rate of 10% per year. How much would you have in this bank account at the end of 2 years if you leave your account alone? Exactly $102 $120
Less than $120 More than $120 Don’t know or not sure
7. Jane sets up a lemonade stand to sell drinks at the park. She paid $3 for sugar, $4 for fresh lemons, and $3 for cups. Jane made $12 in revenue from selling lemonade. How much profit did Jane make? $1 $2 $3 $4 $12

Don’t know or not sure
8. The Smiths have $750 in income, and $800 in expenses this month. They are saving money this month. True
False Don’t know or not sure
9. Tracy has $250. She wants to buy a nice backpack for $100 and buy a new tablet for $200. She decided to buy a simple $50 backpack. Tracy must have decided it was more important for her to have a nicer backpack than a tablet. True
False Don’t know or not sure
10. Which is closest to the cost of one ticket to a newly released movie at a regular movie theater? $1 $10 $50 $75 $100 Don’t know or not sure
11. Which is closest to what one week’s worth of groceries cost for a family of 4? $5 $20 $200 $1,000 $10,000 Don’t know or not sure
12. Ming wanted to buy a fancy notebook for school and save her money to buy a computer. Ming decided to buy a plain notebook that is less expensive so she can save more money for the computer. Ming’s decision is an example of . . . . . . paying interest . . . depositing money . . . making a tradeoff . . . choosing a service Don’t know or not sure
13. Jill had $50 in her checking account. She made a withdrawal of $10 and a deposit of $20. What is Jill’s balance in her checking account?
$10 $20 $50 $60 Don’t know or not sure
Appendix B. IRT Scoring for Quiz Questions
Item response theory (IRT) accounts for differences in the difficulty of individual questions. The model estimates a parameter for each of the quiz items in terms of how well a correct answer to that question predicts overall performance on the quiz. In addition, the IRT approach determines how well each question discriminates between high- and low-performing students, where performance is the latent trait the scale is attempting to measure. The output (Table A1) shows the parameters used. This output is based on a three-parameter logistic IRT model, which includes difficulty, discrimination, and guessing parameters. The factor analysis (Table A-2) shows that all of the items have a unique loading value for one or more factors, indicating that the scale generally performs well; that is, it measures what it is intended to.
Table A1
Para Coef. Std. Err. Z P>z [95% Conf Interval]
Discrim Q1 0.7743 0.0783 9.9 0.00 0.621 0.928
Q2 0.5825 0.0683 8.5 0.00 0.449 0.716 Q3 0.8281 0.0820 10.1 0.00 0.667 0.989 Q4 1.1781 0.1111 10.6 0.00 0.960 1.396 Q5 0.9361 0.0861 10.9 0.00 0.767 1.105 Q6 -0.1425 0.0833 -1.7 0.09 -0.306 0.021 Q7 2.4674 0.3375 7.3 0.00 1.806 3.129 Q8 0.8907 0.1038 8.6 0.00 0.687 1.094 Q9 1.0442 0.0930 11.2 0.00 0.862 1.227 Q10 0.8600 0.0808 10.6 0.00 0.702 1.018 Q11 0.9165 0.0833 11.0 0.00 0.753 1.080 Q12 1.1048 0.2475 4.5 0.00 0.620 1.590 Q13 0.8063 0.0810 10.0 0.00 0.648 0.965 Diff
Q1 -0.6846 0.1042 -6.6 0.00 -0.889 -0.480 Q2 -0.1893 0.1118 -1.7 0.09 -0.408 0.030 Q3 0.5964 0.0946 6.3 0.00 0.411 0.782 Q4 0.6378 0.0731 8.7 0.00 0.494 0.781 Q5 -0.0270 0.0760 -0.4 0.72 -0.176 0.122 Q6 -11.3994 6.5651 -1.7 0.08 -24.267 1.468 Q7 0.5961 0.0498 12.0 0.00 0.498 0.694 Q8 1.2850 0.1195 10.8 0.00 1.051 1.519 Q9 -0.0362 0.0709 -0.5 0.61 -0.175 0.103 Q10 -0.1079 0.0805 -1.3 0.18 -0.266 0.050 Q11 -0.2893 0.0785 -3.7 0.00 -0.443 -0.136 Q12 2.4634 0.2648 9.3 0.00 1.944 2.982 Q13 0.3596 0.0883 4.1 0.00 0.187 0.533 Guess 0.0435 0.0175 2.5 0.01 0.009 0.078
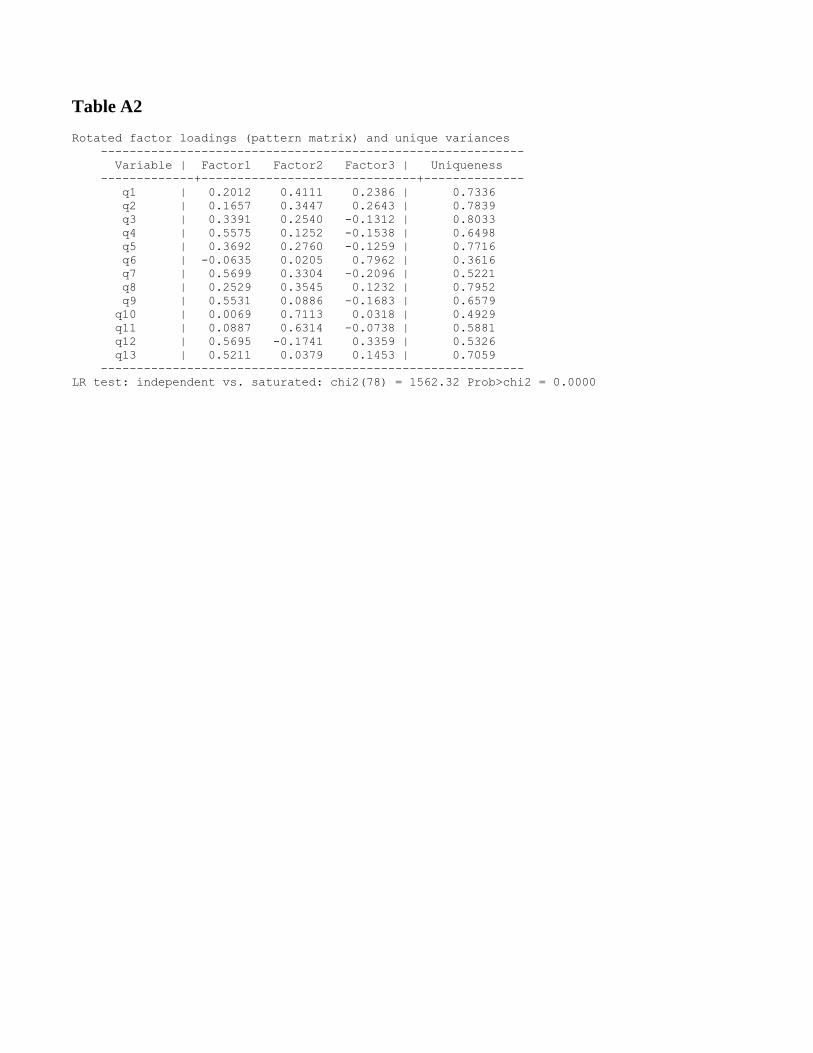
Table A2 Rotated factor loadings (pattern matrix) and unique variances
-----------------------------------------------------------
Variable | Factor1 Factor2 Factor3 | Uniqueness
-------------+------------------------------+--------------
q1 | 0.2012 0.4111 0.2386 | 0.7336
q2 | 0.1657 0.3447 0.2643 | 0.7839
q3 | 0.3391 0.2540 -0.1312 | 0.8033
q4 | 0.5575 0.1252 -0.1538 | 0.6498
q5 | 0.3692 0.2760 -0.1259 | 0.7716
q6 | -0.0635 0.0205 0.7962 | 0.3616
q7 | 0.5699 0.3304 -0.2096 | 0.5221
q8 | 0.2529 0.3545 0.1232 | 0.7952
q9 | 0.5531 0.0886 -0.1683 | 0.6579
q10 | 0.0069 0.7113 0.0318 | 0.4929
q11 | 0.0887 0.6314 -0.0738 | 0.5881
q12 | 0.5695 -0.1741 0.3359 | 0.5326
q13 | 0.5211 0.0379 0.1453 | 0.7059
-----------------------------------------------------------
LR test: independent vs. saturated: chi2(78) = 1562.32 Prob>chi2 = 0.0000