evaluating environmental risks in mining: a perceptual study
TRANSCRIPT
University of VermontScholarWorks @ UVM
Graduate College Dissertations and Theses Dissertations and Theses
2008
Evaluating Environmental Risks in Mining: aPerceptual StudyMary AckleyUniversity of Vermont
Follow this and additional works at: https://scholarworks.uvm.edu/graddis
This Thesis is brought to you for free and open access by the Dissertations and Theses at ScholarWorks @ UVM. It has been accepted for inclusion inGraduate College Dissertations and Theses by an authorized administrator of ScholarWorks @ UVM. For more information, please [email protected].
Recommended CitationAckley, Mary, "Evaluating Environmental Risks in Mining: a Perceptual Study" (2008). Graduate College Dissertations and Theses. 7.https://scholarworks.uvm.edu/graddis/7

EVALUATING ENVIRONMENTAL RISKS IN MINING: A PERCEPTUAL STUDY
AT THE VATUKOULA GOLD MINE IN FIJI
A Thesis Presented
by
Mary Ackley
to
The Faculty of the Graduate College
of
The University of Vermont
In Partial Fulfillment of the Requirements for the Degree of Master of Science Specializing in Natural Resources
May, 2008

Accepted by the Faculty of the Graduate College, The University of Vermont, in partial fulfillment of the requirements for the degree of Master of Science specializing in Natural Resources.
Thesis Examination Committee:
MA&^ Mvisor Saleem H. Ali, Ph.D.
Thomas R. Hudspeth, Ph.D.
7 v'---- 7 . y?-- Chairperson Kie* Killeen, Ph. D.
Vice President for Research and Dean of Graduate Studies
Date: March 17, 2008

ABSTRACT
Gold mining is often associated with positive economic benefits; however, it may also have negative impacts on the environment and human health. It is essential that communities understand the risks and benefits associated with mining, particularly in developing countries where there is often a lack of legislation governing the environmental performance of mining corporations. The perceptions of local people regarding the risks and benefits of mining may differ significantly from those of company representatives, policy makers, and the scientific community. Indeed, public concerns have sometimes been ignored or downplayed by those responsible for the implementation of environmental policies and practices. Examination of the complex social, economic, psychological, political, and cultural factors influencing risk perception in mining communities is thus important for successful risk communication and management.
Issues arising from the interplay between socio-economic benefits and risks are particularly acute in small island states which have isola ted and highly limited economic development trajectories. The lessons learned in such cases are therefore instructive for crisis planning across the developing world. This study conducted firsthand empirical research into the perception of environmental and health risks in the communities surrounding the Vatukoula gold mine in Fiji. Primary data was obtained through a survey questionnaire designed to quantify and evaluate perceived risks (n= 340, representing approximately 24% of the target population). Concurrently, environmental samples were collected to assess the extent of environmental impacts at the study site.
Study results revealed that gender is an important variable in risk perception at Vatukoula. Major findings include: (1) women feel they have less knowledge about the risks of mining compared to men; (2) women feel they have less control to avoid the risks of mining compared to men; and (3) women and men tend to receive risk messages from different sources. The information obtained during this study was made directly available to local stakeholders, to aid in risk management and decision-making.

ACKNOWLEDGEMENTS
First, I would like to express my gratitude to the many people in Fiji who
assisted me throughout this project. Vinaka vakalevu to Romeo Kivi, Ponipate Ravula,
Joesfa Sandreu, and all the people of Vatukoula, who welcomed me into their homes
and lives, even during difficult times. In particular, I am humbled by the boundless
support, patience, and generosity of Pita Vatucawaqa and his family. I would also like
to thank my advisor, Saleem Ali, who encouraged me to take on international research,
and provided support and guidance throughout this project. My gratitude is also
extended to my entire committee, Tom Hudspeth, Kieran Killeen, and Sasha Davis for
their encouragement and patience.
I would also like to acknowledge the generous support of the Tiffany & Co.
Foundation, and support from the University of the South Pacific, the United States
Peace Corps, the World Health Organization, the Government of Fiji, Westech Pty
Ltd., Emperor Mines Ltd., and the individuals at these organizations who provided
valuable feedback and assistance during this project.
Finally, my family and friends have been my foundation throughout my masters
program. Without their support and encouragement I certainly could not have finished
this project. A special thank you also goes to Kristian, who shared in all of my
adventures and supported me along the way.
ii

iii
TABLE OF CONTENTS
Page
ACKNOWLEDGEMENTS ............................................................................................. ii
LIST OF TABLES ...........................................................................................................vi
LIST OF FIGURES ....................................................................................................... vii
CHAPTER 1: VATUKOULA, ROCK OF GOLD.......................................................... 1
1.1 Introduction............................................................................................................. 1
1.2. Location................................................................................................................. 3
1.3. Geology.................................................................................................................. 5
1.4. Profile of a Developing Island Economy............................................................... 6
1.5. Historical Context .................................................................................................. 7 1.5.1. Discovery of Gold ............................................................................................. 7 1.5.2. Historical Contribution of Vatukoula to the Fiji Economy .............................. 9 1.5.3. Development of a Company Town................................................................. 10
1.6. Broader Applicability of the Fiji Case ................................................................. 11
CHAPTER 2: HISTORICAL ENVIRONMENTAL CONCERNS AND CONFLICTS AT VATUKOULA........................................................................................................ 14
2.1. Historical Environmental Concerns ..................................................................... 14
2.2. Historical Conflicts .............................................................................................. 17 2.2.1. Labor Conflicts ............................................................................................... 17 2.2.2. Land Conflicts ................................................................................................ 19
CHAPTER 3: ENVIRONMENTAL IMPLICATIONS OF GOLD MINING.............. 22
3.1. Overview of Mine Processes at Vatukoula.......................................................... 22
3.2. Cyanidation.......................................................................................................... 22
3.3. Chemical Transportation and Storage ................................................................. 23

iv
3.4. Disposal of Mine Wastes ..................................................................................... 23
3.5. Environmental and Health Effects of Cyanide .................................................... 25
3.6. Environmental and Health Effects of Arsenic ..................................................... 27
CHAPTER 4: REGULATORY CONTEXT ................................................................. 29
4.1. Organization ........................................................................................................ 29
4.2. Existing Legislation............................................................................................. 30
CHAPTER 5: UNDERSTANDING ENVIRONMENTAL RISKS.............................. 33
5.1. Risk Perception.................................................................................................... 33
5.2. Risk Communication........................................................................................... 37 5.2.1. Risk Communication Challenges ................................................................... 37 5.2.2. Best Practices in Risk Communication........................................................... 41
CHAPTER 6: MINING AND SUSTAINABLE DEVELOPMENT............................. 44
6.1. Proceed With Caution: The Resource Curse ....................................................... 47
6.2. Stepping Towards Sustainability in the Extractive Industries ............................. 51
CHAPTER 7: RESEARCH METHODOLOGY ........................................................... 58
7.1. Risk-Perception Survey....................................................................................... 58 7.1.1. Survey Instrument........................................................................................... 64 7.1.2. Data Analysis .................................................................................................. 65 7.1.3. Limitations ...................................................................................................... 66
7.2. Environmental Sampling and Analysis ............................................................... 68
7.3. Hydrogen-Sulfide Testing for Bacterial Contamination...................................... 70
CHAPTER 8: RESULTS AND DISCUSSION............................................................. 74
8.1. Risk-Perception Survey....................................................................................... 74 8.1.1. Profile of Respondents.................................................................................... 74 8.1.2. Knowledge of Risks........................................................................................ 75 8.1.3. Level of Concern ............................................................................................ 77 8.1.4. Trust in Authorities ......................................................................................... 79

v
8.1.5. Control ............................................................................................................ 80 8.1.6. Ability............................................................................................................. 81 8.1.7. Weighing Risks and Benefits.......................................................................... 81 8.1.8. Gender and Risk Perception ........................................................................... 83 8.1.9. Health Data ..................................................................................................... 92 8.1.10. Other Demographic Variables ...................................................................... 93 8.1.11. Open-Ended Responses ................................................................................ 96
8.2 Environmental Sampling ...................................................................................... 98
8.3. Hydrogen-Sulfide Testing for Bacterial Contamination.................................... 102
8.4. Impacts of Mine Closure ................................................................................... 103
8.5. Mining in Fiji and the Natural Resource Curse ................................................. 112
CHAPTER 9: CONCLUSION .................................................................................... 118
9.1. Recommendations for Risk Communication and Management ........................ 119
9.2. Lessons for Mine Closure and Transition.......................................................... 128
COMPREHENSIVE BIBLIOGRAPHY ..................................................................... 134
APPENDIX I: SURVEY INSTRUMENT (ENGLISH LANGUAGE)....................... 143
APPENDIX II: SURVEY INSTRUMENT (FIJIAN LANGUAGE) .......................... 154
APPENDIX III: SURVEY RESULTS ........................................................................ 165

vi
LIST OF TABLES Table Page
Table 1: Organization of Target Population and No# of Respondents ............................. 62 Table 2: Sample Key......................................................................................................... 69 Table 3: Summary of Demographic Characteris tics......................................................... 75 Table 4: Respondents Knowledge of Risks: Cross-tabulation According to Gender....... 84 Table 5: Company Reaction to Concern: Cross-Tabulation According to Gender .......... 87 Table 6: Control to Avoid Mining Risks .......................................................................... 88 Table 7: Open-Ended Response Coding Categories and Relative Frequency of Occurrence ........................................................................................................................ 98 Table 8: Analytical Results............................................................................................... 99 Table 9: Hydrogen-Sulfide Water Quality Testing Results ............................................ 102

vii
LIST OF FIGURES
Figure Page
Figure 1: Regional Map Showing Location of Vatukoula .................................................. 4 Figure 2: Sample Locations .............................................................................................. 69 Figure 3: Paper Strip Testing - Color Variation of Black Ferrous Precipitate.................. 73 Figure 4: Sources of Risk Information.............................................................................. 77 Figure 5: Risk Information Source According to Gender................................................. 85 Figure 6: Decision-making According to Gender............................................................. 90 Figure 7: Considered Moving Away?: Response According to Level of Education........ 95

1
CHAPTER 1: VATUKOULA, ROCK OF GOLD
1.1 Introduction
Gold mining has often been associated with positive economic benefits;
however, it may also result in negative impacts on the environment and human health.
It is essential that communities understand the risks and benefits associated with
mining, particularly in developing countries where there is often a lack of legislation
governing the environmental performance of mining corporations. In addition to the
immediate risks associated with a fully operational mine, it is also important to cons ider
the long-term environmental, economic, and social impacts that result from
development strategies which exploit non-renewable natural resources. In the case of
mining, communities around the world have struggled with the process of closure and
remediation after the inevitable cessation of mining activities. Such issues, arising from
the interplay between socio-economic benefits and environmental risks, are particularly
acute in small island states which have isolated and highly limited economic
development trajectories. The lessons learned in such cases are thus instructive for
crisis planning across the developing world.
Examination of the complex social, economic, psychological, political, and
cultural factors influencing risk perception in mining communities is important for
successful risk communication and management. Studies have shown that the
perceptions of local people regarding the risks and benefits of mining may differ
significantly from those of company representatives, policy makers, and the scientific
community (Hadden, 1991). Furthermore, men and women have been shown to

2
perceive risks differently. While women have traditionally had limited access to the
economic benefits of mining, they have consistently been shown to express higher
levels of concern about environmental risks compared to men (Davidson &
Freudenburg, 1996; Gustafson, 1998). However, less research has been done to
identify precisely how and why these gender differences in risk perception occur
(Gustafson, 1998). Studies addressing the complex nature of risk perception in
developed countries such as the United States (Paul Slovic, Layman, & Flynn, 1991),
France, Australia, Germany, and the United Kingdom (Eiser et al., 1990) have made
valuable contributions, resulting in improved risk communication and management
practices. However, fewer such studies have taken place in the developing world
(Bronfman & Cifuentes, 2003). This study attempts to fill these gaps through firsthand
empirical research into the perception of environmental and health risks in the
communities surrounding the Vatukoula gold mine in Fiji. The information obtained
during the study has been made directly available to local stakeholders in the form of a
tool-kit, to aid in risk evaluation and communication.
On the morning of December 5, 2006, Emperor Mines Ltd. (EML) announced
the sudden closure the Vatukoula gold mine, which had operated continuously for 73
years. Following an internal three-month review, the company indicated that the mine
was no longer economically viable (Emperor Mines Limited, 2007). That day, 1,760
mine employees, their families, local businesses, and government officials were
shocked to learn that their source of livelihoods for over seven decades had suddenly
disappeared. After months of uncertainty and economic hardship, the mine was

3
purchased by Westech Gold Pty Ltd. (Westech), an Australian-based company that
began the process of resuming operations at Vatukoula on a smaller scale in August,
2007. The unanticipated closure of the mine left Fiji’s citizens questioning whether the
income from this mineral resource was utilized effectively. Although the event caused
hardship to many, it may also serve as an important opportunity for reflection on the
sustainability of mining as a means of development, and the risks and benefits that
accompany such development activities.
1.2. Location
The Fijian archipelago of 330 islands lies approximately midway between the
equator and the South Pole 1 along the edge of the Pacific Ring of Fire, a volatile zone
of frequent volcanic and seismic activity partially encircling the basin of the Pacific
Ocean. The Ring of Fire is known for its rich array of precious metal deposits. The
ethnically diverse and culturally rich mining town of Vatukoula, which literally means
‘rock of gold,’ is situated in the collapsed caldera of an extinct volcano, near the edge
of the Nakauvadra mountain range on Viti Levu, the largest Fijian island. Matanagata,
which means ‘face of the snake,’ is the traditional name by which Vatukoula is known
(Emberson-Bain, 1994). Vatukoula has a population of approximately 5,700 (Fiji
Islands Bureau of Statistics, 2008) . The nearby town of Tavua, located approximately
eight kilometers north of Vatukoula along the northern coast of Viti Levu, also
1 Fiji is located between longitudes 174° East and 178° West and latitudes 12° S and 22° South (Fiji Islands Bureau of Statistics, 2008).
4
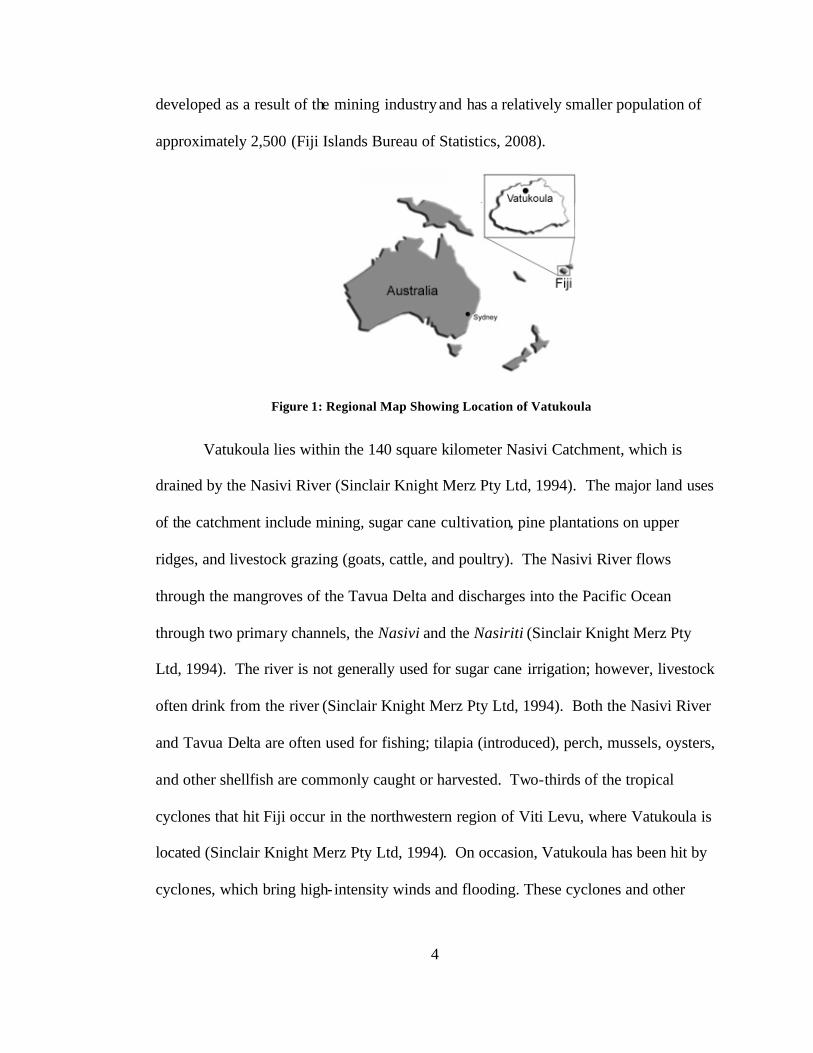
developed as a result of the mining industry and has a relatively smaller population of
approximately 2,500 (Fiji Islands Bureau of Statistics, 2008).
Figure 1: Regional Map Showing Location of Vatukoula
Vatukoula lies within the 140 square kilometer Nasivi Catchment, which is
drained by the Nasivi River (Sinclair Knight Merz Pty Ltd, 1994). The major land uses
of the catchment include mining, sugar cane cultivation, pine plantations on upper
ridges, and livestock grazing (goats, cattle, and poultry). The Nasivi River flows
through the mangroves of the Tavua Delta and discharges into the Pacific Ocean
through two primary channels, the Nasivi and the Nasiriti (Sinclair Knight Merz Pty
Ltd, 1994). The river is not generally used for sugar cane irrigation; however, livestock
often drink from the river (Sinclair Knight Merz Pty Ltd, 1994). Both the Nasivi River
and Tavua Delta are often used for fishing; tilapia (introduced), perch, mussels, oysters,
and other shellfish are commonly caught or harvested. Two-thirds of the tropical
cyclones that hit Fiji occur in the northwestern region of Viti Levu, where Vatukoula is
located (Sinclair Knight Merz Pty Ltd, 1994). On occasion, Vatukoula has been hit by
cyclones, which bring high- intensity winds and flooding. These cyclones and other

5
powerful storms may move large volumes of sediment and produce a rise in water level
of between five and ten meters (Sinclair Knight Merz Pty Ltd, 1994).
1.3. Geology
The Pacific Ring of Fire represents the boundary between the Pacific and
IndoAustralia Plates, a region known for major epithermal gold deposits and copper-
gold porphyry systems, including those in Papua New Guinea, the Solomon Islands,
and New Zealand’s North Island. Gold deposits were formed at Vatukoula between 3
and 7 million years ago during a period of volcanic activity when hydrothermal forces
caused boiling liquid to precipitate gold in thin veins. The rocks of the ancient Tavua
Volcano originated as potassium-rich magma of the shoshonite association, which
evolved from absarokite (olivine-basalt) parent magma to shoshonite, banakite and
monzonite derivatives (Mineral Resources Department: Government of Fiji, 2008a).
Today, the gold at Vatukoula is mostly located within a two square kilometer
fractured block, close to the surface (within 600 m). Gold primarily occurs in three
types of structural settings:
• steeply dipping northwest- striking shears;
• flat-dipping fractures (flatmakes); and
• shatter blocks between shears (Mineral Resources Department:
Government of Fiji, 2008a).
Gold occurs primarily as gold-tellurides and sub-microscopic gold in pyrite.
The specific type of gold deposit at Vatukoula is known as a Low-Sulfidation

6
epithermal gold deposit. There are two main types of epithermal gold deposits, Low-
Sulfidation (LS) and High-Sulfidation (HS), each forming from waters of differing
chemical composition, and in a distinct volcanic environment. LS epithermal gold
deposits are commonly associated with the presence of the following metals: Silver
(Ag), Lead (Pb), Copper (Cu), Zinc (Zn), Arsenic (As), Mercury (Hg), Selenium (Se),
Cadmium (Cd), and sometimes Antimony (Sb) (University of Otago Department of
Geology, 2008).
1.4. Profile of a Deve loping Island Economy
Fiji’s Exclusive Economic Zone covers an area of 1.3 million square kilometers,
of which 18,333 square kilometers is land area (Fiji Islands Bureau of Statistics, 2007).
There are two main islands, Viti Levu, and Vanua Levu, and approximately one-third
of the 330 islands are inhabited. The island nation is a former British colony, which
became independent in 1970. According to the recent 2007 census, Fiji’s popula tion is
827,900, 51% of whom reside in urban areas. Fiji is ethnically diverse; approximately
57% of the population is indigenous Fijian, and approximately 37% of the population is
ethnically Indian. The average life expectancy at birth in Fiji is 68 years, which is
slightly below the World Bank reported average for East Asia and the Pacific. The
average annual household income for a Fijian family is $12, 753 FJD, although
approximately 31.3% of the population are currently living in poverty according to the
most recent survey by the Fiji Islands Bureau of Statistics (Fiji Islands Bureau of
Statistics, 2007).

7
The Fiji Government is party to the United Nations (UN) Millennium
Declaration of 2000, has already achieved six of the eight UN Millennium
Development Goals (MDGs), and is committed to achieving the remaining MDGs by
2015 (Dumaru, 2006). Infant, child, and maternal mortality rates have been very low
since the 1960’s, gender disparity in primary and secondary education is low, and adult
literacy is high (Dumaru, 2006).
Agriculture and tourism are the primary sources of foreign exchange for Fiji.
Sugar exports accounted for over 25% of the total value of Fiji’s domestic exports in
2006, and more than 500,000 tourists visited Fiji in 2005 (Fiji Islands Bureau of
Statistics, 2008). The country has achieved a modest level of economic diversification
and is one of the most developed Pacific Island economies. Garment manufacturing,
fisheries, and mineral water exports are also of considerable economic importance. The
Gross Domestic Product (GDP) of Fiji has, on average, grown at a rate of 2.04%2
between 2000 and 2006.
1.5. Historical Context
1.5.1. Discovery of Gold
The first recorded discovery of gold in Fiji occurred during the British colonial
period and has been accredited to Charles Gurney, who found gold in 1868 in the
gravel deposits of the Navua River, which is also located on the main island, Viti Levu
(Fiji Mineral Resources Department, 1990). A gold rush ensued around the turn of the
2 Calculated at constant 1995 prices, at factor cost (Fiji Islands Bureau of Statistics, 2007).

8
20th century, during which time minute flecks of gold were identified in alluvial
deposits in the Nasivi River in the Vatukoula region. In fact, the first recorded
discovery of gold at Vatukoula was made by Baron A. B. de Este in 1872. However,
the first payable gold deposit at Vatukoula wasn’t found until November 5, 1932, in the
Lololevu Creek, by the determined prospector from Scotland, William Bothwick
(Emberson-Bain, 1994). This discovery ultimately did little to enhance the fortune of
Mr. Bothwick; instead there was a general lack of expertise regarding the technical and
financial aspects of gold mining in Fiji, which led to an influx of foreign investment
and the transfer of control of the majority of mineral wealth to the Australian Emperor
group of companies, led by Edward G. Theodore (Emberson-Bain, 1994). By 1936, the
gold rush had subsided and only three mining companies held their grip on gold at
Vautkoula, including the Emperor Gold Mining Company, Ltd. (Emperor), Loloma
Gold Mines, and Dolphin Mines, Ltd, with Emperor assuming full control in 1956 (Fiji
Mineral Resources Department, 1990). Emperor was the sole operator, except between
1983 and 1992, when the company entered into a joint venture with Western Mining
Corporation (WMC) ("Civil Appeal No. ABU0051 of 2004 " 2006). Emperor once
again assumed full control in 1992 and operated the mine continuously until December
5, 2006. In 2003, Durban Roodepoort Deep (DRD) of South Africa acquired 14% of
Emperor Mines Ltd. (EML); by 2006 DRD had acquired 100% interest in EML (DRD
Gold Limited, 2006). Only one other gold mine was ever developed in Fiji, at the Mt.
Kasi orebody on the second- largest island, Vanua Levu. The Mt. Kasi mine was also
9
operated solely by an Australian company and ceased production in 1946 (Mineral
Resources Department: Government of Fiji, 1990).
1.5.2. Historical Contribution of Vatukoula to the Fiji Economy
The overall contribution of the mining sector has declined from its early high in
the 1930s and 40’s. However, the importance of the mining sector has fluctuated
widely at times, due to variability in gold prices. Since 2000, the total value of mining
and quarrying sector exports as a percentage of total domestic exports has been
approximately 7.7%. However, the mining and quarrying3 sector has only contributed
on average approximately 1.5% to GDP during the past 20 years. In addition to gold
and silver exports, the mining and quarrying sector has also produced coral sand and
limestone for cement manufacturing, and river sand and gravel crude stones for
construction during the past five years.
Approximately 7 million ounces have been mined at Vatukoula since 1936
(Department of Lands and Mineral Resources, 2007). Notably, the mine has
historically been the recipient of exceptionally generous tax subsidies and concessions
by the Fiji government. Indeed, it operated virtually tax-free since the Vatukoula Tax
Agreement (VTA) of 1983 (Grynberg, Fulcher, & Dryden, 1997). At the time of
closure, the mine had an underground delineated gold reserve of 2.34 million tons,
grading 11.4 g/ton, within a total resource of 16.2 million tons, grading 9.1 g/ton. There
3 The overwhelming contributor to the mining and quarrying sector has always been the Vatukoula gold mine, however, prior to WWII, the Mt. Kasi mine (now closed) also contributed to gold production (Mineral Resources Department: Government of Fiji, 2006).

10
are an additional 250,000 ounces of gold in mine tailings from 5.18 million tons,
grading 1.5 g/ton (Department of Lands and Mineral Resources, 2007; River Diamonds
PLC, 2007).
1.5.3. Development of a Company Town
Throughout much of Vatukoula’s history, labor has consisted primarily of
ethnic Fijian males. The mining company was initially able to secure an inexpensive
migrant labor supply partially because of a British colonial protectionist policy that
erroneously portrayed a comfortable rural Fijian subsistence economy, and thus
allowed for the rationalization of low wages and temporary employment (Emberson-
Bain, 1994). This policy was rooted in the assumption that the traditional social
support system of the rural Fijian village economy would take on the burden of caring
for workers during times of sickness, disability, unemployment, and old age
(Emberson-Bain, 1994). Indeed, as the Vatukoula mine expanded the recruitment of
families eventually became common, and many of these costs were transferred to the
wives of mine employees and other women within the village. Women were expected
to play an important unpaid domestic role, including preparation of meals, gardening,
and maintenance of barracks (Emberson-Bain, 1994).
Housing in Vatukoula was initially built in the 1930’s to house single male
miners. Later, when families moved in with the miners, little or no extra space was
provided. Most of the houses have not had any significant repairs or renovations since
they were first built more than seven decades ago. As a result, many houses are now in

11
severe disrepair and the majority of rainwater tanks are not in safe working condition.
Additionally, the land underlying all of the Vatukoula communities is freehold land,
which prior to the sale of the mine, was owned by the mining company. Several years
ago, EML began selling the houses to employees and their families, without selling the
land beneath the houses. Families entered into contracts with EML that required them
to take down their houses and move when they no longer worked for the mine (A.
Wesson, personal communication, August 15, 2007). These terms have now proven to
be unrealistic, with hundreds of former employees currently living in dilapidated
houses on company land.
With housing, land ownership, virtually all employment opportunities, many
social activities, and even health care historically controlled by the company,
Vatukoula can truly be considered a company town. At the time of this study, there
was still some residual evidence of this ever-present climate of control, even after the
closure of the mine. While many residents were forthcoming about past experiences
living in Vatukoula, some remained reluctant to offer opinions for fear of losing future
employment opportunities.
1.6. Broader Applicability of the Fiji Case
Directing revenues from mineral extraction into alternate economic sectors has
proven to be a daunting challenge for many economies, including the small island
nation of Nauru, where phosphate supplies are rapidly nearing exhaustion (Connell,
2006). This research took place shortly after the closure of the Vatukoula mine, at a

12
critical time of transition for the Fiji economy, the mining company, and the residents
of Vatukoula. The closure also facilitated research objectives through improved access
to information and employees.
Fiji is a relatively isolated island economy that is highly dependent on the
contributions of only a few primary industries, including mining, agriculture, and
tourism. It thus provides a very high resolution of variables for causal analysis. As in
Nauru, environmental degradation related to mining, including loss of biodiversity and
industrial pollution, may potentially impede the development of alternate economic
ventures such as tourism or agriculture. Understanding the Fiji case, including the
nature and perception of environmental risk in Vatukoula, will thus offer insights into
the functioning of competing economies in other developing nations where mining has
been an important industry. Such cases are numerous; the list includes, but is not
limited to, island nations such as Jamaica, Nauru, Aruba, New Caledonia, and Papua
New Guinea; South Africa (Binns & Nel, 2003); former Eastern bloc countries such as
the Slovak Republic (Clarke, Denman, Hickman, & Slovak, 2001); and Indonesia
(Sondakh & Jones, 2003). Information gathered on best practices and lessons learned
in relation to risk management and communication may be widely applicable to these
and other developing economies.
The economic opportunities created by growth in the mineral sector frequently
stimulate the development of new urban centers in previously undeveloped areas,
attracting an interregional labor force. Research resulting in improved risk
communication practices will encourage individuals and families to make informed

13
decisions regarding migration to urbanized mining centers from rural or agricultural
areas. The development of the Fijian mining labor supply and the subsequent
urbanization of the area surrounding Vatukoula depict a notable parallel with migration
and urbanization patterns in mining communities across the developing world. A
system of migrant mine labor akin to that in the early Fijian mining industry has
operated in South African gold mines for over a century (Moodie, 1994). Similarly,
mine workers in Brazilian Amazonia view gold mining as a viable alternative to
agriculture, and thus migration to urbanized mining centers is becoming increasingly
common (Godfrey, 1992). When employees and their families decide to migrate, either
temporarily or permanently, to a mining community, it is critical that they have the
information required to make an informed decision regarding the potential risks and
benefits of living and working near a mine.
The Vatukoula case is also of immense value because it involves a medium
scale gold mine that has been financed by a “non-major” foreign company. The South
African company DRD Gold Limited held 100% interest in Emperor Mines Limited
(EML) in Fiji at the time of closure (DRD Gold Limited, 2006). Several of the projects
studied previously have involved “major” mining conglomerates such as Rio Tinto or
BHP_Billiton. However, the growing dominance of medium scale companies,
particularly those arising in China and the Asia-Pacific region have not been studied in
much detail. The corporate social responsibility ethos in such companies deserves
further study as it is likely to be most consequential in coming years.

14
CHAPTER 2: HISTORICAL ENVIRONMENTAL CONCERNS AND
CONFLICTS AT VATUKOULA
2.1. Historical Environmental Concerns
There has been little independent study of the environmental impacts at the
Vatukoula mine to date. However, residents have repeatedly expressed concern over
contamination of surface waters, drinking water, and sulfur dioxide emissions
(Macdonald, 2004). The Nasivi River has historically been severely impacted by
sewage and mine wastes (Mineral Resources Department: Government of Fiji, 2004-
2007). Many of the residents in Vatukoula have been forced to drink untreated water
from the nearby Nasivi River for decades. According to the Vatukoula Primary School
head teacher, the major cause of illness at the school is the consumption of
contaminated water, as there is limited treated water available to students (Anjali,
Jikowale, & Lata, 2007). In 1981, a United Nations Environmental and Social
Commission for Asia and the Pacific (ESCAP) report recommended that until Emperor
could develop a “satisfactory program for monitoring their environmental impact”,
their lease should not be renewed (Macdonald, 2004). In 2003, Emperor claimed that it
could not afford to supply treated drinking water supply without government funding
(Macdonald, 2004). However, according to a representative from the Ministry of
Health, the Ministry had tried on several occasions to put in a public treated water
supply, however, the company (Emperor) would not permit them to do so on their
privately owned land (Timothy Young, personal communication, August 9, 2007).

15
Following a formal request from the Fiji Mine Workers Union (FMWU) and the
Citizens Constitutional Forum (CCF) in May 2003, the Oxfam Australian Community
Aid Abroad Mining Ombudsman conducted an investigation into the mining activities
at the Vatukoula Gold Mine in November 2003 (Macdonald, 2004). The case report,
published in July 2004, recommended that, “an independent audit of the occupational
health and safety practices at the Vatukoula mine site be undertaken (Macdonald,
2004).” In addition, the report recommended that independent environmental and
social impact assessments be undertaken and be released publicly, “in a transparent and
accountable manner (Macdonald, 2004).” Emperor did not respond to the requests for
comment on the 2004 report, or the recommendations the report set forth (Case
Updates, 2005). The Mining Ombudsman returned to the site in 2005 to conduct a
follow-up investigation and Gender Impact Assessment (GIA). Mine workers reported
that newer mine management had taken some steps to improve safety, specifically by
installing a new ventilation shaft. However, workers maintained that underground
conditions were “very poor, with an intensely hot and wet environment, lack of proper
respiratory equipment and consequent health concerns (Oxfam Australia, 2006).”
The head teacher at Vatukoula Primary School, which is located within sight of
the mine’s roaster stack, explained that during mining operations children were affected
by sulfur dioxide emissions. Teachers were often forced to close all the school
windows from 8am until the early afternoon to avoid exposure to emissions, and
several teachers requested transfers to different locations because of their
environmental concerns (Head Teacher, personal communication, July 30, 2007).

16
Limited air quality testing was commissioned by Emperor in December, 2003,
after the investigation by Oxfam (Simtars, 2004). Ore is roasted as part of the gold
extraction process at Vatukoula, and a portion of the gases resulting from this process
are removed through cooling in a gravity-fed water tower (Wrigley, 2004). However,
residual gases, including traces of heavy metals are subsequently released to the
environment (Wrigley, 2004). In December, 2003 Emperor commissioned SIMTARS
of Australia to conduct monitoring of ambient air quality in Vatukoula. Activities
included monitoring of sulfur dioxide (SO2), total suspended particles (TSP), and
suspended metals (Simtars, 2004). TSP and suspended metals were monitored over a
one-month period at single locations, while sulfur dioxide was monitored over a five-
week period at three separate locations (Simtars, 2004). Fiji does not currently have
federal air quality standards. Thus, various international air quality guidelines,
including the United States Environmental Protection Agency (USEPA) guidelines for
sulfur dioxide and World Health Organization (WHO) guidelines for trace metal
concentrations, were used to draw conclusions regarding the implications of the
analytical results (Wrigley, 2004). The final report produced by Australasian Pacific
Environmental Consultants concluded that further sampling of lead and arsenic
concentrations over an annual time period is required to determine if a potential
lifetime risk exposure exists. Further sampling of sulfur dioxide concentrations over an
extended annual period was also recommended. Concentrations of cadmium,
chromium, copper, nickel and zinc in ambient air were all reported as below the

17
analytical Limit of Reporting (LOR) and appeared to have no community health
implications (Wrigley, 2004).
Furthermore, six tailings dams are located in the Vatukoula region. These dams
are designed to store industrial wastes, or tailings, which result from mineral
processing. Some residents live only meters away from the dam walls. According to
Emperor’s 2006 Annual Report, there was a major environmental incident involving a
pipeline failure along a section of the Toko tailings pipeline. This incident resulted in
the coverage of a 30 meter by 30 meter residential compound with industrial waste
(Emperor Mines Ltd., 2006).
2.2. Historical Conflicts
2.2.1. Labor Conflicts
On February 27, 1991, 436 mine workers, who were members of the Fiji Mine
Workers Union (FMWU), went on strike in protest of alleged low wages, unsafe
working conditions, health concerns, poor housing, and poor environmental standards
(Macdonald, 2004). However, the officially recorded reason for the strike, and the only
reason that EML recognized, was the “refusal of Emperor to recognize the FMWU for
the purpose of collective bargaining under the Trade Union (Recognition) Act (Cap
96A) ("Civil Appeal No. ABU0051 of 2004 " 2006).” In 1991 there were changes in
Fiji’s industrial legislation which required that employers only recognize those unions
which represented over 50% of the total workforce, and following this legislation EML
claimed tha t it was the responsibility of the FMWU to prove that they represented over

18
half of the labor force (Macdonald, 2004). This was despite the fact that EML and the
government had worked with the FMWU for decades prior to the 1991 strike. Indeed,
the International Labour Organization’s Expert Committee on the Application of
Conventions and Recommendations criticized EML in 1996 for “…refusing to
recognize independent trade unions, resorting to legal procedures to delay recognition
of trade unions…(Macdonald, 2004)” During the 2003 Mining Ombudsman
investigation, representatives of the FMWU also claimed that EML used court cases as
a delay tactic to avoid confronting the real issues behind the strike (Macdonald, 2004).
On March 4, 1991 the Fiji police enforced an eviction notice on strikers, which
resulted in violence, and the death of a court sheriff (Macdonald, 2004). Because of
their failure to return to work, EML dismissed the strikers between April and July, 1991
("Civil Appeal No. ABU0051 of 2004 " 2006). On February 20, 1995, a Commission
of Inquiry commenced, with Ganeshwar Prasad (GP) Lala appointed Commissioner.
The Commission of Inquiry submitted its Report and recommendations in July, 1995,
however the findings were never debated in Parliament because EML applied for and
was granted leave for judicial review on March 28, 1996 ("Civil Appeal No. ABU0051
of 2004 " 2006). The GP Lala Report made many recommendations, including
increasing environmental control/enforcement by the government, improvements in
underground working conditions by EML, inspection of tailings dams and monitoring
of sulfur dioxide emissions by EML, and the establishment of a treated drinking water
supply. It also recommended that EML make a “humanitarian lump sum payment”
consisting of four years’ salary and the cost of living for striking workers, and the

19
establishment of a social justice fund, to consist of annual contributions from EML, the
government, mine workers, and all Fiji employers, to improve housing conditions in
Vatukoula. Following a lengthy legal battle, the dispute was ultimately resolved in the
courts in favor of EML, however, this decision was based solely on a technicality. In
2004, the GP Lala Commission of Inquiry Report was declared null and void because it
continued to receive submissions and evidence after the allotted time period in its
original terms of reference ("Civil Appeal No. ABU0051 of 2004 " 2006). However, a
2006 High Court of Appeal judgment in response to an appeal of the decision to make
the GP Lala report null and void stated that “the recommendations of the Commission
had no binding effect and had the Government wished to implement any of them, it
would have been free to do so irrespective of the High Court Decision ("Civil Appeal
No. ABU0051 of 2004 " 2006).” In the eyes of the strikers, the dispute remains
unresolved after more than 16 years, and workers continue to sit in protest outside the
mine on a daily basis, even now that the mine has closed.
2.2.2. Land Conflicts
There are several on-going disputes over land ownership in the Vatukoula area.
Indigenous Fijian culture is characterized by a strong social and cultural attachment to
the land. Indigenous landowners believe that their ownership extends to the sky above
and the minerals below the ir land. In Fiji, 84% of the total land area is owned by
indigenous landowners (Mineral Resources Department: Government of Fiji, 2008b).
This land, called Native Land, is owned by traditional landowning units called
mataqali, rather than by individuals, and cannot be sold (McLeod, 2000).

20
Landownership rights are collective and temporary, being passed on through
generations (McLeod, 2000). The remaining land area is either freehold land or state
land.
According to Fiji law, unextracted minerals belong to the state, but royalty
payments for the right to extract minerals, and compensation payments for landowner
loss of tenure and/or damage to land must be paid to the government and subsequently
distributed to landowners (Mineral Resources Department: Government of Fiji, 2008b).
The Native Land Trust Board (NLTB) is the governing body in charge of leasing
Native Land and distributing benefits arising from commercial activities on Native
Land (McLeod, 2000). In 1999, a comprehensive compensation policy was developed
by a interdisciplinary team, led the Mineral Resources Department, titled,
“Compensation Policy for Fiji’s Mineral Sector,” however this policy has not yet been
fully implemented (McLeod, 2000; Mineral Resources Department: Government of
Fiji, 2008b). Historically disputes have arisen related to the unfair distribution of
compensation. For example, payments may be made directly to the mataqali leader,
when customary law actually demands that such payments be made to the provincial
chief. Equity issues also arise related to distribution of compensation between
individuals within the matagali unit. Additional problems have arisen when the NLTB
has withheld payments and instead distributed only interest to landowners (McLeod,
2000).
Landowners from the Nasomo region claim that over 1,000 acres of their land
was unlawfully given to EML during their joint venture with WMC in 1983, when 70%

21
of the land under dispute was granted to EML under Special Mining Lease (SML) 55
(Macdonald, 2004). In 2002, the Nasomo people were granted $1 Million FJD by the
courts, as compensation for this land. However, the Nasomo people sought
significantly more, including that SML 55 be declared “null and void” and that the
companies reimburse landowners for all of the revenues they had derived from
resources on the disputed land. At the time of the mine closure, EML was undertaking
exploration activities on the disputed land. Nasomo landowners remain very concerned
that their current water source will be contaminated by mining activities (Nasomo
landowner, name withheld, personal communication, July 21, 2007).
At least two other traditional landowning groups, the Natolevu Landowning
Unit, and the Nakoroboya Landowners also have unresolved land claims in the
Vatukoula region. The Nakoroboya group claims they hold documents dating back to
1895, including a map detailing their land ownership claims to the area where the mine
is located (Macdonald, 2004). This group told the Mining Ombudsman in 2003 that
these unresolved claims were causing tensions in the community (Macdonald, 2004).
When asked by the Mining Ombudsman about the land claims of these three groups in
2003, EML stated that they owned the land outright and were not aware of any claims
(Macdonald, 2004).

22
CHAPTER 3: ENVIRONMENTAL IMPLICATIONS OF GOLD MINING
3.1. Overview of Mine Processes at Vatukoula
Vatukoula is a multi-shaft underground mine, with average gold grading of 7-
11g/ton. The gold recovery process begins with the crushing and grinding of ore and
the removal of the resulting primary slime through screening and rake classification.
Next, the bulk gold-telluride/pyrite concentrate and primary slime are sent through
separate flotation circuits and then re-combined after achieving a specified level of
concentration (Sinclair Knight Merz Pty Ltd, 1994). The combined flotation
concentrates then undergo roasting and a process known as cyanidation. Because gold
occurs in extremely small concentrations, cyandiation is the only economical way to
extract gold particles from the ore. This process involves the application of a cyanide
solution to dissolve the gold into an aqueous medium through several leaching circuits,
followed by the adsorption of the resulting gold-cyanide complex onto activated
carbon. Silver is also recovered at a later stage using sodium chloride (Sinclair Knight
Merz Pty Ltd, 1994). Residual cyanide is destroyed through the gassing of pulp from
the carbon adsorption circuit with SO2. Tailings are subsequently pumped off for
disposal into a tailings dam.
3.2. Cyanidation
Worldwide, 90 % of gold is recovered using cyanidation (Akcil, 2006). As is
the case with any industrial chemical, cyanide can pose unacceptable risks if it is not
managed properly. Cyanide is known to react with a wide variety of elements in

23
solution, resulting in the formation of many cyanide-related complexes. Because they
process such large quantities of ore, gold mining facilities also produce large quantities
of effluent from the cyanidation process, which can contain free cyanide and a variety
of metal-cyanide complexes including zinc, nickel, cadmium, copper, arsenic, and iron,
depending on the composition of the water that is used in the solution. Effluent is also
likely to contain the oxidized products of these compounds, including ammonia,
cyanate and thiocyanate (Muezzinoglu, 2003).
3.3. Chemical Transportation and Storage
The chemicals used in the mine processes at Vatukoula are imported,
transported to the mine, and subsequently stored on-site. The chemicals present at
Vatukoula at the time of this study included sodium cyanide (NaCn; solid tablets and
liquid solution), sulfuric acid, lead nitrate, zinc powder, nitric acid (HNO3), various
flotation reagents, and approximately 100 tons of elemental sulfur (Metallurgy mill
worker, name withheld, personal communication, July 27, 2007). Chemical storage
units are contained within concrete secondary containment, however, the concrete is
reportedly old, with potential for seepage (Metallurgy mill worker, name withheld,
personal communication, July 27, 2007).
3.4. Disposal of Mine Wastes
Effluent is eventually stored in large tailing dams, where some of the cyanide
solution is recycled. The dams are left open to the atmosphere to allow the evaporation

24
of hydrogen cyanide (HCN) gas into the air, which is accelerated by direct solar
radiation (photolytic dissociation of cyanide) (Muezzinoglu, 2003). Many ores contain
pyrites and sulfur-containing inorganic compounds that can make controlling pH
extremely difficult. Variations in pH in tailings dams or effluent streams may increase
the solubility of metal cyanide complexes and thus create the potential for heavy metal
contamination of the ground water, surface water, and soil (Muezzinoglu, 2003).
Releases and failures of tailings dams have been documented across the globe.
The majority of major mining-related environmental incidents worldwide have been the
result of dam overtopping, breaching, geotechnical failure, or earthquake (Akcil, 2006).
In 2000, the Aural gold mine in Romania experienced a dam failure that caused
leaching of mine wastes into the Danube river system (Stenson, 2006). In 1988, the
Kumtor mine in Kyrgyzstan recorded a spill of 100 tons of cyanide (Stenson, 2006).
Unfortunately, it was only after the Kumtor spill that many of the issues associated with
cyanide management were addressed. While many developed countries maintain strict
regulations on the storage and disposal of wastes from gold mines, mining corporations
in the developing world often operate under much less scrutiny. It is thus extremely
important for residents in mining areas to be informed about the potential
environmental and health risks posed by the storage, transportation, and handling of
mining wastes.
There are six tailings dams located in the Vatukoula region, none of which were
active at the time of this study. Tailings dams No.1-5 are located relatively close to the
Vatukoula settlements, while the 6th dam, Toko Dam, is located approximately 5

25
kilometers northwest of the mine and is currently filled to capacity. Dams No. 1-4 are
significantly older and are all variously re-vegetated. Dam No. 1 has been substantially
removed, while the walls of Dams No. 2-4 were all re-vegetated and stabilized with
cane grass (Miscanthus sp.). A 1992 environmental audit by Sinclair, Knight, & Mertz
indicated that levels of certain heavy metals in food crops grown on the older tailings
dams were safe for human consumption; however, the same report warned that the
harvesting of crops grown on dam walls could encourage large scale erosion of walls
over time (Sinclair Knight Merz Pty Ltd, 1994). A trial wetland was constructed at
Toko Dam in the early 1990’s. This trial wetland was designed to treat 20% of the dam
outflow, while 80% was directly discharged to the local waterway. During full
operation, the mine was discharging on average 80-90 tons of waste per hour into local
waterways, approximately 32% of which would settle (Metallurgy mill worker, name
withheld, personal communication, July 27, 2007). The wetland reportedly functioned
well for two years, and then gradually deteriorated. EML was in the middle of
negotiations with the Nadelei landowners to purchase land for a new tailings dam at the
time of the mine closure (Metallurgy mill worker, name withheld, personal
communication, July 27, 2007).
3.5. Environmental and Health Effects of Cyanide
Cyanide is produced naturally in over 1,000 plant species and the human body
(International Cyanide Management Institute, 2006). Cyanogenic plants such as
cassava, young bamboo shoots, coffee beans, lima beans, soy, and chickpeas naturally

26
contain low concentrations of cyanide, which occurs as part of sugars or other
compounds. Certain bacteria, fungi, and algae also produce cyanide (Agency for Toxic
Substances and Disease Registry, 2006). Cyanide is acutely toxic to humans and
wildlife; fish and invertebrates are particularly susceptible to cyanide poisoning
(International Cyanide Management Institute, 2006). Cyanide does not bioaccumulate,
so chronic exposure to very low concentrations will not eventually result in acute
toxicity. However, incidences of chronic cyanide poisoning have been documented in
people who consistently eat a diet containing large quantities of cyanogenic plants such
as cassava (International Cyanide Management Institute, 2006). In Fiji and other
tropical climates across the globe, cassava is a staple source of carbohydrates.
However, the inner portion of the tuber contains the lowest concentrations of cyanide
and traditional preparation methods can reduce cyanide concentrations even further
(Agency for Toxic Substances and Disease Registry, 2006; Keeler & Tu, 1983).
Hydrogen cyanide gas (HCN) is colorless and has a faint, bitter, almond-like
odor. Sodium cyanide and potassium cyanide are white solids which also have a bitter
almond-like odor in damp air (Agency for Toxic Substances and Disease Registry,
2006).
Humans may be exposed to cyanide by breathing in HCN gas, breathing
tobacco smoke or smoke from burning buildings or plastics, through contaminated
drinking water, eating foods containing cyanides, or by touching soil contaminated with
cyanide. In surface waters, the majority of cyanide will evaporate as HCN gas under
most natural conditions. Exposure to large concentrations of cyanide over a short

27
period of time may result in acute cyanide poisoning. The first indications that a person
may be experiencing cyanide poisoning include shortness of breath, deep and rapid
breathing, seizures, or loss of consciousness (Agency for Toxic Substances and Disease
Registry, 2006). Similar health effects of acute toxicity are exhibited by both adults
and children.
3.6. Environmental and Health Effects of Arsenic
Arsenic is naturally found in all soils in varying quantities. The geological
origins of a soil and its past uses determine the amount of arsenic present, and areas
with volcanic activity are known to contain particularly high levels of arsenic
(Aalbersberg, 2007; Agency for Toxic Substances and Disease Registry, 2007). Use of
arsenic containing pesticides, coal- fired power plants, and incinerators are also
environmental sources of arsenic, which may enter the water, soil, or air. Many
common arsenic compounds can dissolve in water, so they may enter lakes, rivers, and
streams. Unlike mercury and lead, which are most toxic in their organic forms,
inorganic arsenic is the most toxic form of arsenic to humans (Agency for Toxic
Substances and Disease Registry, 2007). A person may be exposed to arsenic through
drinking water or air, but food consumption is the largest source of arsenic. Children
may also be exposed to arsenic if they consume soil during play (Agency for Toxic
Substances and Disease Registry, 2007).
Inorganic arsenic is toxic to humans and may cause death in large doses (above
60,000 ppb in water). Inorganic arsenic is recognized as a human carcinogen (cancer-
causing chemical) by the following agencies: the Department of Health and Human

28
Services (DHHS), the International Agency for Research on Cancer (IARC) and the
Environmental Protection Agency (Agency for Toxic Substances and Disease Registry,
2007). Symptoms of acute exposure to inorganic arsenic include nausea, vomiting,
fatigue, impaired nerve function. Long-term exposure to lower doses causes patches of
darkened skin and the appearance of small "corns" or "warts" on the palms, soles, and
torso, associated with changes in the blood vessels (Agency for Toxic Substances and
Disease Registry, 2007). Breathing in low does of inorganic arsenic may cause a sore
throat and lung irritation. Skin, liver, bladder, and lung cancer are also associated with
exposure to inorganic arsenic (Agency for Toxic Substances and Disease Registry,
2007). Organic arsenic is much less toxic, and is usually excreted in urine within
several days of exposure.

29
CHAPTER 4: REGULATORY CONTEXT
4.1. Organization
Since the most recent military coup, which occurred in December, 2006, the Fiji
government has undergone significant reorganization of its ministries and departments.
Currently, the Ministry of Lands, Mineral Resources, & Environment is the principal
government agency responsible for development and implementation of mineral
resources policy in Fiji. The Mineral Resources Department (MRD), under the
supervision of the Ministry of Lands, Mineral Resources, & Environment provides
technical and geoscientific information to assist investors in the mining sector, develops
mineral policies, promotes the mineral industry in Fiji internationally, and facilitates
exploration and development of mineral, petroleum, and other non- living resources
(Mineral Resources Department: Government of Fiji, 2008b). Additionally, the MRD
is responsible for environmental monitoring and inspection of operational mines. The
MRD has a functional analytical laboratory, and drilling and engineering geology units.
The Public Service Commission appoints the Director of Mines, who is responsible for
management and oversight of the MRD (Mineral Resources Department: Government
of Fiji, 2008b). The Department of Environment, also under the supervision of the
Ministry of Lands, Mineral Resources, & Environment is responsible for the
enforcement of the recent 2005 Environmental Management Act and thus may also be
involved with mining operations. At the time of this study, the ministry responsible for
the Department of Environment was the Ministry of Labour, Industrial Relations,
Tourism & Environment. The Ministry of Health, Women, & Social Welfare may also

30
be directly involved with mining operations because it is responsible for environmental
and public health inspections under certain circumstances, such as after an
environmental incident (e.g. cyanide spill or fish kill) (Timothy Young, personal
communication, August 9, 2007). Vatukoula was excluded from the Health and Safety
a Work Act of 1996, and occupational health and safety at the mine remains under the
jurisdiction of the Mining Act. As a result, the Occupational Health & Safety (OHS)
department is not involved at Vatukoula; instead the MRD is responsible for
occupational safety & health under the Mining Act (Timothy Young, personal
communication, August 9, 2007).
4.2. Existing Legislation
The Mining Act of 1978 is the primary piece of legislation governing mining
activities in Fiji. The Act prohibits the pollution of waterways, and also requires the
filling of any hole, shaft, or pit other excavation created during mining activities (Fiji
Parliament, 1978). However, the fines imposed for violations of the Act are extremely
small, especially when levied against a large foreign corporation, such as EML. For
example, the Act calls for a fine not to exceed $100 FJD for anyone who “causes or
permits the deposit or discharge of any rubbish, dirt, filth or debris or any waste water
from any sink, sewer or drain or other dirty water or any chemical or other substance
deleterious to animal or vegetable life, or any other noxious mater or thing, into any
watercourse (Fiji Parliament, 1978).” The Act allows the Director to issue permits for
discharge of wastes and mine tailings as he deems fit and also gives the Director the

31
power to require the discharging party to supply an alternative water supply to residents
if he deems that their water supply has been compromised. The maximum fine
imposed for any violation of the Act is $200 FJD (Fiji Parliament, 1978). Under the
Mining Act, the MRD is responsible for inspections and environmental monitoring at
Vatukoula, however, according to the Director of Environment, Epeli Nasome, these
monitoring requirements are weak, and Emperor, on occasion, blocked MRD inspectors
from completing inspections (Epeli Nasome, personal communication, August 9,
2007).
In 2005 a new Environment Management Act was passed, which requires
Environmental Impact Assessments (EIAs) for all new development projects,
environment bonds for mitigation purposes, and imposes strict fines (up to $1 Million
FJD) for violations (Parliament of the Fiji Islands, 2005) . However, at the time of this
study, the specific regulations that must accompany the Act were still being finalized,
making it impossible to enforce the Act (Timothy Young, personal communication,
August 9, 2007; Epeli Nasome, personal communication, August 9, 2007). The new
regulations will provide the mandate for the Department of Environment to undertake
the EIA process through direct legislative requirements once they receive final
approval.
“Currently, the Department of Environment undertakes the whole process of
approving EIA Reports through the powers of the Director of Town and Country
Planning or through the own initiative of developers who recognize the environmental

32
impacts on their developments and the need for the process to be done (Fiji
Government, 2007).”
Prior to the enactment of the Environment Management Act, the Ministry of
Health also had the power to enforce environmental and health standards under the
Public Health Act. The Public Health Act requires EML to supply residents with a
water supply on their land, however, the Act does not require that the supply be treated
or fit for human consumption (Timothy Young, personal communication, August 9,
2007).

33
CHAPTER 5: UNDERSTANDING ENVIRONMENTAL RISKS
It is important that individuals accurately understand the risks and benefits
associated with mining, so that they may make informed decisions about living and
working in a mining community. However, community perceptions of risk can differ
significantly from those of company representatives, policy makers, and the scientific
community (Hadden, 1991). Indeed, public concerns have sometimes been ignored or
downplayed by those responsible for the implementation of environmental policies and
practices (Williams, Brown, Greenberg, & Kahn, 1999). Thus, examination of the
unique and complex social, economic, political, psychological and cultural factors
influencing public risk perception is essential for successful risk management. Studies
addressing the complex nature of risk perception in developed countries such as the
United States (Paul Slovic et al., 1991), France, Australia, Germany, and the United
Kingdom (Eiser et al., 1990) have made valuable contributions to the understanding of
effective risk management, often resulting in improved risk communication practices.
However, fewer such studies have taken place in the developing world (Bronfman &
Cifuentes, 2003).
5.1. Risk Perception
The constructivist view of risk perception holds that risks are not purely a
product of the existing environmental reality, but rather, they are formed on both an
individual and societal level in a complex setting of contextual factors (Jasanoff, 1999;
Kasperson & Kasperson, 1996), not necessarily including science (Davis, 2005;

34
Hadden, 1991). Slovic, Fischhoff, and Lichenstein conducted some of the earliest
studies quantifying risk perception beginning in the late 1970s (P. Slovic, Fischhoff, &
Lichtenstein, 1980). They developed a methodology which they later termed the
psychometric paradigm, using a survey instrument to quantify a wide variety of social,
cultural, and psychological factors which they found to influence what an individual
subjectively understands as risk. The psychological paradigm has since been widely
replicated, albeit to a lesser extent in the developing world (Bronfman & Cifuentes,
2003), and has contributed to our improved knowledge of how people understand risks
and how they use this understanding in the decision-making process. However, more
recent contributors to risk literature have argued that although the paradigm has been
replicated with much success, it may not be totally sufficient to understand the complex
nature of the risk perceiver (Marris, Langford, & O'Riordan, 1998; Sjoberg, 1999).
Sjoberg demonstrated that variables such as the seriousness of consequences and the
perceivers interest in the risk were also important predictors of the resulting level of
demand for mitigation of a particular risk (Sjoberg, 1999). The present study, while
borrowing from the model of the psychometric paradigm to examine the social and
cultural context of risk perception at Vatukoula, also endeavors to take a more
exploratory approach using complimentary qualitative methods, given the lack of prior
research on risk in Fiji.
Sokolowska and Tyszka (1995) found that public acceptance of risk may be
influenced by the perceived economic benefits associated with the activity (Sokolowska
& Tyszka, 1995). Issues arising from the interplay between socio-economic benefits

35
and environmental risks are particularly acute in small island states which have isolated
and highly limited economic development trajectories. Williams, Brown, Greenberg,
and Kahn (1999) expanded upon the earlier research of Sokolowska and Tyszka
regarding perceived economic bene fits and risk perception, by examining the
relationship between “actual economic dependence,” on a hazardous waste facility in
the United States, and perception of environmental risks. The present study extends
this line of research, by examining the relationship between economic dependence and
perception of risk in the differing context of a mining facility in a developing country.
The role of women in risk-analysis and decision making processes has been
another important area of inquiry in many risk perception studies. Women have
traditionally had limited access to the employment and business opportunities related to
mining, while assuming much of the social and environmental burden. These issues are
further complicated by the alienation of families from land that has been widely
associated with mining development, especially in Pacific Island cultures where access
to land is linked to the status of women. At the Lihir mine in Papua New Guinea,
women who previously played a vital and self-directed role in household activities
began to feel dependent on their husbands for housekeeping money when mining
development occurred. “Depriving women of land and failing to provide them with
viable alternative ways of affirming their importance in society, unlike men who can
earn good money working in the mining development, effectively deprives them of the
opportunity to feel that they are contributing to society and are valued, productive
members of their family and clan (Scheyvens & Lagisa, 1998).” Women have also

36
been documented as being the first residents to become dissatisfied with the mining
process, often leading to domestic conflicts and even civil unrest (Scheyvens & Lagisa,
1998).
Finally, women have been shown to express consistently higher levels of
concern about environmental risks than their male counterparts (Davidson &
Freudenburg, 1996). While this finding has been replicated widely throughout the
existing literature, there has been less research into the reasons why this is the case.
Interestingly, one study found that women were less likely to view environmental risk
as counterbalanced by economic benefits, but rather as exacerbating economic costs
including “negative impacts on business development, tourism, and the acceptability of
agricultural products (MacGregor et al., 1994).” Another study found that women were
also more likely to take voluntary action to mitigate environmental risks (O'Connor,
Bord, & Fisher, 1999). Furthermore, this disparity in perception of risk has primarily
been found between Caucasian men and women in the United States. Further
investigation into the role of gender in risk perception across other cultural contexts is
thus warranted (Davidson & Freudenburg, 1996). Davidson and Freudenberg (1996)
have also suggested that while numerous studies have focused on nuclear energy and
nuclear waste, additional research into technologies that have thus far been categorized
broadly as “other” may benefit our understand of risk perception and gender.

37
5.2. Risk Communication
Risk communication is a dynamic process of interaction between individuals,
communities, groups, and institutions. The process involves not only information about
risks, but also the concerns, opinions and reactions that people have to risk information
(Committee on Risk Perception and Communication & National Research Council,
1989). Whether or not risks are communicated effectively depends upon several
factors, including, but not limited to the accuracy of risk assessment and information
delivery, the level of trust placed in those who communicate risk messages, existing
perceptions and knowledge of risks, inter- and intra-community interactions, and the
effects of unintended and unofficial risk messages (Fessenden-Radon, Fitchen, &
Heath, 1987; Lofstedt, 2003; Lundgren & McMakin, 2004). Although the nature of
risk communication is complex, there are strategies that may be employed to more
effectively communicate risks. However, the multifaceted nature of risk
communication requires that the strategies used in any particular case must be adapted
so that they are appropriate for the unique community and industry stakeholders
involved.
5.2.1. Risk Communication Challenges
Messages about risk, by their very nature, simplify and condense technical
information, creating the potential for confusion and/or distrust. Risk messages also
invariably contain some level of uncertainty, further complicating their delivery

38
(Fessenden-Radon et al., 1987). It is therefore important to set realistic goals for any
risk communication plan, recognizing that improved risk communication will not
necessary lead to the resolution of existing controversial issues (Committee on Risk
Perception and Communication & National Research Council, 1989). This is because
people have differing interests and values; when people have more accurate
information about risks, they will not necessarily reach the same conclusion about a
particular risk.
Many of the challenges that arise in the risk communication process can be
broadly categorized into two general types, including problems arising between risk
communicators, recipients, and intermediaries; and problems arising from the political
or institutional systems related to risk management (Committee on Risk Perception and
Communication & National Research Council, 1989; Fessenden-Radon et al., 1987;
Lofstedt, 2003). The former type can usually be addressed more directly than the latter,
making problems between message recipients, intermediaries, and deliverers a
particularly appropriate area of focus for improvement. However, understanding the
unique political and institutional challenges in a particular case can also aid in the risk
communication process.
One important challenge that confronts risk managers is that existing political
and institutional systems, including legal and statutory considerations can limit the
options available for dealing with a particular risk (Committee on Risk Perception and
Communication & National Research Council, 1989). For example, in the United
States, the Federal Clean Water Act requires that the best available technology be

39
employed in dealing with certain risks, regardless of the financial costs of that
technology. A lack of consideration of these influences may lead to difficulty on the
part of some recipients in understanding risk messages. Indeed, industries are expected
to comply with all statutes and regulations at a minimum, to meet the expectations of
regulators and the community (Sadar & Shull, 2000). Another political challenge often
arises because individuals, communities, and citizen groups do not have access to the
same resources to obtain information and conduct research about risks as government
and industry. As a result, the public may not accept messages about risk if they do not
feel that the information and research used in creating the messages addresses their
concerns (Committee on Risk Perception and Communication & National Research
Council, 1989). Finally, when multiple authorities are involved in the risk
communication process, for example industry representatives and local and regional
government authorities, there is a potential for conflicting and fragmented
communication. Often such conflicting information casts doubt on the validity of risk
messages, especially if the multiple information sources are all viewed as experts
(Fessenden-Radon et al., 1987).
Many additional challenges arise related to the complex interaction between the
messenger, message, and receiver in the risk communication process. The role of the
risk information receiver is indeed extremely important, however, this role has often
been ignored (Fessenden-Radon et al., 1987). Perhaps most importantly, recipients of
risk messages must trust the authorities which communicate risks to them (Jardine,
2003; Kasperson, 1986; Lofstedt, 2003; Siegrist, 2000). Research has revealed a direct

40
relationship between high public trust in authorities and low perceived risk, and low
public trust in authorities and high perceived risk (Lofstedt, 2003). Although
individuals ultimately decide how to interpret risk information, research has also
indicated that collective interpretations of risk can develop in communities, and these
may also affect how risk messages are received. For example, people may use
vicarious experience (those experiences which are only know to a person indirectly) to
interpret the level of risk and messages about risk (Fessenden-Radon et al., 1987).
Community leaders can further exacerbate collective interpretation of risk. If they hear
about a risk situation in another community, they may interpret this to mean that the
same risk exists in their own community (Fessenden-Radon et al., 1987).
To further complicate matters, official, intentional messages about risk are not
the only messages that recipients receive. Some risk messages are sent unintentionally,
and may take verbal, written, or non-verbal form (Committee on Risk Perception and
Communication & National Research Council, 1989; Fessenden-Radon et al., 1987).
Additionally, a lack of basic knowledge, or the concepts needed to interpret messages
on the part of the recipient may cause confusion or doubt about risks (Fessenden-Radon
et al., 1987).
Finally, the aggregate nature of risk messages provides another obstacle to
communication about risks. Information about risks is often provided in terms of the
risk to a typical population; however, if people cannot answer the question ‘how will
this affect me?’ and relate risk information to their personal experience, then messages
about risk may simply be ignored (Fessenden-Radon et al., 1987).

41
5.2.2. Best Practices in Risk Communication
Contributions to risk communication have come from many different
disciplines; this discussion of best practices will draw on a wide variety of approaches
to risk communication, which can all offer insight depending on the unique audience
and situation at hand. The best practices are compiled into two categories: 1)
recommendations relating to the process of risk communication 2) recommendations
related to the content and presentation of risk messages. In general, risk managers
have traditionally focused on improving the accuracy of message content, however, it
has been demonstrated that both risk communication procedures and message content
must be improved (Leiss, 1996).
Best Practices: The Risk Communication Process
• It is important to begin by setting realistic expectations for the risk
communication process. Improved risk communication will not necessarily
resolve existing tensions between stakeholders. Practical goals should be
established so that all stakeholders have realistic expectations and progress
towards goals can be assessed.
• Identify any limitations, which may include regulatory or audience requirements,
for example, limits to the audience’s ability to read or process information.
• Pre-test risk messages and conduct additional testing between communication
rounds so that improvements in messages can be continually made. Tests with

42
small sections of the intended audience can potentially be used to identify
whether a risk message is addressing the intended concerns and is appropriately
presented.
• Assess audience perceptions and concerns prior to and throughout the
communication process. Some concerns may appear to be based on inaccurate
scientific reasoning, or to be irrelevant; however, these concerns must be listened
to and addressed if risk communication efforts are to be successful.
Best Practices: Message Content and Presentation
• Knowing the audience to whom risks will be communicated is perhaps the most
important principle of effective communication. A thorough knowledge of a
particular audience may include unique cultural considerations, audience
preferences for timing of messages, background knowledge and the existing level
of confidence and trust in risk management authorities. Messages should then be
conveyed in relationship to the audience’s perspectives.
• The language and presentation of risk messages should be simplified, but the
content should not.
• Messages about risk should not minimize the level of uncertainty. In some
situations uncertainty should be fully discussed, including the methods that were
used to gather data, how data was analyzed and how the results were interpreted.
For example, if the audience has been involved throughout the process of risk
assessment, a discussion of uncertainty may not be required because the audience

43
may already understand the sources and level of uncertainty. In crisis situations,
risks may be obvious and can also be left out unless requested.
• Comparisons about risks should be presented with caution. Ana logies can be
useful, but care should be taken so that they do not trivialize the level of risk.
Ranges can be used to express the level of risk (this is particularly useful for
hostile audiences, allowing people to determine their own personal risk level).
Finally, comparisons should be used to relate risks to certain segments of the
population (risks to seniors versus young children).

44
CHAPTER 6: MINING AND SUSTAINABLE DEVELOPMENT
The concept of sustainable development was first popularized following the
1987 United Nations (UN) Brundtland Commission report, Our Common Future,
which adopted it as an official UN goal. They loosely defined the term as development
that “meets the needs of the present without sacrificing the ability of the future to meet
their own needs (World Commission on Environment and Development (WCED),
1987).” Since 1987, many attempts have been made to more clearly define sustainable
development, resulting in a growing debate over how to operationalize the concept.
In general, economists have approached sustainable development by
recognizing that sustainability is closely linked to the economic concept of income.
Particular attention has been paid to this approach because it offers practical insight
into how measure progress towards the goal. The approach is based on the economic
definition of income, outlined by Hicks in 1946 as the maximum amount an individual
can consume during a period and remain as well off at the end of the period as at the
beginning (Hicks, 1946). In other words, Hicksian income is the amount that can be
consumed (spent) without depleting the associated existing capital base (from which
the income is generated). It follows that maintenance of capital is the key to
sustainability. The concepts of income and capital have thus become the basis from
which a more detailed definition of sustainability has arisen. According to this
definition, sustainable development is development that ensures non-declining per
capita national wealth by replacing or conserving the sources of that wealth; that is,
stocks of produced, human, social and natural capital (United Nations, European

45
Commission, International Monetary Fund, Organization for Economic Co-operation
and Development, & World Bank, 2003)
In 1931, Harold Hotelling recognized that the management of non-renewable
natural resources posed a special problem; unlike renewable natural resources, which
can be managed so that they produce a sustainable income, non-renewables, such as
mineral stocks, inevitably decline as they are extracted (Hotelling, 1931). It follows
that their ability to produce the same level of income also declines with extraction.
From a purely accounting standpoint, this means that the net receipts from the
extraction of non-renewable resources must actually be separated into two components:
user cost and true income (El Serafy & Lutz, 1989). User cost being the capital
component earned at the expense of degrading the value of the resource. True income
is the component earned that is value added (not earned at the expense of asset
depletion) (El Serafy, 1989). The important point is that the capital component of the
net receipts originating from exhaustible resources must be set aside for investment in
new types of capital (and thus subtracted from GDP in the case of national accounting)
(El Serafy, 1989).
Until very recently, countries have employed mostly aggregate measures of
national income accounting. However, traditional methods of income accounting using
GDP, such as the widely used 1968 version of the UN System of National Accounting
(SNA), while useful in describing short term changes in economic activity, are not as
valuable for assessing long-term sustainable growth. This is partially because they
ignore the depletion of natural resources and expenditures to protect or restore the

46
environment (El Serafy & Lutz, 1989). In the case of natural resource exploiting
countries, traditional accounting methods have grossly overestimated real income, and
natural capital stocks have been largely consumed rather than reinvested in other forms
of capital. Fortunately, research on natural resource accounting has offered ideas on
how to update national accounting procedures to account for natural resource depletion
and environmental pollution. Adopting the ideal of sustainable development, the UN
has worked with the World Bank, Organization for Economic Co-operation and
Development (OECD) and the International Monetary Fund (IMF) to develop an
updated version of the SNA. The updated 2003 Handbook for Integrated
Environmental and Economic Accounting (SEEA), offers practical methods for
measuring natural capital (United Nations et al., 2003). In this way, countries can
begin to take stock of their natural assets and manage their development activities
accordingly. It is important to note however, that natural resource accounting is still a
work in progress. The SEEA focuses primarily on the environmental and economic
aspects of sustainability, and offers less advice on social sustainability. Practically
speaking, there are also many challenges associated with the valuation of
environmental resources, especially in developing countries. Some of these challenges
include a lack of environmental and financial data, a lack of transparency, the need for
a determination of the stage at which the resources should be valued, and the
limitations of reducing environmental resources to monetary value (Peskin, 1989).
Nevertheless, these methods represent a significant improvement over traditional

47
national accounting, and provide practical guidance on one way to assess sustainability
in resource-rich countries.
6.1. Proceed With Caution: The Resource Curse
Research has demonstrated that some countries with significant endowments of
natural resources have fallen victim to a phenomenon referred to as the resource curse
(Humphreys, Sachs, & Stiglitz, 2007a). Many naturally wealthy countries have
experienced slower economic growth, higher rates of political turmoil and corruption,
and a host of other economic and political challenges compared with countries with
fewer resources (Humphreys et al., 2007a). The tendency for states to consume
revenues (capital) originating from the sale of non-renewable resources, rather than
investing the revenue into assets, is just one of the many pitfalls of natural resource
wealth. Other side-effects of natural resource wealth include Dutch Disease, a decline
in other domestic economic sectors; boom-bust cycles, which result from volatility in
income derived from natural resources; increased corruption; weakened democratic
political systems; militarization and meddling of foreign powers in local politics; and
an uneven distribution of knowledge and power, where extracting corporations have the
upper hand in negotiations with governments (Humphreys et al., 2007a). Furthermore,
mineral rich economies in particular, have been prone to government failure (Auty,
1998).
The negotiation process often marks the beginning of the potential hurdles that a
country wishing to extract natural resource wealth may encounter. Natural resource

48
contracts are usually dependent on several time-sensitive factors, including the
changing price of the resource, and the current economic and political conditions in the
country (Radon, 2007). Informational advantages on the part of companies, and a lack
of technical and negotiation expertise on the part of governments often combine to
result in contracts with large concessions, inhibiting the government’s ability to invest
resource rents far into the future. Such contracts tend to impose very low royalty rates
which are often charged only on profits. In theory, since oil, gas, and minerals are
fixed and non-mobile assets, high taxes could be charged without encouraging their
movement out of the country; in reality though, this has not always been achieved
(Humphreys, Sachs, & Stiglitz, 2007b). However, governments can begin to negotiate
better contracts, starting with a simple step: they can hire one or more expert
negotiators, which would represent a relatively small up-front cost and increase their
chances for retaining resource rents for years to come (Radon, 2007). Also, ensuring
that government employees with the necessary technical expertise are part of the
negotiation team, and the strengthening of tax legislation prior to the negotiation of
contracts can also encourage more optimal outcomes.
After a contract is negotiated, the potential for “Dutch Disease,” consumption of
capital, and boom-bust cycles face resource wealthy countries. In the uncertain
political climate of many developing countries, politicians often have an incentive to
spend revenues sooner rather than leaving investment opportunities for future
opponents (Humphreys et al., 2007a). Compounding the problem, volatility in earnings
from natural resource extraction, originating from variability in extraction rates, natural

49
resource prices, and the timing of payments made by corporations, result in further
difficulty in managing expenditures (Humphreys et al., 2007a). Additionally, while
states tend to overspend, they also tend to under- invest. For example, studies have
revealed a particular tendency to short-change investments in education (Glyfason,
2001).
Political challenges also confront resource-wealthy nations. Profit-motivated
companies sometimes find it easier to bribe political officials to obtain resources at low
prices, than to search for more efficient means of extraction (Humphreys et al., 2007a).
Additionally, because a high level of wealth is available in the short-run, theft of these
assets may provide an easy means of maintaining power (Humphreys et al., 2007b).
While many resource-rich developing nations have failed to benefit
significantly from their natural wealth (Sachs & Warner, 2001), others have managed to
achieve socio-economics benefits. Out of 18 resource-abundant developing countries
studied between 1970-90, only two, Malaysia and Mauritius were able to sustain over 2
% growth per year (Sachs & Warner, 1997). However, more recent studies have
indicated a higher level of success, and perhaps more importantly, a high degree of
variation between the performance of resource-rich countries. For example, between
1990 and 2003, poverty fell by 60 % in Chile’s mining Antofagasta region
(International Council on Mining and Metals, 2006b) Botswana, Peru, Tanzania, and
Ghana have also accrued benefits from investments in mining (Humphreys et al.,
2007a; International Council on Mining and Metals, 2006b). This variation in
performance between different resource-rich countries highlights the fact that not all

50
countries have experienced the resource curse. Until very recently, the literature on the
resource curse did not focus much attention on why these variations existed and why
some countries have in fact not been completely “cursed.” Fortunately, more recent
efforts on the part of researchers, industry, and civil society have shed some light on the
strategies that can be adopted to avoid the potential traps of resource wealth
(Humphreys et al., 2007b; International Council on Mining and Metals, 2006b).
Norway and Malaysia provide two examples of countries that were able to
escape the resource curse, in part by developing efficient state-owned companies to
extract their oil resources (Stiglitz, 2007). The strategy of nationalization allowed
Norway and Malaysia to avoid many of the problems associated with the privatization
of a natural resource. Although proponents of privatization cite efficiency as an
important reason to privatize, faster than efficient levels of resource extraction are often
encouraged when long-term property rights are not viewed as legitimate in corrupt
privatizations (Stiglitz, 2007). Private companies are thus also encouraged to move as
much of the resource wealth to a safer locale, namely out of the count ry, as quickly as
possible (Stiglitz, 2007). Furthermore, agency problems are often increased when
privatization occurs, leading to increased opportunities for diversion of resource wealth
(Stiglitz, 2007).
New investments in mining, however, are currently shifting towards the
developing world (Humphreys et al., 2007b). This means that the need to understand
and avoid resource curse type outcomes in the specific context of developing countries
will continue to increase. If resource extraction continues to lead to lasting and

51
negative economic, social, and political consequences, it cannot be considered
sustainable. The following section examines some of the efforts being made to
improve performance in the extractive industries with regards to sustainable
development.
6.2. Stepping Towards Sustainability in the Extractive Industries
Efforts have been increasing to document the mechanisms by which certain
countries have been more successful in achieving socio-economic development through
the exploitation of non-renewable resources. The proponents of these efforts argue that
if managed prudently, mining can be a viable and rewarding strategy, particularly as an
economic jumpstart during the early stages of development.
Beginning in the 1980’s and 1990’s the World Bank first attempted to
demonstrate this by pointing to poverty alleviation, job creation, and infrastructural
development, using resource-rich developed countries as examples of successes in
mining (Kumah, 2006). They maintained that the “quality and competency” of a
country’s institutional structures could determine whether mining revenues would
promote or impede development in that country (Pegg, 2006). However, throughout
this period, the World Bank continued to support mining projects in developing
countries that did not demonstrate good governance, resulting in an increase in foreign
investment without poverty alleviation (Pegg, 2006).
Many criticized the World Bank’s initial approach, looking at the impacts of
mining on communities and on the environment, especially in the developing world

52
(Power, 2002). In response to this criticism, the World Bank released the Extractive
Industries Review (EIR) report in 2004. This report represented a major step towards
sustainability in the mining sector; the World Bank explicitly stated that certain
preconditions must be in place before it will become involved in mining or oil and gas
projects. Additionally, the report stated that social, environmental, and poverty
alleviation must be explicitly stated goals, equal to the goal of economic growth (Pegg,
2006).
Meanwhile, pressure groups and the internet have been increasingly drawing
attention to environmental incidents related to mining (Horowitz, 2006). Particular
attention has been paid to the string of environmental catastrophes that have occurred in
the developing world as a result of cyanide use in gold mining (Kumah, 2006).
Partially as a result of this pressure, businesses are realizing there are benefits to
improved social and environmental performance. This was evidenced by the creation
of International Council on Mining and Metals (ICMM) in 2001 to promote industry
leadership towards sustainable development. Currently 16 major mining companies are
members of the ICMM (International Council on Mining and Metals, 2006a). In 2003,
all of the corporate members of the ICMM adopted the organization’s Sustainable
Development Framework, which commits them to transparency, and to continually
make improvements in health, safety, environment, human rights, and community
development (Mitchell, 2006). Furthermore, the same year the ICMM formed a
partnership with the World Conservation Union (ICUM) to protect biodiversity by
pledging not to mine or explore in World Heritage Sites (Mitchell, 2006). In May of

53
2004, the ICMM partnered with the World Bank and the United Nations Conference on
Trade and Development (UNCTAD) in undertaking its Resource Endowment Initiative,
which aimed to better understand how mining can contribute to socio-economic
development in host countries.
Corporations, however, aren’t the only ones who can contribute to progress
towards sustainability; civil society has also taken a stand, launching the “Publish What
You Pay” campaign in June, 2002. This campaign now includes more than 300 non-
governmental organizations, led by Global Witness, calling for increased transparency
in the form of mandatory disclosure of payments made by companies in the extractive
industries (Global Witness, 2007; Publish What You Pay, 2007). Governments also
have a responsibility and the potential power to make changes that can ensure that more
natural capital revenues are invested into other forms of capital. Indeed, industry
cannot be expected to take on the challenge alone, without regulatory, fiscal, and
incentive-based measures from governments at all levels (local, regional, national, and
through international cooperation). As the Publish What You Pay campaign highlights,
transparency of revenues must be improved so that governments can be held
accountable. To this end, the Extractive Industries Transparency Initiative (EITI) was
established in 2002 by the UK Prime Minister Tony Blair at the World Summit for
Sustainable Development in Johannesburg. The EITI aims to promote good
governance and accountability through the full publication and verification of company
payments and government revenues from mining, oil, and gas activities (Extractive
Industries Transparency Initiative, 2007). The EITI, by setting a global standard for

54
transparency, can potentially address several of the key negative aspects of the natural
resource curse, thereby increasing the potential for sustainability in the industry. For
example, when transparency is required, it can assist companies in demonstrating the
contribution of their investment in a country, and level the playing field for companies
wishing to voluntarily disclose their information. Furthermore, increased transparency
has the potential to decrease political instability and create a more stable investment
climate.
Some critics argue, however, that many of these efforts involve large western
NGOs partnering with industry, which fails to engage local communities in dialogue
that can help them improve conditions in their communities (Whitmore, 2006). But,
there is evidence that progress is being made at the local level too; the Revenue Watch
Institute (RWI) is also working to increase transparency, while providing assistance to
governments and citizens in combating resource curse effects (Revenue Watch
Institute, 2007). The RWI works to publicly monitor both financing and expenditure
relating to natural resource development. As RWI partners continue to collaborate and
share skills, an indigenous- led network of NGOs is developing to combat corruption in
the developing world (Revenue Watch Institute, 2007). The RWI has provided
resources for workshops and conferences aimed at increasing public involvement in the
accounting and monitoring process, and provided grants to create local public finance
monitoring centers which conduct their own research and discussions. RWI has
worked to build civil society coalitions in Azerbaijan, Kazakhstan, Kyrgyzstan, and
Nigeria (Revenue Watch Institute, 2007).

55
Investors are also realizing they can reduce risks by requiring some level of
Corporate Social Responsibility (CSR) (Horowitz, 2006). Companies are increasingly
reporting information on their corporate governance practices. In 2003, the top ten
mining companies all published Annual Reports and seven of these companies also
published a separate social and environmental report (Jenkins & Yakovleva, 2006).
Such reports are also becoming more sophisticated, however, there currently aren’t any
standards for external verification of the reporting company’s data (Jenkins &
Yakovleva, 2006).
Academic institutions also hold the potential to foster improvements in the
extractive industries. Research, training for future industry professionals, and
partnerships with stakeholders such as the Sustainability Working Group at the
University of British Columbia’s Department of Mining Engineering can help to bring
about positive change (Costa & Scoble, 2006). Cooperative efforts between
researchers and stakeholders such as the Britannia Beach Sustainable Development
Project in British Columbia, which aims to convert a former mine site into a sustainable
community, have demonstrated the potential for creative partnerships to bring about
positive change in the industry (Meech et al., 2006).
Despite the efforts that have just been outlined, the debate surrounding
sustainability in the extractive industries continues. Many maintain that the apparent
increase in concern over sustainability by corporations isn’t enough and the impact on
communities is simply too great (Power, 2002; Whitmore, 2006). Another study
concluded that much more progress must be made before gold mining, in particular,

56
can be deemed sustainable, “…as long as mining continues to displace people, disrupt
social organization, cause sudden loss of livelihoods, and loss of access to public
services it cannot be considered sustainable (Kumah, 2006).”
Still, it is clear that some progress has been made, and the potential for
continued improved management of non-renewable resources exists, regardless of the
setbacks of the past. However, there are still environmental, economic, and social
challenges associated with the exploitation of natural resource wealth which require
continued attention. One specific area that could benefit from more research and action
is the level of support provided to mining communities for economic diversification
and planning for mine closure (International Council on Mining and Metals, 2006b).
Additional improvements in transparency, governance, legislation, and economic
policy could also hold keys to unlocking resource wealth which can truly foster genuine
and sustainable development. Strengthened taxation regimes, strict fines for
environmental damage, increasing requirements for reporting of social and
environmental performance can all potentially increase the benefits of natural resource
wealth. Although governance and institutional structures in developing countries are
often weak when mining, oil, or gas initiatives are undertaken, long-term success can
be achieved if income is successfully reinvested into areas such as technical capacity (a
form of human capital), alternative domestic industries (especially investment in
alternate renewable forms of natural capital where possible), and social capital.
Innovative partnerships between companies, governments, and civil society
organizations can help build the capacity of local and regional public agencies to

57
responsibly deal with revenues, while national and international level partnerships can
potentially bolster commitments to transparency, environmental performance, and
human rights.

58
CHAPTER 7: RESEARCH METHODOLOGY
A combination of quantitative and qualitative methods was used for this study.
This approach of methodological pluralism allowed the research design to be
comprehensive yet flexible, while working within a large community where reliable
demographic information was difficult to obtain prior to travel to the study site
(Sechrest & Sidani, 1995). A quantitative risk-perception survey, including the
collection of health data, and environmental sampling were accompanied by qualitative
semi-structured interviews. Interviews were particularly useful in gaining additional
in-depth insights from community members and exploring the perception of risk and
mine closure process from the varying perspectives of different demographic groups,
company representatives, government officials, and other stakeholders. A total of 32
semi-structured interviews were conducted, twelve of which were conducted with
women (Oishi, 2003). A snowball sampling technique was used to identify women
who had been employed at the mine for interviews, because they were a minority in the
population. In particular, the relationship between risk perception and gender was
examined using a combination of quantitative and qualitative methods, an approach
which few studies have thus far attempted (Gustafson, 1998).
7.1. Risk-Perception Survey
A survey questionnaire was designed to quantify and evaluate environmental
and health risks as they are perceived by Vatukoula residents, and build upon prior
environmental risk assessments. The survey aimed to assess how people understand and

59
utilize information about environmental and health risks (Trumbo, 2002), including but
not limited to, potential for contamination of water, soil, and air, potential for acute
environmental disasters (Stenson, 2006), land use conflicts (McLeod, 2000), and risk to
future generations. The survey also included questions about health symptoms
experienced by mine workers and their families (Elliott, Cole, Krueger, Voorberg, &
Wakefield, 1999), focusing on symptoms that are known to occur with exposure to the
chemicals used in the gold mining operations and their by-products (Muezzinoglu,
2003).
The target population for this study consisted of all people living within the
larger community surrounding the Vatukoula mine, including current and former mine
employees and their families. For organizational purposes, the target population was
divided in accordance with 19 existing geographically distinct villages and mining
settlements. Many of these settlements are located in very close proximity or are
adjacent to each other. However, some of the settlements are located a few kilometers
from the central mining area, including the Nasomo and Nasivi settlements. Reliable,
up-to-date census data was not available for the target population. The most recent
government census data was collected in 1996 and significant changes may have
occurred in the population since that time, especially following the closure of the mine.
The most reliable estimate of the target population was determined to come from a list
of the number of households in each geographic region, provided by the EML
company. Household data for the Nasivi and Nasomo settlements was not available
from EML, so this data was obtained from the nurse at the Tavua District Health

60
Office. Based on the information collected from EML and the health office, it was
estimated that approximately 750 households were located within the study region.
Population was subsequently estimated from the number of households, based on
information from EML that the average household consists of 2 adults and 3 children.
Only adults over the age of 18 were selected for this study, resulting in a total estimated
target population size of 1,500 people. Based on the estimated target population size
of approximately 1,500 people, a predicted maximum response variance of .50/.50, a
confidence level of 95%, and a desired confidence interval of +/- 5%, it was determined
that approximately 304 responses would be required (Fink, 2003). Because of the
uncertainty inherent in the estimated population data, the actual number of occupied
houses was field verified during the survey and the resulting estimate of the target
population was adjusted to 1,446 people.
A simple random sampling method was employed for this study (Fink, 2003).
While gender and age were subgroups of interest, for the purposes of this study, our
random sampling method selected adequate proportions of each of these groups to
obtain the desired confidence interval. Based on the desired number of responses
(304), the estimate that two adults reside in each household, and the estimated total
number of households (750), a simple random sampling technique using an interval of
every other household (1 out of 2) was implemented. To minimize coverage error, a
systematic method was used to select the households that participated in the survey.
This method was based on a geographic sample frame because a reliable list of the
members of the survey population was not available (Dillman, 2007). To ensure

61
randomization, a number between 1 and 2 was randomly selected when sampling in the
first region was undertaken, to indicate whether the first or second household
encountered would be the first household systematically selected (Dillman, 2007).
When arriving at each selected household, the individual who was over the age of 18
with the most recent birthday was selected as the survey participant to further ensure
random selection (Dillman, 2007). Surveys were self-administered and the survey
team returned to each home at a later time to collect each questionnaire. To minimize
non-response error, the survey distribution and collection times were selected based on
the time of day residents were likely to be home (early morning and late evening). If
the selected household member was not home at the time of the first visit, the survey
questionnaire was dropped off to be completed by the selected participant when they
became available. The survey team subsequently returned at a later date to collect the
questionnaire. If the questionnaire was not filled out when the survey team returned,
multiple future contacts (consisting of home visits by the survey team) were made to
ensure that a response was achieved whenever possible.
A token incent ive, consisting of a University of Vermont ink pen, was included
with each survey questionnaire. Participants received the incentive in advance,
regardless of whether of not they responded. This technique has been shown to help
establish trust and increase response rates (Dillman, 2007). In fact, we found that
many people didn’t have a pen or pencil on hand to fill out the questionnaire, so the
inclusion of a pen was also convenient, which likely increased response rates even
further. A high response rate was achieved (92%; n= 240). Demographic data is not
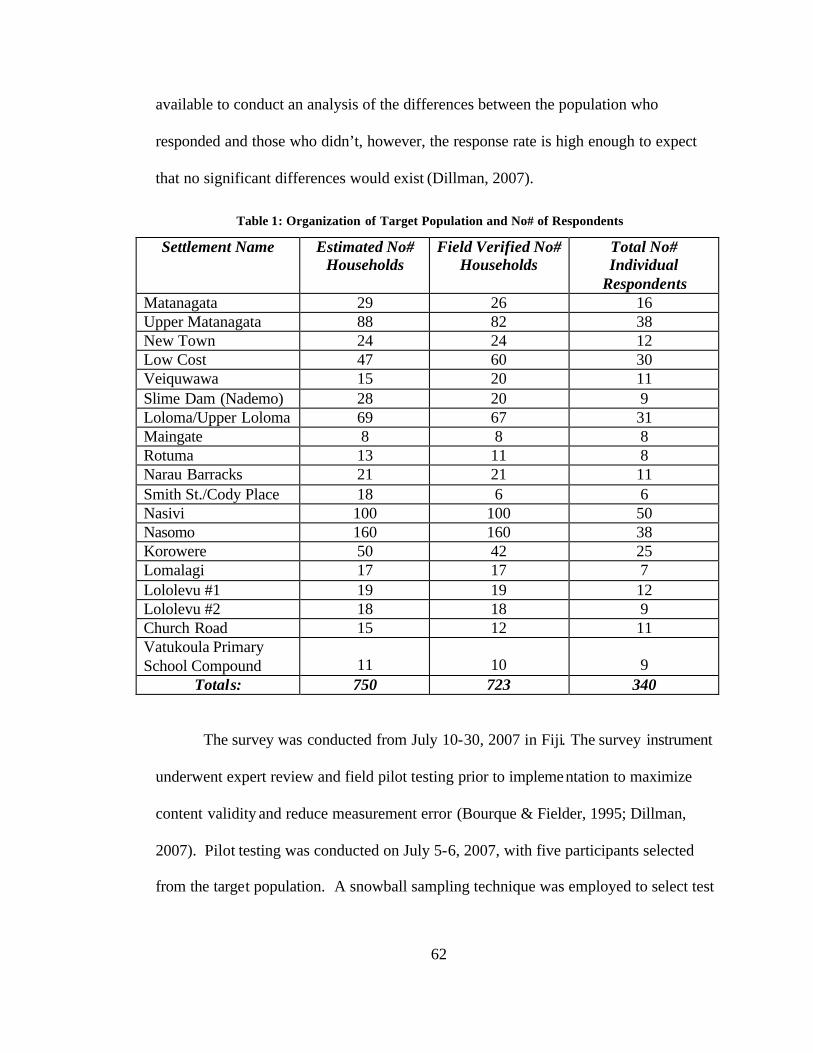
62
available to conduct an analysis of the differences between the population who
responded and those who didn’t, however, the response rate is high enough to expect
that no significant differences would exist (Dillman, 2007).
Table 1: Organization of Target Population and No# of Respondents
Settlement Name Estimated No# Households
Field Verified No# Households
Total No# Individual
Respondents Matanagata 29 26 16 Upper Matanagata 88 82 38 New Town 24 24 12 Low Cost 47 60 30 Veiquwawa 15 20 11 Slime Dam (Nademo) 28 20 9 Loloma/Upper Loloma 69 67 31 Maingate 8 8 8 Rotuma 13 11 8 Narau Barracks 21 21 11 Smith St./Cody Place 18 6 6 Nasivi 100 100 50 Nasomo 160 160 38 Korowere 50 42 25 Lomalagi 17 17 7 Lololevu #1 19 19 12 Lololevu #2 18 18 9 Church Road 15 12 11 Vatukoula Primary School Compound 11 10 9
Totals: 750 723 340
The survey was conducted from July 10-30, 2007 in Fiji. The survey instrument
underwent expert review and field pilot testing prior to implementation to maximize
content validity and reduce measurement error (Bourque & Fielder, 1995; Dillman,
2007). Pilot testing was conducted on July 5-6, 2007, with five participants selected
from the target population. A snowball sampling technique was employed to select test

63
subjects who represented a range of ages, education levels, both men and women, and
former mine employees and non-employees. Participants were asked to complete the
survey questionna ires and return them using the same procedures planned for the actual
survey. A response rate of 100 % was achieved during the pilot test. Interviews were
conducted with each pilot test participant, asking questions regarding the clarity of
instructions, readability and clarity of questions, and understanding of study objectives.
The results of these interviews and results of the pilot test surveys indicated the need
for minor revisions of three survey questions to facilitate easier readability and
comprehension. For example, several of the test subjects indicated that the word
“Indigenous” was unnecessary as a descriptor of Fijian ethnicity in a question asking
respondents to indicate their ethnicity. As a result “Indigenous Fijian” was changed to
“Fijian” to make the answer choices as clear as possible for our specific target
population. After revision, the survey instrument was translated into Fijian language.
A local representative was chosen to assist in the translation, distribution, and
subsequent collection of survey questionnaires. This representative attended a training
session, which outlined the required procedures to ensure random sampling and
effective implementation of the survey plan. The survey team included researcher Mary
Ackley and Pita Vatucawaqa (local representative). The survey team worked in tandem
for the first day of the survey implementation and then split up tasks to increase
efficiency. A total of 369 people were selected to fill out the survey, and completed
questionnaires were collected from 340 people, resulting in a 92% response rate. Each
of the 19 different villages and settlements and approximately 24% of the adult

64
population in the region were represented. Each respondent was given the choice to
complete the survey in English or Fijian language.
While demographic data was collected, names were not recorded at any stage,
and every effort was made to maintain subject anonymity. Surveys were screened for
any information provided that could potentially identify a subject, and this information
was subsequently concealed permanently using a black pen. Surveys were kept in a
locked location until the data was entered electronically, after which time the original
questionnaires were destroyed.
7.1.1. Survey Instrument
The final survey instrument consisted of 46 questions, including 1-7 point
Likert-type scale questions, multiple choice questions, and open-ended questions
(Dillman, 2007). Questions aimed to evaluate risk perception variables such as ability,
sufficiency, level of concern, and knowledge of risks. Questions also aimed to quantify
the degree to which participants utilize systematic vs. heuristic processing in evaluating
risks (Trumbo, 2002). The full survey instrument in English language is included as
Appendix I, the full survey instrument in Fijian language is included as Appendix II.
The survey instrument was accompanied by a cover letter which explained the
purpose of the survey and outlined instructions for completion of the survey. In
addition, each participant was also asked to sign and return a copy of an “Informed
Consent to Participate” form indicating their understanding of the purpose and
objectives of the study and their consent to participate. The cover letter and consent

65
forms are included in Appendices I and II as they were in the original survey
instrument.
7.1.2. Data Analysis
SPSS 15.0, a statistical analysis software package was used to conduct
univariate and bivariate analysis of closed-ended survey questions. Chi-Square and
Mann-Whitney tests were conducted to assess variation in responses according to
gender; Kruskal-Wallis tests were conducted to assess variations between ordinal
variables such as knowledge of risks and nominal demographic variables such as
ethnicity; Spearman correlation coefficients were calculated to assess correlation
between multiple ordinal variables and scale vs. ordinal variables. One-way ANOVA
and Bonferroni tests were conducted to assess variation between scale demographic
variables such as age, and nominal variables. For ordinal variables, “don’t know”
responses were treated as missing values during bivariate and multivariate tests to
ensure accuracy of results. Finally, PLUM ordinal regression analysis was conducted
to assess the relative influence of two independent variables, gender and employment at
the mine on the dependent variable knowledge of risks.
The final survey question was open-ended, asking respondents to rank the three
environmental or health issues that concerned them most. Responses to this question
were translated, coded, and compared to quantitative results obtained with SPSS 15.0.
A hierarchical coding procedure, using categories and subcategories, similar to that
used in the 1991 risk-perception study by Fischer et al was used to classify risks

66
(Fischer, Morgan, Fischhoff, Nair, & Lave, 1991). When a response could potentially
be placed in multiple categories, the most specific category possible was chosen.
7.1.3. Limitations
All households and survey participants were approached in person. This
process was time intensive; however, it ultimately achieved a high response rate. In the
settlement of Nasomo, houses were located far apart, sometimes requiring a 20-30
minute walk between houses. Additionally, reliable maps of the region were not
available so the survey team had great difficulty in located some of the households.
Local community members assis ted the team in locating the houses, but even these
individuals were unable to confirm if all of the households were ultimately identified.
As a result, the sample collected for this particular region was not truly a probability
sample, but rather a convenience sample. Additionally, the final field verified number
of households remains simply a best estimate.
Pilot testing was only conducted for the English language version of the study.
This occurred due to time constraints for the study and the need to confirm translations
with local experts. We wished to get started with pilot testing as soon as practical after
arriving at the study site, however, translation of the survey instrument needed to be
verified concurrently after arriving in Fiji. However, all translations were verified by
local translators prior to use.
We were interested in ethnicity as an independent variable that might affect
risk-perception. However, reliable data on the ethnicity of the target population was

67
not available so it was not possible to stratify the sample accordingly. Census data
from 1996 indicated that the population was predominantly ethnically Fijian, with
minority populations of ethnic Indians, Rotumans, Chinese, and Caucasians. We thus
attempted to over-sample minority populations by selecting additional persons to
participate at households with more than one person of a minority ethnicity. However,
this only occurred in a very small number of cases and thus did not significantly affect
survey results. A snowball sampling technique was employed to identify people of
minority ethnic backgrounds to participate in interviews, which provided additional
insights into the views of these sub-populations.
The final open-ended survey question was translated incorrectly and the mistake
was not identified until after the survey was initiated. The English language question
asked respondents to list the “three environmental or health issues that concern you the
MOST in decreasing order.” The Fijian language version translated to “Please list the
three issues that concern you MOST in decreasing order.” The question could not be
changed after the survey began, but it resulted in an interesting twist on the final
question. Respondents who took the Fijian language version simply listed the three
most important concerns they were facing, regardless of whether they were related to
the environment or health. These responses offered insight into the relative importance
of environmental and health risks compared to other concerns. Open-ended results are
discussed in Chapter 8.
Finally, respondents were asked to report symptoms that they had experienced
within the past month. The period of time during which respondents were asked to

68
report symptoms was important because if people are asked to recall information from
far in the past they may not be able to accurately remember this information (Dillman,
2007). However, in this particular case the mine had been closed for several months
prior to the survey, so interview subjects reported that some of their symptoms had
faded or stopped completely since the mine closure. Specifically, difficulty breathing
and severe cough were mentioned, but it is possible that many people experienced
several symptoms more often, or more severely, during mining operations.
7.2. Environmental Sampling and Analysis
A total of six samples of surface water and drinking water were collected and
analyzed. Water quality was chosen as the primary focus because water represents a
significant pathway through which people may be exposed to contaminants from mine
wastes. Many of the households in Vatukoula are supplied with untreated water,
pumped directly from the nearby Nasivi River and families routinely use river water for
washing clothes, washing dishes, fishing, and swimming.
The six sample locations were chosen because they are places where Vatukoula
residents may commonly come into contact with potentially contaminated surface
waters or drinking water. Detailed information about each sample is described in detail
in Table 2, and sample locations are presented in Figure 2.

69
Table 2: Sample Key
Sample No. 001 002 003 Sample ID UVM -080607-TW-001 UVM -080607-SW-002 UVM -080607-SW-003
Sample Location
Galvanized Iron Tank - Matanagata (Behind House
EM3)
Nasivi River - Upstream of bridge at
pumping station Upstream of bridge at
Lololevu Creek Sample Matrix Tank (Drinking) Water Surface Water Surface Water Date Sampled 8/6/2007 8/6/2007 8/6/2007 Time Sampled 07:31 07:45 08:00 Weather Conditions Sunny, no wind, 27°C Sunny, no wind, 27°C Sunny, no wind, 27°C Additional Notes -- -- -- Sample No. 004 005 006 Sample ID UVM -080607-STW-004 UVM -080607-SW-005 UVM -080607-SW-006
Sample Location Tap - Matanagata
(Behind House M-32)
Nasivi River - Upstream of river crossing ,
just north of Matanagata South shore of Slime Dam Sample Matrix Tap (Drinking) Water Surface Water Surface Water Date Sampled 8/6/2007 8/6/2007 8/6/2007 Time Sampled 08:16 08:26 08:39 Weather Conditions Sunny, no wind, 27°C Sunny, no wind, 27°C Sunny, no wind, 27°C Additional -- Excessive algal growth --
Figure 2: Sample Locations

70
Samples were analyzed locally at the University of the South Pacific (USP)
Institute of Applied Sciences (IAS) Analytical Laboratory and the Fiji Mineral
Resources Department (MRD). Analytical parameters were determined based on local
geology, the chemicals used in the gold mining processes, and their potential by-
products. A priority list of analytical parameters was then developed based on the
degree of toxicity to humans of the potential contaminants, and the analysis options
available at the local laboratories. Historical analytical data, collected by the MRD,
was also reviewed during the development of the sampling and analysis plan.
7.3. Hydrogen-Sulfide Testing for Bacterial Contamination
During the course of the study, the residents of Vatukoula expressed concern
about the potential for contamination of drinking water and surface water due to
inadequate management of human and animal wastes. Sanitation facilities at Vatukoula
primarily consist of flush toilets with septic tanks and pit latrines, which do not provide
adequate removal of pathogens. Additionally, many settlements are located in very
close proximity to the Nasivi River and its tributaries, increasing the risk of
contamination. Animals such as pigs and cows are also commonly located in the
settlements, close to unprotected water supplies.
Faecal coliforms (and other bacteria in the coliform group) exist naturally
within the intestinal tract of humans and other warm-blooded animals. Thus, if water is
contaminated with faecal coliforms, this may indicate that the water is contaminated
with faecal matter and is not safe for human consumption. Therefore, an important

71
indicator of water quality is the absence of faecal coliform bacteria, which may indicate
that pathogens, such as typhoid or cholera, are present (Mosley & Sharp, 2004). Since
most tests for pathogenic organisms are costly and difficult to perform, indicator
organisms, such as total and faecal coliforms, are commonly used to assess the risk that
pathogenic organisms may also be present (Mosley & Sharp, 2004). However,
coliforms may occur naturally in soil and water in tropical climates, making them a
poor indicator organism in such areas. As such, another test has been developed which
uses a more appropriate indicator, hydrogen-sulfide reducing bacteria, to assess the risk
that pathogenic organisms may exist. The Hydrogen Sulfide (H2S) Paper-Strip Test
also has many other advantages because it is very inexpensive and easy for non-
technical people to learn to use. This makes the test ideal for use in rural Pacific island
communities. Each test tube contains a medium in which certain bacteria in the
Enterobacteriacae group, such as Salmonella, Citrobacter, Clostridia, Klebsiella, and
Proteus can produce hydrogen sulfide (Mosley & Sharp, 2004). The production of
hydrogen sulfide is indicated in the test tube when thiosulphate is reduced and
subsequently reacts with ferric salt to form an insoluble black ferrous precipitate. This
black precipitate may then be interpreted to indicate a certain level of risk that
pathogenic organisms may be present. The H2S test has been recommended for testing
drinking water sourced from surface water, boreholes, or rain water, for faecal
contamination (Mosley & Sharp, 2004).
For the present study, several H2S strip tests were obtained free-of-charge from
the World Health Organization (WHO) in the capital city of Suva. A total of ten tests

72
were performed, including one control sample. The control sample was derived from
chlorinated bottled water. Each sample was collected in accordance with suggested
methods outlined in the H2S Paper-Strip Test Instruction Guide provided by WHO in
Fiji. For samples collected from taps, the tap were first cleaned with a clean cloth then
allowed to run for 20 seconds. The sample bottle was then filled up to the marked level
and immediately closed. For samples collected from surface waters, a clean plastic
container was used to trans fer water into the test tube. This container was rinsed
several times prior to collection of the sample. The samples were then stored in a dark
place to prevent sunlight from killing bacteria, which may invalidate results. Samples
were monitored over a three day period, and observations of color change were
recorded at the same time each day. Color change was assessed using the color code
provided in the WHO Instruction Guide.

73
Figure 3: Paper Strip Testing - Color Variation of Black Ferrous Precipitate

74
CHAPTER 8: RESULTS AND DISCUSSION
8.1. Risk-Perception Survey
8.1.1. Profile of Respondents
Three hundred and sixty-nine people were randomly selected to participate in
the survey. A total of 340 completed survey questionna ires were collected,
representing 19 geographically distinct villages and settlements, and resulting in a
response rate of 92%. Respondents were given the choice to complete the survey in
Fijian or English language. 52% of respondents chose to complete the survey in
English, while 48% completed the Fijian version. This nearly even split indicates that
it was very important to offer the survey in both of the predominant local languages.
Our sampling technique successfully captured a fairly even representation of gender,
with 54% of respondents reporting female and 46% reporting male. Only adults over
the age of 18 were selected to complete the survey, but no upper age limit was imposed.
This technique resulted in a broad age representation; respondents ranged in age from
18-80 with a median age of 40. Fewer than 3% of respondents did not complete any
formal education, while 47% of respondents completed secondary school, and 11%
attended a university or other tertiary school. Education levels in Vatukoula are
slightly higher on average, than those in the rest of Fiji according to 1996 census data
(Asian Development Bank, 2006). 83% of respondents were ethnically Fijian. Other
minority ethnicities which were reported included Rotuman, Indian, or multi-ethnic
heredity. Full survey results are located in Appendix III.

75
Table 3: Summary of Demographic Characteristics
Characteristic Range (yrs) Median (yrs)
Std. Dev. (yrs)
95% Confidence
Interval (yrs) Age (n=330) 18-80 40 12.95 39-42
Category Percent
by Category Gender (n=340) Male 46.2% Female 53.8% Ethnicity (n= 340) Fijian 82.6% Indo-Fijian 7.6% Rotuman 4.7% Chinese 0.0% Caucasian 0.0% Other 5.0% Level of Education (n=334) No Formal Schooling 2.4% Primary School 21.3% Secondary School 48.2% Vocational School 16.8% University 11.4% Current or Former Mine Employee? (n=333) Yes 57.4% No 42.6% Work Location (n=188) Aboveground 34.6% Belowground 58.0% Both 7.4% Born in Vatukoula? (n=337) Yes 43.4% No 56.7% Length of Residence in Vatukoula (n=188) Less than 5 years 14.9 6-10 years 12.2% 11-20 yrs 28.2% More than 20 years 44.7%
8.1.2. Knowledge of Risks
When asked how they felt about the risks of mining, the majority of the
population (80.4%) felt they knew about “some” or “most” of the risks of mining.
Approximately 10% felt that they were not aware of any risks, while the remaining

76
10% felt they knew everything they needed to know about the risks of mining (n= 333).
When asked about specific risks, over one-quarter (27%) of Vatukoula residents
reported not knowing whether their drinking water was safe, and 19% did know about
the potential risk of a tailings dam leaking or overflowing. 15.5% of residents felt they
did not know how the risks of mining had changed since the closure of the mine
(n=329). Interviews revealed additional risks that people in the community were not
informed of. One resident explained his concern about the lack of community
knowledge about the risks of cyanide-related fish kills, “At times we have cyanide
spillages into the river, because of the lack of knowledge in the community, at these
times that the fish are dead in the river, we go out there and bring it and cook it and eat
it, because we are not aware of that (Romeo Kivi, personal communication, July 6,
2007).”
Only 37% of people first learned about the risks of mining from the mining
company, while a nearly equally important source of risk information was other people
their village or town (n= 329). Other sources of information about risks included
newspapers (5%), the government (4%), television (4%), and books (4%). Some
respondents indicated that they learned about the risks “somewhere else.” Of these
respondents, the majority wrote in that they learned about the risks through personal
experience. When interview subjects were asked an open-ended question about where
they first learned about the risks, several people also indicated that they learned about
the risks through personal experience, confirming the survey findings. It is thus likely

77
that if the survey was repeated with an additional response option of “through personal
experience,” this option may have been chosen by a higher percentage of respondents.
Somewhere else3%
Because of this survey
2%
Newspapers5%
Information from the government
4%
Books4%
Other people in my village/town
34% The mining company37%
I don't know of any risks7% Television
4%
Figure 4: Sources of Risk Information
8.1.3. Level of Concern
Despite their gaps in risk knowledge, Vatukoula residents feel a consistently
high degree of concern across a range of environmental and health risks, and few
people question the fact that the risks are impacting their health. Air pollution is the
risk which causes the greatest concern among residents, with 74.5% of people feeling
“very worried” about the risk. An additional 12.2% feel “somewhat” worried about air
pollution. Pollution of rivers and streams, as well as drinking water pollution were of
similar concern, with 88.6% of people “somewhat” or “very” worried about the former
and 86.7% of people “somewhat” or “very” worried about the latter. Over 80% of

78
people also feel “somewhat” or “very” worried about pollution of their garden
vegetables, fish, and land. When asked about their concern for their children’s health,
89.8% of parents reported feeling worried about their children’s health because they
live near the mine. 87% of people feel worried about their own health because they
live near the mine. Finally, 85% of people feel worried that environmental damage
from gold mining will impact future generations.
Residents were also asked about the likelihood that each of the risks had
resulted in health problems for either themselves or their families. Again, people
consistently feel that each of the risks is likely to have caused health problems. Air
pollution is the risk that residents feel is most likely to have harmed their health, with
85% of residents reporting that air pollution is “somewhat” or “very” likely to have
harmed their health, the majority of whom felt it was “very” likely (54.4%) (n= 318).
The level of concern a particular person feels about each of the risks of mining
is correlated. For example, if a person feels very worried about air pollution, the same
person is also likely to report they are very worried about each of the other risks.
Likewise, if a particular person isn’t worried about air pollution, they are likely to also
not be worried about water pollution, or any of the other risks. Spearman correlation
coefficients were calculated for each pair of risks, and results indicated significant
positive correlations for every pair of risks tested (p<0.001 for each case).

79
8.1.4. Trust in Authorities
While residents are highly concerned about environmental risks and their
potential health impacts, they do not necessarily feel comfortable discussing these risks
with company officials. Nearly one-third of people reported that prior to the mine
closure, they would not have felt comfortable telling someone from the company if they
had a concern about their health or the environment (n= 288). Furthermore, 48% of
people who would tell the company about their concern felt that the company would
either ignore their concern or do nothing to address it (n= 329). An additional 4% felt
that they would be punished for voicing their concern (n=329). One resident explained
how the company reacted to his concerns during an interview, “…we have complained
a lot at times, but the answer from management doesn’t satisfy us (Romeo Kivi,
personal communication, July 6, 2007).”
The lack of trust in authorities at Vatukoula is likely due in part to the fact that
information about risks has not been communicated in a timely and open manner in the
past. Instead many residents have learned about the risks of mining over a lifetime
through personal experience, or by word of mouth. When questioned about drinking
water quality, Romeo Kivi the secretary of the Vatukoula Community Consultative
Committee explained how the community was not informed about the results of water
quality testing in the past, “No, I’m afraid not, the results are sent directly to the
Mineral Resources Department. The community was not advised on that (Romeo Kivi,
personal communication, July, 6, 2007).” Research has demonstrated that if risks are
first discovered by a community, rather than being fully disclosed by the company

80
immediately following their discovery, people will be predisposed to doubt the
information given to them (Fessenden-Radon et al., 1987).
8.1.5. Control
While residents feel a consistently high level of concern about risks, they also
feel they have very little control to avoid the risks of mining. The majority of people,
64.1% (n= 334), feel they have “little” or “no” control to avoid the risks of mining.
15.3% of people feel they have “some” control, and 20.7% of people feel they have
“enough” or “total” control to avoid the risks of mining. In order for people to feel they
some measure of control over a particular risk, they must feel they have real,
actionable, and positive ways of mitigating that risk (Lundgren & McMakin, 2004).
For example, a positive message about mitigating a risk would be one that tells a person
what to do rather than telling them what actions to avoid. The actions must also be
realistic for a person to implement. For example, after the September 11th attacks in the
United States, people were told to be “vigilant.” While this message is positive, it is
vague and thus difficult to implement on an individual level (Lundgren & McMakin,
2004). Such a message would not help people feel they have control to avoid future
attacks. The present survey revealed that 77% of Vatukoula residents reported not
having a plan to deal with a potential tailings dam disaster. This striking result reveals
one of the possible reasons why the level of control people feel to avoid mining risks is
so low; they do not have real, actionable, and positive information about how to
mitigate potential risks.

81
8.1.6. Ability
Another dimension of risk perception is reflected in a person’s ability to seek
out and find information about risks when they would like to learn more. When asked
about their ability to find additional information about risks, 15.9% of residents felt
they would not know where to go if they wanted to find out more about a particular
mining risk (n=327). 40% of people disagreed with the following statement, “If I have
a question about the risks of gold mining, it is usually easy to find the answer (n=
275).” These results indicate that although people may feel they have some knowledge
about mining risks, they do not necessarily feel comfortable searching for additional
information. If residents do not feel comfortable telling the company about their
concerns, this clearly hinders their ability to seek out further information about risks.
Thus, one way that a company can increase the flow of information about risks is by
creating a more open, transparent, and welcoming relationship between company
officials, employees, and community members.
8.1.7. Weighing Risks and Benefits
Some may argue that by choosing to live and work in Vatukoula, residents are
making a conscious decision to accept the risks of mining in light of the economic
benefits of employment at the mine. However, the results of this study highlight the
underlying complexity of such risk/benefit decisions. Over half of the people of
Vatukoula (52.7%) reported that they are not willing to accept most of the risks of
mining because the benefits are worth it (n= 311). Interviews offered additional insight

82
into this surprising result. Kereni Marama explained why she continues to live in
Vatukoula, and spoke about the feeling of community that was important to her,
“We like living here because the life is easy…when we go to Suva or Lautoka
we have to pay for everything, here we can plant. Here we know each other, when we
don’t have anything we just go to another house and we can borrow it.”
She explained the importance of the cultural connection that Fijians feel to their
land. After generations of mining, families now consider Vatukoula to be their home
and feel connected through a sense of place. She also emphasized the difficulties of
gaining employment in other industries. For example at Fiji Water, “You know...you
have to know somebody there so he can get you in….it’s very hard (Kereni Marama,
personal communication, August 3, 2007).”
Additional insights come from the comments offered at the end of the survey.
Several people chose to write about the highly limited options for employment that
many of the men in the area face. “Where else can my husband find work to support
us, this is the only place he can work as he does not have any other experience
elsewhere.”
Others wrote about their personal and cultural connections to the Vatukoula
community and area,
• “I was born and bred here in Vatukoula and so were my parents and
their parents before them. When the mine closed we were lost….we
have nowhere else to go and there are no jobs available to miners in
Fiji.”

83
• “My ancestors died here…so here we stay.”
It is clear that cultural and personal connections to Vatukoula play an important
role in the analysis of risks and the decision-making process. Additionally, the lack of
alternative economic opportunities, particularly for those without higher education or
specialized training, limits the choices available to miners and their families.
These limited economic options, strong personal and cultural influences, a lack
of trust in company and government officials, and a lack of knowledge about many of
the risks of mining, combine to result in a highly complex and imperfect decision-
making process. The results of this survey can contribute to more informed decision-
making by creating a transparent foundation of knowledge which may be used to build
better risk communication and management strategies, specifically tailored for
Vatukoula.
8.1.8. Gender and Risk Perception
A closer analysis of the responses of men and women revealed that gender is an
important variable in risk perception at Vatukoula. First, the survey revealed that
women and men differ significantly how much they feel they know about mining risks.
Women feel they have less knowledge about the risks of mining compared to men
(p<0.001). More specifically, women are significantly more likely to feel that they
know about some or none of the risks, while men are significantly more likely to
indicate that they know about most or all of the risks.

84
Table 4: Respondents Knowledge of Risks: Cross-tabulation According to Gender
Gender Question Response Male Female Total
Count 11 21 32 % within Gender 7.1% 11.8% 9.6%
None
% of Total 3.3% 6.3% 9.6% Count 53 102 155 % within Gender 34.2% 57.3% 46.5%
Some
% of Total 15.9% 30.6% 46.5% Count 68 45 113 % within Gender 43.9% 25.3% 33.9%
Most
% of Total 20.4% 13.5% 33.9% Count 23 10 33 % within Gender 14.8% 5.6% 9.9%
Knowledge of Risks
All
% of Total 6.9% 3.0% 9.9% Count 155 178 333 % within Gender 100.0% 100.0% 100.0%
Total
% of Total 46.5% 53.5% 100.0%
Just as importantly, women and men also reported receiving risk information
from different sources. As presented earlier, approximately 37% of all respondents
reported first learning about mining risks from the mining company, and approximately
34% of all respondents reported learning about the risks from other people in their
village or town. However, women were half as likely as men to receive risk
information from the company, and almost twice as likely as men to receive
information from other people (p<0.001).

85
Information Source
Somewhere else
Becuase of this survey
Other people in my village
or town
BooksNewspapersGovernmentThe mining company
TelevisionI don't know anything about the
risks
Co
un
t
80
70
60
50
40
30
20
10
0
0.9%
0.6%
21.6%
2.7%
4.3%
1.8%
14.0%
3.3%
4.3%
2.1%
0.9%
12.2%1.5%
1.2%
2.1%
22.8%
0.9%
2.7%
FemaleMale
Gender
Figure 5: Risk Information Source According to Gender
While some Vatukoula residents do receive at least a portion of their risk
information from the company, such risk messages are being less effectively received
by women. One possible explanation for this finding is that women are less likely to
work at the mine, and thus do not have access to on-the-job health and safety training,

86
where risk messages are often communicated. Indeed, the present study confirms that
men are much more likely than women to have been employed at the mine (Fischer’s
Exact Test p<0.001). Although the Fiji government has adopted Equal Opportunity
Employment (EEO) policies for civil service, these policies have not been realized in
the industrial sector. Powerful forces of occupational discrimination and segregation
by gender persist throughout many industries in Fiji (Asian Development Bank, 2006).
Despite the fact that there is no difference in education levels between men and women,
survey results indicate that women have significantly less access to employment
opportunities at Vatukoula. Additionally, women at Vatukoula are not permitted to
work underground. A PLUM ordinal regression test was performed to assess how
influential the variables of gender and employment at the mine were on the dependent
variable knowledge of risks. The results indicated that both variables had a similar and
significant degree of influence on respondent ’s knowledge of risks; the gender variable
had a parameter effect of 0.633 and employment at the mine had a parameter effect of
0.641. Thus, it cannot be concluded from this survey that the difference in knowledge
of risks and source of information were due solely to gender, and not also due in part to
whether or not a person ever worked at the mine. However, the importance of these
findings should not be underestimated; it is clear tha t both women and people who have
not been employed by the mine have a much lower awareness of mining risks and tend
to receive risk information from second-hand sources rather than from the mining
company. This may be because the information is not readily available from the
company or because they prefer alternate sources of information. Most of the

87
interviews conducted with women supported the former conclusion. For example,
when asked if she ever received any information about risks from the company, Elenoa
Bunulau from New Town replied, “No, maybe to my husband, but us gang staying at
home, no (Elenoa Bunulau, personal communication, July, 5, 2007).”
Just as women are less likely to receive risk information from the company,
they are also less likely than their male counterparts to tell the company if they have a
concern about environmental or health risks. Women are more than twice as likely as
men to report that they would not tell the company if they had a concern about the
environment or their health.
Table 5: Company Reaction to Concern: Cross-Tabulation According to Gender
Gender Male Female Total
Count 59 59 118 Listen and try to help % within Gender 38.8% 33.3% 35.9% Count 36 30 66 Listen and do nothing % within Gender 23.7% 16.9% 20.1% Count 38 53 91 Ignore my concern % within Gender 25.0% 29.9% 27.7% Count 7 6 13 Punish me % within Gender 4.6% 3.4% 4.0% Count 12 29 41
Company Reaction to Concerns
Would not tell company % within
Gender 7.9% 16.4% 12.5%
Count 152 177 329 Total % within Gender 100.0% 100.0% 100.0%
Men and women also differ significantly in the level of control they feel they
have to avoid the risks of mining. Survey results revealed that women feel they have
significantly less control to avoid the risks of mining compared to men (p=0.023).
Women are more likely to feel they have “no” control to avoid the risks of mining,

88
while men are more likely to feel they have “some” or “enough” control to avoid the
risks of mining.
Table 6: Control to Avoid Mining Risks
Cross-Tabulation of Responses According to Gender
Gender
Response: Male Female Total Count 57 88 145 % within Gender 36.8% 49.2% 43.4%
No control
% of Total 17.1% 26.3% 43.4% Count 32 37 69 % within Gender 20.6% 20.7% 20.7%
Little control
% of Total 9.6% 11.1% 20.7% Count 29 22 51 % within Gender 18.7% 12.3% 15.3%
Some control
% of Total 8.7% 6.6% 15.3% Count 27 17 44 % within Gender 17.4% 9.5% 13.2%
Enough control
% of Total 8.1% 5.1% 13.2% Count 10 15 25 % within Gender 6.5% 8.4% 7.5%
Total control
% of Total 3.0% 4.5% 7.5% Count 155 179 334 % within Gender 100.0% 100.0% 100.0%
Total
% of Total 46.4% 53.6% 100.0%
It is likely that women’s lack of perceived control and their lack of knowledge
about risks go hand- in-hand. As discussed previously, the control a person feels over a
risk is related to whether or not they are educated and prepared to mitigate that risk
(Lundgren & McMakin, 2004). This study found that approximately half as many
women living in Vatukoula have a plan for a potential tailings dam release or failure,
compared to men (p=0.003). Not only do women feel they know less about the risks of
mining, but they are also less prepared to deal with potential risks than their male
counterparts. This result was also obtained for people who had been employed at the

89
mine vs. those who had not. Those who had never been employed at the mine were
also approximately half as likely to have a plan for a potential tailings dam release or
failure (p=0.002).
It has been widely demonstrated throughout risk perception literature that men
and women perceive the same risks in different ways (Gustafson, 1998). In particular,
studies have consistently shown that women tend to be more concerned about
environmental risks than their male counterparts (Gustafson, 1998). Another study
found that men were more concerned about health risks, while women were more
concerned about environmental risks (Fischer et al., 1991). This study, conducted in a
differing cultural context, did not find any gender differences in respondent ’s level of
concern about environmental or health risks at Vautkoula. This may be due in part to
the fact that all respondents had such consistently high levels of concern about all of the
risks; because there was so little variation across responses overall, less variation may
also be present between the responses of men and women.
Women were also found to be almost half as likely as men to have personally
made the decision to move to Vatukoula (p<0.001; n=188). Instead many women
reported that their husbands had made the decision to move to Vatukoula for them.

90
Who made the decision to move to Vatukoula?
Soemone elseMade together with spouse
SpouseMyself
No
# o
f Res
po
nse
s
60
50
40
30
20
10
0
6.91%
10.11%
17.55%15.96
%
9.57%7.98%0.53%
31.38%
FemaleMale
Gender
Figure 6: Decision-making According to Gender
Almost half (48%) of residents reported that they had considered moving away
from Vatukoula because they were concerned about the environment or their health.
Among those who had considered moving, women were more than twice as likely as
men to report that the reason they decided to stay was because it ultimately wasn’t their
decision (p=0.008). Men were more likely to report that the reason they stayed was
because the money they earned working at the mine was worth the risk (p=0.008). This
result appears to be consistent with a previous risk perception study conducted in
Oregon that found that women are less likely to view risks as counterbalanced by
economic benefits (MacGregor et al., 1994). However, it is impossible to tell from this

91
study if women had equal access to employment opportunities and decision-making
power, whether they would also view risks as counter-balanced by economic benefits.
It is critical that women are given an opportunity to become involved in the
decision-making process, precisely because they do perceive risks in different ways.
Until they are allowed to fully participate in the process of evaluating the risks and
benefits of mining, the perceptions and opinions of women will continue to be
marginalized. The connection between women’s involvement in the decision-making
process and women’s empowerment is recognized in the Women’s Plan of Action
(1998-2008) (WPA) adopted by the Fiji government, and in the United Nations MDGs
(Asian Development Bank, 2006). In Fiji, the important factors disempowering women
include their minimal participation in political and other forms of decision-making,
their lack of property rights, and the prevalence of family violence against women
(Asian Development Bank, 2006).
Such barriers to women’s empowerment are perhaps most intense in mining
communities. Recently, several workshops and conferences that were organized in the
Pacific region revealed some of the major concerns and barriers facing women in
mining communities. The Pacific Regional International Women in Mining Network
Meeting, held in Papua New Guinea in 2007, was attended by two representatives from
Vatukoula (Statement of the Pacific International Women and Mining Network
Meeting, 2007). One major concern laid out by the women at this meeting arises from
the transition to a cash economy, which disrupts traditional gender roles. Women
become economically dependent on men and the importance of their traditional work is
92
diminished. Furthermore, men discontinue their traditional work at home, thus
increasing the burden of household duties for women. A lack of traditiona l societal
controls also often results in social decay, such as increased alcohol and substance
abuse, domestic violence, sexually- transmitted diseases (STD’s), and prostitution
(Oxfam Australia, 2008). Pollution of waterways, air, and land also undermine a
women’s ability to provide a safe home and healthy environment for her family
(Statement of the Pacific International Women and Mining Network Meeting, 2007).
Finally, women are often left out of the decision-making process, including
negotiations about access to land and compensation (Oxfam Australia, 2008).
8.1.9. Health Data
The proportion of deaths due to cancer in Fiji in 2005 was 8.8% (World Health
Organization, 2006). Only 3% of Vatukoula residents reported having been diagnosed
with cancer (n= 337), indicating that it is unlikely that there is elevated incidence of
cancer in the Vatukoula community relative to the rest of Fiji. Additional health data
obtained from the district health office in Tavua indicated that a total of four deaths
occurred in Zone 1 and Zone 2 (which encompass the Vatukoula area) during the 2nd
quarter of 2007, and none of these deaths were caused by cancer.
The most commonly experienced health symptom in Vatukoula is muscle or
joint pain, with 69.6% of people experiencing the symptom at least once during the past
month. Severe cough (63.6% experiencing at least once during the past month) and
severe headaches (59.6% experiencing at least once during the past month) were the

93
second and third most commonly experienced symptoms, respectively. People who
had never worked at the mine were more likely to experience severe headaches more
often than people who had worked at the mine (n= 332; p = 0.010).
Approximately 23% of people reported experiencing hearing loss. People who
reported having worked at the mine were more likely to also report experiencing
hearing loss, however this result was not statistically significant (n=339; p = 0.039).
Finally, age was positively correlated with both hearing loss and memory or
concentration problems (p=0.003 and p=0.022, respectively). Older residents were
more likely to experience both of these symptoms, which are symptoms commonly
experienced more often by people later in life.
8.1.10. Other Demographic Variables
Correlations were also identified between age and risk perception and level of
education and risk perception. Besides being correlated with certain health symptoms,
age was also positively correlated with how likely a person felt that pollution in their
garden vegetables or pollution in their drinking water had harmed their health (p=0.016
and p=0.027, respectively). Older residents felt it was more likely that each of these
environmental risks had harmed their health. Age also had an effect on where residents
would look for additional information regarding environmental or health risks. Older
residents were also more likely to search for risk information in a book, while younger
residents were more likely to search for risk information using a computer (n=327,
Bonferroni test significance, p=0.015).

94
A person’s level of education was positively correlated with how worried they
were about their own health (n =328, p=0.004), and how worried they were about
pollution in their rivers and streams (n=323, p=0.048). Residents who had completed a
higher level of education were more worried about their health and surface water
pollution. This may be because they learned about the potential health impacts of
mining risks during their education. Additionally, level of education was also related to
whether or not a person had considered moving away from Vatukoula due to
environmental or health risks (n=327, p<0.001). People who had completed a higher
level of education were more likely to have considered moving away than those who
were less educated.

95
Level of Education
UniversityVocational School
Secondary School
Primary School
No formal schooling
No
# o
f R
esp
on
ses
100
80
60
40
20
0
8.56%
8.87%
21.71%
7.34%
0.92%
3.06%
7.95%
25.99%
14.07%
1.53%
YesNo
Response
34) Have you ever considered moving away from Vatukoula because you were concerned about your health or the environment?
Figure 7: Considered Moving Away?: Response According to Level of Education
Because 83% of respondents were ethnically Fijian, conclusions about the
relationship between ethnicity and risk perception could not be drawn from this study.
Further inquiry into ethnicity and risk perception through qualitative research or
quantitative research using stratified sampling techniques (if demographic data can be
obtained) is thus warranted.

96
In most cases, the variables that were dependent upon age and/or level of
education (described above) were different from those that depended upon gender. To
further test the validity of gender variations in risk perception, age was held constant in
a partial correlation test between gender and the variable knowledge of risks. Results
indicated that women knew less about mining risks compared to men, even with the age
and level of education variables held constant (p<0.001). Additionally, there is no
significant difference in the level of education of men and women at Vatukoula, so it is
unlikely that a person’s level of education influenced gender differences in risk
perception.
8.1.11. Open-Ended Responses
Many quantitative studies have shown that women and men perceive the same
risks differently (Fischer et al., 1991; Gustafson, 1998), however, qualitative research
using open-ended questions and interviews has shown and men and women also
perceive different risks altogether (Gustafson, 1998). Analysis of open-ended
responses in the present study suggests that women have differing concerns than men;
however, the word risk was not specifically used in this case. In the Fijian version of
the one open-ended question, respondents were asked to list the three issues that
concern them most, in decreasing order. Importantly, the Fijian- language version of
this question did not limit responses to concerns related to the environment or health
and thus offers insight into the relative importance of these issues. Confirming that
environmental and health issues are of great concern, concerns related to the

97
environment and health accounted for 59.4% of all responses in the Fijian version and
95.2% of all responses in the English version. More specifically, issues related to poor
water and air quality were most common in both versions, with 46 (14.7%) and 37
(11.9%) responses respectively in the Fijian language version and 103 (33.0%) and 87
(28%) responses respectively in the English language version. The English language
version was more specific and asked respondents to list the three environmental or
health issues that concerned them most. As a result, Fijian language responses were far
less homogenous and a variety of other issues were identified. In decreasing order of
frequency, financial problems, low wages and poor housing conditions were also of
concern to residents. Societal problems accounted for 18.6% of responses in the Fijian
version. Concerns about family problems, such as “broken home,” and “family
problems everyday” were cited 12 times, with three-quarters of these respondents being
female. Although the number of people citing family problems as a major concern was
relatively small, these open-ended responses offer a more detailed look the wide variety
of social and environmental impacts that exist in mining communities, and also suggest
that women may be more concerned than men about impacts related to family life. As
mentioned earlier, concerns about domestic violence and social problems were also
voiced by women at the Pacific Regional International Women and Mining Network
Meeting.
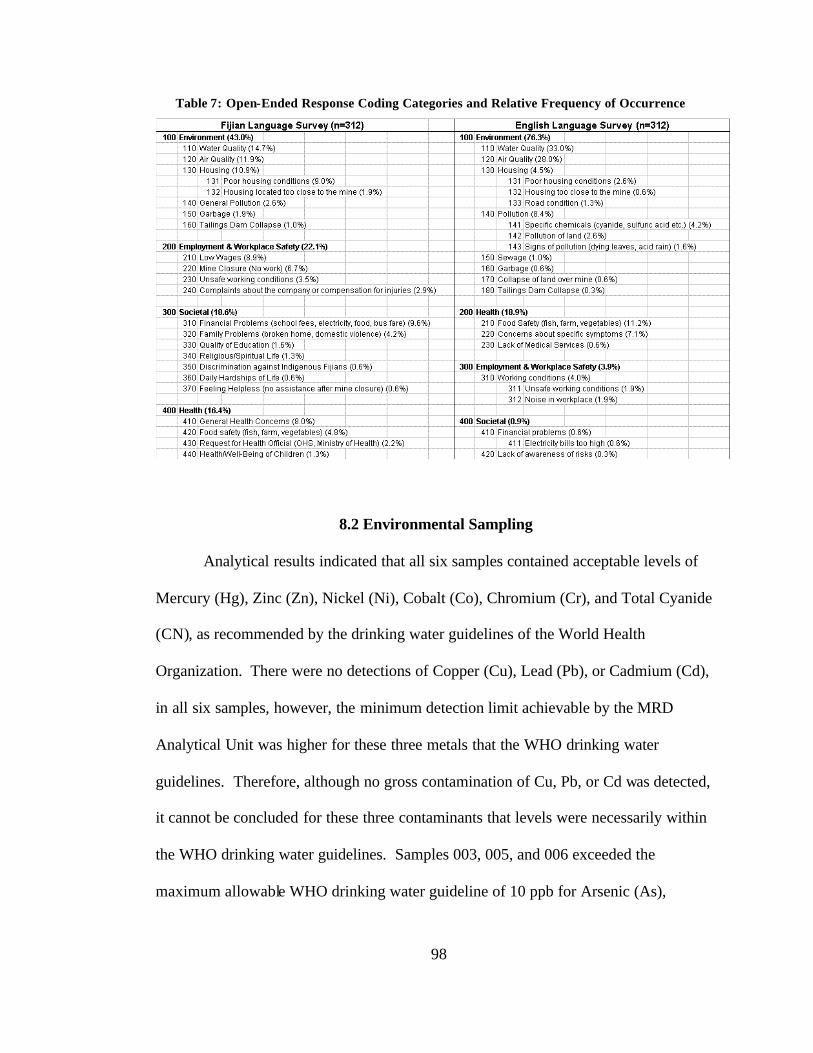
98
Table 7: Open-Ended Response Coding Categories and Relative Frequency of Occurrence
8.2 Environmental Sampling
Analytical results indicated that all six samples contained acceptable levels of
Mercury (Hg), Zinc (Zn), Nickel (Ni), Cobalt (Co), Chromium (Cr), and Total Cyanide
(CN), as recommended by the drinking water guidelines of the World Health
Organization. There were no detections of Copper (Cu), Lead (Pb), or Cadmium (Cd),
in all six samples, however, the minimum detection limit achievable by the MRD
Analytical Unit was higher for these three metals that the WHO drinking water
guidelines. Therefore, although no gross contamination of Cu, Pb, or Cd was detected,
it cannot be concluded for these three contaminants that levels were necessarily within
the WHO drinking water guidelines. Samples 003, 005, and 006 exceeded the
maximum allowable WHO drinking water guideline of 10 ppb for Arsenic (As),

99
however, each of these three samples was collected from surface water in locations
unlikely to be sources of drinking water. Sample 003 was collected from Lololevu
Creek, which is not a source of drinking water; Sample 005 was collected downstream
of both the PWD and EML water intake points; and Sample 006 was collected from the
old tailings dam at Slime Dam, which is also not a drinking water source.
Table 8: Analytical Results
Sample No. 001 002 003 004 005 006
Parameter Units Primary
Criteria *
Arsenic (As) (µg/L) 10.0 0.59 0.82 84.6 0.76 11.8 184
Mercury (Hg) (µg/L) 1 ND(0.3) ND(0.3) ND(0.3) ND(0.3) ND(0.3) ND(0.3)
Copper (Cu) (mg/L) 2.0 ND(0.02) ND(0.02) ND(0.02) ND(0.02) ND(0.02) ND(0.02)
Zinc (Zn) (mg/L) 3.0 0.354 ND(0.02) ND(0.02) ND(0.02) ND(0.02) ND(0.02)
Nickel (Ni) (mg/L) 0.07 ND(0.02) ND(0.02) ND(0.02) ND(0.02) ND(0.02) ND(0.02)
Lead (Pb) (mg/L) 0.01 ND(0.02) ND(0.02) ND(0.02) ND(0.02) ND(0.02) ND(0.02)
Cadmium (Cd) (mg/L) 0.003 ND(0.02) ND(0.02) ND(0.02) ND(0.02) ND(0.02) ND(0.02)
Cobalt (Co) (mg/L) NC ND(0.02) ND(0.02) ND(0.02) ND(0.02) ND(0.02) ND(0.02)
Chromuim (Cr) (mg/L) 0.05 ND(0.02) ND(0.02) ND(0.02) ND(0.02) ND(0.02) ND(0.02)
Total Cyanide (CN) (mg/L) 0.07 ND(0.01) ND(0.01) ND(0.01) ND(0.01) ND(0.01) ND(0.01)
Abbreviations/Symbols
* Based on World Health Organization (WHO) Drinking Water Quality Guidelines (2006)
-- Not analyzed.
NA Not applicable.
NC No criteria established.
ND (0.2) Not detected at detection limit identified in parentheses.
3.7 Exceeds the established primary criteria
When compared with historical water quality data collected during mining
operations, the results of this study show an improvement in water quality. However, it
is important to recognize that samples were collected after the mine had been closed for
eight months. Additionally, samples were collected during the dry season (May to

100
November). Waterways probably experienced heavy sediment and water movement
during the wet season, which lasted for several months following the mine closure
(December- April). This movement probably caused a large degree of natural
remediation of metals, while cyanide was likely largely evaporated as HCN gas. For
example, many common arsenic compounds can dissolve in water, but over time the
majority of As will be present in sediment rather than in water (Agency for Toxic
Substances and Disease Registry, 2007). Given the large volumes of mine wastes
discharged into the river during operation, a significant degree of natural remediation
appears to have occurred in surface waterways, however, conclusions cannot be drawn
from this study regarding the potential contamination of sediment.
Results also indicate that natural processes of remediation have led to an
improvement in water quality in the old tailings dam near Nademo (Slime Dam). This
is a positive indicator of the potential of all of the former tailings dams for successful
rehabilitation through a program of re-vegetation and monitoring.
Residents are currently using the old tailings dam at Nademo for fishing.
Although some fish accumulate arsenic in their tissues, most of this arsenic is in an
organic form called arsenobetaine (commonly called "fish arsenic"), which is less
harmful (Agency for Toxic Substances and Disease Registry, 2007). A recent study by
the University of the South Pacific found that arsenic consumption in Fiji is already
close to the provisional tolerable weekly intake (PTWI)4, however, this study only
4 A Maximum Allowable Daily Body Load (MADL) of total arsenic of 50 µg/kg bw/day was set in 1967 by WHO, however, more recently the Joint FAO/WHO Expert Committee on Food Additives (JECFA) set a PTWI of 15 µg/kg bw/week for inorganic arsenic, the more toxic form (Aalbersberg, 2007).

101
tested for total arsenic, while the toxic form is inorganic arsenic (Aalbersberg, 2007).
The report recommended that further study of the inorganic and organic arsenic levels
in fish in Fiji be undertaken as a priority matter (Aalbersberg, 2007). Additionally, the
risk of mercury and other heavy metal contamination in fish from the tailings dam has
not been assessed. It is thus recommended that a study of the safety of fish for human
consumption be undertaken at the tailings dam at Nademo and in all of the waterways
in the Vatukoula region as a priority matter. This is an important issue because
variations in pH could potential mobilize additional metals into waterways in the
future. pH levels were not tested as part of this study, but given the lack of metal
detections, it is unlikely that pH levels in surface and drinking water were acidic at the
time samples were collected. However, when mining operations resume, excessive
sulfur dioxide emissions from the roaster stack could potentially create acidic surface
water conditions. pH measurements should thus be an integral part of future
monitoring programs.
Although the samples of drinking water tested as part of this study did not
exceed WHO drinking water guidelines, the study cannot be considered a substitute for
a comprehensive Environmental Impact Assessment (EIA). Despite the fact that
untreated water is drawn from upstream of the contaminated Nasivi River sample site
(003), it cannot be concluded from this study that all untreated water drawn from
upstream is necessarily safe from contamination of metals and/or cyanide. During past
mine operations, when wastes were routinely discharged into surface waterways, the
risk of heavy metal and cyanide contamination was much higher than the current post-

102
closure risk. The 1994 environmental audit conducted by Sinclair Knight & Merz
found that “maintaining human drinking water quality at the point of discharge is an
unrealistic expectation (Sinclair Knight Merz Pty Ltd, 1994).” It is thus recommended
that signs be clearly posted if future discharge occurs, advising people not to drink from
streams and rivers in the Vatukoula area. Now that Westech has resumed mining
operations, a consistent environmental monitoring program and a full EIA must also be
undertaken.
8.3. Hydrogen-Sulfide Testing for Bacterial Contamination
Nine samples and one control sample (a total of ten) were tested for the risk of
bacterial contamination. Using the H2S Color Code provided by the WHO, eight out of
nine samples were coded as noticeably black (+++) by the end of the three day
observation period, indicating a high level of risk of bacterial contamination.
Table 9: Hydrogen-Sulfide Water Quality Testing Results
These samples were collected from both surface water and tap sources. One of
the samples was taken from a tap inside a residence in the Nasomo settlement. This
was a source which residents insisted was safe, because it came from the mountains.

103
Two other samples were actually boiled water that residents were drinking from tea
cups at the time of testing. The only remaining sample that was not coded a (+++) was
coded as (+), a slight change to grey color, indicating a slight possibility of bacterial
contamination.
H2S test results indicate that the majority of drinking water sources available to
Vatukoula residents are not safe for human consumption due to the high risk of
bacterial contamination. Residents must take care to boil water, including water
originating from taps. Residents must also take care to avoid cross-contamination,
which may originate from contamination on hands, taps, or dishes. Because the H2S
test kits area readily available from WHO, it is recommended that a longer term
monitoring program be undertaken. This program could potentially be administered
initially with the help of the U.S. Peace Corps volunteer based in Tavua town. The
program could then be continued by local residents under the direction of the
Vatukoula Community Consultative Committee. WHO also provides an easy to use
Sanitary Survey Sheet, which may be used in conjunction with the H2S testing, to assist
in identifying the potential source of contamination for a particular water source.
8.4. Impacts of Mine Closure
The closure of the Vatukoula gold mine served to accentuate and accelerate the
already existing social, environmental, and economic consequences of mining, and was
indeed a very important risk, unforeseen to many. The impacts of the mine closure are
evident throughout Fiji, beginning at the local level in the Vatukoula community itself,

104
continuing to create regional effects, especially on the nearby town of Tavua, and
finally extend ing to the national level, where all Fijian citizens are concerned.
Local Impacts
Although three generations of experienced miners, engineers, and
administrators were trained as a result of mining operations, little was done to prepare
these workers for alternative livelihoods after the mining industry. Few locals held
upper level management positions and the vast majority of those affected by the mining
closure were underground miners. Forced to leave the only job they had even known,
over a thousand mine employees, many of whom were the primary income earners for
their families, were suddenly left to search for alternative ways to earn a living. Most
were forced to look outside their home community for work, and the majority of able-
bodied men left to find work cutting sugar cane. These men had to leave their families
for months at a time, causing considerable social disruption. One resident explained his
concerns at a community meeting with the mayor of neighboring Tavua town,
“…there are consequences, and when I say consequences, it’s sad, because we
have family problems. When I say family problems that’s where the father goes and
works somewhere else, and he never comes back. He’s looking after another family
now, and their kids during this period of time are looked after by a different father or a
different mother, and that’s the consequence I’m talking about (Vatukoula resident,
personal communication, July, 28, 2007).”

105
Furthermore, cane cutters are paid a dismal wage in Fiji. While mining wages
were not high by any standard, ranging from approximately F$1.75/hr to F$4.17/hr for
skilled machine mining, groups of several men cutting cane are paid approximately
$13/ton. These groups of men are able to cut close to two tons per day and split the
per-ton payment resulting in a wage of only F$2-3 per day (Vatukoula resident, name
withheld, personal communication, July 28, 2007). Even with these earnings, some
men work for months without bringing any money home. After deductions for
transportation, food rations, and housing, these men come home with no money at all.
“My husband is there, one month today, one month today, he never bring any
money here (Solute Marama, personal communication, July 28, 2007).”
Those who chose to stay in Vatukoula resorted to subsistence farming, planting
taro roots, cassava, and other vegetables. However, the residents of Vatukoula do not
own their own land and are thus primarily confined to small, piecemeal, or
marginalized areas for farming. Additionally, most were not able to purchase sugar,
flour, and other staples without their regular income. Others, who had the option,
became taxi drivers. But these men were forced to drive long distances to other cities
to find work. One resident elaborated on some of the difficulties related to working far
from home:
“You have to wake up at 5am in the morning…sometimes I go and my kids
never wake up…I was getting more at the mine (J. Narayan, personal communication,
July 31, 2007).”

106
Residents reported that finding the money to feed their children became
exceedingly difficult just weeks after the mine closed. Romeo Kivi, a member of the
Vatukoula Community Consultative Committee, explained that there were many
children whose families could no longer supply them with lunches for school (R. Kivi,
personal communication, July 28, 2007). The 2007 government profile of the
Vatukoula Primary School indicated that approximately 26% of students were affected
by moderate or severe under nutrition in 2007 (Anjali et al., 2007). According to the
Head Teacher, many female students between the ages of 10-13 were also depressed
and under stress due to inadequate breakfasts and lunches (Anjali et al., 2007).
Salote Marama, the women’s representative on the Vatukoula Community
Consultative Committee spoke about some of the specific concerns of women at the
community meeting,
“Men do not know what is the problem in the house…it’s hard for us to share it
out. I think no other women can speak it out this morning. The fathers they do not
know anything about this, it’s us the mothers. Sometimes it’s hard for us to us to
explain to our child, oh, we’ve got no money, you just got to school without food. Us
women we cry everyday…for our children (Salote Marama, personal communication,
July 28, 2007).”
A small minority of people did report that they were able to maintain a similar
standard of living before and after the closure of the mine. In fact, women who were
never employed in the mining industry represented the few who were able to earn a
living. Lepanoni Naivuqa, the wife of a former mining supervisor, was able to earn a

107
modest living selling kava, a traditionally important beverage in Fiji, in the markets (L.
Naivuqa, personal communication, July 22, 2007). Another woman took advantage of
government training to start a small bakery business that was locally successful (Salote
Marama, personal communication, August 1, 2007). The government did provide
F$600,000 worth of assistance, including small business training, which was attended
by 604 people (Ministry of Youth: Government of Fiji, 2007) . However, this training
was only provided after the mine closure. Furthermore, the effectiveness of this
training has not been well established. Starting small businesses in a severely
economically depressed community where people have no disposable income can only
realistically be successful to a certain extent. Local government officials reported that
they willingly withheld business licenses because they believed the licenses were being
misused. One official claimed that people only applied for the licenses to use the start-
up money for immediate expenses (D. Chand, personal communication, July 2007).
Other residents reported that most people who attended the training were only
interested in the per diem cash payment that was given to each attendee, and never felt
they would start their own business (Salote Marama, personal communication, July 31,
2007).
In general, the more highly trained employees (such as engineers), who were a
minority in the workforce, were able to find work in industries overseas or locally in
the tourism industry (R. Venkalesh, personal communication, July 30, 2007).
“In Fiji, compared to other industries…technology wise, Emperor was the best.
(R. Venkalesh, personal communication, July 30, 2007).”

108
In this way, the mining industry provided valuable technical training and skills
for some employees, which, if locally retained could be seen as a valuable investment
in human capital. However, the same former employee explained that his work at
Emperor adversely affected his health, representing a decrease in human capital,
“Working at the HCL pump, it wasn’t good for our health. I was really
hospitalized in 2005 for a good four months…because of my work. In fact I was told by
the doctors I was sick because of my work, because of working in the HCL pump (R.
Venkalesh, personal communication, July 30, 2007).”
One of the community’s most pressing concerns was, and still remains, the issue
of substandard housing and the need for relocation post-closure. The mining industry
could have made a significant contribution to local built capital in the form of housing;
instead many of the structures that were created in the 1930’s have only deteriorated
and in fact have become liabilities. The land underlying all the Vatukoula communities
is freehold land, which prior to the sale of the mine, was owned by EML. However,
several years ago, EML began selling the houses to employees and their families,
without selling the land beneath the houses. Families entered into contracts with EML
that required them to take down their houses and move when they no longer worked for
the mine (A. Wesson, personal communication, August 15, 2007). Indeed, EML gave
employees three months notice to vacate their houses following the closure of the mine.
However, the houses are now worth little or nothing without the mining operations, and
the families have nowhere else to go. Thus, the contract terms have now proven to be

109
unrealistic, and hundreds of former employees are currently living in dilapidated houses
on company land.
Open-ended survey responses revealed that residents were also very concerned
about the lack of medical care available in Vatukoula after the mine closed. The
community was served by medical professionals who were employed by the company
and these doctors and nurses left when the mine closed. This situation could have been
avoided if the company and government worked together to plan for government
medical services equivalent to those provided in other areas of Fiji. There is also a
conflict of interest if company medical services are the only health services available to
residents. This is another reason why the availability of government medical services is
critical. The population of the Vatukoula region is large enough to warrant a public
health center, however, the former company (EML) did not allow such a facility to be
built on their private land (Timothy Young, personal communication, August 9, 2007).
Regional and National Impacts
The neighboring town of Tavua, which also developed as a result of the mining
industry at Vatukoula, experienced a similar economic and social shockwave with the
closure of the mine. Tavua, by all accounts, is totally dependent on the mine. Although
Westech is resuming operations at Vatukoula, employment levels will never return to
their former height and the mine will eventually close again. If Tavua does not develop
alternative sustainable industries the town will not thrive.
110
The town of Tavua is located only a few kilometers downstream of the mine,
along the Nasivi River. It is therefore also susceptible to the environmental risks
associated with gold mining. However, the mayor expressed his concern that the
community felt totally unprepared for a potential release of mining wastes or a tailings
dam failure. In fact, it was his perception that Emperor had actually tried to conceal
information from the public regarding environmental releases in the past (C. Singh,
personal communication, August 3, 2007).
The mayor described the town’s situation approximately six months after the
mine closure as,
“…quite a desperate situation (C. Singh, personal communication, August 3,
2007).”
He explained that the town was given absolutely no notice from the company
that the mine would close. EML admitted to him that in Australia the company be
required to give one year’s notice if they were going to close a mine of similar
magnitude, and that they would not do the same thing back home (C. Singh, personal
communication, August 3, 2007). The mayor specifically described the following
impacts of the mine closure on the town of Tavua:
• an estimated F$75 million in lost revenues, including F$25 million in
annual wages, and F$42 million in service providers; and
• a drop in business of 60%.
Most families, after living without any significant income for over six months,
were in very difficult financial situations. During his six years as mayor, Chandra

111
Singh approached the interim government repeatedly for assistance in developing
alternative industries, including the creation of tax-free zones or concessions, but he did
not feel that enough was being done,
“…the current government lacks the political will to do it (C. Singh, personal
communication, August 3, 2007).”
According to Sada Reddy, the Deputy Governor of the Reserve Bank of Fiji,
F$50-$60 million in export earnings were lost during the period the mine was closed
("$50 Million Lost in Mine Closure," 2007). With the closure of the mine occurring
just one day after the December, 2006 military coup, it is no surprise that it was
challenging for the interim administration to respond quickly to the needs of the
Vatukoula community. A committee was established to examine the impacts of the
mine closure. The chair of the committee was the Permanent Secretary for the Prime
Minister’s office, and other members included the Ministries of Labor, Environment,
Health, Social Welfare, and Education (E. Nasome, personal communication, August 9,
2007). The sudden closure of the mine also challenged the wherewithal of the Mineral
Resources Department (MRD). For example, because of the shortcomings of the
environmental monitoring process, the MRD was forced to go back to the company
(EML) to retrieve important environmental data post-closure (E. Nasome, personal
communication, August 9, 2007). This data was necessary for the MRD to make an
accurate assessment of the impacts of the mine and the associated rehabilitation that
may be required.

112
8.5. Mining in Fiji and the Natural Resource Curse
Although Fiji has achieved some level of economic diversification, a closer
examination of the mining industry in isolation reveals an experience plagued by many
of the common pitfalls associated with the natural resource curse. Unfortunately for
Fiji, when Emperor announced the sudden closure the mine the morning after the
country’s fourth military coup within two decades, a number of serious challenges
related to the sale and negotiation process were created for the interim administration.
The negotiation process relating to natural resource contracts is usually dependent on
time-sensitive factors. The changing price of the resource, and perhaps more
importantly in Fiji’s case, the current economic and political conditions in the country
are critical factors which influence the negotiation process (Radon, 2007).
Immediately following the initial shut down of operations at Vatukoula, EML
stated that the company intended to keep the mine under a care and maintenance
program, and conduct further exploration before selling the mine (Gordon, 2007).
However, they claimed that the presence of the military at the mine site beginning in
January, 2007 compromised their ability manage the mine and this placed an additional
financial burden on the company. The company stated that this military presence,
combined with conditions imposed by the interim government after a subsequent
cabinet meeting (that EML claimed would cost the company more than FJD $51
million) led the company to sell the mine shortly after it was shut down (Gordon,
2007).

113
By any account, the sudden and significant unemployment created by the
closure of the mine made negotiating an agreement with a new mining company a
pressing task. This was not an unfamiliar situation for the government of Fiji.
Beginning in the 1950’s, the government granted an increasing number of concessions
to EML and its principal Fiji subsidiary, Emperor Gold Mining Company Ltd. (EGM)
(Grynberg et al., 1997). The desire to maintain levels of employment at Vatukoula was
a significant factor in the series of concessions that were granted to Emperor over the
next three decades, which reached their height with the signing of the VTA in 1983,
after which EML and EGM paid negligible amounts of tax and royalties (Grynberg et
al., 1997). In their 1997 financial analysis of EGM and EML, Grynberg et al. showed
that EML, domiciled in the tax haven of the Isle of Man, reported profits of
approximately A$50 million for the period 1986-1992 and a return on assets of
approximately 12%, clearly demonstrating that the Vatukoula operations were
profitable (Grynberg et al., 1997). However, while the operations were profitable, the
company paid little or no tax. The VTA provided the necessary conditions for this to
occur, by offering concessions on all of the taxable portions of mining revenues,
including income tax, royalties, customs duty, and fiscal duty (replaced in 1992 by a
general goods and services tax) on imported chemicals and explosives, the only
exception being export tax (Grynberg et al., 1997).
With a history of subsidizing mining operations, the government was finally in
a position to renegotiate a better deal with the new mining company, however, the
timing and conditions of the negotiations left the government in a weakened bargaining

114
position. The problems began with the sale of the mine to Westech, a small newly
incorporated company, owned by Brian and Amelia Wesson, who were actually former
Vatukoula residents. In fact, Brian Wesson was previously employed by the former
owners, EML, as chief engineer for a period of seven years (A. Wesson, personal
communication, August 15, 2007). Thus, it appeared that the new company had an
information advantage when purchasing the mine. Similar conditions of asymmetric
information have been a documented to cause resources to be sold at lower values
during the privatization and bidding processes (Radon, 2007). Although this case
differs because the mine ownership was being transferred between private entities, the
timing of the sale, coupled with an informational advantage on the part of Westech, at
the very least allowed the new company to enter into the negotiation process in a
powerful position. The government did make one attempt to secure a better deal by
placing an ad in the Fiji Times for expressions to operate the Vatukoula mine on
August 4, 2007 (Department of Lands and Mineral Resources, 2007). However, the
fact that Westech had clearly been associated with the former owners surely did not
encourage other interested parties to submit bids that would lead to the best deal for the
mine (Radon, 2007). The sale eventually took place through the legal transfer of all
assets and liabilities from EML to Westech (estimated at over FJD $20 million), with a
cash check issued by Westech to EML for a total of AUD $2.00 (A. Wesson, personal
communication, August 15, 2007).
Further empowering Westech, the interim administration’s negotiating team
probably did not have the technical expertise to successfully argue for its fair share of

115
the remaining resources at Vatukuola. The team did not include key members of the
Fiji Mineral Resources Department (MRD), many of whom held valuable technical
expertise (I. Fong, personal communication, August 9, 2007). Information about the
negotiations was also not available publicly, even though the Vatukoula community
expressed repeatedly that it wished to be involved in the negotiation process. The
Vatukoula community indeed holds a wealth of technical expertise, having produced
three generations of experienced miners and engineers. Community advocates were
reportedly pressured by police officers and the military to stop speaking out about
community concerns relating to the lack of transparency in the negotiation process
(Ravula, 2007).
The negotiations eventually resulted in key concessions to Westech, including:
• a reduction in royalty from 6% to 3% on ore extracted for five years;
• exemption from import duties for two years on automotive diesel oil or
industrial diesel oil imported for use in relation to the operation of the
mine at the national rate;
• exemption from export taxes for a period of 5 years;
• exemption from fiscal duty for a period of 3 years on importation of all
plant equipment, machinery and motor vehicles required to conduct
operations; and
• eligibility to seek an exemption from paying withholding tax on
overseas payments of interest on loans, consultant’s fees, and dividends
116
to shareholders in accordance with Fiji’s Income Tax Act (River
Diamonds PLC, 2007).
In another important concession, Westech was not required to post a bond for
future environmental damage. Westech stated that,
“…we’ve got all this money that we have to pay right now, it’s not a good time
for us to put any more money into a fund for rehabilitation later on, at this stage, we
need money to do the mining (A. Wesson, personal communication, August 15, 2007).”
In return for these concessions, a Community Rehabilitation and Social
Assistance Deed (RASD) was signed, in which Westech agreed to contribute to
rehabilitation of certain social and environmental issues at Vatukoula. However, the
specifics of this deed have not been released publicly by the interim administration.
Amelia Wesson did disclose in an interview that the assistance called for under the
RASD amounted to approximately FJD $6 million (A. Wesson, personal
communication, August 15, 2007). In addition Westech will refund to the government
the expenditures incurred for care and maintenance since May, 2007 which amounts to
approximately FJD $5.4 million (River Diamonds PLC, 2007).
It follows from the above analysis that, as a result of the timing of the closure
(and the associated economic and social pressures to resume mining operations), a lack
of appropriate negotiation and technical expertise on the part of the interim
administration, a lack of public participation and transparency during and after the
negotiation process, and the conditions of the mine sale to a company with an

117
informational advantage, the government again failed to secure the best deal for the
remaining gold resources at Vatukoula. This is evidence that the country did fall into
one of the major traps associated with the resource curse – foreign companies having
the upper hand in negotiations (Radon, 2007). Additionally, while not directly linked
to mining as a result of this study, Fiji’s history of four military coups in the past 20
years, weakened democratic system, and the military intervention at the mine are also
issues commonly attributed to the resource curse. In a larger sense, however, Fiji was
able to escape the more severe resource curse fate. Unlike its close island neighbor,
Nauru, which was totally dependent on phosphate mining for economic development
(McDaniel & Gowdy, 2000), Fiji also derives wealth from tourism, agriculture and
several other small economic sectors. This has allowed the country to escape the
dismal fate it may have encountered if gold was the sole source of national wealth.

118
CHAPTER 9: CONCLUSION
This was the first risk-perception study conducted in both the cultural context of
Fiji and the industrial context of gold mining. As such, all of the survey results are
valuable to a more informed discussion about risk communication and management at
Vatukoula. Furthermore, research has shown that two of the major principles of
effective risk communication are: 1) understanding and addressing audience concerns,
and 2) whenever possible, account for existing beliefs and perceptions (Lundgren &
McMakin, 2004). The results of this study may thus also serve as a preliminary step in
the development of a more effective audience-tailored risk communication program.
A prominent finding of this study is that gender is an important variable in risk
perception at Vatukoula. More specifically, women feel they have less knowledge
about the environmental and health risks of mining compared them men, women feel
they have less control to avoid the risks than their male counterparts, and women tend
to find information about the risks from secondary sources. Institutional and cultural
structures have contributed to this particular form of marginalization of women in
Vatukoula. The traditional roles and status of women in mining communities have
changed, placing women in a position of weakened economic and social power relative
to men in Vatukoula. The Fiji government has endorsed MDG #3, to promote gender
quality and the empowerment of women, and has developed a Strategic Development
Plan (SDP), which includes five major goals for gender and development. The first of
these goals is “to mainstream gender perspectives, issues and concerns in the planning
process (Asian Development Bank, 2006).” If disseminated and applied, the results of

119
this study can contribute to the mainstreaming of gender issues, because they highlight
the key differences in the perceptions of men and women regarding the risks of mining,
both during mining and post-closure. The following sections include many
recommendations specifically targeted at addressing the gender differences in risk
perception identified in this study. Incorporating these recommendations into future
mining activities will be critical if the citizens of Fiji wish to fully realize their stated
development goals, particularly as they relate to gender equality and empowerment of
women.
9.1. Recommendations for Risk Communication and Management
Perhaps the most important obstacle to effective risk communication at
Vatukoula is the existing level of distrust that has developed between the community,
the former mining company, and the government. However, because the mine was
recently purchased by a new company, this challenge may also be a golden opportunity
to build a new reputation of openness and trust. For this to be the case, the new
company must start from the very beginning with a well-planned and open commitment
to risk communication. Timely and full disclosure of risk-related information will be
crucial to this transition. It may be helpful to invite a credible organization which is
trusted by the community, such as a civil society group that has not yet been involved
in any of the past conflicts at Vatukoula, to participate as a partner in a new risk
communication program. It is critical that the community view the source of risk

120
information as credible, and a partner organization may help in the transition to a more
trusting relationship (Lundgren & McMakin, 2004).
One potential source of distrust arises from a conflict of interest that exists in
the environmental monitoring process at Vatukoula. The Mineral Resources
Department (MRD) is the agency that is responsible for monitoring the environmental
impacts at Vatukoula, but it is this same agency that is responsible for promoting the
mineral industry in the country (E. Nasome, personal communication, August 9, 2007).
This conflict of interest has the potential to further increase distrust of authorities when
it comes to full disclosure of risk. In order to correct this situation, the environmental
monitoring component of the MRD must be separated. This monitoring could instead
be facilitated through monitoring agents under the recently passed Environment
Management Act of 2005.
The former environmental officer for the mining company reported that
community meetings were held on a monthly basis to address community concerns
related to environmental risks, through an initiative called the Community Visitation
Program. However, these meetings only achieved an approximately 30% attendance
rate (J. Feresi, personal communication, July 16, 2007). In another conflict of interest,
residents reported concern that the environmental officer was ultimately paid by the
company, and thus had motives other than purely protecting the environment. While
little is known about the content and conduct of the Community Visitation Program, it
is clear from the low level of attendance and lack of community knowledge about risks
that it was not highly successful. It has been demonstrated that risks can be

121
downplayed in public gatherings, and that moderation and careful planning is required
when group interactions relating to risk communication are to take place (Fessenden-
Radon et al., 1987). Specific strategies that may be employed to improve the efficacy
of such meetings include the following:
• An appropriate time and place that is not associated with any negative
feelings for the participants must be selected (Lundgren & McMakin,
2004). In the case of Vatukoula, this may mean having meetings away
from company property, perhaps rotating between the various vale-ni-
koro (community halls);
• Make sure all participants have a clear idea of the purpose and
objectives of the meeting in advance. This could be accomplished
through written notice to all households (addressed to the entire family,
not just the mine employee) or through the various turaga-ni-koro
(traditional village leaders) and through women’s groups (soqosoqo
vakamarama);
• Westech (the current company) should demonstrate support for the
group by providing the necessary financial and technical resources for
the meetings, including training of meeting facilitators and moderators;
• Citizen’s groups and the MRD may be able to offer additional resources,
particularly to bolster technical and facilitation training needs; the
elected members of the Vatukoula Community Consultative Committee

122
(a community group formed to represent community interests in the
mining town) may be able to serve as moderators of these meetings if
training was provided;
• Guidelines should be established for communication and organization,
i.e. Who will facilitate and mediate the meeting? Will decisions be made
by written ballot or a show of hands? Who will make decisions?
(Lundgren & McMakin, 2004); and
• Specific attention should be paid to the inclusion of women at every
stage of the risk communication process, including adequate and full
notification of women regarding meeting times/venues, and separately
allocated time for women to voice concerns and questions.
A firm commitment to the inclusion of gender considerations in the
development of future risk communication and management strategies will be critical
in addressing many of the gender inequities in risk-perception revealed in this study.
The new mining company should support and encourage the participation of women
during the development of new risk communication strategies. Women who participate
in strategic development can offer insights into the best outlets for communicating risks
to other women in Vatukoula. These insights will build upon the findings of this study
to create a knowledge base regarding the most effective methods of communicating
risks to a female audience. Financial resources and support should also be provided for
women who wish to attend regional workshops and conferences aimed at educating and

123
empowering women in mining communities. Finally, the Vatukoula Community
Consultative Committee membership should be expanded to include equal
representation of women and men. Currently the committee includes one female
representative; additional women should be elected to increase women’s access to, and
participation in, the decision-making process.
One specific risk which has not been effectively communicated to the residents
of Vatukoula is the risk of a tailings dam collapse or failure. There are six large tailings
dams located in the region. However, while failures and releases of similar tailings
dams have been documented worldwide (Akcil, 2006; Stenson, 2006), 77% of
respondents in Vatukoula reported not having a plan to deal with this risk. In response
to another question, 19% of respondents reported not knowing much about this
particular risk, and wanting to learn more, while 53% reported being “worried” about
the risk. This is clearly an area where risk communication could and should be
improved. Although signage was placed at tailings dams, most signs were reportedly
vandalized or removed, indicating that they have not been accepted by the community
(A. Wesson, personal communication, August 15, 2007). Clearly, this issue will not
have one simple solution, but must be addressed through the development of increased
trust and confidence in risk managers. Additionally, accurate and specific information
should be provided to all community members regarding the nature of the risks of
tailings dams, and this must be accompanied by a plan to address a potential disaster. If
accurate information is combined with a plan, then residents will feel that there is

124
something they can do to personally address the risk. This will potentially lead to
greater acceptance of future risk messages.
In addition to the intentional, official verbal and written risk messages that have
been sent by the authorities at Vatukuola, it is important to recognize that unintentional,
and non-verbal messages are also being sent. Indeed, unofficial risk messages can
sometimes have more impact that official messages, in part because they may appear to
respond to the real concerns people are facing, or are delivered by unofficial
messengers who are more trusted than their official counterparts (Fessenden-Radon et
al., 1987). One example of an unofficial risk message that may exist in Vatukoula
relates to drinking water quality. In Vatukoula socio-economic divisions have
historically existed according to race (Emberson-Bain, 1994). Today, many of the
poorest villages remain ethnically Fijian, while housing settlements with better quality
housing still belong to primarily ex-patriate, or ethnically mixed owners. The poorer,
often ethnically Fijian villages also have reduced access to treated water. Instead, these
areas are supplied with untreated drinking water directly from the Nasivi River. When
company officials and authorities drink a different source of water, this sends an
unofficial risk message that the untreated water is unsafe. These types of unofficial risk
messages must be recognized and addressed or eliminated wherever possible.
Fortunately, the new company has pledged to supply treated drinking water to all
villages and settlements, and this will represent a step in the right direction.
Due to cultural considerations, Fiji may also be particularly prone to the
challenge of collective interpretations of risk. These are another source of unofficial

125
risk messages that should be recognized and addressed. For example, residents in
Vatukoula perceive there to be a high incidence of asthma related to sulfur dioxide
emissions from the roaster stack. In fact, 82 % of residents reported that they felt that
air pollution was “somewhat or very likely” to have caused them health problems. As a
result, even those individuals who have not directly experienced asthma symptoms may
be less likely to accept official messages that sulfur dioxide is not responsible for
asthma (Fessenden-Radon et al., 1987). In Fijian culture, a high degree of respect and
trust are placed in traditional leaders (A. Emberson-Bain, personal communication, July
18, 2007). This means that if these local leaders are also affected by either personal or
vicarious experience, or by the inter-community grapevine, people may be more likely
to be influenced by the opinions of these leaders instead of risk messages from the
authorities.
General environmental education, specifically as it relates to mining could also
be an important long-term compliment to a risk communication program. There are
three primary schools and one secondary school located nearby the mine. Currently, no
environmental education is taking place in these schools. One teacher commented,
“We don’t know that it (mining) is a dangerous job, smoke coming in, sulfur
coming in, we just thought it was normal. But if there was advanced education on
mining, maybe it’s a different story (Vatukoula primary school teacher (name
withheld), personal communication July 22, 2007).”
A wide variety of educational outlets should be considered. An educational
video and website were created as part of this study; these resources represent two

126
forms of communication that have not yet been explored in this community context.
The projects could be considered as a test of these two communication outlets, and their
effectiveness could be gauged so that improvements and recommendations for future
projects may be developed.
Finally, there has been a relationship demonstrated between actual economic
dependence on an activity and lower levels of perceived risk associated with that
activity (Fessenden-Radon et al., 1987; Williams et al., 1999). Although this study did
not find a statistically significant difference in level of perceived risk between people
who had been employed by the mine and those who hadn’t, there was a trend towards a
slightly lower level of concern about certain risks among people who had been
employed by the mine. However, nearly all of the people who participated in this
study were economically dependent on the mine in some way, if not directly through
employment. As long as residents feel that there are highly limited alternatives to
living and working at Vatukoula, risks will likely continue to be downplayed and
underestimated. As such, an important compliment to any risk communication
program will be the continued commitment by government and local industries to foster
and develop viable economic alternatives to mining in the region.
An open dialogue must be established as soon as possible between the new
mining company, the community, and other stakeholders. This could represent an
important opportunity for the introduction of increased public involvement and an
improvement in the relationship and level of trust between stakeholders. The new
company has pledged to hire only local people for management positions, and this
127
would be a great way to begin getting respected and experienced local Fijian leaders
involved in the risk communication process (Radio New Zealand International, 2007).
In the cultural context of Fiji, having local leaders trained and placed in positions of
authority could be a great way to increase trust and confidence in the risk
communication process. However, it is critical that those authorities who will be
responsible for developing and implementing the risk communication policies have the
necessary technical training and the capability to translate this knowledge into terms
that can be understood by the general public. The new company has a responsibility to
provide this training; no risk communication program will succeed if authorities are not
trusted and viewed as technically competent.
If an increase in the number of management positions available to local people
occurs, it must also be ensured that women are encouraged to apply for and secure an
equal proportion of these management positions. The development of additional
training programs and scholarship opportunities aimed specifically at women, would
help build capacity. Improved access to employment opportunities for women at
Vatukoula will help address their lack of perceived control and lack of knowledge
about environmental and health risks.
Ultimately it will also be important in the case of Vatukoula, that a more in-
depth understanding of the perceptions and knowledge of the community be obtained.
The risk-perception survey performed as part of this study represents a first step in this
direction, however, further inquiries must be undertaken by the company and
government if effective risk communication strategies are to be developed. The

128
important role of the receiver of risk information, the Vatukoula community in this
case, must be fully recognized; strategies for communication of risks must subsequently
be tailored to the unique characteristics of this particular audience. The findings of this
research indicate a clear need for risk communication to be improved specifically for
women and residents who are not employed in the mine. These two groups appear to
seek out information about risks from secondary sources. Programs must be developed
which communicate risk information directly to these groups.
9.2. Lessons for Mine Closure and Transition
The inherently temporary nature of mining was overlooked in Fiji, or perhaps
intentionally pushed aside by some, until the time inevitably arrived when Vatukoula
was forced to close. Only then did it become clear that the economic, environmental,
and social impacts of the short-term venture could no longer be ignored. The
ramifications of inadequate planning for mining closure are now borne by the citizens
of Fiji. The residents of Vatukoula were totally unprepared economically and
otherwise for the closure of the mine. In a recent article for Islands Business, Parmesh
Chand, chief executive officer at the Prime Minister's office explained that Fiji learned
an important lesson regarding mining closure.
"The laws of Fiji are very broad in terms of mining closure. Mining companies
can just pull out and not meet their broader obligations in areas of environment,
alternative livelihood, care and maintenance (Tabureguci, 2007).”

129
Mr. Chand’s comment highlights an important lesson that comes from the
recognition of the phenomenon of the resource curse; legislation and institutional
structures must be strengthened before mining activities are undertaken (Stiglitz, 2007).
In Fiji’s case, this means that if the mistakes of the past are to be avoided, much work is
needed to strengthen tax and environmental legislation, and the institutional structures
necessary for the enforcement of such legislation, before further mining takes place. In
2005, Fiji passed the Environment Management Act, however, the specific standards,
manpower and court system needed to enforce the Act were not in place when the
negotiations with Westech were completed (Epeli Nasome, personal communication,
August 9, 2007). In addition to the potential long-term environmental consequences of
this lack of regulation, it also resulted in Westech not being required to conduct a
formal Environmental Impact Assessment (EIA) before beginning operations at
Vatukoula (A. Wesson, personal communication, August 15, 2007). This was an
important missed opportunity which may have negative consequences extending far
into the future.
Secondly, the negotiation process is always critically important when it comes
to resource extraction in developing countries. In this case, the concessions offered to
Westech will limit Fiji’s ability to capture and invest resource rents in other types of
capital far into the future (which is a fundamentally required for sustainable
development). It would certainly be prudent to seek out and employ expert negotiators
in future negotiations with mining companies, so that the majority of gold wealth is not
captured and exported overseas.

130
The contract being what it is, however, the government should now focus on
making carefully planned investments in education, including the communication of the
environmental and health risks of mining to communities in the Vatukoula region. The
government should also work with Westech and other companies in the region,
including Fiji Water, to make investments in alternative industries so that human and
social capital can be effectively utilized after mining. Tourism would be an intelligent
initial investment for the Vatukoula region. The mine is located along the road
between two major tourist hubs, Nadi and diving island of Nananu- i-Ra. During this
study, tourists expressed interest in potentially visiting a mining heritage site to learn
about the history and culture of the Vatukoula mine. Westech does have plans to create
an on-site museum and to employ the long-time strikers as storytellers (A. Wesson,
personal communication, August 15, 2007). The company also mentioned plans to
develop small scale tourism efforts aimed at the local hot springs in the region (A.
Wesson, personal communication, August 15, 2007). These attempts to develop
tourism could bring employment and financial benefits to the region while the
transition towards more sustainable industries is developed. In the longer-term, the
development of sustainable agriculture has enormous potential. Sugar cane is Fiji’s
primary agricultural good and developing sustainable methods of producing this
product could bring a sustainable source of income to the country, especially with a
developing international biofuels market.
Westech has promised to employ only local people in management positions at
Vatukoula, and this could be not only a socially responsible move, but also a great

131
investment in human and social capital for Fiji. Although mistakes have been made,
one advantage for Fiji now is the amount of mining expertise that the industry has
developed throughout the years. Experienced local Fijians successfully maintained the
mine, without pay, during the period of shut down. Particularly if more business and
management expertise were developed, there would be no reason why Fiji could not
operate its own mining company in the future. However, this may require leaving at
least a portion of their resources in the ground for some time, while capital (financial,
human, and social) is further accrued.
Presumably the issue of substandard housing and relocation will be addressed at
least partially in the RASD agreement. However, Westech admitted that the housing
issue is extremely complicated and will not be resolved with one simple solution.
Westech has proposed taking small steps to address the issue. They described a
potential program in which monthly village clean-up competitions would be held in
each village, with the winning village awarded a sum of approximately $500 to go
towards modifying and cleaning the village (A. Wesson, personal communication,
August 15, 2007). Although this may help relieve some immediate housing problems,
this solution does not address the underlying problem: wages are poor and employees
cannot afford to maintain their own homes. A certain level of responsibility is required
of a company if a mining operation is to be socially sustainable. If a private company
cannot or will not pay wages that allow workers to maintain a reasonable standard of
living, then it is unlikely that it will be socially sustainable in the long term. In
addition, the fact that Westech could not afford to post a bond for the rehabilitation of

132
potential environmental damages further indicates that the company is not prepared to
deal with the inevitable environmental and social consequences of the mining
operations it plans to undertake.
As international pressure for improved environmental and social performance
continues to increase, it will be advantageous for both the citizens of Fiji and Westech
if the company establishes a voluntary and transparent reporting policy, including
annual reports with full disclosure of social and environmental information. From a
business perspective, international campaigns aimed at exposing poor social and
environmental performance, such as the Oxfam Mining Campaign, draw negative
attention to the mining industry in Fiji. Additionally, the financial sector is paying
attention to corporate social responsibility, and mining companies have been excluded
from socially responsible investing funds (Jenkins & Yakovleva, 2006). It also became
clear during the negotiation process that the community itself is demanding increased
transparency, especially related to social and environmental performance. Westech
should thus follow the lead of many of the larger mining companies by establishing a
company website and beginning to publish annual sustainability reports.
Many valuable lessons may be drawn from the story of Vatukoula for other
mining communities throughout the world who wish to plan for longer-term sustainable
development. At the same time, Vatukoula itself has an opportunity to learn from past
mistakes and work towards improved environmental, social, and economic outcomes
during this time of transition. This will require a strong commitment from Westech and
the Fiji Government to work together in a cooperative and transparent manner. Such

133
cooperative stakeholder collaboration will compliment the effective implementation of
the recommendations which have resulted from this study.

134
COMPREHENSIVE BIBLIOGRAPHY
---. (2007, September 22). $50 million lost in mine closure. The Fiji Times Online. Retrieved September 23, 2008, from http://www.fijitimes.com
Aalbersberg, W. (2007). Better food for Fiji. Suva: University of the South Pacific. Agency for Toxic Substances and Disease Registry. (2006). ToxFAQs for cyanide.
Retrieved January 15, 2008, from http://www.atsdr.cdc.gov/tfacts8.html Agency for Toxic Substances and Disease Registry. (2007). Public Health Statement for
Arsenic. Retrieved February 4, 2008, from http://www.atsdr.cdc.gov/toxprofiles/phs2.html
Akcil, A. (2006). Managing cyanide: health, safety and risk management practices at
Turkey's Ovacik gold-silver mine. Journal of Cleaner Production, 14(8), 727-735.
Anjali, R., Jikowale, S., & Lata, S. (2007). Profile of Vatukoula Primary School - 2007. Asian Development Bank. (2006). Republic of the Fiji Islands, Country Gender
Assessment. Auty, R. M. (1998). Social sustainability in mineral-driven development. Journal of
International Development, 10(4), 487-500. Binns, T., & Nel, E. (2003). The village in a game park: Local response to the demise of
coal mining in KwaZulu-Natal, South Africa. Economic Geography, 79(1), 41-66. Bourque, L. B., & Fielder, E. P. (1995). "User-friendly" questionnaires and response
categories. In How to Conduct Self-Administered and Mail Surveys (pp. 41-92). Thousand Oaks: Sage Publications.
Bronfman, N. C., & Cifuentes, L. A. (2003). Risk perception in a developing country:
The case of Chile [electronic version]. Risk Analysis, 23(6), 1271-1285. Civil Appeal No. ABU0051 of 2004 (Fiji Islands Court of Appeal 2006). Clarke, J., Denman, R., Hickman, G., & Slovak, J. (2001). Rural tourism in Roznava
Okres: A Slovak case study. Tourism Management, 22(2), 193-202. Committee on Risk Perception and Communication, & National Research Council.
(1989). Improving Risk Communication. Washington D.C.: National Academy Press.

135
Connell, J. (2006). Nauru: The first failed Pacific State? [electronic version]. Round
Table, 95(383), 47-63. Costa, S., & Scoble, M. (2006). An interdisciplinary approach to integrating
sustainability into mining engineering education and research. Journal of Cleaner Production, 14, 366-373.
Davidson, D. J., & Freudenburg, W. F. (1996). Gender and environmental risk concerns:
A review and analysis of available research. Environment and Behavior, 28(3), 302-336.
Davis, J. S. (2005). "Is it really safe? That's what we want to know": Science, stories, and
dangerous places. The Professional Geographer, 57(2), 213-221. Department of Lands and Mineral Resources. (2007, August 4). Vatukoula Gold Mine:
Expressions of Interest. The Fiji Times. Dillman, D. A. (2007). Mail and internet surveys: The tailored design method. Hoboken,
NJ: John Wiley & Sons, Inc. DRD Gold Limited. (2006). Annual Report: Group Structure and Performance.
Retrieved February 4, 2008, from http://www.drdgold.com/ir/files/annual/ar_2006/at_a_glance.htm
Dumaru, P. (2006). Fiji National Assessment Report : United Nations Department for
Economic and Social Affairs (UNDESA). Eiser, J. R., Hannover, B., Mann, L., Morin, M., Pligt, J. v. D., & Webley, P. (1990).
Nuclear attitudes after Chernobyl: A cross-national study. Journal of Environmental Psychology, 10(2), 101-110.
El Serafy, S. (1989). The proper calculation of income from depletable natural resources.
In Environmental Accounting for Sustainable Development (pp. 10-18). Washington, D.C.: The World Bank.
El Serafy, S., & Lutz, E. (1989). Environmental and resource accounting: An overview.
In Environmental Accounting for Sustainable Development (pp. 1-7). Washington D.C.: The World Bank.
Elliott, S. J., Cole, D. C., Krueger, P., Voorberg, N., & Wakefield, S. (1999). The power
of perception: Health risk attributed to air pollution in an urban industrial neighborhood. Risk Analysis, 19(4), 621-634.

136
Emberson-Bain, A. (1994). Labour and gold in Fiji. Cambridge England ; New York, NY: Cambridge University Press.
Emperor Mines Limited. (2007). Quarterly Report, December 2006 [electronic version]. Emperor Mines Ltd. (2006). Emperor Mines Limited Annual Report 2006 [electronic
version]. Environment Management Act (2005). Government of Fiji. Extractive Industries Transparency Initiative. (2007). EITI: Global Standard for Local
Transparency. Retrieved December 14, 2007, from http://www.eitransparency.org
Fessenden-Radon, J., Fitchen, J. M., & Heath, J. S. (1987). Providing risk information in
communities: Factors influencing what is heard and accepted. Science, Technology, and Human Values, 12(3 & 4), 94-101.
Fiji Government. (2007). Cabinet approves environment management regulations.
Retrieved February 5, 2008, from http://www.fiji.gov.fj/publish/page_10752.shtml
Fiji Islands Bureau of Statistics. (2007). Fiji Facts and Figures. Retrieved January 9,
2008, from http://www.statsfiji.gov.fj/Fiji Fiji Islands Bureau of Statistics. (2008). Fiji National Census of Popuation 2007.
Retrieved January 25, 2008, from http://www.statsfiji.gov.fj/ Fiji Mineral Resources Department. (1990). Discovery of Gold in Fiji. Retrieved
January 3, 2008, from http://www.mrd.gov.fj/gfiji/mining/gold/discgold.html Fink, A. (2003). How to Sample in Surveys (2nd ed.). Thousand Oaks, CA: Sage
Publications. Fischer, G. W., Morgan, M. G., Fischhoff, B., Nair, I., & Lave, L. B. (1991). What risks
are people concerned about? Risk Analysis, 11, 303-314. Global Witness. (2007). Global Witness: Corruption in oil, gas, and mining. Retrieved
December 14, 2007, from http://www.globalwitness.org/pages/en/corruption_in_oil_gas_and_mining.html
Glyfason, T. (2001). Natural resources, education, and economic development. European
Economic Review, 45(4-6), 847-859.

137
Godfrey, B. J. (1992). Migration to the gold-mining frontier in Brazilian Amazonia [electronic version]. Geographical Review, 82(4), 458(412).
Gordon, B. (2007, August 2). Emperor found way for a fair package to mine community.
The Fiji Times. Grynberg, R., Fulcher, P., & Dryden, P. (1997). Mining taxation in Fiji: the case of
Emperor Gold Mines [electronic version]. Economics Division Working Papers Retrieved October 4, 2006, 2006
Gustafson, P. E. (1998). Gender differences in risk perception: theoretical and
methodological perspectives. Risk Analysis, 18(6), 805-811. Hadden, S. G. (1991). Public perception of hazardous waste. Risk Analysis, 11(1), 47-57. Hicks, J. R. (1946). Value and capital (2nd ed.). Oxford: Oxford University Press. Horowitz, L. (2006). Mining and sustainable development. Journal of Cleaner
Production, 14(3-4), 307-308. Hotelling, H. (1931). The economics of exhaustible resources [electronic version]. The
Journal of Political Economy, 39(2), 137-175. Humphreys, M., Sachs, J. D., & Stiglitz, J. E. (2007a). Introduction: What is the problem
with natural resource wealth? In M. Humphreys, J. D. Sachs & J. E. Stiglitz (Eds.), Escaping the Resource Curse (pp. 1-20). New York: Columbia University Press.
Humphreys, M., Sachs, J. D., & Stiglitz, J. E. (Eds.). (2007b). Escaping the resource
curse. New York: Columbia University Press. International Council on Mining and Metals. (2006a). About ICMM. Retrieved
November 12, 2007, from http://www.icmm.com/about.php International Council on Mining and Metals. (2006b). The Challenge of Mineral Wealth:
Using Resource Endowments to Foster Sustainable Development. Synthesis of Four Case Studies: Finding and Recommendations. London.
International Cyanide Management Institute. (2006). Environmental and health effects of
cyanide. Retrieved January 15, 2008, from http://www.cyanidecode.org/cyanide_environmental.php
Jardine, C. G. (2003). Development of a public participation and communication protocol
for establishing fish consumption advisories. Risk Analysis, 23(3), 461-471.

138
Jasanoff, S. (1999). The songlines of risk. Environmental Values, 8, 135-152. Jenkins, H., & Yakovleva, N. (2006). Corporate social responsibility in the mining
industry: exploring trends in social and environmental disclosure. Journal of Cleaner Production, 14, 271-284.
Kasperson, R. E. (1986). Six propositions on public participation and their relevance for
risk communication. Risk Analysis, 6(3), 275-281. Kasperson, R. E., & Kasperson, J. X. (1996). Risk communication: the social attenuation
and amplification of risk. The Annals of The American Academy of Political and Social Science.
Keeler, R. F., & Tu, A. T. (1983). Plant and fungal toxins: Handbook of natural toxins
(Vol. 1): Marcel Dekker. Kumah, A. (2006). Sustainability and gold mining in the developing world. Journal of
Cleaner Production, 14(3-4), 315-323. Leiss, W. (1996). Three phases in the evolution of risk communication practice. Annals
of the American Academy of Political and Social Science, 545, 85-94. Lofstedt, R. (2003). Risk communication: pitfalls and promises. European Review, 11(3),
417-435. Lundgren, R., & McMakin, A. (2004). Risk communication: A handbook for
communicating environmental, safety, and health risks. Columbus, OH: Battelle Press.
Macdonald, I. (2004). Mining ombudsman case report: Vatukoula gold mine: Oxfam
Community Aid Abroad. MacGregor, D., Slovic, P., Mason, R. G., Detweiler, J., Binney, S. E., & Dodd, B.
(1994). Perceived risks of radioactive waste through Oregon: Results of a statewide survey. Risk Analysis, 14(1), 5-14.
Marris, C., Langford, I. H., & O'Riordan, T. (1998). A quantitative test of the cultural
theory of risk perceptions: Comparison with the psychometric paradigm. Risk Analysis, 18(5), 635-647.
McDaniel, C. N., & Gowdy, J. M. (2000). Paradise for sale: A parable of nature.
Berkeley: University of California Press.

139
McLeod, H. (2000). Compensation for landowners affected by mineral development: the Fijian experience [electronic version]. Resources Policy, 26(2), 115-125.
Meech, J. A., McPhie, M., Clausen, K., Simpson, Y., Lang, B., Campbell, E., et al.
(2006). Transformation of a derelict mine site into a sustainable community: the Britannia project. Journal of Cleaner Production, 14, 349-365.
Mineral Resources Department: Government of Fiji. (1990). Discovery of Gold in Fiji.
Retrieved January 3, 2008, from http://www.mrd.gov.fj/gfiji/mining/gold/discgold.html
Mineral Resources Department: Government of Fiji. (2004-2007). Quarterly Reports. Mineral Resources Department: Government of Fiji. (2006). Gold Statistics. Retrieved
November 13, 2007, from http://www.mrd.gov.fj Mineral Resources Department: Government of Fiji. (2008a). Geology of Fiji. Retrieved
January 8, 2008, from http://www.mrd.gov.fj/gfiji/geology/educate/geo_fiji.html Mineral Resources Department: Government of Fiji. (2008b). Mining and Geology in
Fiji. Retrieved February 5, 2008, from http://www.mrd.gov.fj/gfiji/ Ministry of Youth: Government of Fiji. (2007). Vatukoula EGM redundant workers
rehabilitation program 2007: Update. Suva, Fiji. Mitchell, P. (2006). "'The end of the beginning': The journey towards sustainable
development in the mining sector." World Mines Ministries Forum. Toronto, Canada. 4 March 2006.
Moodie, T. D. (1994). Going for gold: Men, mines, and migration. Berkeley, CA:
University of California Press. Mosley, L. M., & Sharp, D. S. (2004). The hydrogen sulfide (H2S) paper-strip test: A
simple test for monitoring drinking water quality in the Pacific Islands (No. 373). Suva, Fiji: South Pacific Applied Geoscience Commission (SOPAC).
Muezzinoglu, A. (2003). A review of environmental considerations on gold mining and
production. Critical Reviews in Environmental Science & Technology, 33(1), 45-71.
O'Connor, R. E., Bord, R. J., & Fisher, A. (1999). Risk perceptions, general
environmental beliefs, and willingness to address climate change. Risk Analysis, 19(3), 461-471.

140
Oishi, S. M. (2003). How to conduct in-person interviews for surveys (2nd ed.). Thousand Oaks, CA: Sage Publications.
Oxfam Australia. (2006). Mining Ombudsman Case Updates 2005 [electronic version].
Fitzroy. Oxfam Australia. (2008). Women and Mining. Retrieved February 1, 2008, from
http://www.oxfam.org.au/campaigns/mining/women/ Pegg, S. (2006). Mining and poverty reduction: Transforming rhetoric into reality. The
Journal of Cleaner Production, 14, 376-387. Peskin, H. M. (1989). Environmental and nonmarket accounting in developing countries.
In Environmental Accounting for Sustainable Development (pp. 59-64). Washington, D.C.: The World Bank.
Power, T. M. (2002). Digging to development?: A historical look at mining and economic
development. Boston: Oxfam America. Publish What You Pay. (2007). Publish What You Pay. Retrieved December 14, 2007,
from http://www.publishwhatyoupay.org/english/index.shtml Radio New Zealand International. (2007, September 12). New owners of Fiji goldmine to
replace expatriate management with locals. Radon, J. (2007). How to negotiate and oil agreement. In Escaping the Resource Curse
(pp. 89-113). New York: Columbia University Press. Ravula, P. (2007, September 8). Community wants the truth. The Fiji Times. Revenue Watch Institute. (2007). Revenue Watch Institute. Retrieved December 14,
2007, from http://www.revenuewatch.org/about/ River Diamonds PLC. (2007, August 20). Westech Gold Pty Ltd announces that Republic
of Fiji signs deed to restart operations at the Emperor Gold Mine. Press Release. Sachs, J. D., & Warner, A. M. (1997). Natural resource abundance and economic growth.
Unpublished Working Paper. Center for International Development and Harvard Institute for International Development.
Sachs, J. D., & Warner, A. M. (2001). The curse of natural resources. European
Economic Review, 45(4-6), 827-838.

141
Sadar, A. J., & Shull, M. D. (2000). Environmental risk communication: Principles and practices for industry. Boca Raton: Lewis Publishers.
Scheyvens, R., & Lagisa, L. (1998). Women, disempowerment and resistance: an
analysis of logging and mining activities in the Pacific. Singapore Journal of Tropical Geography, 19(1), 51-70.
Sechrest, L., & Sidani, S. (1995). Quantitative and qualitative methods: Is there an
alternative? Evaluation and Program Planning, 18(1), 77-87. Siegrist, M. (2000). The influence of trust and perceptions of risks and bene fits on the
acceptance of gene technology. Risk Analysis, 20, 195-203. Simtars. (2004). Final Report: Ambient Air Quality Monitoring Near Vatukoula Gold
Smelter. Queensland, Australia. Sinclair Knight Merz Pty Ltd. (1994). Environmental Audit of Emperor Gold Mines. Sjoberg, L. (1999). The psychometric paradigm revisited. Paper presented at the Royal
Statistical Society Conference, University of Warwick. Slovic, P., Fischhoff, B., & Lichtenstein, S. (1980). Facts and fears: Understanding
perceived risk. In R. C. Schwang & W. A. A. Jr. (Eds.), Societal risk assessment: How safe is safe enough? (pp. 181-216). New York: Platinum Press.
Slovic, P., Layman, M., & Flynn, J. H. (1991). Perceived risk, trust, and the politics of
nuclear waste. Science, 254, 1603(1605). Sokolowska, J., & Tyszka, T. (1995). Perception and acceptance of technical and
environmental risks: Why are poor countries less concerned? Risk Analysis, 15(6), 733-743.
Sondakh, L., & Jones, G. (2003). An economic survey of northern Sulawesi: Turning
weaknesses into strengths under regional autonomy. Bulletin of Indonesian Economic Studies, 39(3), 273-302.
Statement of the Pacific International Women and Mining Network Meeting. (2007). Stenson, J. (2006). Disaster management as a tool for sustainable development: A case
study of cyanide leaching in the gold mining industry. Journal of Cleaner Production, 14(3-4), 230-233.
Stiglitz, J. (2007). What is the role of the state? In Escaping the resource curse (pp. 23-
52). New York: Columbia University Press.

142
Tabureguci, D. (2007). Vatukoula Gold Sparkles No More [electronic version]. Islands
Business. The Mining Act, Chapter 146 (1978). Government of Fiji. Trumbo, C. W. (2002). Information processing and risk perception: An adaptation of the
Heuristic-Systematic Model [electronic version]. Journal of Communication, 52(2), 367-382.
United Nations, European Commission, International Monetary Fund, Organization for
Economic Co-operation and Development, & World Bank. (2003). Handbook for National Accounting: Integrated Environmental and Economic Accounting.
University of Otago Department of Geology. (2008). Metals in the New Zealand
Environment. Retrieved January 8, 2008, from http://www.otago.ac.nz/geology/features/metals/acidrockdrainage.html
Whitmore, A. (2006). The emperors new clothes: Sustainable mining? The Journal of
Cleaner Production, 14(3-4), 309-314. Williams, B. L., Brown, S., Greenberg, M., & Kahn, M. A. (1999). Risk perception in
context: The Savannah River Site [electronic version]. Risk Analysis, 19(6), 1019-1035.
World Commission on Environment and Development (WCED). (1987). Our common
future. World Health Organization. (2006). The Impact of Cancer: Fiji. Retrieved January 30,
2008, from http://www.who.int/ncd_surveillance/infobase/web/InfoBasePolicyMaker/reports/ReporterFullView.aspx?id=5
Wrigley, T. (2004). A report on short term ambient air quality monitoring within the
Vatukoula community: Australasian Pacific Environmental Consultants.
`
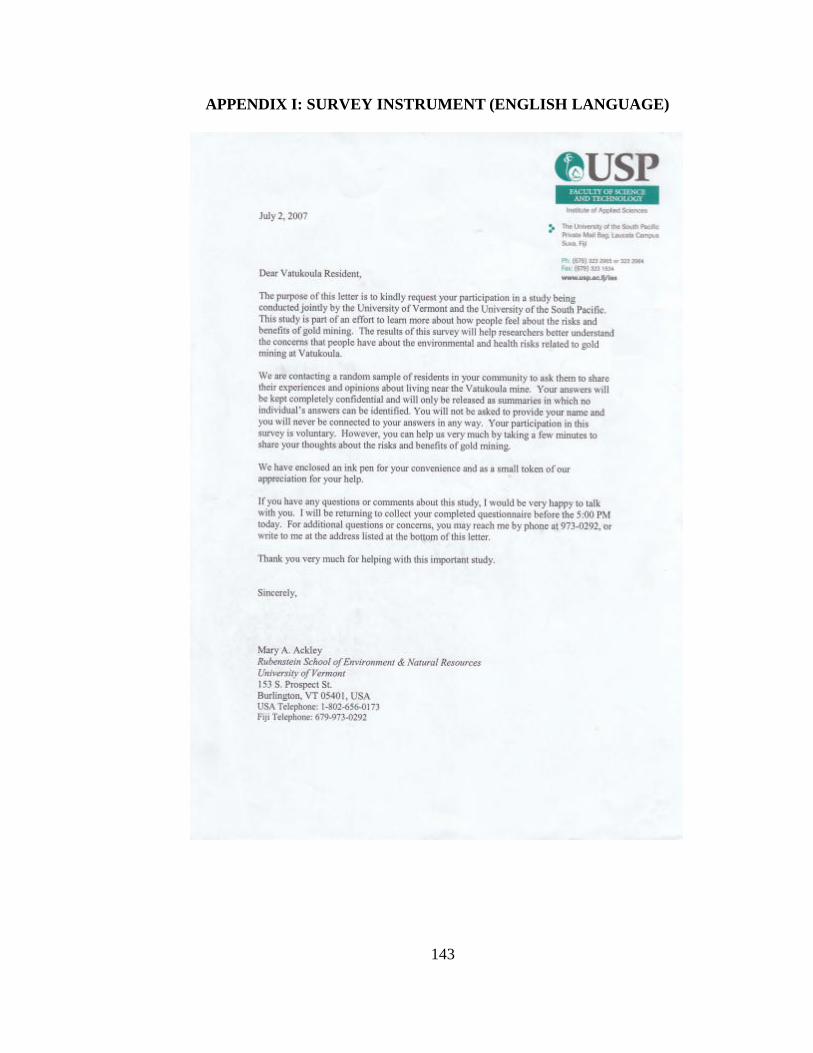
143
APPENDIX I: SURVEY INSTRUMENT (ENGLISH LANGUAGE)

144

145

146

147

148

149

150

151

152

153
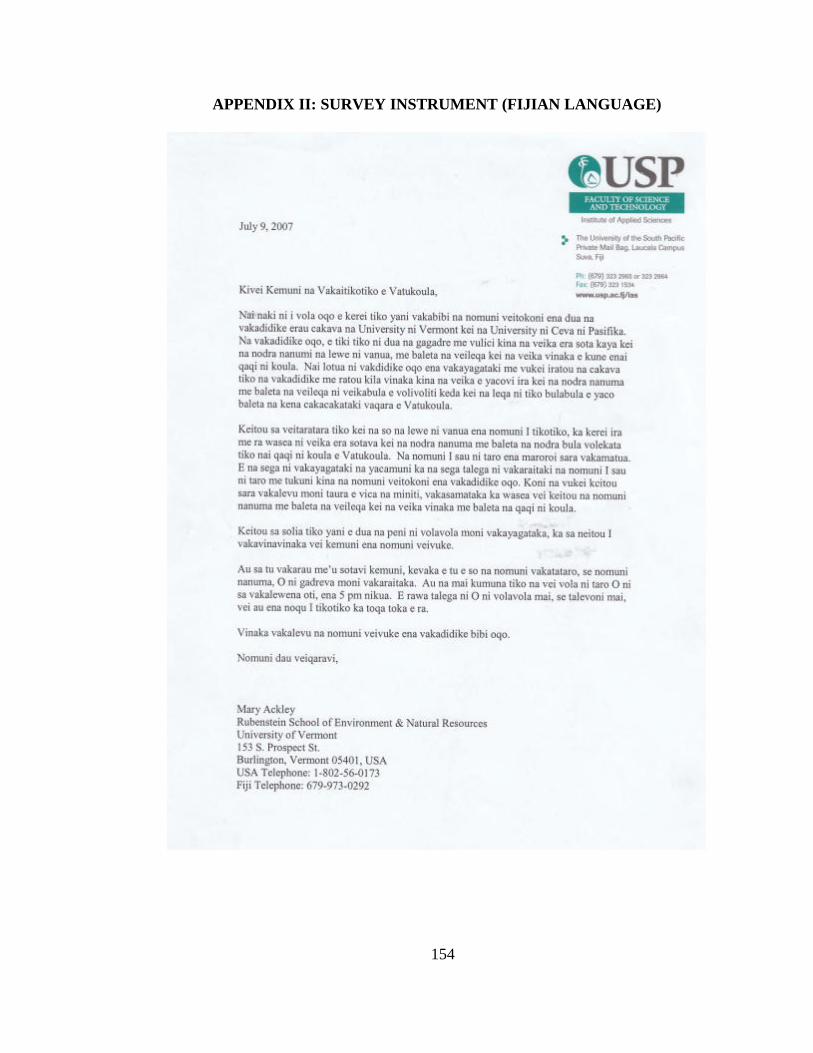
154
APPENDIX II: SURVEY INSTRUMENT (FIJIAN LANGUAGE)

155

156

157

158

159

160
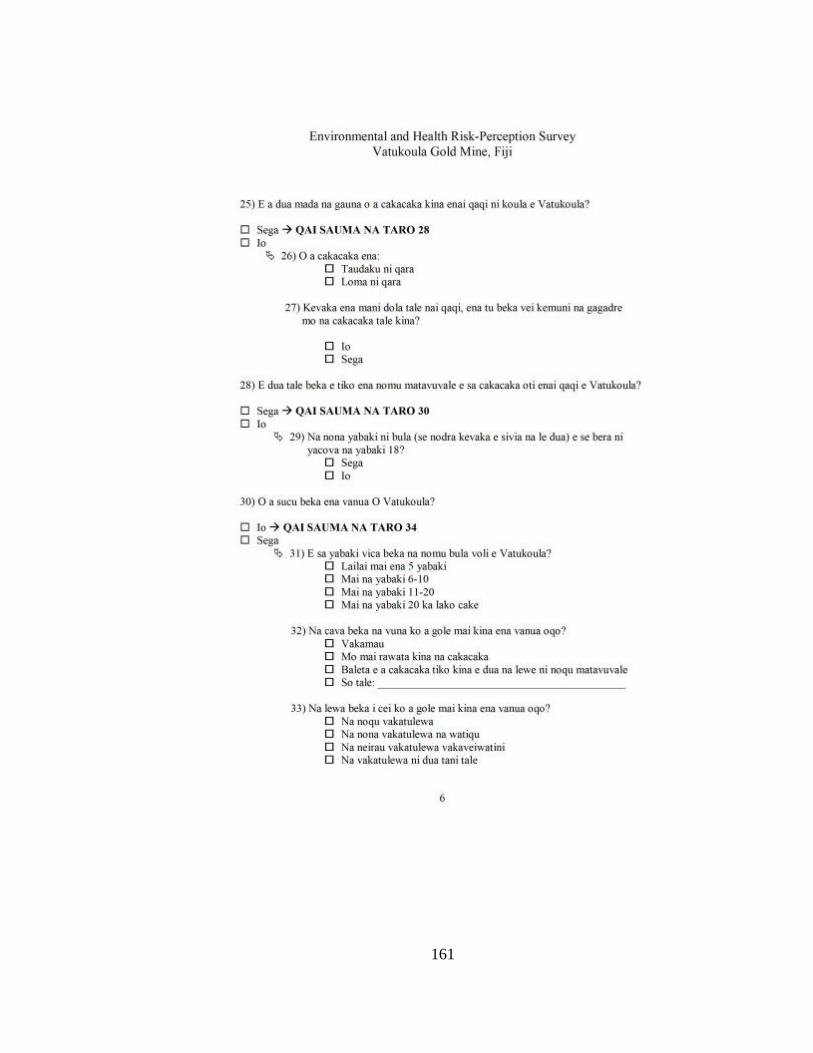
161

162

163

164

165
APPENDIX III: SURVEY RESULTS
The following tables contain summarized data for all survey questions except
those related to demographic characteristics. Demographic characteristics are
summarized in Table 3. Some questions and response categories have been abbreviated
to facilitate readability in table format. Please refer to the original survey instrument in
Appendix I for original question and response wording.
Question 3: Percent Response by Category
10.3% 17.9% 68.8% 3.0%8.7% 17.8% 70.8% 2.7%9.4% 12.2% 74.5% 4.0%8.8% 22.8% 63.8% 4.6%7.9% 19.1% 63.8% 9.1%8.9% 23.0% 60.4% 7.7%
3a) Worried about drinking water pollution? (n=330)3b) Worried about pollution in your rivers and streams? (n=332)3c) Worried about air pollution? (n=339)3d) Worried about pollution in your garden vegetables? (n=329)3e) Worried about pollution in your fish? (n=329)3f) Worried about pollution of your land? (n=326)
Not worriedat all
Somewhatworried
VeryWorried
Don'tknow

166
Questions 4-8: Percent Response by Category
12.1% 7.7% 30.8% 39.3% 10.1%12.1% 6.5% 32.7% 42.2% 8.0%9.4% 4.4% 28.9% 51.0% 6.2%15.0% 9.1% 33.6% 34.5% 7.7%16.8% 8.1% 30.6% 31.5% 12.9%
4) Drinking water pollution (n=338)5) Pollution in your rivers and streams (n=339)6) Air pollution (n=339)7) Pollution in your garden vegetables and root crops (n=339)8) Pollution in your fish (n=333)
Veryunlikely
Somewhatunlikely
Somewhatlikely
VeryLikely
Don'tknow

167
Questions 9-16: Percent Response by Category
Strongly disagree Disagree Agree
Strongly agree
Don't know
9) I worry that gold mining will cause environmental damage that will impact future generations. (n=334)
4.5% 4.2% 42.5% 42.2% 6.6%
10) I am worried about my children's health because we live near the gold mine. (n=335)
3.0% 4.5% 38.5% 51.3% 2.7%
11) I am worried about my own health because I live near the gold mine. (n=334)
2.4% 8.7% 44.3% 42.8% 1.8%
12) I have all of the information I need to decide how I feel about the risks of gold mining. (n=331)
5.1% 20.2% 36.6% 21.1% 16.9%
13) I feel capable of finding the information I need to decide how I feel about the risks of gold mining. (n=329)
2.4% 17.9% 42.2% 20.4% 17.0%
14) I am willing to accept most of the risks of gold mining because the benefits of mining are worth it. (n=334)
14.4% 34.7% 26.9% 17.1% 6.9%
15) If I have a question about the risks of gold mining, it is usually easy to find the answer. (n=334)
6.9% 25.7% 38.9% 10.8% 17.7%
16) Before the mine closed, I felt comfortable telling someone from the company if I had a concern. (n-329)
7.9% 19.5% 43.2% 17.0% 12.5%

168
Questions 17-20: Percent Response by Category
Question Response Category Percent by Category
Feel my water is safe - based on company information 11.0% Feel my water is safe - based on traditional knowledge
13.1%
Don't know if safe or unsafe 26.6%
17) How do you feel about the risk of unsafe drinking water? (n=335)
Worried my water is unsafe - but have no choice 49.3% Do not know about this risk, would like to learn more 18.5% Not worried, company told me this will never happen 3.9% Not worried, I am prepared to deal with this risk 23.9% I'm worried about this risk becuase it may be dangerous to my health or the environment
35.8%
18) How do you feel about the risk of mine wastes overflowing or leaking from a tailings dam? (n=335)
I'm worried about this risk, but willing to accept it 17.9% No control 43.4% Little control 20.7% Some control 15.3% Enough control 13.2%
19) How much control do you have to avoid the risks of mining? (n=334)
Total control 7.5% No 76.8% 20) Do you have a plan for a tailings
dam collapse/overflow? (n=332) Yes 23.2%

169
Health Data (Question 21): Percent Response by Category
Never Between 1-5
times 5 Times or
more Everyday 21a) difficulty breathing (n=339) 50.4% 31.0% 12.1% 6.5% 21b) severe cough (n=338) 36.4% 35.2% 21.3% 7.1% 21c) muscle/joint pain (n=339) 30.4% 35.1% 22.4% 12.1% 21d) memory or concentration problems (n=339) 60.8% 22.7% 12.4% 4.1% 21e) severe headaches (n=339) 40.4% 38.3% 18.9% 2.4% 21f) nausea (n=339) 67.8% 22.1% 6.5% 3.5% 21g) vomiting (n=339) 73.5% 19.8% 4.4% 2.4% 21h) skin (n=339) 55.8% 29.2% 10.6% 4.4% 21i) problems sleeping (n=337) 58.5% 24.3% 11.3% 5.9% 21j) hearing loss (n=339) 76.7% 11.8% 8.6% 2.9% 21k) weakness or exhaustion (n=339) 51.9% 27.7% 15.9% 4.4%
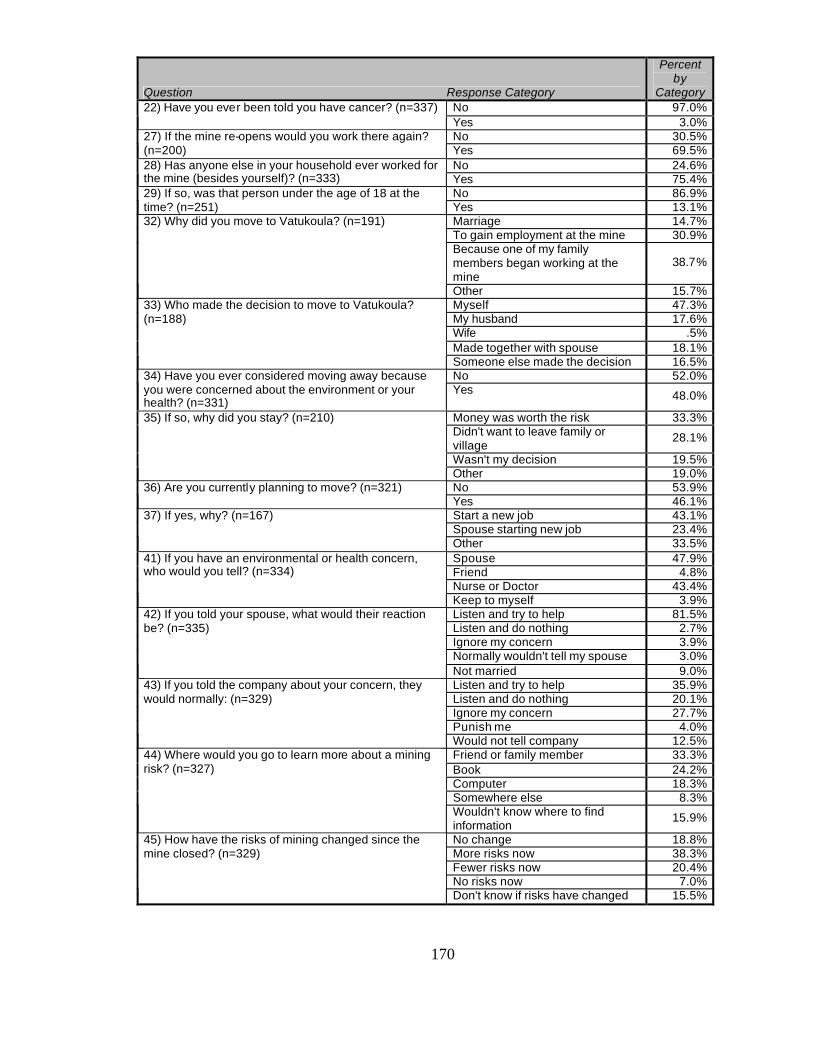
170
Question Response Category
Percent by
Category No 97.0% 22) Have you ever been told you have cancer? (n=337) Yes 3.0% No 30.5% 27) If the mine re-opens would you work there again?
(n=200) Yes 69.5% No 24.6% 28) Has anyone else in your household ever worked for
the mine (besides yourself)? (n=333) Yes 75.4% No 86.9% 29) If so, was that person under the age of 18 at the
time? (n=251) Yes 13.1% Marriage 14.7% To gain employment at the mine 30.9% Because one of my family members began working at the mine
38.7%
32) Why did you move to Vatukoula? (n=191)
Other 15.7% Myself 47.3% My husband 17.6% Wife .5% Made together with spouse 18.1%
33) Who made the decision to move to Vatukoula? (n=188)
Someone else made the decision 16.5% No 52.0% 34) Have you ever considered moving away because
you were concerned about the environment or your health? (n=331)
Yes 48.0%
Money was worth the risk 33.3% Didn't want to leave family or village
28.1%
Wasn't my decision 19.5%
35) If so, why did you stay? (n=210)
Other 19.0% No 53.9% 36) Are you currently planning to move? (n=321) Yes 46.1% Start a new job 43.1% Spouse starting new job 23.4%
37) If yes, why? (n=167)
Other 33.5% Spouse 47.9% Friend 4.8% Nurse or Doctor 43.4%
41) If you have an environmental or health concern, who would you tell? (n=334)
Keep to myself 3.9% Listen and try to help 81.5% Listen and do nothing 2.7% Ignore my concern 3.9% Normally wouldn't tell my spouse 3.0%
42) If you told your spouse, what would their reaction be? (n=335)
Not married 9.0% Listen and try to help 35.9% Listen and do nothing 20.1% Ignore my concern 27.7% Punish me 4.0%
43) If you told the company about your concern, they would normally: (n=329)
Would not tell company 12.5% Friend or family member 33.3% Book 24.2% Computer 18.3% Somewhere else 8.3%
44) Where would you go to learn more about a mining risk? (n=327)
Wouldn't know where to find information
15.9%
No change 18.8% More risks now 38.3% Fewer risks now 20.4% No risks now 7.0%
45) How have the risks of mining changed since the mine closed? (n=329)
Don't know if risks have changed 15.5%

171