evaluating elastic behavior for partially composite ... journal/2018/septem… · specimens allowed...
TRANSCRIPT

71PCI Journal | September–October 2018
■ Designing sandwich panels with wythe connectors made of fiber-reinforced polymers has been largely empirical, making the design process difficult for precast concrete engineers.
■ In this study, fiber-reinforced polymer connectors on component-scale push-off specimens underwent shear testing to study wythe thickness, insulation type, and insulation bond.
■ A generalized model provided measured-to-pre-dicted ratios of 0.95 and 0.97 for full-scale cracking and deflections, respectively, validating its use as a generalized design tool.
Precast concrete sandwich wall panels have been in use for over 60 years. They typically comprise an outer and inner layer (or wythe) of concrete separat-
ed by an insulating material (Fig. 1). To achieve increased structural efficiency, the wythes are connected by shear con-nectors that penetrate the insulating layer, which can provide various levels of composite action. More stringent energy codes have demanded greater thermal efficiency, so these shear connections are often made of various composites to eliminate thermal bridging.
Sandwich wall panels have been produced in the United States for more than 100 years. One of the earliest sandwich wall panel structures was built in 1906.1 This tilt-up wall was produced by casting a 2 in. (50 mm) layer of concrete, cov-ering it with a 2 in. layer of sand, which was later removed, and then casting a second 2 in. layer of concrete. Roberts2 described a prestressed concrete sandwich wall panel struc-ture manufactured in 1951 in New York, N.Y., using a three-wythe panel with a 1.75 in. (44.5 mm) outer wythe and 2 in. (50 mm) insulation wythe (often written as 1.75-2-1.75 in. [44.5-50-44.5 mm]) configuration tied together with steel channel sections for shear reinforcing.
With the significant push for LEED-certified buildings, recent changes to the energy code, and a general increase in public interest in sustainability, there is an increasing demand for thermally efficient and cost-efficient structural elements. Research has been done on precast concrete sandwich wall panels in the past two decades, focusing mostly on the use of
Evaluating elastic behavior for partially composite precast concrete sandwich wall panels
Salam Al-Rubaye, Taylor Sorensen, Jaiden Olsen, and Marc Maguire

72 PCI Journal | September–October 2018
nonconductive wythe connectors. Thermal bridging is still a significant challenge for precast concrete sandwich wall panels, particularly in structurally composite panels.3,4 Figure 2 pres-ents thermal images of precast concrete sandwich wall panels showing the amount of thermal bridging when using fiber-re-inforced polymer (FRP) connectors to the amount caused by steel truss connectors. Many proprietary FRP wythe connector solutions have been proposed to achieve full composite action without thermal bridging. Many of these connectors have been tested and are currently in use across the United States.
A major challenge associated with using FRP connectors in design is determining the percentage of composite action achieved. Many FRP connectors are marketed as being able to produce 100% composite action for the ultimate limit state; however, for elastic deflections and cracking, this number is less clear and is, in all cases, actually a partially composite value.5,6 Because existing design methodologies have been
somewhat limited, there is a need to develop a generalized design methodology that can be easily implemented.
Collins1 suggested the first design methodology based on an allowable stress approach and engineering judgement. Collins recommended a minimum concrete design strength of 3000 psi (21 MPa) for the outside wythes and outlined minimum wythe thicknesses for both the inner and outer wythes. He concluded that the minimum required thicknesses for a panel should be 1.25-2-1.25 in. (31.8-50-31.8 mm), or an overall panel thickness of 4.5 in. (114 mm).
ACI (American Concrete Institute) Committee 5337 advocated the use of an effective section approach where the concrete wythes carried all forces noncompositely without shear force transfer. They also provided allowable-stress design charts for vertical compressive stress for concentric loads based on panel buckling stability and out-of-plane compressive stress for pan-els between columns, supports, or isolated footings. Recom-mendations were also made for steel shear connector spacing.
Salmon and Einea8 developed a displacement prediction using a finite element model for FRP connected panels, analyzing both mechanical and thermal loading. Using this model, a design equation, termed the continuum model, was developed that could analyze the FRP shear connected panels to within 1% of a finite element model, though there was no compari-son with test values.
A 1997 state-of-the-art report by the PCI Precast Sand-wich Wall Panels Committee divided the flexural design for sandwich panels into three categories: noncomposite panel design, composite panel design, and partially composite panel design.9 For noncomposite panel design, the flexural design for the noncomposite panel is the same as for solid panels and the applied loads are distributed to each wythe depending on
Figure 1. Typical partially composite precast concrete sandwich panel.
Figure 2. Thermal images of precast concrete sandwich wall panels containing fiber-reinforced polymer connectors (left) and steel truss connectors (right). Note: °C = (°F – 32)/1.8.

73PCI Journal | September–October 2018
the stiffness for the individual wythe. Equations (1) through (3) show the percentage of total load carried by the individual wythes prior to cracking.
MT =M1 +M2 (1)
M1 =MT
I1I1 + I2( )
(2)
M2 =MT
I2I1 + I2( )
(3)
where
MT = total cracking moment
M1 = cracking moment for wythe 1
M2 = cracking moment for wythe 2
I1 = moment of inertia for wythe 1
I2 = moment of inertia for wythe 2
Wythe 1 is considered the wythe that would be in compres-sion during positive bending, and wythe 2 is considered the wythe that would be in tension during positive bending. For second-order moment amplifications caused by the relative local deformation related to the element chord (P–δ effects) from the axial load and self-weight, only the properties of the structural wythe are used for the stiffness-reduction factor. For
a composite panel, the sandwich panel is assumed composite if the shear connectors provide forces greater than or equal to the lesser of the maximum compressive force for the concrete or the tensile capacity for the steel at ultimate (Eq. [4]).
V = min0.85 ′fctwythe1b
As fy + Aps fpy
⎧⎨⎪
⎩⎪
⎫⎬⎪
⎭⎪ (4)
where
V = shear force provided by connectors
fc' = concrete compressive strength
twythe1 = thickness of wythe 1
b = slab width
As = area of mild steel in wythe
fy = steel yield stress
Aps = area of prestressing steel in wythe
fpy = prestressing steel yield stress
In the second edition of the state-of-the-art report, the flexural design is kept the same, except for the partially composite panels.10 Partially composite panels are assumed to obtain a percentage of composite action based on relating the design to empirical testing performed by connector manufacturers.
Table 1. Test matrix for five-wythe push-off specimens
Insulation typeWythe
thicknessBond
Connector
A B C D
Expanded poly-styrene (EPS)
3 in.B AEPS3B n/a n/a DEPS3B
UB AEPS3UB n/a n/a DEPS3UB
4 in.B AEPS4B n/a n/a DEPS4B
UB AEPS4UB n/a n/a DEPS4UB
Extruded polysty-rene (XPS)
3 in.B AXPS3B BXPS3B CXPS3B DXPS3B
UB AXPS3UB BXPS3UB CXPS3UB DXPS3UB
4 in.B AXPS4B BXPS4B CXPS4B DXPS4B
UB AXPS4UB BXPS4UB CXPS4UB DXPS4UB
Polyisocyanurate (ISO)
3 in.B AISO3B BISO3B CISO3B DISO3B
UB AISO3UB BISO3UB CISO3UB DISO3UB
4 in.B AISO4B BISO4B CISO4B DISO4B
UB AISO4UB BISO4UB CISO4UB DISO4UB
Note: B = bonded; n/a = not applicable, because the connector manufacturer does not use extruded polystyrene with its system;
UB = unbonded. 1 in. = 25.4 mm.
74 PCI Journal | September–October 2018
The research presented in this paper aims to develop a gen-eral tool for precast concrete sandwich wall panel design-ers to use in everyday practice to predict elastic behavior. Testing focused on component-level testing and simplified modeling verified by full-scale testing. Currently in design, the level of composite action is typically based on limited testing performed by the connector companies themselves. Composite percentages for specific connectors are then giv-en to the design engineers to design the panel. This must be done in three design stages: cracking, elastic deflections, and nominal strength. This paper presents an experimental pro-gram of component testing and full-scale testing for various proprietary FRP wythe connectors, as well as a generalized design tool to predict the behavior at cracking and elastic deformation.
Experimental program
The experimental portion of this paper was developed to test several different FRP shear connector systems by fabricating and testing 40 small-scale push-off specimens to apply direct shear to the connectors, as well as to test eight full-scale pre-cast concrete sandwich wall panels.
Push-off testing
Specimen configurations and test matrix
A test matrix was created to provide information on each of the specimens constructed for both the push-off and full-scale testing. Table 1 shows this matrix for the push-off tests. The matrix was based on three variables: connector type, insula-tion type, and concrete-insulation interface bond. This study included four different connectors: A, B, C, and D.
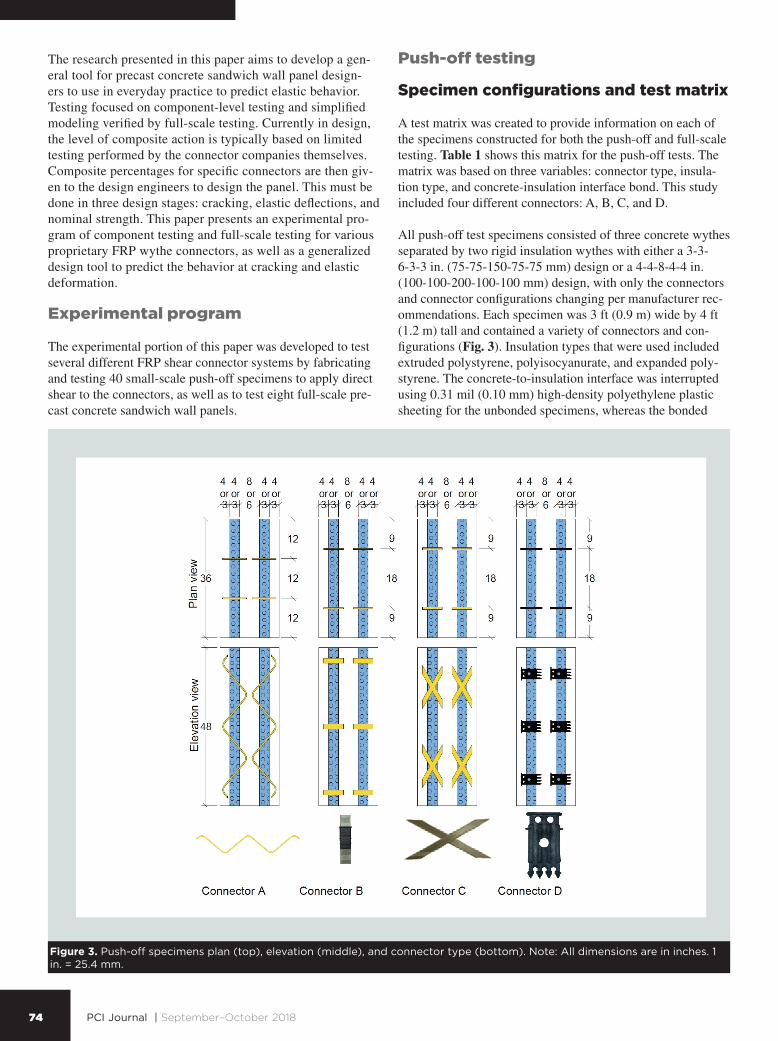
All push-off test specimens consisted of three concrete wythes separated by two rigid insulation wythes with either a 3-3-6-3-3 in. (75-75-150-75-75 mm) design or a 4-4-8-4-4 in. (100-100-200-100-100 mm) design, with only the connectors and connector configurations changing per manufacturer rec-ommendations. Each specimen was 3 ft (0.9 m) wide by 4 ft (1.2 m) tall and contained a variety of connectors and con-figurations (Fig. 3). Insulation types that were used included extruded polystyrene, polyisocyanurate, and expanded poly-styrene. The concrete-to-insulation interface was interrupted using 0.31 mil (0.10 mm) high-density polyethylene plastic sheeting for the unbonded specimens, whereas the bonded
Figure 3. Push-off specimens plan (top), elevation (middle), and connector type (bottom). Note: All dimensions are in inches. 1 in. = 25.4 mm.
75PCI Journal | September–October 2018
specimens allowed the concrete to bond to the foam interface. The concrete was reinforced concentrically with Grade 60 (414 MPa) no. 3 (10M) reinforcing bars spaced every 6 in. (150 mm) in all three wythes.
Each connector tested was manufactured using glass-fiber-re-inforced polymer (GFRP); however, they were not all made with the same manufacturing process. Connector A was a 3∕8 in. (9.5 mm) diameter GFRP reinforcing bar fabricated into a zig-zag pattern with fibers aligned in the direction of the round bar. Connectors B and C were also an aligned fiber flat bar of GFRP (like connector A) that were either oriented in an X shape or orthogonal to the concrete wythes. Connector D was a mold-in-jected product with short, randomly aligned glass fibers.
Push-off test setup
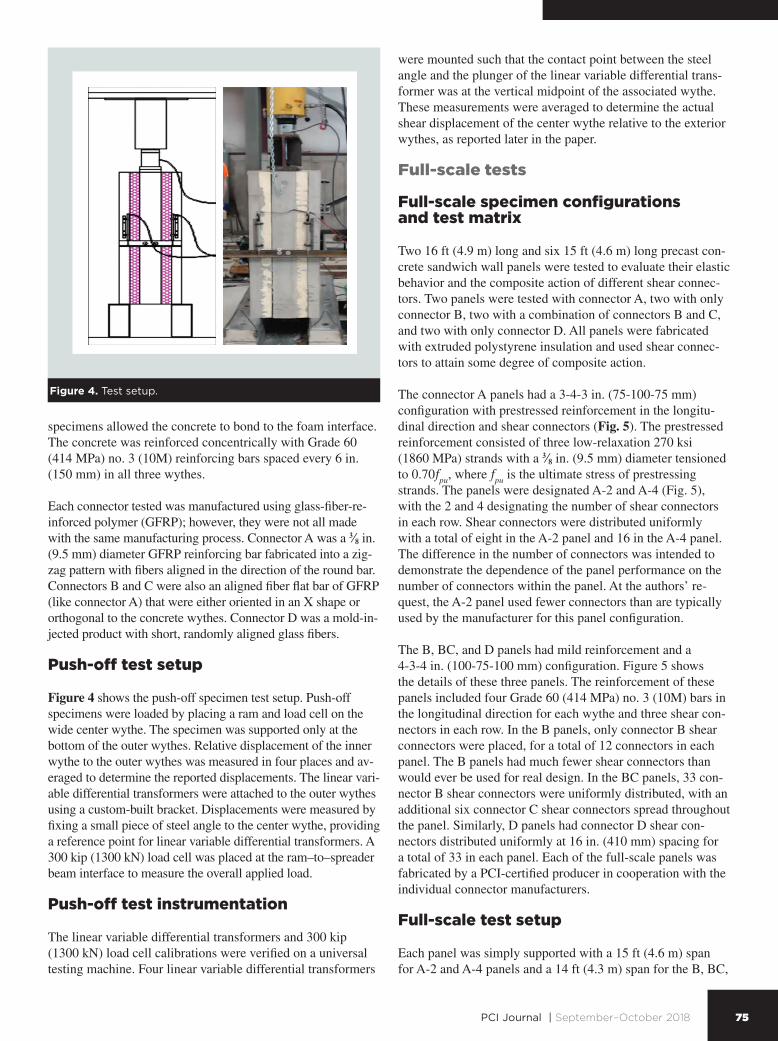
Figure 4 shows the push-off specimen test setup. Push-off specimens were loaded by placing a ram and load cell on the wide center wythe. The specimen was supported only at the bottom of the outer wythes. Relative displacement of the inner wythe to the outer wythes was measured in four places and av-eraged to determine the reported displacements. The linear vari-able differential transformers were attached to the outer wythes using a custom-built bracket. Displacements were measured by fixing a small piece of steel angle to the center wythe, providing a reference point for linear variable differential transformers. A 300 kip (1300 kN) load cell was placed at the ram–to–spreader beam interface to measure the overall applied load.
Push-off test instrumentation
The linear variable differential transformers and 300 kip (1300 kN) load cell calibrations were verified on a universal testing machine. Four linear variable differential transformers
were mounted such that the contact point between the steel angle and the plunger of the linear variable differential trans-former was at the vertical midpoint of the associated wythe. These measurements were averaged to determine the actual shear displacement of the center wythe relative to the exterior wythes, as reported later in the paper.
Full-scale tests
Full-scale specimen configurations and test matrix
Two 16 ft (4.9 m) long and six 15 ft (4.6 m) long precast con-crete sandwich wall panels were tested to evaluate their elastic behavior and the composite action of different shear connec-tors. Two panels were tested with connector A, two with only connector B, two with a combination of connectors B and C, and two with only connector D. All panels were fabricated with extruded polystyrene insulation and used shear connec-tors to attain some degree of composite action.
The connector A panels had a 3-4-3 in. (75-100-75 mm) configuration with prestressed reinforcement in the longitu-dinal direction and shear connectors (Fig. 5). The prestressed reinforcement consisted of three low-relaxation 270 ksi (1860 MPa) strands with a 3∕8 in. (9.5 mm) diameter tensioned to 0.70fpu, where fpu is the ultimate stress of prestressing strands. The panels were designated A-2 and A-4 (Fig. 5), with the 2 and 4 designating the number of shear connectors in each row. Shear connectors were distributed uniformly with a total of eight in the A-2 panel and 16 in the A-4 panel. The difference in the number of connectors was intended to demonstrate the dependence of the panel performance on the number of connectors within the panel. At the authors’ re-quest, the A-2 panel used fewer connectors than are typically used by the manufacturer for this panel configuration.
The B, BC, and D panels had mild reinforcement and a 4-3-4 in. (100-75-100 mm) configuration. Figure 5 shows the details of these three panels. The reinforcement of these panels included four Grade 60 (414 MPa) no. 3 (10M) bars in the longitudinal direction for each wythe and three shear con-nectors in each row. In the B panels, only connector B shear connectors were placed, for a total of 12 connectors in each panel. The B panels had much fewer shear connectors than would ever be used for real design. In the BC panels, 33 con-nector B shear connectors were uniformly distributed, with an additional six connector C shear connectors spread throughout the panel. Similarly, D panels had connector D shear con-nectors distributed uniformly at 16 in. (410 mm) spacing for a total of 33 in each panel. Each of the full-scale panels was fabricated by a PCI-certified producer in cooperation with the individual connector manufacturers.
Full-scale test setup
Each panel was simply supported with a 15 ft (4.6 m) span for A-2 and A-4 panels and a 14 ft (4.3 m) span for the B, BC,
Figure 4. Test setup.

76 PCI Journal | September–October 2018
and D panels. A single hydraulic actuator applied four-point loads with a spreader beam assembly to simulate a distributed load (Fig. 6).
Deflection was measured at midspan on both edges of the
panel. Relative slip between concrete wythes was measured using linear variable differential transformers at each panel corner. Before testing, dead load deflection was measured at midspan with a total station and high accuracy steel ruler by finding the elevations of the supports and of the midspan. This
Figure 5. Panel details. Note: fpu = ultimate stress of prestressing strands. All dimensions are in inches. No. 3 = 10M; 1 in. = 25.4 mm; Grade 60 = 414 MPa.

77PCI Journal | September–October 2018
procedure provided a dead load midspan deflection to within an accuracy of ± 1/32 in. (0.79 mm).
Full-scale instrumentation
The data acquisition system, linear variable differential transformers for slip measurement, and load cell for ram load measurement were the same as for the push-off specimen. The deflection measurements were made with string potentiome-ters with calibration verified on a universal testing machine to an accuracy of 0.001 in. (0.025 mm).
Experimental results
Material testing
Concrete cylinder compressive tests according to ASTM C39,11
using 4 in. (100 mm) diameter cylinders, were performed for all test specimens. For full-scale tests, concrete cylinders were provided by the precaster to be tested on the day of specimen testing. Due to limited material, space, and budget, all of the push-off specimens could not be placed at once. Each spec-imen required three separate concrete placements (one per wythe), and specimens were created in three different sets due to space restrictions for a total of nine placements (three sets with three placements each). Cylinders were created from the concrete midway through each concrete batch. Average con-crete properties for the push-off specimens were as follows: compressive strength was 5620 psi (38.7 MPa), tensile strength was 562 psi (3870 kPa), elastic modulus was 3,820,000 psi (26,340 MPa), and unit weight was 139 lb/ft3 (2230 kg/m3).
Concrete cylinder compression, split tension, and elastic mod-ulus tests were performed for each full-scale panel. Table 2
Figure 6. Full-scale specimen test setup. Note: P = load.

78 PCI Journal | September–October 2018
gives the results of the ASTM C3911 compression testing, ASTM C49612 split tension, and ASTM C46913 elastic modu-lus testing for the full-scale specimens. Each value is the aver-age of three cylinders on the day of testing. All test cylinders were 4 × 8 in. (100 × 200 mm) and provided by the precasters.
Reinforcing bars and prestressing steel samples were obtained from each panel after testing by breaking the concrete out from the ends and removing the steel samples where there was no observed plasticity from testing. Reinforcing bar was tested according to ASTM A370,14 and the full stress-strain curves were developed using a 2 in. (50 mm) extensometer. Because of the gripping limitations of the tensile testing machine, standard reusable chucks were used to test the 3∕8 in. (9.5 mm) prestress-ing strand. Using chucks during tensile testing is known both to limit elongation and may provide slightly lower ultimate stresses.15,16 Only ultimate tensile stress was recorded for the prestressing strand because a proper extensometer (24 in. [610 mm] gauge length, rotation capable) was not available. The average yield stress was 72.2 ksi (498 MPa), and the ultimate stress was 110 ksi (758 MPa). The average ultimate capacity for the prestressing strands was 259 ksi (1790 MPa).
Table 2. Concrete compression strength for full-scale specimens
Specimen
Average concrete
compressive strength f 'c , psi
Split tension, psi
Modulus of elasticity, psi
A-2 10,400 766 6,190,000
A-4 10,400 766 6,190,000
B-1 9230 691 5,820,000
B-2 8000 699 5,990,000
BC-1 9230 691 5,820,000
BC-2 8000 699 5,990,000
D-1 9230 691 5,820,000
D-2 8000 699 5,990,000
Note: 1 psi = 6.895 kPa.
Figure 7. Typical failure modes for the connectors.

79PCI Journal | September–October 2018
Push-off test results
Each push-off specimen was monotonically loaded to failure. Figure 7 presents typical failure modes for each connector. Connector A failed in tension of the GFRP bar, connectors B and D failed in dowel action, and connector C failed through concrete breakout of the compression leg (punching through the exterior wythe). The manufacturer does not recommend connector C for 3 in. (75 mm) concrete wythes. Connector A and C carried their loads through tension and compression of the angled legs; connectors B and D carried load mainly through direct shear.
Due to space constraints, all shear deflection versus shear load plots cannot be provided, but they are contained in Olsen et al.6 Figure 8 displays an example plot of connector A with the
3 in. (75 mm) insulation thickness specimens. Most such plots for each connector type studied behave similarly and have similar elastic and inelastic regions, though their magnitudes and ductility at failure are different.
Figure 9 presents an example shear deformation versus shear load plot, where the individual properties are estimated. All load displacement curves initially had an elastic behavior up to the elastic load limit FE. At the end of elastic behavior, the connectors began to exhibit a reduced inelastic stiffness until peak load. Many of the connectors maintained a significant load past this peak load while continuing to deform, whereas others failed soon after they reached peak load.
On a load-deflection diagram, the elastic stiffness of the spec-imen is the initial slope of the load-deflection curve. For de-sign purposes, this curve is idealized into two categories: the elastic portion KE and the inelastic portion KIE (Fig. 9). These stiffness values can be calculated as the slope, which, for the idealized bilinear case, are calculated by Eq. (5) and (6).
KE =FEΔE
(5)
KIE =Fu − FEΔU − ΔE
(6)
where
KE = elastic stiffness
KIE = inelastic stiffness
FE = elastic limit load
Fu = ultimate capacity or peak load
ΔE = deflection corresponding to the elastic load limit
ΔU = deflection corresponding to the ultimate capacity
Using Eq. (5) and (6), elastic and inelastic stiffness per con-nector were calculated for each connector type. There was a reduction in all measured strengths and stiffness values when comparing the 4 in. (100 mm) specimens with the 3 in. (75 mm) specimens. Such a reduction would be expected since the gap between concrete layers increased but the connectors remain largely unchanged. Connector A seems to be affected by the bond of the insulation to the concrete because, in all cases, the bonded specimens have higher strengths and stiffness than the unbonded specimens. This did not hold true for all the other connectors, as presented in the following sections.
Table 3 presents the ultimate strength Fu comparison for all specimens. Connector A with 3 in. (75 mm) bonded extruded polystyrene insulation produced the strongest individual shear connection (16.8 kip [74.7 kN] each), while connector D with 4 in. (100 mm) unbonded expanded polystyrene insulation produced the smallest ultimate shear load (1.39 kip [6.18 kN]
Figure 8. Example plot for push-off test results for specimens with 3 in. thick insulation using connector A. Note: 1 in. = 25.4 mm; 1 kip = 4.448 kN.
0.0
0.5
1.0
1.5
2.0
2.5
3.0
3.5
4.0
4.5
0.00 0.30 0.60 0.90 1.20
She
ar lo
ad, k
ip
Deflection, in.
FE
KIE
KE
Fu
Figure 9. Load-deformation curve and visual identification of the elastic limit. Note: FE = elastic load limit; Fu = ultimate capacity/strength or peak load; KE = elastic stiffness; KIE = inelastic stiffness. 1 in. = 25.4 mm; 1 kip = 4.448 kN.

80 PCI Journal | September–October 2018
Table 3. Push-off test specimen experimental results
Connector FoamBond
interfaceElastic
load, kipElastic stiffness,
kip/in.Ultimate load, kip Inelastic stiffness, kip/in.
A
3EPS Bonded 9.13 391.30 15.10 42.54
3EPS Unbonded 8.00 170.21 14.39 34.45
4EPS Bonded 7.23 99.04 12.41 25.58
4EPS Unbonded 6.36 70.67 10.36 40.20
3XPS Bonded 9.50 220.93 16.79 68.11
3XPS Unbonded 9.00 163.64 14.44 34.04
4XPS Bonded 7.50 115.38 11.46 72.53
4XPS Unbonded 6.24 69.33 9.72 32.82
3ISO Bonded 5.50 171.88 15.60 53.91
3ISO Unbonded 4.60 184.00 10.12 33.66
4ISO Bonded 5.00 83.33 10.37 31.12
4ISO Unbonded 4.36 62.29 8.27 15.01
B
3XPS Bonded 2.50 19.23 4.99 3.55
3XPS Unbonded 2.20 18.33 3.64 1.53
4XPS Bonded 2.20 7.00 2.98 1.02
4XPS Unbonded 2.40 7.67 2.66 0.29
3ISO Bonded 2.00 25.00 4.28 2.89
3ISO Unbonded 2.30 17.69 4.03 2.24
4ISO Bonded 2.33 7.77 3.46 0.89
4ISO Unbonded 2.15 7.17 2.62 0.32
C
3XPS Bonded 8.20 205.00 12.23 33.29
3XPS Unbonded 6.90 152.78 9.76 23.51
4XPS Bonded 4.20 110.53 7.80 49.95
4XPS Unbonded 3.40 42.50 5.75 6.79
3ISO Bonded 8.60 172.00 11.84 26.40
3ISO Unbonded 8.00 235.29 10.03 29.65
4ISO Bonded 7.73 140.55 11.45 53.13
4ISO Unbonded 7.12 94.93 10.01 13.41
D
3EPS Bonded 2.08 115.56 4.56 36.47
3EPS Unbonded 2.88 62.61 3.85 23.05
4EPS Unbonded 1.23 14.84 1.39 2.05
3XPS Bonded 1.88 94.80 3.91 38.78
3XPS Unbonded 1.92 68.57 3.29 31.57
4XPS Bonded 1.04 86.67 3.76 32.61
4XPS Unbonded 1.56 25.16 2.06 6.27
3ISO Bonded 1.50 63.56 3.60 35.43
3ISO Unbonded 1.58 79.00 3.09 34.62
4ISO Unbonded 1.25 22.24 2.08 12.45
Note: EPS = expanded polystyrene; ISO = polyisocyanurate; XPS = extruded polystyrene. 1 kip = 4.448 kN; 1 kip/in. = 0.113 kN/m.
81PCI Journal | September–October 2018
each). There was a consistent reduction in strength between the 3 and 4 in. wythe specimens, but the specimens using connector C with polyisocyanurate and those using connector D with extruded polystyrene experienced little to no reduction in strength. Connector B seemed to behave similarly, whether the insulation was bonded or not.
Each unbonded specimen produced a reduction in ultimate strength for its respective connector. The amount of reduction in ultimate strength varied greatly, however. For example, the specimens with connector A and expanded polystyrene pro-duced a reduction of approximately 10% when the insulation was unbonded, while the specimens with connector D and ex-panded polystyrene produced an approximately 15% difference when the insulation was unbonded. Insulation type did contrib-ute to the ultimate strength as well, but the results were also inconsistent (especially with the polyisocyanurate insulation).
An elastic limit load FE and elastic stiffness KE were iden-tified from the load deformation curve of each push-off specimen. This was done by visually identifying the elastic limit (Fig. 9). Table 3 shows the maximum elastic force FE observed during testing for each connector configuration. Although fatigue testing was not performed, it was assumed that FE should be the maximum force allowed in the connec-tor during service loading scenarios, as damage may accumu-late at higher loads. Table 3 summarizes FE for all push-off specimens in this paper. The connectors that exhibited a high ultimate strength Fu in Table 3 also had a similar FE relative to the other connectors. The specimens using connector A with extruded polystyrene had the highest FE value (9.5 kip [42 kN]), but the FE value for specimens using connector A with polyisocyanurate was significantly lower than that for the expanded and extruded polystyrene combinations. This is likely due to the difference in polyisocyanurate surface treatment used with the fabricator’s system, as previously discussed, which might cause an inconsistent bond. There was relatively little difference between the bonded and unbonded connector A polyisocyanurate. Similar relationships between insulation, wythe thickness, and bond performance are ob-served with respect to FE.
Table 3 shows the elastic stiffness values for the push-off specimens tested in this program. Connector B resulted in the lowest KE values, as low as 6 kip/in. (1 kN/mm) in combina-tion with the 4 in. (100 mm) insulation thickness unbonded specimens, whereas several connector A specimens exceeded 150 kip/in. (26 kN/mm). Surprisingly, although connector D specimens had displayed lower relative strengths with respect to the other connectors, they had a similar stiffness to the other connector specimens in many instances. Connectors A and C showed significantly higher stiffness and strength. This is likely due to their truss-like fiber orientation, which allows more efficient horizontal load transfer, as opposed to the dowel action transfer mechanism of connectors B and D. This observation needs to be further tested because there were no repeat tests and this may simply be caused by insula-tion bond variability.
Both unbonded polyisocyanurate scenarios for connectors A and C displayed higher elastic stiffness values than their bond-ed counterparts. Generally, 4 in. (100 mm) insulation, bonded and unbonded, exhibit significantly lower stiffness than the ob-served reductions in strengths in Table 3. Similar observations can be made from the inelastic stiffness presented.
Full-scale test results
Deflection versus load for entire data set
All loads shown herein include self-weight, and all deflections include deflection due to self-weight as measured by a total station, as discussed previously. Figure 10 shows deflection versus load and slip versus load plots for panels A-2 and A-4 for the elastic range of the test results only. The cracking load was 155 and 202 lb/ft2 (7.42 and 9.67 kPa) for A-2 and A-4. The shear tie intensity had a large effect on the cracking and deflection of the panel. Doubling the number of connectors in panel A-4 compared with A-2 increased the cracking load by 30% and reduced the deflection by 30%. (The deflection of panel A-4 at 150 lb/ft2 [7 kPa] was 0.24 in. [6.1 mm], com-pared with 0.34 in. [8.6 mm] for panel A-2.) Panel B-1 and B-2 arrived at the testing facility cracked. As such, they are not presented here but can be found in Olsen et al.6 As would be expected from a cracked reinforced concrete panel, panels B-1 and B-2 exhibited much lower stiffness than an uncracked noncomposite panel.
Figure 11 shows the deflection versus load for panels BC-1 and BC-2 for the elastic range of the test results only. The cracking loads were 180 and 164 lb/ft2 (8.62 and 7.85 kPa), respectively, and had only a 10% difference. The deflections were 0.12 and 0.15 in. (3.0 and 3.8 mm) and had a 25% difference for panels BC-1 and BC-2, respectively. Figure 11 presents the deflection versus load plots for panel D-1 and D-2. The cracking loads were 221 and 184 lb/ft2 (10.6 and 8.81 kPa). The BC and D series panels can be found in Olsen et al.6 Table 4 gives a numerical summary of the cracking loads and slip values from the full-scale experiments.
Beam-spring model
The model investigated was a numerical model created using a commercial matrix analysis software package and is a more general variation of the specialized techniques for connector shape and configuration that many connector manufacturers are currently using. This model could easily be replicated using any commercial or personally written matrix analysis software and could also be easily built into commercial wall panel analysis and design software. It should work for any connector type. This approach models the precast concrete sandwich wall panel using only beam and spring elements (Fig. 12) combined with the appropriate material values, boundary conditions, and shear connector stiffness (attained from the tested push-off specimens discussed previously). Other research programs (for example, modified truss17 and beams and springs18,19) have described similar methods using

82 PCI Journal | September–October 2018
matrix software. This concept is also often used for multi-wythe masonry and has been around for decades.20 Many connector manufacturers use a truss analysis with matrix software, but some angled connectors, like connector A, use
angled truss elements. The purpose of developing a simple model that relies only on springs and beam elements is that it can be used to model a panel with any connector type, repeti-tively, with little to no change between analyses. It also relies
Figure 10. Full-scale test results. Note: 1 in. = 25.4 mm; 1 lb/ft2 = 0.0479 kPa.
0
50
100
150
200
250
0.0 0.1 0.2 0.3 0.4 0.5
App
lied
load
, lb/
ft2
Deflection, in.
East deflectionWest deflectionBeam springNoncompositeFully composite
Deflection versus load for panel A-2
Deflection versus load for panel A-4
Slip versus load for panel A-2
Slip versus load for panel A-4
Table 4. Full-scale specimen panel test results
SpecimenWythe configuration,
in.Span length, ft Cracking load, lb/ft2
Deflection at cracking, in.
End slip at cracking load, in.
A-2 3-4-3 15.0 155 0.34 0.050
A-4 3-4-3 15.0 202 0.44 0.035
B-1 4-3-4 14.0 n.d. n.d. n.d.
B-2 4-3-4 14.0 n.d. n.d. n.d.
BC-1 4-3-4 14.0 180 0.12 0.012
BC-2 4-3-4 14.0 164 0.15 0.008
D-1 4-3-4 14.0 221 0.14 0.015
D-2 4-3-4 14.0 184 0.13 0.013
Note: n.d. = no data available. 1 in. = 25.4 mm; 1 ft = 0.305 m; 1 lb/ft2 = 0.0479 kPa.

83PCI Journal | September–October 2018
only on shear testing data, which some connector companies already have from International Code Council Evaluation Service (ICC-ES) acceptance criteria, specifically ICC-ES AC32021 or AC42222 and ASTM E488-96,3 or some form of custom in-house testing.
The proposed two-dimensional model consists of two frames with cross-sectional areas equal to the area of the wythes of the panel they represent. These beam elements can be assigned the individual gross properties of each wythe and separated by a distance equal to the distance between the centroids of the wythes. Shear and axial spring elements are then used to model the transfer of shear force between wythes and are assigned a shear stiffness corresponding to the actual stiffness of the connectors as measured previously. Support conditions are modeled as pin (translation fixed, rotation free) and roller (longitudinal translation free, transverse translation fixed, rotation free) and should be placed at the appropriate location on the panel.
To verify the beam-spring model, each of the previous test specimens was modeled and the elastic deflections and stresses were compared with the test results. Because each
test specimen had a different connector configuration and spacing, links connecting the beam elements were placed at locations corresponding to each of the shear connectors. The values of shear stiffness KE used in each model are from the push-off tests. The shear connector stiffness from the push-off tests included both the stiffness of the connec-tor and the lumped insulation stiffness. For design, it may be prudent to use the unbonded values, but to verify the accuracy of the panels in this study the bonded values for KE were used.
The model included four-point loads applied to the top face of the model, imitating the full-scale testing performed in this study. In addition, the authors added self-weight to the total load. Links were also assigned a longitudinal stiffness based on the tributary geometry and on an assumed Young’s modu-lus of extruded polystyrene insulation because it was the only insulation used for the full-scale specimens.Some preliminary analyses indicated that the beam-spring model is not sensi-tive to the axial stiffness provided to the springs. Tension and compression values for the connectors were not measured in this study, but most connector companies have tension testing performed according to ICC-ES AC320. With this model, the
Figure 11. Full-scale test results. Note: 1 in. = 25.4 mm; 1 lb/ft2 = 0.0479 kPa.
Deflection versus load for panel BC-1
Deflection versus load for panel D-1
Deflection versus load for panel BC-2
Deflection versus load for panel D-2

84 PCI Journal | September–October 2018
deformations and deflections were easily predicted along with axial forces and bending moments in the concrete wythes, which can be resolved into stresses.
Validation of the beam-spring model
Predictions of cracking moment, deflection, and slip of the eight full-scale test panels were made using the beam-spring model and then compared with the actual measured values to validate these predictions. The beam-spring model re-turned favorable results. Figure 10 presents the experimental results and prediction models for the full-scale A-2 sandwich panel. In this figure and similar load-versus-deflection plots in this paper, the beam-spring models are plotted up through cracking, which is the last point at which they are valid. In the plots, a slightly bilinear relationship for the beam-spring mod-el can be observed in the elastic range, which is counterintui-tive for an elastic method. This is caused by the application of uniform load for the dead load and then four-point loads for the testing load.
The models show agreement with the observed behavior. The cracking moment and its deflection differ only by 0.5% and 14%, respectively. The slip of the A-2 panel was 0.05 in. (1.3 mm), with the beam-spring model predicting 0.045 in. (1.1 mm). Furthermore, in Fig. 10 and 11 the experimental load deformation plots and the slip plots become nonlin-ear just as the beam-spring model predicted cracking. The beam-spring model underpredicted the cracking moment of the A-4 panel by 5%. Figure 10 shows that the applied load at cracking was around 200 lb/ft2 (9.6 kPa), which differed slightly from the predictions of the method. The spring model overpredicted the slip in this specimen by 11%. For all of the panels tested, the worst slip prediction was for panel A-4.
Figure 11 shows that the beam-spring model overpredicted the cracking load by 10% for the BC-1 and BC-2 panels. Figure 11 displays the predicted and actual values for the D-1 and D-2 specimens. The cracking load predicted by the beam-spring model matched the average result of the full-scale D panel specimens.
Unit loadBeam element
192 in.
Shear and tension link element
33.6 in. 33.6 in. 33.6 in.
168 in.Roller supportPin support
Figure 12. Example of full-scale specimen modeled using the beam-spring model. Note: 1 in. = 25.4 mm.
Table 5. Summary of predicted and measured-to-predicted ratio for cracking and deflections
PanelBeam-spring model Measured/predicted
Cracking load, lb/ft2 Deflection, in. Cracking load Deflection
A-2 156 0.39 0.99 0.86
A-4 192 0.352 1.05 1.25
B-1 152 0.198 n.d. n.d.
B-2 152 0.198 n.d. n.d.
BC-1 198 0.155 0.91 0.79
BC-2 197 0.157 0.83 0.96
D-1 209 0.144 1.06 1.00
D-2 208 0.138 0.88 0.96
Average 0.95 0.97
Note: n.d. = no data available. 1 in. = 25.4 mm; 1 lb/ft2 = 0.0479 kPa.
85PCI Journal | September–October 2018
Table 5 presents a comparison of the measured cracking load and deflection at cracking with the values predicted by the beam-spring model for each full-scale test in this study. The beam-spring model is accurate, except in the case of the D-2 and BC-2 specimens, which were of the exact same design as the D-1 and BC-1 specimens. The reason for this is unclear and may be due to measurement error. On average, the pre-dictions are good at 0.95 and 0.97 for cracking and deflection at cracking, respectively. These accuracies are similar to other analysis methods for structures such as reinforced and prestressed concrete beams, as well as steel members.24 If the BC-2 and D-2 panels are not included, the measured-to-pre-dicted ratios are nearly 1.0.
The beam-spring model, because of its generality, has the potential to accurately predict all aspects of elastic behavior for panels of any configuration using only geometric and ma-terial inputs, rather than prescriptive and empirical percentage composite actions from connector manufacturers. Hopefully, this general tool will provide some reassurance to engineers who are asked to rely on manufacturer-supplied empirical percentage composite values when they are designing precast concrete sandwich wall panels. Since it was not a focus of this investigation, future investigations should attempt to further validate this methodology and address concerns with P–δ effects, dead load, and other geometric and loading scenarios.
Conclusion
This paper describes the testing of 40 direct shear push-off specimens created to evaluate the shear stiffness of the various commercially available sandwich wall panel shear connectors. The variables studied were connector type, insulation thick-ness and type, and bond. Due to project constraints, only a single specimen of each type could be constructed, so there is no statistical information available regarding the connector strength and stiffness values. In addition to the push-off test-ing, eight precast concrete sandwich wall panels were tested to failure. The purpose of the testing was to evaluate the per-formance of a generalized elastic behavior prediction model that relies only on the shear deformation behavior from push-off testing to predict full-scale panel behavior. The following conclusions can be made from the experimental program:
• For pin-type connectors that fail mainly in dowel action (connectors B and D), insulation type and bond play less of a role in strength and stiffness compared with truss-like connectors (connectors A and C). However, this observation requires more statistical evidence and future work for verification.
• Connector types vary widely in stiffness, strength, and ductility. Concrete bond to the insulation enhances the strength of all connector types. As insulation thickness increases, the strength and stiffness of each shear connec-tor decreases. Ductility is related to the material type and geometry of the specimen.
• Future effort should investigate statistical information regarding the shear strength and stiffness to properly and safely set limits on elastic stresses and failure stresses in the connectors during different loading scenarios.
• The type and intensity of shear connectors significant-ly affect the degree of composite action achieved in a precast concrete sandwich wall panel. For example, doubling the number of shear connectors in the connec-tor A panels resulted in a large strength gain (compare 155 lb/ft2 [7.4 kPa] with 205 lb/ft2 [9.8 kPa]). Note, the reinforcement of panel A-2 is much lighter than would be designed for an actual building.
• The beam-spring model provided average mea-sured-to-predicted ratios of 0.95 and 0.97 for cracking and deflections, respectively.
• Because of its generality, the beam-spring model can accurately predict elastic deflections and cracking for precast concrete sandwich wall panels of any configura-tion using only geometric and material inputs, rather than prescriptive and empirical percentage composite actions from connector manufacturers.
Acknowledgments
The authors are grateful to PCI and the Daniel P. Jenny Fel-lowship that funded this work. All connectors and insulation were donated by the following companies: THiN Wall, Ther-momass, and HK Composites. Mark Lafferty, Maher Tadros (THiN Wall), Jordan Keith, Dave Keith (HK Composites), and Venkatesh Sheshappa (Thermomass) were helpful. This paper is not an endorsement by the authors or by Utah State University of any manufacturer or system. Forterra Structur-al Precast in Salt Lake City, Utah, fabricated four of the six panels, and Concrete Industries in Lincoln, Neb., provided the other two. The support from these precast concrete producers was integral to project completion. Several undergraduate and graduate students deserve thanks for their help on this research: Hannah Young, Parker Syndergaard, Ethan Pickett, Hunter Buxton, Tyson Glover, Mohamed Shwani, and Sattar Dorafshan.
References
1. Collins, F. T. 1954. “Precast Concrete Sandwich Panels for Tilt-up Construction.” Journal of the American Con-crete Institute, no. 26, 149–164.
2. Roberts, S. B. 1951. “Sandwich Walls Precast for Pulp Mill.” Engineering News-Record 146 (8): 32–34.
3. Sorensen, T., S. Dorafshan, and M. Maguire. 2017. “Thermal Evaluation of Common Locations of Heat Loss in Sandwich Wall Panels.” Paper presented at ASCE Con-gress on Technical Advancement, Duluth, MN.

86 PCI Journal | September–October 2018
4. Sorensen, T., and M. Maguire. 2017. “Phase 1: Identifica-tion of Energy-Efficient Detailing for Concrete Sandwich Wall Panels.” Report to the Portland Cement Association, Skokie, IL.
5. Al-Rubaye, S., T. Sorensen, and M. Maguire. 2017. “Investigating Composite Action at Ultimate for Com-mercial Sandwich Panel Composite Connectors.” In The PCI National Bridge Conference: Proceedings, Febru-ary 28–March 4, 2017, Cleveland, Ohio. Chicago, IL: PCI.
6. Olsen, J., S. Al-Rubaye, T. Sorensen, and M. Maguire. 2017. “Developing a General Methodology for Evaluat-ing Composite Action in Insulation Wall Panels.” Report to PCI, Chicago, IL.
7. ACI (American Concrete Institute) Committee 533. 1971. “Design of Precast Concrete Wall Panels.” Journal of the American Concrete Institute 68 (7): 504–513.
8. Salmon, D. C., and A. Einea. 1995. “Partially Composite Sandwich Panel Deflections.” Journal of Structural Engi-neering 121 (4): 778–783.
9. PCI Committee on Precast Sandwich Wall Panels. 1997. “State-of-the-Art of Precast/Prestressed Sandwich Wall Panels.” PCI Journal 42 (2): 92–134.
10. PCI Committee on Precast Sandwich Wall Panels. 2011. “State of the Art of Precast/Prestressed Concrete Sand-wich Wall Panels.” PCI Journal 56 (2): 131–176.
11. ASTM Subcommittee C09.61. 2018. Standard Test Method for Compressive Strength of Cylindrical Concrete Specimens. ASTM C39/C39M-18. West Conshohocken, PA: ASTM International.
12. ASTM Subcommittee C09.61. 2017. Standard Test Method for Splitting Tensile Strength of Cylindrical Concrete Specimens. ASTM C496/C496M-17. West Conshohocken, PA: ASTM International. doi: 10.1520/C0496_C0496M-11.
13. ASTM Subcommittee C09.61. 2014. Standard Test Meth-od for Static Modulus of Elasticity and Poisson’s Ratio of Concrete in Compression. ASTM C469/C469M-14. West Conshohocken, PA: ASTM International. doi: 10.1520/C0469_C0469M.
14. ASTM Subcommittee A01.13. 2017. Standard Test Methods and Definitions for Mechanical Testing of Steel Products. ASTM A370-17. West Conshohocken, PA: ASTM International. doi: 10.1520/A0370-14.
15. Morcous, G., A. Hatami, M. Maguire, K. Hanna, and M. Tadros. 2012. “Mechanical and Bond Properties of 18-mm- (0.7-in.-) Diameter Prestressing Strands.” Journal
of Materials in Civil Engineering 24 (6): 735–744. doi: 10.1061/(ASCE)MT.1943-5533.0000424.
16. Maguire, M. 2009. “Impact of 0.7-inch Diameter Pre-stressing Strands in Bridge Girders.” MS thesis. Universi-ty of Nebraska–Lincoln, Lincoln.
17. Einea, A., D. C. Salmon, M. K. Tadros, and T. D. Culp. 1994. “A New Structurally and Thermally Efficient Precast Sandwich Panel System.” PCI Journal 39 (4): 90–101.
18. Teixeira, N., D. G. Tomlinson, and A. Fam. 2016. “Pre-cast Concrete Sandwich Wall Panels with Bolted Angle Connections Tested in Flexure under Simulated Wind Pressure and Suction.” PCI Journal 61 (4): 65–83.
19. Olsen, J., and M. Maguire. 2016. “Shear Testing of Precast Concrete Sandwich Wall Panel Composite Shear Connectors.” In The PCI National Bridge Conference: Proceedings, March 3–6, 2016, Nashville, Tennessee. Chicago, IL: PCI.
20. Drysdale, R. G., A. A. Hamid, and L. R. Baker. 1994. Masonry Structures: Behavior and Design. Englewood Cliffs, NJ: Prentice Hall.
21. International Code Council Evaluation Service (ICC-ES). 2015. Acceptance Criteria for Fiber-Reinforced Polymer Composite or Unreinforced Polymer Connectors An-chored in Concrete. ICC-ES Acceptance Criteria AC320. Washington, DC: ICC.
22. ICC-ES. 2010. Acceptance Criteria for Semicontinuous Fiber-reinforced Grid Connectors Used in Combination with Rigid Insulation in Concrete Sandwich Panel Con-struction. ICC-ES Acceptance Criteria AC422. Washing-ton, DC: ICC.
23. ASTM Subcommittee E06.13. 1996. Standard Test Meth-ods for Strength of Anchors in Concrete and Masonry Elements. ASTM E488-96. West Conshohocken, PA: ASTM International. doi: 10.1520/E0488-96.
24. Nowak, A. S. and K. R. Collins. 2000. Reliability of Structures. Boston, MA: McGraw-Hill.
Notation
Aps = area of prestressing steel in wythe
As = area of mild steel in wythe
b = slab width
Ec = modulus of elasticity of concrete
fc' = concrete compressive strength

87PCI Journal | September–October 2018
fpu = ultimate stress of prestressing strands
fpy = prestressing steel yield stress
ft = concrete tensile strength
fy = steel yield stress
FE = elastic load limit
Fu = ultimate capacity/strength or peak load
I1 = moment of inertia for wythe 1
I2 = moment of inertia for wythe 2
KE = elastic stiffness
KIE = inelastic stiffness
M1 = cracking moment of wythe 1
M2 = cracking moment of wythe 2
MT = total cracking moment of sandwich panel
P = load
twythe1 = thickness of wythe 1
V = shear force
δ = displacement
ΔE = deflection corresponding to the elastic load limit
ΔU = deflection corresponding to the ultimate capacity

88 PCI Journal | September–October 2018
About the authors
Salam Al-Rubaye is a lecturer at Tikrit University in Tikrit, Iraq, and a graduate research assistant at Utah State University in Logan, Utah. His current research involves finding simplified methods to predict the behavior of the partially composite concrete sandwich
panel. He received outstanding student awards in 2012 from the College of Engineering at Tikrit University and in 2015 from the College of Humanities and Social Sciences at Utah State University.
Taylor Sorensen, MS, is a PhD candidate and research assistant at Utah State University. His interests include concrete sand-wich wall panels, structural sustainability, engineering education, and the bassoon.
Jaiden T. Olsen, MS, EIT, is a structural engineer for BHB Structural Engineers in Salt Lake City, Utah. His interests include structural engineering, gardening, spending time with family, and spending time outdoors.
Marc Maguire, PhD, is an assistant professor of civil and environmental engineering at Utah State University. He is a member of PCI and serves on the Precast Insulated Wall Panels Committee, among others.
Abstract
As energy codes become more stringent, the thermal efficiency of precast concrete sandwich wall panels will be more important. Since the 1990s, sandwich panel wythe connectors, often made of fiber-reinforced polymers (FRPs), have been used to provide both ther-mal and structural efficiency. However, designing such panels has been empirical and relies solely on connec-tor properties provided by the connector companies, making the design process difficult for precast concrete engineers. This paper explains how data collected from small, inexpensive push-off specimens can be used to predict elastic behavior of precast concrete sandwich wall panels. In this study, several different FRP con-nectors on component-scale push-off specimens under-went shear testing. The variables studied were wythe thickness, insulation type, and insulation bond. Eight full-scale specimens were fabricated with different connector types and configurations and tested to val-idate the proposed elastic analysis methodology. The authors created a generalized and simple beam-spring model that uses beams to represent the concrete wythes and springs to model the shear deformation behavior created by the rigid insulation and shear connectors. The beam-spring model provided measured-to-predict-ed ratios of 0.95 and 0.97 for cracking and deflections, respectively, validating its use as a generalized design tool.
Keywords
Composite action, fiber-reinforced polymer, partially composite, sandwich wall panel, shear connector.
Review policy
This paper was reviewed in accordance with the Precast/Prestressed Concrete Institute’s peer-review process.
Reader comments
Please address any reader comments to PCI Journal editor-in-chief Emily Lorenz at [email protected] or Precast/Prestressed Concrete Institute, c/o PCI Journal, 200 W. Adams St., Suite 2100, Chicago, IL 60606.