evaluating credit risk models using loss density forecasts: a synopsis amanda k. geck undergraduate...
TRANSCRIPT
Evaluating Credit Risk Models Using Loss Density Forecasts:
A Synopsis
Amanda K. Geck
Undergraduate Student
Department of Computational and Applied Mathematics
Rice University
November 12, 2003
Outline
Background information/motivation
Frerichs-Löffler evaluation framework, Berkowitz procedure
Two-state model, Multi-state model
Applications
Conclusions

Background information/motivationFrerichs-Löffler evaluation framework, Berkowitz procedure
Two-state model, Multi-state model
Applications
Conclusions

What is credit risk?
Credit risk is the chance that a borrower will default on a loan
Firm defaults when asset value drops below critical value determined by liabilities (Merton 1974)

Who uses credit risk models?
Banks
Bank regulators
Risk managers
What is a portfolio credit risk model?
Quantifies potential losses/gains from holding portfolio of risky debt
Produces probability distribution for value effects of credit-related events
Characteristics of portfolio credit risk models
Some restrict analysis to losses from defaults
Some include effects of credit quality changes
Many capture credit event correlations through correlated latent variables
Limitations
Scarcity of credit events
Long forecast horizons
Data limitations
Evaluation procedure concerns
Research Scarce
Only empirical paper: Nickell, Perraudin, Varotto (2001)
Only theoretical paper: Lopez, Saidenberg (2001)

Background information/motivation
Frerichs-Löffler evaluation framework, Berkowitz procedureTwo-state model, Multi-state model
Applications
Conclusions
Frerichs-Löffler Framework
Monte Carlo study
H0 is correct, rejection frequency should be equal to chosen significance level
H0 wrong, rejection frequency (power of test) should be as high as possible
Berkowitz Test Procedure
Observed credit losses transformed into iid standard normal random variables
H0 = model is correct
Standard likelihood ratio tests

Background information/motivation
Frerichs-Löffler evaluation framework, Berkowitz procedure
Two-state model, Multi-state modelApplications
Conclusions

Two-state model
Neglects migration risk and recovery rate
Describes full loss distribution by distribution of number of defaults in portfolio
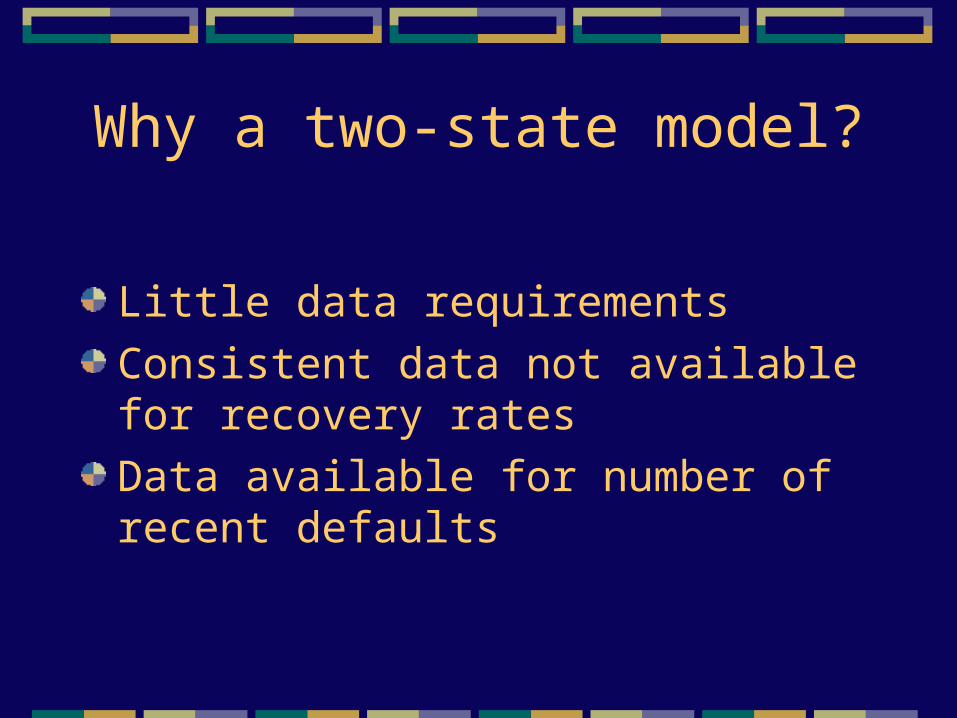
Why a two-state model?
Little data requirements
Consistent data not available for recovery rates
Data available for number of recent defaults
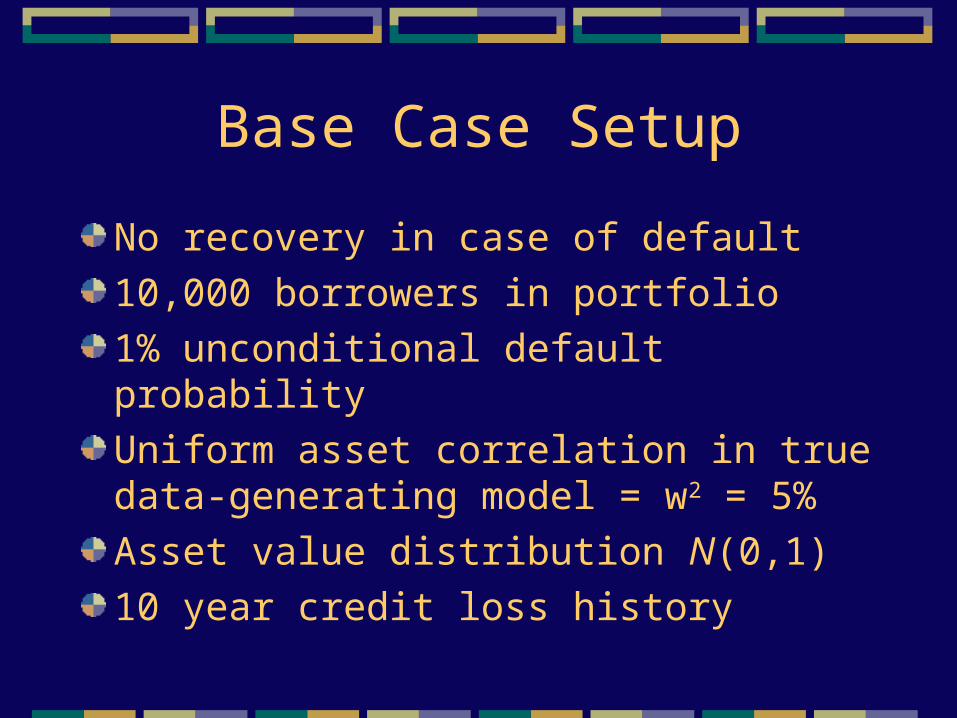
Base Case Setup
No recovery in case of default
10,000 borrowers in portfolio
1% unconditional default probability
Uniform asset correlation in true data-generating model = w2 = 5%
Asset value distribution N(0,1)
10 year credit loss history
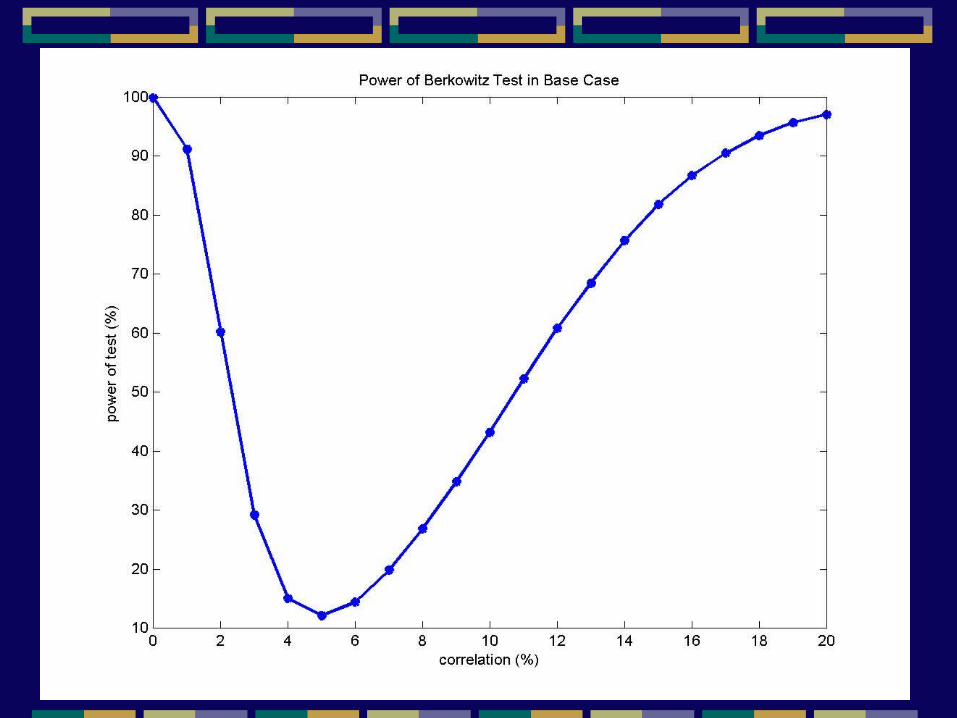
Base Case
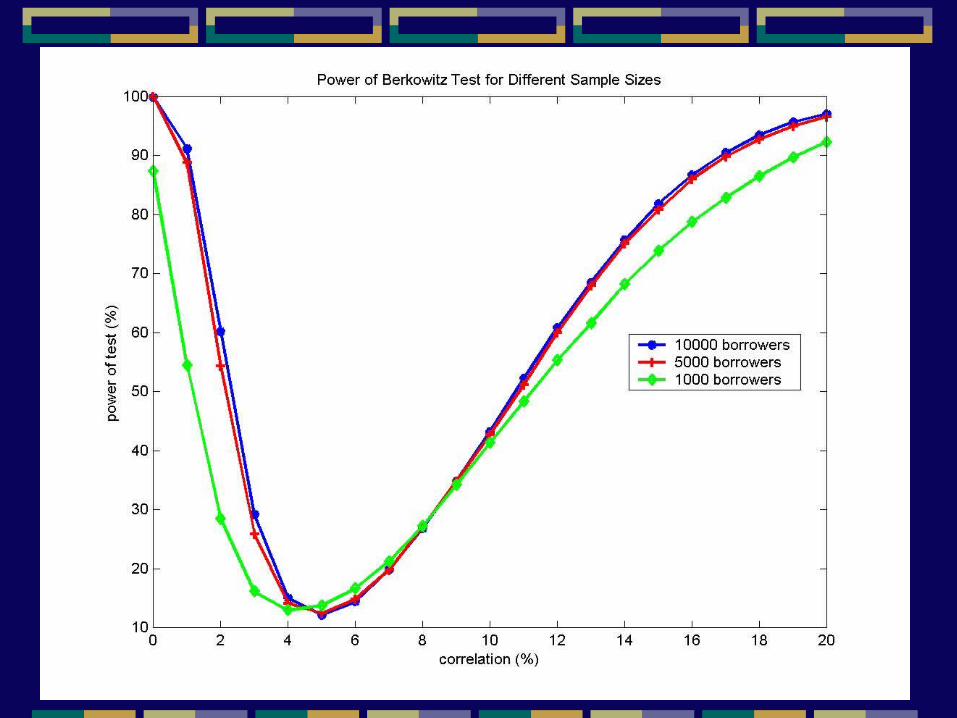
Different Sample Sizes

Different Histories

Issues with two-state model
Choosing an appropriate asset correlation value
Detecting misspecifications in asset correlation when default probability estimates noisy

Heterogeneous portfolio
Split portfolio into seven rating classes
Add noise: Overestimate by 50% default probabilities
for half of borrowers in each rating classUnderestimate by 50% for other half
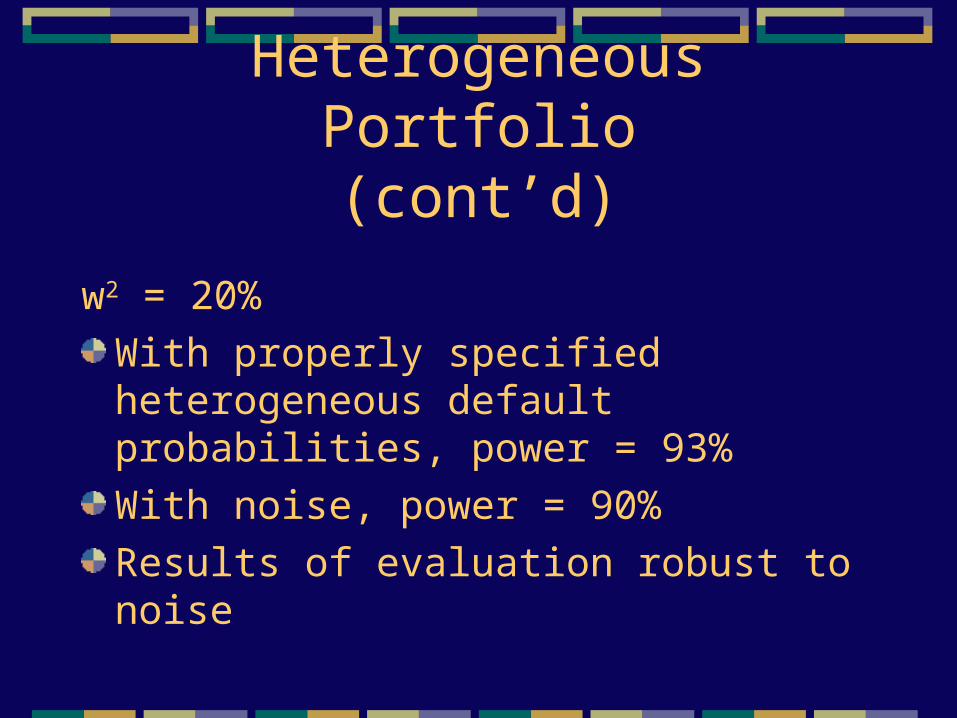
Heterogeneous Portfolio(cont’d)
w2 = 20%
With properly specified heterogeneous default probabilities, power = 93%
With noise, power = 90%
Results of evaluation robust to noise

Heterogeneous Default Probabilities
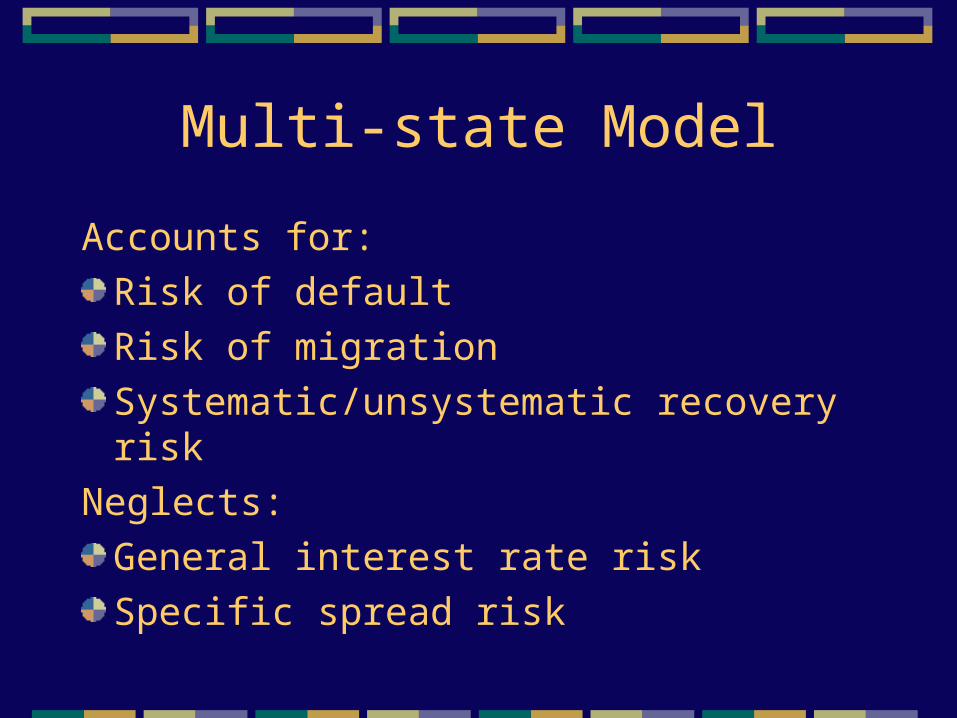
Multi-state Model
Accounts for:
Risk of default
Risk of migration
Systematic/unsystematic recovery risk
Neglects:
General interest rate risk
Specific spread risk
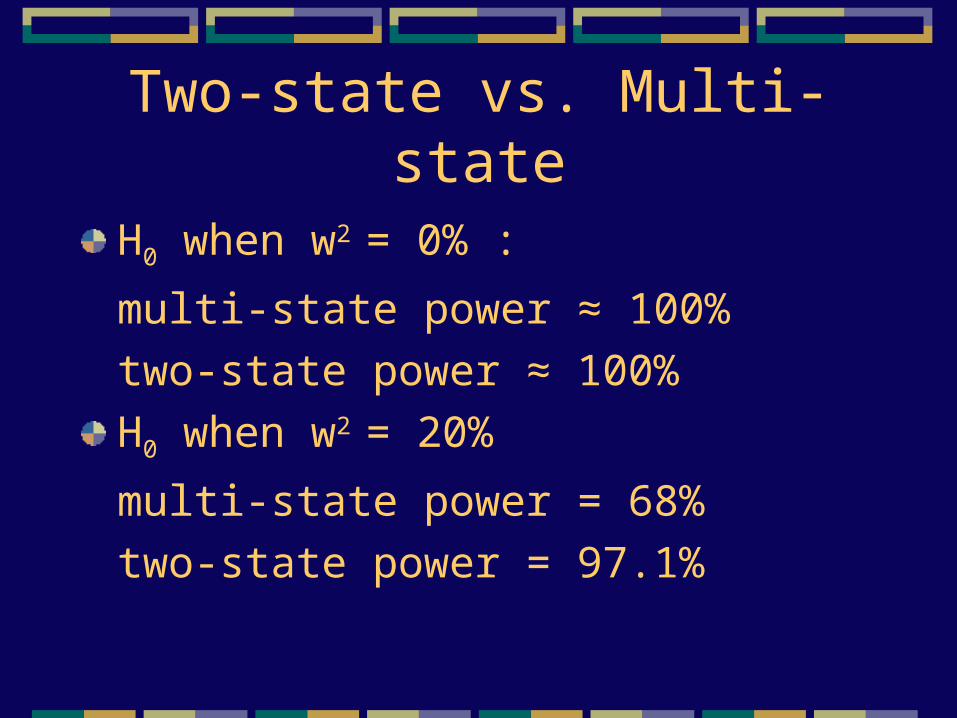
Two-state vs. Multi-state
H0 when w2 = 0% :
multi-state power ≈ 100%
two-state power ≈ 100%
H0 when w2 = 20%
multi-state power = 68%
two-state power = 97.1%

Why is two-state power higher?
Compare unexpected losses
Multi-state: w2 = 20% leads to unexpected loss 1.7 times higher than with w2 = 5%
Two-state: same ratio is 3 times higher
Background information/motivation
Frerichs-Löffler evaluation framework, Berkowitz procedure
Two-state model, Multi-state model
ApplicationsConclusions

Applications for Banks
Use evaluation method to:
Confirm or improve chosen model specifications
Assess powers of models applied to bank’s data
Decide weight given to results in specification process
Applications for Regulators
Validate underlying assumptions of new capital adequacy framework (Basel Committee, 2001)Encourage banks with enough records of past losses to check consistency with Basel assumptionsCheck if assumptions sufficient on average
Background information/motivation
Frerichs-Löffler evaluation framework, Berkowitz procedure
Two-state model, Multi-state model
Applications
Conclusions

Conclusions
Tests good for identifying misspecifications of asset value distribution
Results robust to variations in portfolio size and composition
Power significantly better for two-state model than for multi-state
Reference
Frerichs and Löffler, “Evaluating Credit Risk Models Using Loss Density Forecasts”, Journal of Risk, Summer 2003