evaluating community choice aggregation …innovation.luskin.ucla.edu/sites/default/files/evaluating...
TRANSCRIPT

EVALUATING COMMUNITY CHOICE AGGREGATION ALTERNATIVES FOR THE
CITY OF SANTA MONICA
Kelly Trumbull, Julien Gattaciecca, J.R. DeShazo
December 2017

1
Table of Contents EXECUTIVE SUMMARY .................................................................................... 3
Evaluative Criteria .................................................................................... 3
Overarching Considerations ....................................................................... 4
An Assessment of the Options .................................................................... 5
CHAPTER 1: INTRODUCTION ........................................................................... 7
CHAPTER 2: STATUS OF EACH OPTION ........................................................... 10
2.1 Overview ............................................................................................ 10
2.2 Timelines and Operational Readiness...................................................... 13
2.3 Start and Termination Processes ............................................................ 14
CHAPTER 3: GOVERNANCE ............................................................................ 16
3.1 Decision-Making Process ....................................................................... 16
3.2 Reflecting Local Preferences .................................................................. 20
CHAPTER 4: ENERGY PROCUREMENT .............................................................. 22
4.1 Power Content and Rate Comparison ...................................................... 22
4.2 Category 3 Renewable Energy Certificates .............................................. 24
4.3 Exploring the 100% Renewable Option ................................................... 25
4.4 Energy Services and Third-Party Contracts.............................................. 26
CHAPTER 5: ECONOMICS AND FINANCE ......................................................... 31
5.1 Startup Costs ...................................................................................... 31
5.2 Economies of Scale in Operating Costs ................................................... 33
5.3 Local Program Financing ....................................................................... 35
CHAPTER 6: FUTURE CHALLENGES ................................................................. 37
6.1 Legislative Risks .................................................................................. 37
6.2 Regulatory Risks: PCIA ......................................................................... 39
6.3 Market Force Risks ............................................................................... 41
CHAPTER 7: CONCLUSION ............................................................................ 46

2
AUTHORSHIP
UCLA Luskin Center for Innovation
Dr. J.R. DeShazo, principal investigator, co-author, and center director;
Julien Gattaciecca, co-author and project manager; and
Kelly Trumbull, co-author and researcher
ACKNOWLEDGEMENTS
We would like to thank Garrett Wong and Ariana Vito of the City of Santa Monica for
commissioning this report. We also wish to acknowledge contributions from staff with
the three community choice aggregator alternatives focused on in this report.
Specifically, the following dedicated individuals generously contributed their time to
review the report and provide data and information essential to our analysis: Gary
Gero and Bill Carnahan from Los Angeles Community Choice Energy (LACCE) along
with LACCE consultants Gary Saleba and Anne Falcon from EES Consulting; Samuel
Golding from Community Choice Partners, representing South Bay Clean Power; and
Patti Garibay and Barbara Boswell from California Choice Energy Authority (CCEA)
along with CCEA consultants John Dalessi and Brian Goldstein from Pacific Energy
Advisors Inc. We also thank representatives from existing CCAs, including Katherine
Hernandez from Pico Rivera Innovative Municipal Energy, and Amy Butte, member of
the Santa Monica Task Force.
Finally, we would like to thank our colleagues at the Luskin Center for Innovation:
Colleen Callahan for reviewing and editing the report, and Christian Zarate for the
report design and layout.
DISCLAIMER
The UCLA Luskin Center for Innovation appreciates the contributions of the
aforementioned individuals. This paper, however, does not necessarily reflect their
views nor is an endorsement of its findings. Any errors are those of the authors.
FOR MORE INFORMATION
Contact: [email protected] or [email protected].
UCLA Luskin Center for Innovation: www.innovation.luskin.ucla.edu. ©
December 2017 by the Regents of the University of California, Los Angeles. All
rights reserved. Printed in the United States.
3
EXECUTIVE SUMMARY
Community choice aggregators (CCAs) are a new type of retail electricity provider that allows cities or counties to make decisions about what kinds of energy resources
in which to invest in for themselves rather than relying on traditional investor-owned utilities. Since 2010, California communities have established nine CCAs. Additionally,
over a dozen communities are actively exploring CCA options. Multiple CCA models have arisen out of this rapid growth.
The City of Santa Monica commissioned this report by the UCLA Luskin Center for Innovation as an analysis of the following three CCA options that the City is
considering:
Join Los Angeles Community Choice Energy (LACCE), a Los Angeles County-
wide CCA composed of all unincorporated areas and any city that wishes to join a larger, regional CCA effort;
Initiate South Bay Clean Power (SBCP), a CCA designed for a group of South Bay and Westside Cities; or
Create a single-city CCA through the services of California Choice Energy
Authority (CCEA), which pools services for multiple single-city CCAs.
Despite the Santa Monica focus of this report, the analysis may be relevant to other cities exploring similar options. For readers less familiar with CCAs, their status in California, and the opportunities and challenges they face, an earlier report by the
UCLA Luskin Center for Innovation could provide a helpful introduction; see footnote.1
Evaluative Criteria
As a progressive community, the City of Santa Monica has ambitious environmental goals that involve decarbonization, green electricity, and local energy programs such as distributed energy generation, battery storage, electric vehicles, charging stations,
energy efficiency, and demand response programs.
With this in mind, the UCLA Luskin Center for Innovation compared all three CCA options using the following evaluative criteria that reflect the City’s goals:
Which CCA structure gives the most authority to Santa Monica to make
decisions to achieve its environmental goals? Which option provides the most resilient structure to protect against future
legislative, regulatory, and competition risks? Which option offers the greatest economies of scale that would support future
opportunities?
1 UCLA Luskin Center for Innovation (2017). The Promises and Challenges of Community Choice Aggregation in
California. http://innovation.luskin.ucla.edu/content/promises-and-challenges-community-choice-aggregation-california-0

4
Overarching Considerations The UCLA Luskin Center for Innovation identifies the following set of major considerations and tradeoffs to assist Santa Monica in its decision-making process.
Operational Readiness
An important practical consideration is the operational readiness associated with each option. LACCE is operationally ready and plans to launch in February 2018. SBCP is
at an earlier, conceptual stage and will require significant effort and resources to become operational. CCEA recently provided Santa Monica with its feasibility study,
the first step that would allow Santa Monica to form a single-city CCA through CCEA. Santa Monica could possibly launch its CCA in July 2018, provided some staff time and upfront costs from the City.
Autonomy versus Economies of Scale
Generally, an individual city’s vote share will reduce as more members join their CCA. Chapter 2 of this report analyzes the potential dilution of Santa Monica’s vote under
different membership scenarios for LACCE and SBCP. Although LACCE members differ in size, all decisions will need a majority to pass and no one member could overturn
any decision made by a simple majority. Weighted votes are unlikely based on the experience of existing multi-member CCAs, which tend to have very collaborative decision-making processes with ample time for discussion prior to a vote.
Alternatively, larger CCAs do benefit from economies of scale in operating costs, as
illustrated in Chapter 3. Therefore, Santa Monica may consider the tradeoffs between lower amounts of direct influence versus greater cost competitiveness. Yet economies
of scale and autonomy are not necessarily mutually exclusive. Much will depend on the design and policies set by the CCA. Finally, larger CCA options could offer Santa Monica the ability to form coalitions with other likeminded member cities and
influence the strategy and direction of the entire CCA.
Market Competitiveness and Resiliency Chapter 6 of this report discusses specific regulatory, legislative, and market risks
that CCAs may face in the future. We compare each option’s risk management strategies and put them in perspective with comments we received from several
industry specialists. General recommendations by each entity typically include establishing rate stabilization funds, paying off loans quickly, and actively participating with other CCAs in regulatory and legislative discussion at the state
level.
Planning ahead to mitigate risks is critical in an increasingly competitive electricity retail market. Our discussions with industry experts have emphasized the importance of a CCA achieving financial solvency as quickly as possible. From this financial
perspective, there are potential benefits of being a member of a larger CCA. With a

5
likely greater competition and a more challenging energy market in the future, energy industry experts believe that being part of a larger CCA can offer competitive
advantages when it comes to financing, contracting, and long-term energy procurement.
Advanced Technical and Managerial Capacities
Industry experts also recommend that Santa Monica consider the technical and managerial capacities of staff, consultants and vendors associated with each option,
and their ability to integrate new, innovative strategies. An example of an innovative strategy is the horizontal integration of energy services for more efficient risk management, as recommended by the SBCP draft business plan. Since this type of
advanced capacities is a recent development among CCAs, we have not yet been able to be evaluate costs and benefits in practice. However, we describe the importance
of new capacities and include some suggestions from industry experts.
An Assessment of the Options
The following is our summarized assessment of Santa Monica’s three options.
Los Angeles Community Choice Energy will be a relatively large CCA with member cities across Los Angeles County. This may mean less influence for Santa Monica, in terms of its direct vote. However, this option could also provide the City with the
greatest economies of scale and potential financial stability. LACCE’s large size and associated financial capabilities probably best position Santa Monica to meet
ambitious renewable energy and other environmental goals by avoiding long-term risks. Its county-wide membership also offers member cities the opportunity to collaborate, share resources, and potentially amplify their impact at local, regional,
and state levels. As potentially the largest CCA in California, LACCE could have a strong voice on important legislative and regulatory discussions that lay ahead.
South Bay Clean Power has become more a set of recommendations than an operationally ready option. SBCP’s business plan includes innovative, sophisticated
strategies for a next generation CCA, which others outside of SBCP could adopt. With no other currently committed members (some of the cities included in its feasibility
study have since joined LACCE), SBCP would very likely be smaller than LACCE. This means that Santa Monica could have greater influence in decisions made by this CCA compared to LACCE, but would benefit from fewer economies of scale. In order to
pursue this option Santa Monica may have to take the lead in creating it.
California Choice Energy Authority’s business model allows for members cities to have full autonomy over many important decisions such as rates, power mixes and
local program investments. The City would also have to approve any long-term energy procurement contracts. However, some uncertainty remains regarding the amount of power the City would have over decisions taken by the CCEA’s board
regarding the approval of new members and the choice of third-party contractors for

6
energy procurement, scheduling operations, and data management. While CCEA staff have pledged to do their best to reflect the City’s policy decisions and environmental
goals, it may not be realistic to expect CCEA to change its approach to energy procurement and services based on one individual member’s request. Additionally,
Santa Monica would likely not benefit from the economies of scale offered by a greater CCA.

7
CHAPTER 1: INTRODUCTION
The proliferation of CCAs across California has been exponential. As the figure below
demonstrates, the state went from one CCA launch per year in 2014 and 2015, to
two CCAs launches in 2016, four in 2017, and an expected eight in 2018. With the
successful track record and differing business models of existing CCAs, municipalities
now have the choice between several CCA alternatives.
Figure 1. Timeline of CCA Launches
Figure note: Figure made by the UCLA Luskin Center for Innovation. The above acronyms from left to
right are defined as follows: MCE, Marin Clean Energy; SCP, Sonoma Clean Power, LCE, Lancaster Choice
Energy; CPSF, Clean Power San Francisco; PCE, Peninsula Clean Energy; SVCE, Silicon Valley Clean
Energy; AVCE, Apple Valley Choice Energy; RCEA, Redwood Coast Energy Authority; and PRIME, Pico
Rivera Innovative Municipal Energy.
As each community has unique local needs and preferences, there is no CCA design
that is universally ideal for every city and county across the state. With multiple
proven cases of successful CCAs, the City of Santa Monica is naturally questioning
which of the three available CCA options to pursue for the benefit of their residents:
Join Los Angeles Community Choice Energy (LACCE), a Los Angeles County-
wide CCA composed of all unincorporated areas and any city that wishes to
join a larger, regional CCA effort;
Initiate South Bay Clean Power (SBCP), a CCA designed for a group of cites in
the South Bay and Westside sub-regions of Los Angeles County; or
Create a single-city CCA through the California Choice Energy Authority
(CCEA), which pools services for multiple single-city CCAs.
Currently, Santa Monica (and most of the rest of Los Angeles County) receives
electricity service from Southern California Edison (SCE), an investor-owned utility.
Regardless of which CCA option Santa Monica chooses, they would continue to receive

8
transmission, delivery, and billing services from SCE. A CCA gives Santa Monica the
opportunity to buy energy on behalf of its residents and, as a non-profit, to reinvest
revenues from the program back into the community.
Santa Monica has goals to achieve the highest percentage of renewables as soon as
possible and to utilize the CCA’s position and funds to support decarbonization and
local energy programs such as distributed energy generation, battery storage
systems, energy efficiency, demand response programs, and the electrification of its
transportation system. Santa Monica has already specified a variety of environmental
targets including:
Installing 300 public electric vehicle charging stations by 2022;
Reducing energy use in existing buildings by 50% by 2035;
Implementing a Community Energy Challenge program by 2035;
And achieving carbon neutrality potentially by 2050.
This report evaluates the potential risks and benefits of the options, including how
each could help Santa Monica achieve its stated goals, maintain a leadership role in
the governance of the CCA, and minimize financial risks. In order to conduct this
analysis for the City of Santa Monica, researchers with the UCLA Luskin Center for
Innovation reviewed all relevant documents available and interviewed stakeholders
and representatives of the three CCA options, as well as their consultants. We
compared their recommendations, financial strategies and business plans, and
discussed key elements with staff of existing CCAs as well as industry experts in
energy procurement, regulatory and legal affairs, data management and billing.
Chapter 2 provides the status and operational readiness of each option, the launch
timelines, and the start and termination processes of each option.
Chapter 3 discusses which CCA governance best provides Santa Monica with decision-
making autonomy to achieve its environmental goals and better reflects its local
preferences. We provide an analysis of Santa Monica’s weighted vote share based on
different membership scenarios.
Chapter 4 examines the energy procurement strategy suggested by each option.
While many decisions regarding power procurement have yet to be made by each
option, we look at their estimated power content and forecasted rates. This report
also looks at the energy policies suggested, including the use of unbundled
Renewable Energy Certificates (Category 3), as well as the opportunity to enroll all
of the City’s customers into the 100% renewable product.

9
Chapter 5 assesses how each option may impact Santa Monica’s financial obligations
in regard to startup and operating costs. We also compare each option’s financial
strategy with existing CCAs’ financial reports to quantify the economies of scale.
Finally, we look at each option’s suggestions to support and finance the
implementation of local energy programs.
As it is important to consider the CCA’s ability to provide benefits in the long term,
chapter 6 identifies possible future legislative, regulatory, and market force risks that
could decrease CCAs’ competitiveness, and compares each option’s mitigation
strategies.
We conclude by summarizing the strengths and tradeoffs of each option.

10
CHAPTER 2: STATUS OF EACH OPTION
2.1 Overview
Los Angeles Community Choice Energy
A motion by Supervisors Knabe and Kuehl in 2015 initiated the creation of Los
Angeles Community Choice Energy (LACCE). The County Office of Sustainability,
within the Los Angeles County Internal Services Department, took the lead in
developing this CCA and now has a leading role in the implementation of this CCA.
LACCE is a joint powers authority (JPA) composed of member cities and the
unincorporated areas of Los Angeles County. LACCE has published its business plan,
business plan update, implementation plan, and joint powers authority agreement.2
According to LACCE representatives, as of December 1, 2017 members include:
Unincorporated Los Angeles County
Alhambra
Calabasas
Carson
Claremont
Downey
Rolling Hills Estates
Sierra Madre
South Pasadena
West Hollywood
Three cities (Agoura Hills, Beverly Hills, and Culver City) have adopted the first
reading of the ordinance and have scheduled a second reading. Five other cities have
scheduled a first reading of the ordinance (Hawthorne, Manhattan Beach, Paramount,
Redondo Beach, and West Covina). At least seven other cities are considering joining
LACCE.
2LACCE (2016). “County of Los Angeles Community Choice Energy Business Plan.”
https://www.lacounty.gov/files/sustainability/LACCE%20Feasibility%20study.pdf; LACCE (2017). “Los Angeles Community Choice Energy Business Plan Update.” https://www.lacounty.gov/files/sustainability/LACCE%20Business%20Plan%20Update_4.18.2017.pdf ; LACCE (2017). “Los Angeles Community Choice Energy (LACCE) Community Choice Aggregation Implementation Plan and Statement of Intent.” https://www.lacounty.gov/files/sustainability/LACCE%20Implementation%20Plan%20Packet.pdf; LACCE. “Los Angeles Community Choice Energy Authority Joint Powers Agreement.” http://ceo.lacounty.gov/pdf/sustainability/Final%20JPA_No%20Exhibit%20Title%20Page_04.20.17.pdf
11
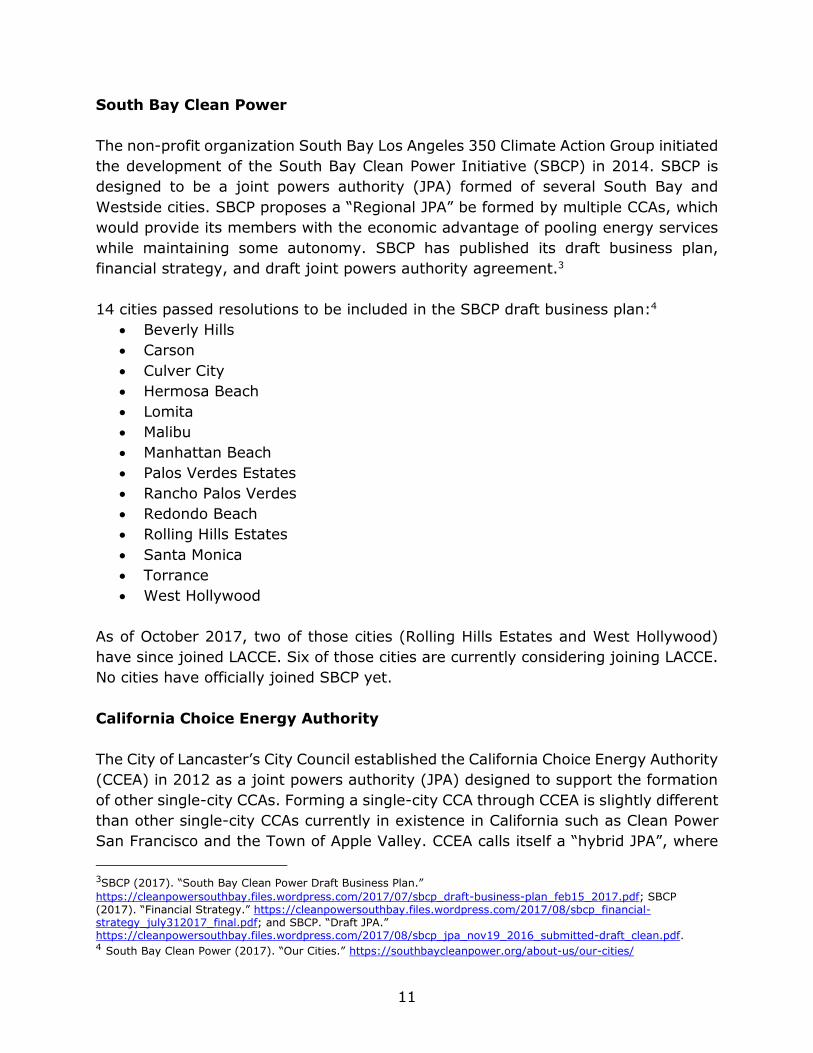
South Bay Clean Power
The non-profit organization South Bay Los Angeles 350 Climate Action Group initiated
the development of the South Bay Clean Power Initiative (SBCP) in 2014. SBCP is
designed to be a joint powers authority (JPA) formed of several South Bay and
Westside cities. SBCP proposes a “Regional JPA” be formed by multiple CCAs, which
would provide its members with the economic advantage of pooling energy services
while maintaining some autonomy. SBCP has published its draft business plan,
financial strategy, and draft joint powers authority agreement.3
14 cities passed resolutions to be included in the SBCP draft business plan:4
Beverly Hills
Carson
Culver City
Hermosa Beach
Lomita
Malibu
Manhattan Beach
Palos Verdes Estates
Rancho Palos Verdes
Redondo Beach
Rolling Hills Estates
Santa Monica
Torrance
West Hollywood
As of October 2017, two of those cities (Rolling Hills Estates and West Hollywood)
have since joined LACCE. Six of those cities are currently considering joining LACCE.
No cities have officially joined SBCP yet.
California Choice Energy Authority
The City of Lancaster’s City Council established the California Choice Energy Authority
(CCEA) in 2012 as a joint powers authority (JPA) designed to support the formation
of other single-city CCAs. Forming a single-city CCA through CCEA is slightly different
than other single-city CCAs currently in existence in California such as Clean Power
San Francisco and the Town of Apple Valley. CCEA calls itself a “hybrid JPA”, where
3SBCP (2017). “South Bay Clean Power Draft Business Plan.”
https://cleanpowersouthbay.files.wordpress.com/2017/07/sbcp_draft-business-plan_feb15_2017.pdf; SBCP (2017). “Financial Strategy.” https://cleanpowersouthbay.files.wordpress.com/2017/08/sbcp_financial-strategy_july312017_final.pdf; and SBCP. “Draft JPA.” https://cleanpowersouthbay.files.wordpress.com/2017/08/sbcp_jpa_nov19_2016_submitted-draft_clean.pdf. 4 South Bay Clean Power (2017). “Our Cities.” https://southbaycleanpower.org/about-us/our-cities/
12
some decision-making autonomy is delegated to the city council of the participating
city while the JPA board is governed by the Lancaster City Council.5 Because CCEA
already exists, there are fewer steps required compared to initiating a new single-
city CCA. CCEA provided the City of Santa Monica with a draft feasibility study and
its JPA agreement in November 2017.6
Currently, CCEA has four members:
Lancaster
Pico Rivera
San Jacinto
Rancho Mirage
5 California Choice Energy Authority (2017). “About CCEA.” https://californiachoiceenergyauthority.com/about/ 6 CCEA (2017). “City of Santa Monica. Community Choice Aggregation Technical Study: Summary of Results”; CCEA
(2012). “Joint Exercise of Powers Agreement Relating to the California Clean Energy Authority.”
13
2.2 Timelines and Operational Readiness
LACCE is the most operationally ready option as it submitted its implementation plan
to the CPUC and is awaiting certification.7 LACCE is expecting to begin serving all
county municipal accounts beginning in February 2018 (during what is referred to as
phase 1).8 All municipal, commercial, and industrial customers will be enrolled by
June 2018 (phase 2), with all remaining customers, including residential customers,
enrolled by December 2018 (phase 3).9
SBCP originally targeted a June 2018 launch date with a three-step phase-in.
Primarily non-residential customers (composing approximately 28% of the load) were
to be enrolled in June 2018 (phase 1). Residential customers (21% of the load) would
be enrolled in October 2018 (phase 2), with the remaining non-residential customers
(51% of the load) enrolled in June of 2019 (phase 3).10 Because no cities have
initiated SBCP yet, it has become more a set of recommendations than an
operationally ready option and it is unlikely that this CCA would be ready by its
original targeted launch date.
CCEA estimates that Santa Monica could launch a single-city CCA in July 2018, given
that Santa Monica initiates the necessary startup.11
7 LACCE (2017). “LACCE Community Choice Aggregation Implementation Plan and Statement of Intent.” Page 1. 8 LACCE (2017). “Regular Meeting of the Board of Directors of the Los Angeles Community Choice Energy
Authority.” https://www.lacounty.gov/files/sustainability/LACCE%20Board%20of%20Directors%20Meeting%20Agenda%20Packet_November%202%2C%202017.pdf 9 LACCE (2017). “LACCE Community Choice Aggregation Implementation Plan and Statement of Intent.” Page 15. 10 SBCP (2017). “Financial Strategy.” Page 20. 11 CCEA (2017). “City of Santa Monica. Community Choice Aggregation Technical Study: Summary of Results.”
Page 14.
14
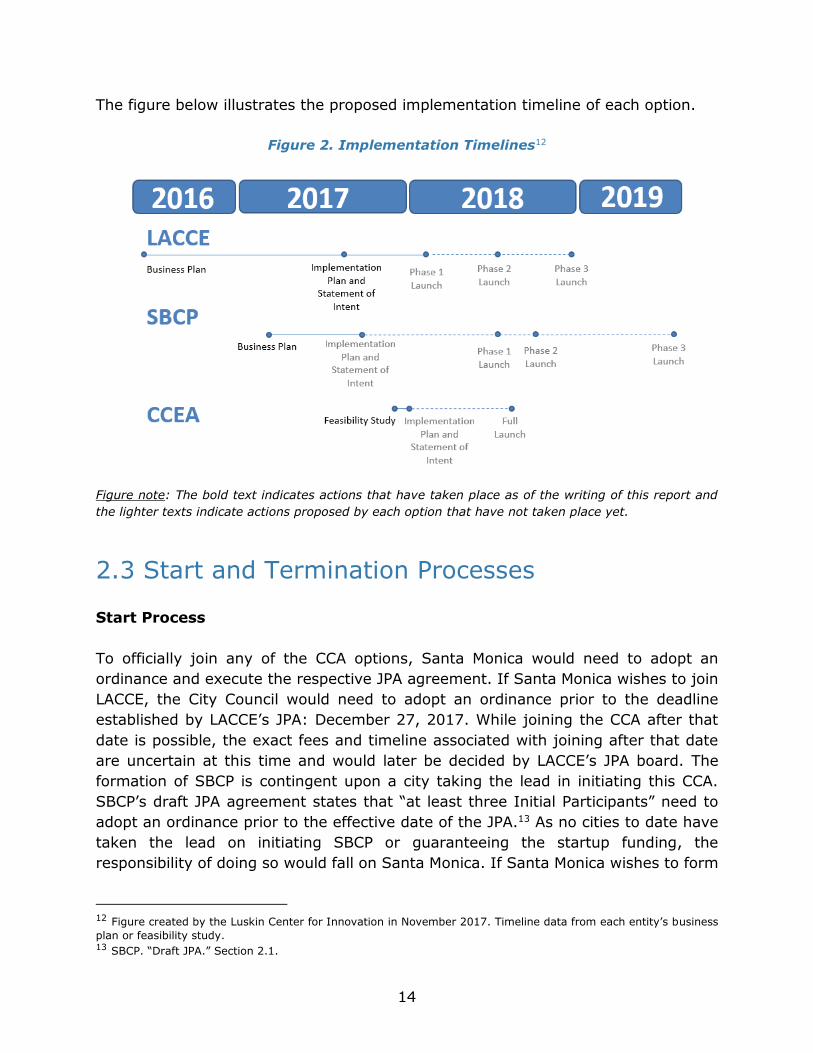
The figure below illustrates the proposed implementation timeline of each option.
Figure 2. Implementation Timelines12
Figure note: The bold text indicates actions that have taken place as of the writing of this report and
the lighter texts indicate actions proposed by each option that have not taken place yet.
2.3 Start and Termination Processes
Start Process
To officially join any of the CCA options, Santa Monica would need to adopt an
ordinance and execute the respective JPA agreement. If Santa Monica wishes to join
LACCE, the City Council would need to adopt an ordinance prior to the deadline
established by LACCE’s JPA: December 27, 2017. While joining the CCA after that
date is possible, the exact fees and timeline associated with joining after that date
are uncertain at this time and would later be decided by LACCE’s JPA board. The
formation of SBCP is contingent upon a city taking the lead in initiating this CCA.
SBCP’s draft JPA agreement states that “at least three Initial Participants” need to
adopt an ordinance prior to the effective date of the JPA.13 As no cities to date have
taken the lead on initiating SBCP or guaranteeing the startup funding, the
responsibility of doing so would fall on Santa Monica. If Santa Monica wishes to form
12 Figure created by the Luskin Center for Innovation in November 2017. Timeline data from each entity’s business
plan or feasibility study. 13 SBCP. “Draft JPA.” Section 2.1.
15
a single-city CCA through CCEA, they would need to follow the six-month
implementation timeline for all necessary startup activities as advised by the
feasibility study.
Termination Process
LACCE and SBCP offer the ability to withdraw from the JPA similarly by giving six
months’ notice. In the event that power contracts had been entered into on the City’s
behalf, Santa Monica would be responsible for any costs incurred from the re-sale of
this excess contracted power. Such a policy is standard among existing CCAs in order
to prevent remaining customers from bearing the cost of departing cities. If too many
members terminate a JPA or if too many residents opt-out, the CCA may need to
mutually terminate and return customers to Southern California Edison (SCE).
Through CCEA, Santa Monica would not be able to exit the JPA until the expiration of
the longest power contract.14
While unlikely, there could be future political or financial changes that impact a
member city’s ability or willingness to remain with a CCA. To date, no cities have left
or terminated CCAs in California.
14 CCEA. “First Amendment to the Joint Exercise of Powers Agreement Relating to the California Clean Energy
Authority.” Section 12.

16
CHAPTER 3: GOVERNANCE
3.1 Decision-Making Process
Distribution of Power between Board Members and the JPA
Each option offers Santa Monica varying levels of autonomy and involvement in the
decision-making process. All three options are governed by their respective Joint
Powers Authority (JPA) board. LACCE and SBCP’s boards are composed of one voting
director from each member city or county. CCEA has a different approach where they
delegate full autonomy to members for most decisions such as but not limited to
rates, power mixes, and local energy programs. However, the JPA board is solely
composed of Lancaster City Councilmembers. Consequently, associate JPA members
do not have a right to vote on certain decisions that rest with the JPA board, including
the approval of new members.
The table below presents how decision-making power would be distributed between
the stakeholders that compose each CCA, and can be divided into three categories:
decisions made by the individual members autonomously; decisions made collectively
through votes by member cities; and decisions made independent of member cities.
Table 1. Distribution of Decision-Making Autonomy for Each Option
LACCE SBCP CCEA
Decisions made by the individual members autonomously
· Default product · TBD by board
· TBD by board
· Rate setting · Programs · Power content · Default product
Decisions made collectively through votes by member cities
· Rate setting · Local programs · Power content · Power procurement · Approving additional member cities · Contracts with third-parties
· Rate setting · Local programs · Power content · Power procurement · Default product · Approving additional member cities · Contracts with third-parties
· None (the board members of the CCEA JPA are solely composed of the Lancaster City Council members)
Decisions made independent of member cities, or with little input from member cities
· None · None
- · All power procurement and balancing less than 5 years
- · Contracts with third-parties - · Approving additional
member cities
17
Veto and Weighted Vote
Most decisions made by the LACCE and SBCP boards require the approval of the
simple majority of board members that are present during the meeting. However, if
members disagree with an affirmative decision, they have the right to call a weighted
vote, where each member’s share of the vote is based on their size. LACCE requires
at least three members to call a weighted vote, which is calculated based on each
members’ load, while SBCP only requires one member to call a weighted vote, which
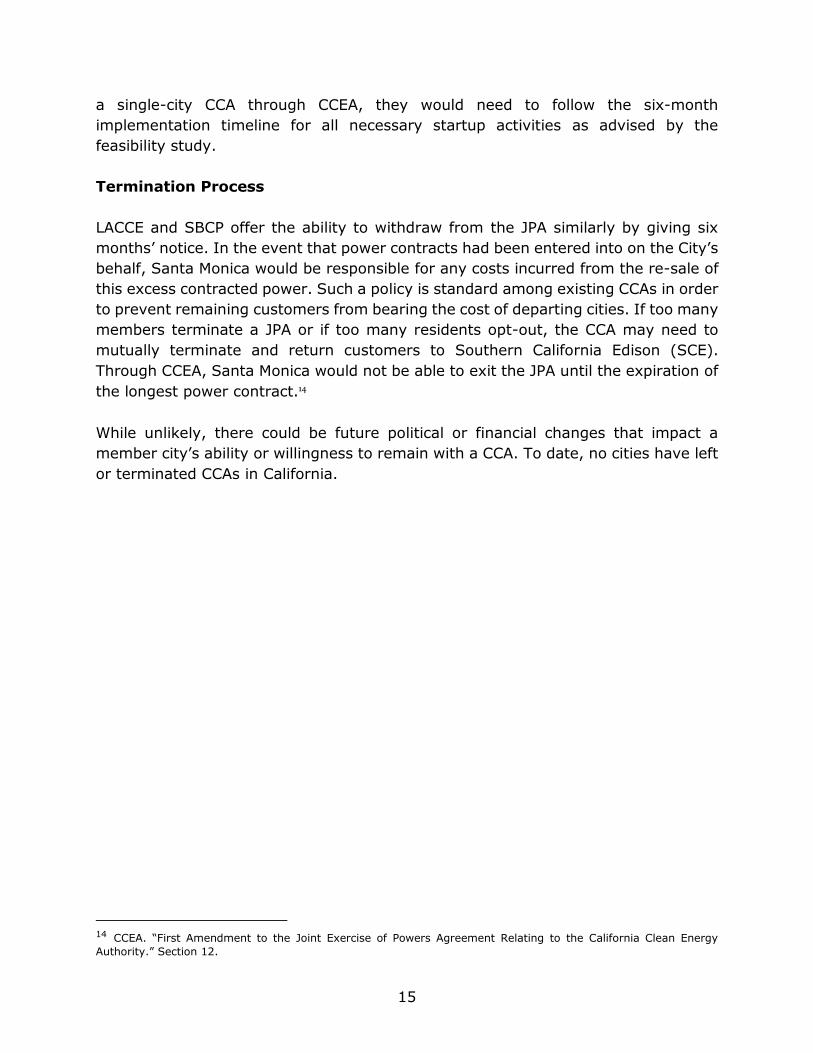
is calculated based on members’ revenues. Figure 3 illustrates the voting process for
LACCE and SBCP.
Figure 3. Decision-Making Process Flow Chart
It is important to note that similar voting systems are also used by other existing
CCAs. Discussions with existing CCAs have revealed that decisions are usually
discussed at length prior to a vote. While there is not always full consensus of
members prior to a vote, weighted votes have very rarely been called. Reaching
consensus would probably be easier for SBCP as its founding members are likely to
share the same vision and the same goals. On the other hand, with a county as
large and heterogeneous as the Los Angeles County, a consensus could potentially
be harder to reach by LACCE.

18
The figure below illustrates the number of city and county members on all existing
and potential CCAs with a multi-member JPA board.
Figure 4. Number of City and County Members on CCA Boards 15
Figure note: Solid bars (for RCEA, SCP, SVCE, PCE, and MCE) illustrate the current number of member
cities and counties on existing CCA boards. Lined bars (for SBCP and LACCE) show potential
membership. LACCE’s membership scenario includes all cities currently considering this option. SBCP’s
membership scenario includes all cities that are in the original feasibility study, excluding those that
have since joined LACCE. Single-city CCAs are not included in this figure as they do not have JPA
boards with multiple members and are instead typically governed by their respective city councils.
Weight Depending on Membership Scenarios
We examine Santa Monica’s share of the weighted vote under different potential
membership scenarios to understand their influence in the event of an extreme case
where a weighted vote is called. Table 2 shows that Santa Monica’s weighted vote
share, based on load share, would potentially vary between 7% and 11% should the
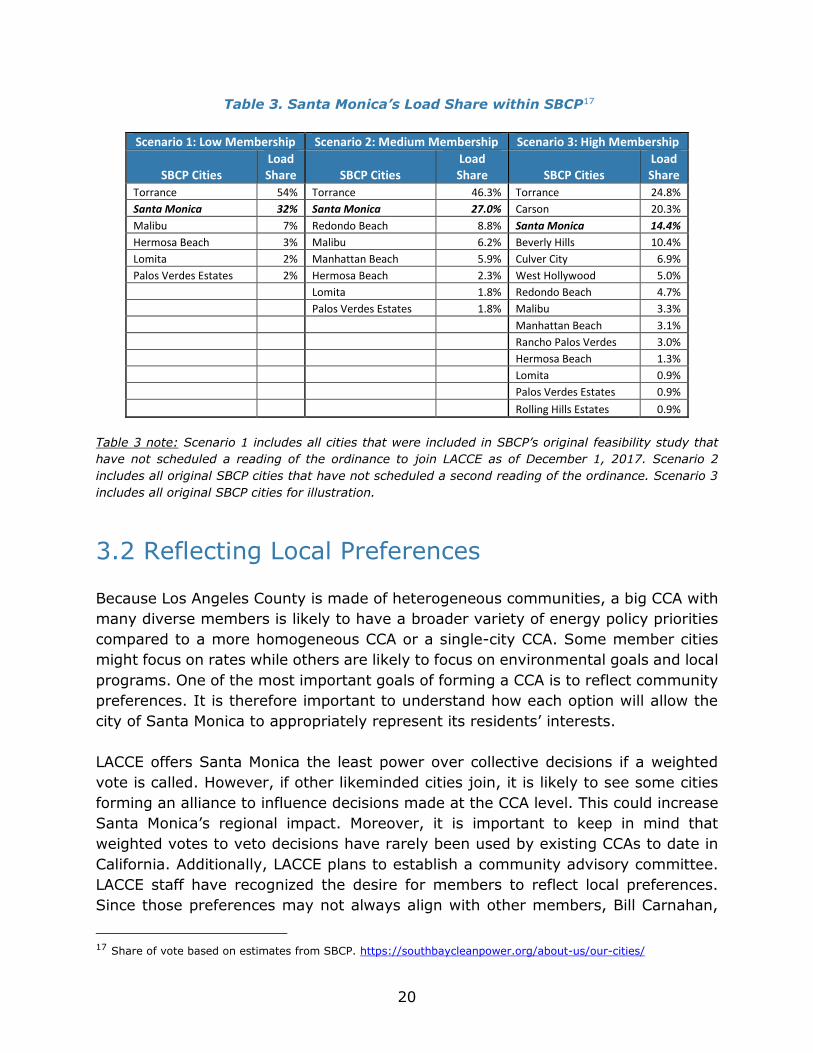
City decide to join LACCE. Table 3 illustrates that Santa Monica’s weighted vote share
could potentially vary between 27% and 32%, if the City decides to form SBCP,
resulting in the City having more control over collective decisions.
15 Figure created by the UCLA Luskin Center for Innovation in November 2017. Membership data from each entity’s
website.
911 12 12
2226
28
0
5
10
15
20
25
30
RCEA SCP SVCE SBCP PCE LACCE MCE
19
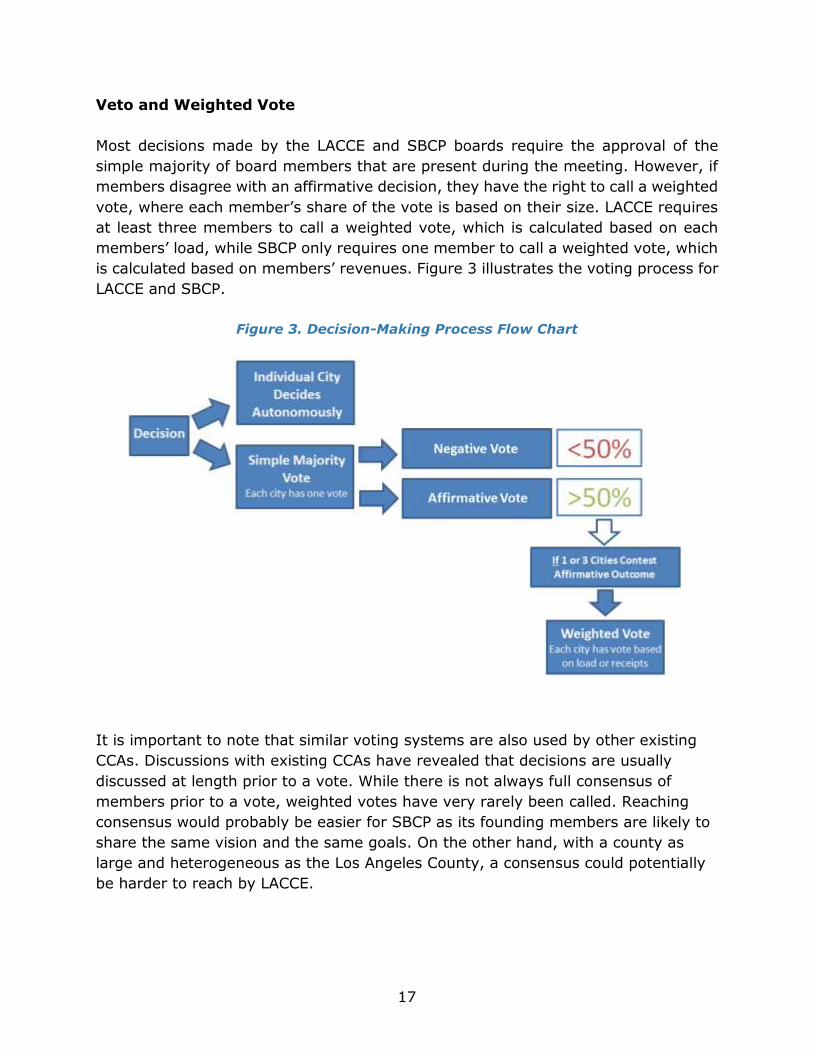
Table 2. Santa Monica’s Load Share within LACCE16
Scenario 1: Low Membership Scenario 2: Medium Membership Scenario 3: High Membership
LACCE Cities Load Share LACCE Cities
Load Share LACCE Cities
Load Share
Unincorporated LA County 53.3% Unincorporated LA County 38.8% Unincorporated LA County 34.6%
Carson 12.5% Carson 9.1% Carson 8.1%
Santa Monica 11.0% Santa Monica 8.0% Santa Monica 7.2%
Downey 7.2% Beverly Hills 5.3% Beverly Hills 4.7%
Alhambra 4.7% Downey 5.2% Downey 4.7%
West Hollywood 4.2% West Covina 4.1% West Covina 3.7%
Calabasas 2.9% Manhattan Beach 3.6% Whittier 3.2%
Claremont 2.1% Hawthorne 3.5% Manhattan Beach 3.2%
South Pasadena 1.4% Culver City 3.4% Hawthorne 3.1%
Sierra Madre 0.6% Alhambra 3.4% Culver City 3.1%
Rolling Hills Estates 0.2% West Hollywood 3.0% Alhambra 3.0%
Redondo Beach 3.0% Arcadia 3.0%
Paramount 2.2% West Hollywood 2.7%
Calabasas 2.1% Redondo Beach 2.7%
Claremont 1.6% Covina 2.2%
Agoura Hills 1.5% Paramount 2.0%
South Pasadena 1.0% Calabasas 1.9%
Palos Verdes Estates 0.6% Claremont 1.4%
Sierra Madre 0.5% Malibu 1.4%
Rolling Hills Estates 0.1% Agoura Hills 1.3%
La Puente 1.0%
South Pasadena 0.9%
Palos Verdes Estates 0.5%
Sierra Madre 0.4%
Rolling Hills Estates 0.1%
Table 2 note: Scenario 1 includes cities that have officially joined LACCE as of December 1, 2017.
Scenario 2 also includes all cities that have scheduled a first or a second reading of the ordinance.
Scenario 3 includes all cities currently considering LACCE.
16 Status of members provided by LACCE. Share of vote estimated based on load data provided by the LA Energy
Atlas. http://www.energyatlas.ucla.edu/
20
Table 3. Santa Monica’s Load Share within SBCP17
Scenario 1: Low Membership Scenario 2: Medium Membership Scenario 3: High Membership
SBCP Cities Load Share SBCP Cities
Load Share SBCP Cities
Load Share
Torrance 54% Torrance 46.3% Torrance 24.8%
Santa Monica 32% Santa Monica 27.0% Carson 20.3%
Malibu 7% Redondo Beach 8.8% Santa Monica 14.4%
Hermosa Beach 3% Malibu 6.2% Beverly Hills 10.4%
Lomita 2% Manhattan Beach 5.9% Culver City 6.9%
Palos Verdes Estates 2% Hermosa Beach 2.3% West Hollywood 5.0%
Lomita 1.8% Redondo Beach 4.7%
Palos Verdes Estates 1.8% Malibu 3.3%
Manhattan Beach 3.1%
Rancho Palos Verdes 3.0%
Hermosa Beach 1.3%
Lomita 0.9%
Palos Verdes Estates 0.9%
Rolling Hills Estates 0.9%
Table 3 note: Scenario 1 includes all cities that were included in SBCP’s original feasibility study that
have not scheduled a reading of the ordinance to join LACCE as of December 1, 2017. Scenario 2
includes all original SBCP cities that have not scheduled a second reading of the ordinance. Scenario 3
includes all original SBCP cities for illustration.
3.2 Reflecting Local Preferences
Because Los Angeles County is made of heterogeneous communities, a big CCA with
many diverse members is likely to have a broader variety of energy policy priorities
compared to a more homogeneous CCA or a single-city CCA. Some member cities
might focus on rates while others are likely to focus on environmental goals and local
programs. One of the most important goals of forming a CCA is to reflect community
preferences. It is therefore important to understand how each option will allow the
city of Santa Monica to appropriately represent its residents’ interests.
LACCE offers Santa Monica the least power over collective decisions if a weighted
vote is called. However, if other likeminded cities join, it is likely to see some cities
forming an alliance to influence decisions made at the CCA level. This could increase
Santa Monica’s regional impact. Moreover, it is important to keep in mind that
weighted votes to veto decisions have rarely been used by existing CCAs to date in
California. Additionally, LACCE plans to establish a community advisory committee.
LACCE staff have recognized the desire for members to reflect local preferences.
Since those preferences may not always align with other members, Bill Carnahan,
17 Share of vote based on estimates from SBCP. https://southbaycleanpower.org/about-us/our-cities/

21
the interim executive director of LACCE and former executive director of Southern
California Public Power Authority, has suggested a “cafeteria style” approach, where
each member can decide which programs they want to participate in, finance, and
benefit from.
SBCP could be formed by cities with similar visions, goals, and energy policy
priorities, which would limit the risk of disagreement. Additionally, Santa Monica is
likely to have more weight over decisions in both the simple and the weighted vote
due to the likely smaller membership compared to LACCE. Finally, SBCP also
recommends the establishment of a community advisory committee and recommends
that a representative from this community has a non-voting seat on the JPA Board.
With CCEA, the Santa Monica City Council would have full decision-making autonomy
to reflect its community preferences through rates, power mixes, and investments in
local energy programs. However, Santa Monica would not have a formal voting right
in a few other types of decisions where authority rests with CCEA’s JPA board
governed by the Lancaster City Council: decisions regarding contracting with third
parties for services (including approving consultants for energy procurement) and
approving new associate members. Approval from an official representative from
Santa Monica is required before CCEA can enter into energy procurement contracts
longer than five years. Due to the design of CCEA, Santa Monica should not be
negatively impacted by additional joining members.

22
CHAPTER 4: ENERGY PROCUREMENT
4.1 Power Content and Rate Comparison
This section compares the potential electricity products and rates that could be
offered by each option according to their published documents. However, it is
important to remember that this comparison only looks at each option’s forecasts
and estimations. Each option uses different methodologies and assumptions to
forecast rates for their respective CCA and for SCE’s rates. Ultimately, this
comparison is hypothetical and much remains uncertain. Rates will be affected by
future energy market prices, the policy decisions taken by the respective boards
regarding the energy procurement strategy and portfolio content, as well as the
decisions made by each CCA’s general manager. We believe that while competitive
rates are a crucial element, most CCAs in California have been successful through
their innovative approaches, greener electricity, and local-level management.
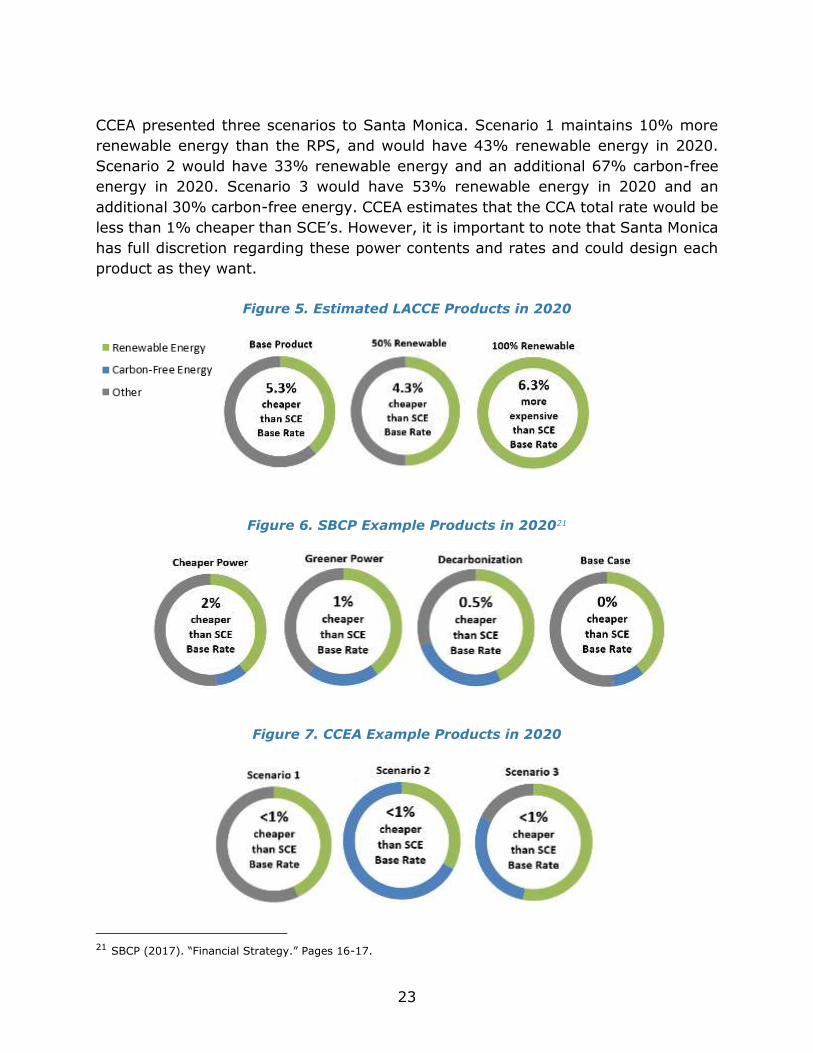
LACCE suggests to offer customers three products to choose from: a base product, a
50% renewable energy product, and a 100% renewable energy product. The base
product will at a minimum always meet the state Renewables Portfolio Standard
(RPS) requirement (33% in 2020). According to recent discussions with LACCE staff,
their base product is will likely be greener than the base product originally described
in their business plan in order to compete with SCE’s aggressive 2020 procurement.
Currently, SCE has 41.4% renewable energy under contract for 2020.18 LACCE’s
business plan does not report the percent of carbon free electricity. Santa Monica can
determine which of the three products to enroll its residents in by default (although
customers can always opt into a different product offered).19
SBCP’s power mixes have not yet been determined. The JPA board would have to
design and vote on the different products offered to ratepayers and whether or not a
member can enroll by default its residents into a greener product. In their financial
strategy, SBCP presents four illustrative scenarios of power mixes, which vary
between 39% and 43% renewable energy, and between 9% and 27% additional
carbon free electricity in 2020.20 It is important to note all but one scenario have less
renewable energy than SCE will have in 2020. SBCP estimates their rates to be
consistently cheaper through 2022 for each option, and uses a conservative
estimation of the exit fees charged by SCE.
18 California Public Utilities Commission (2017). “California Renewables Portfolio Standard (RPS).” 19 LACCE (2017). “LACCE Community Choice Aggregation Implementation Plan and Statement of Intent.” 20 Renewable energy sources include biomass and biowaste, geothermal, wind, small hydro, and solar. Large hydro
power is not considered a renewable resource but rather a carbon free source of energy.
23
CCEA presented three scenarios to Santa Monica. Scenario 1 maintains 10% more
renewable energy than the RPS, and would have 43% renewable energy in 2020.
Scenario 2 would have 33% renewable energy and an additional 67% carbon-free
energy in 2020. Scenario 3 would have 53% renewable energy in 2020 and an
additional 30% carbon-free energy. CCEA estimates that the CCA total rate would be
less than 1% cheaper than SCE’s. However, it is important to note that Santa Monica
has full discretion regarding these power contents and rates and could design each
product as they want.
Figure 5. Estimated LACCE Products in 2020
Figure 6. SBCP Example Products in 202021
Figure 7. CCEA Example Products in 2020
21 SBCP (2017). “Financial Strategy.” Pages 16-17.

24
Electricity rates and power mixes will only be finalized once they have been approved
by LACCE’s or SBCP’s respective JPA board. If the Santa Monica City Council elects
the single-city option, they will have full autonomy over rates and power mixes.
4.2 Category 3 Renewable Energy Certificates
According to the California Public Utilities Commission, “Renewable energy facilities
can sell energy and/or renewable energy credits (RECs) to a California retail seller of
electricity to meet its [renewables portfolio standard (RPS)] obligation.”22 The RPS
program distinguishes renewable procurement acquired from contracts into three
portfolio content or RECs categories referred to as buckets. The first two buckets,
RECs categories 1 and 2, are when the renewable energy certificate is bought bundled
with the underlying renewable energy. The last bucket, also called RECs category 3
or unbundled REC3, is when the energy provider only buys the certificate without the
energy. As the figure below shows, the State does not view RECs category 3 as an
appropriate long-term solution to procuring renewable energy.
Figure 8. RPS Portfolio Content Category Requirement23
22 California Public Utilities Commission (2017). “RPS Procurement Rule.”
http://www.cpuc.ca.gov/RPS_Procurement_Rules_33/ 23 Ibid.

25
One of the main reasons why electricity providers use RECs category 3 is because
they have been historically cheaper than buying bundled renewable energy. Previous
research from the UCLA Luskin Center for found that in 2016, Marin Clean Energy
was still using up to 3% of RECs category 3, and Lancaster Choice Energy was using
up to the maximum amount allowed by the RPS program. Other CCAs like Sonoma
Clean Power or Peninsula Clean Energy do not use RECs category 3.
LACCE’s JPA states to “discourage the use of REC category 3.” However, the JPA
board will ultimately decide the policy. According to discussions with LACCE staff,
their initial request for proposals for energy procurement specifically requested no
use of RECs category 3.
SBCP’s draft business plan states that “no use of Category 3 unbundled Renewable
Energy Certificates (RECs) [will be purchased] to achieve [their] 100% renewables
goal”24 as one of their goals and objectives. However, the use of RECs category 3 to
meet interim goals or in the implementation phase is not specified and would likely
be determined by the JPA board.
CCEA will procure power on behalf of Santa Monica with the single-city option. Santa
Monica can then specifically request that no RECs category 3 are used for electricity
procurement. The feasibility study presented to Santa Monica assumes the use of
RECs category 3 up to the maximum of 10% in some of the proposed scenarios.
4.3 Exploring the 100% Renewable Option
As discussed in the previous section, each option could provide Santa Monica with
the ability to immediately provide a 100% renewable electricity product. Because this
would be the most expensive option, the vast majority of CCAs enroll by default their
customers into the cheaper option in order to maximize their customer retention. The
problem with this strategy is that most CCAs only see a very small amount of “opt-
ups,” defined as when a customer voluntarily chooses to enroll in a greener product.
The City of Portola Valley, a member of Peninsula Clean Energy, a CCA in San Mateo
County, is the only CCA member so far to have default enrolled all of their customer
accounts into the 100% renewables product. A representative from Peninsula Clean
Energy confirmed that as of October 2017 only 4% of customers in Portola Valley
opted down to the cheaper product and 5% opted out of the CCA to return to PG&E.
It is important to note that the percentage of opt-outs for a CCA in California varies
between approximately 2% and 10%. These numbers indicate that customer
24 SBCP (2017). “South Bay Clean Power Draft Business Plan.” Letter of Introduction.

26
retention may not be a major risk for other similar communities considering a 100%
renewables default option.
The Public Policy Institute of California conducted a survey that revealed that the
willingness to pay more for greener electricity varies based on political affiliation:
68% of Democrats and 38% of Republicans were willing to pay more.25 Willingness
to pay was less dependent on income: between 55% and 60% of respondents across
income levels (ranging from under $40,000 to more than $80,000) reported being
willing to pay more for greener electricity. The table below shows the socio-economic
comparison between the cities of Portola Valley and Santa Monica.
Table 4. Comparison of Demographics:
the Cities of Portola Valley and Santa Monica26
Portola Valley Santa Monica
Median Household Income $185,234 $76,580
Population 2016 4,597 92,478
Percent Registered Democrats 47% 54%
Percent Registered Republicans 25% 13%
4.4 Energy Services and Third-Party Contracts
This section of the report presents and synthetizes discussions with energy
procurement specialists, including the authors of SBCP’s business plan. SBCP’s
business plan was the only one of the three options to focus on an energy
procurement strategy and services to address future legislative, regulatory and
market risks (refer to chapter 6 for a more detailed assessment of future risks).
The core business of CCAs is to procure energy, which represents on average between
80% and 90% of all costs incurred by existing aggregators in California. Energy
procurement involves various services such as planning and portfolio analysis,
contract origination, short-term load forecasting, scheduling and balancing of
operations, settlements, and data management.27 The figures below illustrate the
breakdown of required energy services.
25 Kordus, David. Public Policy Institute of California (2017). “Californians’ Views on Climate Change.” 26 Population estimates from United States Census Bureau “American Fact Finder.” Party affiliation data from
California Secretary of State “Voter Registration Statistics.” 27 Data management includes data exchange with the investor-owned utility, technical testing, customer service
information systems, customer call center, billing, settlement quality meter data reporting, and reporting and audits of utility billing.

27
Figure 9. Energy Services28
Data and Billing Services
Context around Energy Management Services
According to SBCP’s business plan, one of the most important debates occurring
today within the community choice energy industry revolves around how to best
structure energy services management for new CCAs to respond to future risks.
Energy procurement and risk management are complex practices that require
significant research, analysis, and market experience. Supplying power to any
aggregation of customers requires a diverse portfolio of energy products29 to be
contracted for and actively managed as market conditions change over time. The
diversification of the energy portfolio is also crucial in regards to energy contracts
versus market price exposure, long- versus short-term energy contracts, volume,
location, and type of energy sources.
Investor-owned utilities reportedly integrate all of these energy services together,
known as a commodity risk management approach. Most of the first existing CCAs
delegated the complexity of portfolio management functions to external consultants,
also called Energy Service Providers (ESPs), when they launched. According to SBCP’s
draft business plan and discussions we had with its authors, this model comes with
28 Top image from SBCP (2017). “Draft Business Plan.” Page 17. Bottom image from Community Choice Partners. 29 Such energy products include physical electricity products (energy, capacity, renewable energy certificates,
emission reduction credits, and ancillary services), physical fuel products (primarily natural gas, transportation and storage) and financial or insurance products (transmission congestion revenue rights, call/put options, multi-party spreads, etc).

28
disadvantages regarding commodity risk management modeling techniques and
operational practices. The separation of the CCA’s energy risk management functions
and a relatively inflexible approach to energy procurement could impede their ability
to adapt to regulatory and market risks.
Existing CCAs have been successful with this outsourced model. However, we have
noticed a change in the energy risk management approach over time. We have seen
some CCAs like MCE bringing those capabilities in-house after several years of
experience in the energy procurement industry, most likely justified by the need to
absorb vendors’ margin in-house. Some newly formed CCAs have also chosen to
adopt a single portfolio manager model. According to SBCP, under this approach, the
CCA contracts for all of the aforementioned energy risk management functions to be
provided by a service provider operating “as an agent” of the government agency.
General Approach toward Energy Services for each Option
Decisions regarding LACCE’s energy services and policies have not yet been finalized
for implementation phases 2 and 3. However, for phase 1, LACCE hired separate
contractors for energy procurement, scheduling operations, and data management.
If Santa Monica joins LACCE, they would have the opportunity to influence, with other
cities, decisions for the following phases.
SBCP recommends the use of a portfolio manager that would integrate all energy
services functions, rather than contracting for these services separately. SBCP
believes that such a strategy helps to streamline services and better integrate local
energy generation, resulting in a more efficient risk management across these
different functions.
With CCEA, Santa Monica would delegate all tasks related to energy procurement,
contracting origination, and management to CCEA and their consultant Pacific Energy
Advisors, overseen by Lancaster Choice Energy’s executive director. CCEA also
handles finding and contracting with a data manager and an independent scheduling
coordinator for CCEA’s member cities. According to recent discussions with Pacific
Energy Advisors, this option provides economies of scale regarding energy services.
Yet Santa Monica could still benefit from energy procurement tailored to its specific
energy needs and load profile.
Energy Procurement Costs
One important competitive advantage of CCAs is that they are free to set their rate
structures as they want, as opposed to investor-owned utilities that are required to
have rates approved by the California Public Utilities Commission. Because of new
29
technologies and data management services, CCAs now have the opportunity to go
one step further by customizing rates at a customer level. Customized rates could
help ensure that the highest paying customers remain with the CCA. SBCP is the only
option to suggest this strategy so far.
This would also allow each member city to have a different rate structure that could
best reflect the real cost of electricity procurement. Coastal cities have different costs
of procurement due to the important role the ocean plays in regulating and absorbing
more extreme temperatures. Cities like Santa Monica can be cheaper to serve
because their electricity load demand varies less within a day and less across the
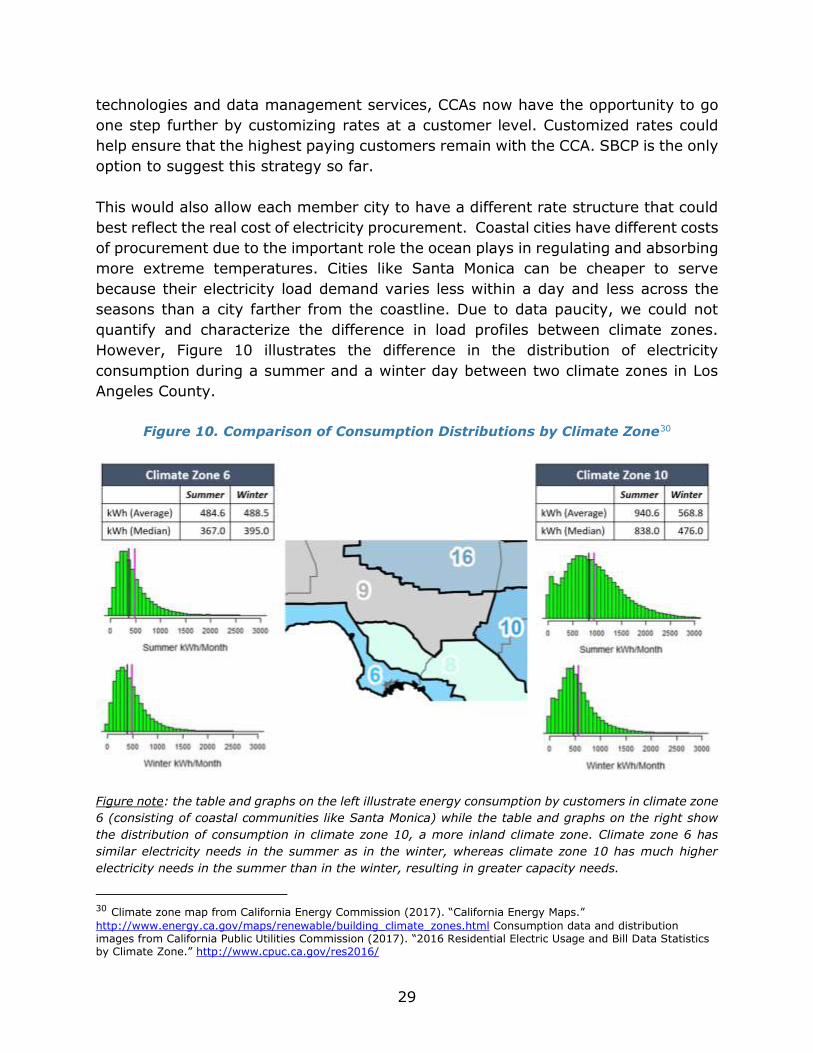
seasons than a city farther from the coastline. Due to data paucity, we could not
quantify and characterize the difference in load profiles between climate zones.
However, Figure 10 illustrates the difference in the distribution of electricity
consumption during a summer and a winter day between two climate zones in Los
Angeles County.
Figure 10. Comparison of Consumption Distributions by Climate Zone30
Figure note: the table and graphs on the left illustrate energy consumption by customers in climate zone
6 (consisting of coastal communities like Santa Monica) while the table and graphs on the right show
the distribution of consumption in climate zone 10, a more inland climate zone. Climate zone 6 has
similar electricity needs in the summer as in the winter, whereas climate zone 10 has much higher
electricity needs in the summer than in the winter, resulting in greater capacity needs.
30 Climate zone map from California Energy Commission (2017). “California Energy Maps.”
http://www.energy.ca.gov/maps/renewable/building_climate_zones.html Consumption data and distribution images from California Public Utilities Commission (2017). “2016 Residential Electric Usage and Bill Data Statistics by Climate Zone.” http://www.cpuc.ca.gov/res2016/

30
Each CCA option is differently poised to handle the issue of differing climate conditions
and associated electricity needs. With CCEA, the current energy contractor, Pacific
Energy Advisors, considers each members’ specific load profile and electricity needs
separate when procuring energy. Pacific Energy Advisors only pools contracts with
the same energy providers for all members so that they can benefit from economies
of scale, but respects specificities when it comes to procurement price.
If SBCP is formed with cities with similar climate zones and demand load profiles, it
could provide the City of Santa Monica with the same economic advantage regarding
electricity procurement.
As for LACCE, energy policies will be voted on by board members. However, even
though it could be possible to distinguish rates among city members, the authors
believe it will be politically challenging and it raises the question whether it would be
fair for a CCA to provide different rates based on a city’s climate zone and load profile.
Data Management Services
To date, all CCAs and utilities have contracted with the same data management
vendor. However, emerging CCAs are beginning to consider other contractors that
offer more refined services, including particular capabilities required to better support
demand response and energy efficiency program implementation. For further
comments, please refer to East Bay Community Energy (EBCE) staff’s
recommendation regarding energy services.
Developing advanced capacities with cutting-edge technologies, strategies, and
partners should be something to consider when making policy decisions, specifically
in regard to the future risks that lie ahead for CCAs in California. Since these
advanced capacities are a recent development among CCAs, we have not yet been
able to evaluate their costs and benefits in practice.

31
CHAPTER 5: ECONOMICS AND FINANCE
There are several cost factors that need to be taken into consideration when
comparing CCA options, including startup costs and financing, energy procurement
costs, non-energy operating costs, and the costs and financing of local energy
programs.
In this chapter, we compare the financial obligation that each option requires from
Santa Monica regarding start-up costs and operating costs. We do not analyze the
cost of procurement between each option as we neither have the experience nor the
knowledge to assess and compare each option’s methodologies for forecasts and cost
estimates.
5.1 Startup Costs
The startup phase, also known as the pre-start phase, usually varies between six
months and one year. The associated costs usually include staff members,
consultants, marketing, and infrastructure.
Startup Costs Estimation
Back in 2016, LACCE’s business plan initially estimated startup costs to be
$1,213,718, with a launch in January 2017. Because the launch was postponed by
one year, we estimated the total costs incurred by the CCA this year to have been
$1,355,000 (2017 total costs minus utility transaction fees, but including the CPUC
Bond), resulting in a total startup cost of $2,568,718 for LACCE.31 Based on SBCP’s
financial strategy, we estimate a startup cost of up to $912,376 (all startup costs
minus utility and CAISO fees). CCEA’s technical study estimates startup costs of
around $703,940 for the first six months.
Depending on the ultimate membership of LACCE, Santa Monica’s share of the load
could represent between 7.1% and 11%, resulting in an indirect financial contribution
of between $182,379 and $282,559. Santa Monica’s share of these costs would
continually decrease as more cities join LACCE. For SBCP, Santa Monica’s share of
the load could represent between 27% and 32%, resulting in an indirect financial
contribution of between $246,342 and $291,960, based on the membership scenarios
31 LACCE (2016). “County of Los Angeles Community Choice Energy Business Plan.” Startup activities
and costs. We excluded utility transaction fees for 2017. Page 36

32
described in chapter 3. Thus, LACCE and SBCP’s estimations could provide the City
with economies of scale, resulting in lower startup costs than can be achieved through
CCEA.
For comparison, the table below illustrates the startup funding amount and sources
for exisitng CCAs.
Table 5. Startup Funding Requirements and Sources for Existing CCAs32
Startup Costs Financing
LACCE received an interest rate free loan of $10 million from the County of Los
Angeles, which should be reimbursed next summer. SBCP suggests that the leading
cities guarantee a $2.5 million startup loan to finance the launch of the CCA. Using
cities as guarantors could potentially help SBCP to obtain cheaper rates than if the
brand new CCA was taking out a loan itself without any credit history. CCEA suggests
a small loan of $700,000 that could be covered by the city’s general fund, resulting
in lower interest rates, if any. Table 6 compares the startup costs and financing
reported by each option, including additional financing needs, usually for energy
procurement.
Table 6. Comparison of Startup Financing
LACCE SBCP CCEA
Startup Costs Estimation $2,568,718 $912,376 $703,940
Startup Costs Financing $10 million from LA County. Interest free. To be paid back in June 2018.
$2.5 million estimated by SBCP business plan, 100% guaranteed by initiating cities.
The City could secure $700k through a loan via general fund or other source.
Additional Financing $40-50 million to start energy procurement. Could be a line of credit, another County Loan.
$10 million loan 50% guaranteed by member cities + $20 million line of credit
$1,200,000 additional cash flow needed according to CCEA technical study.
32 LACCE (2016). “County of Los Angeles Community Choice Energy Business Plan.” Page 64.

33
5.2 Economies of Scale in Operating Costs
Frequently, all revenues generated through the sale of electricity “flow to the JPA” to
cover energy procurement costs and non-energy operating costs. Most of the time,
non-energy operating costs are similar to fixed costs, which means they do not
exactly proportionally increase or decrease based on the load to serve or the number
of members. Consequently, the larger the CCA, the lower the non-energy operating
costs per member should be. Operating costs usually cover general and
administration expenses, personnel, professional services and data management,
legal and regulatory staff or consultants, marketing and promotions, customer
service, and other utility or California Independent System Operator (CAISO) fees.
For LACCE and SBCP, the vast majority of the operating costs listed above should be
covered and paid for by the CCA itself. This means that Santa Monica will have very
minimal to no staffing and operating costs on its side.
However, if Santa Monica chooses to create a single-city CCA through CCEA, the City
can determine how much staff it wants to dedicate to the program depending on how
much it wants to be involved in the administration. The City will pay CCEA service
fees, estimated to be around $850,000. This fee is divided in two: a flat annual fee
of approximately $250,000 that Santa Monica would have to pay to CCEA no matter
what; and variable annual costs estimated at $600,000 for procurement, regulatory
and other services provided by CCEA. These latter costs will proportionally vary with
the amount of CCEA members and is consequently one of the few operating costs
under this business model that could benefit from economies of scale.
The UCLA Luskin Center for Innovation conducted an analysis based on existing CCAs
in California to compare each options’ estimation of their non-energy operating costs.
We found a statistically significant relationship between operating costs per MWh and
load. We found that for every 1% increase in load, a CCA could expect operating
costs per MWh to decrease by 0.4% on average. This means that CCAs serving a
larger load benefit from economies of scale in operating costs, potentially resulting
in more revenues per MWh available for programs or to allow for reduced rates.
Figure 11 shows the cost of non-energy operating costs per MWh for existing CCAs.
CCAs are shown by annual load, with the largest load on the left.

34
Figure 11. Non-Energy Operating Costs per MWh33
Figure 11 note: EES Consulting provided the UCLA Luskin Center for Innovation with high and low load operating costs scenarios. SBCP’s operating costs are from their business plan and CCEA’s are from the feasibility they provided the City of Santa Monica.
Notably, economies of scale were not found in the cost of energy per MWh. This is
likely due to the fact that the cost of energy is dependent upon several factors such
as, but not limited to, the portfolio content and procurement strategy, the balance
between long-term and short-term contracts, and the market conditions in which the
power purchase agreements were signed.
Recent discussions with several industry specialists revealed that in a very
competitive environment, larger CCAs might have bargaining advantages over
smaller CCAs when it comes to long-term energy procurement and other contracts
for third-party assistance. With a more fragmented electricity retail market and
increasingly stronger competition, Santa Monica could possibly benefit more from
greater bargaining power and economies of scale in the energy procurement
processes through a larger CCA.
33 Operating cost data from each entity’s respective publicly available 2017-2018 fiscal year budget. Load data from
each CCA’s most recently published Implementation Plan.
$-
$2
$4
$6
$8
$10
$12
LACCE -High
SBCP MCE LACCE -Low
PCE SVCE SCP CCEA LCE AVCE
Operating Costs per MWh
35
5.3 Local Program Financing
The community-oriented nature of CCAs allow them to efficiently tailor,
communicate, and implement local energy programs to meet community needs.
When CCAs do, it comes with several local benefits. Funds collected through rates
are reinjected locally, instead of being centralized by utilities and state agencies to
benefit the state more broadly. These local programs can support local jobs, boosting
the local economy. In a previous report, we estimated that the five operational CCAs
in 2016 supported over 600 local construction jobs, 24 new operations and
maintenance jobs, and an additional 28.2 operations and maintenance jobs from
construction in previous years.34
CCAs can apply to the California Public Utilities Commission to administer their own
energy efficiency programs by using funds collected through public benefits
surcharges. For example, MCE (the first CCA to launch in California) received
$1,334,519 in public purpose program revenue in 2017.35 CCAs can also take
advantage of opportunities such as California Energy Commission grants or
partnering with other agencies or nonprofits. Similar to the implementation plans of
Silicon Valley Clean Energy and Peninsula Clean Energy, LACCE states that they “will
eventually administer energy efficiency, demand response and distributed generation
programs that can be used as cost-effective alternatives to procurement of supply-
resources.”36
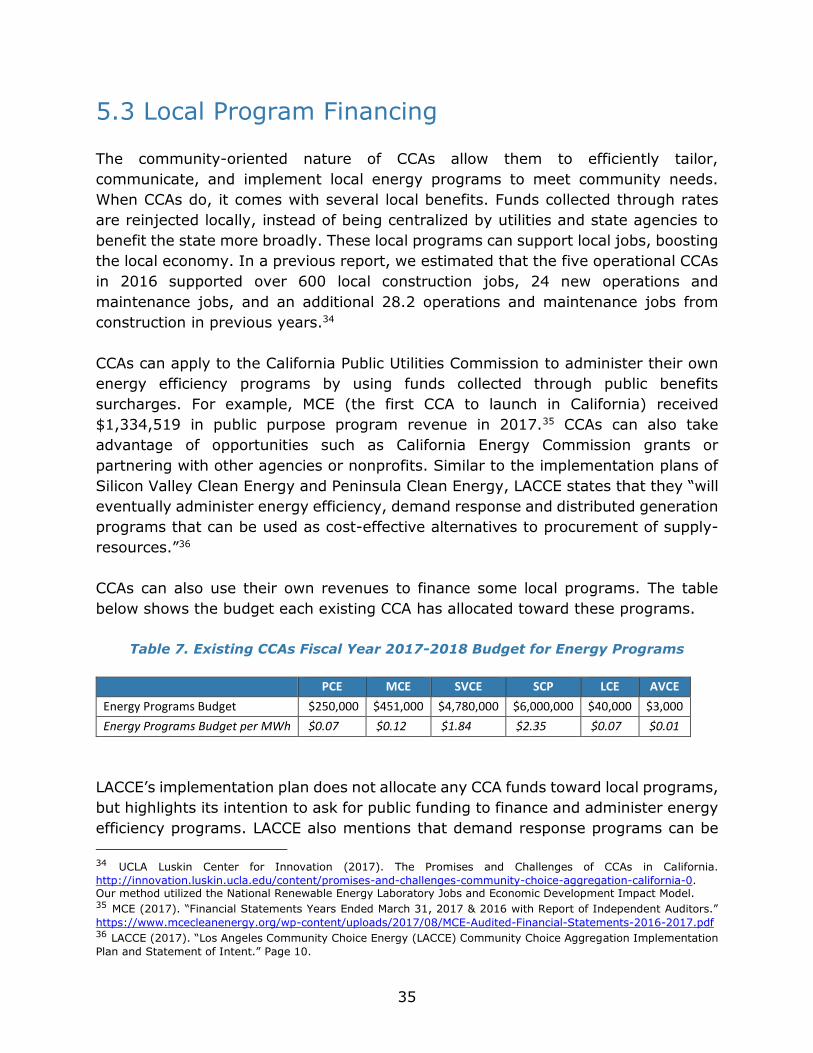
CCAs can also use their own revenues to finance some local programs. The table
below shows the budget each existing CCA has allocated toward these programs.
Table 7. Existing CCAs Fiscal Year 2017-2018 Budget for Energy Programs
PCE MCE SVCE SCP LCE AVCE
Energy Programs Budget $250,000 $451,000 $4,780,000 $6,000,000 $40,000 $3,000
Energy Programs Budget per MWh $0.07 $0.12 $1.84 $2.35 $0.07 $0.01
LACCE’s implementation plan does not allocate any CCA funds toward local programs,
but highlights its intention to ask for public funding to finance and administer energy
efficiency programs. LACCE also mentions that demand response programs can be
34 UCLA Luskin Center for Innovation (2017). The Promises and Challenges of CCAs in California.
http://innovation.luskin.ucla.edu/content/promises-and-challenges-community-choice-aggregation-california-0. Our method utilized the National Renewable Energy Laboratory Jobs and Economic Development Impact Model. 35 MCE (2017). “Financial Statements Years Ended March 31, 2017 & 2016 with Report of Independent Auditors.”
https://www.mcecleanenergy.org/wp-content/uploads/2017/08/MCE-Audited-Financial-Statements-2016-2017.pdf 36 LACCE (2017). “Los Angeles Community Choice Energy (LACCE) Community Choice Aggregation Implementation
Plan and Statement of Intent.” Page 10.

36
cost effective alternatives to resource adequacy capacity required by the CPUC and
that they will promote local investment through net energy metering and feed-in
tariff programs. LACCE’s interim director, Bill Carnahan, has suggested LACCE could
adopt a “cafeteria style” approach where each member can pick which program they
want to finance and participate in.37 MCE’s JPA agreement, as an example, stipulates
that any member can participate in the programs they approve and finance. Any
member who votes against the approval of a program or activity will be taken out of
this program without bearing any financial obligation.38
SBCP specifies an annual budget for local distributed energy resource (DER)
programs, which is budgeted to be $2,000,000 in 2020. SBCP’s business plan details
how DER functions would be fully integrated into the agency’s business model and
contracted services including “power planning, load forecasting, power procurement
… [which] necessitates contracting for a specialized set of services”.39
With CCEA, Santa Monica would have complete autonomy over rates and the budget
allocated toward local program investment.
It is important to note that recent discussions with existing CCAs revealed
recommendations to focus on achieving financial solvency and establishing a rate
stabilization fund prior to investing in local programs, as remaining cost competitive
and retaining customers should be priority number one. It is hard to determine how
much money will be available for local energy programs because it will depend on
the rates and energy policies set by the JPA board as well as the procurement and
operating costs of each option.
37 According to discussions with Gary Gero, Chief Sustainability Officer of the County of Los Angeles and Bill
Carnahan, LACCE’s interim executive director in October 2017. 38 MCE (2008). “Marin Energy Authority Joint Powers Agreement.” 39 SBCP (2017). “South Bay Clean Power Draft Business Plan (2017). Page 26.

37
CHAPTER 6: FUTURE CHALLENGES
California is in the middle of an energy revolution, with new players, new regulations,
and ambitious environmental goals. Greater competition in the retail electricity
market will increase pressure on prices, resulting in more innovative energy
procurement strategies. New CCAs must carefully identify and plan to mitigate any
potential future challenges. In this section, we discuss potential regulatory,
legislative, and market force risks. At the end of each section, we provide the reader
with the mitigation strategies suggested by each option.40, 41, 42
6.1 Legislative Risks
Future Legislation Affecting Investor-Owned Utility Renewable
Procurement
California Senator Kevin De León introduced Senate Bill 100 this year that if signed
into law would have required 100% of electricity sales to come from renewable or
carbon free energy by 2045. Senate Bill 100 was postponed to the next legislative
session. Such a regulation could ultimately reduce one of the main marketing and
competitive advantages of CCAs, who often claim to have a cleaner energy portfolio
than most investor-owned utilities.
Even without this regulatory pressure, it is important to note that the renewable
energy procurement gap between investor-owned utilities and CCAs is narrowing.
The largest investor-owned utilities now have between 41% and 45% RPS-eligible
renewable energy procurement under contract for 2020.43 The more CCAs that
become operational, the more investor-owned utilities’ customer bases shrink,
resulting in renewable energy contracts composing a greater percentage of their
sales.
40 LACCE (2017). “Los Angeles Community Choice Energy Business Plan Update.” Page 17 and 18. LACCE proposes
mitigation strategies for SCE rates and surcharges, regulatory risks, power supply costs, SCE RPS share, availability of RPS/GHG-free power, financial risks (related to financing and credit), and loads and customer participation. 41 SBCP (2017). “Financial Strategy.” Page 33-46. SBCP proposes mitigation strategies for the PCIA, Direct Access
reopening, the risk that the CPUC pierces the veil of CCA JPA liability protection, and a general contingency plan. 42 CCEA (2017). “City of Santa Monica. Community Choice Aggregation Technical Study: Summary of Results.”
CCEA proposes mitigation strategies for financial risk related to CCA failure, financial risk related to procurement deviations, market volatility and price risk, availability of renewable and carbon-free energy supplies, legislative and regulatory changes, and Power Charge Indifference Adjustment (PCIA) rate risk. 43 California Public Utilities Commission (2017). “California Renewables Portfolio Standard (RPS)”.
http://www.cpuc.ca.gov/RPS_Homepage/

38
Phasing Out Legislative Support
The increasing competition toward greener power mixes coupled with the phase out
of the federal Investment Tax Credit (ITC) could impact the cost of renewable energy
sources in California, such as wind and solar. The table below describes the reduction
over time of the amount of investment in a solar installation that can be deducted
from the tax payment.
Table 8. Phase Out of the ITC44
Year Commercial Solar ITC
Residential Solar ITC
2018 30% 30%
2019 30% 30%
2020 26% 26%
2021 22% 22%
2022 10% 0%
2023+ 10% 0%
Mitigation Strategies Suggested by Each Option
In the event that investor-owned utilities and CCAs would be required to procure
100% of their electricity from renewables, CCAs would need to prioritize competitive
rates and to emphasize local programs and investments.
In the event of increasing competition for renewable power, LACCE proposes to:
“Shift emphasis to GHG-free energy sources… secure long-term contracts… invest in
local renewable resources.”45 In regard to a potential power supply cost increase,
LACCE proposes two main mitigation strategies that focus on long-term contracts and
the stabilization rate reserve funds.46 According to industry specialists, being part of
a larger structure can provide economies of scale and larger bargaining power in a
competitive market.
CCEA proposes the “use of a ‘laddered’ procurement strategy, which is based on
layered purchases in which portions of the energy spend are fixed at intervals
throughout the contract term, rather than all at once. Alternatively, the buyer might
form a set of ‘investment rules,’ buying at certain price levels to both mitigate risk
and seize opportunities.” CCEA also recommends the use of a diversified supply
44 United States Energy Information Administration (August 2016). “Annual Energy Outlook 2016 with projections
to 2040”. LR-8. https://www.eia.gov/outlooks/archive/aeo16/pdf/0383(2016).pdf 45 LACCE (2017). “Los Angeles Community Choice Energy Business Plan Update.” 17. 46 Ibid.

39
portfolio that includes contracts with various term lengths and end dates and the
“participation in the incumbent utility’s short-term RFO for renewable energy sales”.47
SBCP proposes more “sophisticated energy risk management capacities” in the
broader context of legislative and regulatory risks, such as the use of a “portfolio
manager model” and a “significant expansion of distributed energy”.48 (Refer to
section 4.4 on energy services and third-party contractors for further details on
SBCP’s energy risk management strategy).
6.2 Regulatory Risks: PCIA
The Power Charge Indifference Adjustment (PCIA) is an exit fee charged per kWh to
customers who depart from an investor-owned utility. While this fee is necessary to
ensure that customers remaining with the investor-owned utility are not penalized to
the departing load (also known as bundled customer indifference), there are concerns
from both CCAs and investor-owned utilities about the PCIA in its current form. With
the proliferation of CCAs in California, it is important to understand the long-term
effect of a price indifference mechanism in a more competitive environment. In the
longer term, customers might request the ability to change from one utility to another
without paying any exit or entry fees and without being required to compensate for
the losses of another company, as is the case in many other sectors. While the PCIA
has long been a contentious issue, the rapid expansion of CCAs over the last few
years has increased the salience of this issue.
The California Public Utilities Commission currently has an open rulemaking that has
established several guiding principles regarding revising the PCIA in order to address
concerns.49 The new methodology aims to maintain bundled customer indifference
while using a methodology that provides transparency, verifiability, flexibility, and
stability as well as maintains a balance between accessible data and confidential
information.50 Importantly, the California Public Utilities Commission notes that this
methodology “should not create unreasonable obstacles for customers of non-
47 CCEA (2017). “City of Santa Monica Community Choice Aggregation Technical Study:
Summary of Results Draft.” 48 SBCP (2017). “Draft Business Plan.” 49 California Public Utilities Commission (2017). R.17-06-026. “Order Instituting Rulemaking to Review, Revise, and
Consider Alternatives To The Power Charge Indifference Adjustment.” http://docs.cpuc.ca.gov/PublishedDocs/Published/G000/M191/K426/191426539.PDF 50 Ibid.
40
investor-owned utilities energy providers.” 51 Various stakeholders have submitted
comments to the California Public Utilities Commission regarding the rulemaking.
Investor-owned utilities applied to have the Portfolio Allocation Mechanism (PAM)
replace the PCIA. While the California Public Utilities Commission dismissed the
investor-owned utilities’ initial PAM application, the investor-owned utilities continue
to offer suggestions that were included in the PAM under this current rulemaking.52
CalCCA, which represents CCAs across the state, also recommended revisions and
additions to the California Public Utilities Commission’s guiding principles, including
to “recognize California policies to promote development of CCAs” and to “respect
CCAs’ responsibility to develop their own generation portfolios.”53
Mitigation Strategies Suggested by Each Option
If “SCE’s generation rates decrease or its non-bypassable charges increase,” LACCE
proposes to establish a Rate Stabilization Fund, invest in both long- and short-term
contracts, and “emphasize the value of programs, local control, and environmental
impact in marketing.”54
SBCP discusses the regulatory risks in great detail in its draft business plan and
financial strategy. SBCP advises hiring a portfolio manager for energy risk
management and establishing a regional JPA of CCAs to benefit from economies of
scale.55 However, municipalities may face liabilities from guaranteeing startup loans.
Additionally, they propose refraining from entering into long-term contracts prior to
the revision of the PCIA.56 SBCP also proposes launching as quickly as possible in
order to start building up reserve funds and to pay off loans prior to the PCIA
revision.57 Additionally, as a contingency plan, SBCP proposes to “maintain financial
reserves and power contract obligations in a manner that affords notifying the CPUC
and SCE of the intent to suspend CCA operations one year ahead of time …and then
to do so without having to raise rates, otherwise cause losses, fail to meet any extant
debt service obligations, or breach any power contracts.”58
51 Ibid. 52 California Public Utilities Commission (2017). “Joint Comments of Southern California Edison Company (U 338-E),
Pacific Gas And Electric Company (U 39-E), and San Diego Gas & Electric Company (U 902-E) on Order Instituting Rulemaking To Review, Revise, And Consider Alternatives to the Power Charge Indifference Adjustment.” http://docs.cpuc.ca.gov/PublishedDocs/Efile/G000/M195/K146/195146326.PDF 53 California Public Utilities Commission (2017). “Comments of the
California Community Choice Association.” http://docs.cpuc.ca.gov/PublishedDocs/Efile/G000/M195/K910/195910761.PDF 54 LACCE (2017). “Los Angeles Community Choice Energy Business Plan Update.” Page 17. 55 Ibid. Page 35. 56 Ibid. 57 Ibid. Page 27. 58 Ibid. Page 27.

41
CCEA proposes a “laddered” procurement strategy (as described in more detail in
section 6.1), establishing a Rate Stabilization Fund, and participating in the CPUC’s
open rulemaking regarding the PCIA.59 For legislative and regulatory change risks
more broadly, each option recommends some form of lobbying, working with other
CCAs, and monitoring regulatory changes.
6.3 Market Force Risks
When Assembly Bill 117 authorized the creation of CCAs in 2002, one of the main
goals was to introduce competition into the energy market. Our previous research
found that CCAs do appear to put downward pressure on electricity prices that
customers pay while supporting the state’s renewable energy and energy efficiency
goals.60 As the energy market sees a proliferation of CCAs, this will further increase
competition in the energy market. This section identifies some market force risks
that we view as potential challenges for CCAs, and how each option is planning to
address those.
Increasing Electricity Rate Components: the 500% Surge in Transmission
and Delivery Fees
Transmission and delivery fees are charged by investor-owned utilities on a per kWh
basis to all customers, including CCA customers within their territory. As seen in the
figure below, the cost of transmission has strongly increased over time. For example,
SCE transmission and distribution revenue requirements increased by a factor of five
over the past decade. Such an important increase in cost will attract the attention of
end-users on their electricity bills, making customers more sensitive to electricity
prices.
59 CCEA (2017). “City of Santa Monica Community Choice Aggregation Technical Study:
Summary of Results Draft.” 60 UCLA Luskin Center for Innovation (2017). The Promises and Challenges of CCAs in California.
http://innovation.luskin.ucla.edu/content/promises-and-challenges-community-choice-aggregation-california-0

42
Figure 12. Transmission Revenue Requirements over Time61
This could be a disadvantage for CCAs that offer higher rates than investor-owned utilities in order to procure more renewables.
Losing High Revenue-Generating Non-Residential Customers: the Threat of
Direct Access
Direct Access (DA) is a “retail electric service where customers purchase electricity
from a competitive provider called an Electric Service Provider (ESP), instead of from
a regulated electric utility.”62 DA customers pay the exit fees, transmission, and
delivery fees to their utility, similar to what CCA customers do. DA closed to new
customers in 2001 and very successfully reopened temporarily in 2013 for non-
residential customers. According to the California Public Utilities Commission,
“Currently, the DA program is at capacity, as demand for DA service exceeded the
load permitted under the adopted utility service area caps.”63
If DA reopens again, and based on its past success, DA could be attractive enough
to result in non-residential customers leaving their investor-owned utility or CCA.
This is of particular risk to Santa Monica if it joins LACCE, which is expected to have
power prices that reflect all the cities in the county. The ocean cooling makes Santa
Monica and other coastal customers have loads that are lower cost to serve than
elsewhere in the County, so customers may find substantial discounts in
individualized rates quoted by DA providers. Moreover, if a DA customer has to pay
exit fees (PCIA) to the investor-owned utility, there are currently no such regulatory
mechanisms for CCAs to recover the financial loss resulting from excess power
procurement from departing customers.
61 California Public Utilities Commission (2017). “California Electric and Gas Utility Cost Report.” Page 18. 62 California Public Utilities Commission (2017). “California Direct Access Program.”
http://www.cpuc.ca.gov/General.aspx?id=7881 63 California Public Utilities Commission (2017). “California Direct Access Program.”
http://www.cpuc.ca.gov/General.aspx?id=7881

43
Losing Large Residential Customers: Self-Provisioning
Self-provisioning, or islanding, is when a customer can meet all of their electricity
needs without needing to import electricity from the grid. This is usually realized
when distributed energy generation, such as rooftop solar, is combined with battery
storage, load response, and energy efficiency. While islanding is currently not
permitted in California, this could eventually change. As an example, Hawaii has two
different Net Energy Metering (NEM) programs, one of which includes a self-
provisioning option.64 If transmission costs keep increasing by a factor of 2.5 to 5
every decade, self-provisioning electricity might become a cost-effective option with
the help of decreasing costs in solar energy, energy storage, and new technology
such as bidirectional charging car batteries or smart appliances. Moreover, energy
storage seems to be currently supported by the state and the federal legislature. For
example, the Federal Senate Bill 1868 was introduced to offer federal tax credits to
support energy storage.
As an example, research by the Rocky Mountain Institute found that within 20 years,
a commercial building property owner may be able to install a combination of solar
and storage at costs that would be more cost effective than purchasing energy from
their local utility.65 The figure below illustrates when some states may see self-
provisioning become cheaper than their affiliate utility.
64 Hawaiian Electric, Maui Electric, Hawai‘i Electric Light (2017). “Customer Self-Supply and Grid-Supply
Programs.” https://www.hawaiianelectric.com/clean-energy-hawaii/producing-clean-energy/customer-self-supply-and-grid-supply-programs 65 The Rocky Mountain Institute. “The Economics of Grid Defection.” https://rmi.org/insights/reports/economics-
grid-defection/

44
Figure 13. Solar and Batter Levelized Cost of Electricity Compared to
Utility Retail Price Projections66
Mitigation Strategies Suggested by Each Option
Retaining customers, especially high revenue generating customers, is critical to a
CCA’s financial success and ability to maintain operations.
LACCE proposes to “increase marketing…reduce overhead…expand to new customer
markets… [and] consider merging with existing CCA” if they start losing customers.67
SBCP has the most thought-out recommendations of all options when it comes to
market risk mitigation. The financial strategy recommends to “monitor the evolution
of the Direct Access debate at the CPUC and the Legislature”68 and “not engage in
long-term contracts prior to… further clarity on the risk Direct Access poses.”69 An
additional risk mitigation recommendation, although not specific to a decrease in
customer base, includes contracting “with a portfolio manager for power planning,
contracting, and energy risk management” for resiliency purposes.70
66 The Rocky Mountain Institute. “The Economics of Grid Defection.” https://rmi.org/insights/reports/economics-
grid-defection/ 67 LACCE (2017). “Los Angeles Community Choice Energy Business Plan Update” Page 17. 68 SBCP (2017). “Financial Strategy.” Page 42. 69 Ibid. Page 27. 70 SBCP (2017). “Financial Strategy.” Page 27.

45
SBCP also suggests that CCAs could stop replicating investor-owned utilities’ rate
structure and utilize their rate-setting authority in order to “offer individual customers
a customized, and flexible, rate structure.”71 Because CCAs do not need to seek the
California Public Utilities Commission’s approval for their rates, they could specifically
pay attention to the needs of their larger customers and provide them with special
services such as real-time pricing or tailored energy procurement.
71 Ibid. Page 42.
46
CHAPTER 7: CONCLUSION
Each option that Santa Monica is considering comes with tradeoffs, most notably
between formal autonomy and economies of scale. It is important to weigh these
tradeoffs in the context of providing competitive rates and programs in the face of a
changing energy market.
Los Angeles Community Choice Energy
Because LACCE is likely to be the largest CCA option, it reduces Santa Monica’s direct
influence on decisions made by the board. The only decision Santa Monica would
have full control over is the choice of electricity product to enroll their residents into
by default. Currently, member cities do not have direct autonomy over rates, power
content, or programs, and instead will collectively vote on these policies in the future.
Unlike SBCP that has a detailed set of recommended energy policies, LACCE’s
strategy is to wait for all member cities to join before voting on most policies. This
future decision-making process provides an opportunity for Santa Monica to form
coalitions with other member cities to influence the integration of innovative
strategies that would advance Santa Monica’s priorities.
Because this CCA will potentially be the largest CCA in the state, the size could offer
its member cities economies of scale, greater negotiating power with other
stakeholders, a more diversified energy portfolio, and a greater diffusion of financial
risks over its members. As another positive, because Santa Monica represents a
smaller share of the total load, their indirect financial contribution to startup and
operating costs is likely to be lower than it would be with SBCP or CCEA. Lower
operating costs and potentially higher margins would likely result in more funds to
invest in local energy programs. In conclusion, LACCE is the most operationally ready
and would require the least amount of work and financial commitment from Santa
Monica to join.
South Bay Clean Power
The sub-regional SBCP could potentially offer Santa Monica a balanced compromise
between the likely larger, regional LACCE and a single-city option. Member cities
could benefit from greater influence in the voting process, if they are willing to reduce
economies of scale. Moreover, SBCP offers a well-thought-out approach to energy
management services and a business model with innovative components.

47
The main challenges of this option are very low operational readiness and
momentum, and a higher financial risk for the City itself. Santa Monica would be
required to invest a lot of its time to get the CCA off the ground and recruit other
member cities to join. If SBCP does not officially launch, Santa Monica could still
consider implementing some of the recommended strategies developed by SBCP.
California Choice Energy Authority
Compared to the other options, CCEA’s single-city hybrid approach would offer Santa
Monica full autonomy on some of the most important decisions. CCEA is the only
option so far to provide the City with full control over rate setting, power content, the
default product, and the use of net revenues that could be invested in local energy
programs or other priorities determined by Santa Monica City Councilmembers. CCEA
would procure energy based on Santa Monica’s policies and power mix preferences,
and provide the City with rates that reflect the true cost of power supply. CCEA would
also require that Santa Monica approves energy contracts longer than five years.
However, even if CCEA considers members’ input in decisions, it is not clear how
much Santa Monica could influence the choice of third-party contractors and their
energy procurement strategies without a seat on the CCEA board. Santa Monica’s
ambitious environmental goals and long-term strategy might necessitate a flexible
CCA structure in which the City can vote on and influence all decisions that would
affect their energy procurement. Moreover, the CCEA option would offer Santa Monica
fewer economies of scale compared to larger CCAs like LACCE or SBCP. Economies
of scale may become increasingly important over the long-term given future
regulatory and market force risks that could reduce the amount of net revenues
available for programs, a rate stabilization fund, or debt services.