evaluating and mitigating the impact of complexity in ... and mitigating the impact of complexity in...
TRANSCRIPT

Evaluating and Mitigating the Impact of Complexity in Software Models
Julien Delange John Hudak William Nichols James McHale Min-Young Nam
December 2015
TECHNICAL REPORT CMU/SEI-2015-TR-013
Software Solutions Division
Distribution Statement A: Approved for Public Release; Distribution is Unlimited
http://www.sei.cmu.edu

CMU/SEI-2015-TR-013 | SOFTWARE ENGINEERING INSTITUTE | CARNEGIE MELLON UNIVERSITY
Distribution Statement A: Approved for Public Release; Distribution is Unlimited
Copyright 2015 Carnegie Mellon University
This material is based upon work funded and supported by the Department of Defense under Contract
No. FA8721-05-C-0003 with Carnegie Mellon University for the operation of the Software Engineer-
ing Institute, a federally funded research and development center.
Any opinions, findings and conclusions or recommendations expressed in this material are those of the
author(s) and do not necessarily reflect the views of the United States Department of Defense.
This report was prepared for the
SEI Administrative Agent
AFLCMC/PZM
20 Schilling Circle, Bldg 1305, 3rd floor
Hanscom AFB, MA 01731-2125
NO WARRANTY. THIS CARNEGIE MELLON UNIVERSITY AND SOFTWARE ENGINEERING
INSTITUTE MATERIAL IS FURNISHED ON AN “AS-IS” BASIS. CARNEGIE MELLON
UNIVERSITY MAKES NO WARRANTIES OF ANY KIND, EITHER EXPRESSED OR IMPLIED,
AS TO ANY MATTER INCLUDING, BUT NOT LIMITED TO, WARRANTY OF FITNESS FOR
PURPOSE OR MERCHANTABILITY, EXCLUSIVITY, OR RESULTS OBTAINED FROM USE
OF THE MATERIAL. CARNEGIE MELLON UNIVERSITY DOES NOT MAKE ANY
WARRANTY OF ANY KIND WITH RESPECT TO FREEDOM FROM PATENT, TRADEMARK,
OR COPYRIGHT INFRINGEMENT.
This material has been approved for public release and unlimited distribution except as restricted be-
low.
Internal use:* Permission to reproduce this material and to prepare derivative works from this material
for internal use is granted, provided the copyright and “No Warranty” statements are included with all
reproductions and derivative works.
External use:* This material may be reproduced in its entirety, without modification, and freely distrib-
uted in written or electronic form without requesting formal permission. Permission is required for any
other external and/or commercial use. Requests for permission should be directed to the Software En-
gineering Institute at [email protected].
* These restrictions do not apply to U.S. government entities.
Capability Maturity Model® is registered in the U.S. Patent and Trademark Office by Carnegie Mellon
University.
DM-0002966

CMU/SEI-2015-TR-013 | SOFTWARE ENGINEERING INSTITUTE | CARNEGIE MELLON UNIVERSITY i
Distribution Statement A: Approved for Public Release; Distribution is Unlimited
Table of Contents
Abstract iv
1 Introduction 1 1.1 Toward a Definition of Software Complexity 2 1.2 Distinguishing Essential and Avoidable Complexity 2 1.3 Research Questions 3 1.4 Overview of the Investigative Approach 3 1.5 Structure of This Report 4
2 The Impact of Model-Based Engineering on Software Complexity 5 2.1 Complexity Reduction 6 2.2 Development 7 2.3 Maintenance 12 2.4 Upgrades 15 2.5 Summary and Conclusion 15
3 Detecting and Avoiding Complexity 17 3.1 Complexity Measures and Metrics 17
3.1.1 McCabe Complexity Metric 17 3.1.2 Halstead Complexity Metrics 18 3.1.3 Zage Complexity Metrics 18 3.1.4 Program Counting 19
3.2 Effects on System Qualities: Application of Complexity Metrics in a Model-Based Environment 19
3.3 Cost Savings Estimates 20
4 Detecting Complexity – A Practical Example 21 4.1 Tool Overview 21 4.2 Discovering and Reducing Avoidable Complexity 21
4.2.1 McCabe Metric 22 4.2.2 Halstead Metrics 23 4.2.3 Zage Metrics 24 4.2.4 Nesting Level 25 4.2.5 Generic Type 26 4.2.6 Single Connection Check 27
5 Results and Conclusions 28
Appendix Acronyms 29
References 30

CMU/SEI-2015-TR-013 | SOFTWARE ENGINEERING INSTITUTE | CARNEGIE MELLON UNIVERSITY ii
Distribution Statement A: Approved for Public Release; Distribution is Unlimited
List of Figures
Figure 1: Growth of Avionics Software in KSLOC [Adapted from Hagan 2012] 1
Figure 2: Increasing Size of Onboard Avionic Software [Reprinted with permission from Redman et al. 2010] 5
Figure 3: Cyclomatic Complexity Increases with Size [Reprinted with permission from Maxwell 2008] 7
Figure 4: Invoking the Complexity Metrics Tools 21
Figure 5: McCabe Complexity Value in the Script Tab 22
Figure 6: McCabe Tab 23
Figure 7: Script Execution Output 24
Figure 8: Halstead Tab 24
Figure 9: Zage Metrics Tab Results 25
Figure 10: NestLevel Tab 26
Figure 11: GenericType Tab 26
Figure 12: Connection Tab 27
CMU/SEI-2015-TR-013 | SOFTWARE ENGINEERING INSTITUTE | CARNEGIE MELLON UNIVERSITY iii
Distribution Statement A: Approved for Public Release; Distribution is Unlimited
List of Tables
Table 1: Effort Distribution for Production of High-Quality Software 8
Table 2: Average Defect Potentials for Software in the United States [Data from Jones 2009] 10
Table 3: Defect Potentials in Comparable Systems for C and Java [Data from Jones 2012a] 10
Table 4: MBE Effect on Baseline Development for DO-178C Level C and A 10
Table 5: Major Kinds of Work Performed During Maintenance [Jones 2006] 13

CMU/SEI-2015-TR-013 | SOFTWARE ENGINEERING INSTITUTE | CARNEGIE MELLON UNIVERSITY iv
Distribution Statement A: Approved for Public Release; Distribution is Unlimited
Abstract
Safety-critical systems, such as those used in the avionics, aerospace, medical, and automotive do-mains, are becoming more software reliant, and their size has increased enormously. These sys-tems are becoming more complex, increasing certification costs. As certification is expensive and verification activities require significant manpower, this increasing complexity impacts the total cost of ownership. While part of the complexity is intrinsic to system functions and requirements, another part can be avoided. As software development is moving toward model-based approaches, reducing software model size and avoidable complexity would lower certification costs and re-duce software maintenance efforts. This report defines software complexity, metrics for complex-ity in models, and the effects of model complexity on levels of effort in the development, integration, maintenance, and upgrade costs of a project lifecycle. It focuses on popular code met-rics for models; their definition, measurement, and implications for development efforts; and tech-niques that have been used to reduce complexity, such as implementing a complexity measurement tool on a modeling tool. This report also presents an analysis tool that can be used to identify and measure complexity in a model-based development approach and explains how to ap-ply the newly defined metrics.

CMU/SEI-2015-TR-013 | SOFTWARE ENGINEERING INSTITUTE | CARNEGIE MELLON UNIVERSITY 1
Distribution Statement A: Approved for Public Release; Distribution is Unlimited
1 Introduction
Safety-critical systems—such as those used in the avionics, aerospace, medical, and automotive domains—are becoming extremely software reliant. The size of avionics software has increased enormously in the past few decades: as illustrated in Figure 1, the size of military avionics soft-ware increased from 135 KSLOC (thousand source lines of code) to 24 MSLOC (million source lines of code) in less than 40 years [Hagan 2012]. The software used by the Apache helicopter grew from 300 KSLOC in Model AH-64A (produced between 1984 and 1997) to over 1.4 MSLOC in Model AH64-D (produced until 2012) [McGarry 2012]. This trend is also true for other domains: automotive systems contain more and more electronic functions and, as space is scarce, most of these functions are implemented using software rather than hardware, which also facilitates system upgrade and maintenance. Because failure of such systems might have im-portant consequences, software for safety-critical systems must be designed and certified against stringent certification standards [ISO 2011, RTCA 2011a].
Figure 1: Growth of Avionics Software in KSLOC [Adapted from Hagan 2012]
An increase of software volume (i.e., number of lines of code [LOC]) implies that more compo-nents are executed by different computers and connected through networks using specific proto-cols. This increasing use of software also increases its complexity: interconnected components perform various functions, potentially at different criticality levels (e.g., entertainment system vs. cruise control), and designers must ensure isolation among these different criticality levels. Ac-cording to certification standards, a system must be free of any design errors and must be tested and validated to demonstrate that a component with low criticality cannot interfere with a compo-nent of high criticality [ISO 2011, RTCA 2011a].
Compliance with these requirements is expensive: related verification activities—such as code re-view, unit testing, and integration testing—require significant effort in terms of manpower and are

CMU/SEI-2015-TR-013 | SOFTWARE ENGINEERING INSTITUTE | CARNEGIE MELLON UNIVERSITY 2
Distribution Statement A: Approved for Public Release; Distribution is Unlimited
tightly dependent on the software size. Reducing software size and complexity would not only lower certification costs but also reduce software maintenance effort.
During the past few years, safety-critical software development has been moving toward model-based engineering (MBE) approaches, which consist of abstracting software concerns in models with specific notation. The objective is to use models like SCADE and SIMULINK to represent the software with accurate and convenient semantics that can be edited with a user-friendly inter-face [ANSYS 2014a, MathWorks 2015]. This representation is then processed to validate and ver-ify the architecture and ultimately transformed into executable code. A model-based approach ensures that system requirements are met and validated and removes the usual defects introduced by manual code production. Also, some standards [RTCA 2011a] allow the use of a certified code generator such as SCADE, which then waives code certification activities and, thus, reduces sig-nificantly the cost associated with them.
In this report, we introduce a method that we developed to identify model complexity and esti-mate its impact in terms of cost and effort savings. We detail the savings of MBE with a general cost-savings model that compares savings between traditional and model-based development pro-cesses. We define and explain how to measure complexity in software models and present several strategies to reduce or eliminate it. Then, we apply this approach with the SCADE modeling lan-guage and present our tool to compute complexity metrics from SCADE systems [ANSYS 2014a]. The following sections introduce the key concepts related to model complexity and pre-sent the outline of this report.
1.1 Toward a Definition of Software Complexity
When applied to a system, the term complexity has different dimensions and associated under-standings. One definition of complexity is based on the “ease of understanding” a software model representing a software system design specified by an engineer. Two components of this dimen-sion are
the notation: A clear, unambiguous language with a precise semantics eases the understand-ing of the model.
the user: A well-trained user who is familiar with a notation will take less time to under-stand and maintain a model.
Obviously, a model that is easy to understand is also easier to use and maintain, which reduces the likelihood that a user will introduce errors when updating it. For that reason, the notation should be designed to reduce or mitigate complexity. In addition, tools must be designed so that they guide users not familiar with the notation and help them both understand the model and avoid de-sign mistakes.
1.2 Distinguishing Essential and Avoidable Complexity
Evidence shows that software complexity has increased significantly over time not only because of the increase in number of functions but also because of a paradigm shift in which more func-tions are realized using software rather than hardware [Nolte 2009]. This prevalence of software usage induces an organic increase of software complexity, a type of complexity required to imple-

CMU/SEI-2015-TR-013 | SOFTWARE ENGINEERING INSTITUTE | CARNEGIE MELLON UNIVERSITY 3
Distribution Statement A: Approved for Public Release; Distribution is Unlimited
ment all the necessary functions. This is the essential complexity of a system, and it cannot be mit-igated by any means other than changing the design (removing functions or implementing them in hardware instead of in software).
However, complexity can be also introduced through poor design and implementation techniques. For example, too many interfaces on a component or too many nesting levels make software re-view and analysis difficult. This is the avoidable complexity of a system, and it can be removed by refactoring the system and using appropriate design patterns.
The total software complexity is the sum of the essential and the avoidable complexity. The es-sential complexity is related to the system functions and cannot be mitigated. On the other hand, the avoidable complexity is not necessary and incurs potential rework, refactoring, or re-engineer-ing efforts. For that reason, it should be avoided as much as possible and as early as possible.
1.3 Research Questions
The purpose of this research is to better understand the dimensions of complexity within a model-based software development paradigm. Specifically, our research questions are as follows:
1. How can we identify complexity in model-based systems? Is it possible to reuse metrics and approaches applied to traditional programming languages, or should we establish new metrics specific to model-based notations?
2. How can we measure complexity and distinguish essential from avoidable complexity? How can we detect avoidable complexity? What metrics are effective for doing that?
3. What is the impact of complexity? How much does it cost to maintain complex software, and how much can we save by reducing its complexity?
4. How can we mitigate software complexity? Can we identify particular modeling elements and patterns that incur avoidable complexity?
1.4 Overview of the Investigative Approach
In order to achieve our research goals, we undertook several parallel efforts to address the re-search questions posed in the previous section:
Review existing literature on software complexity applied to models and traditional pro-gramming languages.
Understand the use of model-based tools and how they can be used to mitigate software complexity.
Identify complexity metrics that are indicators of software quality and cost, and implement tools that generate complexity metrics in software models.
Evaluate the impact of model complexity with respect to phases of the development lifecycle (e.g., integration, acceptance, maintenance), and establish a method for determining return on investment to estimate potential cost savings when using models.
Identify techniques to reduce software complexity in models.
Design tools that produce complexity metrics from software models.

CMU/SEI-2015-TR-013 | SOFTWARE ENGINEERING INSTITUTE | CARNEGIE MELLON UNIVERSITY 4
Distribution Statement A: Approved for Public Release; Distribution is Unlimited
1.5 Structure of This Report
Section 1 (this introduction) provides our motivation to study complexity and the essential re-search questions that we address in this effort. Some background information provides the reader with a basis for the work and related areas explored.
Section 2 (The Impact of Complexity) discusses the impact of model-based development, the complexity at the software level, some associated metrics, and the effects of complexity in terms of relative levels of effort in the integration, maintenance, and upgrade costs of a project lifecycle.
Section 3 (Detecting and Avoiding Complexity) focuses on the more popular code metrics; their application to software models; their definition, measurement, and implications with respect to development efforts; and techniques that have been used to reduce complexity.
Section 4 (Detecting Complexity – A Practical Example) presents new complexity perspectives and associated techniques in the form of a model analysis tool. This tool identifies and measures complexity in software models and has been integrated in an existing modeling platform.
Section 5 (Results and Conclusions) reviews the results of how complexity is introduced in the development of a system and how an MBE approach can help mitigate that complexity.

CMU/SEI-2015-TR-013 | SOFTWARE ENGINEERING INSTITUTE | CARNEGIE MELLON UNIVERSITY 5
Distribution Statement A: Approved for Public Release; Distribution is Unlimited
2 The Impact of Model-Based Engineering on Software Complexity
Traditional software development techniques that implement solutions in embedded systems, con-trol systems, integrated modular avionics, and so forth are reaching scalability limits in both cost and assurance. In this section, we compare the economics of traditional development to develop-ment that relies on MBE and extend the argument in favor of MBE to include efforts that reduce the complexity of MBE models.
The volume, complexity, and cost of software development for safety-critical systems—such as in avionics, aerospace, defense, medical, or automotive systems— are trending upward. Figure 2 shows the trend in system size for avionic systems. Software volume, measured by lines of code, is on a trend to double every four years. Figure 2 includes software development cost estimates using COCOMO II of approximately $300 per line of code (LOC). High costs result from the need for highly skilled developers, the level of verification required for certification [DO-178 IG 2015, Hilderman 2009, RTCA 2011a], and a growing test volume. Although high cost is often at-tributed to the need for low defect density, it may be more correct to attribute cost to both the methods used to produce the software and the requirements for certification of its quality. Data from SEI customers suggests development rates of approximately 5 LOC per developer day for avionic code (this is only about half the rate used in The Mythical Man-Month [Brooks 1995]), re-sulting in about 1,000 LOC per year per developer. Assuming a fully burdened rate cost of $150,000 per developer, we estimate $150 per LOC using the best methods known but not neces-sarily satisfying DO-178B/C standards. Although precise values matter very much to developers and customers, this range is sufficient to illustrate that (1) the figure contains reasonable estimates and (2) development is rapidly approaching a point of unaffordability using current methods.
Figure 2: Increasing Size of Onboard Avionic Software [Reprinted with permission from Redman et al. 2010]

CMU/SEI-2015-TR-013 | SOFTWARE ENGINEERING INSTITUTE | CARNEGIE MELLON UNIVERSITY 6
Distribution Statement A: Approved for Public Release; Distribution is Unlimited
Another aspect of the increasing cost of software is that defect rates, using conventional develop-ment methods for high-assurance safety-critical systems, are commonly believed to be approxi-mately 100 defects per MSLOC [Li 1998], or more than a factor of 10 better than leading commercial software. The very best in class are perhaps 20 defects per MSLOC. Because 20% of defects may be serious and 1% may be fatal, software with even 1 to 5 defects per MSLOC is likely to contain at least 1 serious software defect, despite our best efforts with certification. For reasons we will discuss, MBE holds the promise [Hagan 2012] of pushing development defects consistently down toward the best-in-class numbers by aiding in the development of less complex underlying models with fewer defects, more easily discoverable defects, or both. Assuming that any added effort or other costs associated with reducing model complexity do not exceed the amounts saved by having fewer or easier-to-find defects, reducing complexity should be no worse than a break-even proposition in economic terms, with a net gain in quality as gauged by a lower number of defects found in the field.
Advocates of MBE propose that it will reduce manual labor, defects, and unnecessary complexity. The Correctness by Construction method relies on principles similar to MBE by validating and verifying a system as much as possible early in the design process. Prior work in Correctness by Construction on formal modeling and certified construction of code has shown practical promise [Barnes 2009], and regulations have been adapted to recognize formal proofs and certified code generators for verification [RTCA 2011b].
We argue that MBE is more cost-effective [Hagan 2012]—in terms of fewer dollars, shorter schedules, or both—and better because it reduces the amount of hand-built code, delivers fewer defects and thus higher assurance, and reduces the cost of verification for comparable systems de-veloped through traditional software techniques. MBE achieves these benefits by reducing the complexity visible to the developer with a higher level of abstraction and avoiding unnecessary complexity related to code production through automated translation of designs into code. Addi-tional reductions of complexity in the underlying model should further reduce the remaining cod-ing and debugging effort during development, decreasing implementation costs accordingly. This less-complex MBE representation should also be easier to verify, resulting in reduced verification, inspection, and testing efforts and in higher quality in terms of fewer escaped defects.
2.1 Complexity Reduction
MBE reduces or hides complexity (such as complexity related to code production and testing ac-tivities). Reduction may result from improved design using formal notation at a higher level of ab-straction. At a minimum, however, MBE hides much of the complexity (cyclomatic complexity) at the code level within the module. This hidden complexity represents code that need not be built by hand but can be machine generated. There is substantial evidence that cyclomatic complexity is linearly correlated with product size [Jay 2009, Hopkins 2008], at least within a domain, as il-lustrated by Figure 3.

CMU/SEI-2015-TR-013 | SOFTWARE ENGINEERING INSTITUTE | CARNEGIE MELLON UNIVERSITY 7
Distribution Statement A: Approved for Public Release; Distribution is Unlimited
Figure 3: Cyclomatic Complexity Increases with Size [Reprinted with permission from Maxwell 2008]
On the other hand, faults tend to increase superlinearly with size and complexity [Hatton 1997, Withrow 1990]. To the extent that MBE reduces the amount of hand-built code, it should have a direct linear effect on size and effort and a superlinear effect on software defect density.
The following sections discuss modeling of the development process and engineering economics. We also explain why the complexity of software models matters and how it impacts the benefits of MBE, increasing or decreasing the value of MBE development approaches.
2.2 Development
Traditional or conventional software development involves highly variable amounts of require-ments engineering and design, followed by an equal or greater amount of coding effort, followed by an amount of inspections, testing, and integration. Verification and validation vary according to the assurance levels required by the application (e.g., the Design Assurance Level [DAL] for avionics application), regulatory requirements, the size of the code, and especially the defect con-tent of the code. High-assurance code typically relies on both team inspections and exhaustive testing. Each production activity has the potential to introduce defects into the system, including the possibility that defect fixes themselves are defective. In this section, we provide benchmarks for production and defect rates for baseline development, examine how MBE changes the cost of production, and infer how reducing complexity in the underlying model should increase the bene-fits of MBE.
At typical levels of quality, Jones estimates the expected costs associated with defects in several phases of the lifecycle [Jones 2012a]:
Typical data for cost per defect varies from study to study but resembles the following pat-tern circa 2012:
Defects found during requirements = $250
Defects found during design = $500
Defects found during coding and testing = $1,250
Defects found after release = $5,000

CMU/SEI-2015-TR-013 | SOFTWARE ENGINEERING INSTITUTE | CARNEGIE MELLON UNIVERSITY 8
Distribution Statement A: Approved for Public Release; Distribution is Unlimited
To better understand how MBE might change the economics of development and verification, we begin by noting the role that correctness of the software plays in safety and security [Davis 2004] and then examine benchmark data for how effort is distributed among the development phases for a high-quality development process. The data in Table 1 are from teams using the Team Software Process (TSP) [Humphrey 2000, Musson 2002]. TSP data has the advantages of representing high-quality development and including sufficiently detailed measurements to inform estimates involving process change.
Table 1: Effort Distribution for Production of High-Quality Software
Phase % Effort
Planning 2.00
Requirements 2.00
System Test Plan 2.50
Requirements Inspection 5.00
High-Level Design (HLD) 7.00
Integration Test Plan 5.00
HLD Inspection 3.00
Detailed-Level Design (DLD) 11.50
DLD Review 5.00
Test Development 5.00
DLD Inspection 10.00
Code 15.00
Code Review 5.00
Compile 1.00
Code Inspection 9.00
Unit Test 3.00
Build and Integration Test 3.00
System Test 5.00
Postmortem 1.00
In data shown in Table 1, construction (i.e., activities to build the system – design, code, build) consumes about 65% of the total effort. The DO-178B/C standard requires additional test-based verification of 100% LOC coverage or modified condition/decision coverage (MC/DC) [Ackermann 2010]. This additional testing would likely increase the total development cost by 50% to 200% because of additional required analysis activities. Depending on the safety level of a component, DO-178C may require exhaustive low-level test of the code. The more stringent lev-els of test include complete line-of-code coverage, test of all decisions (essentially path coverage), and MC/DC [DO-178 IG 2015]. The result is that effort to develop and execute the tests can sub-stantially exceed the effort to develop the code. To account for this effort, we will apply a factor of 2.0 to the construction, realized in the unit test phase. We will also consider that very high as-surance generally applies additional resources to inspections, typically four to five inspectors ra-ther than the more common two to three inspectors.
The most direct potential for savings from MBE is through reducing the effort for phases from de-tailed-level design (DLD) through unit test, which in TSP benchmarks contain roughly 64% of the total effort (see Table 1). MBE approaches might reduce these aspects even more when combined

CMU/SEI-2015-TR-013 | SOFTWARE ENGINEERING INSTITUTE | CARNEGIE MELLON UNIVERSITY 9
Distribution Statement A: Approved for Public Release; Distribution is Unlimited
with use of a certified code generator, as produced code is automatically compliant with regula-tory constraints. Additional savings may be realized from efficiency in the design phases, during integration, and through lower levels of defects.
The SEI’s experience with high-reliability systems has been that a high-quality process leads to a low number of defects and reduces rather than increases cost [Nichols 2012, Obradovic 2013]. Nonetheless, actual industry practice and estimates of cost for high-reliability software vary widely. Shull reports increases to development costs ranging from 50% to 1,000% due to more coding constraints and certification requirements (e.g., testing, validation) [Shull 2002]. The SEI data suggest that the costs are not due to reliability per se but to the cost of developing, executing, and documenting the required test-based verification activities.
A white paper by Hilderman suggests that with planning, a high-quality development process, and test automation, the increase in cost would be a factor of roughly 1.7 [Hilderman 2009]. In a book on avionics certification, Hilderman states that SEI/CMMI Level 3 techniques should increase costs of developing safety-critical systems by 25–40%, with industry experience averaging closer to 75–100% [Hilderman 2007]. In his book on the economics of software quality, Capers Jones reports that CMMI Level 5 has among the lowest development costs [Jones 2011]. By focusing on system design, validating its correctness before implementation, and automatically generating cer-tified code, an MBE development process delivers high-dependability systems quickly and afford-ably.
From these varied data, we might suppose that (1) the skill and experience of the staff are a signif-icant factor and (2) extensive use of testing as quality control, as required for certification by DO-178B, will increase costs. A typical industry rule of thumb is that producing high-quality software increases cost by a factor of 3 [Ebert 2009], though this appears to rely more on tests than alterna-tive verification methods. It seems a reasonable estimate that cost savings can be realized through quality assurance (process), and cost increases can result from exhaustive testing for quality con-trol. To analyze the cost savings, we will use the conservative estimates that assume an emphasis on software quality assurance prior to application of quality control.
From the quality data and modeling, software assurance for high-reliability systems typically costs more until the product is released into test. After release to test, net savings are realized from running test cases once or just a few times, as opposed to a test-until-fixed approach, which tends to increase both the number of times a test suite is executed as well as the overall schedule.
Typical costs for inspection and testing effort run between 30% and 70% of the overall initial con-struction effort [RTI 2002], with either assurance level or defect content having the ability to dominate costs if it is high. Highly effective inspections require about 1 developer hour per 200 lines of code inspected, typically with four or five inspectors assigned. The inspection process alone could then cost 25 hours per KSLOC. TSP benchmark data indicates that there are less than 1,000 direct hours available per developer per year, which suggests that inspection alone would require at least 25 man years of effort for 1 MSLOC. MBE alters both the introduction and re-moval of defects; therefore, we include a description of the defect potentials in software.
Defects are injected in all portions of the development lifecycle, including maintenance. Jones provides some benchmark data for the typical number of defects, shown in Table 2 [Jones 2009].

CMU/SEI-2015-TR-013 | SOFTWARE ENGINEERING INSTITUTE | CARNEGIE MELLON UNIVERSITY 10
Distribution Statement A: Approved for Public Release; Distribution is Unlimited
Table 2: Average Defect Potentials for Software in the United States [Data from Jones 2009]
Source of Defect Defects per Function Point
Requirements 1.00
Architecture 0.30
Design 1.15
Code 1.35
Security code flaws 0.25 (security flaws)
Documents 0.50
Bad fixes 0.40
Total 4.95
Note that in Jones’ data, requirements, design, and code each contribute comparable numbers of defects. Not included in this table is the defect potential of the test cases themselves, which in our experience (and verified in private communications with multiple developers) is comparable to the code defects.
Jones has pointed out that the defect potential depends on the implementation choices; for exam-ple, two different languages require different code sizes to implement functionality and therefore inject substantially different numbers of defects [Jones 2012b]. To a first approximation, the de-fect levels scale with the size of the implementation. This is largely because developers inject de-fects into hand-crafted code at statistically predictable rates; thus defects scale with code size.
Table 3: Defect Potentials in Comparable Systems for C and Java [Data from Jones 2012a]
Defect Source
Defects in C per
2,000 SLOC
Defects
Defects in Java per
1,000 SLOC
Defects
Requirements 10 10
Design 20 20
Source code 30 15
Documents 3 3
Bad fixes 2 2
Total 65 50
Per KSLOC 3.25 2.5
Using an MBE approach to development instead of traditional approaches improves the develop-ment process of most major lifecycle activities. With data collected from industry case studies, we estimated the potential reduction in cost for two DALs: Level A (with the highest constraints, where a failure has catastrophic consequences) and Level C (where a failure has major conse-quences) [RTCA 2011b]. Software at a high DAL requires more testing and analysis (e.g., code coverage, state validation), increasing development costs. Table 4 summarizes how an MBE envi-ronment might affect the development process for safety-critical code. The phase effort ratios are similar to those seen in our TSP benchmark data, but show slightly more use of test and less use of review and inspection. The values are similar enough that we are confident that the data and models are sufficiently reliable to provide reasonable estimates. The use of MBE will alter the as-sumptions.
Table 4: MBE Effect on Baseline Development for DO-178C Level C and A
Activity Use of MBE in Development Baseline % Effort
Reduction for DAL C
Reduction for DAL A
Plan MBE provides a repeatable process for plan-ning, saving time, and making the plan more
9.3% 75% 75%

CMU/SEI-2015-TR-013 | SOFTWARE ENGINEERING INSTITUTE | CARNEGIE MELLON UNIVERSITY 11
Distribution Statement A: Approved for Public Release; Distribution is Unlimited
accurate and predictable. Substantially less planning effort is devoted to coding and test-ing activities.
Requirements, system design, functions, and system architecture
MBE is used to model functions and archi-tecture.
8.4% 17% 20%
System requirements allocated to software
Formal notation helps in early stage of con-trol algorithms design.
11.2% 17% 25%
Software design The formally defined language is used di-rectly for embedded software design.
6.5% 19% 25%
Code Code is generated directly from the design, though some specific manual code remains.
16.8% 77% 83%
Test
A code generator can be certified. The test environment for host and target can be quali-fied as a verification tool. While the designs must be verified, the code generation development process reduces the need for low-level testing of generated code. Formal MBE enables development of tools to support developing and running the same high-level tests on both host and target.
14.0% 59% 56%
Reviews and inspec-tions
Design and architecture have formal designs that can be reviewed with tool support. If the code generator is certified, code review is unnecessary for generated code. Manual code still requires review. Low-level test reviews are unnecessary where verification requires no test. User Context verification is automated. Detailed Certification Kits enable a repeata-ble process to be enacted.
16.8% 44% 60%
Integration, software of components, hard-ware, and software
The formally defined model and components enable integration development and meas-urement coverage with automated support.
16.8% 79% 80%
Final estimated effort % of baseline 100% 59% 43%
First, in the planning activity, use of the tools and formal methods requires a disciplined, repeata-ble process. The repeatable process can be reused, and benchmark data can be used for planning. Moreover, a substantial portion of planning typically involves estimation of the software size, coding, and testing. In the manual case, just under 10% of the effort is required. The net from the process change is a reduction of 75% more or less, regardless of Level C or Level A.
Second, MBE supports the early requirements and design through formal modeling of the func-tionality and architecture. Modeling the control algorithms using formal notation also helps in the early stages of design to allocate functionality to software. These stages typically require about 20% of the total effort and can be modestly reduced with tool support. Tools and formal methods reduce the effort by just under 20% for Level C and just over 20% for the more rigorous Level A.
Third, software design is performed, whether implicitly or explicitly, regardless of MBE use. MBE, however, provides a formal approach directly applicable to embedded systems, along with tool support. The result is a modest reduction in effort of 20% to 25% in the software design phase.
Fourth, by generating code from design, MBE eliminates much of the coding effort, thereby elim-inating that cost. This reduction can vary according to the particular MBE environment used.

CMU/SEI-2015-TR-013 | SOFTWARE ENGINEERING INSTITUTE | CARNEGIE MELLON UNIVERSITY 12
Distribution Statement A: Approved for Public Release; Distribution is Unlimited
However, experience indicates that roughly 20% of the code must still be manually constructed or modified, leaving a significant 80% savings for this stage.
Fifth, for an MBE environment certified to generate code, the product is precisely what the design language specifies, and the inspection and testing costs are reduced dramatically since verification is proven through the code generator rather than by inspection and test. Designs must still be in-spected and tested, as must manually written code, but code, code review, and detailed test efforts are substantially reduced. The cost benefits of using a certified code generator are magnified at this point. Assuming that inspectors and test developers are familiar with the design language in-volved, whether graphical, textual, or a mix, any reduction in the complexity of the design should result in less effort to verify (inspect and test) and in higher quality (fewer defects escaping from development).
Sixth, the integration effort in Table 4 is for certified and predictable components for which the interactions have been formally modeled. Integrating the various parts of a complex software sys-tem is usually a case of assembling its component parts in a logical sequence in order to verify the expected operation of each part in its proper place, typically only with minimal, expected interac-tions with other parts. A simpler, less complex system should result in a simpler, quicker, and less error-prone integration effort, both in designing the integration and actually performing it. Use of MBE should result not only in finding fewer defects during integration but also in improving con-figuration management of the components, thus reducing time and effort related to integration ac-tivities. The effort of integration and debugging can be reduced by about 80%.
As systems become larger and more complex, we suspect that the inherent benefits of MBE, espe-cially when considering the benefits of reducing the complexity of the underlying model, may be understated. During the integration phase, having a less complex system (e.g., fewer interfaces, fewer components, and models that are easy to understand and well documented) will make this phase faster to complete. Also, MBE facilitates the auto-integration of models that use different notations, which would then automate the integration process. We do not estimate these latter ef-fects here, but it seems logical to assume that these benefits could become more significant as the size and essential complexity of a system increase.
MBE does, however, increase some costs. There may be some growth in the effort to develop and interpret requirements. The design of a solution that satisfies requirements requires developers trained in the chosen MBE environment rather than developers who presumably would work with less well-specified inputs. We can also assume that more time will be spent in developing the more rigorous and detailed design. It is reasonable to assume that a more highly trained, and thus more expensive, group of designers will be required. While verification is still necessary to con-firm that the design satisfies the requirements, this effort should remain steady or possibly be re-duced somewhat since all relevant aspects of the design should be explicitly available due to the input demands of MBE.
2.3 Maintenance
Maintenance includes defect fixes, addition of new functionality, improvement of existing func-tionality or performance, or adaptation to a new environment, hardware, or software. Various sources, including Banker and the Software Technology Support Center, suggest that maintenance comprises 60% to 90% of the total lifetime costs [Banker 1991, 1993; STSC 2003]. Because

CMU/SEI-2015-TR-013 | SOFTWARE ENGINEERING INSTITUTE | CARNEGIE MELLON UNIVERSITY 13
Distribution Statement A: Approved for Public Release; Distribution is Unlimited
maintenance is the biggest contributor of the total cost of ownership (TCO), we will examine the effect of MBE generally on the maintenance phase of the product lifecycle and the impact of com-plexity over these activities. As safety-critical systems are maintained for decades, software com-plexity has a critical impact and will ultimately affect maintenance activities.
Capers Jones lists a number of categories of work performed under the generic term “mainte-nance,” reproduced in Table 5.
Table 5: Major Kinds of Work Performed During Maintenance [Jones 2006]
1. Major Enhancements (new features of > 20 function points)
2. Minor Enhancements (new features of < 5 function points)
3. Maintenance (repairing defects for good will)
4. Warranty repairs (repairing defects under formal contract)
5. Customer support (responding to client phone calls or problem reports)
6. Error-prone module removal (eliminating very troublesome code segments)
7. Mandatory changes (required or statutory changes)
8. Complexity analysis (quantifying control flow using complexity metrics)
9. Code restructuring (reducing cyclomatic and essential complexity)
10. Optimization (increasing performance or throughput)
11. Migration (moving software from one platform to another)
12. Conversion (Changing the interface or file structure)
13. Reverse engineering (extracting latent design information from code)
14. Reengineering (transforming legacy application to client-server form)
15. Dead code removal (removing segments no longer utilized)
16. Dormant application elimination (archiving unused software)
17. Nationalization (modifying software for international use)
18. Year 2000 Repairs (date format expansion or masking)
19. Euro-currency conversion (adding the new unified currency to financial applications)
20. Retirement (withdrawing an application from active service)
21. Field service (sending maintenance members to client locations)
We discuss major and minor enhancements in Section 2.4 on upgrades. Most, but not all, other items on this list are relevant to the embedded software in control systems and avionics. For ex-ample, we can ignore Y2K and currency conversions. Also, avionic software should have few or no error-prone modules, dead code, or unused software because these are DO-178C require-ments). We begin by demonstrating substantial savings with the reduction of defects.
A common feature of maintenance is the modification of existing software (e.g., bug fixes). In this respect, maintenance work looks like and costs similarly to new development, and the estimates from MBE for development still apply. According to Capers Jones, TCO is largely driven by de-fect removal [Jones 2009]; however, other factors may apply. Such factors include the compre-hensiveness and correctness of designs, adequacy of documentation, configuration management, and staff familiarity with the products.
Maintenance costs tend to be somewhat higher per changed line of code for a variety of reasons:
New staff are unfamiliar with the current design and implementations (as safety-critical sys-tems operate for decades, the staff maintaining the software is usually not the staff who de-veloped it).
Poorly structured code (or models) is more difficult to understand and alter, especially with undertrained staff.

CMU/SEI-2015-TR-013 | SOFTWARE ENGINEERING INSTITUTE | CARNEGIE MELLON UNIVERSITY 14
Distribution Statement A: Approved for Public Release; Distribution is Unlimited
Defects found in operation can be difficult to reproduce and locate in the code or model.
For large bodies of code or models, it is difficult to maintain the current design.
Regression tests must be maintained and executed for each change.
Changes can introduce unanticipated incompatibilities within the system.
Banker estimates that software complexity itself can increase maintenance costs of commercial applications by 25% and increase the total lifecycle costs by 17% [Banker 1993]. Considering not only that safety-critical applications have stringent quality requirements but also that both the software and models of such applications must be maintained for decades, the real costs could be higher than these estimates for critical applications.
Maintenance costs are largely mitigated through use of MBE for the following reasons:
Designs provide a higher level of abstraction and focus on business concerns, hiding unnec-essary complexity.
Designs are the primary developer artifact and are maintained through use of the tool.
Staff can hide implementation details and focus attention at a higher level of analysis than the detailed code.
Optimization and low-level structure are managed through code generation (especially true when using certified code generator) or at the design level of abstraction.
For MBE environments providing certified code generation, the same reductions in cost and escaped defects enjoyed in development are repeated in maintenance.
Code restructuring is largely unnecessary, or if it is necessary, it happens for only the effort required to change the model, with the code following along for minimal or zero cost.
Fewer regression tests must be maintained.
Jones provides a sample calculation showing factors of 0.5 to 10 TCO savings in development, enhancement, and maintenance when using high-quality, certifiable, reused components [Jones 2009]. That is, the benefits of high quality not only propagate throughout the product life but also provide larger savings during the maintenance phase than during initial development. If fewer de-fects escape from development due to the reduced complexity there, maintenance cost should be reduced proportionally. Also, the simpler MBE artifacts that result from reduced complexity make finding and fixing defects easier and faster.
For long-lived systems, adaptation to new hardware components must from time to time be ac-counted for, as obsolete hardware is replaced with newer components. The integration of new hardware components usually requires software revisions to accommodate changes to the inputs, outputs, and performance. MBE affects the software development and verification during this stage as much as MBE affects new development.
Finally, the maintenance staff is often not the same staff who did the development, especially for systems operating for many years. Some systems are maintained for more than 50 years and re-quire software upgrades to support additional components and adaptation to new operating sys-tems or processors. In this case, there is a potentially large effort just to understand the existing artifacts. MBE provides obvious benefits through a smaller, design-oriented view of software

CMU/SEI-2015-TR-013 | SOFTWARE ENGINEERING INSTITUTE | CARNEGIE MELLON UNIVERSITY 15
Distribution Statement A: Approved for Public Release; Distribution is Unlimited
functionality than the code itself, and any reduction in complexity of the MBE artifacts will re-duce that effort accordingly. Thus in maintenance activities, reduction of complexity will have the biggest potential savings.
2.4 Upgrades
Upgrades are a small-to-medium development activity integrated with maintenance efforts. An upgrade combines substantial development and integration. Most of the analysis that applies to new development will, once again, directly apply to upgrades. Depending on the type of upgrade, MBE will either reduce or avoid effort. When integrating a new functionality, the use of MBE will reduce the upgrade process through the same benefits as in development and other mainte-nance activities. In some cases (e.g., support of a new execution platform, such as modification of the operating system or target processor), upgrade efforts will be supported by the code generator.
During upgrade activities, developers must understand the existing development artifacts in order to accommodate the new features into the design. This is made easier by using a high-level repre-sentation, as provided by the MBE environment, that hides implementation complexity. The pro-cess is reinforced by the use of a certified code generator, as the generated code does not need to be reviewed.
Then developers must design the upgrade (again, made easier by reduced initial complexity) and implement the upgrade (with the same logic in favor of reduced complexity as in development, and enhanced in the case of certified code generation). Finally, they must integrate and test the upgrade with the same approach discussed in initial development. The same factors apply, favor-ing reduced complexity, reduced unit test, and automated support for integration and integration test.
2.5 Summary and Conclusion
In this analysis, we have seen that the baseline assumptions for productivity are supported by both industry data and data collected from TSP teams. Conventional development approaches fail to scale because the cost per line of code becomes prohibitive at some volume of code. New devel-opment approaches that reduce development efforts and overall complexity are required to ad-dress this issue. The MBE paradigm seems to address these problems by
reducing design complexity with a higher level of abstraction that focuses on system design, validates it earlier, and hides implementation (e.g., code) details
generating code from the models, thereby reducing implementation (e.g., code production) activities
reducing testing and certification activities, especially when using a certified code generator
assisting with the management of change propagation during maintenance via a high-level set of reusable components
We showed that when using a certified code generator, MBE can cut 50% of the development costs, depending on the criticality level, as illustrated in Table 4. Obviously, the more critical the component, the more tests engineers must write and execute. And when large numbers of tests must be written and executed, an MBE approach with a certified code generator will reduce test-ing efforts and increase savings.

CMU/SEI-2015-TR-013 | SOFTWARE ENGINEERING INSTITUTE | CARNEGIE MELLON UNIVERSITY 16
Distribution Statement A: Approved for Public Release; Distribution is Unlimited
Using an MBE approach makes the development process more robust and eases the certification process and the related testing activities. In addition, reducing model complexity has a significant impact on maintenance activities, and maintaining a well-documented model that is easy to under-stand and modify will decrease the TCO. Because safety-critical systems are maintained for dec-ades, ensuring high-quality development artifacts (with reduced complexity) can reduce the TCO merely by reducing the effort in development, inspection, and test. Complexity reduction alone may reduce the maintenance costs by 25% and the TCO by 17%. Although model complexity is a contributor to high-quality components, this study demonstrates that maintaining low-complexity components and delivering high-quality models reduce maintenance activities and associated costs.

CMU/SEI-2015-TR-013 | SOFTWARE ENGINEERING INSTITUTE | CARNEGIE MELLON UNIVERSITY 17
Distribution Statement A: Approved for Public Release; Distribution is Unlimited
3 Detecting and Avoiding Complexity
3.1 Complexity Measures and Metrics
Software complexity is different at the architecture level, where it is defined by how components communicate and are integrated, than at the code or behavior level, where it is defined by how components are implemented.
At the architecture level, notations range from informal (narrative descriptions, block diagrams, etc.) to formal, in the form of architecture description languages (ADLs), state machines, and computer code. ADLs capture abstracted components of the system and their interactions among one another [Aiguier 2009]. Given that ADLs represent a specification formalism of architectural connectors, the denotation is essentially a formalism in which complexity can be characterized by the notation of property emergence. Aiguier considers a system complex when the global system does not preserve the complete behavior of some subsystems and when some global properties cannot be deduced from a complete knowledge of system components. Unfortunately, and proba-bly because of a lack of efficient notations, there has been limited application of this work on ar-chitecture complexity to identify and measure software complexity in models.
Most often, complexity metrics are applied at the code level. The code structure—along with data and control flow paths and associated interface variables—form the basis for assessing complex-ity. In addition, code is a formal notation that can be processed to produce complexity metrics. The following paragraphs introduce metrics used in industry to gain insight into the complexity of the software.
3.1.1 McCabe Complexity Metric
McCabe complexity focuses on the data flow in the architecture [McCabe 1976]. The metric rep-resents a program as a graph and defines the complexity, C, as = − + 2 ,
where E is the number of edges, N is the number of nodes, and P is the number of connected com-ponents.
One problem with the McCabe complexity metric is its application to various programming lan-guages and the granularity of the mapping between the graph and the programming language. In some cases, the graph is mapped onto different source code artifacts and two analysis tools might have different interpretations of the metrics and their representation in the programming language. For example, an edge can be a use relationship, a method/function call, or an inheritance link. When using this metric, we must keep these restrictions in mind and clearly define our mapping between the model elements and the graph.

CMU/SEI-2015-TR-013 | SOFTWARE ENGINEERING INSTITUTE | CARNEGIE MELLON UNIVERSITY 18
Distribution Statement A: Approved for Public Release; Distribution is Unlimited
3.1.2 Halstead Complexity Metrics
Halstead metrics aim to estimate the programming effort [Halstead 1972, 1977]. The metrics can be applied to preliminary software design artifacts (pseudo code) as well as to the code itself. The metrics are based on counting various characteristics of the software system:
n1: number of distinct operators
n2: number of distinct operands
N1: total number of operators
N2: total number of operands
The following measures are then produced: ℎ = 1 + 2 = 1 + 2 = ∗ log
= 12 ∗ 2/ 2 = ∗ = /18
: ∗∗ 233,000
The constants (18 for the time to implement the system and 3,000 for the number of delivered bugs) were defined by Halstead himself. It might be useful to revise them, depending on the appli-cation background, the domain, and specific constraints or requirements on the software.
Because they work at the implementation level (processing the source code), Halstead metrics can be inaccurate for users who want metrics for a higher level of abstraction: producing these metrics requires the actual system realization.
3.1.3 Zage Complexity Metrics
Zage metrics focus on two measures [Zage 1993]:
De: an external metric related to the component’s external interfaces and other interactions within the system
Di: an internal metric related to the component’s internal structure (algorithms, internal data flows, etc.)
The global metrics are then the sum of both De and Di.
De, the external measure, is defined as follows for a particular component in the system: = ∗ (# ∗ # ) + (# ∗ # ), where e1 and e2 are weighting factors defined by the user.

CMU/SEI-2015-TR-013 | SOFTWARE ENGINEERING INSTITUTE | CARNEGIE MELLON UNIVERSITY 19
Distribution Statement A: Approved for Public Release; Distribution is Unlimited
Di, the internal measure, is defined as follows: = ∗ + + / ,
where
i1, i2, and i3 are weighting factors defined by the user
CC is the number of procedure invocations
DSM is the number of references to complex data types (pointers, records, arrays, etc.)
I/O is the number of input/output operations (read a device, write in a file, receive data from the network, etc.)
The external metric focuses on the external interfaces (what is using or used by the component) and does not take into account the data flow in the architecture (in contrast to other metrics, such as McCabe’s). The internal metric is very precise but can be difficult to map into a programming language. For example, some concepts are not present or are hidden by some languages: the num-ber of I/Os is often abstracted by the language, and the number of references to complex data types is language dependent (e.g., in Java, any object variable can be counted as a pointer).
3.1.4 Program Counting
There are many other metrics to analyze software and to characterize and identify complexity. In some respects, the McCabe, Halstead, and Zage metrics also use these values to provide a better view of complexity. However, in some cases, the raw data alone can be a good indicator of soft-ware complexity. One simple approach is to count the program elements and identify whether there are too few, too many, or just enough elements. Some coding guidelines use program count-ing approaches to evaluate the complexity and quality of a piece of code. For example, in the Linux kernel coding style, the code should have fewer than four levels of indentation to keep it simple to understand [LKO 2015]. Many similar techniques can give developers insight into soft-ware complexity, such as the number of functions, use of specialized data types, number of argu-ments for a method or function, and the number of methods within a class.
3.2 Effects on System Qualities: Application of Complexity Metrics in a Model-Based Environment
Can one apply complexity metrics that have been developed for specific programming languages and design artifacts to actual models, which rely on several different tools and languages? In fact, due to differences in language semantics, existing metrics cannot be used on all programs because the language does not provide the required values. For example, current code analysis tools have different understandings of dependencies in Java, such as use of a class and call of a method. Thus, applying complexity metrics initially designed for traditional programming languages in a model-based environment is a real challenge. It is a paradigm shift that needs some tailoring. The design methods for manual code and models use different artifacts; to apply the metrics in mod-els, one has to identify how to map programming language concepts into models.
This challenge has been previously discussed mostly for Simulink models. Prabhu applies McCabe’s cyclomatic complexity and the Halstead metrics to evaluate the complexity of Sim-ulink models [Prabhu 2010]. He notes the challenge of switching from programming languages to

CMU/SEI-2015-TR-013 | SOFTWARE ENGINEERING INSTITUTE | CARNEGIE MELLON UNIVERSITY 20
Distribution Statement A: Approved for Public Release; Distribution is Unlimited
models: metrics have to be tailored and values obtained at the code or model level so that com-puted values are different. Olszewska introduced new metrics specific to high-level design [Ol-szewska 2011]. They focus primarily on model counting, such as the average number of blocks per layer or the stability of the number of inputs/outputs across the model.
Actual modeling tools include limited support for complexity features. In MATLAB, SLdiagnos-tics provides a model counting tool but does not apply any existing complexity metrics used with typical programming languages such as McCabe or Halstead [MathWorks 2014]. But model-based engineering is still emerging, and the topic of software model complexity is fairly new. Be-fore integrating complexity-related features into modeling tools, it is worth defining how to iden-tify complexity in models and how to compute it.
Similarly to programming languages, commercial modeling tools have guidelines and rules for writing models [ANSYS 2014b, MAAB 2007]. Rules are focused not solely on quantitative as-pects (e.g., number of components, connections) but also on graphical aspects (organization of model elements when using a graphical representation), naming rules, data type definitions, com-ponents to use or avoid, and others. Even if these guidelines can help the system designer, there is no automatic support for validating their enforcement.
3.3 Cost Savings Estimates
Research has demonstrated that MBE can save a significant amount of effort, especially for safety-critical systems, due to better design and a reduced need for testing [Hagan 2012]. Costs savings are even more significant when the code generator is certified by DO-178C standards [RTCA 2011a], which further reduces the number of tests to be performed. Empirical studies based on previous projects show that using models can save from 21% (using a regular platform) to almost 60% (using a certified platform) when producing software at the highest criticality level (e.g., DAL A for DO-178C, which is the most stringent in terms of verification) and from 30% (non-certified platform) to 40% (certified platform) when designing software at the lowest level (e.g., DAL D). As there are fewer verification activities for software at a lower criticality level, using a certified code generator does not save as much as when designing critical software.
However, these estimates are often made by tool vendors using in-house models. Because tool vendors have a good knowledge of their own technologies, the models they evaluate do not con-tain many defects. Models from designers can have a lot more complexity that originates from the users’ background, experience, and understanding of a tool. For practitioners, the model complex-ity becomes a variability factor when estimating software development costs. These estimates not only show the value of MBE but also how much complexity increases or decreases software de-velopment costs. The previous section of this report provided more detailed cost savings estimates not only for the development process but also for the overall lifecycle.

CMU/SEI-2015-TR-013 | SOFTWARE ENGINEERING INSTITUTE | CARNEGIE MELLON UNIVERSITY 21
Distribution Statement A: Approved for Public Release; Distribution is Unlimited
4 Detecting Complexity – A Practical Example
4.1 Tool Overview
We built our complexity metric tools as scripts written in the TCL language to be installed on SCADE. SCADE supports the installation of TCL scripts as extensions, and these scripts are fully integrated in the SCADE environment. In the following, we explain what part of the model the tool covers so that users will understand what it does. For installation instructions, a complete user guide is available in the work of Nam [Nam 2015].
4.2 Discovering and Reducing Avoidable Complexity
The following metrics are available in our tools:
McCabe: computes the regular McCabe metric for a node [McCabe 1976]
Halstead: computes the Halstead metrics for a node [Halstead 1972, 1977]
Zage: computes the Zage metrics for a node [Zage 1993]
nesting level: counts the depth of non-predefined operators and state machine states in mod-eling components
generic type: detects use of generic types (int, bool, etc.)
single connection check: looks for operators that may be better merged with other operators because they consist of a single input connection
To use the tool, select the operator (a) that you want to analyze, and invoke the tool using the Complexity Tools menu (b), as shown in Figure 4.
Figure 4: Invoking the Complexity Metrics Tools
In the following, we describe the implementation of each complexity metric and detail what part of a SCADE model is being processed. Consequently, it would be useful to be familiar with the SCADE tool.

CMU/SEI-2015-TR-013 | SOFTWARE ENGINEERING INSTITUTE | CARNEGIE MELLON UNIVERSITY 22
Distribution Statement A: Approved for Public Release; Distribution is Unlimited
4.2.1 McCabe Metric
For the McCabe metric, the tool searches for IF and CASE statements and loops (FOR state-ments) in the model and counts them to calculate the McCabe complexity value. For CASE state-ments, it considers the number of case values and whether or not they are default values. It currently does not check “If Block,” “If Node,” “When Block,” and “When Branch” in SCADE. State machines generate case statements in code. Thus, the tool considers the number of states. Also, the tool recognizes that if a state machine has at least one strong transition (a transition that activates a state when the transition condition becomes true), each state counts for two cases. Each transition in a state machine generates one IF statement. Among the predefined operators, we found that the operators in the “Higher Order” category generate FOR loops. Each FOR loop is counted as 1.
Currently the tool starts from the selected operator and checks all equations and contained opera-tors, which are also represented as equations. If a state machine exists in the operator, the tool searches inside the states and state transitions for the aforementioned elements. For state transi-tions, the tools checks only the conditions. States can contain other state machines inside, so the tool searches recursively through all state machines.
After the tool runs, it prints the final McCabe complexity value in the Script tab in Output, as shown in Figure 5.
Figure 5: McCabe Complexity Value in the Script Tab
The McCabe tab shows which elements contributed to the final complexity count; see the Count column in Figure 6.

CMU/SEI-2015-TR-013 | SOFTWARE ENGINEERING INSTITUTE | CARNEGIE MELLON UNIVERSITY 23
Distribution Statement A: Approved for Public Release; Distribution is Unlimited
Figure 6: McCabe Tab
4.2.2 Halstead Metrics
To evaluate Halstead metrics, the tool calculates four values:
1. total number of operators
2. total numbers of operands
3. total number of distinct operators
4. total number of distinct operands
To do this, the tool navigates through the model, finds all “Predefined Operators” as defined in SCADE, and counts their number of instances. If an operator is used at least once, it is counted as 1 for the number of operators. For each operator, the tool also investigate its inputs for operands. It calculates the total number of operands by adding all parameters that are of the type ExprId for each predefined operator instance.
To account for distinct operands, if an input to one operator is also an input to another, those in-puts count as one single operand. The tool calculates the number of operands by first saving all local variables in an operator into a set. The total number of local variables in the set is N_all. Then for each suboperator, the tool tries to remove all local variables that are used as inputs from the set. After the tool does this for each suboperator, the set is left with local variables that are used only for outputs or saved in local variables (and never used for input to another operator). The current size of the set equals N_output. Then by subtracting N_output from N_all, we get the number of distinct inputs that exist for all the suboperators in an operator. We add this value for every SCADE operator.
The accuracy depends on whether the search goes to every possible place in the model that could have a predefined operator. Currently the tool starts from the selected operator and checks all equations and contained operators that are also represented as equations. If a state machine exists in the operator, the tool searches inside the states and state transitions for equations and operators. For state transitions, it checks only the conditions. States can have another state machine inside, and the tool recursively searches through all state machines.

CMU/SEI-2015-TR-013 | SOFTWARE ENGINEERING INSTITUTE | CARNEGIE MELLON UNIVERSITY 24
Distribution Statement A: Approved for Public Release; Distribution is Unlimited
In Figure 7, the Halstead Script tab shows the results of the analysis and the values for the total number of operators, operands, distinct operators, and distinct operands. It will also display which operator keys (unique values in SCADE for each predefined operator) exist and how frequently they are used.
Figure 7: Script Execution Output
From the Halstead tab, shown in Figure 8, users can do a visual check of which operators and op-erands are accounted for. The count column shows only the total count number and not the dis-tinct number for an item.
Figure 8: Halstead Tab
4.2.3 Zage Metrics
For Zage metrics, the tool looks for four values:
1. number of inputs
2. number of outputs
3. number of fan-in units

CMU/SEI-2015-TR-013 | SOFTWARE ENGINEERING INSTITUTE | CARNEGIE MELLON UNIVERSITY 25
Distribution Statement A: Approved for Public Release; Distribution is Unlimited
4. number of fan-out units
The tool gives these values for each operator that is not predefined. It counts the number of inputs and outputs by analyzing the equation that calls the operator. Fan-in is counted by adding the number of times an operator type is used in the model. Fan-out is counted by the number of suboperators that an operator contains. The tool analyzes operators that are given in the SCADE as libraries to use, such as MAX and MIN.
In Figure 9, the result is shown at the end of the tab named Zage. After scrolling down to the end of the table, the user sees a list of all the non-predefined operators that were used, the four values listed above, and the De value (the external design metric), which is currently the multiple of Num Input and Num Output summed with the multiple of FanIn and FanOut. Weight factors are simpli-fied to 1.
Figure 9: Zage Metrics Tab Results
4.2.4 Nesting Level
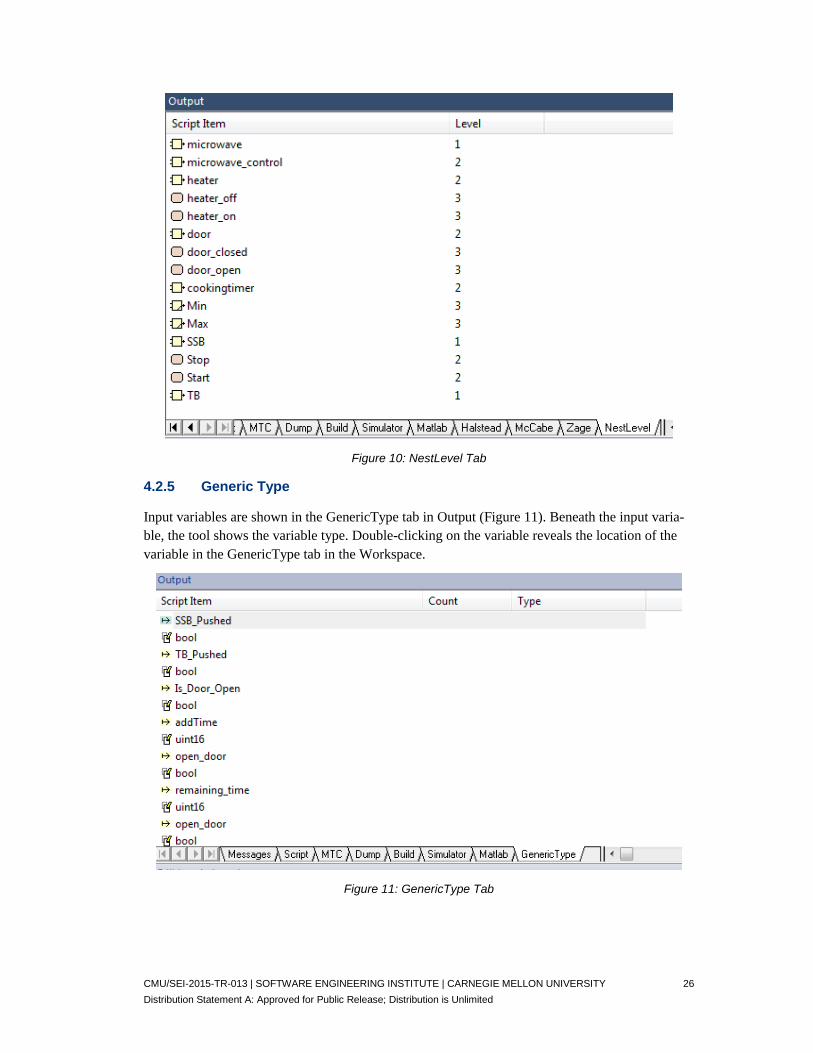
In Figure 10, the Script tab shows the maximum nesting level, and the NestLevel tab shows the level of each non-predefined operator and state that were identified in the model.
CMU/SEI-2015-TR-013 | SOFTWARE ENGINEERING INSTITUTE | CARNEGIE MELLON UNIVERSITY 26
Distribution Statement A: Approved for Public Release; Distribution is Unlimited
Figure 10: NestLevel Tab
4.2.5 Generic Type
Input variables are shown in the GenericType tab in Output (Figure 11). Beneath the input varia-ble, the tool shows the variable type. Double-clicking on the variable reveals the location of the variable in the GenericType tab in the Workspace.
Figure 11: GenericType Tab

CMU/SEI-2015-TR-013 | SOFTWARE ENGINEERING INSTITUTE | CARNEGIE MELLON UNIVERSITY 27
Distribution Statement A: Approved for Public Release; Distribution is Unlimited
4.2.6 Single Connection Check
A dialog appears with the total number of operators that have single connections. All non-prede-fined operators in the model are shown in the Connection tab from Output (Figure 12). Below each operator, the tool shows the count of inputs and indicates whether there is only one connec-tion.
Figure 12: Connection Tab

CMU/SEI-2015-TR-013 | SOFTWARE ENGINEERING INSTITUTE | CARNEGIE MELLON UNIVERSITY 28
Distribution Statement A: Approved for Public Release; Distribution is Unlimited
5 Results and Conclusions
Safety-critical systems, such as those used in the avionics, aerospace, medical, and automotive do-mains, are becoming more software reliant, and their size has increased enormously. An increase of software volume implies that more components are executed by different computers and con-nected through different protocols, increasing the software complexity. Compliance with certifica-tion requirements for these systems is growing more and more expensive, and verification activities require significant manpower. For those reasons, reducing software size and complexity will lower certification costs and reduce software maintenance efforts.
The purpose of this research was to better understand complexity within a model-based software development paradigm and to determine whether an MBE approach can help reduce the overall complexity of software models and ultimately of safety-critical software. Our research questions were
1. How can we identify complexity in model-based systems?
2. How can we measure complexity and distinguish essential from avoidable complexity?
3. What is the impact of avoidable complexity?
4. How can we mitigate software complexity?
In order to reduce complexity in models and software, a development team must be able to iden-tify and measure it. To identify complexity in software models, we first adapted complexity met-rics typically used with traditional programming languages (e.g., Java, C) to modeling languages (e.g., SCADE). We evaluated these established metrics and their relevance for software models. While they provide an overview of a model’s complexity, we think that new complexity metrics specific to the model’s semantics and its data flow approach would more accurately capture model complexity.
We then introduced our data flow analysis complexity tool, which analyzes each data flow in a model and ultimately provides insight about its inherent complexity (number of components used, division of the flow across the architecture, etc.). We detailed the use of our metrics to identify and reduce avoidable complexity; our tool helps users apply these metrics to the system under de-velopment to mitigate complexity through every stage of the system’s lifecycle. While these met-rics are a step toward a better understanding of model complexity, they need to be calibrated in order to distinguish and qualify models (e.g., which one requires rework or refactoring efforts and what needs to be done).
We estimated that, depending on development requirements and constraints, using an MBE ap-proach could reduce development costs by as much as 50%. In addition to these savings, reducing model complexity could lower maintenance costs by 25%. As maintenance activities account for 70% to 90% of the total lifecycle costs, using a MBE development approach and keeping the complexity of software models low can reduce the TCO for a system by as much as 30%.

CMU/SEI-2015-TR-013 | SOFTWARE ENGINEERING INSTITUTE | CARNEGIE MELLON UNIVERSITY 29
Distribution Statement A: Approved for Public Release; Distribution is Unlimited
Appendix Acronyms
ADL architecture description language
DAL Design Assurance Level
DLD detailed-level design
HLD high-level design
KSLOC thousand source lines of code
LOC lines of code
MBE model-based engineering
MD/DC modified condition/decision coverage
MSLOC million source lines of code
TCL tool command language
TOC total cost of ownership
TSP Team Software Process
CMU/SEI-2015-TR-013 | SOFTWARE ENGINEERING INSTITUTE | CARNEGIE MELLON UNIVERSITY 30
Distribution Statement A: Approved for Public Release; Distribution is Unlimited
References
URLs are valid as of the publication date of this document.
[Ackerman 2010] Ackermann, Christopher. MCDC_Coverage_02 in a Nutshell. Fraunhofer USA. 2010. http://www.slidefinder.net/n/nutshell_christopher_ackermann/mcdc_coverage_02/7587078
[Aiguier 2009] Aiguier, Marc et al. Complex Software Systems: Formalization and Applications. International Journal on Advances in Software. Volume 2. Number 1. 2009. Pages 47–62.
[ANSYS 2014a] ANSYS. SCADE Suite. ANSYS. 2014. http://www.ansys.com/Products/Simulation+Technol-ogy/Systems+&+Embedded+Software/ANSYS+SCADE+Suite
[ANSYS 2014b] ANSYS. SCADE Suite Application Software Development Standard. ANSYS. 2014.
[Banker 1991] Banker, R. D. et al. A Model to Evaluate Variables Impacting the Productivity of Software Maintenance Projects. Management Science. Volume 37. Number 1. 1991. Pages 1–18. doi:10.1287/mnsc.37.1.1
[Banker 1993] Banker, Rajiv D. et al. Software Complexity and Maintenance Costs. Communications of the ACM. Volume 36. Number 11. 1993. Pages 81–94. doi:10.1145/163359.163375
[Barnes 2009] Barnes, John. The Spark Approach to High Integrity Software Regensburg. John Barnes Infomatics. 2009.
[Brooks 1995] Brooks, Frederick P., Jr. The Mythical Man-Month. Anniversary ed. Addison-Wesley Longman. 1995. http://dl.acm.org/citation.cfm?id=207583
[Davis 2004] Davis, Noopur et al. Processes to Produce Secure Software, Summary of US National Cybersecurity Summit Subgroup Report. IEEE Security & Privacy Magazine. Volume 2. Number 3. 2004. Pages 18–25. doi:10.1109/MSP.2004.21
[DO-178 IG 2015] DO-178 Industry Group. DO-178B Q & A. 2015. http://www.do178site.com/do178b_ques-tions.php

CMU/SEI-2015-TR-013 | SOFTWARE ENGINEERING INSTITUTE | CARNEGIE MELLON UNIVERSITY 31
Distribution Statement A: Approved for Public Release; Distribution is Unlimited
[Ebert 2009] Ebert, Christof et al. Embedded Software: Facts, Figures, and Future. Computer. Volume 42. Number 4. 2009. Pages 42–52. doi:10.1109/MC.2009.118
[Hagan 2012] Hagan, C. et al. Software: The Brains Behind U.S. Defense Systems. ATKearney, Inc. 2012. https://www.atkearney.com/documents/10192/247932/Software-The_Brains_Be-hind_US_Defense_Systems.pdf
[Halstead 1972] Halstead, M. H. Natural Laws Controlling Algorithm Structure. SIGPLAN Notices. Volume 7. 1972. Pages 19–26.
[Halstead 1977] Halstead, Maurice H. Elements of Software Science. Elsevier North-Holland. 1977.
[Hatton 1997] Hatton, L. Reexamining the Fault Density Component Size Connection. IEEE Software. Volume 14. Number 2. 1997. Pages 89–97. doi:10.1109/52.582978
[Hilderman 2007] Hilderman, Vance & Baghi, Tony. Avionics Certification: A Complete Guide to DO-178 (Soft-ware), DO-254 (Hardware). Avionics Communications. 2007.
[Hilderman 2009] Hilderman, Vance. DO-178B Costs Versus Benefits. HighRely. 2009. http://www.cems.uwe.ac.uk/~ngunton/hrwp_do_178b_cost_benefit.pdf
[Hopkins 2008] Hopkins, Tim & Hatton, Les. Exploring Defect Correlations in a Major Fortran Numerical Library. University of Kent. 2008. http://www.leshatton.org/Documents/NAG01_01-08.pdf
[Humphrey 2000] Humphrey, Watts S. The Team Software Process. CMU/SEI-2000-TR-023. Software Engineering Institute, Carnegie Mellon University. 2000. http://resources.sei.cmu.edu/library/asset-view.cfm?assetid=5287
[ISO 2011] International Organization for Standardization. Road Vehicles – Functional Safety. ISO 26262-1. ISO. 2011.
[Jay 2009] Jay, Graylin et al. Cyclomatic Complexity and Lines of Code: Empirical Evidence of a Stable Linear Relationship. Journal of Software Engineering and Applications. Volume 2. Number 3. 2009. Pages 137–143. doi:10.4236/jsea.2009.23020

CMU/SEI-2015-TR-013 | SOFTWARE ENGINEERING INSTITUTE | CARNEGIE MELLON UNIVERSITY 32
Distribution Statement A: Approved for Public Release; Distribution is Unlimited
[Jones 2006] Jones, Capers. The Economics of Software Maintenance in the Twenty First Century. Version 3. 2006. http://www.compaid.com/caiinternet/ezine/capersjones-maintenance.pdf
[Jones 2009] Jones, Capers. Software Engineering Best Practices: Lessons from Successful Projects in the Top Companies. McGraw-Hill Osborne Media. 2009.
[Jones 2011] Jones, Capers & Bonsignour, Oliver. The Economics of Software Quality. Addison-Wesley Professional. 2011.
[Jones 2012a] Jones, Capers. Software Defect Origins and Removal Methods. Namcook Analytics. 2012. http://www.ifpug.org/Documents/Jones-SoftwareDefectOriginsAndRemovalMethodsDraft5.pdf
[Jones 2012b] Jones, Capers. Software Quality Metrics: Three Harmful Metrics and Two Helpful Metrics. Namcook Analytics. 2012. http://www.ppi-int.com/systems-engineering/free%20resources/Software%20Quality%20Metrics%20Capers%20Jones%20120607.pdf
[Li 1998] Li, Michael Naixin et al. Estimating the Number of Defects: A Simple and Intuitive Approach. Proceedings of the 7th International Symposium on Software Reliability Engineering (ISSRE). 1998. Pages 307–315. http://www.cs.colostate.edu/pubserv/pubs/Li-malaiya-p-li98.pdf
[LKO 2015] Linux Kernel Organization. Linux Kernel Coding Style. 2015. https://www.kernel.org/doc/Docu-mentation/CodingStyle
[MAAB 2007] MathWorks Automotive Advisory Board. Control Algorithm Guidelines Using MATLAB, Sim-ulink, and Stateflow. MAAB. 2007.
[MathWorks 2014] MathWorks. SLdiagnostics Tool. MathWorks. 2014. http://www.mathworks.com/help/sim-ulink/slref/sldiagnostics.html
[MathWorks 2015] MathWorks. Simulink. MathWorks. 2015.
[Maxwell 2008] Maxwell, David. Coverity Report. Technology Innovation Management Review. 2008. http://tim-review.ca/article/156

CMU/SEI-2015-TR-013 | SOFTWARE ENGINEERING INSTITUTE | CARNEGIE MELLON UNIVERSITY 33
Distribution Statement A: Approved for Public Release; Distribution is Unlimited
[McCabe 1976] McCabe, T. J. A Complexity Measure. IEEE Transactions on Software Engineering. Volume SE-2. 1976. Pages 308–320.
[McGarry 2012] McGarry, J. et al. Office of the Deputy Assistant Secretary of the Army for Cost and Economics (ODASA-CE). Software Maintenance, Sustaining Engineering, and Operational Support: Key Factors That Impact Program and System Performance. Systems and Software Technology Con-ference. Salt Lake City, UT. April 2012. http://www.ieee-stc.org/proceed-ings/2012/pdfs/3001JohnMcGarry.pdf
[Musson 2002] Musson, Robert. How the TSP Impacts the Top Line. CrossTalk. Volume 15. Number 9. 2002. Pages 9–11.
[Nam 2015] Nam, Min-Young. ERACES: Complexity Metrics Tool User Guide. 2015. https://github.com/cmu-sei/eraces/tree/master/scade-metrics/doc
[Nichols 2012] Nichols, William R. Plan for Success, Model the Cost of Quality. Software Quality Professional. Volume 14. Number 2. 2012. Pages 4–11.
[Nolte 2009] Nolte, Thomas. Hierarchical Scheduling of Complex Embedded Real-Time Systems. Ecole d’Ete Temps-Réel 2009 (ERT09). Paris, France. September 2009. https://www.aca-demia.edu/2738487/Hierarchical_scheduling_of_complex_embedded_real-time_systems
[Obradovic 2013] Obradovic, Alex. Using TSP to Develop and Maintain Mission Critical IT Systems. TSP Symposium. 2013. http://resources.sei.cmu.edu/library/asset-view.cfm?assetID=297766
[Olszewska 2011] Olszewska, Marga. Simulink-Specific Design Quality Metrics. TUCS Technical Report 1002. Turku Centre for Computer Science. 2011.
[Prabhu 2010] Prabhu, Jeevan. Complexity Analysis of Simulink Models to Improve the Quality of Outsourcing in an Automotive Company. Manipal University. 2010.
[Redman 2010] Redman, David et al. Virtual Integration for Improved System Design. In Analytic Virtual Integration of Cyber-Physical Systems Workshop (AVICPS). Vol. 52498. 2010. Pages 57–64. http://www.andrew.cmu.edu/user/dionisio/avicps2010-proceedings/proceedings.pdf
[RTCA 2011a] RTCA, Inc. DO-178C Software Considerations in Airborne Systems and Equipment Certification. RTCA. 2011. http://www.rtca.org/store_product.asp?prodid=803

CMU/SEI-2015-TR-013 | SOFTWARE ENGINEERING INSTITUTE | CARNEGIE MELLON UNIVERSITY 34
Distribution Statement A: Approved for Public Release; Distribution is Unlimited
[RTCA 2011b] RTCA, Inc. DO-333: Formal Methods Supplement to DO-178C and DO-278A. RTCA. 2011. http://www.rtca.org/store_product.asp?prodid=859
[RTI 2002] RTI. The Economic Impacts of Inadequate Infrastructure for Software Testing. NIST Planning re-port 02-3. National Institute of Standards and Technology. May 2002.
[Shull 2002] Shull, Forrest et al. What We Have Learned About Fighting Defects. Proceedings of the 8th IEEE Symposium. 2002. Pages 249–258.
[STSC 2003] Software Technology Support Center. Guidelines for Successful Acquisition and Management of Software-Intensive Systems: Weapon Systems, Command and Control Systems, Management In-formation Systems. Condensed Version 4.0. U.S. Air Force. 2003. http://www.stsc.hill.af.mil/resources/tech_docs/gsam4.html
[Withrow 1990] Withrow, Carol. Error Density and Size in Ada Software. IEEE Software. Volume 7. Number 1. 1990. Pages 26–30. doi:10.1109/52.43046
[Zage 1993] Zage, W. M. & Zage, D. M. Evaluating Design Metrics on Large-Scale Software. IEEE Software. Volume 10. Number 4. July 1993. Pages 75–81. doi: 10.1109/52.219620

CMU/SEI-2015-TR-013 | SOFTWARE ENGINEERING INSTITUTE | CARNEGIE MELLON UNIVERSITY
Distribution Statement A: Approved for Public Release; Distribution is Unlimited
REPORT DOCUMENTATION PAGE Form Approved OMB No. 0704-0188
Public reporting burden for this collection of information is estimated to average 1 hour per response, including the time for reviewing instructions, search-ing existing data sources, gathering and maintaining the data needed, and completing and reviewing the collection of information. Send comments regard-ing this burden estimate or any other aspect of this collection of information, including suggestions for reducing this burden, to Washington Headquarters Services, Directorate for information Operations and Reports, 1215 Jefferson Davis Highway, Suite 1204, Arlington, VA 22202-4302, and to the Office of Management and Budget, Paperwork Reduction Project (0704-0188), Washington, DC 20503.
1. AGENCY USE ONLY
(Leave Blank)
2. REPORT DATE
December 2015
3. REPORT TYPE AND DATES COVERED
Final
4. TITLE AND SUBTITLE
Evaluating and Mitigating the Impact of Complexity in Software Models
5. FUNDING NUMBERS
FA8721-05-C-0003
6. AUTHOR(S)
Julien Delange, John Hudak, William Nichols, James McHale, and Min-Young Nam
7. PERFORMING ORGANIZATION NAME(S) AND ADDRESS(ES)
Software Engineering Institute Carnegie Mellon University Pittsburgh, PA 15213
8. PERFORMING ORGANIZATION REPORT NUMBER
CMU/SEI-2015-TR-013
9. SPONSORING/MONITORING AGENCY NAME(S) AND ADDRESS(ES)
AFLCMC/PZE/Hanscom Enterprise Acquisition Division 20 Schilling Circle Building 1305 Hanscom AFB, MA 01731-2116
10. SPONSORING/MONITORING AGENCY REPORT NUMBER
n/a
11. SUPPLEMENTARY NOTES
12A DISTRIBUTION/AVAILABILITY STATEMENT
Unclassified/Unlimited, DTIC, NTIS
12B DISTRIBUTION CODE
13. ABSTRACT (MAXIMUM 200 WORDS)
Safety-critical systems, such as those used in the avionics, aerospace, medical, and automotive domains, are becoming more software reliant, and their size has increased enormously. These systems are becoming more complex, increasing certification costs. As certifica-tion is expensive and verification activities require significant manpower, this increasing complexity impacts the total cost of ownership. While part of the complexity is intrinsic to system functions and requirements, another part can be avoided. As software development is moving toward model-based approaches, reducing software model size and avoidable complexity would lower certification costs and reduce software maintenance efforts. This report defines software complexity, metrics for complexity in models, and the effects of model complexity on levels of effort in the development, integration, maintenance, and upgrade costs of a project lifecycle. It focuses on popu-lar code metrics for models; their definition, measurement, and implications for development efforts; and techniques that have been used to reduce complexity, such as implementing a complexity measurement tool on a modeling tool. This report also presents an analysis tool that can be used to identify and measure complexity in a model-based development approach and explains how to apply the newly defined metrics.
14. SUBJECT TERMS
certification, complexity metrics, model-based engineering, safety-critical systems, software complexity
15. NUMBER OF PAGES
41
16. PRICE CODE
17. SECURITY CLASSIFICATION OF REPORT
Unclassified
18. SECURITY CLASSIFICATION OF THIS PAGE
Unclassified
19. SECURITY CLASSIFICATION OF ABSTRACT
Unclassified
20. LIMITATION OF ABSTRACT
UL NSN 7540-01-280-5500 Standard Form 298 (Rev. 2-89) Prescribed by ANSI Std. Z39-18
298-102