evaluated kinetic and photochemical data for atmospheric chemistry
TRANSCRIPT
Atmos. Chem. Phys., 4, 1461–1738, 2004www.atmos-chem-phys.org/acp/4/1461/SRef-ID: 1680-7324/acp/2004-4-1461
AtmosphericChemistry
and Physics
Evaluated kinetic and photochemical data for atmosphericchemistry: Volume I – gas phase reactions of Ox, HOx, NOx
and SOx species
R. Atkinson1, D. L. Baulch2, R. A. Cox3, J. N. Crowley4, R. F. Hampson5, R. G. Hynes6, M. E. Jenkin7, M. J. Rossi8,and J. Troe9*
1Air Pollution Research Center, University of California, Riverside, California 92521, USA2School of Chemistry, University of Leeds, Leeds LS2 9JT, UK3Centre for Atmospheric Science, Dept. of Chemistry, University of Cambridge, Lensfield Road Cambridge CB2 1EP, UK4Max-Planck-Institut fur Chemie, Division of Atmospheric Chemistry, Postfach 3060, 55020 Mainz, Germany5U.S. Dept. of Commerce, National Inst. of Standards and Technology, Bldg. 221, Rm A111, Gaithersburg, MD 20899, USA6CSIRO Energy Technology, Lucas Heights Science and Technology Centre, PMB 7, Bangor, NSW 2234, Australia7Dept. of Environmental Science and Technology, Imperial College London, Silwood Park, Ascot, Berkshire SL5 7PY UK8Env. Naturel, Architectural et Construit, Pollution Atmos. et Sol (LPAS/ENAC), EPFL CH 1015 Lausanne, Switzerland9Institute of Physical Chemistry, University of Gottingen, Tammannstr. 6, D-37077 Gottingen, Germany* The IUPAC Subcommittee on Gas Kinetic Data Evaluation for Atmospheric Chemistry
Received: 7 August 2003 – Published in Atmos. Chem. Phys. Discuss.: 15 December 2003Revised: 1 March 2004 – Accepted: 9 March 2004 – Published: 1 September 2004
Abstract. This article, the first in the series, presents kineticand photochemical data evaluated by the IUPAC Subcommit-tee on Gas Kinetic Data Evaluation for Atmospheric Chem-istry. It covers the gas phase and photochemical reactions ofOx, HOx, NOx and SOx species, which were last publishedin 1997, and were updated on the IUPAC website in late2001. The article consists of a summary sheet, containing therecommended kinetic parameters for the evaluated reactions,and five appendices containing the data sheets, which provideinformation upon which the recommendations are made.
1 Introduction
In the mid 1970s it was appreciated that there was a needfor the establishment of an international panel to produce aset of critically evaluated rate parameters for reactions of in-terest for atmospheric chemistry. To this end the CODATATask Group on Chemical Kinetics, under the auspices of theInternational Council of Scientific Unions (ICSU), was con-stituted in 1977, and its aim was to produce an evaluation ofrelevant, available kinetic and photochemical data. The firstevaluation by this international committee was published inJ. Phys. Chem. Ref. Data in 1980 (Baulch et al., 1980),followed by Supplements in 1982 (Baulch et al., 1982) and
Correspondence to:R.A. Cox([email protected])
1984 (Baulch et al., 1984). In 1986 the IUPAC Subcom-mittee on Data Evaluation superseded the original CODATATask Group for Atmospheric Chemistry, and the Subcom-mittee has continued its data evaluation program with Sup-plements published in 1989 (Atkinson et al., 1989), 1992(Atkinson et al., 1992), 1997 (Atkinson et al., 1997a), 1997(Atkinson et al., 1997b), 1999 (Atkinson et al., 1999), and2000 (Atkinson et al., 2000). Following the last of these re-ports, Supplement VIII (Atkinson et al., 2000), the evaluationhas continued to be updated and published on the worldwideweb (http://www.iupac-kinetic.ch.cam.ac.uk/). The IUPACwebsite hosts an interactive database with a search facilityand implemented hyperlinks between the summary table andthe data sheets, both of which can be downloaded as individ-ual PDF files. In order to further enhance the accessibility ofthis updated material to the scientific community, the evalu-ation is being published as a series of articles inAtmosphericChemistry and Physics. This article is the first of the series,Volume I.
© European Geosciences Union 2004
1462 R. Atkinson et al.: Evaluated kinetic and photochemical data for Ox, HOx, NOx and SOx
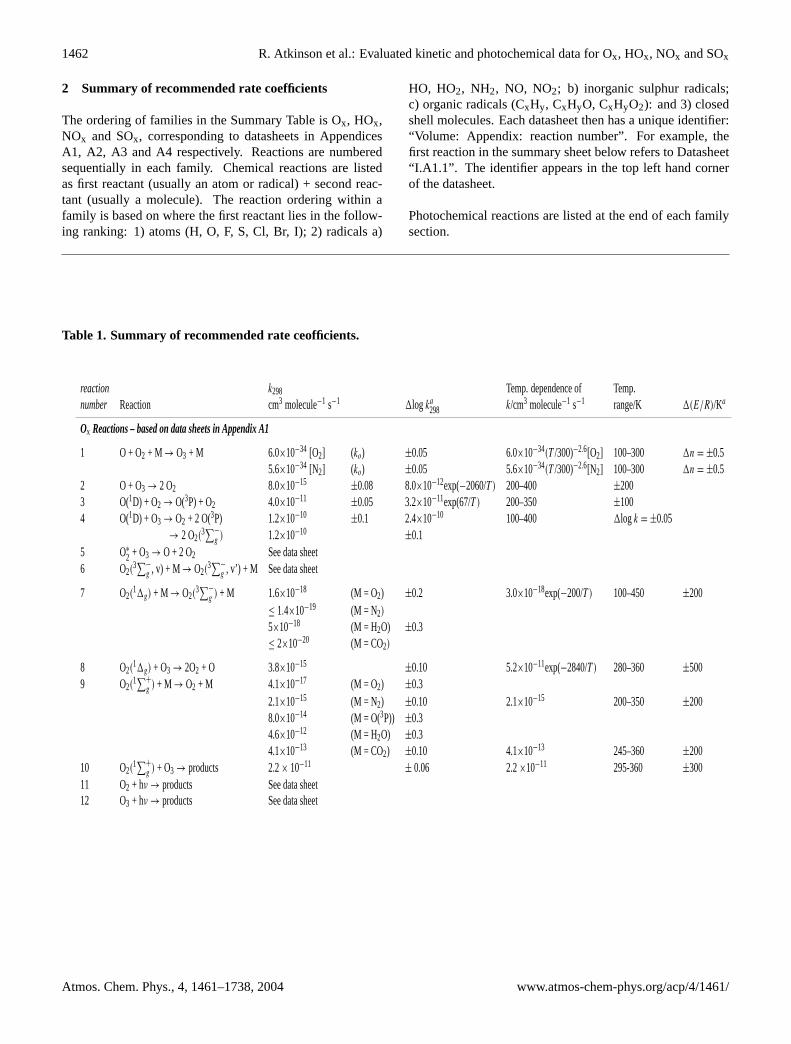
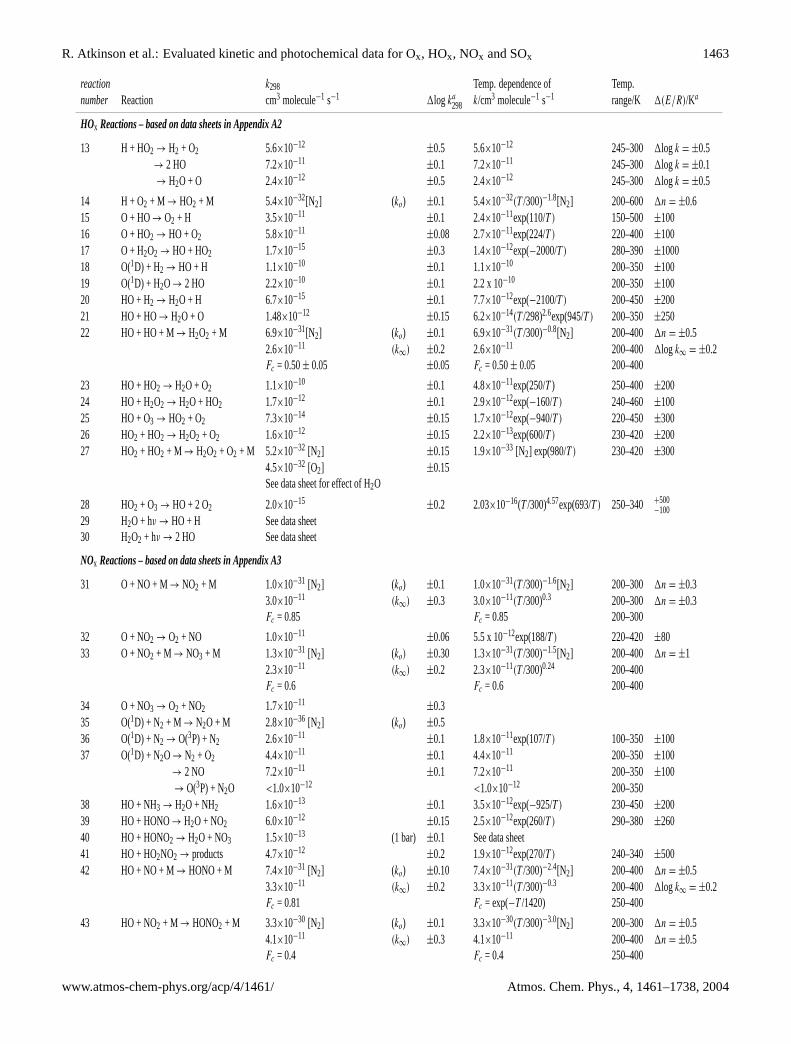
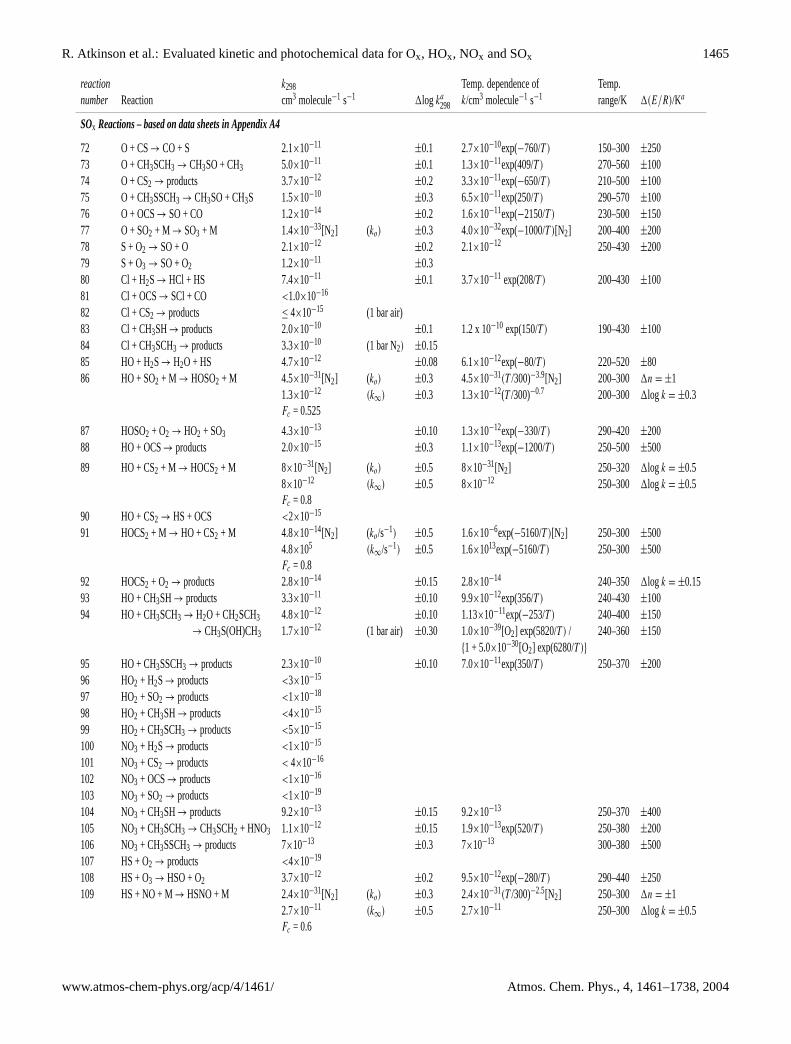
2 Summary of recommended rate coefficients
The ordering of families in the Summary Table is Ox, HOx,NOx and SOx, corresponding to datasheets in AppendicesA1, A2, A3 and A4 respectively. Reactions are numberedsequentially in each family. Chemical reactions are listedas first reactant (usually an atom or radical) + second reac-tant (usually a molecule). The reaction ordering within afamily is based on where the first reactant lies in the follow-ing ranking: 1) atoms (H, O, F, S, Cl, Br, I); 2) radicals a)
HO, HO2, NH2, NO, NO2; b) inorganic sulphur radicals;c) organic radicals (CxHy, CxHyO, CxHyO2): and 3) closedshell molecules. Each datasheet then has a unique identifier:“Volume: Appendix: reaction number”. For example, thefirst reaction in the summary sheet below refers to Datasheet“I.A1.1”. The identifier appears in the top left hand cornerof the datasheet.
Photochemical reactions are listed at the end of each familysection.
Table 1. Summary of recommended rate ceofficients.
reaction k298 Temp. dependence of Temp.number Reaction cm3 molecule−1 s−1 1log ka
298 k/cm3 molecule−1 s−1 range/K 1(E/R)/Ka
Ox Reactions – based on data sheets in Appendix A1
1 O + O2 + M → O3 + M 6.0×10⁻³⁴ [O2] (ko) ±0.05 6.0×10⁻³⁴(T /300)−2.6[O2] 100–300 1n = ±0.55.6×10−34 [N2] (ko) ±0.05 5.6×10⁻³⁴(T /300)−2.6[N2] 100–300 1n = ±0.5
2 O + O3 → 2 O2 8.0×10⁻¹⁵±0.08 8.0×10⁻¹²exp(−2060/T ) 200–400 ±200
3 O(1D) + O2 → O(3P) + O2 4.0×10⁻¹¹±0.05 3.2×10⁻¹¹exp(67/T ) 200–350 ±100
4 O(1D) + O3 → O2 + 2 O(3P) 1.2×10⁻¹⁰±0.1 2.4×10⁻¹⁰ 100–400 1log k = ±0.05
→ 2 O2(3∑−
g ) 1.2×10⁻¹⁰±0.1
5 O∗
2 + O3 → O + 2 O2 See data sheet6 O2(
3∑−
g , v) + M → O2(3∑−
g , v’) + M See data sheet
7 O2(11g) + M → O2(
3∑−
g ) + M 1.6×10⁻¹⁸ (M = O2) ±0.2 3.0×10⁻¹⁸exp(−200/T ) 100–450 ±200≤ 1.4×10⁻¹⁹ (M = N2)
5×10⁻¹⁸ (M = H2O) ±0.3≤ 2×10⁻²⁰ (M = CO2)
8 O2(11g) + O3 → 2O2 + O 3.8×10⁻¹⁵
±0.10 5.2×10⁻¹¹exp(−2840/T ) 280–360 ±5009 O2(
1∑+
g ) + M → O2 + M 4.1×10⁻¹⁷ (M = O2) ±0.32.1×10−15 (M = N2) ±0.10 2.1×10⁻¹⁵ 200–350 ±2008.0×10−14 (M = O(3P)) ±0.34.6×10−12 (M = H2O) ±0.34.1×10−13 (M = CO2) ±0.10 4.1×10⁻¹³ 245–360 ±200
10 O2(1∑+
g ) + O3 → products 2.2× 10⁻¹¹± 0.06 2.2×10⁻¹¹ 295-360 ±300
11 O2 + hν → products See data sheet12 O3 + hν → products See data sheet
Atmos. Chem. Phys., 4, 1461–1738, 2004 www.atmos-chem-phys.org/acp/4/1461/
R. Atkinson et al.: Evaluated kinetic and photochemical data for Ox, HOx, NOx and SOx 1463
reaction k298 Temp. dependence of Temp.number Reaction cm3 molecule−1 s−1 1log ka
298 k/cm3 molecule−1 s−1 range/K 1(E/R)/Ka
HOx Reactions – based on data sheets in Appendix A2
13 H + HO2 → H2 + O2 5.6×10⁻¹²±0.5 5.6×10⁻¹² 245–300 1log k = ±0.5
→ 2 HO 7.2×10⁻¹¹±0.1 7.2×10⁻¹¹ 245–300 1log k = ±0.1
→ H2O + O 2.4×10⁻¹²±0.5 2.4×10⁻¹² 245–300 1log k = ±0.5
14 H + O2 + M → HO2 + M 5.4×10⁻³²[N2] (ko) ±0.1 5.4×10⁻³²(T /300)−1.8[N2] 200–600 1n = ±0.615 O + HO→ O2 + H 3.5×10⁻¹¹
±0.1 2.4×10⁻¹¹exp(110/T ) 150–500 ±10016 O + HO2 → HO + O2 5.8×10⁻¹¹
±0.08 2.7×10⁻¹¹exp(224/T ) 220–400 ±10017 O + H2O2 → HO + HO2 1.7×10⁻¹⁵
±0.3 1.4×10⁻¹²exp(−2000/T ) 280–390 ±100018 O(1D) + H2 → HO + H 1.1×10⁻¹⁰
±0.1 1.1×10⁻¹⁰ 200–350 ±10019 O(1D) + H2O → 2 HO 2.2×10⁻¹⁰
±0.1 2.2 x 10⁻¹⁰ 200–350 ±10020 HO + H2 → H2O + H 6.7×10⁻¹⁵
±0.1 7.7×10⁻¹²exp(−2100/T ) 200–450 ±20021 HO + HO→ H2O + O 1.48×10⁻¹²
±0.15 6.2×10⁻¹⁴(T /298)2.6exp(945/T ) 200–350 ±25022 HO + HO + M→ H2O2 + M 6.9×10⁻³¹[N2] (ko) ±0.1 6.9×10⁻³¹(T /300)−0.8[N2] 200–400 1n = ±0.5
2.6×10⁻¹¹ (k∞) ±0.2 2.6×10⁻¹¹ 200–400 1log k∞ = ±0.2Fc = 0.50± 0.05 ±0.05 Fc = 0.50± 0.05 200–400
23 HO + HO2 → H2O + O2 1.1×10⁻¹⁰±0.1 4.8×10⁻¹¹exp(250/T ) 250–400 ±200
24 HO + H2O2 → H2O + HO2 1.7×10⁻¹²±0.1 2.9×10⁻¹²exp(−160/T ) 240–460 ±100
25 HO + O3 → HO2 + O2 7.3×10⁻¹⁴±0.15 1.7×10⁻¹²exp(−940/T ) 220–450 ±300
26 HO2 + HO2 → H2O2 + O2 1.6×10⁻¹²±0.15 2.2×10⁻¹³exp(600/T ) 230–420 ±200
27 HO2 + HO2 + M → H2O2 + O2 + M 5.2×10⁻³² [N2] ±0.15 1.9×10⁻³³ [N2] exp(980/T ) 230–420 ±3004.5×10−32 [O2] ±0.15See data sheet for effect of H2O
28 HO2 + O3 → HO + 2 O2 2.0×10⁻¹⁵±0.2 2.03×10⁻¹⁶(T /300)4.57exp(693/T ) 250–340 +500
−10029 H2O + hν → HO + H See data sheet30 H2O2 + hν → 2 HO See data sheet
NOx Reactions – based on data sheets in Appendix A3
31 O + NO + M→ NO2 + M 1.0×10⁻³¹ [N2] (ko) ±0.1 1.0×10⁻³¹(T /300)−1.6[N2] 200–300 1n = ±0.33.0×10−11 (k∞) ±0.3 3.0×10⁻¹¹(T /300)0.3 200–300 1n = ±0.3Fc = 0.85 Fc = 0.85 200–300
32 O + NO2 → O2 + NO 1.0×10⁻¹¹±0.06 5.5 x 10⁻¹²exp(188/T ) 220–420 ±80
33 O + NO2 + M → NO3 + M 1.3×10⁻³¹ [N2] (ko) ±0.30 1.3×10⁻³¹(T /300)−1.5[N2] 200–400 1n = ±12.3×10⁻¹¹ (k∞) ±0.2 2.3×10⁻¹¹(T /300)0.24 200–400Fc = 0.6 Fc = 0.6 200–400
34 O + NO3 → O2 + NO2 1.7×10⁻¹¹±0.3
35 O(1D) + N2 + M → N2O + M 2.8×10−36 [N2] (ko) ±0.536 O(1D) + N2 → O(3P) + N2 2.6×10⁻¹¹
±0.1 1.8×10⁻¹¹exp(107/T ) 100–350 ±10037 O(1D) + N2O → N2 + O2 4.4×10⁻¹¹
±0.1 4.4×10⁻¹¹ 200–350 ±100→ 2 NO 7.2×10⁻¹¹
±0.1 7.2×10⁻¹¹ 200–350 ±100→ O(3P) + N2O <1.0×10⁻¹² <1.0×10⁻¹² 200–350
38 HO + NH3 → H2O + NH2 1.6×10⁻¹³±0.1 3.5×10⁻¹²exp(−925/T ) 230–450 ±200
39 HO + HONO→ H2O + NO2 6.0×10⁻¹²±0.15 2.5×10⁻¹²exp(260/T ) 290–380 ±260
40 HO + HONO2 → H2O + NO3 1.5×10⁻¹³ (1 bar) ±0.1 See data sheet41 HO + HO2NO2 → products 4.7×10⁻¹²
±0.2 1.9×10⁻¹²exp(270/T ) 240–340 ±50042 HO + NO + M→ HONO + M 7.4×10⁻³¹ [N2] (ko) ±0.10 7.4×10⁻³¹(T /300)−2.4[N2] 200–400 1n = ±0.5
3.3×10⁻¹¹ (k∞) ±0.2 3.3×10⁻¹¹(T /300)−0.3 200–400 1log k∞ = ±0.2Fc = 0.81 Fc = exp(−T /1420) 250–400
43 HO + NO2 + M → HONO2 + M 3.3×10⁻³⁰ [N2] (ko) ±0.1 3.3×10⁻³⁰(T /300)−3.0[N2] 200–300 1n = ±0.54.1×10−11 (k∞) ±0.3 4.1×10⁻¹¹ 200–400 1n = ±0.5Fc = 0.4 Fc = 0.4 250–400
www.atmos-chem-phys.org/acp/4/1461/ Atmos. Chem. Phys., 4, 1461–1738, 2004

1464 R. Atkinson et al.: Evaluated kinetic and photochemical data for Ox, HOx, NOx and SOx
reaction k298 Temp. dependence of Temp.number Reaction cm3 molecule−1 s−1 1log ka
298 k/cm3 molecule−1 s−1 range/K 1(E/R)/Ka
44 HO + NO3 → HO2 + NO2 2.0×10⁻¹¹±0.3
45 HO2 + NO → HO + NO2 8.8×10⁻¹²±0.1 3.6×10⁻¹²exp(270/T ) 200–400 ±100
46 HO2 + NO2 + M → HO2NO2 + M 1.8×10⁻³¹ [N2] (ko) ±0.10 1.8×10⁻³¹(T /300)−3.2[N2] 220–360 1n = ±14.7×10⁻¹² (k∞) ±0.2 4.7×10⁻¹² 220–360 1n = ±1Fc = 0.6 Fc = 0.6
47 HO2NO2 + M → HO2 + NO2 + M 1.3×10⁻²⁰ [N2] (ko/s−1) ±0.3 4.1×10⁻⁵exp(−10650/T )[N2] 260–300 ±5000.25 (k∞/s−1) ±0.5 4.8×10¹⁵exp(−11170/T ) 260–300 ±500Fc = 0.6 Fc = 0.6 260–300
48 HO2 + NO3 → products 4.0×10⁻¹²±0.2
49 NH2 + O2 → products <6×10⁻²¹
50 NH2 + O3 → products 1.7×10⁻¹³±0.5 4.9 x 10⁻¹²exp(−1000/T ) 250–380 ±500
51 NH2 + NO → products 1.6×10⁻¹¹±0.2 1.6×10⁻¹¹(T /298)−1.4 210–500 1n = ±0.5
52 NH2 + NO2 → products 2.0×10⁻¹¹±0.2 2.0×10⁻¹¹(T /298)−1.3 250–500 1n = ±0.7
53 2NO + O2 → 2 NO2 2.0×10−38 (cm6 molecule−2 s−1) ±0.1 3.3×10−39exp(530/T ) 270–600 ±40054 NO + O3 → NO2 + O2 1.8×10⁻¹⁴
±0.08 1.4×10⁻¹²exp(−1310/T ) 195–308 ±20055 NO + NO2 + M → N2O3 + M 3.1×10⁻³⁴ [N2] (ko) ±0.3 3.1×10⁻³⁴ (T /300)−7.7 [N2] 200–300 1n = ±1
7.9×10⁻¹² (k∞) ±0.3 7.9×10⁻¹² (T /300)1.4 200–300 1n = ±0.5Fc = 0.6
56 N2O3 + M → NO + NO2 + M 1.6×10⁻¹⁴[N2] (k0/s−1) ±0.4 1.9×10⁻⁷(T /300)−8.7exp(-4880/T )[N2] 225–300 ±2001n = ±1
3.6×10⁸ (k∞/s−1) ±0.3 4.7×10¹⁵(T /300)0.4 exp(−4880/T ) 225–300 ±100Fc = 0.6 1n = ±1
57 NO + NO3 → 2 NO2 2.6×10⁻¹¹±0.1 1.8 x 10⁻¹¹exp(110/T ) 220–420 ±100
58 NO2 + O3 → NO3 + O2 3.5×10⁻¹⁷±0.06 1.4×10⁻¹³exp(−2470/T ) 230–360 ±150
59 NO2 + NO2 + M → N2O4 + M 1.4×10⁻³³[N2] (k0) ±0.3 1.4×10⁻³³(T /300)−3.8[N2] 300–500 1n = ±11.0×10⁻¹² (k∞) ±0.3 1.0×10⁻¹² 250–300 1log k = ±0.3Fc = 0.40
60 N2O4 + M → NO2 + NO2 + M 6.1×10⁻¹⁵[N2] (k0/s−1) ±0.3 1.3×10⁻⁵(T /300)−3.8 exp (−6400/T )[N2] 300–500 ±5004.4×106 (k∞/s−1) ±0.4 1.15×10¹⁶exp(−6460/T ) 250–300 ±500Fc = 0.40
61 NO2 + NO3 + M → N2O5 + M 3.6×10⁻³⁰[N2] (ko) ±0.10 3.6×10⁻³⁰(T /300)−4.1[N2] 200–300 1n = ±0.51.9×10−12 (k∞) ±0.2 1.9×10⁻¹²(T /300)0.2 200–400 1n = ±0.6Fc = 0.35 Fc = 0.35 200–400
62 N2O5 + M → NO2 + NO3 + M 1.2×10⁻¹⁹[N2] (ko/s−1) ±0.2 1.3×10⁻³(T /300)−3.5 200–400 1n = ±0.5exp(−11000/T )[N2]
6.9×10⁻² (k∞/s−1) ±0.3 9.7×10¹⁴(T /300)0.1 200–300 1n = ±0.2exp(−11080/T )
Fc = 0.35 Fc = 0.35 200–30063 N2O5 + H2O → 2 HNO3 2.5×10⁻²²
64 N2O5 + 2H2O → HNO3 + H2O 1.8×10−39 (cm6 molecule−2 s−1)
65 HONO + hν → products see data sheet66 HONO2 + hν → products see data sheet67 HO2NO2 + hν → products see data sheet68 NO2 + hν → products see data sheet69 NO3 + hν → products see data sheet70 N2O + hν → products see data sheet71 N2O5 + hν → products see data sheet
Atmos. Chem. Phys., 4, 1461–1738, 2004 www.atmos-chem-phys.org/acp/4/1461/
R. Atkinson et al.: Evaluated kinetic and photochemical data for Ox, HOx, NOx and SOx 1465
reaction k298 Temp. dependence of Temp.number Reaction cm3 molecule−1 s−1 1log ka
298 k/cm3 molecule−1 s−1 range/K 1(E/R)/Ka
SOx Reactions – based on data sheets in Appendix A4
72 O + CS→ CO + S 2.1×10⁻¹¹±0.1 2.7×10⁻¹⁰exp(−760/T ) 150–300 ±250
73 O + CH3SCH3 → CH3SO + CH3 5.0×10⁻¹¹±0.1 1.3×10⁻¹¹exp(409/T ) 270–560 ±100
74 O + CS2 → products 3.7×10⁻¹²±0.2 3.3×10⁻¹¹exp(−650/T ) 210–500 ±100
75 O + CH3SSCH3 → CH3SO + CH3S 1.5×10⁻¹⁰±0.3 6.5×10⁻¹¹exp(250/T ) 290–570 ±100
76 O + OCS→ SO + CO 1.2×10⁻¹⁴±0.2 1.6×10⁻¹¹exp(−2150/T ) 230–500 ±150
77 O + SO2 + M → SO3 + M 1.4×10⁻³³[N2] (ko) ±0.3 4.0×10⁻³²exp(−1000/T )[N2] 200–400 ±20078 S + O2 → SO + O 2.1×10⁻¹²
±0.2 2.1×10⁻¹² 250–430 ±20079 S + O3 → SO + O2 1.2×10⁻¹¹
±0.380 Cl + H2S→ HCl + HS 7.4×10⁻¹¹
±0.1 3.7×10⁻¹¹ exp(208/T ) 200–430 ±10081 Cl + OCS→ SCl + CO <1.0×10⁻¹⁶
82 Cl + CS2 → products ≤ 4×10⁻¹⁵ (1 bar air)83 Cl + CH3SH→ products 2.0×10⁻¹⁰
±0.1 1.2 x 10⁻¹⁰ exp(150/T ) 190–430 ±10084 Cl + CH3SCH3 → products 3.3×10⁻¹⁰ (1 bar N2) ±0.1585 HO + H2S→ H2O + HS 4.7×10⁻¹²
±0.08 6.1×10⁻¹²exp(−80/T ) 220–520 ±8086 HO + SO2 + M → HOSO2 + M 4.5×10⁻³¹[N2] (ko) ±0.3 4.5×10⁻³¹(T /300)−3.9[N2] 200–300 1n = ±1
1.3×10⁻¹² (k∞) ±0.3 1.3×10⁻¹²(T /300)−0.7 200–300 1log k = ±0.3Fc = 0.525
87 HOSO2 + O2 → HO2 + SO3 4.3×10⁻¹³±0.10 1.3×10⁻¹²exp(−330/T ) 290–420 ±200
88 HO + OCS→ products 2.0×10⁻¹⁵±0.3 1.1×10⁻¹³exp(−1200/T ) 250–500 ±500
89 HO + CS2 + M → HOCS2 + M 8×10⁻³¹[N2] (ko) ±0.5 8×10⁻³¹[N2] 250–320 1log k = ±0.58×10⁻¹² (k∞) ±0.5 8×10⁻¹² 250–300 1log k = ±0.5Fc = 0.8
90 HO + CS2 → HS + OCS <2×10⁻¹⁵
91 HOCS2 + M → HO + CS2 + M 4.8×10⁻¹⁴[N2] (ko/s−1) ±0.5 1.6×10⁻⁶exp(−5160/T )[N2] 250–300 ±5004.8×105 (k∞/s−1) ±0.5 1.6×10¹³exp(−5160/T ) 250–300 ±500Fc = 0.8
92 HOCS2 + O2 → products 2.8×10⁻¹⁴±0.15 2.8×10⁻¹⁴ 240–350 1log k = ±0.15
93 HO + CH3SH→ products 3.3×10⁻¹¹±0.10 9.9×10⁻¹²exp(356/T ) 240–430 ±100
94 HO + CH3SCH3 → H2O + CH2SCH3 4.8×10⁻¹²±0.10 1.13×10⁻¹¹exp(−253/T ) 240–400 ±150
→ CH3S(OH)CH3 1.7×10⁻¹² (1 bar air) ±0.30 1.0×10−39[O2] exp(5820/T ) / 240–360 ±150{1 + 5.0×10⁻³⁰[O2] exp(6280/T )}
95 HO + CH3SSCH3 → products 2.3×10⁻¹⁰±0.10 7.0×10⁻¹¹exp(350/T ) 250–370 ±200
96 HO2 + H2S→ products <3×10⁻¹⁵
97 HO2 + SO2 → products <1×10⁻¹⁸
98 HO2 + CH3SH→ products <4×10⁻¹⁵
99 HO2 + CH3SCH3 → products <5×10⁻¹⁵
100 NO3 + H2S→ products <1×10⁻¹⁵
101 NO3 + CS2 → products < 4×10⁻¹⁶
102 NO3 + OCS→ products <1×10⁻¹⁶
103 NO3 + SO2 → products <1×10⁻¹⁹
104 NO3 + CH3SH→ products 9.2×10⁻¹³±0.15 9.2×10⁻¹³ 250–370 ±400
105 NO3 + CH3SCH3 → CH3SCH2 + HNO3 1.1×10⁻¹²±0.15 1.9×10⁻¹³exp(520/T ) 250–380 ±200
106 NO3 + CH3SSCH3 → products 7×10⁻¹³±0.3 7×10⁻¹³ 300–380 ±500
107 HS + O2 → products <4×10⁻¹⁹
108 HS + O3 → HSO + O2 3.7×10⁻¹²±0.2 9.5×10⁻¹²exp(−280/T ) 290–440 ±250
109 HS + NO + M→ HSNO + M 2.4×10⁻³¹[N2] (ko) ±0.3 2.4×10⁻³¹(T /300)−2.5[N2] 250–300 1n = ±12.7×10⁻¹¹ (k∞) ±0.5 2.7×10⁻¹¹ 250–300 1log k = ±0.5Fc = 0.6
www.atmos-chem-phys.org/acp/4/1461/ Atmos. Chem. Phys., 4, 1461–1738, 2004

1466 R. Atkinson et al.: Evaluated kinetic and photochemical data for Ox, HOx, NOx and SOx
reaction k298 Temp. dependence of Temp.number Reaction cm3 molecule−1 s−1 1log ka
298 k/cm3 molecule−1 s−1 range/K 1(E/R)/Ka
110 HS + NO2 → HSO + NO 6.7×10⁻¹¹±0.3 2.9×10⁻¹¹exp(240/T ) 220–420 ±100
111 HSO + O2 → products ≤ 2.0×10⁻¹⁷
112 HSO + O3 → products 1.1×10⁻¹³±0.2
113 HSO + NO→ products <1.0×10⁻¹⁵
114 HSO + NO2 → products 9.6×10⁻¹²±0.3
115 HSO2 + O2 → products 3.0×10⁻¹³±0.8
116 SO + O2 → SO2 + O 7.6×10⁻¹⁷±0.15 1.6 x 10⁻¹³exp(−2280/T ) 230–420 ±500
117 SO + O3 → SO2 + O2 8.9×10⁻¹⁴±0.1 4.5×10⁻¹²exp(−1170/T ) 230–420 ±150
118 SO + NO2 → SO2 + NO 1.4×10⁻¹¹±0.1 1.4 x 10⁻¹¹ 210–360 ±100
119 SO3 (+ H2O) → H2SO4 5.7×10⁴ s−1 (at 50% relative humidity)120 SO3 + NH3 → products 2.0×10⁻¹¹ (1 bar) ±0.2121 CS + O2 → products 2.9×10⁻¹⁹
±0.6122 CS + O3 → OCS + O2 3.0×10⁻¹⁶
±0.5123 CS + NO2 → OCS + NO 7.6×10⁻¹⁷
±0.5124 CH2SH + O2 → products 6.6×10⁻¹²
±0.3125 CH2SH + O3 → products 3.5×10⁻¹¹
±0.3126 CH2SH + NO→ products 1.5×10⁻¹¹
±0.3127 CH2SH + NO2 → products 4.4×10⁻¹¹
±0.5128 CH3S + O2 + M → CH3SOO + M see data sheet129 CH3SOO + M→ CH3S + O2 + M see data sheet130 CH3S + O3 → products 4.9×10⁻¹²
±0.2 1.15×10⁻¹²exp(430/T ) 259–381 ±100131 CH3S + NO + M→ CH3SNO + M 3.3×10⁻²⁹[N2] (ko) ±0.3 3.3×10⁻²⁹(T /300)−4[N2] 290–450 1n = ±2
4×10⁻¹¹ (k∞) ±0.5 4×10⁻¹¹ 290–450 1log k = ±0.5Fc = 0.54 Fc = 0.54
132 CH3S + NO2 → CH3SO + NO 6.0×10⁻¹¹±0.15 3.0×10⁻¹¹exp(210/T ) 240–350 ±200
133 CH3SO + O3 → products 6.0×10⁻¹³±0.3
134 CH3SO + NO2 → products 1.2×10⁻¹¹±0.2
135 CH3SOO + O3 → products <8×10⁻¹³ (227 K)136 CH3SOO + NO→ products 1.1×10⁻¹¹ 227–256 1log k = ±0.3137 CH3SOO + NO2 → products 2.2×10⁻¹¹ 227–246 1log k = ±0.3138 CH3SO2 + NO2 → products ≤1×10⁻¹⁵
139 CH3SCH2 + O2 → CH3SCH2O2 5.7×10⁻¹² (1 bar) ±0.4140 CH3SCH2O2 + NO → CH3SCH2O + NO2 1.2×10⁻¹¹
±0.2 4.9×10⁻¹² exp(260/T ) 260–400 ±300141 CH3SCH2O2 + NO2 + M → CH3SCH2O2NO2 + M 9×10⁻¹² (1 bar) ±0.5142 CH3SCH2O2 + CH3SCH2O2 → 2CH3SCH2O + O2 1.0×10⁻¹¹
±0.3143 CH3SS + O3 → products 4.6×10⁻¹³
±0.3144 CH3SS + NO2 → products 1.8×10⁻¹¹
±0.3145 CH3SSO + NO2 → products 4.5×10⁻¹²
±0.3146 O3 + CH3SCH3 → products <1×10⁻¹⁸
147 ClO + CH3SCH3 → products 9×10⁻¹⁵±0.5
148 BrO + CH3SCH3 → products 4.4×10⁻¹³±0.3
149 IO + CH3SCH3 → products 1.3×10⁻¹⁴±0.2
150 OCS + hν → products See data sheet151 CS2 + hν → products See data sheet152 CH3SSCH3 + hν → products See data sheet153 CH3SNO + hν → products See data sheet
a The cited uncertainty is an expanded uncertainty corresponding approximately to a 95% confidence limit.
Atmos. Chem. Phys., 4, 1461–1738, 2004 www.atmos-chem-phys.org/acp/4/1461/
R. Atkinson et al.: Evaluated kinetic and photochemical data for Ox, HOx, NOx and SOx 1467
3 Guide to the data sheets
The data sheets are principally of two types: (i) those forindividual thermal reactions and (ii) those for the individualphotochemical reactions.
3.1 Thermal reactions
The data sheets begin with a statement of the reactions in-cluding all pathways which are considered feasible. This isfollowed by the corresponding enthalpy changes at 298 K,calculated from the enthalpies of formation summarized inthe Thermodynamics Data summary.
The available kinetic data on the reactions are summarizedunder two headings: (i) Absolute Rate Coefficients, and (ii)Relative Rate Coefficients. Under these headings, we includenew data which have been published since the last publishedIUPAC evaluation as well as the data used in deriving thepreferred values. Under both of the headings above, the dataare presented as absolute rate coefficients. If the temperaturecoefficient has been measured, the results are given in a tem-perature dependent form over a stated temperature range. Forbimolecular reactions, the temperature dependence is usuallyexpressed in the normal Arrhenius form,k = A exp(−B/T ),where B = E/R. For a few bimolecular reactions, wehave listed temperature dependences in the alternative form,k = A′T n or CTn exp(−D/T ), where the original authorshave found this to give a better fit to the data. For pressuredependent combination and dissociation reactions, the non-Arrhenius temperature dependence is used. This is discussedmore fully in a subsequent section of this Introduction.
Single temperature data are presented as such and wher-ever possible the rate coefficient at, or close to, 298 K isquoted directly as measured by the original authors. Thismeans that the listed rate coefficient at 298 K may differslightly from that calculated from the Arrhenius parametersdetermined by the same authors. Rate coefficients at 298 Kmarked with an asterisk indicate that the value was calculatedby extrapolation of a measured temperature range which didnot include 298 K. The tables of data are supplemented bya series of comments summarizing the experimental details.The following list of abbreviations, relating to experimentaltechniques, is used in the Techniques and Comments sec-tions:
A – absorptionAS – absorption spectroscopyCCD – charge coupled detectorCIMS – chemical ionization mass spectroscopy/spectrometricCL – chemiluminescenceCRDS – cavity ring-down spectroscopyDF – discharge flowEPR – electron paramagnetic resonanceF – flow systemFP – flash photolysis
FTIR – Fourier transform infraredFTS – Fourier transform spectroscopyGC – gas chromatography/gas chromatographicHPLC – high-performance liquid chromatographyIR – infraredLIF – laser induced fluorescenceLMR – laser magnetic resonanceLP – laser photolysisMM – molecular modulationMS – mass spectrometry/mass spectrometricP – steady state photolysisPLP – pulsed laser photolysisPR – pulse radiolysisRA – resonance absorptionRF – resonance fluorescenceRR – relative rateS – static systemTDLS – tunable diode laser spectroscopyUV – ultravioletUVA – ultraviolet absorptionVUVA – vacuum ultraviolet absorption
For measurements of relative rate coefficients, whereverpossible the comments contain the actual measured ratio ofrate coefficients together with the rate coefficient of the ref-erence reaction used to calculate the absolute rate coefficientlisted in the data table. The absolute value of the rate coef-ficient given in the table may be different from that reportedby the original author owing to a different choice of rate co-efficient of the reference reaction. Whenever possible thereference rate data are those preferred in the present evalua-tion.
The preferred rate coefficients are presented (i) at a tem-perature of 298 K and (ii) in temperature dependent formover a stated temperature range. This is followed by a state-ment of the uncertainty limits in logk at 298 K and the un-certainty limits either in (E/R) or in n, for the mean tem-perature in the range. Some comments on the assignment ofuncertainties are given later in this introduction.
The “Comments on Preferred Values” describe how theselection was made and give any other relevant information.The extent of the comments depends upon the present stateof our knowledge of the particular reaction in question. Thedata sheets are concluded with a list of the relevant refer-ences.
3.2 Conventions concerning rate coefficients
All of the reactions in the table are elementary processes.Thus the rate expression is derived from a statement of thereaction, e.g.
A + A → B + C
−1
2
d[A]
dt=
d[B]
dt=
d[C]
dt= k[A]
2.
www.atmos-chem-phys.org/acp/4/1461/ Atmos. Chem. Phys., 4, 1461–1738, 2004

1468 R. Atkinson et al.: Evaluated kinetic and photochemical data for Ox, HOx, NOx and SOx
Note that the stoichiometric coefficient for A, i.e. 2, appearsin the denominator before the rate of change of [A] (which isequal to 2k[A] 2) and as a power on the right-hand side.
Representations ofk as a function of temperature charac-terize simple “direct” bimolecular reactions. Sometimes it isfound thatk also depends on the pressure and the nature ofthe bath gas. This may be an indication of complex forma-tion during the course of the bimolecular reaction, which isalways the case in combination reactions. In the followingsections the representations ofk which are adopted in thesecases are explained.
3.3 Treatment of combination and dissociation reactions
Unlike simple bimolecular reactions such as those consid-ered in Sect. 1.2, combination reactions
A + B + M → AB + M
and the reverse dissociation reactions
AB + M → A + B + M
are composed of sequences of different types of physical andchemical elementary processes. Their rate coefficients reflectthe more complicated sequential mechanism and depend onthe temperature,T , and the nature and concentration of thethird body, [M]. In this evaluation, the combination reactionsare described by a formal second order rate law:
d[AB]
dt= k[A][B]
while dissociation reactions are described by a formal first-order rate law:
−d[AB]
dt= k[AB]
In both cases,k depends on the temperature and on [M].In order to rationalize the representations of the rate
coefficients used in this evaluation, we first consider theLindemann-Hinshelwood reaction scheme. The combinationreactions follow an elementary mechanism of the form,
A + B → AB∗ (1)
AB∗→ A + B (-1)
AB∗+ M → AB + M (2)
while the dissociation reactions are characterized by:
AB + M → AB∗+ M (-2)
AB∗+ M → AB + M (2)
AB∗→ A + B (-1)
Assuming quasi-stationary concentrations for the highlyexcited unstable species AB∗ (i.e. that d[AB∗]/dt ∼ 0), it
follows that the rate coefficient for the combination reactionis given by:
k = k1
(k2[M]
k−1 + k2[M]
)while that for the dissociation reaction is given by:
k = k−2[M]
(k−1
k−1 + k2[M]
)In these equations the expressions before the parentheses
represent the rate coefficients of the process initiating the re-action, whereas the expressions within the parentheses de-note the fraction of reaction events which, after initiation,complete the reaction to products.
In the low pressure limit ([M]→ 0) the rate coefficientsare proportional to [M]; in the high pressure limit ([M]→ ∞) they are independent of [M]. It is useful to expressk in terms of the limiting low pressure and high pressure ratecoefficients,
k0 = lim k([M])
[M] → 0and,
k∞ = lim k([M])
[M] → ∞
respectively. From this convention, the Lindemann-Hinshelwood equation is obtained
k =kok∞
ko + k∞
It follows that for combination reactions,k0 = k1k2[M]/ k−1andk∞ = k1, while for dissociation reactions,k0 = k−2[M]andk∞ = k−1k−2/k2. Since detailed balancing applies, theratio of the rate coefficients for combination and dissociationat a fixedT and [M] is given by the equilibrium constantKc
= k1k2/k−1k−2.Starting from the high-pressure limit, the rate coefficients
fall-off with decreasing third body concentration [M] andthe corresponding representation ofk as a function of [M]is termed the “falloff curve” of the reaction. In practice,the above Lindemann-Hinshelwood expressions do not suf-fice to characterize the falloff curves completely. Because ofthe multistep character of the collisional deactivation (k2[M])and activation (k−2[M]) processes, and energy- and angularmomentum-dependencies of the association (k1) and disso-ciation (k−1) steps, as well as other phenomena, the falloffexpressions have to be modified. This can be done by includ-ing a broadening factorF to the Lindemann-Hinshelwoodexpression (Troe, 1979):
k =kok∞
ko + k∞
F = ko
(1
1 +ko
k∞
)F = k∞
(ko
k∞
1 +ko
k∞
)F
The broadening factorF depends on the ratiok0/k∞, whichis proportional to [M], and can be used as a measure of “re-duced pressure”. The first factors on the right-hand siderepresent the Lindemann-Hinshelwood expression and the
Atmos. Chem. Phys., 4, 1461–1738, 2004 www.atmos-chem-phys.org/acp/4/1461/

R. Atkinson et al.: Evaluated kinetic and photochemical data for Ox, HOx, NOx and SOx 1469
additional broadening factorF , at not too high temperatures,is approximately given by (Troe, 1979):
logF ∼=logFc
1 + [log(k0/k∞)/N]2
where log = log10 andN = [0.75− 1.27 logFc]. In this waythe three quantitiesk0, k∞, andFc characterise the falloffcurve for the present application.
The given approximate expression for the broadening fac-tor F was obtained from statistical unimolecular rate theoryin its simplest form (Troe, 1979). More rigorous represen-tations require detailed information on the potential energysurfaces and on the collisional energy transfer step of the re-action. If this information is not available, one may assumetypical behaviour and rely on the theoretical analysis givenby Cobos and Troe (2003). ForT = 200−300 K and thecollider M = N2 (with a collision efficiencyβc ≈ 0.3), thistreatment predictsFc ≈ 0.49, 0.44, 0.39, and 0.35, if thereactants A and B in total haver = 3, 4, 5, or 6 rotationaldegrees of freedom, respectively (e.g. for the reaction HO +NO2, one would haver = 5 and henceFc ≈ 0.39). It isalso predicted thatFc, for the present applications, should benearly temperature independent. Finally, more rigorous ex-pressions for the broadening factorsF are given in Cobos andTroe (2003) which, in general do not differ from the aboveformula by more than about 10 percent. Since the specialproperties of each reaction system may lead to some devia-tions from the given values ofFc, these should only be usedfor a first orientation. Larger deviations of experimentallyfitted Fc-values from the given “standard values”, however,may be an indication for inadequate falloff extrapolations tok0 andk∞. In this case, the apparent values forFc, k0, andk∞ obtained by fitting still can provide a satisfactory repre-sentation of the considered experimental data, in spite of thefact that inadequate values ofk0 andk∞ are obtained by ex-trapolation.
If a given falloff curve is fitted in different ways, changesin Fc require changes in the limitingk0 andk∞ values. Forthe purpose of this evaluation, this is irrelevant if the pre-ferredk0 andk∞ are used consistently together with the pre-ferredFc values. If the selectedFc value is too large, the val-ues ofk0 andk∞ obtained by fitting the falloff expression tothe experimental data are underestimated. IfFc is too small,k0 andk∞ are overestimated. However uncertainties inFc
influence the fittedk0 andk∞ in different ways. A simplerpolicy of fitting falloff was chosen by the NASA/JPL panel(Sander et al., 2003) in puttingF = 0.6 and N = 1. Thisgenerally leads to different values of the fittedk0 andk∞ andtheir temperature dependencies than derived here, althoughexperimental data over the range of atmospheric interest canbe generally be reproduced equally well. However the de-rived k0 andk∞ may differ from the true limiting rate coef-ficients and thus should be interpreted by theory only withcaution.
In the present evaluation, we generally follow the experi-mentally fitted values forFc, k0, andk∞, providedFc doesnot differ too much from the values given above. If largedeviations are encountered, the experimental data are re-evaluated using the givenFc-values given above.
Besides the energy-transfer mechanism, i.e. reactions (1),(-1), and (2), a second mechanism appears to be relevant forsome reactions considered here. This is the radical-complex(or chaperon) mechanism
A + M → AM (3)
AM → A + M (-3)
B + AM → AB + M (4)
which, in the low pressure range, leads to
k0 = (k3/k−3)k4[M].
For some tri- and tetra-atomic adducts AB, this valueof k0 may exceed that from the energy-transfer mechanismand show stronger temperature dependencies. This mecha-nism may also influence high pressure experiments whenk0from the radical-complex mechanism exceeds k∞ from theenergy-transfer mechanism (Oum et al., 2003). In this casefalloff over wide pressure ranges cannot be represented bycontributions from the energy-transfer mechanism alone, inparticular when measurements at pressures above about 10bar are taken into consideration.
The dependence ofk0 andk∞ on the temperatureT is rep-resented in the form:k ∝ T −n except for cases with an estab-lished energy barrier in the potential. We have used this formof temperature dependence because it usually gives a betterfit to the data over a wider range of temperature than doesthe Arrhenius expression. It should be emphasised that thechosen form of the temperature dependence is often only ad-equate over limited temperature ranges such as 200–300 K.Obviously, the relevant values ofn are different fork0 andk∞. In this evaluation, values ofk0 are given for selected ex-amples of third bodies M, and if possible for M = N2, O2 orair.
3.4 Treatment of complex-forming bimolecular reactions
Bimolecular reactions may follow the “direct” pathway
A + B → C + D
and/or involve complex formation,
A + B ⇔ AB∗→ C + D
↓ MAB
We designate the rate coefficients of the individual steps asin Sect. 1.3, above:
A + B → AB∗ (1)
www.atmos-chem-phys.org/acp/4/1461/ Atmos. Chem. Phys., 4, 1461–1738, 2004

1470 R. Atkinson et al.: Evaluated kinetic and photochemical data for Ox, HOx, NOx and SOx
AB∗→ A + B (-1)
AB∗+ M → AB + M (2)
AB∗→ C + D (3)
Assuming quasi-stationary concentrations of AB∗ (i.e.d[AB∗]/dt ∼ 0), a Lindemann-Hinshelwood type of analysisleads to,
d[AB]
dt= kS[A][B]
d[C]
dt= kD[A][B]
d[A]
dt= (kS + kD)[A][B]
where
kS = k1
(k2
k−1 + k2 + k3
)
kD = k1
(k3
k−1 + k2 + k3
)Note that sincek2 is proportional to [M],kS andkD are
dependent on the nature and concentration of the third bodyM, in addition to their temperature dependence. In reality,as for the combination and dissociation reactions, the givenexpressions forkS andkD have to be extended by suitablebroadening factorsF in order to account for the multistepcharacter of process (2) and the energy dependencies of pro-cesses (1), (-1) and (3). These broadening factors, however,differ from those for combination and dissociation reactions.For simplicity, they are ignored in this evaluation such thatkD at high pressure approaches
kD → k1k3/k2
which is inversely proportional to [M].kD may also be ex-pressed by
kD ≈ kD0kS/kS0
wherekD0 andkS0 are the respective limiting low-pressurerate coefficients for the formation of C + D or A + B atthe considered [M]. When it is established that complex-formation is involved, this equation is used to characterizethe increasing suppression of C + D formation with increas-ing [M].
3.5 Photochemical reactions
The data sheets begin with a list of feasible primary pho-tochemical transitions for wavelengths usually down to170 nm, along with the corresponding enthalpy changes at0 K where possible or alternatively at 298 K, calculated from
the data in the Thermodynamic Data summary. Calcu-lated threshold wavelengths corresponding to these enthalpychanges are also listed, bearing in mind that the values calcu-lated from the enthalpy changes at 298 K are not true “thresh-old values”.
This is followed by tables which summarise the availableexperimental data for: (i) absorption cross-sections and (ii)quantum yields. These data are supplemented by a series ofcomments.
The next table lists the preferred absorption cross-sectiondata and the preferred quantum yields at appropriate wave-length intervals. For absorption cross-sections the intervalsare usually 1 nm, 5 nm or 10 nm. Any temperature depen-dence of the absorption cross-sections is also given wherepossible. The aim in presenting these preferred data is toprovide a basis for calculating atmospheric photolysis rates.For absorption continua the temperature dependence is oftenrepresented by Sulzer-Wieland type expressions (Astholz etal., 1981). Alternately a simple empirical expression of theform: log10(σT 1/σT 2) = B(T1−T2) is used.
The comments again describe how the preferred data wereselected and include other relevant points. The photochemi-cal data sheets are also concluded with a list of references.
3.6 Conventions concerning absorption cross-sections
These are presented in the data sheets as “absorption cross-sections per molecule, base e.” They are defined according tothe equations
I/I0= exp(−σ [N]l),
σ = {1/([N]l)} ln(I0/I),
where I0 and I are the incident and transmitted light inten-sities, σ is the absorption cross-section per molecule (ex-pressed in this paper in units of cm2), [N] is the number con-centration of absorber (expressed in molecule cm−3), andl
is the path length (expressed in cm). Other definitions andunits are frequently quoted. The closely related quantities“absorption coefficient” and “extinction coefficient” are of-ten used, but care must be taken to avoid confusion in theirdefinition. It is always necessary to know the units of con-centration and of path length and the type of logarithm (basee or base 10) corresponding to the definition. To convert anabsorption cross-section to the equivalent Naperian (base e)absorption coefficient (expressed in cm−1) of a gas at a pres-sure of one standard atmosphere and temperature of 273 K,multiply the value ofσ in cm2 by 2.69×1019.
Atmos. Chem. Phys., 4, 1461–1738, 2004 www.atmos-chem-phys.org/acp/4/1461/

R. Atkinson et al.: Evaluated kinetic and photochemical data for Ox, HOx, NOx and SOx 1471
3.7 Assignment of uncertainties
Under the heading “reliability”, estimates have been made ofthe absolute accuracies of the preferred values ofk at 298 Kand of the preferred values ofE/R over the quoted temper-ature range. The accuracy of the preferred rate coefficientat 298 K is quoted as the term1log k, where1log k = D
andD is defined by the equation, log10k = C ± D. This isequivalent to the statement thatk is uncertain to a factor ofF , whereD = log10F . The accuracy of the preferred valueof E/R is quoted as the term1(E/R), where1(E/R) = G
andG is defined by the equationE/R = H ± G. D andG
are expanded uncertainties corresponding approximately to a95% confidence limit.
For second-order rate coefficients listed in this evalua-tion, an estimate of the uncertainty at any given temperaturewithin the recommended temperature range may be obtainedfrom the equation:
1 logk(T ) = 1 logk(298 K) + 0.4343{1E/R(1/T − 1/298)}
The assignment of these absolute uncertainties ink andE/R
is a subjective assessment of the evaluators. They are not de-termined by a rigorous, statistical analysis of the database,which is generally too limited to permit such an analy-sis. Rather, the uncertainties are based on a knowledge ofthe techniques, the difficulties of the experimental measure-ments, the potential for systematic errors, and the number ofstudies conducted and their agreement or lack thereof. Ex-perience shows that for rate measurements of atomic andfree radical reactions in the gas phase, the precision of themeasurement, i.e. the reproducibility, is usually good. Thus,for single studies of a particular reaction involving one tech-nique, standard deviations, or even 90% confidence limits, of±10% or less are frequently reported in the literature. Unfor-tunately, when evaluators come to compare data for the samereaction studied by more than one group of investigators andinvolving different techniques, the rate coefficients often dif-fer by a factor of 2 or even more. This can only mean thatone or more of the studies has involved large systematic un-certainty which is difficult to detect. This is hardly surprisingsince, unlike molecular reactions, it is not always possible tostudy atomic and free radical reactions in isolation, and con-sequently mechanistic and other difficulties frequently arise.
The arbitrary assignment of uncertainties made here isbased mainly on our state of knowledge of a particular re-action which is dependent upon factors such as the numberof independent investigations carried out and the number ofdifferent techniques used. On the whole, our assessment ofuncertainty limits tends towards the cautious side. Thus, inthe case where a rate coefficient has been measured by a sin-gle investigation using one particular technique and is un-confirmed by independent work, we suggest that minimumuncertainty limits of a factor of 2 are appropriate.
In contrast to the usual situation for the rate coefficientsof thermal reactions, where intercomparison of results of a
number of independent studies permits a realistic assessmentof reliability, for many photochemical processes there is ascarcity of apparently reliable data. Thus, we do not feeljustified at present in assigning uncertainty limits to the pa-rameters reported for the photochemical reactions.
Acknowledgements.The Chairman and members of the Committeewish to express their appreciation to I.U.P.A.C. for the financialhelp which facilitated the preparation of this evaluation. We alsoacknowledge financial support from the following organisations:Agricultural Experimental Station, University of California, the UKNatural Environmental Research Council, the Standard ReferenceData Program (N.I.S.T), the Fonds National Suisse de la RechercheScientifique (F.N.S.R.S.) and the Office Federal de l’Education etde la Science, and the Deutsche Forschungsgemeinschaft (SFB357).
Edited by: W. Sturges
References
Astholz, D. C., Brouwer, L., and Troe, J.: High Temperature UltraViolet Spectra of Polyatomic Molecules in Shock Waves, Ber.Bunsenges. Phys. Chem. 85, 559, 1981.
Atkinson, R., Baulch, D. L., Cox, R. A., Hampson, Jr., R. F., Kerr, J.A., and Troe, J.: Evaluated Kinetic and Photochemical Data forAtmospheric Chemistry: Supplement III, IUPAC Subcommitteeon Gas Kinetic Data Evaluation for Atmospheric Chemistry, J.Phys. Chem. Ref. Data 18, 881–1097, 1989.
Atkinson, R., Baulch, D. L., Cox, R. A., Hampson, Jr., R. F., Kerr, J.A., and Troe, J.: Evaluated Kinetic and Photochemical Data forAtmospheric Chemistry: Supplement IV, IUPAC Subcommitteeon Gas Kinetic Data Evaluation for Atmospheric Chemistry, J.Phys. Chem. Ref. Data 21, 1125–1568, 1992.
Atkinson, R., Baulch, D. L., Cox, R. A., Hampson, Jr., R. F., Kerr,J. A., Rossi, M., and Troe, J.: Evaluated Kinetic, Photochemical,and Heterogeneous Data for Atmospheric Chemistry: Supple-ment V, IUPAC Subcommittee on Gas Kinetic Data Evaluationfor Atmospheric Chemistry, J. Phys. Chem. Ref. Data 26, 521–1011, 1997a.
Atkinson, R., Baulch, D. L., Cox, R. A., Hampson, Jr., R. F., Kerr, J.A., Rossi, M. J., and Troe, J.: Evaluated Kinetic and Photochem-ical Data for Atmospheric Chemistry: Supplement VI, IUPACSubcommittee on Gas Kinetic Data Evaluation for AtmosphericChemistry, J. Phys. Chem. Ref. Data 26, 1329–1499, 1997b.
Atkinson, R., Baulch, D. L., Cox, R. A., Hampson, Jr., R. F., Kerr, J.A., Rossi, M. J., and Troe, J.: Evaluated Kinetic and Photochem-ical Data for Atmospheric Chemistry: Supplement VII, IUPACSubcommittee on Gas Kinetic Data Evaluation for AtmosphericChemistry, J. Phys. Chem. Ref. Data 28, 191–393, 1999.
Atkinson, R., Baulch, D. L., Cox, R. A., Hampson, Jr., R. F., Kerr, J.A., Rossi, M. J., and Troe, J.: Evaluated Kinetic and Photochem-ical Data for Atmospheric Chemistry, Supplement VIII, IUPACSubcommittee on Gas Kinetic Data Evaluation for AtmosphericChemistry, J. Phys. Chem. Ref. Data, J. Phys. Chem. Ref. Data29, 167–266, 2000.
Baulch, D. L., Cox, R. A., Hampson, Jr., R. F., Kerr, J. A., Troe, J.,and Watson, R. T.: Evaluated Kinetic and Photochemical Data
www.atmos-chem-phys.org/acp/4/1461/ Atmos. Chem. Phys., 4, 1461–1738, 2004

1472 R. Atkinson et al.: Evaluated kinetic and photochemical data for Ox, HOx, NOx and SOx
for Atmospheric Chemistry, CODATA Task Group on ChemicalKinetics, J. Phys. Chem. Ref. Data 9, 295–471, 1980.
Baulch, D. L., Cox, R. A., Crutzen, P. J., Hampson, Jr., R. F., Kerr,J. A., Troe, J., and Watson, R. T.: Evaluated Kinetic and Photo-chemical Data for Atmospheric Chemistry: Supplement I, CO-DATA Task Group on Chemical Kinetics, J. Phys. Chem. Ref.Data 11, 327–496, 1982.
Baulch, D. L., Cox, R. A., Hampson, Jr., R. F., Kerr, J. A., Troe,J., and Watson, R. T.: Evaluated Kinetic and PhotochemicalData for Atmospheric Chemistry: Supplement II, CODATA TaskGroup on Gas Phase Chemical Kinetics, J. Phys. Chem. Ref.Data 13, 1259–1380, 1984.
Cobos, C. J. and Troe, J.: Prediction of Reduced Falloff Curves forRecombination, Reactions at Low Temperatures, Z. Phys. Chem.
217, 1–14, 2003.Demore, W. B., Sander, S. P., Friedl R. R., Golden D. M., Kurylo
M. J., Huie R. E., Orkin V. L. ,Moortgat G. K., Ravishankara A.R., Kolb C. E., Molina M. J. and Finlayson-Pitts B. J.: ChemicalKinetics and Photochemical Data for Use in Atmospheric Stud-ies. NASA Panel for Data Evaluation, Evaluation Number 14.,JPL Publication 02-25, 2003.
Oum, K., Sekiguchi, K., Luther, K., and Troe, J.: Observation ofUnique Pressure Effects in the Combination Reaction of BenzylRadicals in the Gas to Liquid Transition Region, Phys. Chem.Chem. Phys. 5, 2931–2933, 2003.
Troe, J.: Predictive Possibilities of Unimolecular Rate Theory, J.Phys. Chem., 83, 114–126, 1979.
Atmos. Chem. Phys., 4, 1461–1738, 2004 www.atmos-chem-phys.org/acp/4/1461/

R. Atkinson et al.: Evaluated kinetic and photochemical data for Ox, HOx, NOx and SOx 1473
Appendix A1: Ox reactions
I.A1.1
O + O2 + M → O3 + M
1H ◦= −106.5 kJ· mol−1
Low-pressure rate coefficientsRate coefficient data
k0/cm3 molecule−1 s−1 Temp./K Reference Technique/Comments
Absolute Rate Coefficients6.75×10−35 [O2]× 262–319 Arnold and Comes, 1979 FP-RAexp[(635± 18)/T ](5.69± 0.40)×10−34 [O2] 2981.82×10−35 [N2]× 262–309exp[(995± 37)/T ](5.13± 0.60)×10−34 [N2] 298(6.9± 1.0)×10−34
× 219–368 Klais et al., 1980 FP-RF(T /300)−(1.25±0.2) [O2](6.2± 0.9)×10−34
× 219–368(T /300)−(2.0±0.5) [N2](5.69± 0.34)×10−34
× 227–353 Lin and Leu, 1982 FP-RF(T /300)−(2.37±0.37) [O2](5.70± 0.19)×10−34
× 218–366(T /300)−(2.62±0.18) [N2]5.5×10⁻³⁴ (T /300)−2.6 [N2] 100–400 Hippler et al., 1990 PLP-UVA (a)5.2×10⁻³⁵ (T /1000)−1.3 [N2] 700–900(6.5±1.1)×10−34 [N2] 296 Anderson et al., 1997 (b)
Comments
(a) The O3 product was monitored by UV absorption at 265 nm. Data forT > 400 K are based on dissociation experi-ments. The reaction is suggested to follow the energy transfer mechanism at high temperatures. The strong temperaturedependence observed for low temperatures suggests that a radical-complex mechanism dominates.
(b) Steady-state photolysis of O2 near 200 Torr monitoring O3 absorption at 254 nm and following isotopic compositions bymolecular beam mass spectrometric sampling. Isotope effects with16O and18O resolved.
Preferred Values
ko = 5.6×10⁻³⁴ (T /300)−2.6 [N2] cm3 molecule−1 s−1 over the temperature range 100–300 K.ko = 6.0×10⁻³⁴ (T /300)−2.6 [O2] cm3 molecule−1 s−1 over the temperature range 100–300 K.
Reliability
1log ko = ±0.05 at 298 K.1n = ±0.5.
Comments on Preferred Values
The preferred values at 300 K are averages of the data from Arnold and Comes (1979), Klais et al. (1980), Lin and Leu(1982) and Hippler et al. (1990), and the temperature coefficients are taken from Hippler et al. (1990). The experiments fromHippler et al. (1990) under low temperature and high pressure conditions indicate anomalous falloff behaviour different fromthe formalism described for the energy transfer mechanism in the Introduction. These effects are not relevant for atmosphericconditions as such, and they are not included in this evaluation.
www.atmos-chem-phys.org/acp/4/1461/ Atmos. Chem. Phys., 4, 1461–1738, 2004

1474 R. Atkinson et al.: Evaluated kinetic and photochemical data for Ox, HOx, NOx and SOx
References
Anderson, S. H., Hulsebusch, D. and Mauersberger K. : J. Chem. Phys., 107, 5385, 1997.Arnold, I. and Comes, F. J.: Chem. Phys. 42, 231, 1979.Hippler, H., Rahn, R., and Troe J.: J. Chem. Phys., 93, 6560, 1990.Klais, O., Anderson, P. C. and Kurylo, M. J.: Int. J. Chem. Kinet., 12, 469, 1980.Lin, C. L. and Leu, M. T.: Int. J. Chem. Kinet., 14, 417, 1982.
Atmos. Chem. Phys., 4, 1461–1738, 2004 www.atmos-chem-phys.org/acp/4/1461/

R. Atkinson et al.: Evaluated kinetic and photochemical data for Ox, HOx, NOx and SOx 1475
I.A1.2
O + O3→ 2O2
1H ◦ = -391.9 kJ·mol−1
Rate coefficient data
k0/cm3 molecule−1 s−1 Temp./K Reference Technique/Comments
Absolute Rate Coefficients1.1×10−11 exp(−2155/T) 269–409 McCrumb and Kaufman, 1972 (a)2.0×10⁻¹¹ exp(−2280/T) 220–353 Davis et al., 1973 PLP-RF8.3×10−15 298 West et al., 1978 PLP-RF2.12×10−11 exp(−2337/T) 262–335 Arnold and Comes, 1979 FP-RA5.6×10−12 exp(−1959/T) 220–377 Wine et al., 1983 PLP-RF8.26×10−15 297
Comments
(a) Flow system used with O(3P) atoms being produced by the pyrolysis of O3.
Preferred Values
k = 8.0×10⁻¹⁵ cm3 molecule−1 s−1 at 298 K.k = 8.0×10⁻¹² exp(−2060/T ) cm3 molecule−1 s−1 over the temperature range 200–400 K.
Reliability
1log k = ±0.08 at 298 K.1(E/R) = ±200 K.
Comments on Preferred Values
The study of Wine et al. (1983) yields values ofk in close agreement with those from other studies, over the whole tem-perature range covered. Our preferred values are based on the least-squares expression obtained by Wine et al. (1983) from afit of their data plus those of McCrumb and Kaufman (1972), Davis et al. (1973), West et al. (1978) and Arnold and Comes(1979). Computed rate constants (Balakinshnan and Billing, 1995) using variational transition state theory are in satisfactoryagreement with the experimental results.
References
Arnold, I. and Comes, F. J.: Chem. Phys., 42, 231, 1979.Balakinshnan, N. and Billing, G. D.: Chem. Phys. Lett., 242, 68, 1995.Davis, D. D., Wong, W. and Lephardt, J.: Chem. Phys. Lett., 22, 273, 1973.McCrumb, J. L. and Kaufman, F.: J. Chem. Phys., 57, 1270, 1972.West, G. A., Weston Jr., R. E. and Flynn, G. W.: Chem. Phys. Lett., 56, 429, 1978.Wine, P. H., Nicovich, J. M., Thompson, R. J. and. Ravishankara, A. R.: J. Phys. Chem., 87, 3948, 1983.
www.atmos-chem-phys.org/acp/4/1461/ Atmos. Chem. Phys., 4, 1461–1738, 2004

1476 R. Atkinson et al.: Evaluated kinetic and photochemical data for Ox, HOx, NOx and SOx
I.A1.3
O(1D) + O2 → O(3P) + O2(16+g ) (1)
→ O(3P) + O2(11g) (2)→ O(3P) + O2(36−
g ) (3)
1H ◦ (1) = −32.8 kJ·mol−1
1H ◦ (2) = −95.4 kJ·mol−1
1H ◦ (3) = −189.7 kJ·mol−1
Rate coefficient data (k = k1 + k2 + k3)
k/cm3 molecule−1 s−1 Temp./K Reference Technique/Comments
Absolute Rate Coefficients2.9×10−11 exp[(67± 11)/T ] 104–354 Streit et al., 1976 (a)3.6×10⁻¹¹ 298(4.2± 0.2)×10−11 295 Amimoto et al., 1979 PLP-RA (b)(4.0± 0.6)×10−11 298 Brock and Watson, 1979 PLP-RF (b)
Branching Ratiosk1/k = 0.77± 0.2 300 Lee and Slanger, 1978 (c)k2/k ≤ 0.05 300 Gauthier and Snelling, 1971 (d)
Comments
(a) O(1D) atoms were produced by flash photolysis of O3 and detected by O(1D) → O(3P) emission at 630 nm.
(b) O(3P) atom product detected by resonance absorption (Amimoto et al., 1979) or resonance fluorescence (Brock andWatson, 1979).
(c) O(1D) atoms detected by O(1D) → O(3P) emission at 630 nm. O2(16+g ) was monitored from the O2(16+
g ) → O2(36−
g )
(1-1) and (0-0) band emission. O2(16+
g ) is only formed in theυ = 0 and 1 levels, withk(1)/k(0) = 0.7.
(d) O(1D) atom production by the photolysis of O3.
Preferred Values
k = 4.0×10⁻¹¹ cm3 molecule−1 s−1 at 298 K.k = 3.2×10⁻¹¹ exp(67/T ) cm3 molecule−1 s−1 over the temperature range 200–350 K.k1/k = 0.8 at 298 K.k2/k ≤ 0.05 at 298 K.
Reliability
1log k = ±0.05 at 298 K.1(E/R) = ±100 K.1(k1/k) = ±0.1 at 298 K.
Comments on Preferred Values
The preferred 298 K rate coefficient is the average of the results from Streit et al. (1976), Amimoto et al. (1979) and Brockand Watson (1979). The temperature dependence is that measured by Streit et al. (1976). The branching ratios of Lee andSlanger (1978) and Gauthier and Snelling (1971) are recommended.
Atmos. Chem. Phys., 4, 1461–1738, 2004 www.atmos-chem-phys.org/acp/4/1461/
R. Atkinson et al.: Evaluated kinetic and photochemical data for Ox, HOx, NOx and SOx 1477
References
Amimoto, S. T., Force, A. P., Gulotty Jr., R. G. and Wiesenfeld, J. R.: J. Chem. Phys., 71, 3640, 1979.Brock, J. C. and Watson, R. T.: Reported at the NATO Advanced Study Institute on Atmospheric Ozone, Portugal (1979). Seealso Moortgat, G. K. in Report. No. FAA-EE.80-20, 1980.Gauthier, M., and Snelling, D. R.: J. Chem. Phys., 54, 4317, 1971.Lee, L. C. and Slanger, T.: J. Chem. Phys., 69, 4053, 1978.Streit, G. E., Howard, C. J., Schmeltekopf, A. L., Davidson, J. A. and Schiff, H. I.: J. Chem. Phys., 65, 4761, 1976.
www.atmos-chem-phys.org/acp/4/1461/ Atmos. Chem. Phys., 4, 1461–1738, 2004

1478 R. Atkinson et al.: Evaluated kinetic and photochemical data for Ox, HOx, NOx and SOx
I.A1.4
O(1D) + O3 → O2 + 2O(3P) (1)→ O(3P) + O3 (2)→ 2O2(11g) (3)→ O2(16+
g ) + O2(36−g ) (4)
→ 2O2(36−g ) (5)
1H ◦= −83.2 kJ·mol−1
1H ◦= −189.7 kJ·mol−1
1H ◦= −393.0 kJ·mol−1
1H ◦= −424.7 kJ·mol−1
1H ◦= −581.6 kJ·mol−1
Rate coefficient data (k = k1 + k2 + k3 + k4 + k5)
k/cm3 molecule−1 s−1 Temp./K Reference Technique/Comments
Absolute Rate Coefficients(2.4± 0.5)×10−10 103–393 Streit et al., 1976 (a)(2.5± 0.5)×10−10 300 Amimoto et al., 1978; 1980 PLP-RA (b)(2.28± 0.23)×10−10 298 Wine and Ravishankara, 1981 PLP-RF (b)(2.5± 0.2)×10−10 298 Greenblatt and Wiesenfeld, 1983 PLP-RF (b)
Branching Ratiosk1/(k3 + k4 + k5) = 1 ∼298 Davenport et al., 1972 FP-RF (b)k1/k = 0.53 298 Cobos et al., 1983 (c)k5/k = 0.47
Comments
(a) O(1D) atoms produced by flash photolysis of O3 in a flow system and detected by emission at 630 nm.
(b) The product O(3P) atoms were detected by resonance absorption (Amimoto et al., 1978; 1980) or resonance fluorescence(Wine and Ravishankara, 1981; Greenblatt and Wiesenfeld, 1983).
(c) Steady-state photolysis of pure O3 and O3-inert gas mixtures. Ozone removal was monitored manometrically at highpressures and spectrophotometrically at lower pressures. The quantum yield of O3 removal was interpreted in terms of acomplex reaction scheme.
Preferred Values
k = 2.4×10⁻¹⁰ cm3 molecule−1 s−1, independent of temperature over the range 100–400 K.k1/k = k5/k = 0.5 at 298 K.
Reliability
1log k = ±0.05 over the temperature range 100–400 K.1k1/k = 1k5/k = ±0.1 at 298 K.
Comments on Preferred Values
The recommendation for the rate coefficient is based on the data of Streit et al. (1976), Amimoto et al. (1978, 1980), Wineand Ravishankara (1981) and Greenblatt and Wiesenfeld (1983). The branching ratios are based on these studies plus the workof Davenport et al. (1972) and Cobos et al. (1983).
Atmos. Chem. Phys., 4, 1461–1738, 2004 www.atmos-chem-phys.org/acp/4/1461/

R. Atkinson et al.: Evaluated kinetic and photochemical data for Ox, HOx, NOx and SOx 1479
References
Amimoto, S. T., Force, A. P. and Wiesenfel, J. R.: Chem. Phys. Lett., 60, 40, 1978.Amimoto, S. T., Force, A. P., Wiesenfeld, J. R. and Young, R. H.: J. Chem. Phys., 73, 1244, 1980.Cobos, C., Castellano, E. and Schumacher, H. J.: J. Photochem., 21, 291, 1983.Davenport, J., Ridley, B., Schiff, H. I. and Welge, K. H.: J. Chem. Soc. Faraday Disc., 53, 230, 1972.Davidson, J. A., Sadowski, C. M., Schiff, H. I., Streit, G. E., Howard, C. J., Jennings, D. A. and Schmeltekopf, A. L.: J. Chem.Phys., 64, 57, 1976.Greenblatt G. D. and Wiesenfeld, J. R.: J. Chem. Phys., 789, 4924, 1983.Streit, G. E., Howard, C. J., Schmeltekopf, A. L., Davidson and Schiff, H.I.: J. Chem. Phys., 65, 4761, 1976.Wine, P. H. and Ravishankara, A. R.: Chem. Phys. Lett., 77, 103, 1981.
www.atmos-chem-phys.org/acp/4/1461/ Atmos. Chem. Phys., 4, 1461–1738, 2004

1480 R. Atkinson et al.: Evaluated kinetic and photochemical data for Ox, HOx, NOx and SOx
I.A1.5
O2* + O3 → O + 2O2
Comments
Arnold and Comes (1980a, 1980b) have studied this reaction of vibrationally excited oxygen molecules in the groundelectronic state with ozone and they report a rate coefficient of 2.8×10⁻¹⁵ cm3 molecule−1 s−1 at 298 K. The vibrationallyexcited oxygen molecules were produced in the reaction of O(1D) atoms with O3 following the UV photolysis of ozone. Thisis the only reported study of this rate coefficient, and we make no recommendation. For further discussion the reader is referredto the review by Steinfeld et al. (1987).
References
Arnold, I. and Comes, F. J.: Chem. Phys., 47, 125, 1980a.Arnold, I. and Comes, F. J.: J. Mol. Struct., 61, 223, 1980b.Steinfeld, J. I., Adler-Golden, S. M. and Gallagher, J. W.: J. Phys. Chem. Ref. Data, 16, 911, 1987.
Atmos. Chem. Phys., 4, 1461–1738, 2004 www.atmos-chem-phys.org/acp/4/1461/

R. Atkinson et al.: Evaluated kinetic and photochemical data for Ox, HOx, NOx and SOx 1481
I.A1.6
O2(36−g ,v) + M → O2(36−
g ,v’) + M
Rate coefficient data
k/cm3 molecule−1 s−1 M ν Temp./K Reference Technique/Comments
Absolute Rate Coefficients(4.7± 0.3)×10−15 O2 19 295 Price et al., 1993 (a)(3.2± 0.3)×10−15 20(5.8± 1.2)×10−15 21(5.4± 0.8)×10−14 22(1.2± 0.4)×10−14 23(0.84± 0.04)×10−14 24(1.8± 0.05)×10−14 25(4.7± 0.2)×10−14 26(2.3± 0.1)×10−14 O2 19 460(3.1± 0.08)×10−14 20(2.2± 0.9)×10−14 21(3.7± 0.3)×10−14 22(4.1± 0.6)×10−14 23(6.9± 0.5)×10−14 24(11.7± 0.2)×10−14 25(16.4± 2)×10−14 26>8.3×10⁻¹⁴ 27>1.2×10⁻¹¹ 286.5×10⁻¹⁴ O2 8 300 Park and Slanger, 1994 (b)>1.3×10⁻¹³ He 22(1.53± 0.25)×10−11 O3 222×10−13 CO2 149×10−14 22
Comments
(a) Vibrationally highly excited electronic ground state O2 molecules were generated by stimulated emission pumping, anddetected by LIF.
(b) Vibrationally highly excited electronic ground state O2 molecules were formed by ozone photodissociation at 248 nm(Hartley band). The excited molecules were detected by LIF. Rate coefficients were evaluated using a cascade model, inwhich relaxation through single-quantum V-V and V-T steps was assumed.
Preferred Values See table.
Reliability
1log k = ±0.5.
Comments on Preferred Values
The results given from Price et al. (1993), and more results presented in graphical form from Park and Slanger (1994), appearconsistent with each other.
www.atmos-chem-phys.org/acp/4/1461/ Atmos. Chem. Phys., 4, 1461–1738, 2004

1482 R. Atkinson et al.: Evaluated kinetic and photochemical data for Ox, HOx, NOx and SOx
References
Park, H. and Slanger, T. G.: J. Chem. Phys., 100, 287, 1994.Price, J. M., Mack, J. A., Rogaski, C. A. and Wodtke, A. M.: Chem. Phys., 175, 83, 1993.
Atmos. Chem. Phys., 4, 1461–1738, 2004 www.atmos-chem-phys.org/acp/4/1461/

R. Atkinson et al.: Evaluated kinetic and photochemical data for Ox, HOx, NOx and SOx 1483
I.A1.7
O2(11g) + M → O2(36−g ) + M
1H ◦ = −94.3 kJ·mol−1
Rate coefficient data
k/cm3 molecule−1 s−1 M Reference Technique/Comments
Absolute Rate Coefficients(1.51± 0.05)×10−18 O2 298 Borrell et al., 1977 DF-CL (a)(1.47± 0.05)×10−18 O2 298 Leiss et al., 1978 (b)(1.65± 0.07)×10−18 O2 298 Raja et al., 1986 DF-CL (a)3.15×10 −18 exp(−205/T ) O2 100–450 Billington and Borrell, 1986 DF-CL (a)1.57×10⁻¹⁸ 2981.4×10−19 N2 300 Collins et al., 1973 FP-VUVA (c)5.6×10⁻¹⁸ H2O 298 Findlay and Snelling, 1971 (d)<1.5×10⁻²⁰ CO2 298(4 ± 1)×10−18 H2O 298 Becker et al., 1971 (e)
Comments
(a) Discharge flow system. O2(11) was monitored by dimol emission at 634 nm or from O2(16) emission at 762 nm.
(b) Large static reactor. O2(11) was monitored by emission at 1.27µm.
(c) O2 (11) was detected by time-resolved absorption at 144 nm.
(d) Flow system, with photolysis of C6H6-O2 mixtures at 253.7 nm to produce O2(11). O2(
11) was measured by 1.27µmemission.
(e) As (b) but using dimol emission at 634 nm.
Preferred Values
k = 1.6×10⁻¹⁸ cm3 molecule−1 s−1 for M = O2 at 298 K.k = 3.0×10⁻¹⁸ exp(−200/T ) cm3 molecule−1 s−1 for M = O2 over the temperature range 100–450 K.k ≤1.4×10⁻¹⁹ cm3 molecule−1 s−1 for M = N2 at 298 K.k = 5×10⁻¹⁸ cm3 molecule−1 s−1 for M = H2O at 298 K.k ≤2×10⁻²⁰ cm3 molecule−1 s−1 for M = CO2 at 298 K.
Reliability
1log k = ±0.2 for M = O2 at 298 K.1(E/R) = ±200 K for M = O2.1log k = ±0.3 for M = H2O at 298 K.
Comments on Preferred Values
The preferred value fork(M = O2) is based on the data of Borrell et al. (1977), Leiss et al. (1978), Raja et al. (1986)and Billington and Borrell (1986), which also gives the temperature dependence adopted. For other quenching gases therecommendation fork(M = N2) is based on the data of Collins et al. (1973), fork(M = H2O) on the data of Findlay andSnelling (1971) and Becker et al. (1971), and fork(M = CO2) on the data of Leiss et al. (1978) and Findlay and Snelling(1971).
www.atmos-chem-phys.org/acp/4/1461/ Atmos. Chem. Phys., 4, 1461–1738, 2004

1484 R. Atkinson et al.: Evaluated kinetic and photochemical data for Ox, HOx, NOx and SOx
References
Becker, K. H., Groth, W. and Schurath, U.: Chem. Phys. Lett., 8, 259, 1971.Billington A. P. and Borrell, P.: J. Chem. Soc. Faraday Trans. 2, 82, 963, 1986.Borrell, P., Borrell, P. M. and Pedley, M. B.: Chem. Phys. Lett., 51, 300, 1977.Collins, R. J., Husain, D. and Donovan, R. J.: J. Chem. Soc. Faraday Trans. 2, 69, 145, 1973.Findlay F. D. and Snelling, D. R.: J. Chem. Phys., 55, 545, 1971.Leiss, A., Schurath, U., Becker, K. H. and Fink, E. H.: J. Photochem., 8, 211, 1978.Raja, N., Arora, P.K. and. Chatha, J. P. S.: Int. J. Chem. Kinet., 18, 505, 1986.
Atmos. Chem. Phys., 4, 1461–1738, 2004 www.atmos-chem-phys.org/acp/4/1461/
R. Atkinson et al.: Evaluated kinetic and photochemical data for Ox, HOx, NOx and SOx 1485
I.A1.8
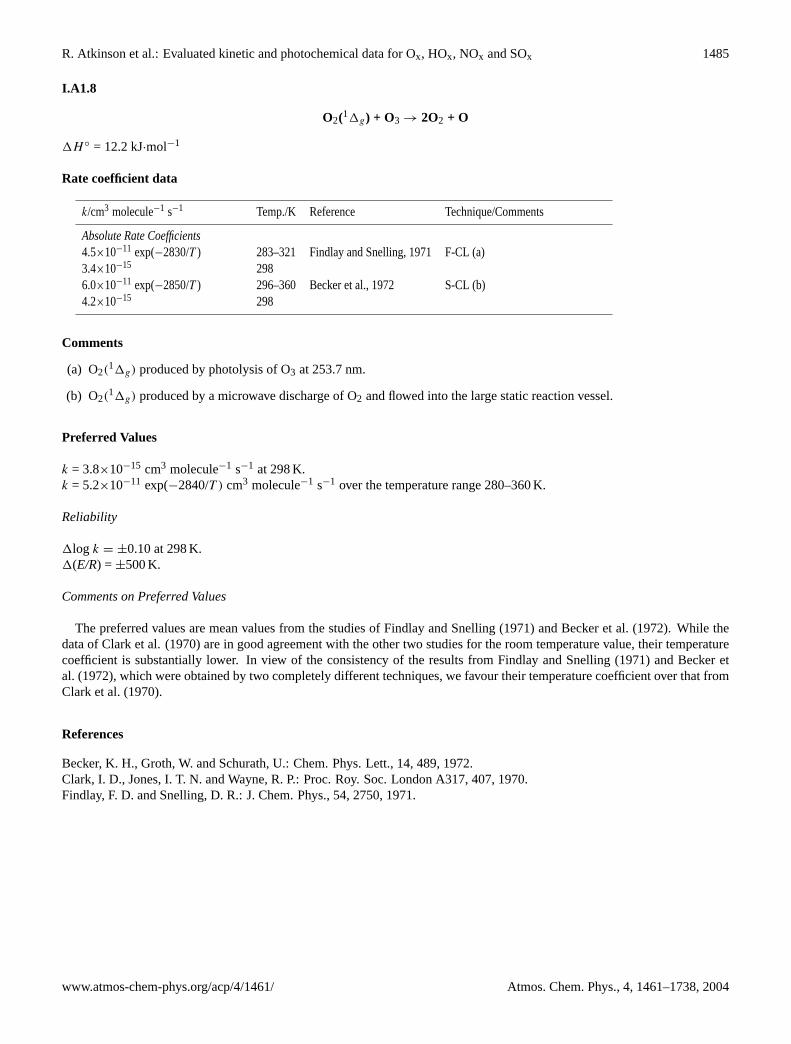
O2(11g) + O3 → 2O2 + O
1H ◦ = 12.2 kJ·mol−1
Rate coefficient data
k/cm3 molecule−1 s−1 Temp./K Reference Technique/Comments
Absolute Rate Coefficients4.5×10−11 exp(−2830/T ) 283–321 Findlay and Snelling, 1971 F-CL (a)3.4×10⁻¹⁵ 2986.0×10−11 exp(−2850/T ) 296–360 Becker et al., 1972 S-CL (b)4.2×10⁻¹⁵ 298
Comments
(a) O2(11g) produced by photolysis of O3 at 253.7 nm.
(b) O2(11g) produced by a microwave discharge of O2 and flowed into the large static reaction vessel.
Preferred Values
k = 3.8×10⁻¹⁵ cm3 molecule−1 s−1 at 298 K.k = 5.2×10⁻¹¹ exp(−2840/T ) cm3 molecule−1 s−1 over the temperature range 280–360 K.
Reliability
1log k = ±0.10 at 298 K.1(E/R) = ±500 K.
Comments on Preferred Values
The preferred values are mean values from the studies of Findlay and Snelling (1971) and Becker et al. (1972). While thedata of Clark et al. (1970) are in good agreement with the other two studies for the room temperature value, their temperaturecoefficient is substantially lower. In view of the consistency of the results from Findlay and Snelling (1971) and Becker etal. (1972), which were obtained by two completely different techniques, we favour their temperature coefficient over that fromClark et al. (1970).
References
Becker, K. H., Groth, W. and Schurath, U.: Chem. Phys. Lett., 14, 489, 1972.Clark, I. D., Jones, I. T. N. and Wayne, R. P.: Proc. Roy. Soc. London A317, 407, 1970.Findlay, F. D. and Snelling, D. R.: J. Chem. Phys., 54, 2750, 1971.
www.atmos-chem-phys.org/acp/4/1461/ Atmos. Chem. Phys., 4, 1461–1738, 2004

1486 R. Atkinson et al.: Evaluated kinetic and photochemical data for Ox, HOx, NOx and SOx
I.A1.9
O2(16+g ) + M → O2(36−
g ) + M (1)→ O2(11g) +M (2)
1H ◦(1) = −156.9 kJ·mol−1
1H ◦(2) = −62.6 kJ·mol−1
Rate coefficient data (k = k1 + k2)
k/cm3 molecule−1 s−1 M Temp./K Reference Technique/Comments
Absolute Rate Coefficients(4.6± 1)×10−17 O2 294 Thomas and Thrush, 1975 DF-CL4.6×10−12 H2O 294(4.0± 0.4)×10−17 O2 298 Martin et al., 1976 FP-CL(2.2± 0.1)×10−15 N2 298(3.8± 0.3)×10−17 O2 300 Lawton et al., 1977 FP-CL(2.5± 0.2)×10−17 O2 298 Chatha et al., 1979 DF-CL(1.7± 0.1)×10−15 N2 2981.7×10−15 exp(48/T ) N2 203–349 Kohse-Hoinghaus and Stuhl, 1980 PLP (a)(8.0± 2.0)×10−14 O 300 Slanger and Black, 1979 FP (a)4.4×10⁻¹³ CO2 298 Filseth et al., 1970 FP (a)(3.0± 0.5)×10−13 CO2 298 Noxon, 1970 FP (a)(4.1± 0.3)×10−13 CO2 298 Davidson et al., 1972 FP (a)(4.53± 0.29)×10−13 CO2 298 Aviles et al., 1980 PLP (a)(5.0± 0.3)×10−13 CO2 298 Muller and Houston, 1981 PLP (a)(3.4± 0.4)×10−13 CO2 293 Borrell et al., 1983 DF-CL(1.7± 0.1)×10−15 N2 298 Choo and Leu, 1985 DF (a,b)(4.6± 0.5)×10−13 CO2 245–2625.6×10−17 O2 302 Knickelbein et al., 1987 PLP (a)(2.2± 0.2)×10−15 N2 298 Wildt et al., 1988 PLP-CL (c)(2.4± 0.4)×10−13 CO2 298<1.0×10⁻¹⁶ O2 298 Shi and Barker, 1990 PLP-CL (d)(2.32± 0.14)×10−15 N2 298(4.0± 0.1)×10−13 CO2 298(4.25±0.52)×10−17 O2 295 Kebabian and Freeman, 1997 (e)
Comments
(a) Time-resolved emission from O2(16) measured near 762 nm.
(b) Negligible temperature dependence observed for quenching by CO2 over the range 245–362 K, withE/R< ± 200 K.
(c) Direct laser excitation of O2(16) from O2 by photolysis at 600–800 nm.
(d) O2(16) formed by the reaction O(1D) + O2 → O(3P) + O2(
16).
(e) Fluorescence following broadband excitation in an integrating sphere.
Atmos. Chem. Phys., 4, 1461–1738, 2004 www.atmos-chem-phys.org/acp/4/1461/
R. Atkinson et al.: Evaluated kinetic and photochemical data for Ox, HOx, NOx and SOx 1487
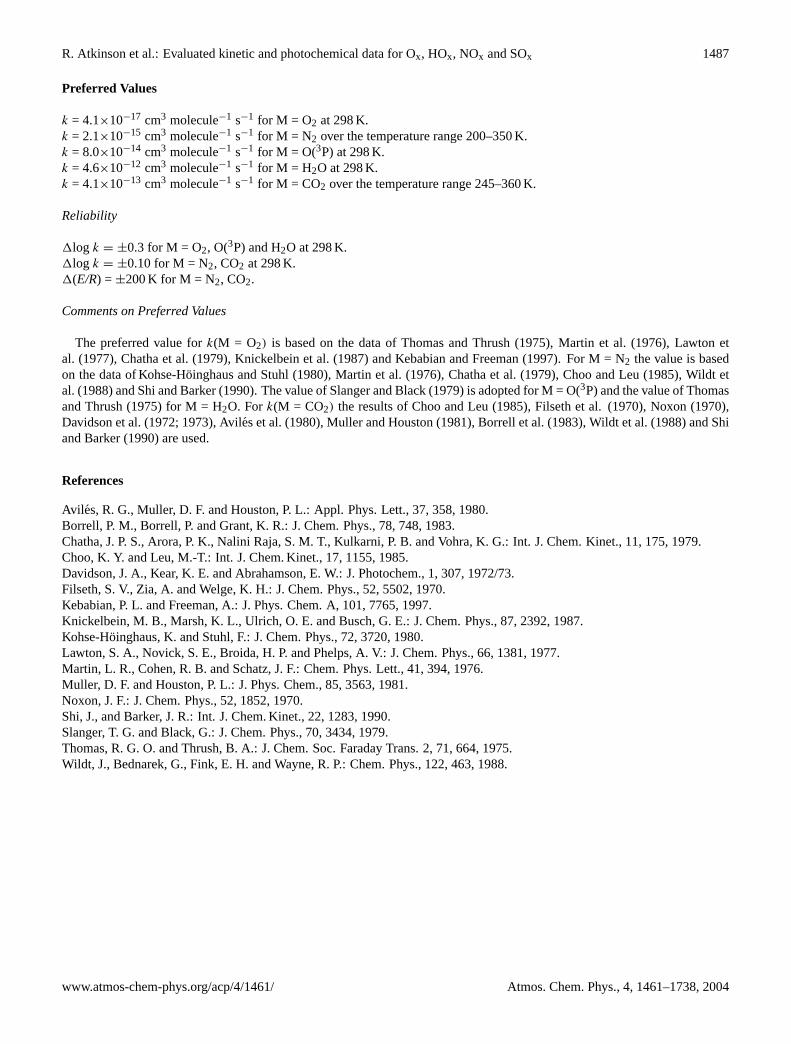
Preferred Values
k = 4.1×10⁻¹⁷ cm3 molecule−1 s−1 for M = O2 at 298 K.k = 2.1×10⁻¹⁵ cm3 molecule−1 s−1 for M = N2 over the temperature range 200–350 K.k = 8.0×10⁻¹⁴ cm3 molecule−1 s−1 for M = O(3P) at 298 K.k = 4.6×10⁻¹² cm3 molecule−1 s−1 for M = H2O at 298 K.k = 4.1×10⁻¹³ cm3 molecule−1 s−1 for M = CO2 over the temperature range 245–360 K.
Reliability
1log k = ±0.3 for M = O2, O(3P) and H2O at 298 K.1log k = ±0.10 for M = N2, CO2 at 298 K.1(E/R) = ±200 K for M = N2, CO2.
Comments on Preferred Values
The preferred value fork(M = O2) is based on the data of Thomas and Thrush (1975), Martin et al. (1976), Lawton etal. (1977), Chatha et al. (1979), Knickelbein et al. (1987) and Kebabian and Freeman (1997). For M = N2 the value is basedon the data of Kohse-Hoinghaus and Stuhl (1980), Martin et al. (1976), Chatha et al. (1979), Choo and Leu (1985), Wildt etal. (1988) and Shi and Barker (1990). The value of Slanger and Black (1979) is adopted for M = O(3P) and the value of Thomasand Thrush (1975) for M = H2O. Fork(M = CO2) the results of Choo and Leu (1985), Filseth et al. (1970), Noxon (1970),Davidson et al. (1972; 1973), Aviles et al. (1980), Muller and Houston (1981), Borrell et al. (1983), Wildt et al. (1988) and Shiand Barker (1990) are used.
References
Avil es, R. G., Muller, D. F. and Houston, P. L.: Appl. Phys. Lett., 37, 358, 1980.Borrell, P. M., Borrell, P. and Grant, K. R.: J. Chem. Phys., 78, 748, 1983.Chatha, J. P. S., Arora, P. K., Nalini Raja, S. M. T., Kulkarni, P. B. and Vohra, K. G.: Int. J. Chem. Kinet., 11, 175, 1979.Choo, K. Y. and Leu, M.-T.: Int. J. Chem. Kinet., 17, 1155, 1985.Davidson, J. A., Kear, K. E. and Abrahamson, E. W.: J. Photochem., 1, 307, 1972/73.Filseth, S. V., Zia, A. and Welge, K. H.: J. Chem. Phys., 52, 5502, 1970.Kebabian, P. L. and Freeman, A.: J. Phys. Chem. A, 101, 7765, 1997.Knickelbein, M. B., Marsh, K. L., Ulrich, O. E. and Busch, G. E.: J. Chem. Phys., 87, 2392, 1987.Kohse-Hoinghaus, K. and Stuhl, F.: J. Chem. Phys., 72, 3720, 1980.Lawton, S. A., Novick, S. E., Broida, H. P. and Phelps, A. V.: J. Chem. Phys., 66, 1381, 1977.Martin, L. R., Cohen, R. B. and Schatz, J. F.: Chem. Phys. Lett., 41, 394, 1976.Muller, D. F. and Houston, P. L.: J. Phys. Chem., 85, 3563, 1981.Noxon, J. F.: J. Chem. Phys., 52, 1852, 1970.Shi, J., and Barker, J. R.: Int. J. Chem. Kinet., 22, 1283, 1990.Slanger, T. G. and Black, G.: J. Chem. Phys., 70, 3434, 1979.Thomas, R. G. O. and Thrush, B. A.: J. Chem. Soc. Faraday Trans. 2, 71, 664, 1975.Wildt, J., Bednarek, G., Fink, E. H. and Wayne, R. P.: Chem. Phys., 122, 463, 1988.
www.atmos-chem-phys.org/acp/4/1461/ Atmos. Chem. Phys., 4, 1461–1738, 2004
1488 R. Atkinson et al.: Evaluated kinetic and photochemical data for Ox, HOx, NOx and SOx
I.A1.10
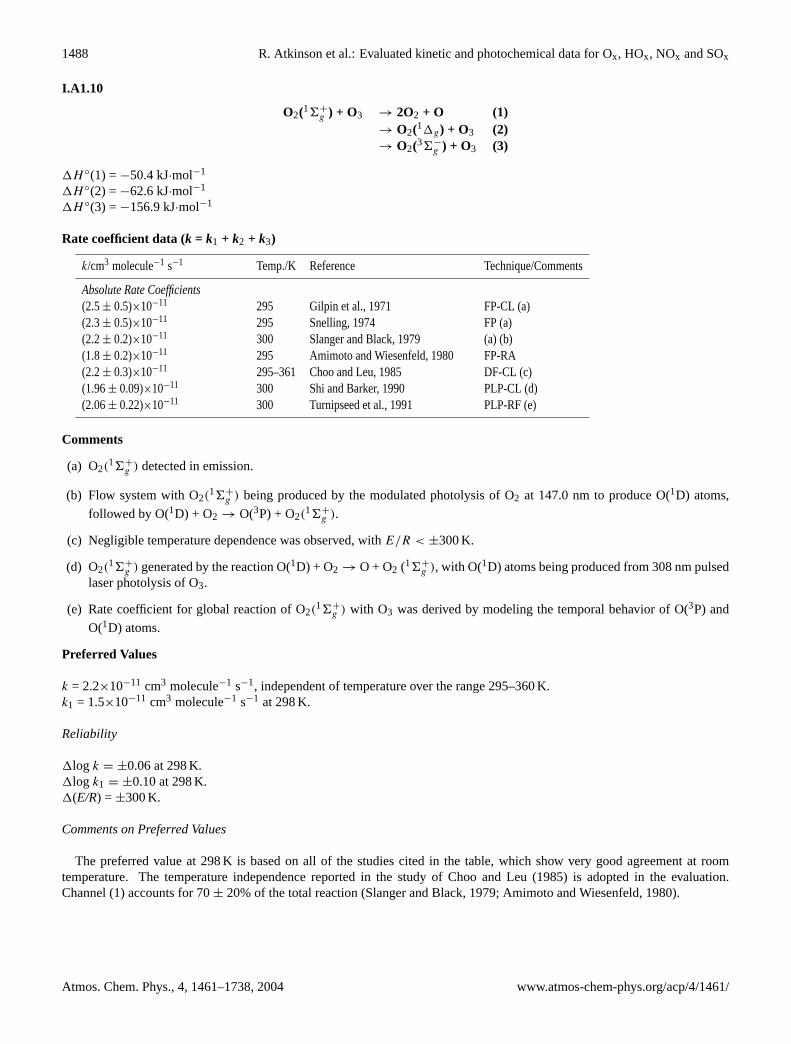
O2(16+g ) + O3 → 2O2 + O (1)
→ O2(11g) + O3 (2)→ O2(36−
g ) + O3 (3)
1H ◦(1) = −50.4 kJ·mol−1
1H ◦(2) = −62.6 kJ·mol−1
1H ◦(3) = −156.9 kJ·mol−1
Rate coefficient data (k = k1 + k2 + k3)
k/cm3 molecule−1 s−1 Temp./K Reference Technique/Comments
Absolute Rate Coefficients(2.5± 0.5)×10−11 295 Gilpin et al., 1971 FP-CL (a)(2.3± 0.5)×10−11 295 Snelling, 1974 FP (a)(2.2± 0.2)×10−11 300 Slanger and Black, 1979 (a) (b)(1.8± 0.2)×10−11 295 Amimoto and Wiesenfeld, 1980 FP-RA(2.2± 0.3)×10−11 295–361 Choo and Leu, 1985 DF-CL (c)(1.96± 0.09)×10−11 300 Shi and Barker, 1990 PLP-CL (d)(2.06± 0.22)×10−11 300 Turnipseed et al., 1991 PLP-RF (e)
Comments
(a) O2(16+
g ) detected in emission.
(b) Flow system with O2(16+g ) being produced by the modulated photolysis of O2 at 147.0 nm to produce O(1D) atoms,
followed by O(1D) + O2 → O(3P) + O2(16+
g ).
(c) Negligible temperature dependence was observed, withE/R < ±300 K.
(d) O2(16+
g ) generated by the reaction O(1D) + O2 → O + O2 (16+g ), with O(1D) atoms being produced from 308 nm pulsed
laser photolysis of O3.
(e) Rate coefficient for global reaction of O2(16+
g ) with O3 was derived by modeling the temporal behavior of O(3P) and
O(1D) atoms.
Preferred Values
k = 2.2×10⁻¹¹ cm3 molecule−1 s−1, independent of temperature over the range 295–360 K.k1 = 1.5×10⁻¹¹ cm3 molecule−1 s−1 at 298 K.
Reliability
1log k = ±0.06 at 298 K.1log k1 = ±0.10 at 298 K.1(E/R) = ±300 K.
Comments on Preferred Values
The preferred value at 298 K is based on all of the studies cited in the table, which show very good agreement at roomtemperature. The temperature independence reported in the study of Choo and Leu (1985) is adopted in the evaluation.Channel (1) accounts for 70± 20% of the total reaction (Slanger and Black, 1979; Amimoto and Wiesenfeld, 1980).
Atmos. Chem. Phys., 4, 1461–1738, 2004 www.atmos-chem-phys.org/acp/4/1461/
R. Atkinson et al.: Evaluated kinetic and photochemical data for Ox, HOx, NOx and SOx 1489
References
Amimoto, S. T. and Wiesenfeld, J. R.: J. Chem. Phys., 72, 3899, 1980.Choo, K. Y. and Leu, M.-T.: Int. J. Chem. Kinet., 17, 1155, 1985.Gilpin, R., Schiff, H. I. and Welge, K. H.: J. Chem. Phys., 55, 1087, 1971.Shi, J. and Barker, J. R.: Int. J. Chem. Kinet., 22, 1283, 1990.Slanger, T. G. and Black, G.: J. Chem. Phys., 70, 3434, 1979.Snelling, D. R.: Can. J. Chem., 52, 257, 1974.Turnipseed, A. A., Vaghjiani, G. L., Gierczak, T., Thompson, J. E. and Ravishankara, A. R.: J. Chem. Phys., 95, 3244, 1991.
www.atmos-chem-phys.org/acp/4/1461/ Atmos. Chem. Phys., 4, 1461–1738, 2004
1490 R. Atkinson et al.: Evaluated kinetic and photochemical data for Ox, HOx, NOx and SOx
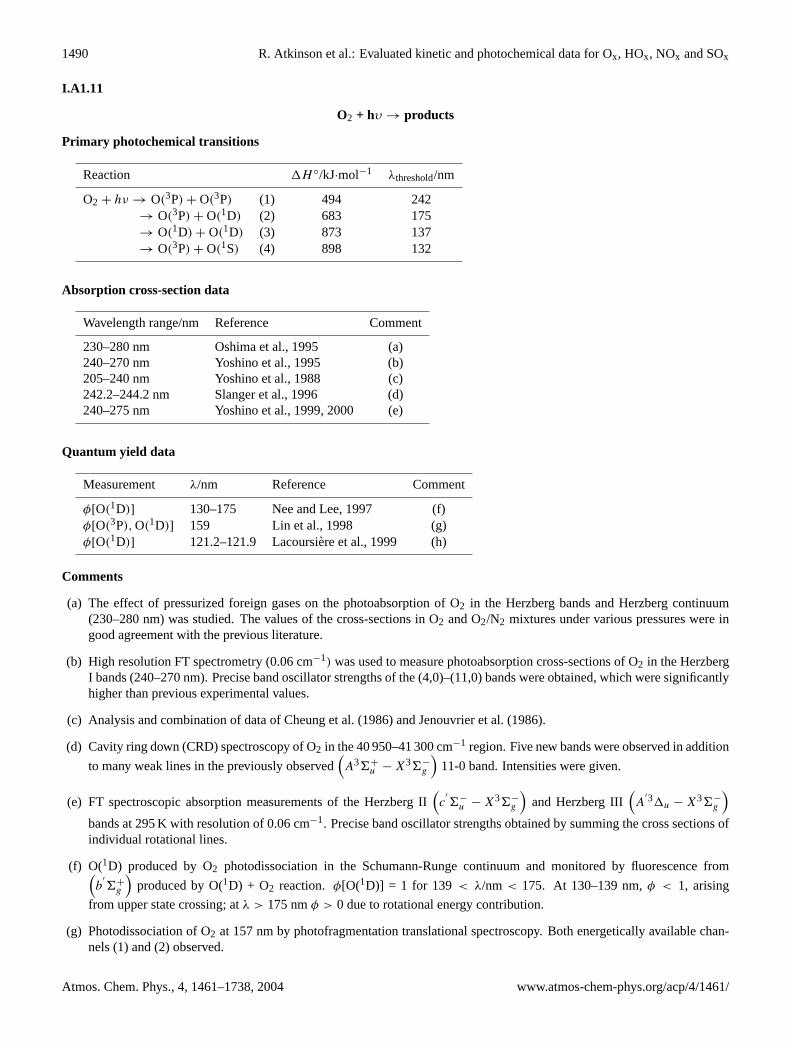
I.A1.11
O2 + hυ → products
Primary photochemical transitions
Reaction 1H ◦/kJ·mol−1 λthreshold/nm
O2 + hν → O(3P) + O(3P) (1) 494 242→ O(3P) + O(1D) (2) 683 175→ O(1D) + O(1D) (3) 873 137→ O(3P) + O(1S) (4) 898 132
Absorption cross-section data
Wavelength range/nm Reference Comment
230–280 nm Oshima et al., 1995 (a)240–270 nm Yoshino et al., 1995 (b)205–240 nm Yoshino et al., 1988 (c)242.2–244.2 nm Slanger et al., 1996 (d)240–275 nm Yoshino et al., 1999, 2000 (e)
Quantum yield data
Measurement λ/nm Reference Comment
φ[O(1D)] 130–175 Nee and Lee, 1997 (f)φ[O(3P), O(1D)] 159 Lin et al., 1998 (g)φ[O(1D)] 121.2–121.9 Lacoursiere et al., 1999 (h)
Comments
(a) The effect of pressurized foreign gases on the photoabsorption of O2 in the Herzberg bands and Herzberg continuum(230–280 nm) was studied. The values of the cross-sections in O2 and O2/N2 mixtures under various pressures were ingood agreement with the previous literature.
(b) High resolution FT spectrometry (0.06 cm−1) was used to measure photoabsorption cross-sections of O2 in the HerzbergI bands (240–270 nm). Precise band oscillator strengths of the (4,0)–(11,0) bands were obtained, which were significantlyhigher than previous experimental values.
(c) Analysis and combination of data of Cheung et al. (1986) and Jenouvrier et al. (1986).
(d) Cavity ring down (CRD) spectroscopy of O2 in the 40 950–41 300 cm−1 region. Five new bands were observed in addition
to many weak lines in the previously observed(A36+
u − X36−g
)11-0 band. Intensities were given.
(e) FT spectroscopic absorption measurements of the Herzberg II(c
′
6−u − X36−
g
)and Herzberg III
(A
′31u − X36−g
)bands at 295 K with resolution of 0.06 cm−1. Precise band oscillator strengths obtained by summing the cross sections ofindividual rotational lines.
(f) O(1D) produced by O2 photodissociation in the Schumann-Runge continuum and monitored by fluorescence from(b
′
6+g
)produced by O(1D) + O2 reaction. φ[O(1D)] = 1 for 139 < λ/nm < 175. At 130–139 nm,φ < 1, arising
from upper state crossing; atλ > 175 nmφ > 0 due to rotational energy contribution.
(g) Photodissociation of O2 at 157 nm by photofragmentation translational spectroscopy. Both energetically available chan-nels (1) and (2) observed.
Atmos. Chem. Phys., 4, 1461–1738, 2004 www.atmos-chem-phys.org/acp/4/1461/

R. Atkinson et al.: Evaluated kinetic and photochemical data for Ox, HOx, NOx and SOx 1491
(h) Tunable laser photolysis of O2 at spectral resolution of 1 cm−1 (1.5×10⁻³ nm). O(1D) yield in the envelope of the
H-Lyman∝ feature. Measurements monitored the emission from O2
(b
′
6+g
)at 762 nm produced by the quenching of
O(′D) by O2. φ(1D) was strongly wavelength dependent: 1.0 at 121.35 nm decreasing to a minimum of 0.48 near 121.62nm. Strong temperature dependence found, the minimum yield at 121.62 nm was 0.28 at 84 K.
Preferred Values
Absorption cross-section of O2 in the 205–240 nm region of the Herzberg continuum
λ/nm 1024σ /cm2 λ/nm 1024σ /cm2
205 7.35 223 3.89207 7.05 225 3.45209 6.68 227 2.98211 6.24 229 2.63213 5.89 231 2.25215 5.59 233 1.94217 5.13 235 1.63219 4.64 237 1.34221 4.26 239 1.10
240 1.01
Quantum Yields
φ1 = 1 for 242> λ > 175 nmφ2 = 1 for 175> λ > 139 nmφ2 = 0.44 forλ = 121.6 nm
Comments on Preferred Values
The recommended absorption cross-section values for the Herzberg continuum are taken from the study of Yoshino etal. (1988), where values are tabulated for every nm from 205–240 nm. These values were derived from an analysis and combi-nation of the data of Cheung et al. (1986) and Jenouvrier et al. (1986). These data are in agreement with the results of Johnstonet al. (1984), and are consistent with the lower absorption cross-section values inferred from balloon-borne measurements ofsolar irradiance attenuation in the stratosphere by Frederick and Mentall (1982), Herman and Mentall (1982) and Andersonand Hall (1983; 1986). Herzberg continuum cross-section values under the S-R bands (< 200 nm) have been determined moreaccurately by Yoshino et al. (1992) and are significantly smaller than any previous values. The data from Oshima et al. (1995),Yoshino et al. (1995), Slanger et al. (1996) and Yoshino et al. (1999; 2000) relate to the Herzberg bound system in the regionbeyond the photodissociation threshold for O2, and do not affect the preferred cross-sections for the photolysis of atmosphericO2.
In the Schumann-Runge wavelength region (175–200 nm), a detailed analysis of the penetration of solar radiation requiresabsorption cross-section measurements with very high spectral resolution. Absorption cross-section values for the (0, 0)–(12, 0) S-R bands measured by the Harvard-Smithsonian group (Yoshino et al., 1983; 1984; 1987; 1989; 1990; Cheung etal., 1984; 1989; 1990 and Chi et al., 1990), are the first set of values which are independent of instrumental resolution. Bandoscillator strengths for these bands have been determined by direct numerical integration of these absolute cross-section values.Minschwaner et al. (1992; 1993) have fitted O2 cross-sections for the frequency range 49 000–57 000 cm−1 (175–204 nm) withtemperature-dependent polynomial expressions for the temperature range 130–500 K using the latest laboratory spectroscopicdata. This model provides an efficient and accurate means of determining S-R band absorption cross-sections at 0.5 cm−1
resolution. These high resolution calculated values differ from the WMO (1986) recommendations by up to 10–20% at somewavelengths. Mean-band parameterizations of O2 absorption in the S-R bands for calculating UV transmission and photolysisrates have been presented by Murtagh (1988) and by Nicolet and Kennes (1989).
The effect on ozone formation in the 214 nm photolysis of oxygen due to O2-O2 collision pairs at high O2 pressure and theeffect of high N2 pressure has been studied by Horowitz et al. (1990). Greenblatt et al. (1990) studied the absorption spectrum
www.atmos-chem-phys.org/acp/4/1461/ Atmos. Chem. Phys., 4, 1461–1738, 2004

1492 R. Atkinson et al.: Evaluated kinetic and photochemical data for Ox, HOx, NOx and SOx
of O2 and O2-O2 collision pairs over the wavelength range 330–140 nm for O2 pressures from 1 to 55 bar at 298 K. Bandcenters, band widths, and absorption cross-sections were reported for the absorption features in this wavelength region (Lee etal., 1977).
At λ < 242 nm O2 dissociates with unit quantum efficiency. Below the threshold for O(1D) production (reaction (2)) twoground state O atoms are produced, but above this wavelength both O(3P) and O(1D) are produced (Lin et al., 1998). The workof Nee and Lee (1997) showed thatφ(2) = 1 in the range 175–139 nm based on measurement of O(1D) production. This workalso confirmed thatφ(O1D) showed sharp variations at shorter wavelengths as observed in earlier work by Lee et al. (1977)who also reported a value ofφ(2) = 0.44± 0.05 for absorption of Lyman-∝ at 121.6 nm. A detailed study (Lacoursiere et al.,1999) of O(1D) production over the entire H Lyman-∝ profile using a tunable VUV laser source has confirmed that a strongwavelength dependence of O(1D) exists in this region.
References
Anderson, G. P. and Hall, L. A.: J. Geophys. Res., 88, 6801, 1983; 91, 14 509, 1986.Cheung, A. S. C.,Yoshino, K., Parkinson, W. H. and D. E. Freeman, Canad. J. Phys., 62, 1752, 1984.Cheung, A. S. C., Yoshino, K., Parkinson, W. H., Guberman, S. L. and Freeman, D. E.: Planet. Space Sci., 34, 1007, 1986.Cheung, A. S. C., Yoshino, K., Freeman, D. E., Friedman, R. S., Dalgarno, A. and Parkinson, W. H.: J. Mol. Spectrosc., 134,362, 1989.Cheung, A. S. C., Yoshino, K., Esmond, J. R., Chiu, S. S. L., Freeman D. E. and Parkinson, W. H.: J. Chem. Phys., 92, 842,1990.Chiu, S. S. L., Cheung, A. S. C., Yoshino, K., Esmond, J. R., Freeman, D. E. and Parkinson, W. H.: J. Chem. Phys., 93, 5539,1990.Frederick, J. E. and Mentall, J. E.: Geophys. Res. Lett., 9, 461, 1982.Greenblatt, G. D., Orlando, J. J., Burkholder, J. B. and Ravishankara, A. R.: J. Geophys. Res., 95, 18 577, 1990.Herman, J. R. and Mentall, J. E.: J. Geophys. Res., 87, 8967, 1982.Horowitz, A., Schneider, W. and Moortgat, G. K.: J. Phys. Chem., 93, 7859, 1989; 94, 2904, 1990.Jenouvrier, A., Coquart, B. and Merienne, M. F.:J. Quant. Spectrosc. Radiat. Transfer, 36, 349, 1986.Johnston, H. S., Paige, M., and Yao, F.: J. Geophys. Res., 89, 11 661, 1984.Lacoursiere, J., Meyer, S. A., Faris, G. W., Slanger, T. G., Lewis, B. R. and Gibson, S. T.: J. Chem. Phys., 110, 1949, 1999.Lee, L. C., Slanger, T. G., Black G. and Sharpless, R. L.: J. Chem. Phys., 67, 5602, 1977.Lin, J. J., Huang, D. W., Lee Y. T. and Yang, X.:J. Chem. Phys., 109, 1758, 1998.Minschwaner, K., Anderson, G. P., Hall, L. A. and Yoshino, K.: J. Geophys. Res., 97, 10 103, 1992.Minschwaner, K., Salawitch, R. J. and McElroy, M. B.: J. Geophys. Res., 98, 10 543, 1993.Murtagh, D. P.: Planet. Space Sci., 36, 819, 1988.Nee, J. B. and Lee, P. C.: J. Phys. Chem. A, 101, 6653, 1997.Nicolet, M. and Kennes, R.: Planet. Space Sci., 37, 459, 1989.Oshima, Y., Okamoto, Y. and Koda, S: J. Phys. Chem., 99, 11 830, 1995.Slanger, T. G., Huestis, D. L., Cosby, P. C., Naus, N. and Meijer, G.: J. Chem. Phys., 105, 9393, 1996.WMO, “Atmospheric Ozone 1985, “World Meteorological Organization, Geneva, Switzerland, Global Ozone Research andMonitoring Project: Report No. 16, Chapter 7, 1986.Yoshino, K., Freeman, D. E., Esmond, J. R. and Parkinson, W. H.: Planet. Space Sci., 31, 339, 1983.Yoshino, K. Freeman, D. E. and Parkinson, W. H.: J. Phys. Chem. Ref. Data, 13, 207, 1984.Yoshino, K., Freeman, D. E., Esmond, J. R. and Parkinson, W. H.: Planet. Space Sci., 35, 1067, 1987.Yoshino, K., Cheung, A. S. C., Esmond, J. R., Parkinson, W. H., Freeman, D. E., Guberman, S. L., Jenouvrier, A., Coquart, B.and Merienne, M. F.: Planet. Space Sci., 36, 1469, 1988.Yoshino, K., Freeman, D. E., Esmond, J. R., Friedman, R. S. and Parkinson, W. H.: Planet. Space Sci., 36, 1201, 1988; 37,419, 1989.Yoshino,K., Esmond, J. R., Cheung, A. S. C., Freeman, D. E. and Parkinson, W. H.: J. Geophys. Res., 95, 11 743, 1990.Yoshino, K., Esmond, J. R., Cheung, A. S. C., Freeman, D. E. and Parkinson, W. H.: Planet. Space Sci., 40, 185, 1992.Yoshino, K., Esmond, J. R., Murray, J. E., Parkinson, W. H., Thorne, A. P., Learner, R. C. M. and Cox, G.: J. Chem. Phys.,103, 1243, 1995.Yoshino, K., Esmond, J. R., Parkinson, W. H., Thorne, A. P., Learner, R. C. M. and Cox, G.: J. Chem. Phys., 111, 2960, 1999.Yoshino, K., Esmond, J. R., Parkinson, W. H., Thorne, A. P., Learner, R. C. M., Cox, G. and Cheung, A. S. C.: J. Chem. Phys.,112, 9791, 2000.
Atmos. Chem. Phys., 4, 1461–1738, 2004 www.atmos-chem-phys.org/acp/4/1461/
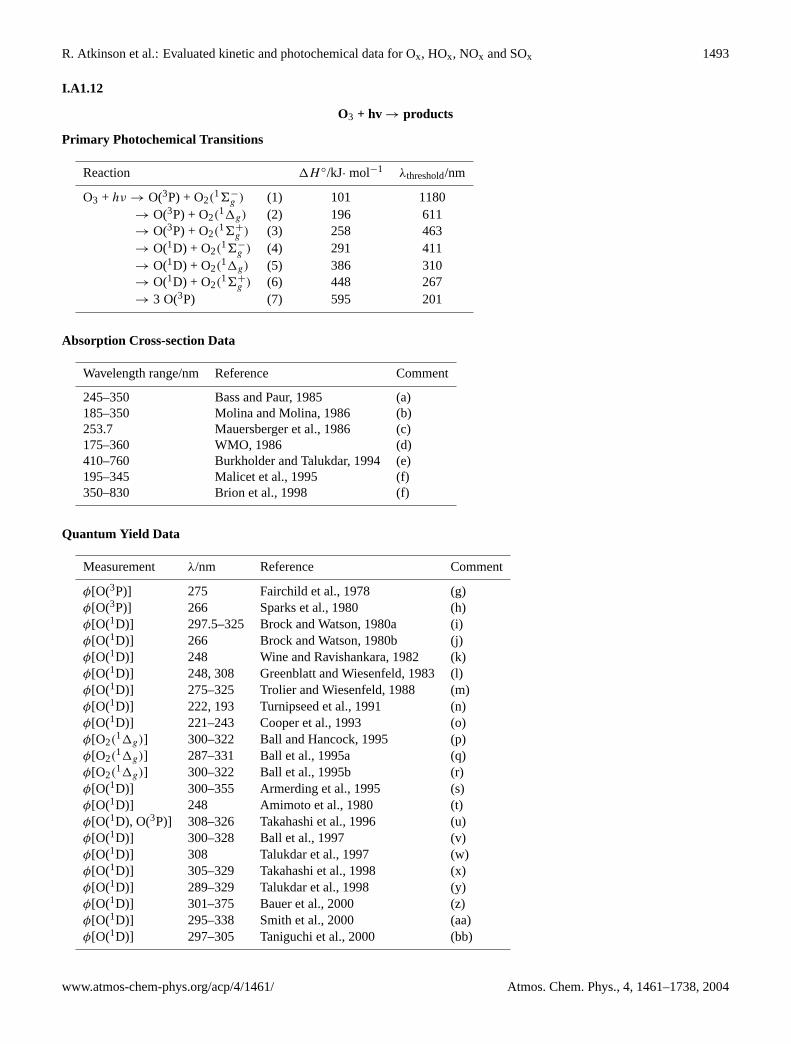
R. Atkinson et al.: Evaluated kinetic and photochemical data for Ox, HOx, NOx and SOx 1493
I.A1.12
O3 + hv → products
Primary Photochemical Transitions
Reaction 1H ◦/kJ· mol−1 λthreshold/nm
O3 + hν → O(3P) + O2(16−
g ) (1) 101 1180→ O(3P) + O2(
11g) (2) 196 611→ O(3P) + O2(
16+g ) (3) 258 463
→ O(1D) + O2(16−
g ) (4) 291 411→ O(1D) + O2(
11g) (5) 386 310→ O(1D) + O2(
16+g ) (6) 448 267
→ 3 O(3P) (7) 595 201
Absorption Cross-section Data
Wavelength range/nm Reference Comment
245–350 Bass and Paur, 1985 (a)185–350 Molina and Molina, 1986 (b)253.7 Mauersberger et al., 1986 (c)175–360 WMO, 1986 (d)410–760 Burkholder and Talukdar, 1994 (e)195–345 Malicet et al., 1995 (f)350–830 Brion et al., 1998 (f)
Quantum Yield Data
Measurement λ/nm Reference Comment
φ[O(3P)] 275 Fairchild et al., 1978 (g)φ[O(3P)] 266 Sparks et al., 1980 (h)φ[O(1D)] 297.5–325 Brock and Watson, 1980a (i)φ[O(1D)] 266 Brock and Watson, 1980b (j)φ[O(1D)] 248 Wine and Ravishankara, 1982 (k)φ[O(1D)] 248, 308 Greenblatt and Wiesenfeld, 1983 (l)φ[O(1D)] 275–325 Trolier and Wiesenfeld, 1988 (m)φ[O(1D)] 222, 193 Turnipseed et al., 1991 (n)φ[O(1D)] 221–243 Cooper et al., 1993 (o)φ[O2(
11g)] 300–322 Ball and Hancock, 1995 (p)φ[O2(
11g)] 287–331 Ball et al., 1995a (q)φ[O2(
11g)] 300–322 Ball et al., 1995b (r)φ[O(1D)] 300–355 Armerding et al., 1995 (s)φ[O(1D)] 248 Amimoto et al., 1980 (t)φ[O(1D), O(3P)] 308–326 Takahashi et al., 1996 (u)φ[O(1D)] 300–328 Ball et al., 1997 (v)φ[O(1D)] 308 Talukdar et al., 1997 (w)φ[O(1D)] 305–329 Takahashi et al., 1998 (x)φ[O(1D)] 289–329 Talukdar et al., 1998 (y)φ[O(1D)] 301–375 Bauer et al., 2000 (z)φ[O(1D)] 295–338 Smith et al., 2000 (aa)φ[O(1D)] 297–305 Taniguchi et al., 2000 (bb)
www.atmos-chem-phys.org/acp/4/1461/ Atmos. Chem. Phys., 4, 1461–1738, 2004

1494 R. Atkinson et al.: Evaluated kinetic and photochemical data for Ox, HOx, NOx and SOx
Comments
(a) Measured at 226–298 K with spectral resolution of 0.07 nm.
(b) Measured at 200–300 K with spectral resolution of 0.025 nm. Relative values normalised to a value of 1147×10−20cm2
at the 253.65 nm mercury line.
(c) Measured at 297 K and later (Barnes and Mauersberger, 1987) at 195–351 K on the 253.65 nm mercury line.
(d) Critical review of all published data. Recommended values given for standard spectral intervals from 175–360 nm for 203and 273 K.
(e) Measured with a diode array. Cross-sections independent of temperature.
(f) Absolute cross sections for O3 absorption in the range 195–345 nm measured at high resolution (1λ = 0.01–0.02 nm)using a conventional absorption cell-monochromator combination, with ozone measured manometrically. The temperaturedependence of the absorption in the Hartley and Huggins bands was also measured over the range 218–295 K. A smallincrease inσ with decreasing temperature (1.0% over the whole temperature range) was observed atλ = 253.65 nm, nearthe maximum in the Hartley band; at 298 K,σ (253.65 nm) = (113.05± 1.1)×10−19 cm2 molecule−1. In the Hugginsbands (300–345 nm) there is a larger temperature dependence (up to 50%), which increases progressively to longerwavelengths. In contrast to the Hartley band there is a decrease inσ with decreasing temperature. The second paperfrom this group presents absorption spectra measurements for the ozone molecule in the 350–830 nm region, includingthe Chappuis bands.
(g) Photofragment spectroscopy of O3: co-product is O2(36−); φ(1) = 0.1.
(h) High resolution photofragment spectroscopy givingφ(1) = 0.1.
(i) Laser photolysis of O3-N2O mixture: NO product of O(1D) reaction with N2O measured by chemiluminescence fromNO2.
(j) Laser flash photolysis: O(3P) by RF;φ(1) = 0.12±0.02 at 266 nm.
(k) Laser flash photolysis: O(3P) by RF;φ(1) = 0.093±0.028 at 248 nm.
(l) Laser photolysis at 248 nm and 308 nm: O(3P) by RF;φ[O(1D)] = 0.94±0.01 at 248 nm,φ[O(1D)] = 0.79±0.02 at 308nm.
(m) Laser photolysis of O3-N2O mixtures: O(1D) quenching by CO2 monitored by infrared chemiluminescence from CO2.
(n) Laser photolysis: O(3P) by RF;φ[O(3P)] = 0.12±0.02;φ[O(1D)] = 0.87 at 222 nm.
(o) Laser photolysis: O(1D) detected by weak 630 nm fluorescence emission from O(1D) → O(3P). Relativeφ[O(1D)]normalised toφ[(O1D)] = 0.87 at 222 nm of Turnipseed et al. (1991).
(p) Relative quantum yields of O2(11) from laser photolysis of O3 in the range 300< λ < 322 nm measured by [2 + 1]resonance enhanced multiphoton ionisation (REMPI) at 227K. Forλ > 309 nm,φ[O2(
11)] at 227 K falls more rapidlythan observed at 298K (Ball et al., 1993) confirming that internal energy of O3 contributes to formation of O2(11), justbeyond the 310 nm threshold for spin allowed production of the two singlet products of channel (5). Atλ > 320 nm,φ[O2(
11)] was approximately equal at the two temperatures, and substantially larger than the then current measurementsof φ(O1D) suggesting a spin-forbidden channel for O2(11) production, e.g. channel (2), withφ(2) = 0.1 at 320 nm.
(q) Kinetic energies of the O2(11) fragment of O3 photolysis in the range 287.57 and 331.52 nm measured by time-of-flightmass spectrometry. Between 308 and 318 nm dissociation is dominated by the spin allowed dissociation channel (5). Atlonger wavelengths, photofragments with higher kinetic energies are produced, consistent with the occurrence of the spinforbidden process, channel (2).
(r) Data forφ[O2(11)] temperature dependence reported in earlier publications (Ball and Hancock, 1995; Ball et al., 1993;
1995a) were compared with earlier data forφ[O(1D)]. At 300–309 nm there is no temperature dependence of the yield ofeither photo-product. In the fall-off region, 307–319 nm, there is good agreement between the measured yields of O2(
11)
and modelling calculations by Michelson et al. (1994) which take into account dissociation of internally excited ozonemolecules for the formation of O(1D).
Atmos. Chem. Phys., 4, 1461–1738, 2004 www.atmos-chem-phys.org/acp/4/1461/

R. Atkinson et al.: Evaluated kinetic and photochemical data for Ox, HOx, NOx and SOx 1495
(s) φ[O(1D)] in the wavelength range 300–330 nm and at 355 nm determined indirectly by observation of the LIF of OHproduced by the reaction of photofragment O(1D) with H2O.φ[O(1D)] was determined to be unity at 302.5 nm decreasingto 0.6 at 310 nm with a characteristic ’saddle’ point at 315 nm and with a long wavelength tail extending to a thresholdbetween 331 and 333 nm. No O(1D) was detected at 355 nm.
(t) Laser flash photolysis: O(3P) by RA;φ(1) = 0.15±0.02 at 248 nm.
(u) The photofragment yield spectra of O(1D) and O(3P) produced in the photodissociation of O3 in the Huggins band systemover the range 308–326 nm were determined using vacuum ultraviolet LIF. The O(3P) yield exhibited vibrational structureas in the absorption spectrum in the Huggins band, whilst O(1D) showed a smooth dependence on wavelength. Thequantum yield of O(1D) was calculated assumingφ[O(1D) + O(3P)] = 1. Using the absorption spectrum of Molina andMolina (1986),φ[O(1D)] showed a distinct ’tail’ for the region beyond the threshold for channel (5) at 310 nm, as hadbeen reported in some previous studies (Brock and Watson, 1980a; Trolier and Wiesenfield, 1988), and in the co-productfrom the spin allowed channel (5), O2(11), reported by Ball and Hancock (1995) and Ball et al. (1993; 1995a; 1995b).The ’tail’ in φ[O(1D)] in the wavelength range 310–321 nm is attributed to hot band excitation of the repulsive limb ofthe excited state (1B2 or 2A1) correlating with the singlet products. The non-zero formation of O(1D) atλ > 321 nm wastentatively attributed to the spin forbidden process producing O(1D) + O2 (36−
g ).
(v) Relative quantum yields of O(1D) determined by REMPI detection of O(1D) following laser photolysis of O3 between300 and 328 nm. Results confirm the tail in the quantum yield extending to wavelengths beyond the thermodynamicthreshold at 310 nm, which is attributed to the occurrence of both spin allowed and spin forbidden processes. Absolutequantum yields were obtained by normalisation to a constant value ofφ = 0.95 in the range 300–305 nm as recommendedby NASA (1997).
(w) Temperature dependence of quantum yields of O(1D) following laser photolysis of O3 at 308 nm and 248 nm between200–320 K. O(1D) determined indirectly by 1) conversion to O(3P) followed by RF detection; 2) conversion to HO/D,followed by LIF detection. At 308 nm,φ[O(1D)] decreased very slightly with temperature from 0.79 at 298 K to 0.73 at200 K, whilst at 248 nmφ[O(1D)] was independent of temperature.
(x) Wavelength and temperature dependence of quantum yields of O(1D) following laser photolysis of O3 between 305–329nm and at 295 and 227 K. The photofragment yield spectra of O(1D) and O(3P) were determined using vacuum ultravioletLIF and converted to absolute quantum yields by matching to the O3 absorption spectrum of Malicet et al. (1995) at thetwo temperatures and assumingφ[O(1D) + O(3P)] = 1. Doppler profiles of nascent O(1D) were measured, providinginformation on the dissociation processes. The results are consistent with a dominant hot band contribution at 310< λ <
321 nm, and with occurrence of the spin-forbidden process atλ > 318 nm producing O(1D) + O2(36−
g ) with φ = 0.08.
(y) Temperature and wavelength dependence of quantum yields of O(1D) following laser photolysis of O3 between 289–329nm at 203–320 K. O(1D) determined indirectly by 1) conversion to O(3P) followed by RF detection; 2) conversion toOH/OD followed by LIF detection. Absolute values ofφ[O(1D)] were based on a value ofφ = 0.79 at 308 nm, andtemperature independent values ofφ = 0.89±0.02 at 289< λ < 305 nm andφ = 0.06 for the spin-forbidden process atλ > 318 nm.
(z) Relative quantum yields for O(1D) between 305 and 375 nm at 298 and 273 K. O(1D) measured indirectly via LIF detec-tion of vibrationally excited HO produced in O(1D) + H2 reaction. Use of blue shifted LIF gave high detection sensitivityand eliminated probe laser interference. Significant temperature dependent O(1D) quantum yield atλ = 310–325 nmconfirmed. Between 325 and 375 nm a temperature independent quantum yield ofφ = 0.064±0.006 observed, which isassigned to the spin-forbidden channel (4). This study supersedes and extends earlier work by this group published bySilvente et al. (1997) which reached similar conclusions.
(aa) Quantum yields for O(1D) from broadband photolysis of ozone in wavelength range 295–338 nm and temperatures 226–298 K. O(1D) detected by CIMS and absolute quantum yields were based on a value ofφ = 0.79 at 308 nm. Atλ =312–324 nm the O(1D) quantum yield was temperature dependent. Between 328 and 338 nm a temperature independentquantum yield ofφ ∼ 0.12 was observed, which is assigned to the spin-forbidden channel (4).
(bb) Wavelength dependence of quantum yields of O(1D) following laser photolysis of O3 between 297–316 nm and at 295 K.The photofragment yield spectra of O(1D) and O(3P) were determined using vacuum ultraviolet LIF. The photofrag-ment yield spectra of O(3P) were used to determine quantum yields of O(1D) between 297–305 nm, which were almostindependent of photolysis wavelength in this range (φ = 0.89).
www.atmos-chem-phys.org/acp/4/1461/ Atmos. Chem. Phys., 4, 1461–1738, 2004
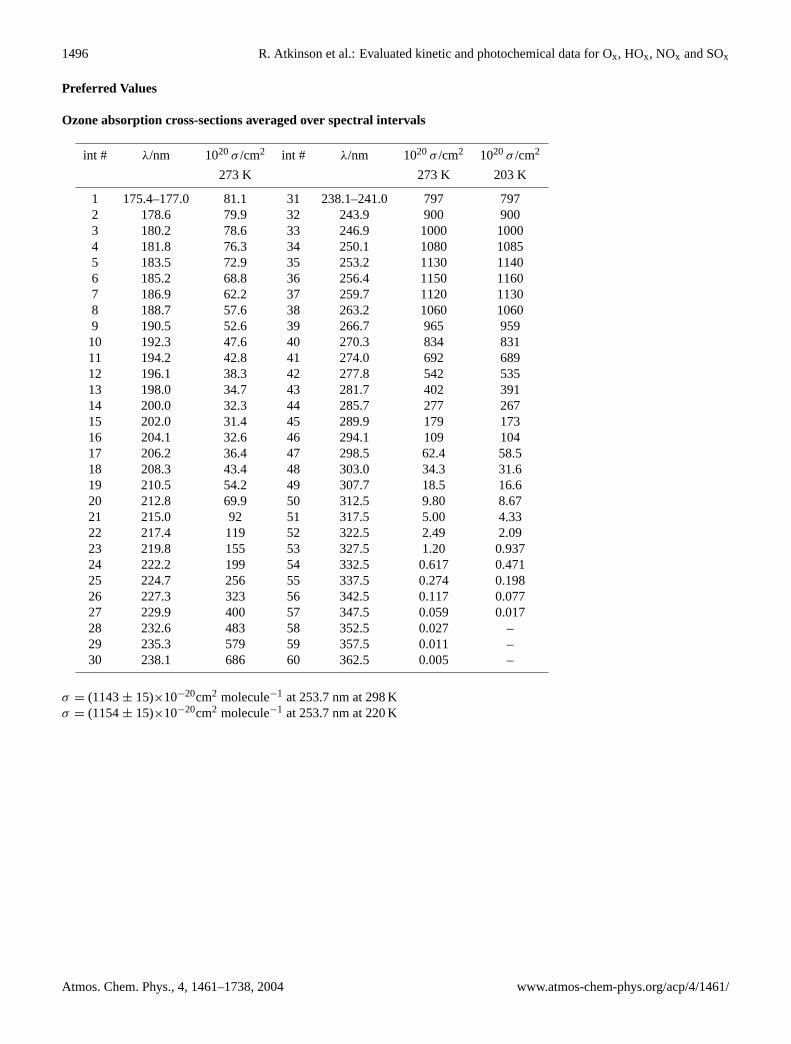
1496 R. Atkinson et al.: Evaluated kinetic and photochemical data for Ox, HOx, NOx and SOx
Preferred Values
Ozone absorption cross-sections averaged over spectral intervals
int # λ/nm 1020σ /cm2 int # λ/nm 1020σ /cm2 1020σ /cm2
273 K 273 K 203 K
1 175.4–177.0 81.1 31 238.1–241.0 797 7972 178.6 79.9 32 243.9 900 9003 180.2 78.6 33 246.9 1000 10004 181.8 76.3 34 250.1 1080 10855 183.5 72.9 35 253.2 1130 11406 185.2 68.8 36 256.4 1150 11607 186.9 62.2 37 259.7 1120 11308 188.7 57.6 38 263.2 1060 10609 190.5 52.6 39 266.7 965 95910 192.3 47.6 40 270.3 834 83111 194.2 42.8 41 274.0 692 68912 196.1 38.3 42 277.8 542 53513 198.0 34.7 43 281.7 402 39114 200.0 32.3 44 285.7 277 26715 202.0 31.4 45 289.9 179 17316 204.1 32.6 46 294.1 109 10417 206.2 36.4 47 298.5 62.4 58.518 208.3 43.4 48 303.0 34.3 31.619 210.5 54.2 49 307.7 18.5 16.620 212.8 69.9 50 312.5 9.80 8.6721 215.0 92 51 317.5 5.00 4.3322 217.4 119 52 322.5 2.49 2.0923 219.8 155 53 327.5 1.20 0.93724 222.2 199 54 332.5 0.617 0.47125 224.7 256 55 337.5 0.274 0.19826 227.3 323 56 342.5 0.117 0.07727 229.9 400 57 347.5 0.059 0.01728 232.6 483 58 352.5 0.027 –29 235.3 579 59 357.5 0.011 –30 238.1 686 60 362.5 0.005 –
σ = (1143± 15)×10−20cm2 molecule−1 at 253.7 nm at 298 Kσ = (1154± 15)×10−20cm2 molecule−1 at 253.7 nm at 220 K
Atmos. Chem. Phys., 4, 1461–1738, 2004 www.atmos-chem-phys.org/acp/4/1461/

R. Atkinson et al.: Evaluated kinetic and photochemical data for Ox, HOx, NOx and SOx 1497
Ozone absorption cross-sections in the visible spectral region∗
λ/nm 1023σ /cm2 λ/nm 1023σ /cm2
410 1.2 560 394420 2.2 580 459440 11.2 600 511460 32.8 620 400480 68.4 640 296500 122 660 209520 182 680 136540 291 700 91
σ is independent of temperature in the region 410–700 nm.∗ Values are for specific wavelengths given; they are not averaged over wavelength ranges.
Quantum Yields for O(1D) production from O 3 photolysis at 298 K
Wavelength/nm φ[O(1D)] Wavelength/nm φ[O(1D)]
305 0.900 317 0.222306 0.884 318 0.206307 0.862 319 0.187308 0.793 320 0.166309 0.671 321 0.146310 0.523 322 0.128311 0.394 323 0.113312 0.310 324 0.101313 0.265 325 0.092314 0.246 326 0.086315 0.239 327 0.082316 0.233 328 0.080
220< λ/nm<305:φ[O(1D)] = 0.90;φ[O(3P)] = 0.10330< λ/nm<370:φ[O(1D)] = 0.08;φ[O(3P)] = 0.92
Temperature dependence of Quantum Yields for O(1D) production from O 3 photolysis
For 306< λ/nm< 328 and 200< T /K < 320:
φ (λ, T ) =
{q1
q1 + q2
}× A1 × exp
{−
(X1 − λ
ω1
)4}
+
{q2
q1 + q2
}× A2 ×
{T
300
}2
exp
{−
(X2 − λ
ω2
)2}
+ A3 ×
{T
300
}1.5
exp
{−
(X3 − λ
ω3
)2}
+ c
whereqi = exp(−
νi
RT
)A1 = 0.8036;A2 = 8.9061; A3 = 0.1192; X1 = 304.225;X2 = 314.957; X3 = 310.737;ω1 = 5.576; ω2 = 6.601;ω3 = 2.187; ν1 = 0; ν2 = 825.518; c = 0.0765;We recommend this expression for use in the wavelength and temperature range given above. It should not be used outside thisrange.φ[O(1D)] is independent of temperature in the range 220< λ/nm< 305 and 330< λ/nm< 370.
www.atmos-chem-phys.org/acp/4/1461/ Atmos. Chem. Phys., 4, 1461–1738, 2004

1498 R. Atkinson et al.: Evaluated kinetic and photochemical data for Ox, HOx, NOx and SOx
Comments on Preferred Values
Absorption cross-sections
The recommended absorption cross-section values at 273 K for the wavelength range 175–362 nm are averaged valuesfor the standard spectral intervals used in atmospheric modelling calculations. These values have been adopted from earlierevaluations (NASA, 1997; IUPAC, 1997) which accepted the values tabulated in the WMO 1986 review, except for the region185–225 nm where the values were taken from the study of Molina and Molina (1986). Recommended values at 203 K in theHuggins bands are also taken from the WMO (1986) review and are based on the data of Bass and Paur (1985).
The new work of Malicet et al. (1995) provides detailed data on the absolute absorption cross sections of ozone and theirtemperature dependence (218–295 K) over the wavelength range 195–345 nm. The measurements are at sufficient resolution toresolve the vibrational structure in the Huggins bands. The data are generally in excellent agreement with earlier measurements,although there are small differences in detail in specific regions of the spectrum. At wavelenghts below 240 nm the cross-sections are identical with those of Molina and Molina (1986), confirming the basis of the recommended values in this range.In the range 240–335 nm the new data are between 1.5% and 3.0% lower than those of Molina and Molina (1986) but about1.5% higher than those of Yoshino et al. (1993). The new data are very close to the data of Bass and Paur (1985) up to 310nm. In the Huggins bands (λ > 310 nm), shifts of +0.05 nm in the vibrational structure are apparent in the Bass and Paur(1985) data, which may be due to error in the wavelength calibration. This gives rise to small but significant differences in theindividual cross-sections and their temperature dependence. Nevertheless the small differences do not influence the averagedcross-sections sufficiently to warrant revision of the recommended values for calculation of the atmospheric photoabsorptionrates of ozone in the Huggins bands. For cross-sections at high resolution, the data of Malicet et al. (1995) which are availablein digital form from the authors, is recommended.
Malicet et al. (1995) observed a weak temperature dependence near the maximum in the Hartley band, leading to an increaseof approximately 1% inσ between 295 and 218 K, in agreement with earlier work of Molina and Molina (1986) and Barnesand Mauersberger (1987). The values recommended for the cross section at 253.7 nm have been obtained by averaging thedata of Daumont et al. (1992), Malicet et al. (1995), Hearn (1961), Molina and Molina (1986) and Mauersberger et al. (1986;1987). The new recommendation is slightly lower than previously given on the basis of the last three studies.
Ozone cross sections in the Chappius bands (450–750 nm), which are independent of temperature, are taken fromBurkholder and Talukdar (1994). The values reported by Brion et al. (1998) are in good agreement.
Quantum Yields
A wealth of data from studies cited in the table for the quantum yield for O(1D) production and its co-product, O2(11g), inthe spin allowed dissociation channel (5), give clear evidence for substantially enhanced dissociation into electronically excitedproducts beyond the threshold at 310 nm. This is attributed to the contribution of vibrational energy contained in ground stateO3 molecules. Recent measurements also show that significant O(1D) production occurs atλ = 320–370 nm which is attributedto the spin-forbidden channel (4). The new data up to 1997 were considered in IUPAC (1997), where a complete revision in therecommended quantum yields for O(1D) production at 298 K was made, which included the ‘tail’ inφ[O(1D)] at wavelengthsbeyond 312 nm (see Fig. 1). The recommended values forφ[O(1D)] covering the range 300–335 nm at 298 K were obtainedby taking a smooth curve through the mean of the experimental values reported by Brock and Watson (1980a), Trolier andWiesenfeld (1988), Armerding et al. (1995), Takahashi et al. (1996) and Silvente et al. (1997) (forλ > 325 nm only). Inthe absence of direct measurements ofφ[O(1D)] at other temperatures, no recommendation was made for the temperaturedependence. The ‘tail’, was partly attributed to the involvement of vibrationally excited ozone, implying a fall off inφ[O(1D)]with temperature in the important region between 308–320 nm. This has now been confirmed in several studies.
Since 1997 there have been six new studies (Ball et al., 1997; Talukdar et al., 1997; 1998; Takahashi et al., 1998; Bauer etal., 2000 and Smith et al., 2000) in whichφ[O(1D)] was determined, the data now covering a range of temperature from 200to 320 K and wavelength from 289 to 375 nm. The results of these studies at 298 K are plotted, together with the earlier datacited above, in Fig. 1. The studies are all in good agreement and support O(1D) production beyond the threshold at 310 nm.Recently, a rigorous evaluation of the data has been conducted by a group involving the principal investigators of these recentstudies (Matsumi et al., 2002). The group had access to all experimental data and were able to harmonise and renormalisethe quantum yield values to eliminate systematic errors. The O3 absorption spectrum of Malicet et al. (1995) was used in therenormalisation.
The recommendations for theφ[O(1D)] were derived using the following procedures. Firstφ[O(1D)] at 308 nm and 298 Kwas set at 0.79. This was based on the measurements of Greenblatt and Wiesenfeld (1983), Talukdar et al. (1997) and Takahashiet al. (1996; 1998). A wavelength dependence ofφ[O(1D)] at 298 K between 306 and 328 nm was derived by averaging the
Atmos. Chem. Phys., 4, 1461–1738, 2004 www.atmos-chem-phys.org/acp/4/1461/

R. Atkinson et al.: Evaluated kinetic and photochemical data for Ox, HOx, NOx and SOx 1499
0
0.2
0.4
0.6
0.8
1
300 305 310 315 320 325 330
Ball,97Takahashi,98Talukdar,98Bauer,00Smith,00Trolier&Wiesenfeld,88Brock&Watson,80Armerding,95Takahashi,96IUPAC1997Matsumi2002φφφφ [
O(1
D)]
wavelength/nm
Fig. 1. Quantum Yields for O(1D) production from O3 photolysis at 298 K. The data are taken from the cited references without normali-sation. The IUPAC (1997) recommendation is a mean of the values reported by Brock and Watson (1980a), Trolier and Wiesenfeld (1988),Armerding et al. (1995), Takahashi et al. (1996) and Silvente et al. (1997) (forλ > 325 nm only). The recommendation of Matsumi etal. (2002), which is adopted for this IUPAC evaluation, is derived by averaging the renormalised data from Brock and Watson (1980a),Trolier and Wiesenfeld (1988), Armerding et al. (1995), Takahashi et al. (1996; 1998), Ball et al. (1997), Talukdar et al. (1997; 1998), Baueret al. (2000), Smith et al. (2000) and Taniguchi et al. (2000).
renormalised data from Brock and Watson (1980a), Trolier and Wiesenfeld (1988), Armerding et al. (1995), Takahashi etal. (1996), Ball et al. (1997), Talukdar et al. (1997; 1998), Bauer et al. (2000) and Smith et al. (2000).
The recent studies of Talukdar et al. (1998), Taniguchi et al. (2000) and Smith et al. (2000) showφ[O(1D)] values in the range290–305 nm of around 0.90. The renormalised values of Trolier and Wiesenfeld (1988), Armerding et al. (1995), Takahashiet al. (1996), Ball et al. (1997), also showed values in this region. Matsumi et al. (2002) therefore recommended a value ofφ[O(1D)] = 0.90±0.09 for 290< λ < 305 nm. We adopt these recommendations as our preferred values at 298 K, which arelisted in the Table.
There are several studies (Brock and Watson, 1980b; Amimoto et al., 1980; Wine and Ravishankara, 1983; Greenblatt andWiesenfeld, 1983; Turnipseed et al., 1991; Cooper et al., 1993; Talukdar et al., 1998) which show that, in the wavelength range222–275 nm,φ[O(1D)] is between 0.85 and 0.90 without significant variation. Fairchild et al. (1978) and Sparks et al. (1980)report significant O(3P) production in the Hartley Band at 275 and 266 nm. We therefore recommend a value ofφ[O(1D)] =0.90±0.05 andφ[O(3P)] = 0.10±0.05 for the entire range 220< λ <305 nm.
Recent data on the temperature dependence ofφ[O(1D)] (Takahashi et al., 1998; Talukdar et al., 1998; Bauer et al., 2000;Smith et al., 2000) confirms that the yield is temperature dependent at wavelengths> 308 nm, as indicated by earlier indirectmeasurements of Lin and DeMore (1973) (275–320 nm) at 233 K and Kuis et al. (1975) (313 nm) in the range 221–293 K,and measurements of Ball and colleagues (1995; 1995a; 1995b) ofφ[O2(
11g)] at 298 K and 227 K. However the recentobservations show that at all temperatures,φ[O(1D)] andφ[O2(
11g)] decline to a limiting value of∼0.1. Evidence from thetime-of-flight experiments of Ball et al. (1995a) and the Doppler profiles of nascent O(1D)] (Takahashi et al., 1996; 1998;Denzer et al., 1997) strongly points to a contribution from the spin forbidden channel (2). O’Keeffe et al. (1998) have observednascent O2(b16g) photofragments from O3 photodissociation between 335 and 352 nm, indicating a contribution from channel(3) in this region. These channels involve ground state O3 and are, therefore, unlikely to be temperature dependent.
Experiments show that at wavelengths below 305 nm,φ[O(1D)] is invariant with temperature. At 308 nm, Matsumi etal. (2002) recommend the following expression based on the recent data (Takahashi et al., 1998; Talukdar et al., 1998; Baueret al., 2000; Smith et al., 2000):
φ(308nm, T ) = 6.10× 10⁻⁴T + 0.608
www.atmos-chem-phys.org/acp/4/1461/ Atmos. Chem. Phys., 4, 1461–1738, 2004
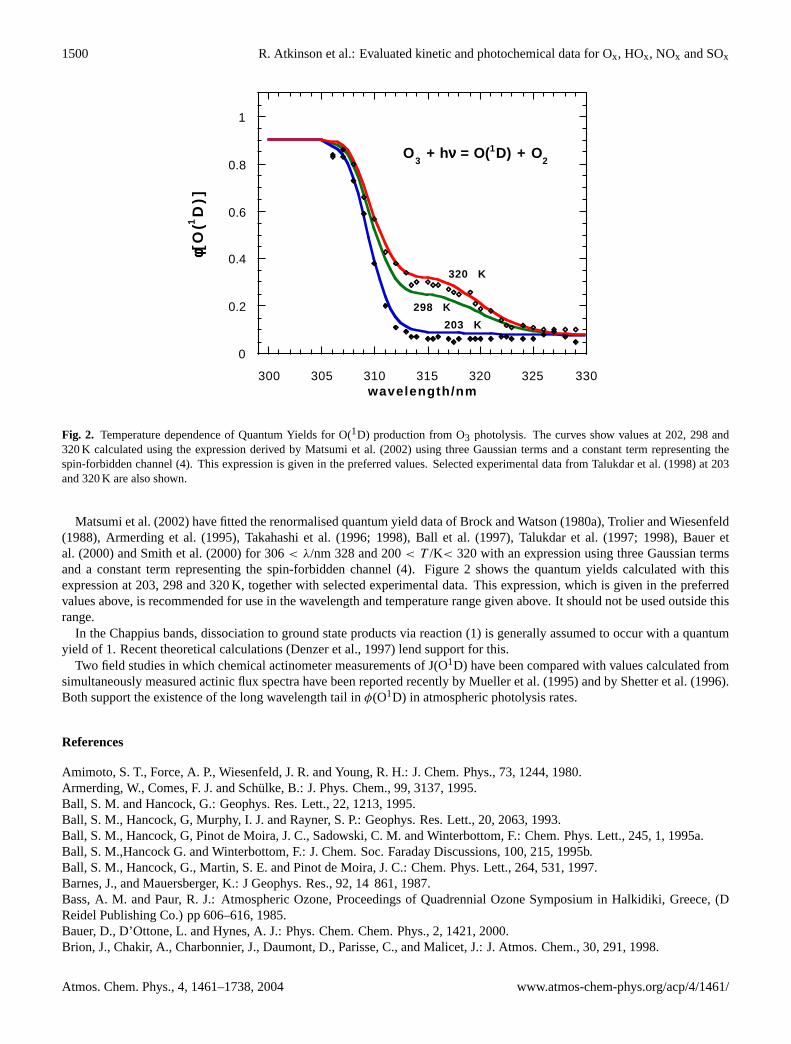
1500 R. Atkinson et al.: Evaluated kinetic and photochemical data for Ox, HOx, NOx and SOx
0
0.2
0.4
0.6
0.8
1
300 305 310 315 320 325 330
O3 + hνννν = O(1D) + O
2
φφφφ [O
(1D
)]
wavelength/nm
320 K
203 K
298 K
Fig. 2. Temperature dependence of Quantum Yields for O(1D) production from O3 photolysis. The curves show values at 202, 298 and320 K calculated using the expression derived by Matsumi et al. (2002) using three Gaussian terms and a constant term representing thespin-forbidden channel (4). This expression is given in the preferred values. Selected experimental data from Talukdar et al. (1998) at 203and 320 K are also shown.
Matsumi et al. (2002) have fitted the renormalised quantum yield data of Brock and Watson (1980a), Trolier and Wiesenfeld(1988), Armerding et al. (1995), Takahashi et al. (1996; 1998), Ball et al. (1997), Talukdar et al. (1997; 1998), Bauer etal. (2000) and Smith et al. (2000) for 306< λ/nm 328 and 200< T /K< 320 with an expression using three Gaussian termsand a constant term representing the spin-forbidden channel (4). Figure 2 shows the quantum yields calculated with thisexpression at 203, 298 and 320 K, together with selected experimental data. This expression, which is given in the preferredvalues above, is recommended for use in the wavelength and temperature range given above. It should not be used outside thisrange.
In the Chappius bands, dissociation to ground state products via reaction (1) is generally assumed to occur with a quantumyield of 1. Recent theoretical calculations (Denzer et al., 1997) lend support for this.
Two field studies in which chemical actinometer measurements of J(O1D) have been compared with values calculated fromsimultaneously measured actinic flux spectra have been reported recently by Mueller et al. (1995) and by Shetter et al. (1996).Both support the existence of the long wavelength tail inφ(O1D) in atmospheric photolysis rates.
References
Amimoto, S. T., Force, A. P., Wiesenfeld, J. R. and Young, R. H.: J. Chem. Phys., 73, 1244, 1980.Armerding, W., Comes, F. J. and Schulke, B.: J. Phys. Chem., 99, 3137, 1995.Ball, S. M. and Hancock, G.: Geophys. Res. Lett., 22, 1213, 1995.Ball, S. M., Hancock, G, Murphy, I. J. and Rayner, S. P.: Geophys. Res. Lett., 20, 2063, 1993.Ball, S. M., Hancock, G, Pinot de Moira, J. C., Sadowski, C. M. and Winterbottom, F.: Chem. Phys. Lett., 245, 1, 1995a.Ball, S. M.,Hancock G. and Winterbottom, F.: J. Chem. Soc. Faraday Discussions, 100, 215, 1995b.Ball, S. M., Hancock, G., Martin, S. E. and Pinot de Moira, J. C.: Chem. Phys. Lett., 264, 531, 1997.Barnes, J., and Mauersberger, K.: J Geophys. Res., 92, 14 861, 1987.Bass, A. M. and Paur, R. J.: Atmospheric Ozone, Proceedings of Quadrennial Ozone Symposium in Halkidiki, Greece, (DReidel Publishing Co.) pp 606–616, 1985.Bauer, D., D’Ottone, L. and Hynes, A. J.: Phys. Chem. Chem. Phys., 2, 1421, 2000.Brion, J., Chakir, A., Charbonnier, J., Daumont, D., Parisse, C., and Malicet, J.: J. Atmos. Chem., 30, 291, 1998.
Atmos. Chem. Phys., 4, 1461–1738, 2004 www.atmos-chem-phys.org/acp/4/1461/

R. Atkinson et al.: Evaluated kinetic and photochemical data for Ox, HOx, NOx and SOx 1501
Brock, J. C. and Watson, R. T.: Chem. Phys., 46, 477, 1980a.Brock, J. C. and Watson, R. T.: Chem. Phys. Lett., 71, 371, 1980b.Burkholder, J. B. and Talukdar, R. K.: Geophys. Res. Lett., 21, 581, 1994.Cooper, I. A., Neill, P. J. and Wiesenfeld, J. R.: J. Geophys. Res., 98, 12 795, 1993.Daumont, D. D., Brion, J.,Charbonnier, J. and Malicet, J.: J. Atmos. Chem., 15, 145, 1992.Denzer, W., Hancock, G., Pinot de Moira, J. C. and Tyley, P. L.: Chem. Phys. Lett., 280, 496, 1997.Fairchild, C. E., Stone, E. J. and Lawrence, G. M.: J. Chem. Phys., 69, 3632, 1978.Greenblatt, G. D. and Wiesenfeld, J. R.: J. Chem. Phys., 78, 4924, 1983.Hearn, A. G.: Proc. Phys. Soc. London, 78, 932, 1961.IUPAC, Supplement VI: J. Phys. Chem. Ref. Data, 26, 1329, 1997.Kuis, S., Simonaitis. R. and Heicklen, J.: J. Geophys. Res., 80, 1328, 1975.Lin, C-L., and DeMore, W. B.: J. Photochem., 2, 161, 1973.Malicet, J., Daumont, D.,Charbonnier, J, Parisse, C., Chakir, A. and Brion, J.: J. Atm. Chem., 21, 263, 1995.Matsumi, Y., Comes, F. J., Hancock, G., Hofzumahaus, A., Hynes, A. J., Kawasaki, M., Ravishankara, A. R.: J. Geophys.Res.,107, (D3), ACH1, 2002.Mauersberger, K., Barnes, J., Hanson, D. and Morton, J.: Geophys. Res. Lett., 13, 671, 1986.Michelson, H. A., Salawitch, R. J., Wennberg, P. O. and Anderson, J. G.: Geophys. Res. Lett., 21, 2227, 1994.Molina, M. J. and Molina, L. T.: J. Geophys. Res., 91, 14 501, 1986.Muller, M., Kraus, A. and Hofzumahaus, A.: Geophys. Res. Lett., 22, 679, 1995.NASA Evaluation No 12, 1997 (see references in Introduction).O’Keeffe, P., Ridley, T., Wang, Sh., Lawley, K. P. and Donovan, R. J.: Chem. Phys. Lett., 298, 368, 1998.Shetter, R. E., Cantrell, C. A., Lantz. K. O., Flocke, S. J., Orlando, J. J., Tyndall, G. S., Gilpin, T. M., Fischer, C.A.,Madronich, S., Calvert, J. A. and Junkermann, W.:J. Geophys. Res., 101, 14 631, 1996.Silvente, E., Richter, R. C., Zheng, M., Saltzman, E. S. and Hynes, A. J.: Chem. Phys. Lett., 264, 309, 1997.Smith, G. D., Molina, L. T. and Molina, M. J.: J. Phys. Chem. A, 104, 8916, 2000.Sparks, R. K., Carlson, L. R., Shobatake, K., Kowalczyk, M. L. and Lee, Y. T.: J. Chem. Phys., 72, 1401, 1980.Takahashi, K., Matsumi, Y. and Kawasaki, M.: J. Phys. Chem., 100, 4084, 1996.Takahashi, K., Taniguchi, N., Matsumi, Y., Kawasaki, M., and Ashfold, M. N. R.: J. Chem. Phys., 108, 7161, 1998.Talukdar, R. K., Gilles, M. K., Battin-Leclerc, F., Ravishankara, A. R., Fracheboud, J.-M, Orlando, J. J. and Tyndall, G. S.:Geophys. Res. Lett., 24, 1091, 1997.Talukdar, R. K., Longfellow, C. A., Gilles, M. K. and Ravishankara, A. R.: Geophys. Res. Lett., 25, 143, 1998.Taniguchi, N., Takahashi, K., and Matsumi, Y.: J. Phys. Chem. A, 104, 8936, 2000.Takahashi, K., Kishigami, M., Matsumi, Y., Kawasaki, M. and Orr-Ewing, A.: J. Chem. Phys., 105, 5290, 1996.Trolier. M. and Wiesenfeld, J. R.: J. Geophys. Res., 7119, 1988.Turnipseed, A. A., Vaghjianni, G. L., Gierczak, T., Thompson, J. E. and Ravishankara, A. R.: J Chem. Phys., 95, 3244, 1991.Wine, P. H. and Ravishankara, A. R.: Chem. Phys. 69, 365, 1982.Yoshino, K., Esmond, J. R., Freeman, D. E. and Parkinson, W. H.: J. Geophys. Res., 98, 5205, 1993.WMO, Global Ozone Research and Monitoring Project Report No.16: Atmospheric Ozone 1985, Chapter 7, 1986.
www.atmos-chem-phys.org/acp/4/1461/ Atmos. Chem. Phys., 4, 1461–1738, 2004

1502 R. Atkinson et al.: Evaluated kinetic and photochemical data for Ox, HOx, NOx and SOx
Appendix A2: HOx reactions
I.A2.13
H + HO2 → H2 + O2 (1)→ 2HO (2)→ H2O + O (3)
1H ◦(1) = −232.6 kJ·mol−1
1H ◦(2) = −156.2 kJ·mol−1
1H ◦(3) = −225.2 kJ·mol−1
Rate coefficient data (k = k1 + k2 + k3)
k/cm3 molecule−1 s−1 Temp./K Reference Technique/ Comments
Absolute Rate Coefficients(7.4± 1.2)×10−11 245–300 Sridharan et al., 1982 DF-RF(8.7± 1.5)×10−11 245–300 Keyser, 1986 DF-RF
Branching Ratiosk1/k = 0.08± 0.04 245–300 Keyser, 1986k2/k = 0.90± 0.04k3/k = 0.02± 0.04
Preferred Values
k = 8.0×10⁻¹¹ cm3 molecule−1 s−1, independent of temperature over the range 245–300 K.k1 = 5.6×10⁻¹² cm3 molecule−1 s−1, independent of temperature over the range 245–300 K.k2 = 7.2×10⁻¹¹ cm3 molecule−1 s−1, independent of temperature over the range 245–300 K.k3 = 2.4×10⁻¹² cm3 molecule−1 s−1, independent of temperature over the range 245–300 K.
Reliability
1log k = ±0.1 over the temperature range 245–300 K.1(E/R) = ±200 K.1log k1 = ±0.5 over the temperature range 245–300 K.1log k2 = ±0.1 over the temperature range 245–300 K.1log k3 = ±0.5 over the temperature range 245–300 K.
Comments on Preferred Values
The study of Keyser (1986) is the most detailed to date. Several species were monitored and the possible effects of sidereactions were carefully analyzed. Values obtained for the overall rate coefficient and the branching ratios agree with thevalues obtained by Sridharan et al. (1982), who used a similar technique. The recommended values fork and the branchingratios are the means of the values from these two studies. In both cases (Keyser, 1986; Sridharan et al., 1982),k1/k was notmeasured directly but obtained by difference. A direct measurement of this branching ratio is desirable.
The yield of O2(16()) has been measured by Hislop and Wayne (1977), Keyser et al. (1985) and Michelangeli et al. (1988),
who report values of (2.8± 1.3)×10−4, <8×10⁻³ and<2.1×10⁻², respectively.Keyser (1986) observed no effect of temperature on the rate coefficientk over the small range studied. This suggests that the
value ofk2 = 3.3×10⁻¹¹ cm3 molecule−1 s−1 at 349 K obtained by Pagsberg et al. (1979) is too low or there is a substantialnegative temperature coefficient. We provisionally recommendE/R = 0 but only over the temperature range 245–300 K.
Atmos. Chem. Phys., 4, 1461–1738, 2004 www.atmos-chem-phys.org/acp/4/1461/

R. Atkinson et al.: Evaluated kinetic and photochemical data for Ox, HOx, NOx and SOx 1503
References
Hislop, J. R. and Wayne, R. P.: J. Chem. Soc. Faraday Trans. 2, 73, 506, 1977.Keyser, L. F., Choo, K. Y. and Leu, M. T.: Int. J. Chem. Kinet., 17, 1169, 1985.Keyser, L. F.: J. Phys. Chem., 90, 2994, 1986.Michelangeli, D. V., Choo, K.-Y. and Leu, M.-T.: Int. J. Chem. Kinet., 20, 915, 1988.Pagsberg, P. B., Eriksen, J. and Christensen, H. C.: J. Phys. Chem., 83, 582, 1979.Sridharan, U. C., Qiu, L. X. and Kaufman, F.: J. Phys. Chem., 86, 4569, 1982.
www.atmos-chem-phys.org/acp/4/1461/ Atmos. Chem. Phys., 4, 1461–1738, 2004
1504 R. Atkinson et al.: Evaluated kinetic and photochemical data for Ox, HOx, NOx and SOx
I.A2.14
H + O2 + M → HO2 + M
1H ◦ = −203.4 kJ·mol−1
Low-pressure rate coefficients
Rate coefficient data
k0/cm3 molecule−1 s−1 Temp./K Reference Technique/Comments
Absolute Rate Coefficients5.33×10−32(T /298)−1.77 [N2] 226–298 Kurylo, 1972 FP-RF(5.46±0.7)×10−32(T /298)−1.50 [N2] 220–298 Wong and Davis, 1974 FP-RF6.5×10−32 [N2] 298 Cobos et al., 1985 PLP-UVA (a)6.2×10⁻³²(T /300)−1.66 [N2] 298–639 Hsu et al., 1989 DF-RF2.9×10−33 exp[(825± 130)/T ] [N2] 298–580 Carleton et al., 1993 PLP-LIF/RA4.6×10−32 [N2] 2983.9×10−32 exp[(600± 1050)/T ] [H2O] 575–750
Comments
(a) Measurements of the falloff curve between 1 and 200 bar, with determination ofk0, k∞, andFc.
Preferred Values
k0 = 5.4×10⁻³² (T /300)−1.8 [N2] cm3 molecule−1 s−1 over the temperature range 200–600 K.
Reliability
1log k0 = ±0.1 at 298 K.1n = ±0.6.
Comments on Preferred Values
The preferred values are an average of the results from Kurylo (1972), Wong and Davis (1974), Cobos et al. (1985), Hsu etal. (1989) and Carleton et al. (1993). There is a single study of the full falloff curve (Cobos et al., 1985) which leads tok∞ =7.5×10⁻¹¹ cm3 molecule−1 s−1 at 298 K and a broadening factor ofFc = 0.55± 0.15 at 298 K. Theoretical modeling (Hardinget al., 2000; Troe, 2000) using anab initio potential energy surface givesk∞ = 9.5×10⁻¹¹ (T /300)0.44 cm3 molecule−1 s−1
andFc = 0.5 over the range 200–2000 K.
References
Carleton, K. L., Kessler, W. J. and Marinelli, W. J.: J. Phys. Chem., 97, 6412, 1993.Cobos, C. J., Hippler, H., and Troe, J.: J. Phys. Chem., 89, 342, 1985.Harding, L. B., Troe, J. and Ushakov, V. G.: Phys. Chem. Chem. Phys., 2, 631, 2000.Hsu, K.-J., Anderson, S. M., Durant, J. L. and Kaufman, F.: J. Phys. Chem., 93, 1018, 1989.Kurylo, M. J.: J. Phys. Chem., 76, 3518, 1972.Troe, J.: Proc. Combust. Inst., 28, 1463, 2000.Wong, W. and Davis, D. D.: Int. J. Chem. Kinet., 6, 401, 1974.
Atmos. Chem. Phys., 4, 1461–1738, 2004 www.atmos-chem-phys.org/acp/4/1461/
R. Atkinson et al.: Evaluated kinetic and photochemical data for Ox, HOx, NOx and SOx 1505
I.A2.15
O + HO → O2 + H
1H ◦ = −68.4 kJ·mol−1
Rate coefficient data
k/cm3 molecule−1 s−1 Temp./K Reference Technique/Comments
Absolute Rate Coefficients3.35×10−11(T /300)−0.36 221–499 Lewis and Watson, 1980 DF-RF (a)3.84×10⁻¹¹(T /300)−0.5 250–500 Howard and Smith, 1981 DF/FP-RF3.52×10−11 298 Temps, 1983 DF-LMR3.1×10−11 298 Brune et al., 1983 DF-LMR/RA/RF4.1×10−11(T /300)−0.6 158–294 Smith and Stewart, 1994 DF/PLP-RF
Relative Rate Coefficients3.4×10−11 298 Keyser, 1983 DF-RF (b)
Comments
(a) “Best-fit” values for 300 K from this work are preferred.(b) Measurements relative to the reaction O + HO2 → HO + O2 evaluated withk(O+HO2) = 5.8×10⁻¹¹ cm3 molecule−1 s−1.
Preferred Values
k = 3.5×10⁻¹¹ cm3 molecule−1 s−1 at 298 K.k = 2.4×10⁻¹¹ exp(110/T ) cm3 molecule−1 s−1 over the temperature range 150–500 K.
Reliability
1log k = ±0.1 at 298 K.1(E/R) = ±100 K.
Comments on Preferred Values
The recommended temperature dependence is based on a least-squares fit of the data of Lewis and Watson (1980) andHoward and Smith (1981), which are in close agreement. The preferred value for 300 K is the average of data obtained near300 K by Lewis and Watson (1980), Howard and Smith (1981), Temps (1983), Brune et al. (1983) and Smith and Stewart(1994). The reaction has also been the subject of numerous theoretical studies; see Miller and Klippenstein (1999) or Troe andUshakov (2001).
References
Brune, W. H., Schwab, J. J. and Anderson, J. G.: J. Phys. Chem., 87, 4503, 1983.Howard, M. J. and Smith, I. W. M.: J. Chem. Soc. Faraday Trans: 2, 77, 997, 1981.Keyser, L. F.: J. Phys. Chem., 87, 837, 1983.Lewis, R. S. and Watson, R. T.: J. Phys. Chem., 84, 3495, 1980.Miller, J. A. and Klippenstein, S. J,: Int. J. Chem. Kinet., 31, 753, 1999.Smith, I. W. M. and Stewart, D. W. A.: J. Chem. Soc. Faraday Trans., 90, 3221, 1994.Temps, F., Ph. D. Dissertation, Gottingen: 1983.Troe, J. and Ushakov, V. G.: J. Chem. Phys., 115, 3621, 2001.
www.atmos-chem-phys.org/acp/4/1461/ Atmos. Chem. Phys., 4, 1461–1738, 2004

1506 R. Atkinson et al.: Evaluated kinetic and photochemical data for Ox, HOx, NOx and SOx
I.A2.16
O + HO2 → HO + O2
1H ◦ = −225.6 kJ·mol−1
Rate coefficient data
k0/cm3 molecule−1 s−1 Temp./K Reference Technique/Comments
Absolute Rate Coefficients3.1×10−11 exp[(200± 28)/T ] 229–372 Keyser, 1982 DF-RF(6.1± 0.4)×10−11 299(5.4± 0.9)×10−11 296 Sridharan et al., 1982 DF-RF(6.2± 1.1)×10−11 298 Ravishankara et al., 1983 PLP-RF(5.2± 0.8)×10−11 300 Brune et al., 1983 DF-RF2.91×10−11 exp[(228± 75)/T ] 266–391 Nicovich and Wine, 1987 PLP-RF(6.30± 0.91)×10−11 298
Preferred Values
k = 5.8×10⁻¹¹ cm3 molecule−1 s−1 at 298 K.k = 2.7×10⁻¹¹ exp(224/T ) cm3 molecule−1 s−1 over the temperature range 220–400 K.
Reliability
1log k = ±0.08 at 298 K.1(E/R) = ±100 K.
Comments on Preferred Values
The recommended rate coefficient at 298 K is the mean of those obtained in the studies of Keyser (1982), Sridharan etal. (1982), Ravishankara et al. (1983), Brune et al. (1983) and Nicovich and Wine (1987), all of which are in excellent agree-ment. The temperature coefficient is the mean of the values obtained by Keyser (1982) and Nicovich and Wine (1987), withthe pre-exponential factor being based on this value ofE/R and the recommended value ofk at 298 K.
In the two most recent studies of the reaction mechanism, Keyser et al. (1985) have shown that the yield of O2(16) from the
reaction is< 1×10⁻² per HO2 radical removed and Sridharan et al. (1985) have shown, in an18O labelling experiment, thatthe reaction proceeds via formation of an HO2−
18O intermediate which dissociates to HO and18OO by rupture of an O-Obond rather than via a four center intermediate yielding H18O + OO.
References
Brune, W. H., Schwab, J. J. and Anderson, J. G.: J. Phys. Chem., 87, 4503, 1983.Keyser, L. F.: J. Phys. Chem., 86, 3439, 1982.Keyser, L. F., Choo, K. Y. and Leu, M. T.: Int. J. Chem. Kinet., 17, 1169, 1985.Nicovich, J. M. and Wine, P. H.: J. Phys. Chem., 91, 5118, 1987.Ravishankara, A. R., Wine, P. H. and Nicovich, J. M.: J. Chem. Phys., 78, 6629, 1983.Sridharan, U. C., Qiu, L. X. and Kaufman, F.: J. Phys. Chem., 86, 4569, 1982.Sridharan, U. C., Klein, F. S. and Kaufman, F.: J. Chem. Phys., 82, 592, 1985.
Atmos. Chem. Phys., 4, 1461–1738, 2004 www.atmos-chem-phys.org/acp/4/1461/
R. Atkinson et al.: Evaluated kinetic and photochemical data for Ox, HOx, NOx and SOx 1507
I.A2.17
O + H2O2 → HO + HO2
1H ◦ = −60.1 kJ·mol−1
Rate coefficient data
k/cm3 molecule−1 s−1 Temp./K Reference Technique/Comments
Absolute Rate Coefficients2.75×10−12 exp[−(2125± 261)/T ] 283–368 Davis et al., 1974 FP-RF2.1×10−15 2981.13×10−12 exp[−(2000± 160)/T ] 298–386 Wine et al., 1983 FP-RF(1.45± 0.29)×10−15 298
Preferred Values
k = 1.7×10⁻¹⁵ cm3 molecule−1 s−1 at 298 K.k = 1.4×10⁻¹² exp(−2000/T ) cm3 molecule−1 s−1 over the temperature range 280–390 K.
Reliability
1log k = ±0.3 at 298 K.1(E/R) = ±1000 K.
Comments on Preferred Values
The preferred values are based on the results of Davis et al. (1974) and Wine et al. (1983). These two studies are in agreementwith regard to the temperature coefficient of the rate coefficient, but the absolute values ofk differ by a factor or 2 throughoutthe range. In both cases the pre-exponential factor obtained is low compared with other atom-molecule reactions. To obtainthe preferred values the temperature coefficient is accepted and the pre-exponential factor adjusted to obtain agreement withthe recommended value ofk at 298 K, which is the mean of the values found in the two studies.
Roscoe (1982) has discussed earlier work on this reaction, which was invalidated by secondary reactions affecting themeasurements.
References
Davis, D. D., Wong, W. and Schiff, R.: J. Phys. Chem., 78, 463, 1974.Roscoe, J. M., Int. J. Chem. Kinet., 14, 471, 1982.Wine, P. H., Nicovich, J. M., Thompson, R. J. and Ravishankara, A. R.: J. Phys. Chem., 87, 3948, 1983.
www.atmos-chem-phys.org/acp/4/1461/ Atmos. Chem. Phys., 4, 1461–1738, 2004

1508 R. Atkinson et al.: Evaluated kinetic and photochemical data for Ox, HOx, NOx and SOx
I.A2.18
O(1D) + H2 → HO + H (1)→ O(3P) + H2 (2)
1H ◦(1) = −182.7 kJ·mol−1
1H ◦(2) = −189.7 kJ·mol−1
Rate coefficient data (k = k1 + k2)
k/cm3 molecule−1 s−1 Temp./K Reference Technique/Comments
Absolute Rate Coefficients(9.9± 3)×10−11 204–352 Davidson et al., 1976, 1977 (a)(1.18± 0.12)×10−10 297 Wine and Ravishankara, 1981 PLP-RF (b)(1.0± 0.1)×10−10 298 Force and Wiesenfeld, 1981 (c)(1.2± 0.1)×10−10 298 Talukdar and Ravishankara, 1996 PLP-RF (d)
Comments
(a) Pulsed laser photolysis of O3 at 266 nm, with O(1D) atoms being monitored by time-resolved emission at 630 nm.
(b) O(3P) atoms were monitored by time-resolved resonance fluorescence.
(c) Pulsed laser photolysis of O3 at 248 nm. H and O(3P) atoms were monitored by time-resolved absorption spectroscopy.
(d) O(3P) and H atom products were monitored by resonance fluorescence.
Preferred Values
k = 1.1×10⁻¹⁰ cm3 molecule−1 s−1, independent of temperature over the range 200–350 K.
Reliability
1log k = ±0.1 at 298 K.1(E/R) = ±100 K.
Comments on Preferred Values
The recommended value is the mean of the values of Davidson et al. (1976; 1977), Wine and Ravishankara (1981), Forceand Wiesenfeld (1981) and Talukdar and Ravishankara (1996), all of which are in excellent agreement. Channel (1) appears tobe the dominant pathway (>95%) for the reaction (Wine and Ravishankara, 1982).
Absolute rate constants and isotopic branching ratios have been reported (Laurent et al., 1995) for the reaction of O(1D)with HD. Thek values were insigificantly different from the recommendation for H2, with a branching ratio OH/OD = 1.35±0.20.
References
Davidson, J. A., Sadowski, C. M., Schiff, H. I., Streit, G. E. Howard, C. J., Jennings, D. A. and Schmeltekopf A. L.: J. Chem.Phys., 64, 57, 1976.Davidson, J. A., Schiff, H. I., Streit, G. E., McAfee, J. R., Schmeltekopf, A. L. and Howard C. J.: J. Chem. Phys., 67, 5021,1977.Force, A. P. and Wiesenfeld, J. R.: J. Chem. Phys., 74, 1718, 1981.Laurent, T., Naik, P. D., Volpp, H.-R., Wolfrum, J., Arusi-Parpar, T., Bar, I. and Rosenwaks, S.: Chem. Phys. Lett., 236, 343,1995.
Atmos. Chem. Phys., 4, 1461–1738, 2004 www.atmos-chem-phys.org/acp/4/1461/
R. Atkinson et al.: Evaluated kinetic and photochemical data for Ox, HOx, NOx and SOx 1509
Talukdar, R. K. and Ravishankara, A. R.: Chem. Phys. Lett., 253, 177, 1996.Wine, P. H. and Ravishankara, A. R.: Chem. Phys. Lett., 77, 103, 1981.Wine, P. H. and Ravishankara, A. R.: Chem. Phys., 69, 365, 1982.
www.atmos-chem-phys.org/acp/4/1461/ Atmos. Chem. Phys., 4, 1461–1738, 2004

1510 R. Atkinson et al.: Evaluated kinetic and photochemical data for Ox, HOx, NOx and SOx
I.A2.19
O(1D) + H2O → 2HO (1)→ H2 + O2 (2)→ O(3P) + H2O (3)
1H ◦(1) = −120.7 kJ·mol−1
1H ◦(2) = −197.1 kJ·mol−1
1H ◦(3) = −189.7 kJ·mol−1
Rate coefficient data (k = k1 + k2 + k3)
k/cm3 molecule−1 s−1 Temp./K Reference Technique/Comments
Absolute Rate Coefficients(2.3± 0.4)×10−10 253–353 Streit et al., 1976 PLP (a)(1.95± 0.3)×10−10 295 Amimoto et al., 1979 PLP-RA (b)(2.6± 0.5)×10−10 300 Lee and Slanger, 1979 PLP (c)k1 = (2.02± 0.41)×10−10 298 Gericke and Comes, 1981 PLP-RA(1.95± 0.2)×10−10 298 Wine and Ravishankara, 1981 PLP-RF (d)
Branching Ratiosk2/k = 0.01(+0.005
−0.01 ) 298 Zellner et al., 1980 FP-RA (e)k3/k = 0.049± 0.032 298± 2 Wine and Ravishankara, 1982 PLP-RF (d)k2/k = 0.006(+0.007
−0.006) 298 Glinski and Birks, 1985 (f)
Comments
(a) O(1D) atoms were monitored by time-resolved emission from the O(1D) → O(3P) transition at 630 nm.
(b) O(3P) atoms were measured by resonance absorption.
(c) O(1D) atoms were measured by emission at 630 nm and, indirectly, by O2(16+
g →3 6−
g ) emission at 720 nm.
(d) O(3P) atom formation was monitored by RF.
(e) The H2 yield was measured by GC, together with the HO radical concentration by resonance absorption.
(f) Photolysis of O3-H2O mixtures at 253.7 nm. The H2 yield was measured by GC.
Preferred Values
k = 2.2×10⁻¹⁰ cm3 molecule−1 s−1, independent of temperature over the range 200–350 K.k1 = 2.2×10⁻¹⁰ cm3 molecule−1 s−1 at 298 K.k2 <2.2×10⁻¹² cm3 molecule−1 s−1 at 298 K.k3 <1.2×10⁻¹¹ cm3 molecule−1 s−1 at 298 K.
Reliability
1log k = ±0.1 at 298 K.1(E/R) = ±100 K.1log k1 = ±0.1 at 298 K.
Atmos. Chem. Phys., 4, 1461–1738, 2004 www.atmos-chem-phys.org/acp/4/1461/

R. Atkinson et al.: Evaluated kinetic and photochemical data for Ox, HOx, NOx and SOx 1511
Comments on Preferred Values
The preferred value fork is a mean of the values of Streit et al. (1976), Amimoto et al. (1979), Lee and Slanger (1979),Gericke and Comes (1981) and Wine and Ravishankara (1981), all of which are in good agreement. Our recommendations fork2/k andk3/k are based on the data of Zellner et al. (1980) and Glinski and Birks (1985) (k2/k), and Zellner et al. (1980) andWine and Ravishankara (1982 (k3/k).
References
Amimoto, S. T., Force, A. P., Gulotty Jr., R. G. and Wiesenfeld, J. R.: J. Chem. Phys., 71, 3640, 1979.Gericke, K. H. and Comes, F. J.: Chem. Phys. Lett., 81, 218, 1981.Glinski, R. J. and Birks, J. W.: J. Phys. Chem., 89, 3449, 1985.Lee, L. C. and Slanger, T. G.: Geophys. Res. Lett., 6, 165, 1979.Schiff, H. I.: J. Chem. Phys., 65, 4761, 1976.Streit, G. E., Howard, C. J., Schmeltekopf, A. L., Davidson, J. A. and Wine, P. H. and Ravishankara, A. R.: Chem. Phys. Lett.,77, 103, 1981.Wine, P. H. and Ravishankara, A. R.: Chem. Phys., 69, 365, 1982.Zellner, R., Wagner, G. and Himme, B.: J. Phys. Chem., 84, 3196, 1980.
www.atmos-chem-phys.org/acp/4/1461/ Atmos. Chem. Phys., 4, 1461–1738, 2004
1512 R. Atkinson et al.: Evaluated kinetic and photochemical data for Ox, HOx, NOx and SOx
I.A2.20
HO + H2 → H2O + H
1H ◦ = −62.0 kJ·mol−1
Rate coefficient data
k/cm3 molecule−1 s−1 Temp./K Reference Technique/Comments
Absolute Rate Coefficients7.0×10−15 300 Greiner, 1969 FP-RA(7.1± 1.1)×10−15 298 Stuhl and Niki, 1972 FP-RF7.6×10−15 298 Westenberg and deHaas, 1973 DF-EPR1.8×10−11 exp(−2330/T ) 210–460 Smith and Zellner, 1974 FP-RA(7.1± 1.0)×10−15 298(5.79± 0.26)×10−15 300 Overend et al., 1975 FP-RA5.9×10−12 exp[−(2008± 151)/T ] 298–425 Atkinson et al., 1975 FP-RF(6.97± 0.70)×10−15 2984.12×10−19T 2.44 exp(−1281/T ) 298–992 Tully and Ravishankara, 1980 FP-RF(6.08± 0.37)×10−15 2986.1×10−15 298 Zellner and Steinert, 1981 DF-RF(4.9± 0.5)×10−12 exp[−(1990± 340)/T ] 250–400 Ravishankara et al., 1981 FP-RF(5.64± 0.60)×10−15 2957.2×10−20T 2.69 exp(−1150/T ) 230–420 Talukdar et al., 1996 FP/PLP-LIF(a)(6.65± 0.36)×10−15 298
Comments
(a) Both flash lamp and pulsed laser photolysis were used. The HO radical reactions with HD and D2 were also studied.
Preferred Values
k = 6.7×10⁻¹⁵ cm3 molecule−1 s−1 at 298 K.k = 7.7×10⁻¹² exp(−2100/T ) cm3 molecule−1 s−1 over the temperature range 200–450 K.
Reliability
1log k = ±0.1 at 298 K.1(E/R) = ±200 K.
Comments on Preferred Values
There are several studies in good agreement concerning both the temperature dependence and absolute values of the ratecoefficient. The preferred value ofk at 298 K is the mean of the results of Greiner (1969), Stuhl and Niki (1972), Westenbergand deHaas (1973), Smith and Zellner (1974), Overend et al. (1975), Atkinson et al. (1975), Tully and Ravishankara (1980),Zellner and Steinert (1981) and Ravishankara et al. (1981). The preferred value ofE/R is the mean of the values of Smithand Zellner (1974), Atkinson et al. (1975) and Ravishankara et al. (1981). The pre-exponential factor in the rate expressionis calculated to fit the preferred value ofk at 298 K and that ofE/R. The results of Talukdar et al. (1996) are in excellentagreement with this recommendation. There have been many quantum mechanical calculations of the rate coefficient for thisreaction, and these are in reasonable agreement with experiment (Manthe et al., 1993; Szichman and Baer, 1995). Brownswordet al. (1991) have recently measured the branching ratio for H2O/HOD product formation of (1.2±0.2) in the HO + HD reactionin a PLP/VUV-LIF study under single collision conditions.
Atmos. Chem. Phys., 4, 1461–1738, 2004 www.atmos-chem-phys.org/acp/4/1461/
R. Atkinson et al.: Evaluated kinetic and photochemical data for Ox, HOx, NOx and SOx 1513
References
Atkinson, R., Hansen, D. A. and Pitts Jr., J. N.: J. Chem. Phys., 63, 1703, 1975.Brownsword, R. A., Hillenkamp, M., Schmiechen, P., Volpp H.-R. and Wolfrum, J.: Chem. Phys. Lett., 215, 325, 1991.Greiner, N. R.: J. Chem. Phys., 51, 5049, 1969.Manthe, U., Seideman, T. and Miller, W. H.: J. Chem. Phys., 99, 10 078, 1993.Overend, R., Paraskevopoulos, G. and Cvetanovic, R. J.: Can. J. Chem., 53, 3374, 1975.Ravishankara, A. R., Nicovich, J. M., Thompson, R. L. and Tully, F. P.: J. Phys. Chem., 85, 2498, 1981.Smith, I. W. M. and Zellner, R.: J. Chem. Soc. Faraday Trans. 2, 70, 1045, 1974.Stuhl, F. and Niki, H.: J. Chem. Phys., 57, 3671, 1972.Szichman, H. and Baer, M.: Chem. Phys. Lett., 242, 285, 1995.Talukdar, R. K., Gierczak, T., Goldfarb, L., Rudich, Y., Rao, B. S. M. and Ravishankara, A. R.: J. Phys. Chem., 100, 3037,1996.Tully, F. P. and Ravishankara, A. R.: J. Phys. Chem., 84, 3126, 1980.Westenberg, A. A. and deHaas, N.: J. Chem. Phys., 58, 4061, 1973.Zellner, R. and Steinert, W.: Chem. Phys. Lett., 81, 568, 1981.
www.atmos-chem-phys.org/acp/4/1461/ Atmos. Chem. Phys., 4, 1461–1738, 2004

1514 R. Atkinson et al.: Evaluated kinetic and photochemical data for Ox, HOx, NOx and SOx
I.A2.21
HO + HO → H2O + O
1H ◦ = −71.2 kJ·mol−1
Rate coefficient data
k/cm3 molecule−1 s−1 Temp./K Reference Technique/Comments
Absolute Rate Coefficients(2.3± 0.3)×10−12 350 Westenberg and deHaas, 1973 DF-EPR(2.1± 0.5)×10−12 298 McKenzie et al., 1973 DF-EPR(1.4± 0.2)×10−12 300 Clyne and Down, 1974 DF-RF/RA(2.1± 0.1)×10−12 300 Trainor and von Rosenberg, 1974 FP-RA(1.7± 0.2)×10−12 298 Farquharson and Smith, 1980 DF-RF3.2×10−12 exp(−242/T ) 250–580 Wagner and Zellner, 1981 FP-RA(1.43± 0.3)×10−12 298(7.1±1.0)×10−13 exp[(210± 40)/T ] 233–360 Bedjanian et al., 1999 DF-MS1.4×10−12 2981.9×10−12 298 IUPAC, 1997 (a)7.9×10⁻¹⁴(T /298)2.6 exp(945/T ) 200–500
Comments
(a) Based on 298 K values from Westenberg and deHaas (1973), McKenzie et al. (1973), Clyne and Down (1974), Trainorand von Rosenberg (1974), Farquharson and Smith (1980) and Wagner and Zellner (1981) and a temperature dependencefrom anab initio modelling study of Harding et al. (1988).
Preferred Values
k = 1.48×10⁻¹² cm3 molecule−1 s−1 at 298 K.k = 6.2×10⁻¹⁴ (T /298)2.6 exp(945/T ) cm3 molecule−1 s−1 over the temperature range 200–350 K.
Reliability
1log k = ±0.15 at 298 K.1(E/R) = ±250 K.
Comments on Preferred Values
There are a number of measurements ofk at temperatures close to 298 K (Westenberg and deHaas, 1973; McKenzie et al.,1973; Clyne and Down, 1974; Trainor and von Rosenberg, 1974; Farquharson and Smith, 1980; Wagner and Zellner, 1981;Del Greco et al., 1962; Dixon-Lewis et al., 1966; Wilson and Donovan, 1967; Breen and Glass, 1970) falling in the range (1.4–2.3)×10−12 cm3 molecule−1 s−1. The more recent studies (Clyne and Down, 1974; Farquharson and Smith, 1980; Wagnerand Zellner, 1981; Bedjanian et al., 1999) support the lower values fork(298) near 1.4×10⁻¹² cm3 molecule−1 s−1. Thenegative temperature dependence reported by Bedjanian et al. (1999) in the low temperature region, which is in conflict withthe earlier works of Wagner and Zellner (1981) supports the theoretically derived temperature dependence recommended byIUPAC (1997). The current recommendation is the IUPAC (1997) expression with the temperature independent term adjustedto give ak(298K) value of 1.5×10⁻¹² cm3 molecule−1 s−1.
Atmos. Chem. Phys., 4, 1461–1738, 2004 www.atmos-chem-phys.org/acp/4/1461/

R. Atkinson et al.: Evaluated kinetic and photochemical data for Ox, HOx, NOx and SOx 1515
References
Bedjanian, Y., Le Bras, G. and Poulet, G.: J. Phys. Chem. A, 103, 7017, 1999.Breen, J. E. and Glass, G. P.: J. Chem. Phys., 52, 1082, 1970.Clyne, M. A. A. and Down, S.: J. Chem. Soc. Faraday Trans. 2, 70, 253, 1974.Del Greco, F. P. and Kaufman, F.: Discuss. Faraday Soc., 33, 128, 1962.Dixon-Lewis, G., Wilson, W. E. and Westenberg., A. A.: J. Chem. Phys., 44, 2877, 1966.Farquharson, G. K. and Smith, R. L.: Aust. J. Chem., 33, 1425, 1980.Harding, L. B. and. Wagner, A. F.: 22nd Symp. (Int.) on Combustion (Combustion Institute, Pittsburgh, 1988), p. 983, 1988.IUPAC, Supplement VI: J. Phys. Chem. Ref. Data, 26, 1329, 1997.McKenzie, A., Mulcahy, M. F. R. and Steven, J. R.: J. Chem. Phys., 59, 3244, 1973.Trainor, D. W. and von Rosenberg Jr., C. W. J.: Chem. Phys., 61, 1010, 1974.Wagner, G. and Zellner, R.: Ber. Bunsenges. Phys. Chem., 85, 1122, 1981.Westenberg, A. A. and deHaas, N.: J. Chem. Phys., 58, 4066, 1973.Wilson, W. E. and O’Donovan, J. T.: J. Chem. Phys., 47, 5455, 1967.
www.atmos-chem-phys.org/acp/4/1461/ Atmos. Chem. Phys., 4, 1461–1738, 2004

1516 R. Atkinson et al.: Evaluated kinetic and photochemical data for Ox, HOx, NOx and SOx
I.A2.22
HO + HO + M → H2O2 + M
1H ◦ = −210.7 kJ·mol−1
Low-pressure rate coefficients
Rate coefficient data
k0/cm3 molecule−1 s−1 Temp./K Reference Technique/Comments
Absolute Rate Coefficients(2.5± 0.3)×10−31 [N2] 300 Trainor and von Rosenberg, 1974 FP-RA6.9×10−31 (T/300)−0.8 [N2] 253–353 Zellner et al., 1988 FP-RA3.7×10−31 [He] 298 Forster et al., 1995 PLP-LIF (a)
Comments
(a) Measurements were carried out with saturated LIF at total gas densities in the range 3.9×10¹⁹ to 3.4×10²¹ moleculecm−3, covering the major part of the falloff curve. The apparent discrepancy between the results of Trainor and vonRosenberg (1974) and Zellner et al. (1988) disappears when the contribution of the reaction HO + HO→ H2O + O isseparated by means of the falloff plot. The theoretical analysis by Fulle et al. (1996) indicates a change of the temperaturecoefficient ofk0 from T −0.9 between 200 and 300 K toT −2.7 between 300 and 700 K (for the bath gas He).
Preferred Values
k0 = 6.9×10⁻³¹ (T /300)−0.8 [N2] cm3 molecule−1 s−1 over the temperature range 200–400 K.
Reliability
1log k0 = ±0.1 at 298 K.1n = ±0.5.
Comments on Preferred Values
The analysis of the complete falloff curve by Forster et al. (1995) shows that the measurements from Trainor and vonRosenberg (1974), Zellner et al. (1988) and Forster et al. (1995) are all consistent. It is essential that falloff effects are takeninto account, as noted in the comments onk∞.
Atmos. Chem. Phys., 4, 1461–1738, 2004 www.atmos-chem-phys.org/acp/4/1461/
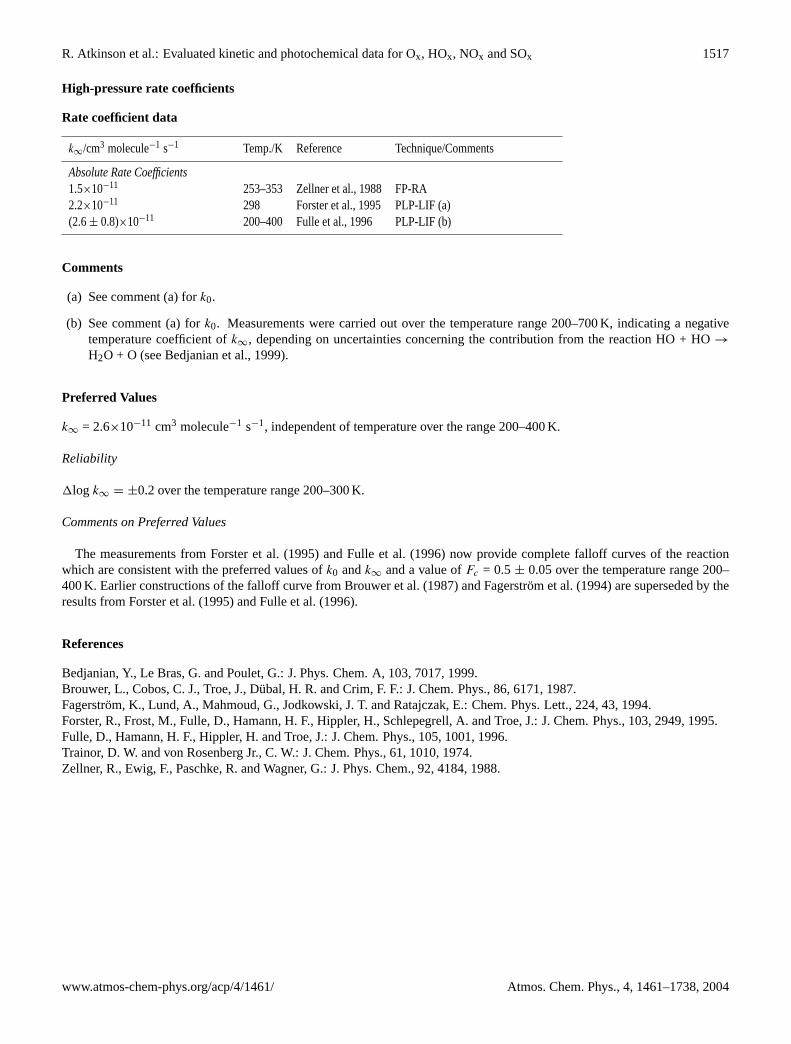
R. Atkinson et al.: Evaluated kinetic and photochemical data for Ox, HOx, NOx and SOx 1517
High-pressure rate coefficients
Rate coefficient data
k∞/cm3 molecule−1 s−1 Temp./K Reference Technique/Comments
Absolute Rate Coefficients1.5×10−11 253–353 Zellner et al., 1988 FP-RA2.2×10−11 298 Forster et al., 1995 PLP-LIF (a)(2.6± 0.8)×10−11 200–400 Fulle et al., 1996 PLP-LIF (b)
Comments
(a) See comment (a) fork0.
(b) See comment (a) fork0. Measurements were carried out over the temperature range 200–700 K, indicating a negativetemperature coefficient ofk∞, depending on uncertainties concerning the contribution from the reaction HO + HO→
H2O + O (see Bedjanian et al., 1999).
Preferred Values
k∞ = 2.6×10⁻¹¹ cm3 molecule−1 s−1, independent of temperature over the range 200–400 K.
Reliability
1log k∞ = ±0.2 over the temperature range 200–300 K.
Comments on Preferred Values
The measurements from Forster et al. (1995) and Fulle et al. (1996) now provide complete falloff curves of the reactionwhich are consistent with the preferred values ofk0 andk∞ and a value ofFc = 0.5± 0.05 over the temperature range 200–400 K. Earlier constructions of the falloff curve from Brouwer et al. (1987) and Fagerstrom et al. (1994) are superseded by theresults from Forster et al. (1995) and Fulle et al. (1996).
References
Bedjanian, Y., Le Bras, G. and Poulet, G.: J. Phys. Chem. A, 103, 7017, 1999.Brouwer, L., Cobos, C. J., Troe, J., Dubal, H. R. and Crim, F. F.: J. Chem. Phys., 86, 6171, 1987.Fagerstrom, K., Lund, A., Mahmoud, G., Jodkowski, J. T. and Ratajczak, E.: Chem. Phys. Lett., 224, 43, 1994.Forster, R., Frost, M., Fulle, D., Hamann, H. F., Hippler, H., Schlepegrell, A. and Troe, J.: J. Chem. Phys., 103, 2949, 1995.Fulle, D., Hamann, H. F., Hippler, H. and Troe, J.: J. Chem. Phys., 105, 1001, 1996.Trainor, D. W. and von Rosenberg Jr., C. W.: J. Chem. Phys., 61, 1010, 1974.Zellner, R., Ewig, F., Paschke, R. and Wagner, G.: J. Phys. Chem., 92, 4184, 1988.
www.atmos-chem-phys.org/acp/4/1461/ Atmos. Chem. Phys., 4, 1461–1738, 2004

1518 R. Atkinson et al.: Evaluated kinetic and photochemical data for Ox, HOx, NOx and SOx
I.A2.23
HO + HO2 → H2O + O2
1H ◦ = −294.6 kJ·mol−1
Rate coefficient data
k/cm3 molecule−1 s−1 Temp./K Reference Technique/Comments
Absolute Rate Coefficients(1.1+0.28
−0.39)×10−10 (1 bar N2) 298 Braun et al., 1982 FP-UVA(1.1± 0.28)×10−10 298 Dransfeld and Wagner, 1986 DF-LMR4.8×10−11 exp[(250± 50)/T ] 254–383 Keyser, 1988 DF-RF(1.1± 0.3)×10−10 299(8.0 )×10−11 298 Schwab et al., 1989 DF-LMR3.3×10−11 1100 Hippler et al., 1995 (a)1.8×10⁻¹¹ 12507.5×10−11 1600
Comments
(a) Thermal decomposition of H2O2 in a shock tube. HO radicals were monitored by resonance absorption.
Preferred Values
k = 1.1×10⁻¹⁰ cm3 molecule−1 s−1 at 298 K.k = 4.8×10⁻¹¹ exp(250/T ) cm3 molecule−1 s−1 over the temperature range 250–400 K.
Reliability
1log k = ±0.1 at 298 K.1(E/R) = ±200 K.
Comments on Preferred Values
There has been some controversy over the effects of pressure on the rate coefficient for this reaction. Early discharge-flowmeasurements at low pressures of 1.3–13 mbar (1–10 Torr) consistently gave values ofk approximately a factor of 2 lower thanthose obtained by other techniques at pressures close to atmospheric. The discharge-flow study of Keyser (1988) appears tohave resolved the problem. These results (Keyser, 1988) suggest that the presence of small quantities of H and O atoms presentin previous discharge-flow studies led to erroneously low values ofk, and that there is no evidence for any variation ink withpressure. These findings (Keyser, 1988) are accepted and we take the expression of Keyser fork as our recommendation. Thereare a number of other studies in excellent agreement with the value recommended fork at 298 K, including relative rate studiesof DeMore (1982) and Cox et al. (1982) which demonstrate thatk(298 K) is unaffected by H2O pressure up to 21 mbar. Thehigh temperature data suggest non-Arrhenius temperature dependence at temperatures above the range of our recommendation.
In another discharge-flow study, Keyser et al. (1985), by monitoring the O2(b16) → X(36) transition at 762 nm, haveshown that the yield of O2(b16) from the reaction is small (<1×10⁻³). The anomalous temperature dependence observed inthe recent high temperature study (Hippler et al., 1995) suggests a mechanism involving intermediate complex formation.
References
Braun, M., Hofzumahaus, A. and Stuhl, F.: Ber. Bunsenges. Phys. Chem., 86, 597, 1982.Cox, R. A., Burrows, J. P. and Wallington, T. J.: Chem. Phys. Lett., 85, 217, 1982.
Atmos. Chem. Phys., 4, 1461–1738, 2004 www.atmos-chem-phys.org/acp/4/1461/
R. Atkinson et al.: Evaluated kinetic and photochemical data for Ox, HOx, NOx and SOx 1519
DeMore, W. B.: J. Phys. Chem., 86, 121, 1982.Dransfield, P. and Wagner, H. Gg.: Z. Naturforsch., 42a, 471, 1986.Hippler, H., Neunaber, N. and Troe, J.: J. Chem. Phys., 103, 3510, 1995.Keyser, L. F.: J. Phys. Chem., 92, 1193, 1988.Keyser, L. F., Choo, K. Y. and Leu, M. T.: Int. J. Chem. Kinet., 17, 1169, 1985.Schwab, J. J., Brune, W. H. and Anderson, J. G.: J. Phys. Chem., 93, 1030, 1989.
www.atmos-chem-phys.org/acp/4/1461/ Atmos. Chem. Phys., 4, 1461–1738, 2004
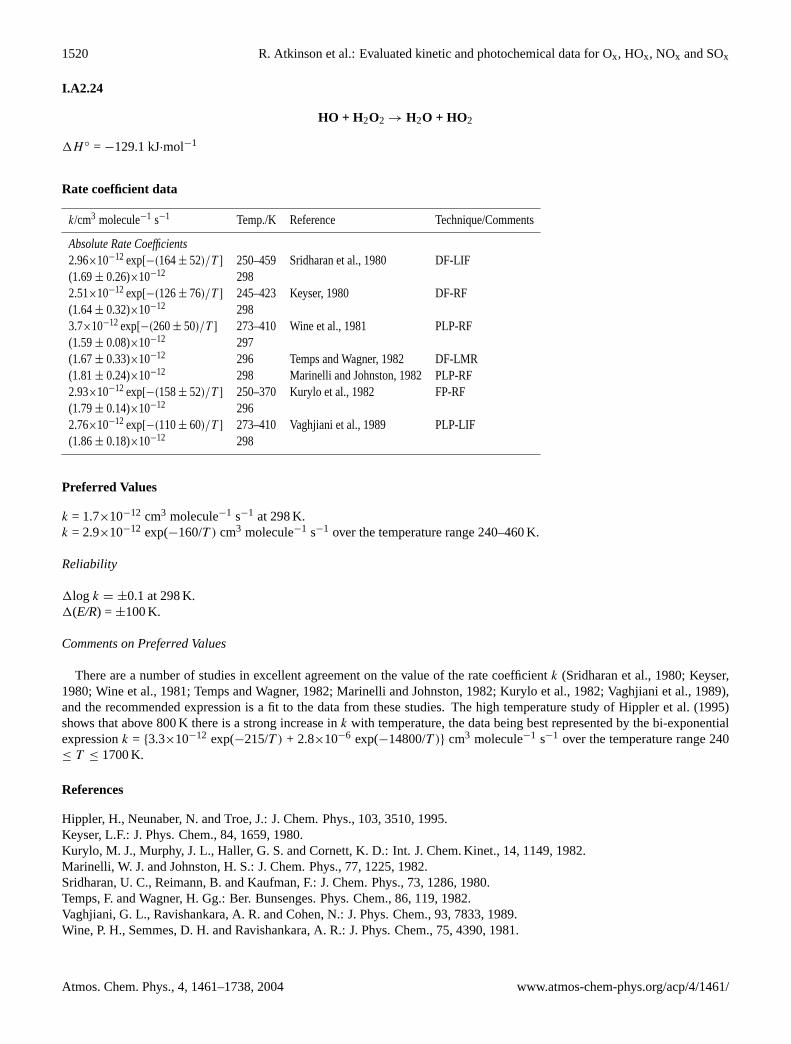
1520 R. Atkinson et al.: Evaluated kinetic and photochemical data for Ox, HOx, NOx and SOx
I.A2.24
HO + H2O2 → H2O + HO2
1H ◦ = −129.1 kJ·mol−1
Rate coefficient data
k/cm3 molecule−1 s−1 Temp./K Reference Technique/Comments
Absolute Rate Coefficients2.96×10−12 exp[−(164± 52)/T ] 250–459 Sridharan et al., 1980 DF-LIF(1.69± 0.26)×10−12 2982.51×10−12 exp[−(126± 76)/T ] 245–423 Keyser, 1980 DF-RF(1.64± 0.32)×10−12 2983.7×10−12 exp[−(260± 50)/T ] 273–410 Wine et al., 1981 PLP-RF(1.59± 0.08)×10−12 297(1.67± 0.33)×10−12 296 Temps and Wagner, 1982 DF-LMR(1.81± 0.24)×10−12 298 Marinelli and Johnston, 1982 PLP-RF2.93×10−12 exp[−(158± 52)/T ] 250–370 Kurylo et al., 1982 FP-RF(1.79± 0.14)×10−12 2962.76×10−12 exp[−(110± 60)/T ] 273–410 Vaghjiani et al., 1989 PLP-LIF(1.86± 0.18)×10−12 298
Preferred Values
k = 1.7×10⁻¹² cm3 molecule−1 s−1 at 298 K.k = 2.9×10⁻¹² exp(−160/T ) cm3 molecule−1 s−1 over the temperature range 240–460 K.
Reliability
1log k = ±0.1 at 298 K.1(E/R) = ±100 K.
Comments on Preferred Values
There are a number of studies in excellent agreement on the value of the rate coefficientk (Sridharan et al., 1980; Keyser,1980; Wine et al., 1981; Temps and Wagner, 1982; Marinelli and Johnston, 1982; Kurylo et al., 1982; Vaghjiani et al., 1989),and the recommended expression is a fit to the data from these studies. The high temperature study of Hippler et al. (1995)shows that above 800 K there is a strong increase ink with temperature, the data being best represented by the bi-exponentialexpressionk = {3.3×10⁻¹² exp(−215/T ) + 2.8×10⁻⁶ exp(−14800/T )} cm3 molecule−1 s−1 over the temperature range 240≤ T ≤ 1700 K.
References
Hippler, H., Neunaber, N. and Troe, J.: J. Chem. Phys., 103, 3510, 1995.Keyser, L.F.: J. Phys. Chem., 84, 1659, 1980.Kurylo, M. J., Murphy, J. L., Haller, G. S. and Cornett, K. D.: Int. J. Chem. Kinet., 14, 1149, 1982.Marinelli, W. J. and Johnston, H. S.: J. Chem. Phys., 77, 1225, 1982.Sridharan, U. C., Reimann, B. and Kaufman, F.: J. Chem. Phys., 73, 1286, 1980.Temps, F. and Wagner, H. Gg.: Ber. Bunsenges. Phys. Chem., 86, 119, 1982.Vaghjiani, G. L., Ravishankara, A. R. and Cohen, N.: J. Phys. Chem., 93, 7833, 1989.Wine, P. H., Semmes, D. H. and Ravishankara, A. R.: J. Phys. Chem., 75, 4390, 1981.
Atmos. Chem. Phys., 4, 1461–1738, 2004 www.atmos-chem-phys.org/acp/4/1461/
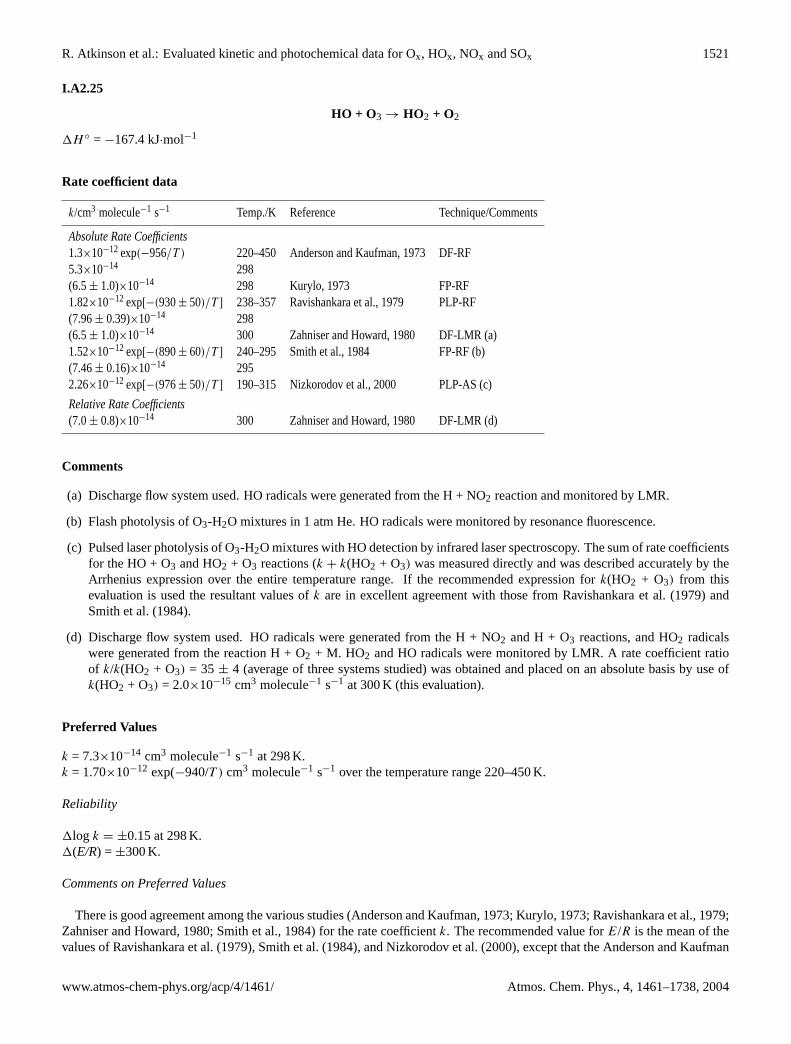
R. Atkinson et al.: Evaluated kinetic and photochemical data for Ox, HOx, NOx and SOx 1521
I.A2.25
HO + O3 → HO2 + O2
1H ◦ = −167.4 kJ·mol−1
Rate coefficient data
k/cm3 molecule−1 s−1 Temp./K Reference Technique/Comments
Absolute Rate Coefficients1.3×10−12 exp(−956/T ) 220–450 Anderson and Kaufman, 1973 DF-RF5.3×10−14 298(6.5± 1.0)×10−14 298 Kurylo, 1973 FP-RF1.82×10−12 exp[−(930± 50)/T ] 238–357 Ravishankara et al., 1979 PLP-RF(7.96± 0.39)×10−14 298(6.5± 1.0)×10−14 300 Zahniser and Howard, 1980 DF-LMR (a)1.52×10⁻¹² exp[−(890± 60)/T ] 240–295 Smith et al., 1984 FP-RF (b)(7.46± 0.16)×10−14 2952.26×10−12 exp[−(976± 50)/T ] 190–315 Nizkorodov et al., 2000 PLP-AS (c)
Relative Rate Coefficients(7.0± 0.8)×10−14 300 Zahniser and Howard, 1980 DF-LMR (d)
Comments
(a) Discharge flow system used. HO radicals were generated from the H + NO2 reaction and monitored by LMR.
(b) Flash photolysis of O3-H2O mixtures in 1 atm He. HO radicals were monitored by resonance fluorescence.
(c) Pulsed laser photolysis of O3-H2O mixtures with HO detection by infrared laser spectroscopy. The sum of rate coefficientsfor the HO + O3 and HO2 + O3 reactions (k + k(HO2 + O3) was measured directly and was described accurately by theArrhenius expression over the entire temperature range. If the recommended expression fork(HO2 + O3) from thisevaluation is used the resultant values ofk are in excellent agreement with those from Ravishankara et al. (1979) andSmith et al. (1984).
(d) Discharge flow system used. HO radicals were generated from the H + NO2 and H + O3 reactions, and HO2 radicalswere generated from the reaction H + O2 + M. HO2 and HO radicals were monitored by LMR. A rate coefficient ratioof k/k(HO2 + O3) = 35 ± 4 (average of three systems studied) was obtained and placed on an absolute basis by use ofk(HO2 + O3) = 2.0×10⁻¹⁵ cm3 molecule−1 s−1 at 300 K (this evaluation).
Preferred Values
k = 7.3×10⁻¹⁴ cm3 molecule−1 s−1 at 298 K.k = 1.70×10⁻¹² exp(−940/T ) cm3 molecule−1 s−1 over the temperature range 220–450 K.
Reliability
1log k = ±0.15 at 298 K.1(E/R) = ±300 K.
Comments on Preferred Values
There is good agreement among the various studies (Anderson and Kaufman, 1973; Kurylo, 1973; Ravishankara et al., 1979;Zahniser and Howard, 1980; Smith et al., 1984) for the rate coefficientk. The recommended value forE/R is the mean of thevalues of Ravishankara et al. (1979), Smith et al. (1984), and Nizkorodov et al. (2000), except that the Anderson and Kaufman
www.atmos-chem-phys.org/acp/4/1461/ Atmos. Chem. Phys., 4, 1461–1738, 2004
1522 R. Atkinson et al.: Evaluated kinetic and photochemical data for Ox, HOx, NOx and SOx
(1973) study gave a somewhat slower rate, probably due to HO regeneration from the HO2 + NO reaction which has beenrevised upwards since this early study. The recommended 298 K rate coefficient is the mean of the values from these studies(Anderson and Kaufman, 1973; Ravishankara et al., 1979; Smith et al., 1984) plus those of Kurylo (1973) and Zahniser andHoward (1980). The pre-exponential factor is derived from the recommended values ofE/R and the 298 K rate coefficient.
References
Anderson, J. G. and Kaufman, F.: Chem. Phys. Lett., 19, 483, 1973.Kurylo, M. J.: Chem. Phys. Lett., 23, 467, 1973.Nizkorodov, S. A., Harper, W. W., Blackman, B. W. and Nesbitt, D. J.: J. Phys. Chem. A, 104, 3964, 2000.Ravishankara, A. R., Wine, P. H. and Langford, A. O.: J. Chem. Phys., 70, 984, 1979.Smith, C. A., Molina, L. T., Lamb, J. J. and Molina, M. J.: Int. J. Chem. Kinet., 16, 41, 1984.Zahniser, M. S. and Howard, C. J.: J. Chem. Phys., 73, 1620, 1980.
Atmos. Chem. Phys., 4, 1461–1738, 2004 www.atmos-chem-phys.org/acp/4/1461/

R. Atkinson et al.: Evaluated kinetic and photochemical data for Ox, HOx, NOx and SOx 1523
I.A2.26I.A2.27
HO2 + HO2 → H2O2 + O2 (1)HO2 + HO2 + M → H2O2 + O2 +M (2)
1H ◦(1) = 1H ◦(2) = −165.5 kJ·mol−1
Rate coefficient data (k = k1 + k2)
k/cm3 molecule−1 s−1 Temp./K Reference Technique/Comments
Absolute Rate Coefficients3.8×10−14 exp[(1250± 200)/T ] 273–339 Cox and Burrows, 1979 MM (a)(2.35± 0.2)×10−12 2982.4×10−13 exp[(560± 200)/T ] 298–359 Thrush and Tyndall, 1982a FP-TDLS (b)(1.6± 0.1)×10−12 2982.5×10−12 (1.013 bar N2) 296 Simonaitis and Heicklen, 1982 FP-UVAk1 = (1.4± 0.2)×10−12 296k1 = 2.2×10⁻¹³ exp(620/T ) 230–420 Kircher and Sander, 1984 FP-UVA (c)k1 = (1.7± 0.22)×10−12 298k2 = 1.9×10⁻³³ [N2] exp(980/T ) 230–420 Kircher and Sander, 1984 FP-UVA (c)k2 = (5.4± 3.1)×10−32 [N2] 298k1 = 1.88×10⁻¹² 298 Kurylo et al., 1986 FP-UVA (d)k2 = 4.53×10⁻³² [O2] 298k2 = 5.95×10⁻³² [N2] 298k1 = 2.0×10⁻¹³ exp[(595± 120)/T ] 253–390 Takacs and Howard, 1986 DF-LMRk1 = (1.54± 0.07)×10−12 294(3.3± 0.9)×10−12 298 Lightfoot et al., 1988 FP-UVA(1.5± 0.5)×10−12 418(8.8± 1.2)×10−13 577(8.2± 2.0)×10−13 623(8.1± 1.5)×10−13 677(7.6± 1.4)×10−13 723(9.1± 2.5)×10−13 777(2.44±0.20)×10−12 (1000 mbar O2) 298 Crowley et al., 1991 MMS(2.84±0.30)×10−12 (1000 mbar N2) 298(3.5±1.0)×10−12 (1000 mbar SF6) 295 Sehested et al., 1997 PR-UVA
Comments
(a) HO2 radicals were monitored by molecular modulation spectrometry. The data cited refer to a total pressure of 1013 mbarand absence of H2O.
(b) HO2 radicals were monitored by diode laser spectroscopy. Pressure = 9–27 mbar (7–20 Torr) of O2.
(c) Pressure range was 0.133–0.933 bar (100–700 Torr) of Ar and N2. Enhancement ofk by added water was observed,in a linear fashion independent of the pressure of other gases, according to the equationkobs = k×(1 + 1.4×10⁻²¹
exp(2200/T ) [H2O]).
(d) Total pressure range was 0.033–1.01 bar (25–760 Torr).
Preferred Values
k1 = 1.6×10⁻¹² cm3 molecule−1 s−1 at 298 K.k2 = 5.2×10⁻³² [N2] cm3 molecule−1 s−1 at 298 K.
www.atmos-chem-phys.org/acp/4/1461/ Atmos. Chem. Phys., 4, 1461–1738, 2004
1524 R. Atkinson et al.: Evaluated kinetic and photochemical data for Ox, HOx, NOx and SOx
k2 = 4.5×10⁻³² [O2] cm3 molecule−1 s−1 at 298 K.k1 = 2.2×10⁻¹³ exp(600/T ) cm3 molecule−1 s−1 over the temperature range 230–420 K.k2 = 1.9×10⁻³³ [N2] exp(980/T ) cm3 molecule−1 s−1 over the temperature range 230–420 K.
In the presence of H2O the expressions fork1 andk2 should be multiplied by the factor:{1 + 1.4×10⁻²¹ [H2O] exp(2200/T )}, where [H2O] is in molecule cm−3 units.
Reliability
1log k1 = 1log k2 = 0.15 at 298 K.1(E1/R) = ±200 K.1(E2/R) = ±300 K.
Comments on Preferred Values
The preferred values given here are identical with the values derived by Kircher and Sander (1984) and also recommendedin the review by Wallington et al. (1992).
At temperatures close to 298 K, the reaction proceeds by two channels, one bimolecular and the other termolecular. Thepreferred values fork1 are based on the work of Cox and Burrows (1979), Thrush and Tyndall (1982a), Kircher and Sander(1984), Kurylo et al. (1986), Takacs and Howard (1986) and Lightfoot et al. (1988). The work of Kurylo et al. (1986) and ofLightfoot et al. (1988) has confirmed quantitatively the effects of pressure previously observed by Simonaitis and Heicklen(1982) and Kircher and Sander (1984). The recommendations fork2 are based on the work of Kircher and Sander (1984) andKurylo et al. (1986), with the temperature coefficient ofk2 being taken from Kircher and Sander (1984) and Lightfoot et al.(1988). At higher temperatures,T >600 K, Hippler et al. (1990) and Lightfoot et al. (1988) observe a sharp change in thetemperature coefficient with upward curvature of the Arrhenius plot.
The marked effect of water on this reaction was established in the work of Lii et al. (1981) and Kircher and Sander (1984).The recommended multiplying factor fork1 andk2 in the presence of water is based on these two studies.
Mozurkewich and Benson (1985) have considered the HO2 + HO2 reaction theoretically and conclude that the negativetemperature dependence, the pressure dependence, and the observed isotope effects can most reasonably be explained in termsof a cyclic hydrogen bonded, HO2 O2H, intermediate to alternative structures suggested by others.
Sahetchian et al. (1982) reported the formation of H2 (∼10% at 500 K) in the reaction system but this is contrary to earlierevidence of Baldwin et al. (1984) and the more recent and careful study of Stephens et al. (1989), who find less than 0.01fractional contribution from the channel leading to H2 + 2O2. Keyser et al. (1985) have measured a yield of O2(b16) of<3×10⁻² per HO2 consumed.
References
Baldwin, R. R., Dean, C. E., Honeyman, M. R. and Walker, R. W.: J. Chem. Soc. Faraday 1, 80, 3187, 1984.Cox, R. A. and Burrows, J. P.: J. Phys. Chem., 83, 2560, 1979.Crowley, J. N., Simon, F. G., Burrows, J. P., Moortgat, G. K., Hippler, H., Troe, J. and Willner, J: J. Chem. Phys., 93, 1755,1990.Jenkin, M. E. and Cox, R. A.: J. Photochem. Photobiol. A: Chem., 60, 1, 1991.Keyser, L. F, Choo, K. Y. and Leu, M. T.: Int. J. Chem. Kinet., 17, 1169, 1985.Kircher, C. C. and Sander, S. P.: J. Phys. Chem., 88, 2082, 1984.Kurylo, M. J., Ouellette, P. A. and Laufer, A. H.: J. Phys. Chem., 90, 437, 1986.Lightfoot, P. D., Veyret, B. and Lesclaux, R.: Chem. Phys. Lett., 150, 120, 1988.Lii, R. -R. , Sauer Jr., M. C. and Gordon, S.: J. Phys. Chem., 85, 2833, 1981.Mozurkewich, M. and Benson, S. W.: Int. J. Chem. Kinet., 17, 787, 1985.Sahetchian, K. A., Heiss, A. and Rigny, R.: Can. J. Chem., 60, 2896, 1982.Sander, S. P.: J. Phys. Chem., 88, 6018, 1984.Sander, S. P., Peterson, M., Watson, R. T. and Patrick, R.: J. Phys. Chem., 86, 1236, 1982.Sehested, J., Mogelberg, T., Fagerstrom, K., Mahmoud, G. and Wallington, T. J.: Int. J. Chem. Kinet., 29, 673, 1997.Simonaitis, R. and Heicklen, J.: J. Phys. Chem., 86, 3416, 1982.Stephens, S. L., Birks, J. W. and Glinski, R. J.: J. Phys. Chem., 93, 8384, 1989.
Atmos. Chem. Phys., 4, 1461–1738, 2004 www.atmos-chem-phys.org/acp/4/1461/

R. Atkinson et al.: Evaluated kinetic and photochemical data for Ox, HOx, NOx and SOx 1525
Takacs, G. A. and Howard, C. J.: J. Phys. Chem., 90, 687, 1986.Thrush, B. A. and Tyndall, G. S.: Chem. Phys. Lett., 92, 232, 1982a.Thrush, B. A. and Tyndall, G. S.: J. Chem. Soc. Faraday Trans. 2, 78, 1469, 1982b.Wallington, T. J., Dagaut, P. and Kurylo, M. J.: Chem. Rev., 92, 667, 1992.
www.atmos-chem-phys.org/acp/4/1461/ Atmos. Chem. Phys., 4, 1461–1738, 2004

1526 R. Atkinson et al.: Evaluated kinetic and photochemical data for Ox, HOx, NOx and SOx
I.A2.28
HO2 + O3 → HO + 2O2
1H ◦ = −118 kJ·mol−1
Rate coefficient data
k/cm3 molecule−1 s−1 Temp./K Reference Technique/Comments
Absolute Rate Coefficients1.4×10−14 exp[(−580± 100)/T ] 245–365 Zahniser and Howard, 1980 DF-LMR2.0×10−15 2981.8×10−14 exp[(−680± 148/T ] 253–400 Wang et al., 1988 DF (a)(1.3± 0.3)×10−15 233–253(1.9± 0.3)×10−15 298(103± 51)[exp[−(1323± 160)/T ] + 0.88]×10−15 197–297 Herndon et al., 2001 DF-TDLAS (b)(2.0± 0.2)×10−15 295
Comments
(a) HO2 radicals were monitored by photodissociation at 147 nm and HO radicals were detected by HO(A-X) fluorescenceat 310 nm.
(b) Used turbulent flow reactor with pressure range 80–175 Torr. H18O2 monitored in excess16O3 to avoid reformation ofreactant.
Preferred Values
k = 2.0×10⁻¹⁵ cm3 molecule−1 s−1 at 298 K.k = 2.03×10⁻¹⁶ (T /300)4.57 exp(693/T ) cm3 molecule−1 s−1 over the temperature range 250–340 K.
Reliability
1log k = ±0.2 at 298 K.1(E/R) = +500K
−100K
Comments on Preferred Values
A number of studies (Zahniser and Howard, 1980; Wang et al., 1988; Herndon et al., 2001; Manzanares et al., 1986; Sinhaet al., 1987) are in close agreement on the value ofk at 298 K, but there is some divergence concerning the temperaturecoefficient ofk. The studies of Sinha et al. (1987), Wang et al. (1988) and Herndon et al. (2001) agree thatk exhibits non-Arrhenius behavior which is particularly noticeable atT < 250 K. There are experimental difficulties in working at thesetemperatures. At higher temperature the results from these two studies (Wang et al., 1988 and Sinha et al., 1987) also diverge,giving values ofk differing by nearly a factor of 2 at 400 K. We therefore limit the temperature range of our recommendationto T < 340 K until this discrepancy is resolved.
The preferred value at 298 K is a mean of the results of Zahniser and Howard (1980), Wang et al. (1988), Herndon etal. (2001) and Sinha et al. (1987). The comparative dependent expression is obtained by putting an expression of formAT nexp(E/RT) to the data of Herndon et al. (2001) atT ≤ 297 K and the averaged data of Zahniser (1980), Wang (1988)and Sinha (1987) at 298< T < 340 K.
Isotopic exchange studies (Nelson et al., 1994) of the reaction between H18O2 and O3 show that at room temperatures thereaction proceeds almost exclusively by H atom transfer rather than by transfer of an oxygen atom. Moreover there is littlechange in this finding with temperature over the range 226–355K (Nelson et al., 1994), indicating that any curvature on theArrhenius plot cannot be due to competition between these two reaction paths.
Atmos. Chem. Phys., 4, 1461–1738, 2004 www.atmos-chem-phys.org/acp/4/1461/
R. Atkinson et al.: Evaluated kinetic and photochemical data for Ox, HOx, NOx and SOx 1527
References
Herndon, S. C., Malta, P. W. V., Nelson, D. D., Jayne, J. T. and Zahniser, M. S.:J. Phys. Chem. A, 105, 1583, 2001.Manzanares, E. R., Suto, M., Lee, L. C. and Coffey Jr., D.: J. Chem. Phys., 85, 5027, 1986.Nelson Jr., D. D. and Zahniser, M. S.: J. Phys. Chem., 98, 2101, 1994.Sinha, A., Lovejoy, E. R. and Howard, C. J.: J. Chem. Phys., 87, 2122, 1987.Wang, X., Suto, M. and Lee, L. C.: J. Chem. Phys., 88, 896, 1988.Zahniser, M. S. and Howard, C. J. :J. Chem. Phys., 73, 1620, 1980.
www.atmos-chem-phys.org/acp/4/1461/ Atmos. Chem. Phys., 4, 1461–1738, 2004
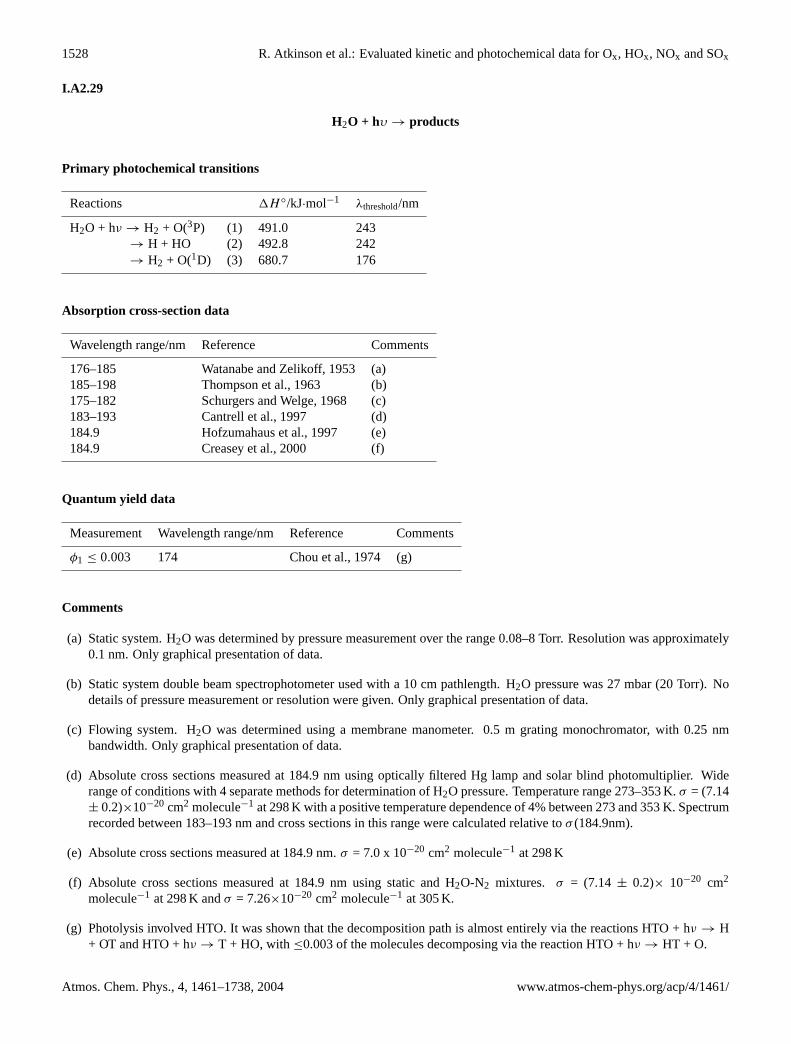
1528 R. Atkinson et al.: Evaluated kinetic and photochemical data for Ox, HOx, NOx and SOx
I.A2.29
H2O + hυ → products
Primary photochemical transitions
Reactions 1H ◦/kJ·mol−1 λthreshold/nm
H2O + hν → H2 + O(3P) (1) 491.0 243→ H + HO (2) 492.8 242→ H2 + O(1D) (3) 680.7 176
Absorption cross-section data
Wavelength range/nm Reference Comments
176–185 Watanabe and Zelikoff, 1953 (a)185–198 Thompson et al., 1963 (b)175–182 Schurgers and Welge, 1968 (c)183–193 Cantrell et al., 1997 (d)184.9 Hofzumahaus et al., 1997 (e)184.9 Creasey et al., 2000 (f)
Quantum yield data
Measurement Wavelength range/nm Reference Comments
φ1 ≤ 0.003 174 Chou et al., 1974 (g)
Comments
(a) Static system. H2O was determined by pressure measurement over the range 0.08–8 Torr. Resolution was approximately0.1 nm. Only graphical presentation of data.
(b) Static system double beam spectrophotometer used with a 10 cm pathlength. H2O pressure was 27 mbar (20 Torr). Nodetails of pressure measurement or resolution were given. Only graphical presentation of data.
(c) Flowing system. H2O was determined using a membrane manometer. 0.5 m grating monochromator, with 0.25 nmbandwidth. Only graphical presentation of data.
(d) Absolute cross sections measured at 184.9 nm using optically filtered Hg lamp and solar blind photomultiplier. Widerange of conditions with 4 separate methods for determination of H2O pressure. Temperature range 273–353 K.σ = (7.14± 0.2)×10−20 cm2 molecule−1 at 298 K with a positive temperature dependence of 4% between 273 and 353 K. Spectrumrecorded between 183–193 nm and cross sections in this range were calculated relative toσ (184.9nm).
(e) Absolute cross sections measured at 184.9 nm.σ = 7.0 x 10⁻²⁰ cm2 molecule−1 at 298 K
(f) Absolute cross sections measured at 184.9 nm using static and H2O-N2 mixtures. σ = (7.14 ± 0.2)× 10−20 cm2
molecule−1 at 298 K andσ = 7.26×10⁻²⁰ cm2 molecule−1 at 305 K.
(g) Photolysis involved HTO. It was shown that the decomposition path is almost entirely via the reactions HTO + hν → H+ OT and HTO + hν → T + HO, with≤0.003 of the molecules decomposing via the reaction HTO + hν → HT + O.
Atmos. Chem. Phys., 4, 1461–1738, 2004 www.atmos-chem-phys.org/acp/4/1461/
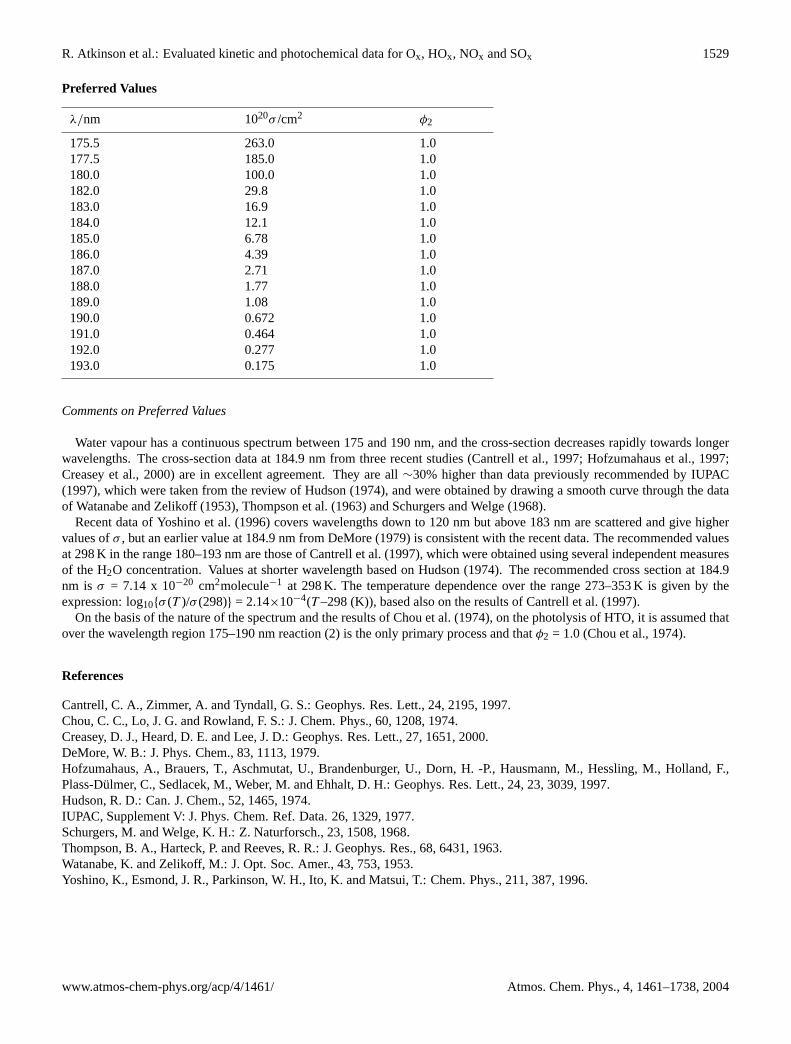
R. Atkinson et al.: Evaluated kinetic and photochemical data for Ox, HOx, NOx and SOx 1529
Preferred Values
λ/nm 1020σ /cm2 φ2
175.5 263.0 1.0177.5 185.0 1.0180.0 100.0 1.0182.0 29.8 1.0183.0 16.9 1.0184.0 12.1 1.0185.0 6.78 1.0186.0 4.39 1.0187.0 2.71 1.0188.0 1.77 1.0189.0 1.08 1.0190.0 0.672 1.0191.0 0.464 1.0192.0 0.277 1.0193.0 0.175 1.0
Comments on Preferred Values
Water vapour has a continuous spectrum between 175 and 190 nm, and the cross-section decreases rapidly towards longerwavelengths. The cross-section data at 184.9 nm from three recent studies (Cantrell et al., 1997; Hofzumahaus et al., 1997;Creasey et al., 2000) are in excellent agreement. They are all∼30% higher than data previously recommended by IUPAC(1997), which were taken from the review of Hudson (1974), and were obtained by drawing a smooth curve through the dataof Watanabe and Zelikoff (1953), Thompson et al. (1963) and Schurgers and Welge (1968).
Recent data of Yoshino et al. (1996) covers wavelengths down to 120 nm but above 183 nm are scattered and give highervalues ofσ , but an earlier value at 184.9 nm from DeMore (1979) is consistent with the recent data. The recommended valuesat 298 K in the range 180–193 nm are those of Cantrell et al. (1997), which were obtained using several independent measuresof the H2O concentration. Values at shorter wavelength based on Hudson (1974). The recommended cross section at 184.9nm is σ = 7.14 x 10⁻²⁰ cm2molecule−1 at 298 K. The temperature dependence over the range 273–353 K is given by theexpression: log10{σ (T )/σ (298)} = 2.14×10⁻⁴(T –298 (K)), based also on the results of Cantrell et al. (1997).
On the basis of the nature of the spectrum and the results of Chou et al. (1974), on the photolysis of HTO, it is assumed thatover the wavelength region 175–190 nm reaction (2) is the only primary process and thatφ2 = 1.0 (Chou et al., 1974).
References
Cantrell, C. A., Zimmer, A. and Tyndall, G. S.: Geophys. Res. Lett., 24, 2195, 1997.Chou, C. C., Lo, J. G. and Rowland, F. S.: J. Chem. Phys., 60, 1208, 1974.Creasey, D. J., Heard, D. E. and Lee, J. D.: Geophys. Res. Lett., 27, 1651, 2000.DeMore, W. B.: J. Phys. Chem., 83, 1113, 1979.Hofzumahaus, A., Brauers, T., Aschmutat, U., Brandenburger, U., Dorn, H. -P., Hausmann, M., Hessling, M., Holland, F.,Plass-Dulmer, C., Sedlacek, M., Weber, M. and Ehhalt, D. H.: Geophys. Res. Lett., 24, 23, 3039, 1997.Hudson, R. D.: Can. J. Chem., 52, 1465, 1974.IUPAC, Supplement V: J. Phys. Chem. Ref. Data. 26, 1329, 1977.Schurgers, M. and Welge, K. H.: Z. Naturforsch., 23, 1508, 1968.Thompson, B. A., Harteck, P. and Reeves, R. R.: J. Geophys. Res., 68, 6431, 1963.Watanabe, K. and Zelikoff, M.: J. Opt. Soc. Amer., 43, 753, 1953.Yoshino, K., Esmond, J. R., Parkinson, W. H., Ito, K. and Matsui, T.: Chem. Phys., 211, 387, 1996.
www.atmos-chem-phys.org/acp/4/1461/ Atmos. Chem. Phys., 4, 1461–1738, 2004

1530 R. Atkinson et al.: Evaluated kinetic and photochemical data for Ox, HOx, NOx and SOx
I.A2.30
H2O2 + hν → products
Primary photochemical processes
Reaction 1H ◦/kJ·mol−1 λthreshold/nm
H2O2 + hν → HO + HO (1) 215 557→ H2O + O(1D) (2) 333 359→ H + HO2 (3) 369 324→ HO + HO(26) (4) 606 197
Quantum Yield Data
(φ = φ1 + φ2 + φ3 + φ4)
Measurement Wavelength Reference CommentsRange/nm
φ3 = 0.12 193 Gerlach-Meyer et al., 1987 (a)φ1 = 1.04± 0.18 248 Vaghjiani and Ravishankara, 1990 (b)φ2 < 0.002 248φ3 < 0.0002 248φ1 = 1.01± 0.17 222 Vaghjiani et al., 1992 (c)φ2 < 0.002 222φ3 = 0.024± 0.012 222φ3 = 0.16± 0.04 193φ1 = 0.79± 0.12 248 Schiffman et al., 1993 (d)
Comments
(a) Pulsed laser photolysis of H2O2 with H-atom detection by laser-induced fluorescence.
(b) Pulsed photolysis of flowing mixtures of H2O2-H2O-N2 (or He) and of O3-H2O-N2 (or He) at 298 K. H2O2 and O3 weredetermined by UV absorption at 213.9 nm or 228.8 nm. Quantum yield of HO radical formation from H2O2-H2O mixturewas measured relative to that from O3-H2O mixture. These relative yields were placed on an absolute basis using theknown quantum yield of HO radical production from the photolysis of O3-H2O mixtures at 248 nm, taken asφ(HO) =1.73± 0.09 (Vagjiani and Ravishankara, 1990, Wine and Ravishankara, 1982). O and H atom yields were determined byresonance fluorescence.
(c) Pulsed laser photolysis of H2O2-N2 or SF6 mixtures at 222 nm and 248 nm. [HO] monitored by LIF. The quantum yield ofHO radical production at 248 nm was assumed to be 2.0 and the value at 222 nm was determined from this and the relativeHO yields at the two wavelengths. H atom concentrations were monitored by resonance fluorescence. The quantum yieldwas determined by reference to CH3SH photolysis at 193 nm. O(3P) atom formation was investigated using resonancefluorescence but only a very small signal was detected, possibly due to secondary chemistry.
(d) Pulsed laser photolysis of H2O2 mixtures. Energy, and hence number of photons, of laser pulse absorbed determined bycalorimetry. HO radical concentrations were monitored by infrared absorption using a color center dye-laser (2.35–3.40µm) and interferometer for wavelength measurement. Absolute HO radical concentrations were obtained using integratedabsorption cross-sections measured in the same laboratory.
Atmos. Chem. Phys., 4, 1461–1738, 2004 www.atmos-chem-phys.org/acp/4/1461/
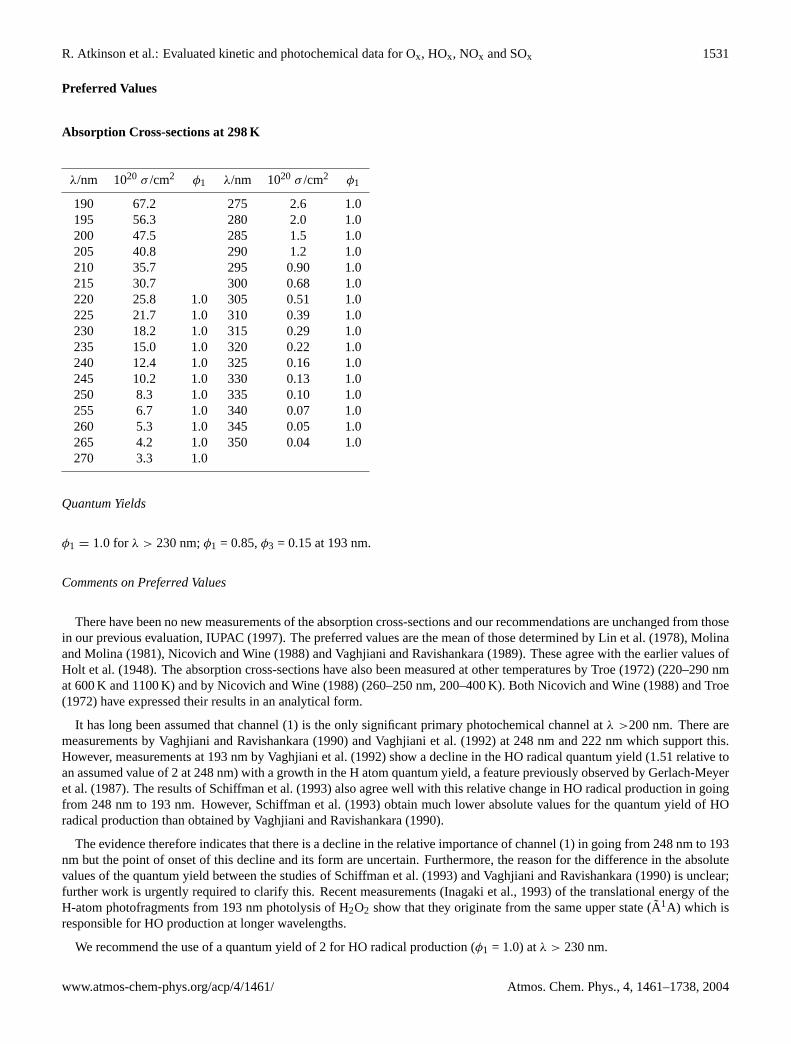
R. Atkinson et al.: Evaluated kinetic and photochemical data for Ox, HOx, NOx and SOx 1531
Preferred Values
Absorption Cross-sections at 298 K
λ/nm 1020 σ /cm2 φ1 λ/nm 1020 σ /cm2 φ1
190 67.2 275 2.6 1.0195 56.3 280 2.0 1.0200 47.5 285 1.5 1.0205 40.8 290 1.2 1.0210 35.7 295 0.90 1.0215 30.7 300 0.68 1.0220 25.8 1.0 305 0.51 1.0225 21.7 1.0 310 0.39 1.0230 18.2 1.0 315 0.29 1.0235 15.0 1.0 320 0.22 1.0240 12.4 1.0 325 0.16 1.0245 10.2 1.0 330 0.13 1.0250 8.3 1.0 335 0.10 1.0255 6.7 1.0 340 0.07 1.0260 5.3 1.0 345 0.05 1.0265 4.2 1.0 350 0.04 1.0270 3.3 1.0
Quantum Yields
φ1 = 1.0 for λ > 230 nm;φ1 = 0.85,φ3 = 0.15 at 193 nm.
Comments on Preferred Values
There have been no new measurements of the absorption cross-sections and our recommendations are unchanged from thosein our previous evaluation, IUPAC (1997). The preferred values are the mean of those determined by Lin et al. (1978), Molinaand Molina (1981), Nicovich and Wine (1988) and Vaghjiani and Ravishankara (1989). These agree with the earlier values ofHolt et al. (1948). The absorption cross-sections have also been measured at other temperatures by Troe (1972) (220–290 nmat 600 K and 1100 K) and by Nicovich and Wine (1988) (260–250 nm, 200–400 K). Both Nicovich and Wine (1988) and Troe(1972) have expressed their results in an analytical form.
It has long been assumed that channel (1) is the only significant primary photochemical channel atλ >200 nm. There aremeasurements by Vaghjiani and Ravishankara (1990) and Vaghjiani et al. (1992) at 248 nm and 222 nm which support this.However, measurements at 193 nm by Vaghjiani et al. (1992) show a decline in the HO radical quantum yield (1.51 relative toan assumed value of 2 at 248 nm) with a growth in the H atom quantum yield, a feature previously observed by Gerlach-Meyeret al. (1987). The results of Schiffman et al. (1993) also agree well with this relative change in HO radical production in goingfrom 248 nm to 193 nm. However, Schiffman et al. (1993) obtain much lower absolute values for the quantum yield of HOradical production than obtained by Vaghjiani and Ravishankara (1990).
The evidence therefore indicates that there is a decline in the relative importance of channel (1) in going from 248 nm to 193nm but the point of onset of this decline and its form are uncertain. Furthermore, the reason for the difference in the absolutevalues of the quantum yield between the studies of Schiffman et al. (1993) and Vaghjiani and Ravishankara (1990) is unclear;further work is urgently required to clarify this. Recent measurements (Inagaki et al., 1993) of the translational energy of theH-atom photofragments from 193 nm photolysis of H2O2 show that they originate from the same upper state (A1A) which isresponsible for HO production at longer wavelengths.
We recommend the use of a quantum yield of 2 for HO radical production (φ1 = 1.0) atλ > 230 nm.
www.atmos-chem-phys.org/acp/4/1461/ Atmos. Chem. Phys., 4, 1461–1738, 2004
1532 R. Atkinson et al.: Evaluated kinetic and photochemical data for Ox, HOx, NOx and SOx
References
Gerlach-Meyer, V., Linnebach, E., Kleinermanns, K. and Wolfrum, J.: Chem. Phys. Lett., 133, 113, 1987.Holt, R. B., McLane, C. K. and Oldenberg, O.: J. Chem. Phys., 16, 225, 638 [erratum], 1948.Inagaki, Y., Matsumi, Y. and Kawasaki, M.: Bull Chem. Soc. Jpn., 66, 3166, 1993.IUPAC, Supplement V: J. Phys. Chem. Ref. Data, 26, 1329, 1997.Lin, C. L., Rohatgi, N. K. and DeMore, W. B.: Geophys. Res. Lett., 5, 113, 1978.Molina, L. T. and Molina, M. J.:J. Photochem., 15, 97, 1981.Nicovich, J. M. and Wine, P. H.: J. Geophys. Res., 93, 2417, 1988.Schiffman, A., Nelson Jr., D. D. and Nesbitt, D. J.: J. Chem. Phys., 98, 6935, 1993.Troe, J.: Helv. Chim. Acta, 55, 205, 1972.Vaghjiani, G. L. and Ravishankara, A. R.: J. Geophys. Res., 94, 3487, 1989.Vaghjiani, G. L. and Ravishankara, A. R.: J. Chem. Phys., 92, 996, 1990.Vaghjiani, G. L., Turnipseed, A. A., Warren, R. F. and Ravishankara, A. R.: J. Chem. Phys., 96, 5878, 1992.Wine, P. H. and Ravishankara, A. R.: Chem. Phys., 69, 365, 1982.Nelson Jr., D. D., Schiffman, A. and Nesbitt, D. J.: J. Chem. Phys., 90, 5455, 1989.
Atmos. Chem. Phys., 4, 1461–1738, 2004 www.atmos-chem-phys.org/acp/4/1461/
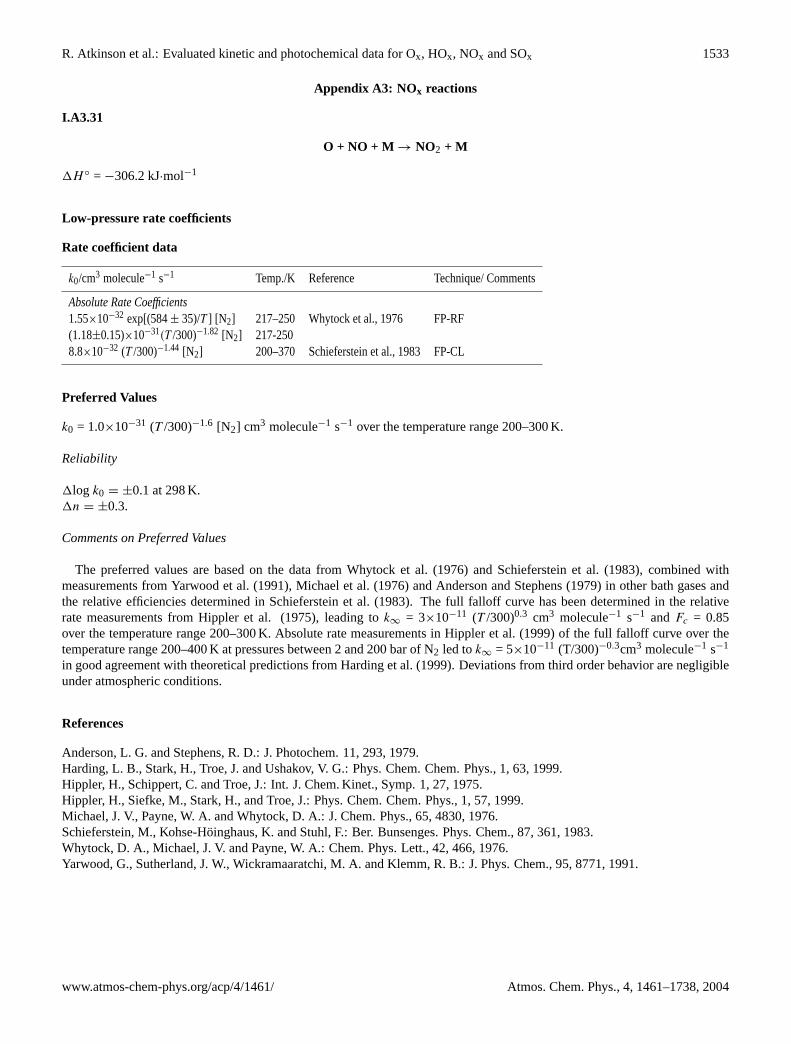
R. Atkinson et al.: Evaluated kinetic and photochemical data for Ox, HOx, NOx and SOx 1533
Appendix A3: NOx reactions
I.A3.31
O + NO + M → NO2 + M
1H ◦ = −306.2 kJ·mol−1
Low-pressure rate coefficients
Rate coefficient data
k0/cm3 molecule−1 s−1 Temp./K Reference Technique/ Comments
Absolute Rate Coefficients1.55×10−32 exp[(584± 35)/T ] [N2] 217–250 Whytock et al., 1976 FP-RF(1.18±0.15)×10−31(T /300)−1.82 [N2] 217-2508.8×10−32 (T /300)−1.44 [N2] 200–370 Schieferstein et al., 1983 FP-CL
Preferred Values
k0 = 1.0×10⁻³¹ (T /300)−1.6 [N2] cm3 molecule−1 s−1 over the temperature range 200–300 K.
Reliability
1log k0 = ±0.1 at 298 K.1n = ±0.3.
Comments on Preferred Values
The preferred values are based on the data from Whytock et al. (1976) and Schieferstein et al. (1983), combined withmeasurements from Yarwood et al. (1991), Michael et al. (1976) and Anderson and Stephens (1979) in other bath gases andthe relative efficiencies determined in Schieferstein et al. (1983). The full falloff curve has been determined in the relativerate measurements from Hippler et al. (1975), leading tok∞ = 3×10⁻¹¹ (T /300)0.3 cm3 molecule−1 s−1 and Fc = 0.85over the temperature range 200–300 K. Absolute rate measurements in Hippler et al. (1999) of the full falloff curve over thetemperature range 200–400 K at pressures between 2 and 200 bar of N2 led tok∞ = 5×10⁻¹¹ (T/300)−0.3cm3 molecule−1 s−1
in good agreement with theoretical predictions from Harding et al. (1999). Deviations from third order behavior are negligibleunder atmospheric conditions.
References
Anderson, L. G. and Stephens, R. D.: J. Photochem. 11, 293, 1979.Harding, L. B., Stark, H., Troe, J. and Ushakov, V. G.: Phys. Chem. Chem. Phys., 1, 63, 1999.Hippler, H., Schippert, C. and Troe, J.: Int. J. Chem. Kinet., Symp. 1, 27, 1975.Hippler, H., Siefke, M., Stark, H., and Troe, J.: Phys. Chem. Chem. Phys., 1, 57, 1999.Michael, J. V., Payne, W. A. and Whytock, D. A.: J. Chem. Phys., 65, 4830, 1976.Schieferstein, M., Kohse-Hoinghaus, K. and Stuhl, F.: Ber. Bunsenges. Phys. Chem., 87, 361, 1983.Whytock, D. A., Michael, J. V. and Payne, W. A.: Chem. Phys. Lett., 42, 466, 1976.Yarwood, G., Sutherland, J. W., Wickramaaratchi, M. A. and Klemm, R. B.: J. Phys. Chem., 95, 8771, 1991.
www.atmos-chem-phys.org/acp/4/1461/ Atmos. Chem. Phys., 4, 1461–1738, 2004

1534 R. Atkinson et al.: Evaluated kinetic and photochemical data for Ox, HOx, NOx and SOx
I.A3.32
O + NO2 → O2+ NO
1H ◦ = −192.1 kJ mol−1
Rate coefficient data
k/cm3 molecule−1 s−1 Temp./K Reference Technique/Comments
Absolute Rate Coefficients9.3×10−12 296 Slanger et al., 1973 DF-CL (a)1.05×10⁻¹¹ 240(1.0± 0.1)×10−11 298 Ongstad and Birks, 1984 DF-CL (a)6.58×10⁻¹² exp[(142± 23)/T ] 224–354 Ongstad and Birks, 1986 DF-CL (a)(1.03± 0.09)×10−11 2985.21×10−12 exp[(202± 27)/T ] 233–357 Geers-Muller and Stuhl, 1987 PLP-CL (b)(1.02± 0.02)×10−11 301(9.3± 1.0)×10−12 298 Paulson et al., 1995 PLP-RF (c)5.26×10⁻¹² exp[(209± 35)/T ] 220–412 Gierczak et al., 1999 PLP-RF (d)(1.06± 0.08)×10−11 298
Comments
(a) O(3P) atoms were monitored by O + NO chemiluminescence.
(b) O(3P) atoms were generated by photolysis of NO. O(3P) atoms were monitored by O + NO chemiluminescence. Valuesfor k(O + N2O4) andk(O + N2O5) were also estimated from the results.
(c) O(3P) atoms were generated by pulsed laser photolysis of NO2 at 308 nm. NO2 concentrations were determined bycomparison of the UV absorption in pure NO2 with that in the He/NO2 mixtures which were flowed through the photolysiscell.
(d) O(3P) atoms were generated by pulsed laser photolysis of NO2 at 308 nm. Three methods were used to determine theNO2 concentration: (i) UV absorption, (ii) flow measurements based on the drop in pressure from a calibrated volume,(iii) chemical titration using an excess of O3to convert a measured flow of NO to NO2. The UV cross sections used weremeasured at 413 nm as a function of temperature and combined with those of Harder et al. (1997), with which they are inclose agreement.
Preferred Values
k= 1.0×10⁻¹¹ cm3 molecule−1 s−1 at 298 K.k = 5.5×10⁻¹² exp(188/T ) cm3 molecule−1 s−1 over the temperature range 220–420 K.
Reliability
1log k = ± 0.06 at 298 K.1(E/R) = ± 80 K.
Comments on Preferred Values
The preferred value ofk at 298 K is the average of the values obtained by Slanger et al. (1973), Ongsted and Birks (1984;1986), Geers-Muller and Stuhl (1987), Paulson et al. (1995) and Gierczak et al. (1999), and the temperature dependence isfrom an unweighted least squares fit to the data from the same studies.
The earlier studies of Davis et al. (1973) and Bemand et al. (1974) are in satisfactory agreement with the other studies butshow greater scatter than the more recent studies, and are not used in arriving at our preferred values.
Atmos. Chem. Phys., 4, 1461–1738, 2004 www.atmos-chem-phys.org/acp/4/1461/

R. Atkinson et al.: Evaluated kinetic and photochemical data for Ox, HOx, NOx and SOx 1535
References
Bemand, P. P., Clyne, M. A. A. and Watson, R. T.: J. Chem. Soc. Faraday Trans. 2, 70, 564, 1974.Davis, D. D., Herron, J. T. and Huie, R. E.: J. Chem. Phys., 58, 530, 1973.Geers-Muller, R. and Stuhl, F.: Chem. Phys. Lett., 135, 263, 1987.Gierczak, T., Burkholder, J. B. and Ravishankara, A. R.: J. Phys. Chem. A, 103, 877, 1999.Harder, J. W., Brault, J. W., Johnston, P. V. and Mount, G. H.: J. Geophys. Res., 102, 3861, 1997.Ongstad, A. P. and Birks, J. W.: J. Chem. Phys., 81, 3922, 1984.Ongstad, A. P. and Birks, J. W.: J. Chem. Phys., 85, 3359, 1986.Paulson, S. E., Orlando, J. J., Tyndall, G. S. and Calvert, J. G.: Int. J. Chem. Kinet., 27, 997, 1995.Slanger, T. G., Wood, B. J. and Black, G.: Int. J. Chem. Kinet., 5, 615, 1973.
www.atmos-chem-phys.org/acp/4/1461/ Atmos. Chem. Phys., 4, 1461–1738, 2004
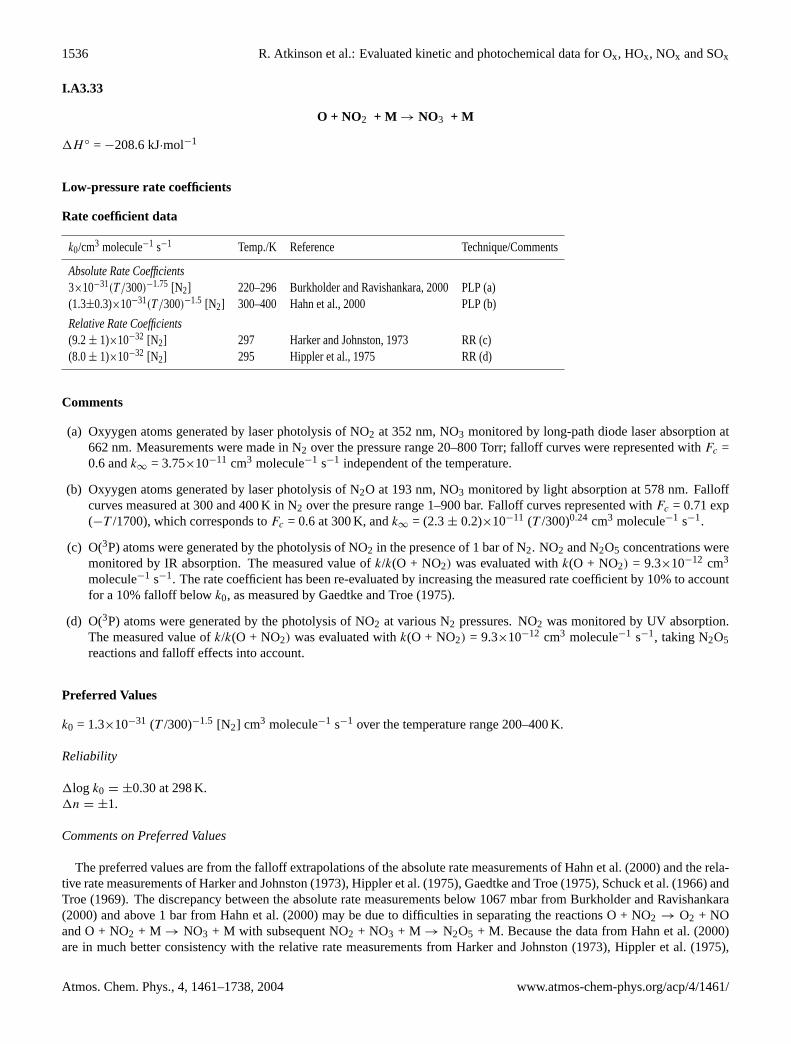
1536 R. Atkinson et al.: Evaluated kinetic and photochemical data for Ox, HOx, NOx and SOx
I.A3.33
O + NO2 + M → NO3 + M
1H ◦ = −208.6 kJ·mol−1
Low-pressure rate coefficients
Rate coefficient data
k0/cm3 molecule−1 s−1 Temp./K Reference Technique/Comments
Absolute Rate Coefficients3×10−31(T /300)−1.75 [N2] 220–296 Burkholder and Ravishankara, 2000 PLP (a)(1.3±0.3)×10−31(T /300)−1.5 [N2] 300–400 Hahn et al., 2000 PLP (b)
Relative Rate Coefficients(9.2± 1)×10−32 [N2] 297 Harker and Johnston, 1973 RR (c)(8.0± 1)×10−32 [N2] 295 Hippler et al., 1975 RR (d)
Comments
(a) Oxyygen atoms generated by laser photolysis of NO2 at 352 nm, NO3 monitored by long-path diode laser absorption at662 nm. Measurements were made in N2 over the pressure range 20–800 Torr; falloff curves were represented withFc =0.6 andk∞ = 3.75×10⁻¹¹ cm3 molecule−1 s−1 independent of the temperature.
(b) Oxyygen atoms generated by laser photolysis of N2O at 193 nm, NO3 monitored by light absorption at 578 nm. Falloffcurves measured at 300 and 400 K in N2 over the presure range 1–900 bar. Falloff curves represented withFc = 0.71 exp(−T /1700), which corresponds toFc = 0.6 at 300 K, andk∞ = (2.3± 0.2)×10−11 (T /300)0.24 cm3 molecule−1 s−1.
(c) O(3P) atoms were generated by the photolysis of NO2 in the presence of 1 bar of N2. NO2 and N2O5 concentrations weremonitored by IR absorption. The measured value ofk/k(O + NO2) was evaluated withk(O + NO2) = 9.3×10⁻¹² cm3
molecule−1 s−1. The rate coefficient has been re-evaluated by increasing the measured rate coefficient by 10% to accountfor a 10% falloff belowk0, as measured by Gaedtke and Troe (1975).
(d) O(3P) atoms were generated by the photolysis of NO2 at various N2 pressures. NO2 was monitored by UV absorption.The measured value ofk/k(O + NO2) was evaluated withk(O + NO2) = 9.3×10⁻¹² cm3 molecule−1 s−1, taking N2O5reactions and falloff effects into account.
Preferred Values
k0 = 1.3×10⁻³¹ (T /300)−1.5 [N2] cm3 molecule−1 s−1 over the temperature range 200–400 K.
Reliability
1log k0 = ±0.30 at 298 K.1n = ±1.
Comments on Preferred Values
The preferred values are from the falloff extrapolations of the absolute rate measurements of Hahn et al. (2000) and the rela-tive rate measurements of Harker and Johnston (1973), Hippler et al. (1975), Gaedtke and Troe (1975), Schuck et al. (1966) andTroe (1969). The discrepancy between the absolute rate measurements below 1067 mbar from Burkholder and Ravishankara(2000) and above 1 bar from Hahn et al. (2000) may be due to difficulties in separating the reactions O + NO2 → O2 + NOand O + NO2 + M → NO3 + M with subsequent NO2 + NO3 + M → N2O5 + M. Because the data from Hahn et al. (2000)are in much better consistency with the relative rate measurements from Harker and Johnston (1973), Hippler et al. (1975),
Atmos. Chem. Phys., 4, 1461–1738, 2004 www.atmos-chem-phys.org/acp/4/1461/

R. Atkinson et al.: Evaluated kinetic and photochemical data for Ox, HOx, NOx and SOx 1537
Gaedtke and Troe (1975), Schuck et al. (1966) and Troe (1969), they are preferred here. It should be emphasized that falloffeffects are important at atmospheric pressures; these effects are represented withFc = 0.6 andk∞ = 2.3×10⁻¹¹ (T /300)0.24
cm3 molecule−1 s−1 from the measurements and theoretical analysis of Hahn et al. (2000).
High-pressure rate coefficients
Rate coefficient data
k∞/cm3 molecule−1 s−1 Temp./K Reference Technique/Comments
Absolute Rate Coefficients(2.3±0.2)×10−11(T /300)0.24 300–400 Hahn et al., 2000 PLP (a)
Relative Rate Coefficients(2.2± 0.4)×10−11 300 Gaedtke and Troe, 1975 (b)
Comments
(a) See comment (b) fork0.
(b) Analysis of the pressure dependence of the quantum yield of NO2 photolysis between 1 and 1000 bar of N2. Measurementsof k∞/k(O + NO2 → O2 + NO) evaluated withk(O + NO2) = 9×10⁻¹² cm3 molecule−1 s−1.
Preferred Values
k∞ = 2.3×10⁻¹¹ (T /300)0.24 cm3 molecule−1 s−1 over the temperature range 200–400 K.
Reliability
1log k∞ = ±0.2 over the temperature range 200–400 K.
Comments on Preferred Values
The absolute and relative rate measurements of the falloff curve over a very wide pressure range from Hahn et al. (2000) andGaedtke and Troe (1975), on which the preferred values are based, allow for a reliable extrapolation to the high pressure limitof the reaction. Falloff curves are constructed withFc = 0.6 andk0 = 1.3 x 10⁻³¹(T /300)−1.5 [N2] cm3 molecule−1 s−1.
References
Burkholder, J. B. and Ravishankara, A. R.: J. Phys. Chem. A, 104, 6752, 2000.Gaedtke, H. and Troe, J.: Ber. Bunsenges. Phys. Chem., 79, 184, 1975.Hahn, J., Luther, K. and Troe, J.: Phys. Chem. Chem. Phys., 2, 5098, 2000.Harker, A. B. and Johnston, H. S.: J. Phys. Chem., 77, 1153, 1973.Hippler, H., Schippert, C. and Troe, J.: Int. J. Chem. Kinet. Symp., 1, 27, 1975.Schuck, E. A., Stephens, E. R. and Schrock, R. R.: J. Air Pollut. Contr. Assoc., 16, 695, 1966.Troe, J.: Ber. Bunsenges. Phys. Chem., 73, 906, 1969.
www.atmos-chem-phys.org/acp/4/1461/ Atmos. Chem. Phys., 4, 1461–1738, 2004

1538 R. Atkinson et al.: Evaluated kinetic and photochemical data for Ox, HOx, NOx and SOx
I.A3.34
O + NO3 → O2 + NO2
1H ◦ = −289.7 kJ mol−1
Rate coefficient data
k/cm3 molecule−1 s−1 Temp./K Reference Technique/Comments
Absolute Rate Coefficients(1.70± 0.6)×10−11 297 Canosa-Mas et al., 1989 DF-RF/A (a)
Comments
(a) [O(3P)] was monitored by RF and [NO3] by absorption at 662 nm usingσ = 1.9×10⁻¹⁷cm2 molecule−1. Excess of[NO3] over [O] was not sufficient to give purely first order kinetics. Analysis of the data took account of this and of thepossibility of other interfering reactions.
Preferred Values
k= 1.7×10⁻¹¹cm3 molecule−1 s−1 at 298 K.
Reliability
1log k = ± 0.3 at 298 K.
Comments on Preferred Values
The preferred value is that reported by Canosa-Mas et al. (1989), which is the only direct measurement of the rate coefficient.The earlier relative value of Graham and Johnston (1978), of (1.0± 0.4)×10 −11 cm3 molecule−1 s−1 at 297 K, is consistentwith the preferred value, taking into account the experimental uncertainties. The temperature dependence is probably nearzero, by analogy with the reaction of O(3P) atoms with NO2.
References
Canosa-Mas, C. E., Carpenter, P. J. and Wayne, R. P.: J. Chem. Soc. Faraday Trans. 2, 85, 697, 1989.Graham, R. A. and Johnston, H. S.: J. Phys. Chem., 82, 254, 1978.
Atmos. Chem. Phys., 4, 1461–1738, 2004 www.atmos-chem-phys.org/acp/4/1461/
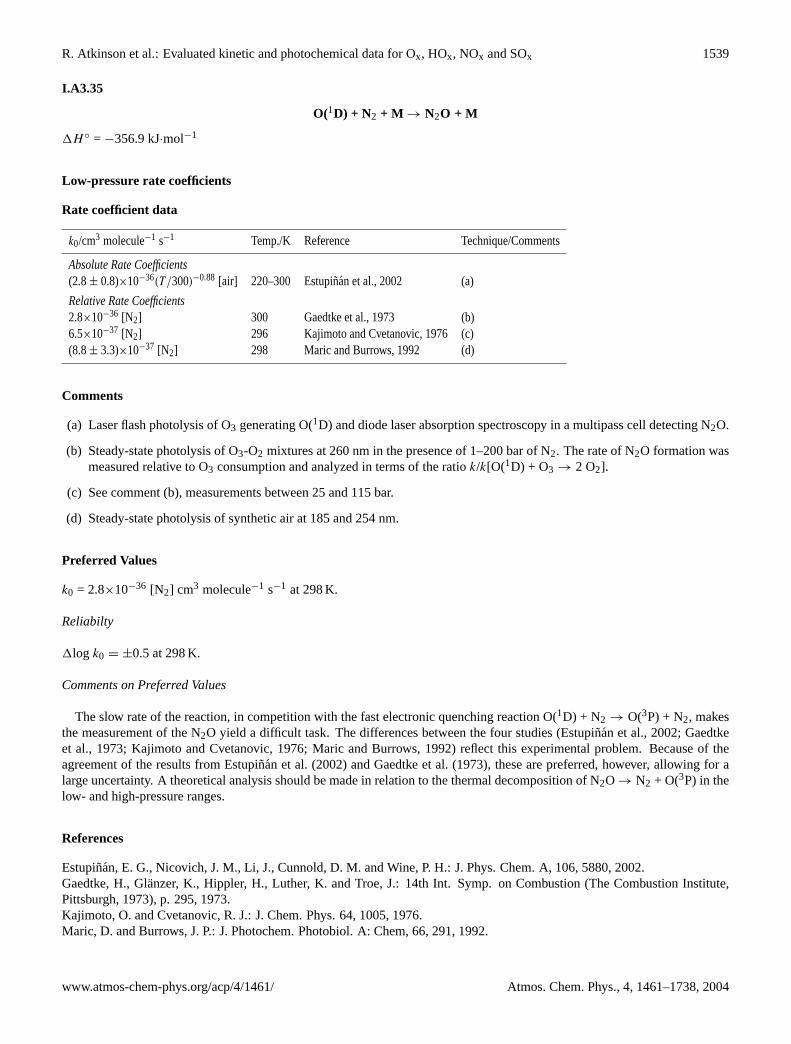
R. Atkinson et al.: Evaluated kinetic and photochemical data for Ox, HOx, NOx and SOx 1539
I.A3.35
O(1D) + N2 + M → N2O + M
1H ◦ = −356.9 kJ·mol−1
Low-pressure rate coefficients
Rate coefficient data
k0/cm3 molecule−1 s−1 Temp./K Reference Technique/Comments
Absolute Rate Coefficients(2.8± 0.8)×10−36(T /300)−0.88 [air] 220–300 Estupinan et al., 2002 (a)
Relative Rate Coefficients2.8×10−36 [N2] 300 Gaedtke et al., 1973 (b)6.5×10−37 [N2] 296 Kajimoto and Cvetanovic, 1976 (c)(8.8± 3.3)×10−37 [N2] 298 Maric and Burrows, 1992 (d)
Comments
(a) Laser flash photolysis of O3 generating O(1D) and diode laser absorption spectroscopy in a multipass cell detecting N2O.
(b) Steady-state photolysis of O3-O2 mixtures at 260 nm in the presence of 1–200 bar of N2. The rate of N2O formation wasmeasured relative to O3 consumption and analyzed in terms of the ratiok/k[O(1D) + O3 → 2 O2].
(c) See comment (b), measurements between 25 and 115 bar.
(d) Steady-state photolysis of synthetic air at 185 and 254 nm.
Preferred Values
k0 = 2.8×10−36 [N2] cm3 molecule−1 s−1 at 298 K.
Reliabilty
1log k0 = ±0.5 at 298 K.
Comments on Preferred Values
The slow rate of the reaction, in competition with the fast electronic quenching reaction O(1D) + N2 → O(3P) + N2, makesthe measurement of the N2O yield a difficult task. The differences between the four studies (Estupinan et al., 2002; Gaedtkeet al., 1973; Kajimoto and Cvetanovic, 1976; Maric and Burrows, 1992) reflect this experimental problem. Because of theagreement of the results from Estupinan et al. (2002) and Gaedtke et al. (1973), these are preferred, however, allowing for alarge uncertainty. A theoretical analysis should be made in relation to the thermal decomposition of N2O → N2 + O(3P) in thelow- and high-pressure ranges.
References
Estupinan, E. G., Nicovich, J. M., Li, J., Cunnold, D. M. and Wine, P. H.: J. Phys. Chem. A, 106, 5880, 2002.Gaedtke, H., Glanzer, K., Hippler, H., Luther, K. and Troe, J.: 14th Int. Symp. on Combustion (The Combustion Institute,Pittsburgh, 1973), p. 295, 1973.Kajimoto, O. and Cvetanovic, R. J.: J. Chem. Phys. 64, 1005, 1976.Maric, D. and Burrows, J. P.: J. Photochem. Photobiol. A: Chem, 66, 291, 1992.
www.atmos-chem-phys.org/acp/4/1461/ Atmos. Chem. Phys., 4, 1461–1738, 2004

1540 R. Atkinson et al.: Evaluated kinetic and photochemical data for Ox, HOx, NOx and SOx
I.A3.36
O(1D) + N2 → O(3P) + N2
1H ◦ = −189.7 kJ mol−1
Rate coefficient data
k/cm3 molecule−1 s−1 Temp./K Reference Technique/Comments
Absolute Rate Coefficients2.0×10−11 exp[(107± 8)/T ] 104–354 Streit et al., 1976 PLP (a)(2.8± 0.6)×10−11 300(2.4± 0.1)×10−11 295 Amimoto et al., 1979 PLP-RA (b)(2.77± 0.40)×10−11 298 Brock and Watson, 1980 PLP-RF (b)(2.52± 0.25)×10−11 297 Wine and Ravishankara, 1981 PLP-RF (b)
Relative Rate Coefficients(2.6± 0.3)×10−11 296 Shi and Barker, 1990 (c)
Comments
(a) O(1D) atoms were monitored by time-resolved detection of O(1D) → O(3P) emission.
(b) O(3P) atom product monitored.
(c) The kinetics of deactivation of O2(16+g ) were studied by time-resolved emission from O2(
16+g ) produced by the reaction
of O(1D) atoms with O2 following pulsed laser photolysis of O3. The effect of N2 (and other quenchers) on the initialfluorescence intensity gave the rate coefficient for O(1D) deactivation relative to that for O2. k has been calculated usinga value ofk[O(1D) + O2] = 4.0×10⁻¹¹ cm3 molecule−1 s−1 (this evaluation).
Preferred Values
k= 2.6×10⁻¹¹ cm3 molecule−1 s−1 at 298 K.k = 1.8×10⁻¹¹ exp(107/T ) cm3 molecule−1 s−1 over the temperature range 100–350 K.
Reliability
1log k = ± 0.1 at 298 K.1(E/R) = ± 100 K.
Comments on Preferred Values
The preferred value at 298 K is the average of the results of Streit et al. (1976), Amimoto et al. (1979), Brock and Watson(1980), Wine and Ravishankara (1981) and Shi and Barker (1990). The temperature dependence obtained by Streit et al. (1976)is accepted and the pre-exponential factor is adjusted to fit the value ofk at 298 K.
References
Amimoto, S. T., Force, A. P., Gulotty Jr., R. G., and Wiesenfeld, J. R.: J. Chem. Phys., 71, 3640, 1979.Brock, J. C. and Watson, R. T.: results presented at the NATO Advanced Study Institute on Atmospheric Ozone, Portugal,1979; see Moortgat G. K. review in Report No. FAA-EE-80-2, 1980.Shi, J. and Barker, J. R.: Int. J. Chem. Kinet., 22, 1283, 1990.Streit, G. E., Howard, C. J., Schmeltekopf, A. L., Davidson, J. A. and Schiff, H. I.: J. Chem. Phys., 65, 4761, 1976.Wine, P. H. and Ravishankara, A. R.: Chem. Phys. Lett., 77, 103, 1981.
Atmos. Chem. Phys., 4, 1461–1738, 2004 www.atmos-chem-phys.org/acp/4/1461/

R. Atkinson et al.: Evaluated kinetic and photochemical data for Ox, HOx, NOx and SOx 1541
I.A3.37
O(1D) + N2O → N2 + O2 (1)→ 2NO (2)
1H ◦(1) = −521.0 kJ·mol−1
1H ◦(2) = −340.4 kJ·mol−1
Rate coefficient data (k = k1 + k2)
k/cm3 molecule−1 s−1 Temp./K Reference Technique/Comments
Absolute Rate Coefficients(1.1± 0.2)×10−10 204–359 Davidson et al., 1977 PLP (a)(1.20± 0.1)×10−10 295 Amimoto et al., 1979 PLP-RA (b)(1.17± 0.12)×10−10 298 Wine and Ravishankara, 1981 PLP-RF (b)
Branching Ratiosk2/k = 0.62± 0.02 298 Marx et al., 1979 P-GC/CLk2/k = 0.62± 0.09 177–296 Lam et al., 1981 P-CLk2/k = 0.61± 0.08 296 Cantrell et al., 1994 (c)
Comments
(a) O(1D) atoms were monitored by time-resolved detection of O(1D) → O(3P) emission.
(b) O(3P) atom product monitored.
(c) Static photolysis of N2O-O3 mixtures atλ > 240 nm with product analysis by FTIR spectroscopy. The amount of NOformed in reaction (2) was determined from the yield of HNO3 formed by total oxidation and hydration of NOx products,corrected for losses to the wall. The value ofk2/k obtained from the experimental data was 0.57± 0.08; the value givenin the table was obtained by averaging the experimental value with selected literature data.
Preferred Values
k1 = 4.4×10⁻¹¹ cm3 molecule−1 s−1, independent of temperature over the range 200–350 K.k2 = 7.2×10⁻¹¹ cm3 molecule−1 s−1, independent of temperature over the range 200–350 K.
Reliability
1log k1 = 1log k2 = ±0.1 at 298 K.1(E1/R) = (E2/R) = ±100 K.
Comments on Preferred Values
The data and recommendation for the branching ratio at room temperature ofk2/k = 0.61 ± 0.08 given by Cantrell etal. (1994) are in accord with the earlier results of Marx et al. (1979) and Lam et al. (1981). The overall rate coefficient valuesat room temperature are the average of the results of Davidson et al. (1977), Amimoto et al. (1979) and Wine and Ravishankara(1981), all of which are in close agreement (see also data by Volltrauer et al., 1979). The temperature independence reportedby Davidson et al. (1977, 1979) is accepted.
References
Amimoto, S. T., Force, A. P., Gulotty Jr., R. G. and Weisenfeld, J. R.: J. Chem. Phys., 71, 3640, 1979.Cantrell, C. A., Shetter, R. E. and Calvert, J. G.: J. Geophys. Res., 99, 3739, 1994.
www.atmos-chem-phys.org/acp/4/1461/ Atmos. Chem. Phys., 4, 1461–1738, 2004

1542 R. Atkinson et al.: Evaluated kinetic and photochemical data for Ox, HOx, NOx and SOx
Davidson, J. A., Schiff, H. I., Streit, G. E., McAfee, J. R., Schmeltekopf, A. L. and Howard, C. J.: J. Chem. Phys., 67, 5021,1977.Davidson, J. A., Howard, C. J., Schiff, H. I. and Fehsenfeld, F. C.: J. Chem. Phys., 70, 1697, 1979.Lam, L., Hastie, D. R., Ridley, B. A. and Schiff, H. I.: J. Photochem., 15, 119, 1981.Marx, W., Bahe, F. and Schurath, U.: Ber. Bunsenges. Phys. Chem., 83, 225, 1979.Volltrauer, H. N., Felder, W., Pirkle, R. J. and Fontijn, A.: J. Photochem., 11, 173, 1979.Wine, P. H. and Ravishankara, A. R.: Chem. Phys. Lett., 77, 103, 1981.
Atmos. Chem. Phys., 4, 1461–1738, 2004 www.atmos-chem-phys.org/acp/4/1461/

R. Atkinson et al.: Evaluated kinetic and photochemical data for Ox, HOx, NOx and SOx 1543
I.A3.38
HO + NH3 → H2O + NH2
1H ◦ = −44.4 kJ mol−1
Rate coefficient data
k/cm3 molecule−1 s−1 Temp./K Reference Technique/Comments
Absolute Rate Coefficients(1.5± 0.4)×10−13 298 Stuhl, 1973 FP-RF2.3×10−12 exp(−805/T ) 228–472 Zellner and Smith, 1974; Smith FP-RA1.58×10−13 298 and Zellner, 19752.93×10−12 exp[−(861± 151)/T ] 298–427 Perry et al., 1976 FP-RF(1.64± 0.16)×10−13 2985.41×10−12 exp[−(1067± 72)/T ] 294–1075 Silver and Kolb, 1980 DF-RF(1.44± 0.29)×10−13 2944.55×10−12 exp[−(973± 78)/T ] 297–364 Stephens, 1984 DF-RF(1.73± 0.11)×10−13 2973.29×10−12 exp[−(922± 100)/T ] 273–433 Diau et al., 1990 FP/PLP-LIF (a)(1.47± 0.07)×10−13 297
Comments
(a) Pulsed laser photolysis and conventional flash photolysis of H2O and H2O2 were used as the sources of HO radicals. Thetotal pressure was varied over the range 0.091–0.672 bar (68–504 Torr).
Preferred Values
k = 1.6×10⁻¹³ cm3 molecule−1 s−1 at 298 K.k = 3.5×10⁻¹² exp(−925/T ) cm3 molecule−1 s−1 over the temperature range 230–450 K.
Reliability
1log k = ±0.1 at 298 K.1(E/R) = ±200 K.
Comments on Preferred Values
The preferred values are obtained from a least-squares fit to the data of Stuhl (1973), Smith and Zellner (1974; 1975),Perry et al. (1976), Stephens (1984), Diau et al. (1990) and the data of Silver and Kolb (1980) below 450 K. The relative ratemeasurement ofk/k(HO + HONO) by Cox et al. (1975) at 296± 2 K is in good agreement with the preferred value when thevalue ofk(HO + HONO) from this review is used. Results from other low temperature studies (Kurylo, 1973; Hack et al.,1974; Pagsberg et al. 1979) are well outside the error limits obtained from the direct studies cited in the table above (Stuhl,1973; Zellner and Smith, 1974; Smith and Zellner, 1975; Perry et al., 1976; Silver and Kolb, 1980; Stephens, 1984; Diau et al.,1990) and are not used in this evaluation.
There are numerous high temperature studies which, together with the studies cited here, indicate a distinct curvature on theArrhenius plot (Jeffries and Smith, 1986). However, the simple Arrhenius expression given here as the preferred expressionfor k is sufficiently precise over the temperature range cited.
www.atmos-chem-phys.org/acp/4/1461/ Atmos. Chem. Phys., 4, 1461–1738, 2004

1544 R. Atkinson et al.: Evaluated kinetic and photochemical data for Ox, HOx, NOx and SOx
References
Cox, R. A., Derwent, R. G. and Holt, P. M.: Chemosphere, 4, 201, 1975.Diau, E. W.-G., Tso, T.-L. and Lee, Y.-P.: J. Phys. Chem., 94, 5261, 1990.Hack, W., Hoyermann, K. and Wagner, H. Gg.: Ber. Bunsenges. Phys. Chem., 78, 386, 1974.Jeffries, J. B. and Smith, G. P.: J. Phys. Chem., 90, 487, 1986.Kurylo, M. J.: Chem. Phys. Lett., 23, 467, 1973.Pagsberg, P. B., Eriksen, J. and Christensen, H. C.: J. Phys. Chem., 83, 582, 1979.Perry, R. A., Atkinson, R. and Pitts Jr., J. N.: J. Chem. Phys., 64, 3237, 1976.Silver, J. A. and Kolb, C. E.: Chem. Phys. Lett., 75, 191, 1980.Smith, I. W. M. and Zellner, R.: Int. J. Chem. Kinet. Symp.1, 341, 1975.Stephens, R. D.: J. Phys. Chem., 88, 3308, 1984.Stuhl, F.: J. Chem. Phys., 59, 635, 1973.Zellner, R. and Smith, I. W. M.: Chem. Phys. Lett., 26, 72, 1974.
Atmos. Chem. Phys., 4, 1461–1738, 2004 www.atmos-chem-phys.org/acp/4/1461/

R. Atkinson et al.: Evaluated kinetic and photochemical data for Ox, HOx, NOx and SOx 1545
I.A3.39
HO + HONO → H2O + NO2
1H ◦ = −166.3 kJ mol−1
Rate coefficient data
k/cm3 molecule−1 s−1 Temp./K Reference Technique/Comments
Absolute Rate Coefficients1.80×10−11 exp[−(390± 80)/T ] 278–342 Jenkin and Cox, 1987 MM-RA(4.9± 0.5)×10−12 2982.8×10−12 exp[(260± 140)/T ] 298–373 Burkholder et al., 1992 PLP-LIF (a)(7.05± 1.41)×10−12 298
Relative Rate Coefficients(6.0± 0.4)×10−12 296 Cox et al., 1976 (b)
Comments
(a) HO radicals were monitored by LIF with HONO in excess. [HONO] and [NO2] were also monitored usingin situ diode-array spectroscopy.
(b) Photolysis of HONO-NO and HONO-H2 mixtures at a total pressure of 1 bar of N2 or N2-O2 diluent. A value ofk/k(HO+ H2) = 945± 48 was obtained. The value ofk given in the table is calculated usingk(HO + H2) = 6.4×10⁻¹⁵ cm3
molecule−1 s−1 at 296 K (IUPAC, current recommendation).
Preferred Values
k = 6.0×10⁻¹² cm3 molecule−1 s−1 at 298 K.k = 2.5×10⁻¹² exp(260/T ) cm3 molecule−1 s−1 over the temperature range 290–380 K.
Reliability
1log k = ±0.15 at 298 K.1(E/R) = ±260 K.
Comments on Preferred Values
There are significant differences between the two direct studies of Jenkin and Cox (1987) and Burkholder et al. (1992) partic-ularly with respect to the temperature dependence ofk. The work of Burkholder et al. (1992) has substantially better precisionthan that of Jenkin and Cox (1987). Furthermore, the small negative temperature dependence ofk found by Burkholder etal. (1992) is consistent with that observed for the analogous reaction of HO radicals with HONO2.
The preferred value ofk at 298 K is an average of the room temperature rate coefficients of Jenkin and Cox (1987),Burkholder et al. (1992) and Cox et al. (1976). The temperature dependence ofk is that given by Burkholder et al. (1992)with the pre-exponential factor being adjusted to fit the preferred value ofk at 298 K.
References
Burkholder, J. B., Mellouki A., Talukdar, R. and Ravishankara, A. R.: Int. J. Chem. Kinet., 24, 711, 1992.Cox, R. A., Derwent, R. G. and Holt, P. M.: J. Chem. Soc. Faraday Trans. 1, 72, 2031, 1976.IUPAC: http://www.iupac-kinetic.ch.cam.ac.uk/Jenkin, M. E. and Cox, R. A.: Chem. Phys. Lett., 137, 548, 1987.
www.atmos-chem-phys.org/acp/4/1461/ Atmos. Chem. Phys., 4, 1461–1738, 2004

1546 R. Atkinson et al.: Evaluated kinetic and photochemical data for Ox, HOx, NOx and SOx
I.A3.40
HO + HONO2 → H2O + NO3 (1)→ [H2NO4] → H2O + NO3 (2)
1H ◦ = −70.2 kJ mol−1
Rate coefficient data (k = k1 + k2)
k/cm3 molecule−1 s−1 Temp./K Reference Technique/Comments
Absolute Rate Coefficients(8.9± 1.3)×10−14 272–464 Margitan et al., 1975 DF-RF (a)(8 ± 2)×10−14 240–298 Smith and Zellner, 1975 FP-RA (b)1.52×10⁻¹⁴ exp[(649± 69)/T ] 224–366 Wine et al., 1981 FP-RF(1.25± 0.28)×10−13 298(1.25± 0.13)×10−13 298 Ravishankara et al., 1982 PLP-RA (c)5.7×10⁻¹⁵ exp[(896± 145)/T ] 228–298 Margitan and Watson, 1982 FP-RF (d)(1.19± 0.12)×10−13 2981.05×10−14 exp[(759± 100)/T ] 225–296 Kurylo et al., 1982 FP-RF (e)(1.38± 0.20)×10−13 2967.3×10−15 exp[(867± 85)/T ] 251–403 Jourdain et al., 1982 DF-EPR (f)(1.25± 0.07)×10−13 2961.52×10−14 exp[(644± 79)/T ] 218–363 Marinelli and Johnston, 1982 FP-RF (g)(1.31± 0.24)×10−13 2988.3×10−15 exp[(850± 40)/T ] 240–370 Smith et al., 1984 FP-RF (h)(1.36± 0.04)×10−13 2955.43×10−15 exp(843/T ) 253–295 Devolder et al., 1984 DF-RF (i)(9.3± 1.0)×10−14 2952.0×10−14 exp[(430± 60)/T ] 237–330 Connell and Howard, 1985 DF-LMR(8.4± 0.18)×10−14 301(1.26± 0.11)×10−13 297 Jolly et al., 1985 PLP-RA (j)(1.28± 0.10)×10−13 297 Stachnik et al., 1986 PLP-RA (k)See comment 200–373 Brown et al., 1999 PLP-LIF (l)
Comments
(a) The value given is the mean of the rate coefficients measured at 295, 420 and 464 K. A slightly higher value obtained at272 K was considered (Margitan et al., 1975) to be less reliable.
(b) The measured rate coefficient was observed to increase with increasing temperature above 298 K, to 1.0×10⁻¹³ cm3
molecule−1 s−1 at 406 K.
(c) The value ofk tabulated is at 67 mbar (50 Torr) Ar;k was also measured at 80 mbar (60 Torr) SF6 and at 251 K. Thereaction stoichiometry was measured by monitoring NO3 radical production using optical absorption at 662 nm and usingthe initial [HO] value. The figures given for the stoichiometry have since been revised as a result of a remeasurementof the absorption coefficient of NO3 (Yokelson et al., 1994). The new values are 0.85 at 298 K and 0.88 at 251 K for[NO3]produced/[HO]consumed.
(d) k was found to depend on both temperature and pressure.k was reported to increase by 10% over the pressure range27–133 mbar (20–100 Torr) He at 298 K and by 40% over the same pressure range at 238 K. The Arrhenius expressiontabulated is a least-squares fit to the data at 53 mbar (40 Torr) He over the temperature range 228–298 K. Significantnon-Arrhenius behavior was observed above 298 K at each value of the total pressure.k was also determined at 27 mbar(20 Torr) He and 133 mbar (100 Torr) He. For the linear portion of the Arrhenius plots (at or below 298 K) the followingvalues ofE/R are derived:−735 K (27 mbar He) and−1000 K (133 mbar He). The authors made linear extrapolationsto zero pressure and reported anE/R value of−700 K for data at or below 298 K.
Atmos. Chem. Phys., 4, 1461–1738, 2004 www.atmos-chem-phys.org/acp/4/1461/
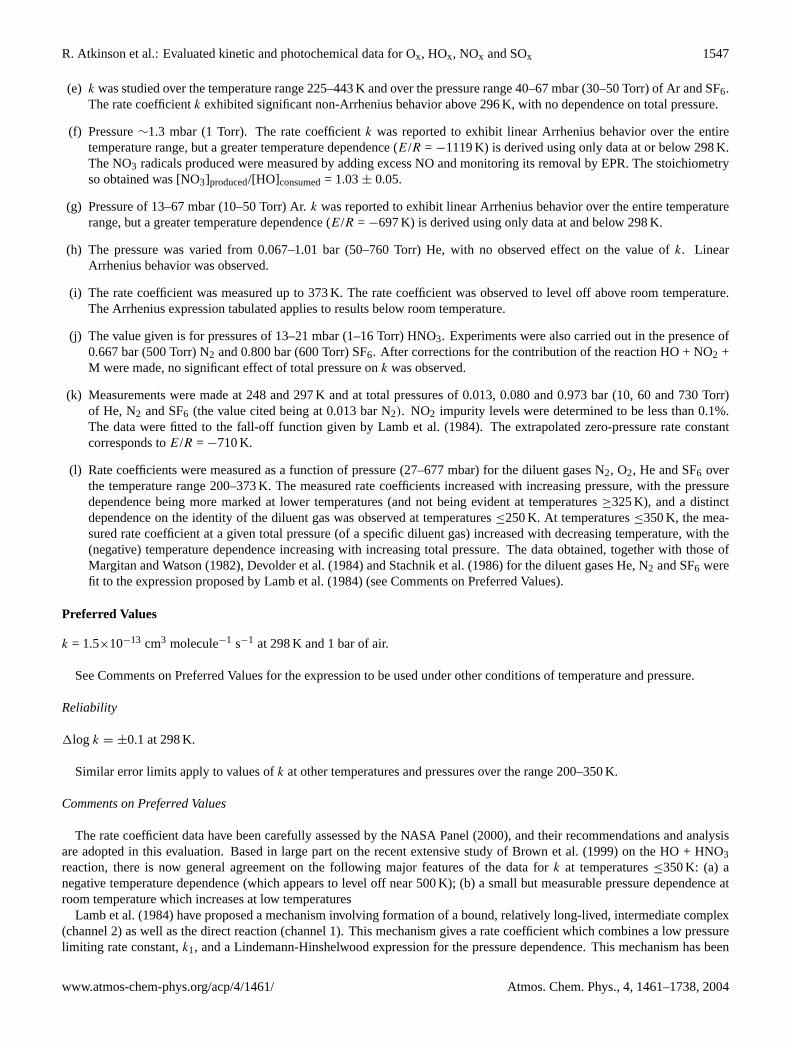
R. Atkinson et al.: Evaluated kinetic and photochemical data for Ox, HOx, NOx and SOx 1547
(e) k was studied over the temperature range 225–443 K and over the pressure range 40–67 mbar (30–50 Torr) of Ar and SF6.The rate coefficientk exhibited significant non-Arrhenius behavior above 296 K, with no dependence on total pressure.
(f) Pressure∼1.3 mbar (1 Torr). The rate coefficientk was reported to exhibit linear Arrhenius behavior over the entiretemperature range, but a greater temperature dependence (E/R = −1119 K) is derived using only data at or below 298 K.The NO3 radicals produced were measured by adding excess NO and monitoring its removal by EPR. The stoichiometryso obtained was [NO3]produced/[HO]consumed= 1.03± 0.05.
(g) Pressure of 13–67 mbar (10–50 Torr) Ar.k was reported to exhibit linear Arrhenius behavior over the entire temperaturerange, but a greater temperature dependence (E/R = −697 K) is derived using only data at and below 298 K.
(h) The pressure was varied from 0.067–1.01 bar (50–760 Torr) He, with no observed effect on the value ofk. LinearArrhenius behavior was observed.
(i) The rate coefficient was measured up to 373 K. The rate coefficient was observed to level off above room temperature.The Arrhenius expression tabulated applies to results below room temperature.
(j) The value given is for pressures of 13–21 mbar (1–16 Torr) HNO3. Experiments were also carried out in the presence of0.667 bar (500 Torr) N2 and 0.800 bar (600 Torr) SF6. After corrections for the contribution of the reaction HO + NO2 +M were made, no significant effect of total pressure onk was observed.
(k) Measurements were made at 248 and 297 K and at total pressures of 0.013, 0.080 and 0.973 bar (10, 60 and 730 Torr)of He, N2 and SF6 (the value cited being at 0.013 bar N2). NO2 impurity levels were determined to be less than 0.1%.The data were fitted to the fall-off function given by Lamb et al. (1984). The extrapolated zero-pressure rate constantcorresponds toE/R = −710 K.
(l) Rate coefficients were measured as a function of pressure (27–677 mbar) for the diluent gases N2, O2, He and SF6 overthe temperature range 200–373 K. The measured rate coefficients increased with increasing pressure, with the pressuredependence being more marked at lower temperatures (and not being evident at temperatures≥325 K), and a distinctdependence on the identity of the diluent gas was observed at temperatures≤250 K. At temperatures≤350 K, the mea-sured rate coefficient at a given total pressure (of a specific diluent gas) increased with decreasing temperature, with the(negative) temperature dependence increasing with increasing total pressure. The data obtained, together with those ofMargitan and Watson (1982), Devolder et al. (1984) and Stachnik et al. (1986) for the diluent gases He, N2 and SF6 werefit to the expression proposed by Lamb et al. (1984) (see Comments on Preferred Values).
Preferred Values
k = 1.5×10⁻¹³ cm3 molecule−1 s−1 at 298 K and 1 bar of air.
See Comments on Preferred Values for the expression to be used under other conditions of temperature and pressure.
Reliability
1log k = ±0.1 at 298 K.
Similar error limits apply to values ofk at other temperatures and pressures over the range 200–350 K.
Comments on Preferred Values
The rate coefficient data have been carefully assessed by the NASA Panel (2000), and their recommendations and analysisare adopted in this evaluation. Based in large part on the recent extensive study of Brown et al. (1999) on the HO + HNO3reaction, there is now general agreement on the following major features of the data fork at temperatures≤350 K: (a) anegative temperature dependence (which appears to level off near 500 K); (b) a small but measurable pressure dependence atroom temperature which increases at low temperatures
Lamb et al. (1984) have proposed a mechanism involving formation of a bound, relatively long-lived, intermediate complex(channel 2) as well as the direct reaction (channel 1). This mechanism gives a rate coefficient which combines a low pressurelimiting rate constant,k1, and a Lindemann-Hinshelwood expression for the pressure dependence. This mechanism has been
www.atmos-chem-phys.org/acp/4/1461/ Atmos. Chem. Phys., 4, 1461–1738, 2004
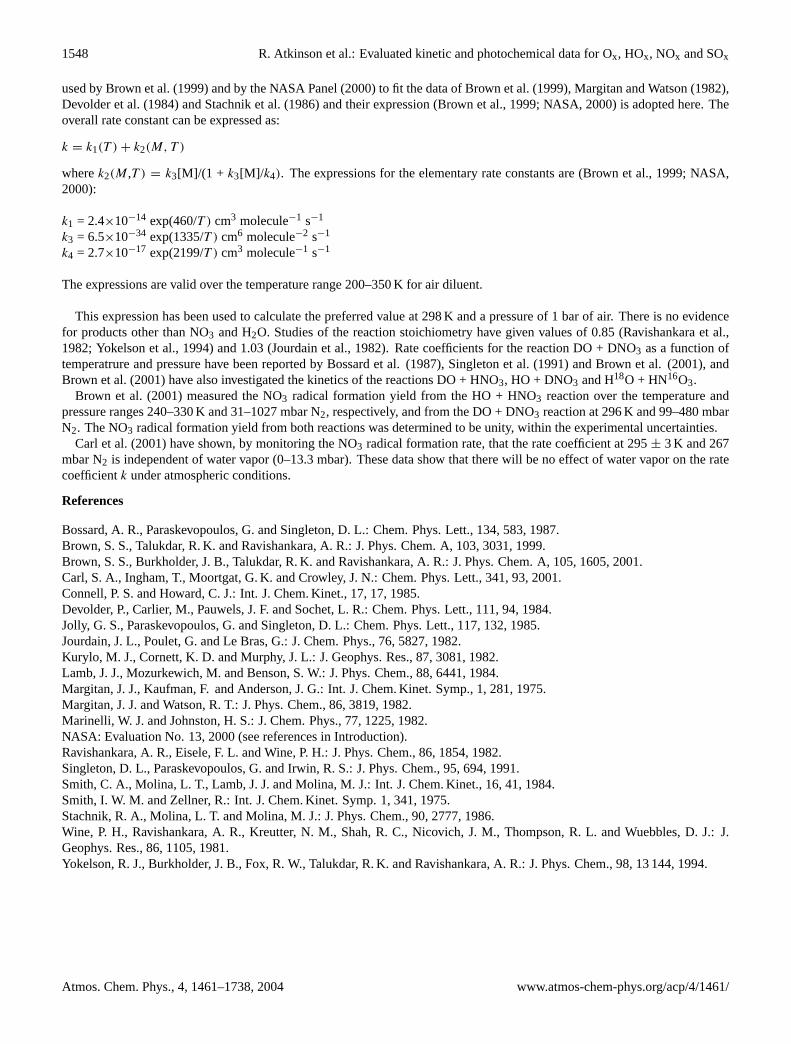
1548 R. Atkinson et al.: Evaluated kinetic and photochemical data for Ox, HOx, NOx and SOx
used by Brown et al. (1999) and by the NASA Panel (2000) to fit the data of Brown et al. (1999), Margitan and Watson (1982),Devolder et al. (1984) and Stachnik et al. (1986) and their expression (Brown et al., 1999; NASA, 2000) is adopted here. Theoverall rate constant can be expressed as:
k = k1(T ) + k2(M, T )
wherek2(M,T ) = k3[M]/(1 + k3[M]/ k4). The expressions for the elementary rate constants are (Brown et al., 1999; NASA,2000):
k1 = 2.4×10⁻¹⁴ exp(460/T ) cm3 molecule−1 s−1
k3 = 6.5×10⁻³⁴ exp(1335/T ) cm6 molecule−2 s−1
k4 = 2.7×10⁻¹⁷ exp(2199/T ) cm3 molecule−1 s−1
The expressions are valid over the temperature range 200–350 K for air diluent.
This expression has been used to calculate the preferred value at 298 K and a pressure of 1 bar of air. There is no evidencefor products other than NO3 and H2O. Studies of the reaction stoichiometry have given values of 0.85 (Ravishankara et al.,1982; Yokelson et al., 1994) and 1.03 (Jourdain et al., 1982). Rate coefficients for the reaction DO + DNO3 as a function oftemperatrure and pressure have been reported by Bossard et al. (1987), Singleton et al. (1991) and Brown et al. (2001), andBrown et al. (2001) have also investigated the kinetics of the reactions DO + HNO3, HO + DNO3 and H18O + HN16O3.
Brown et al. (2001) measured the NO3 radical formation yield from the HO + HNO3 reaction over the temperature andpressure ranges 240–330 K and 31–1027 mbar N2, respectively, and from the DO + DNO3 reaction at 296 K and 99–480 mbarN2. The NO3 radical formation yield from both reactions was determined to be unity, within the experimental uncertainties.
Carl et al. (2001) have shown, by monitoring the NO3 radical formation rate, that the rate coefficient at 295± 3 K and 267mbar N2 is independent of water vapor (0–13.3 mbar). These data show that there will be no effect of water vapor on the ratecoefficientk under atmospheric conditions.
References
Bossard, A. R., Paraskevopoulos, G. and Singleton, D. L.: Chem. Phys. Lett., 134, 583, 1987.Brown, S. S., Talukdar, R. K. and Ravishankara, A. R.: J. Phys. Chem. A, 103, 3031, 1999.Brown, S. S., Burkholder, J. B., Talukdar, R. K. and Ravishankara, A. R.: J. Phys. Chem. A, 105, 1605, 2001.Carl, S. A., Ingham, T., Moortgat, G. K. and Crowley, J. N.: Chem. Phys. Lett., 341, 93, 2001.Connell, P. S. and Howard, C. J.: Int. J. Chem. Kinet., 17, 17, 1985.Devolder, P., Carlier, M., Pauwels, J. F. and Sochet, L. R.: Chem. Phys. Lett., 111, 94, 1984.Jolly, G. S., Paraskevopoulos, G. and Singleton, D. L.: Chem. Phys. Lett., 117, 132, 1985.Jourdain, J. L., Poulet, G. and Le Bras, G.: J. Chem. Phys., 76, 5827, 1982.Kurylo, M. J., Cornett, K. D. and Murphy, J. L.: J. Geophys. Res., 87, 3081, 1982.Lamb, J. J., Mozurkewich, M. and Benson, S. W.: J. Phys. Chem., 88, 6441, 1984.Margitan, J. J., Kaufman, F. and Anderson, J. G.: Int. J. Chem. Kinet. Symp., 1, 281, 1975.Margitan, J. J. and Watson, R. T.: J. Phys. Chem., 86, 3819, 1982.Marinelli, W. J. and Johnston, H. S.: J. Chem. Phys., 77, 1225, 1982.NASA: Evaluation No. 13, 2000 (see references in Introduction).Ravishankara, A. R., Eisele, F. L. and Wine, P. H.: J. Phys. Chem., 86, 1854, 1982.Singleton, D. L., Paraskevopoulos, G. and Irwin, R. S.: J. Phys. Chem., 95, 694, 1991.Smith, C. A., Molina, L. T., Lamb, J. J. and Molina, M. J.: Int. J. Chem. Kinet., 16, 41, 1984.Smith, I. W. M. and Zellner, R.: Int. J. Chem. Kinet. Symp. 1, 341, 1975.Stachnik, R. A., Molina, L. T. and Molina, M. J.: J. Phys. Chem., 90, 2777, 1986.Wine, P. H., Ravishankara, A. R., Kreutter, N. M., Shah, R. C., Nicovich, J. M., Thompson, R. L. and Wuebbles, D. J.: J.Geophys. Res., 86, 1105, 1981.Yokelson, R. J., Burkholder, J. B., Fox, R. W., Talukdar, R. K. and Ravishankara, A. R.: J. Phys. Chem., 98, 13 144, 1994.
Atmos. Chem. Phys., 4, 1461–1738, 2004 www.atmos-chem-phys.org/acp/4/1461/

R. Atkinson et al.: Evaluated kinetic and photochemical data for Ox, HOx, NOx and SOx 1549
I.A3.41
HO + HO2NO2 → H2O + O2 + NO2 (1)→ H2O2 + NO3 (2)
1H ◦(1) = −193 kJ mol−1
1H ◦(2) = −47 kJ mol−1
Rate coefficient data (k = k1 + k2)
k/cm3 molecule−1 s−1 Temp./K Reference Technique/Comments
Absolute Rate Coefficients(4.0± 1.6)×10−12 246–324 Trevor et al., 1982 PLP-RF (a)5.9×10⁻¹³ exp[(650± 30)/T ] 241–336 Smith et al., 1984 FP-RF (b)(5.2± 1.1)×10−12 295
Relative Rate Coefficients(5.1± 1.3)×10−12 268–295 Barnes et al., 1986 RR (c)
Comments
(a) The rate coefficient was independent of total pressure over the range 4–20 mbar He.
(b) The total pressure was 1.01 bar (760 Torr) of He.
(c) Relative rate study in a 420 L vessel. FTIR was used to monitor the concentration of HO2NO2, and the concentrations ofthe reference hydrocarbons (C3H6, n-C4H10) were monitored by GC. The effect of pressure was studied over the range1.3–400 mbar (1–300 Torr) of He or N2. The measured rate coefficient ratios have been placed on an absolute basis usingthe rate coefficient ofk(HO + n-C4H10) = 1.69 x 10⁻¹⁷T 2 exp(145/T ) cm3 molecule−1 s−1 and the fall-off expressionfor k(HO + C3H6) recommended by Atkinson (1997). The rate coefficents are observed to be pressure and temperatureindependent over the ranges studied. In particular, the rate coefficient, measured relative to that for HO +n-butane (whichis pressure-independent), showed no effect of total pressure of He diluent over the range 6.7–400 mbar at 278 K. Resultsfrom this study supersede earlier results obtained using similar but less sensitive techniques (Barnes et al., 1981).
Preferred Values
k = 4.7×10⁻¹² cm3 molecule−1 s−1 at 298 K.k = 1.9×10⁻¹² exp(270/T ) cm3 molecule−1 s−1 over the temperature range 240–340 K.
Reliability
1log k = ±0.2 at 298 K.1(E/R)= ±500 K.
Comments on Preferred Values
The preferred values are based upon a least-squares fit to the data of Trevor et al. (1982), Smith et al. (1984) and Barneset al. (1986). Trevor et al. (1982) studied the reaction from 246–324 K at low pressures [4–20 mbar (3–15 Torr He)] andrecommended a temperature-independent rate coefficient but also reported an Arrhenius expression withE/R = (193± 194) K.In contrast, Smith et al. (1984) reported a negative temperature dependence ofk with E/R = −(650± 30) K over the range241–336 K at 1.01 bar (760 Torr) of He. It is possible that this difference is due to the reaction mechanism being complex,leading to different temperature dependences at low and high pressure. At 220 K, the values ofk derived from these studiesdiffer by a factor of 3 but the recommended error limits onE/R encompass the results from both studies.
The study by Barnes et al. (1986) is the only one over an extended pressure range [6.7–400 mbar (5–300 Torr) He at 278 K].Their data show the rate coefficient to be pressure independent over this range, and the same value ofk was obtained at 295 K
www.atmos-chem-phys.org/acp/4/1461/ Atmos. Chem. Phys., 4, 1461–1738, 2004

1550 R. Atkinson et al.: Evaluated kinetic and photochemical data for Ox, HOx, NOx and SOx
and 6.7 mbar He as at 268 K and 133 mbar He. They also observed no change with N2 or synthetic air as the diluent gas. ATST calculation by Lamb et al. (1984) suggests that the pressure dependence of this rate coefficient will be much less thanthat for the corresponding reaction of HO radicals with HNO3. Although no data are as yet available concerning the reactionproducts, channel (1) is expected to dominate.
References
Atkinson, R.: J. Phys. Chem. Ref. Data, 26, 215, 1997.Barnes, I., Bastian, V., Becker, K. H., Fink, E. H. and Zabel, F.: Chem. Phys. Lett., 83, 459, 1981.Barnes, I., Bastian, V., Becker, K. H., Fink, E. H. and Zabel, F.: Chem. Phys. Lett., 123, 28, 1986.Lamb, J. J., Mozurkewich, M. and Benson, S. W.: J. Phys. Chem., 88, 6441, 1984.Smith, C. A., Molina, L. T., Lamb, J. J. and Molina, M. J.: Int. J. Chem. Kinet., 16, 41, 1984.Trevor, P. L., Black, G. and Barker, J. R.: J. Phys. Chem., 86, 1661, 1982.
Atmos. Chem. Phys., 4, 1461–1738, 2004 www.atmos-chem-phys.org/acp/4/1461/

R. Atkinson et al.: Evaluated kinetic and photochemical data for Ox, HOx, NOx and SOx 1551
I.A3.42
HO + NO + M → HONO + M
1H ◦ = −207.0 kJ·mol−1
Low-pressure rate coefficients
Rate coefficient data
k0/cm3 molecule−1 s−1 Temp./K Reference Technique/Comments
Absolute Rate Coefficients(1.1± 0.1)×10−30 [N2] 293 Burrows et al., 1983 DF-RF(7.0± 2.0)×10−31(T /300)−(2.6±0.3) [N2] 90–220 Atkinson and Smith, 1994 DF-LIF (a)8.9×10⁻³¹(T /298)−2.1 [N2] 80–301 Sharkey et al., 1994 PLP-LIF (b)
Comments
(a) HO radicals were generated by a cold cathode discharge and detected by LIF. The experiments were carried out in asupersonic expansion at total pressures corresponding to 1016 to 1018 molecule cm−3.
(b) Experiments were carried out in a cryogenically cooled cell and in a supersonic expansion. At 52 K, rate coefficients havebeen determined at total gas densities from 5.1×10¹⁶ to 8.2×10¹⁷ molecule cm−3.
Preferred Values
k0 = 7.4×10⁻³¹ (T /300)−2.4 [N2] cm3 molecule−1 s−1 over the temperature range 200–400 K.
Reliability
1log k0 = ±0.10 at 298 K.1n = ±0.5.
Comments on Preferred Values
The preferred values are derived following the analysis given in Forster et al. (1995) of data from Burrows et al. (1983),Atkinson and Smith (1994), Sharkey et al. (1994), Anderson and Kaukman (1972), Stuhl and Niki (1972), Morley and Smith(1972), Westenberg and deHaas (1972), Anderson et al. (1974), Howard and Evenson (1974), Harris and Wayne (1975),Atkinson et al. (1975), Overend et al. (1976) and Anastasi and Smith (1978), and from measurements of the falloff curve withM=He from Forster et al. (1995) and other bath gases from Zabarnick (1993). For measurements ofk0 in the bath gas SF6, seePagsberg et al. (1997).
High-pressure rate coefficients
Rate coefficient data
k∞/cm3 molecule−1 s−1 Temp./K Reference Technique/Comments
Absolute Rate Coefficients3.0×10−11 298 Zabarnick, 1993 PLP-LIF (a)3.3×10⁻¹¹ 298 Forster et al., 1995 PLP-LIF (b)3.3×10⁻¹¹(T /300)−0.3 250–400 Fulle et al., 1998 PLP-LIF (c)
www.atmos-chem-phys.org/acp/4/1461/ Atmos. Chem. Phys., 4, 1461–1738, 2004

1552 R. Atkinson et al.: Evaluated kinetic and photochemical data for Ox, HOx, NOx and SOx
Comments
(a) Falloff extrapolations with M=Ar and SF6 at pressures below 1 bar.
(b) Measurements in He up to 200 bar using saturated LIF for detection.
(c) see (b); measurements in the bath gas He over the range 5–150 bar.
Preferred Values
k∞ = 3.3×10⁻¹¹ (T /300)−0.3 cm3 molecule−1 s−1 over the temperature range 200–400 K.
Reliability
1log k∞ = ±0.2 over the temperature range 200–400 K.
Comments on Preferred Values
The preferred values are taken from the determination and analysis of the complete falloff curve from Forster et al. (1995)and Fulle et al. (1998). The falloff curve corresponds toFc (300 K) = 0.81. The measurements at pressures below 1 bar of thelow pressure parts of the falloff curves from Zabarnick (1993) and Donahue et al. (1997) are consistent with this representationof the falloff curve.
References
Anastasi, C. and Smith, I. W. M.: J. Chem. Soc. Faraday Trans. 2, 74, 1056, 1978.Anderson, J. G. and Kaufman, F.: Chem. Phys. Lett., 16, 375, 1972.Anderson, J. G., Margitan, J. J. and Kaufman, F.: J. Chem. Phys., 60, 3310, 1974.Atkinson, R., Hansen, D. A. and Pitts Jr., J. N.: J. Chem. Phys., 62, 3284, 1975.Atkinson, D. B. and Smith, M. A.: J. Phys. Chem., 98, 5797, 1994.Burrows, J. P., Wallington, T. J. and Wayne, R. P.: J. Chem. Soc. Faraday Trans. 2, 79, 111, 1983.Donahue, N. M., Dubey, M. K., Mohrschladt, R., Demerjian, K. L. and Anderson, J. G.: J. Geophys. Res., 102, 6159, 1997.Forster, R., Frost, M., Fulle, D., Hamann, H. F., Hippler, H., Schlepegrell, A. and Troe, J.: J. Chem. Phys., 103, 2949, 1995.Fulle, D., Hamann, H. F., Hippler, H. and Troe, J.: J. Chem. Phys., 108, 5391, 1998.Harris, G. W. and Wayne, R. P.: J. Chem. Soc. Faraday Trans. 1, 71, 610, 1975.Howard, C. J. and Evenson, K. M.: J. Chem. Phys., 61, 1943, 1974.Morley, C. and Smith, I. W. M.: J. Chem. Soc. Faraday Trans., 68, 1016, 1972.Overend, R. P., Paraskevopoulos, G. and Black, C.: J. Chem. Phys., 64, 4149, 1976.Pagsberg, P., Bjergbakke, E., Ratajczak, E. and Sillesen, A.: Chem. Phys. Lett., 272, 383, 1997.Sharkey, P., Sims, I. R., Smith, I. W. M., Bocherel, P. and Rowe, B. R.: J. Chem. Soc. Faraday Trans., 90, 3609, 1994.Stuhl, F. and Niki, H.: J. Chem. Phys., 57, 3677, 1972.Westenberg, A. A. and deHaas, N.: J. Chem. Phys., 57, 5375, 1972.Zabarnick, S.: Chem. Phys., 171, 265, 1993.
Atmos. Chem. Phys., 4, 1461–1738, 2004 www.atmos-chem-phys.org/acp/4/1461/

R. Atkinson et al.: Evaluated kinetic and photochemical data for Ox, HOx, NOx and SOx 1553
I.A3.43
HO + NO2 + M → HONO2 + M
1H ◦ = −207.6 kJ·mol−1
Low-pressure rate coefficients
Rate coefficient data
k0/cm3 molecule−1 s−1 Temp./K Reference Technique/Comments
Absolute Rate Coefficients2.3×10−30(T /295)−2.5 [N2] 240–450 Anderson et al., 1974 DF-RF (a)2.9×10⁻³⁰ [N2] 296 Howard and Evenson, 1974 DF-LMR (b)2.6×10⁻³⁰(T /296)−2.6 [N2] 220–550 Anastasi and Smith, 1976 FP-RA (c)(2.6± 0.4)×10−30(T /300)−2.8 [N2] 247–352 Wine et al., 1979 RP-RF (d)(2.7± 0.2)×10−30 [N2] 295 Burrows et al., 1983 DF-RF (e)(3.39± 0.26)×10−30 [N2] 300 Donahue et al., 1997 DF-LIF (f)2.47×10⁻³⁰(T /300)−2.97 [N2] 220–250 Brown et al., 1999 PLP-LIF (g)2.85×10⁻³⁰(T /300)−2.67 [N2] 220–300 Dransfield et al., 1999 DF-LIF (h)(2.5±0.3)×10−30 [N2] 298 D’Ottone et al., 2001 PLP-LIF(i)
Comments
(a) Measurements over the range 1.3–13 mbar (1–10 Torr). Evaluation assuming limiting third order behavior.
(b) Measurements over the range 0.5–6.7 mbar (0.4–5 Torr). Evaluation assuming limiting third order behavior.
(c) Measurements using bath gas concentrations of (3.2–160)×1017 molecule cm−3. Falloff extrapolation using Kassel in-tegrals towardsk0 in agreement with data from Anderson et al. (1974) and Howard and Evenson (1974). Extrapolationtowardsk∞ oversimplified, but data in the intermediate falloff range in agreement with later work.
(d) Measurements using bath gas concentrations of (5.4–230)×1017 molecule cm−3. Extrapolation of the falloff data withFc
= 0.7 leads to the givenk0.
(e) Measurements using bath gas concentrations of 1.3–6.7 mbar (1–5 Torr). Evaluation assuming limiting third order behav-ior.
(f) Measurements over the range 2.6–780 mbar (2–600 Torr). Evaluation of the falloff curve withFc = 0.3± 0.03 andk∞
= (4.77± 1.04)×10−11 cm3 molecules−1 s−1. Fit based on data from this work and Anderson et al. (1974), Howard andEvenson (1974), Anastasi and Smith (1976), Wine et al. (1979) and Burrows et al. (1983).
(g) Measurements over the range 26–325 mbar (20–250 Torr). Evaluation of the falloff curve withFc = 0.6 andk∞ =1.45×10⁻¹¹ (T /300)−2.77 cm3 molecule−1 s−1.
(h) Measurements over the range 6.6–197 mbar (50–150 Torr). Evaluation of the falloff curve withFc = exp(−T /363) andk∞ = 3.13×10⁻¹¹ cm3 molecule−1 s−1. Fit based on data from this work and Anderson et al. (1974), Howard andEvenson (1974), Anastasi and Smith (1976), Wine et al. (1979), Burrows et al. (1983), Donahue et al. (1997) and Brownet al. (1999).
(i) Measurements over the range 40–920 mbar (30–700 Torr) at 273 and 298 K. Data evaluated withFc = 0.6 andk∞ = (2.4± 1.7)×10−11 cm3 molecule−1 s−1. The use ofFc = 0.4 would lead tok0 = 3.7×10⁻³⁰ (T /300)−3.0 [N2] cm3 molecule−1
s−1 andk∞ = 4.6×10⁻¹¹ cm3 molecule−1 s−1.
www.atmos-chem-phys.org/acp/4/1461/ Atmos. Chem. Phys., 4, 1461–1738, 2004

1554 R. Atkinson et al.: Evaluated kinetic and photochemical data for Ox, HOx, NOx and SOx
Preferred Values
k0 = 3.3×10⁻³⁰ (T /300)−3.0 [N2] cm3 molecule−1 s−1 over the temperature range 200–300 K.
Reliability
1log k0 = ± 0.1 at 298 K.1n = ± 0.5.
Comments on Preferred Values
The differences between the various values ofk0 in part are due to different experimental results, in part they arise fromdifferent falloff expressions using eitherFc = 0.6 or smaller values ofFc. While the differences in the experimental resultsare small near to the low pressure limit, they become increasingly pronounced towards the center of the falloff curve and theextrapolatedk∞. There are essentially two groups of studies, those with higher rate constants (e.g. Anastasi and Smith, 1976;Wine et al., 1979; Brown et al., 1999; D’Ottone et al., 2001) and those with lower values (e.g. Donahue et al., 1997; Dransfieldet al., 1999). As long as the reasons for the differences are not identified, we prefer an average of the results from Donahue etal. (1997), Brown et al. (1999), Dransfield et al. (1999) and D’Ottone et al. (2001). The falloff extrapolation is done with thetheoretical results forFc = 0.4 and the temperature coefficient ofk0 from Troe (2001).
High-pressure rate coefficients
Rate coefficient data
k∞/cm3 molecule−1 s−1 Temp./K Reference Technique/Comments
Absolute Rate Coefficients≥3.5×10⁻¹¹ 297 Wine et al., 1979 FP-RF (a)≥3.0×10⁻¹¹ 295 Robertshaw and Smith, 1982 PLP-LIF (b)7.5×10⁻¹¹ 298 Forster et al., 1995 PLP-LIF (c)(4.77± 1.04)×10−11 300 Donahue et al., 1997 DF-LIF (d)(7.5± 2.2)×10−11 250–400 Fulle et al., 1998 PLP-LIF (e)1.45×10⁻¹¹(T /300) 220–250 Brown et al., 1999 PLP-LIF (f)3.13×10⁻¹¹ 220–300 Dransfield et al., 1999 DF-LIF (g)(2.4± 1.7)×10−11 298 D’Ottone et al., 2001 (h)(5.0± 2)×10−11 250–400 Hippler et al., 2002 PLP-LIF (i)(4.8± 0.8)×10−11 298 Smith and Williams, 1985 (j)
Comments
(a) See comment (d) fork0. Extrapolation of the falloff curve withFc = 0.7 leads to the given lower limit ofk∞.
(b) Measurements in the bath gases Ar up to 4 bar and CF4 up to 8.6 bar.
(c) Measurements in a static high pressure cell in the bath gas He over the range 7.6×10¹⁸ – 3.6×10²¹ molecule cm−3 (1–150bar).
(d) See comment (f) fork0.
(e) See comment (c). Measurements in He at 250 K between 1.04 and 140 bar, at 300 K between 113 and 1330 bar, andat 400 K between 1.6 and 1370 bar. High pressure flow cell used below 8 bar, static cell used above 200 bar. Falloffextrapolations withk0 = 1.6×10⁻³⁰ (T /300)−2.9 [He] cm3 molecule−1 s−1 andFc = 0.45 (268 K), 0.41 (300 K) and 0.33(400 K).
(f) See comment (g) fork0.
Atmos. Chem. Phys., 4, 1461–1738, 2004 www.atmos-chem-phys.org/acp/4/1461/
R. Atkinson et al.: Evaluated kinetic and photochemical data for Ox, HOx, NOx and SOx 1555
(g) See comment (h) fork0.
(h) See comment (i) fork0.
(i) See comment (c) and (e); repeated measurements in high pressure flow cells revealed that those measurements fromForster et al. (1995) and Fulle et al. (1998), which were done in a static high pressure cell (pressures above 200 bar), gavek∞ values which are about 30 % too high. Nonexponential profiles of HO decay above 400 K at pressures around 100bar suggest that HOONO isomers are formed besides HNO3 which become thermally unstable on aµs-time scale underthese conditions.
(j) Pulsed laser photolysis – LIF study of the vibrational relaxation HO (ν = 1) + NO2 → HO (ν = 0) + NO2.
Preferred Values
k(1bar) = 1.2×10⁻¹¹ cm3 molecule−1 s−1 at 298 K.k∞ = 4.1×10⁻¹¹ cm3 molecule−1 s−1 over the temperature range 200–400 K.
Reliability
1log k(1bar) =± 0.3 at 298 K.1log k∞ = ± 0.3 at 298 K.1n = ± 0.5.
Comments on Preferred Values
See comments on preferred values ofk0. The preferred value ofk∞ is the average of the falloff extrapolations from Donahueet al. (1997), Dransfield et al. (1999) and D’Ottone et al. (2001), using the theoretical value ofFc = 0.4 from Troe (2001), therevised high-pressure value from Hippler et al. (2002) and the vibrational relaxation rate constant from Smith and Williams(1985). The preferred value ofk(1bar) corresponds to the present preferred values ofk0 andk∞ andFc = 0.4. It agrees withthe results from D’Ottone et al. (2001). The measurements from Donahue et al. (1997) give ak(1 bar) which is about a factorof 2 smaller. We discard this value because it is difficult to be reconciled with the results from Hippler et al. (2002) and Smithand Williams (1985), unless complications with isomer formation show up (see the following).
There is only limited information on the extent of formation of HOONO isomers, e.g. discussed in the modeling in Goldenand Smith (2000), Chakraborty et al. (1998) and Matheu and Green (2000), and on their fate. While spectroscopicin situdetection still has not been possible (Dransfield et al., 2001), non-exponential HO-decays above 400 K at pressures near 100bar in Hippler et al. (2002) provided clear evidence for its formation. It remains unclear whether HOONO efficiently converts toHONO2 at lower pressures by intramolecular processes, or whether HOONO is a final reaction product. Some information ona high barrier for the isomerization on HOONO→ HONO2 is provided byab initio calculations in Sumathi and Peyerimhoff(1997), however, isomerization in loosely bound structures cannot yet be ruled out. Isotopic scrambling experiments fromDonahue et al. (2001) provide some insight, suggesting that HONO2 formation contributes only∼ 20% tok∞. However, thetheoretical analysis from Troe (2001) seems to rule out a noticeable contribution of HOONO formation under atmosphericconditions.
References
Anastasi, C. and Smith, I. W. M.: J. Chem. Soc. Faraday Trans. 2, 72, 1459, 1976.Anderson, J. G., Margitan, J. J. and Kaufman, F.: J. Chem. Phys., 60, 3310, 1974.Anderson, J. G.: J. Geophys. Res., 102, 6159, 1997.Brown, S. S., Talukdar, R. K. and Ravishankara, A. R.: Chem. Phys. Lett., 299, 277, 1999.Burrows, J. P., Wallington, T. J. and Wayne, R. P.: J. Chem. Soc. Faraday Trans. 2, 79, 111, 1983.Chakraborty, D., Park, J. and Lin, M. C.: Chem. Phys., 231, 39, 1998.D’Ottone, L., Campazano-Jost, P., Bauer, D. and Hynes, A. J.: J. Phys. Chem. A, 105, 10 538, 2001.Donahue, N. M., Dubey, M. K., Mohrschladt, R., Demerjian, K., Dransfield, T. J., Perkins, K. K., Anderson, J. G.,Sprenguether, M. M. and Demerjian, K. L.: Geophys. Res. Lett.,26, 687, 1999.Donahue, N. M., Mohrschladt, R., Dransfield, T. J., Anderson, J. G. and Dubey, M. K.: J. Phys. Chem. A, 105, 1515, 2001.
www.atmos-chem-phys.org/acp/4/1461/ Atmos. Chem. Phys., 4, 1461–1738, 2004

1556 R. Atkinson et al.: Evaluated kinetic and photochemical data for Ox, HOx, NOx and SOx
Dransfield, T. J., Donahue, N. M. and Anderson, J. G.: J. Phys. Chem. A, 105, 1507, 2001.Forster, R., Frost, M., Fulle, D., Hamann, H. F., Hippler, H. and Troe, J.: J. Chem. Phys., 100, 5391, 1998.Golden, D. M. and Smith, G. P.: J. Phys. Chem. A, 104, 3991, 2000.Hippler, H., Nasterlack, S. and Striebel, F.: Phys. Chem. Chem. Phys., 4, 2959, 2002.Howard, C. J. and Evenson, K. M.: J. Chem. Phys., 61, 1943, 1974.Matheu, D. M. and Green, W. H.: Int. J. Chem. Kinet., 32, 245, 2000.Robertshaw, J. S. and Smith, I. W. M.: J. Phys. Chem., 86, 785, 1982.Schlepegrell, A. and Troe, J.: J. Chem. Phys., 103, 2949, 1995.Smith, I. W. M. and Williams, M. D.: J. Chem. Soc. Faraday Trans. 2, 81, 1849, 1985.Sumathi, R. and Peyerimhoff, S. D.: J. Chem. Phys., 107, 1872, 1997.Troe, J.: Int. J. Chem. Kinet. 33, 878, 2001.Wine, P. H., Kreutter, N. M. and Ravishankara, A. R.: J. Phys. Chem., 83, 3191, 1979.
Atmos. Chem. Phys., 4, 1461–1738, 2004 www.atmos-chem-phys.org/acp/4/1461/

R. Atkinson et al.: Evaluated kinetic and photochemical data for Ox, HOx, NOx and SOx 1557
I.A3.44
HO + NO3 → HO2 + NO2
1H ◦ = −63.1 kJ mol−1
Rate coefficient data
k/cm3 molecule−1 s−1 Temp./K Reference Technique/Comments
Absolute Rate Coefficients(2.6± 0.6)×10−11 298 Mellouki et al., 1988 DF-EPR (a)(2.0± 0.6)×10−11 298 Boodaghians et al., 1988 DF-RF (b)(1.22± 0.35)×10−11 298 Becker et al., 1992 DF-RF/MS (c)(2.1± 1.0)×10−11 297 Mellouki et al., 1993 DF-LMR (d)
Comments
(a) Both [HO] and [HO2] (after conversion of HO2 to HO) were monitored in the presence of excess NO3 radicals. [NO3] wasmeasured by titration with NO or 2,3-dimethyl-2-butene. A complex kinetic analysis accounting for secondary chemistrywas required to extract values ofk.
(b) The measured rate coefficient,k, was corrected for the effects of secondary reactions which accelerate the removal of HOradicals.
(c) [HO] was monitored by RF, and [NO3] and [HO2] were monitored by MS. Identical values ofk were obtained from HOproducedin situby the H + NO2 reaction or by injection of HO radicals produced from the H + NO2 or F + H2O reactions.A complex analysis accounting for the secondary chemistry was required to extract values ofk.
(d) [HO], [HO2], and [NO2] were monitored by LMR in an excess of NO3 radicals.
Preferred Values
k1 = 2.0×10⁻¹¹ cm3 molecule−1 s−1 at 298 K.
Reliability
1log k = ± 0.3.
Comments on Preferred Values
The value ofk obtained by Becker et al. (1992) is substantially lower than the values reported in the other three studies(Mellouki et al., 1988; 1993; Boodaghians et al., 1988) which are in good agreement, although the error limits quoted arelarge. In all of the studies it proved necessary to make extensive corrections for the secondary reactions. The preferred valueof k is a simple average of all of the reported values.
No measurements have been made of the temperature dependence ofk but a small negative value is expected by analogywith similar reactions.
References
Becker, E., Rahman, M. M. and Schindler, R. N.: Ber. Bunsenges. Phys. Chem., 96, 776, 1992.Boodaghians, R. B., Canosa-Mas, C. E., Carpenter, P. J. and Wayne, R. P.: J. Chem. Soc. Faraday Trans., 2, 84, 931, 1988.Mellouki, A., Le Bras, G. and Poulet, G.: J. Phys. Chem., 92, 2229, 1988.Mellouki, A., Talukdar, R. K., Bopegedera, A. M. R. P. and Howard, C. J.: Int. J. Chem. Kinet., 25, 25, 1993.
www.atmos-chem-phys.org/acp/4/1461/ Atmos. Chem. Phys., 4, 1461–1738, 2004

1558 R. Atkinson et al.: Evaluated kinetic and photochemical data for Ox, HOx, NOx and SOx
I.A3.45
HO2 + NO → NO2+ HO
1H ◦ = −34.5 kJ mol−1
Rate coefficient data
k/cm3 molecule−1 s−1 Temp./K Reference Technique/Comments
Absolute Rate Coefficients(8.1± 1.5)×10−12 296 Howard and Evenson, 1977 DF-LMR (a)3.3×10⁻¹² exp[(254± 50)/T ] 230–400 Howard, 1979 DF-LMR8.01×10−12 2995.7×10−12 exp[(130± 270)T ] 270–425 Leu, 1979 DF-RF (b)(9.8± 1.6)×10−12 298(1.1± 0.3)×10−11 297 Glaschick-Schimpf et al., 1979 DF (c)(7.6± 1.7)×10−12 293 Hack et al., 1980 DF-LMR/EPR (d)3.57×10⁻¹² exp[(226± 41)/T ] 423–1271 Howard, 1980 DF-LMR (e)7.6×10⁻¹² 298*(8.5± 1.3)×10−12 297 Jemi-Alade and Thrush, 1990 DF-LMR (f)3.0×10⁻¹² exp[(290± 30)/T ] 206–295 Seeley et al., 1996 DF-MS (g)(8.0± 0.5)×10−12 294(9.6± 1.5)×10−12 298 Bohn and Zetzsch, 1997 PLP-A (h)
Relative Rate Coefficients(7.3± 0.7)×10−12 298 Thrush and Wilkinson, 1981 DF-LMR (i)
Comments
(a) [HO2] was monitored by LMR. An upper limit of 4.5×10⁻³⁰ cm6 molecule−2 s−1 was established for the rate coefficientof the potentially pressure dependent third-order channel.
(b) [HO] was monitored.
(c) [HO2] was monitored in excess NO by the light emitted at 1.43µm after energy transfer from O2(11) produced by amicrowave discharge in NO.
(d) [HO2] was monitored by both LMR and EPR. The rate coefficient was observed to be pressure independent over the range2.1–16.7 mbar (1.6–12.5 Torr).
(e) The same technique was used as in similar earlier studies (Howard and Evenson, 1977; Howard, 1979) from the samelaboratory. The author combined the data from the present study with that at lower temperatures from the earlier studies(Howard and Evenson, 1977; Howard, 1979) to derive the expressionk = 3.51×10⁻¹² exp[(240± 30)/T ) cm3 molecule−1
s−1 for the temperature range 232–1271 K. The rate coefficient for the reverse reaction was also measured over the range425–1115 K and from the two studies a value of1H ◦(HO2) = (10± 2.5) kJ mol−1 at 298 K was derived. The value ofk
at 298 K tabulated is obtained by extrapolation of the high temperature expression.
(f) [HO2] was monitored by LMR and HO radicals were scavenged by C2F3Cl. k was observed to be independent of pressureover the range 1.1–17 mbar (0.8–13 Torr).
(g) Turbulent fast flow technique was used. [HO2], [HO], and [NO2] were monitored by high pressure chemical ionisationmass-spectrometry.k was found to independent of pressure over the range 93–253 mbar N2 (70–190 Torr) at 294 K.
(h) Pulsed laser photolysis at 248 nm of H2O2/NO/O2 mixtures at total pressures of 0.1, 0.5, and 1 bar. [HO] was monitoredby time resolved CW UV laser absorption in the 308 nm region. The value ofk was found to be independent of pressure.The rate of HO formation and HO2 removal were found to be identical within experimental error indicating an HO yieldclose to unity.
Atmos. Chem. Phys., 4, 1461–1738, 2004 www.atmos-chem-phys.org/acp/4/1461/

R. Atkinson et al.: Evaluated kinetic and photochemical data for Ox, HOx, NOx and SOx 1559
(i) [HO] and [HO2] were monitored by LMR. The steady-state values of [HO] and [HO2] were measured in a system wheretheir relative concentrations are related by [HO]/[HO2] = k/k(HO + H2O2). k was calculated using a rate coefficient ofk(HO + H2O2) = 1.7×10⁻¹² cm3 molecule−1s−1 (this evaluation).
Preferred Values
k= 8.8×10⁻¹² cm3 molecule−1 s−1 at 298 K.k = 3.6×10⁻¹² exp(270/T ) cm3 molecule−1 s−1 over the range 200–400 K.
Reliability
1log k = ± 0.1 at 298 K.1(E/R) = ± 100 K.
Comments on Preferred Values
Since our previous evaluation, IUPAC (1997), the rate coefficient has been measured at 298 K by Gershenzon et al. (1999)and by Bohn and Zetzsch (1997). The latter study gave a value ofk in good agreement with our preferred value. Gershenzonet al. (1999), using a novel EPR technique to follow the course of the reaction, obtained a value ofk= (7 ± 2)×10−12 cm3
molecule−1 s−1 also in agreement with our preferred value within the fairly wide error limits of the experiment.The preferred value ofk at 298 K is the mean of the values of Howard and Evenson (1977), Howard (1979), Leu (1979), Hack
et al. (1980), Jemi-Alade and Thrush (1990), Seeley et al. (1996) and Bohn and Zetzsch (1997). The temperature dependenceis the mean of the values of Howard (1979) and Seeley et al. (1996), which are preferred to the less precise value of Leu (1979).The pre-exponential factor is adjusted to fit the preferred value ofk at 298 K.
Theab initio calculation of Chakraborty et al. (1998), based on formation and rapid decomposition of an HOONO interme-diate, gives values of the rate parameters in reasonably good agreement with our preferred values.
References
Bohn, B., and Zetzsch, C.: J. Phys. Chem. A, 101, 1488, 1997.Chakraborty, D., Park, J. and Lin, M. C.: Chem. Phys., 231, 39, 1998.Gershenzon, Yu. M., Il’in, S. D., Politenkova, G. G. and Remorov, R. G.: Chem. Phys. Rep., 18, 91, 1999.Glaschick-Schimpf, I., Leiss, A., Monkhouse, P. B., Schurath, U., Becker, K. H. and Fink, E. H.: Chem. Phys. Lett., 67, 318,1979.Hack, W., Preuss, A. W., Temps, F., Wagner, H. Gg. and Hoyermann, K.: Int. J. Chem. Kinet., 12, 851, 1980.Howard, C. J. and Evenson, K. M.: Geophys. Res. Lett. 4, 437, 1977.Howard, C. J.: J. Chem. Phys., 71, 2352, 1979.Howard, C. J.: J. Am. Chem. Soc., 102, 851, 1980.IUPAC, Supplement VI: J. Phys. Chem. Ref. Data, 26, 1329, 1997.Jemi-Alade, A. A. and Thrush, B. A.: J. Chem. Soc. Faraday Trans., 86, 3355, 1990.Leu, M.-T.: J. Chem. Phys., 70, 1662, 1979.Seeley, J. V., Meads, R. F., Elrod, M. J. and Molina, M. J.: J. Phys. Chem., 100, 4026, 1996.Thrush, B. A. and Wilkinson, J. P. T.: Chem. Phys. Lett., 81, 1, 1981.
www.atmos-chem-phys.org/acp/4/1461/ Atmos. Chem. Phys., 4, 1461–1738, 2004

1560 R. Atkinson et al.: Evaluated kinetic and photochemical data for Ox, HOx, NOx and SOx
I.A3.46
HO2 + NO2 + M → HO2NO2 + M
1H ◦ = −100.5 kJ·mol−1
Low-pressure rate coefficients
Rate coefficient data
k0/cm3 molecule−1 s−1 Temp./K Reference Technique/Comments
Absolute Rate Coefficients(2.09± 0.52)×10−31 [N2] 300 Howard, 1977 DF-LMR (a)(2.5± 0.5)×10−31 [N2] 283 Cox and Patrick, 1979 (b)(2.3± 0.6)×10−31(T /300)−4.6 [N2] 229–362 Sander and Peterson, 1984 (c)1.5×10⁻³¹ [N2] 298 Kurylo and Ouellette, 1986 (d)1.8×10⁻³¹(T /300)−3.2±0.4 [N2] 228–358 Kurylo and Ouellette, 1987 (d)
Comments
(a) Discharge flow system study with laser magnetic resonance detection of HO2. The pressure range was 0.7–4 mbar (0.5–3Torr). The linear plot ofk0 as a function of [M] with a non-zero intercept was interpreted as contribution from the reactionHO2 + NO2 → HONO + O2. As this reaction channel is not present (see comments on preferred values), the non-zerointercept has to be attributed to a curved falloff plot.
(b) Molecular modulation UV spectrometry. HO2 radicals were generated by Cl2 photolysis in the presence of H2 and O2.O2-N2 mixtures used in the pressure range 53–800 mbar (40–600 Torr).
(c) Flash photolysis-UV absorption study in the pressure range 67–930 mbar (50–700 Torr). A strong enhancement of reactionin the presence of water vapor was observed, suggested to be due to formation of HO2-H2O complexes.
(d) Flash photolysis of Cl2-CH3OH-NO2 mixtures in the presence of O2 or N2, with HO2 detection at 225 nm. The falloffcurve measured over the pressure range 33–800 mbar (25–600 Torr). The rate coefficient was evaluated usingFc = 0.6andk∞ = 4.7 x 10⁻¹² (T /300)−1.4±1.0 cm3 molecule−1 s−1.
Preferred Values
k0 = 1.8×10⁻³¹ (T /300)−3.2 [N2] cm3 molecule−1 s−1 over the temperature range 220–360 K.
Reliability
1log k0 = ±0.10 at 298 K.1n = ±1.
Comments on Preferred Values
The studies of Howard (1977), Cox and Patrick (1979), Sander and Peterson (1984) and Kurylo and Ouellette (1986, 1987)are in reasonable agreement. The preferred values are based on the study of Kurylo and Ouellette (1987), with the ratecoefficientk0 being evaluated with the value fork∞ given below andFc = 0.6. Modification ofFc will lead to minor changesin k0 andk∞. Unsuccessful search for HONO as a reaction product in Dransfield et al. (2001) indicates that the reaction HO2+ NO2 → HONO + O2 (at a pressure of 120 Torr [160 mbar]) does not occur.
Atmos. Chem. Phys., 4, 1461–1738, 2004 www.atmos-chem-phys.org/acp/4/1461/
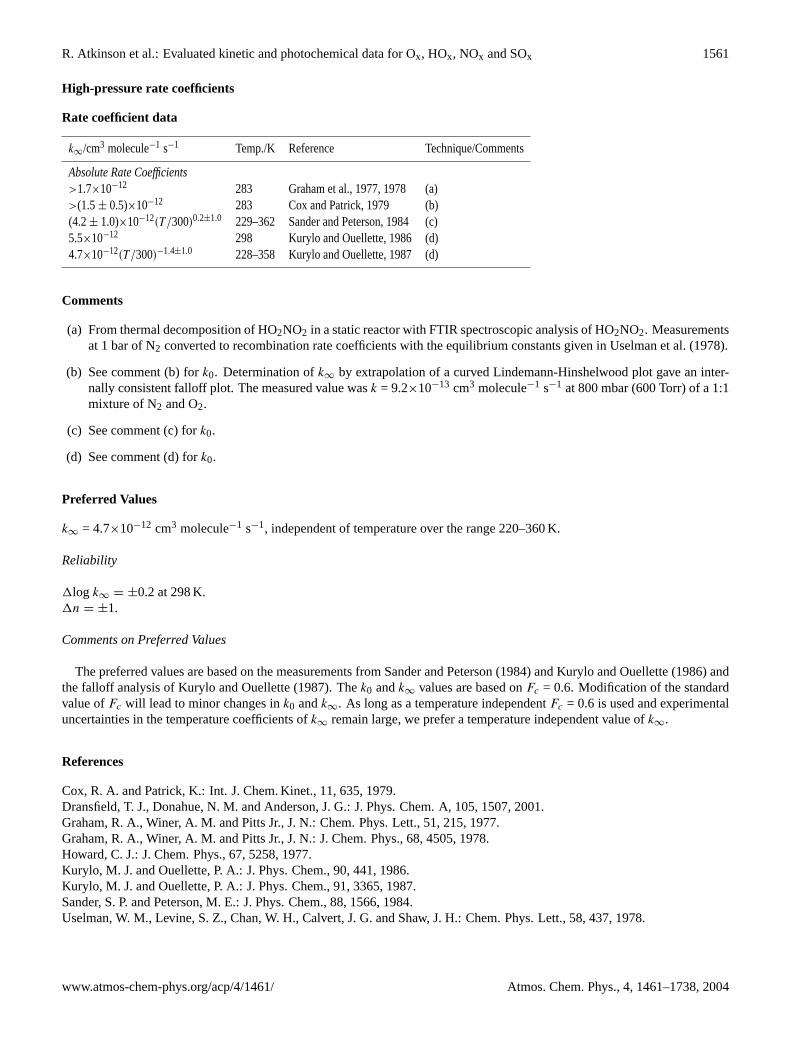
R. Atkinson et al.: Evaluated kinetic and photochemical data for Ox, HOx, NOx and SOx 1561
High-pressure rate coefficients
Rate coefficient data
k∞/cm3 molecule−1 s−1 Temp./K Reference Technique/Comments
Absolute Rate Coefficients>1.7×10⁻¹² 283 Graham et al., 1977, 1978 (a)>(1.5± 0.5)×10−12 283 Cox and Patrick, 1979 (b)(4.2± 1.0)×10−12(T /300)0.2±1.0 229–362 Sander and Peterson, 1984 (c)5.5×10⁻¹² 298 Kurylo and Ouellette, 1986 (d)4.7×10⁻¹²(T /300)−1.4±1.0 228–358 Kurylo and Ouellette, 1987 (d)
Comments
(a) From thermal decomposition of HO2NO2 in a static reactor with FTIR spectroscopic analysis of HO2NO2. Measurementsat 1 bar of N2 converted to recombination rate coefficients with the equilibrium constants given in Uselman et al. (1978).
(b) See comment (b) fork0. Determination ofk∞ by extrapolation of a curved Lindemann-Hinshelwood plot gave an inter-nally consistent falloff plot. The measured value wask = 9.2×10⁻¹³ cm3 molecule−1 s−1 at 800 mbar (600 Torr) of a 1:1mixture of N2 and O2.
(c) See comment (c) fork0.
(d) See comment (d) fork0.
Preferred Values
k∞ = 4.7×10⁻¹² cm3 molecule−1 s−1, independent of temperature over the range 220–360 K.
Reliability
1log k∞ = ±0.2 at 298 K.1n = ±1.
Comments on Preferred Values
The preferred values are based on the measurements from Sander and Peterson (1984) and Kurylo and Ouellette (1986) andthe falloff analysis of Kurylo and Ouellette (1987). Thek0 andk∞ values are based onFc = 0.6. Modification of the standardvalue ofFc will lead to minor changes ink0 andk∞. As long as a temperature independentFc = 0.6 is used and experimentaluncertainties in the temperature coefficients ofk∞ remain large, we prefer a temperature independent value ofk∞.
References
Cox, R. A. and Patrick, K.: Int. J. Chem. Kinet., 11, 635, 1979.Dransfield, T. J., Donahue, N. M. and Anderson, J. G.: J. Phys. Chem. A, 105, 1507, 2001.Graham, R. A., Winer, A. M. and Pitts Jr., J. N.: Chem. Phys. Lett., 51, 215, 1977.Graham, R. A., Winer, A. M. and Pitts Jr., J. N.: J. Chem. Phys., 68, 4505, 1978.Howard, C. J.: J. Chem. Phys., 67, 5258, 1977.Kurylo, M. J. and Ouellette, P. A.: J. Phys. Chem., 90, 441, 1986.Kurylo, M. J. and Ouellette, P. A.: J. Phys. Chem., 91, 3365, 1987.Sander, S. P. and Peterson, M. E.: J. Phys. Chem., 88, 1566, 1984.Uselman, W. M., Levine, S. Z., Chan, W. H., Calvert, J. G. and Shaw, J. H.: Chem. Phys. Lett., 58, 437, 1978.
www.atmos-chem-phys.org/acp/4/1461/ Atmos. Chem. Phys., 4, 1461–1738, 2004

1562 R. Atkinson et al.: Evaluated kinetic and photochemical data for Ox, HOx, NOx and SOx
I.A3.47
HO2NO2 + M → HO2 + NO2 + M
1H ◦ = 100.5 kJ·mol−1
Low-pressure rate coefficients
Rate coefficient data
k0/s−1 Temp./K Reference Technique/Comments
Absolute Rate Coefficients1.5×10−20 [N2] 298 Cox and Patrick, 1979 (a)5.2×10⁻⁶ exp[−(10014± 250)/T ] [N2] 261–295 Graham et al., 1978 (b)1.3×10⁻²⁰ [N2] 2984.1×10−5 exp[−(10645± 260)/T ] [N2] 261–307 Zabel, 1995 (c)1.2×10⁻²⁰ [N2] 298
Comments
(a) Derived from measurements of the reverse reaction. Conversion of the data to the dissociation reaction of HO2NO2 usingthe equilibrium constantKc = 1.68×1028 exp(−11977/T ) cm3 molecule−1 from Uselman et al. (1978) and comparisonwith earlier dissociation data.
(b) FTIR study in a 5800 L chamber. Measurements were made at 1.3–9.3 mbar (1–7 Torr) of N2. At higher pressures (≥9.3mbar), deviations from low pressure behavior were observed.
(c) FTIR study in a 420 L chamber. The pressure range was 14–1027 mbar (10–772 Torr). The falloff curve was evaluatedwith Fc = 0.5.
Preferred Values
k0 = 1.3×10⁻²⁰ [N2] s−1 at 298 K.k0 = 4.1×10⁻⁵ exp(−10650/T ) [N2] s−1 over the temperature range 260–300 K.
Reliability
1log k0 = ±0.3 at 298 K.1(E/R) = ±500 K.
Comments on Preferred Values
The preferred values are from the study of Zabel (1995), and are in close agreement with those from Graham et al. (1978).The data from Zabel (1995) provide the most consistent picture of all RO2NO2 dissociation reactions. Falloff curves areconstructed withFc = 0.5.
Atmos. Chem. Phys., 4, 1461–1738, 2004 www.atmos-chem-phys.org/acp/4/1461/

R. Atkinson et al.: Evaluated kinetic and photochemical data for Ox, HOx, NOx and SOx 1563
High-pressure rate coefficients
Rate coefficient data
k∞/s−1 Temp./K Reference Technique/Comments
Absolute Rate Coefficients>0.018 278 Graham et al., 1978 (a)5.7×10¹⁵ exp(−11170/T ) 261–307 Zabel, 1995 (b)0.30 298
Comments
(a) See comment (b) fork0. This is a lower limit since a linear Lindemann-Hinshelwood evaluation of the falloff curve wasmade for the pressure range 0.013–1.01 bar (10–760 Torr) of N2.
(b) See comment (c) fork0.
Preferred Values
k∞ = 0.25 s−1 at 298 K.k∞ = 4.8×10¹⁵ exp(−11170/T ) s−1 over the temperature range 260–300 K.
Reliability
1log k∞ = ±0.5 at 298 K.1(E/R) = ±500 K.
Comments on Preferred Values
See Comments on Preferred Values fork0. The data from Zabel (1995) were re-evaluated withFc = 0.6 such as used forthe falloff curves of the reverse reaction HO2 + NO2 + M → HO2NO2 + M and becauseFc is identical for the forward andbackward reaction. Since the measurements from Zabel (1995) were made close to the low pressure limit, only the extrapolationto k∞ is noticeably influenced by the change of the usedFc.
References
Cox, R. A. and Patrick, K.: Int. J. Chem. Kinet., 11, 635, 1979.Graham, R. A., Winer, A. M. and Pitts Jr., J. N.: Chem. Phys. Lett., 51, 215 (1977); J. Chem. Phys., 68, 4505, 1978.Uselman, W. M., Levine, S. Z., Chan, W. H., Calvert, J. G. and Shaw, J. H.: Chem. Phys. Lett., 58, 437, 1978.Zabel, F.: Z. Phys. Chem., 188, 119, 1995.
www.atmos-chem-phys.org/acp/4/1461/ Atmos. Chem. Phys., 4, 1461–1738, 2004

1564 R. Atkinson et al.: Evaluated kinetic and photochemical data for Ox, HOx, NOx and SOx
I.A3.48
HO2 + NO3 → O2 + HNO3 (1)→ HO + NO2 + O2 (2)
1H ◦(1) = −223.4 kJ mol−1
1H ◦(2) = −17.9 kJ mol−1
Rate coefficient data (k = k1 + k2)
k/cm3 molecule−1 s−1 Temp./K Reference Technique/Comments
Absolute Rate Coefficientsk1 = (9.2± 4.8)×10−13 298 Mellouki et al., 1988 DF-EPR (a)k2 = (3.6± 0.9)×10−12 2982.3×10−12 exp[(170± 270)/T ] 263–338 Hall et al., 1988 MM-UV/VIS (b)(4.1± 0.8)×10−12 298k1 = (1.9± 0.8)×10−12 298 Becker et al., 1992 DF-RF/MS (c)k2 = (2.5± 0.7)×10−12 298(3.0± 0.7)×10−12 297± 2 Mellouki et al., 1993 DF-LMR (d)
Comments
(a) [HO] and [NO3] were monitored in excess NO3. Kinetics of a complex mechanism were analysed to extract values of ratecoefficients. Values ofk(HO + NO3) were also obtained (see the HO + NO3 data sheet).
(b) [HO2] and [NO3] were monitored by visible and UV spectroscopy. The kinetics of a complex mechanism were simulatedto extract values of rate coefficients. An upper limit ofk2/k < 0.6 was obtained from measurements of [HO] by modulatedresonance absorption.
(c) [HO] monitored by RF, and [NO3] and [HO2] monitored by MS. A quasi-steady state of [HO2] and [HO] is produced byreaction of HO with NO3, in excess, to reform HO2 radicals.k1 was inferred from the extra loss of HO2 following theestablishment of the quasi-steady state.
(d) [HO], [HO2], and [NO2] were all monitored by LMR. Three different methods for generation of NO3 were used.k couldbe obtained under pseudo-first-order conditions by using an excess of NO3 and adding C2F3Cl to scavenge HO radicals.A value of the branching ratio was obtained by simulation of the time dependences of [HO] and [HO2] using a simplemechanism.
Preferred Values
k= 4.0×10⁻¹² cm3 molecule−1 s−1 at 298 K.
Reliability
1log k = ± 0.2.
Comments on Preferred Values
Although the study of Mellouki et al. (1993) gives a value ofk at 298K some 30% lower than obtained in the earlier studies(Mellouki et al., 1988; Hall et al., 1988; Becker et al., 1992), all of the values are within the reported error limits, which aresubstantial. The preferred value is a mean of the data from all four studies (Mellouki et al., 1988; 1993; Hall et al., 1988;Becker et al., 1992). Measurements of the branching ratiok2/k at 298 K range from< 0.6 (Hall et al., 1988) to 1.0 (Mellouki etal., 1993). The study of Mellouki et al. (1993), in which HO yields were measured, appears to be the most direct, and suggeststhat the reaction proceeds almost entirely through the second channel, but at this stage no recommendation is made for the
Atmos. Chem. Phys., 4, 1461–1738, 2004 www.atmos-chem-phys.org/acp/4/1461/
R. Atkinson et al.: Evaluated kinetic and photochemical data for Ox, HOx, NOx and SOx 1565
branching ratio because of the experimental uncertainties. Similarly, data on the temperature dependence is considered to betoo uncertain to make a recommendation.
References
Becker, E., Rahman, M. M. and Schindler, R. N.: Ber. Bunsenges. Phys. Chem., 96, 776, 1992.Hall, I. W., Wayne, R. P., Cox, R. A., Jenkin, M. E. and Hayman, G. D.: J. Phys. Chem., 92, 5049, 1988.Mellouki, A., LeBras, G. and Poulet, G.: J. Phys. Chem., 92, 2229, 1988.Mellouki, A., Talukdar, R. K., Bopegedera, A. M. R. P. and Howard, C. J.: Int. J. Chem. Kinet., 25, 25, 1993.
www.atmos-chem-phys.org/acp/4/1461/ Atmos. Chem. Phys., 4, 1461–1738, 2004

1566 R. Atkinson et al.: Evaluated kinetic and photochemical data for Ox, HOx, NOx and SOx
I.A3.49
NH2 + O2 → Products
Rate coefficient data
k/cm3 molecule−1 s−1 Temp./K Reference Technique/Comments
Relative Rate Coefficients< 6×10⁻²¹ 296 Tyndall et al., 1991 (a)
Comments
(a) Photolysis of NH3 in the presence of excess O2. The concentrations of NO, NO2, and N2O, the only likely products, weremeasured by FTIR spectroscopy. The upper limit to the rate coefficient was based on computer simulation of a substantialreaction mechanism.
Preferred Values
k < 6×10⁻²¹ cm3 molecule−1 s−1 at 298 K.
Comments on Preferred Values
This reaction has several energetically feasible channels, including those leading to NO + H2O and HNO + HO. The mea-surements of Tyndall et al. (1991) set an upper limit to the channels leading directly, or indirectly, to NO, NO2, and N2O. Thisresult confirms earlier conclusions that the reaction is very slow (Lesclaux and Demissy, 1977; Cheskis and Sarkisov, 1979;Patrick and Golden, 1984; Lozovsky et al., 1984; Michael et al., 1985) making it unimportant in the atmosphere.
References
Cheskis, S. G. and Sarkisov, O. M.: Chem. Phys. Lett., 62, 72, 1979.Lesclaux, R. and Demissy, M.: Nouv. J. Chim., 1, 443, 1977.Lozovsky, V. A., Ioffe, M. A. and Sarkisov, O. M.: Chem. Phys. Lett., 110, 651, 1984.Michael, J. V., Klemm, R. B., Brobst, W. D., Bosco, S. R. and Nava, D. F.: J. Phys. Chem., 89, 3335, 1985.Patrick, R. and Golden, D. M.: J. Phys. Chem., 88, 491, 1984.Tyndall, G. S., Orlando, J. J., Nickerson, K. E., Cantrell, C. A. and Calvert, J. G.: J. Geophys. Res., 96, 20 761, 1991.
Atmos. Chem. Phys., 4, 1461–1738, 2004 www.atmos-chem-phys.org/acp/4/1461/

R. Atkinson et al.: Evaluated kinetic and photochemical data for Ox, HOx, NOx and SOx 1567
I.A3.50NH2 + O3 → Products
Rate coefficient data
k/cm3 molecule−1 s−1 Temp./K Reference Technique/Comments
Absolute Rate Coefficients4.2×10−12 exp[−(1250± 250)/T ] 298–380 Kurusawa and Lesclaux, 1980 FP/LIF(6.3± 1.0)×10−14 298(1.2± 0.3)×10−13 298 Bulatov et al., 1980 FP (a,b)2.01×10⁻¹² exp[−(710± 50)/T ] 250–358 Hack et al., 1981 DF-LIF (b)(1.84± 0.16)×10−13 2951.57×10−11 exp[−(1151± 123)/T ] 272–348 Patrick and Golden, 1984 PLP-RA(3.25± 0.27)×10−13 298(1.5± 0.3)×10−13 298 Cheskis et al., 1985 PLP-LIF (c)
Comments
(a) [NH2] monitored by intracavity laser spectroscopy.
(b) Deviation from first order kinetics observed at high O3 pressures, and interpreted as due to formation of NH2O, whichregenerates NH2 by reaction with O3.
(c) The rate coefficients of reaction of vibrationally excited NH2 with O3 were also measured and found to be a factor of 10greater than that of NH2 in its ground vibrational state.
Preferred Values
k= 1.7×10⁻¹³ cm3 molecule−1 s−1 at 298 K.k = 4.9×10⁻¹² exp(−1000/T ) cm3 molecule−1 s−1 over the temperature range 250–380 K.
Reliability
1log k = ± 0.5 at 298 K.1(E/R) = ± 500 K.
Comments on Preferred Values
The reported rate coefficients at 298 K vary by a factor of 5. There is no convincing argument for rejecting any of the studiesand, therefore, the preferred rate coefficient at 298 K is taken as the average of the results of Kurasawa and Lesclaux (1980),Bulatov et al. (1980), Hack et al. (1981), Patrick and Golden (1984) and Cheskis et al. (1985). The temperature dependenceof k is obtained by averaging the values of Kurasawa and Lesclaux (1980), Hack et al. (1981) and Patrick and Golden (1984).Although the products of the reaction have not been characterized, the most likely process is transfer of an oxygen atom toform NH2O + O2. It has been suggested (Bulatov et al., 1980; Hack et al., 1981) that NH2 may be regenerated by reaction withO3, but the study of Patrick and Golden (1984) indicates that this reaction must be slow.
References
Bulotov, V.P., Buloyan, A. A., Cheskis, S. G., Kozliner, M. Z., Sarkisov, O. M. and Trotsin, A. I.: Chem. Phys. Lett., 74, 288,1980.Cheskis, S. G., Iogensen, A. A., Sarkisov, O. M. and Titov, A. A.: Chem. Phys. Lett., 120, 45, 1985.Hack, W., Horie, O. and Wagner, H. Gg.: Ber. Bunsenges. Phys. Chem., 85, 72, 1981.Kurasawa, H. and Lesclaux, R.: Chem. Phys. Lett., 72, 437, 1980.Patrick, R. and Golden, D. M.: J. Phys. Chem., 88, 491, 1984.
www.atmos-chem-phys.org/acp/4/1461/ Atmos. Chem. Phys., 4, 1461–1738, 2004
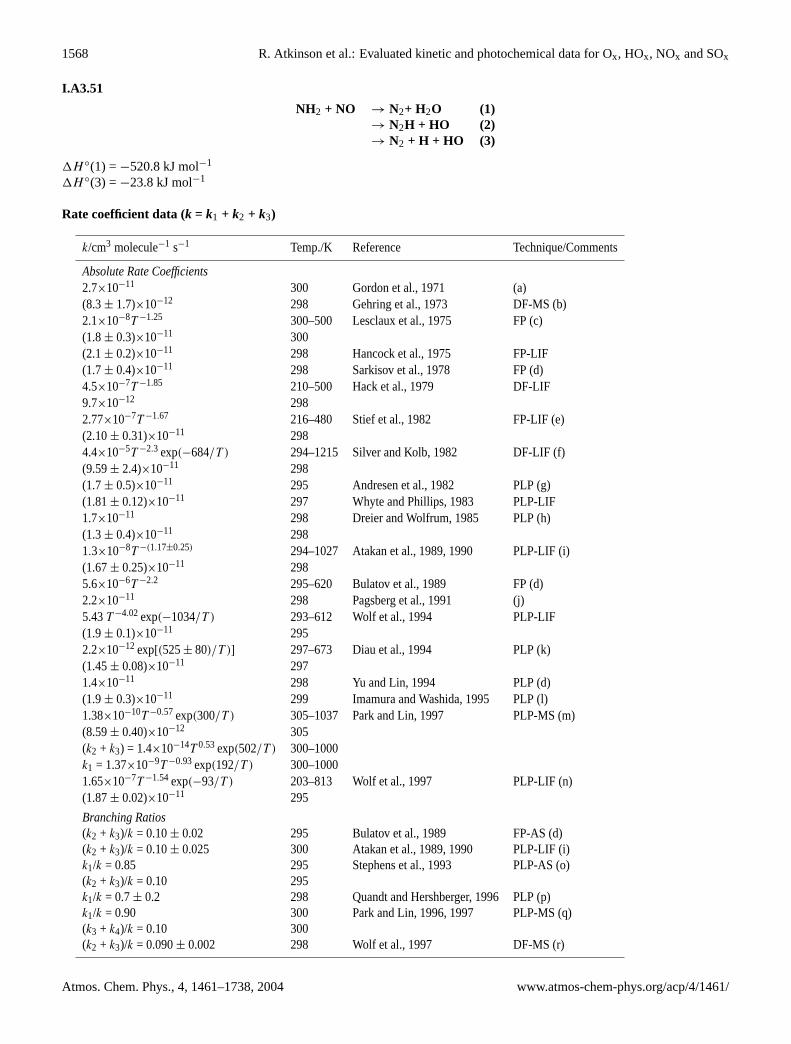
1568 R. Atkinson et al.: Evaluated kinetic and photochemical data for Ox, HOx, NOx and SOx
I.A3.51
NH2 + NO → N2+ H2O (1)→ N2H + HO (2)→ N2 + H + HO (3)
1H ◦(1) = −520.8 kJ mol−1
1H ◦(3) = −23.8 kJ mol−1
Rate coefficient data (k = k1 + k2 + k3)
k/cm3 molecule−1 s−1 Temp./K Reference Technique/Comments
Absolute Rate Coefficients2.7×10−11 300 Gordon et al., 1971 (a)(8.3± 1.7)×10−12 298 Gehring et al., 1973 DF-MS (b)2.1×10⁻⁸T −1.25 300–500 Lesclaux et al., 1975 FP (c)(1.8± 0.3)×10−11 300(2.1± 0.2)×10−11 298 Hancock et al., 1975 FP-LIF(1.7± 0.4)×10−11 298 Sarkisov et al., 1978 FP (d)4.5×10⁻⁷T −1.85 210–500 Hack et al., 1979 DF-LIF9.7×10−12 2982.77×10−7T −1.67 216–480 Stief et al., 1982 FP-LIF (e)(2.10± 0.31)×10−11 2984.4×10−5T −2.3 exp(−684/T ) 294–1215 Silver and Kolb, 1982 DF-LIF (f)(9.59± 2.4)×10−11 298(1.7± 0.5)×10−11 295 Andresen et al., 1982 PLP (g)(1.81± 0.12)×10−11 297 Whyte and Phillips, 1983 PLP-LIF1.7×10−11 298 Dreier and Wolfrum, 1985 PLP (h)(1.3± 0.4)×10−11 2981.3×10−8T −(1.17±0.25) 294–1027 Atakan et al., 1989, 1990 PLP-LIF (i)(1.67± 0.25)×10−11 2985.6×10−6T −2.2 295–620 Bulatov et al., 1989 FP (d)2.2×10⁻¹¹ 298 Pagsberg et al., 1991 (j)5.43T −4.02 exp(−1034/T ) 293–612 Wolf et al., 1994 PLP-LIF(1.9± 0.1)×10−11 2952.2×10−12 exp[(525± 80)/T )] 297–673 Diau et al., 1994 PLP (k)(1.45± 0.08)×10−11 2971.4×10−11 298 Yu and Lin, 1994 PLP (d)(1.9± 0.3)×10−11 299 Imamura and Washida, 1995 PLP (l)1.38×10⁻¹⁰T −0.57 exp(300/T ) 305–1037 Park and Lin, 1997 PLP-MS (m)(8.59± 0.40)×10−12 305(k2 + k3) = 1.4×10⁻¹⁴T 0.53 exp(502/T ) 300–1000k1 = 1.37×10⁻⁹T −0.93 exp(192/T ) 300–10001.65×10−7T −1.54 exp(−93/T ) 203–813 Wolf et al., 1997 PLP-LIF (n)(1.87± 0.02)×10−11 295
Branching Ratios(k2 + k3)/k = 0.10± 0.02 295 Bulatov et al., 1989 FP-AS (d)(k2 + k3)/k = 0.10± 0.025 300 Atakan et al., 1989, 1990 PLP-LIF (i)k1/k = 0.85 295 Stephens et al., 1993 PLP-AS (o)(k2 + k3)/k = 0.10 295k1/k = 0.7± 0.2 298 Quandt and Hershberger, 1996 PLP (p)k1/k = 0.90 300 Park and Lin, 1996, 1997 PLP-MS (q)(k3 + k4)/k = 0.10 300(k2 + k3)/k = 0.090± 0.002 298 Wolf et al., 1997 DF-MS (r)
Atmos. Chem. Phys., 4, 1461–1738, 2004 www.atmos-chem-phys.org/acp/4/1461/

R. Atkinson et al.: Evaluated kinetic and photochemical data for Ox, HOx, NOx and SOx 1569
Comments
(a) Pulse radiolysis of NH3-NO mixtures at 670 mbar (500 Torr) total pressure. [NH2] monitored by time-resolved absorptionspectroscopy.
(b) NO2 was added to an excess of H atoms followed by addition of NH3. Analysis by time-of-flight mass-spectrometry.Vibrationally excited H2O was observed as a product. The addition product NH2NO was also observed to the extent of5% of the N2 formed.
(c) [NH2] was monitored by absorption spectroscopy. No pressure dependence ofk was observed over the range 2.7–930mbar (2–700 Torr) of N2.
(d) [NH2] was monitored by intracavity laser absorption.
(e) [NH2] was monitored by LIF. Production of HO was looked for by resonance fluorescence and found under static condi-tions but not under flowing conditions. An upper limit of (k2 + k3)/k ≤ 0.22 was obtained.
(f) [NH2] was monitored by LIF. HO production was detected by RF or by LIF. A rate coefficient ratio (k2 + k3)/k = 0.4±
0.1 was obtained but the data were later re-analysed by the authors to give a value of 0.12. H-atom production was lookedfor using RF; an upper limit of 0.05 was found for the branching ratio of channels leading to H atoms.
(g) The rate coefficient was obtained by monitoring the production of vibrationally excited H2O by observation of infraredand visible emissions. RA and LIF were used to monitor [HO].k2/k ≥ 0.65 was obtained with the H-atom yield being≤
0.05.
(h) [NH2] and [N2] were monitored by coherent anti-Stokes Raman spectroscopy (CARS). Another independent value of therate constant was obtained by monitoring the IR fluorescence of vibrationally excited H2O.
(i) [HO] was monitored by LIF. The HO yield was determined by using HO production from H2O2 photolysis to calibratefor [HO].
(j) Pulse radiolysis, of Ar-SF6-NH3-NO mixtures at a total pressure of∼ 50 mbar. [NH2] and [HO] were monitored bytime-resolved UV absorption spectroscopy. The observed yield of HO was small suggesting a value of (k2+k3)/k ≈ 0.07.
(k) [NH2] was monitored by cavity ring down absorption spectroscopy at 537.6 nm.
(l) [NH2] was monitored by photoionization mass spectrometry.
(m) Pulsed laser photolysis of NH3-NO mixtures. [H2O] and [NO] were monitored by time-resolved mass-spectrometry andvalues ofk were derived from detailed modelling of the [H2O] and [NO] profiles. In a subsequent publication (Park andLin, 1999) the data are re-analysed and expressions derived givingk1 and (k2 + k3) up to temperatures above 2000 K butthese expressions agree very closely with those cited here forT ≤ 1000 K.
(n) The expressionk = 2.66×10⁻⁸T −1.27 cm3 molecule−1 s−1 also provides a good fit to the data.
(o) Pulsed laser photolysis of NH3-NO mixtures. [H2O], [HO], [NH3], and [NH2] were monitored by infrared absorptionspectroscopy.
(p) Pulsed laser photolysis of NH3-NO mixtures. [H2O] and [NH2] were monitored by infrared absorption spectroscopy.This was a preliminary study to an investigation of the branching in the NH2 + NO2 reaction.
(q) Pulsed laser photolysis of NH3-NO-CO mixtures. Time-resolved mass-spectrometric measurements of [H2O], [NO] andof [CO2] produced by scavenging of HO by the CO.
(r) NH2 radicals were generated by the F + NH3 reaction in a flow He carrier gas to which an NO-CO-He mixture wasadded downstream of the NH2 generation point. [N2] and [CO2] were determined by mass-spectrometry. The ND2 + NOreaction was also studied.
www.atmos-chem-phys.org/acp/4/1461/ Atmos. Chem. Phys., 4, 1461–1738, 2004
1570 R. Atkinson et al.: Evaluated kinetic and photochemical data for Ox, HOx, NOx and SOx
Preferred Values
k= 1.6×10⁻¹¹ cm3 molecule−1 s−1 at 298 K.k = 1.6×10⁻¹¹ (T /298)−1.4 cm3 molecule−1 s−1 over the temperature range 210–500 K.k1/k = 0.9 at 298 K.(k2 + k3)/k = 0.1 at 298 K.
Reliability
1log k = ± 0.15 at 298 K.1n = ± 0.5.1k1/k = ± 0.05 at 298 K.1(k2 + k3)/k = ± 0.03 at 298 K.
Comments on Preferred Value
The values of the rate coefficients obtained in the pulsed photolysis studies are significantly higher than those obtained usingthe discharge flow technique. The reason for this discrepancy is not known. The preferred value at 298 K is therefore takenas the mean of the values reported in the below references. The temperature dependence is based on the data below 500 K inthe temperature dependence studies of Lesclaux et al. (1975), Hack et al. (1979), Stief et al. (1982), Silver and Kolb (1982),Atakan et al. (1989; 1990), Bulatov et al. (1989), Wolf et al. (1994; 1997), Diau et al. (1994) and Park and Lin (1997).
The preferred values of the branching ratios are based on the direct measurements of Atakan et al. (1989; 1990), Stephens etal. (1993), Park and Lin (1996; 1997) and Wolf et al. (1997). The less direct study of Bulatov et al. (1989) and the preliminarystudy of Quandt and Hershberger (1996) are in satisfactory agreement with the preferred values.
There are now reasonably consistent measurements of the branching ratios up to∼ 1700 K. The value of (k2 +k3)/k remainsvirtually independent of temperature over the range covered by our recommendations but begins to rise steadily at temperaturesin excess of 600 K reaching a value of∼ 0.53 at 1700 K (Park and Lin, 1999).
References
Andresen, P., Jacobs, A., Kleinermanns, C. and Wolfrum, J.: 19th Symp. (Int.) Combust., 11, 1982.Atakan, B., Jacobs, A., Wahl, W., Weller, R. and Wolfrum, J.: Chem. Phys. Lett.155, 609, 1989.Atakan, B., Wolfrum, J. and Weller, R.: Ber. Bunsenges. Phys. Chem., 94, 1372, 1990.Bulatov, V. P., Ioffe, A. A., Lozovsky, V. A. and Sarkisov, O. M.: Chem. Phys. Lett., 162, 141, 1989.Diau, E. W., Yu, T., Wagner, M. A. G. and Lin, M. C.: J. Phys. Chem., 98, 4034, 1994.Dreier, T. and Wolfrum, J.: 20th Symp. (Int.) Combust., 695, 1985.Gehring, M., Hoyermann, K., Schacke, H. and Wolfrum, J.: 14th Symp. (Int.) Combust., 99, 1973.Gordon, S., Mulac, W. and Nangia, P.: J. Phys. Chem., 75, 2087, 1971.Hack, W., Schacke, H., Schroter, M. and Wagner, H. Gg.: 17th Symp. (Int.) Combust., 505, 1979.Hancock, G., Lange, W., Lenzi, M. and Welge, K. H.: Chem. Phys. Lett., 33, 168, 1975.Imamura, T. and Washida, N.: Laser Chem., 16, 43, 1995.Lesclaux, R., Khe, P. V., Dezauzier, P. and Soulignac, J. C.: Chem. Phys. Lett., 35, 493, 1975.Pagsberg, P., Sztuba, B., Ratajczak, E. and Sillesen, A.: Acta Chem. Scand., 45, 329, 1991.Park, J. and Lin, M. C.: J. Phys. Chem., 100, 3317, 1996.Park, J. and Lin, M. C.: J. Phys. Chem., 101, 5, 1997.Park, J. and Lin, M. C.: J. Phys. Chem. A, 103, 8906, 1999.Quandt, R. W. and Hershberger, J. F.: J. Phys. Chem., 100, 9407, 1996.Sarkisov, O. M., Cheskis, S. G. and Sviridenkov, E. A.: Bull. Acad. Sci. USSR, Chem. Ser., 27, 2336, Eng. trans., 1978.Silver, J. A. and Kolb, C. E.: J. Phys. Chem., 86, 3240, 1982.Stephens, J. W., Morter, C. L., Farhat, S. K., Glass, G. P. and Curl, R. F.: J. Phys. Chem., 97, 8944, 1993.Stief, L. J., Brobst, W. D., Nava, D. F., Barkowski, R. P. and Michael, J. V.: J. Chem. Soc. Faraday Trans., 2, 78, 1391, 1982.Whyte, A. R. and Phillips, L. F.: Chem. Phys. Lett., 102, 451, 1983.Wolf, M., Yang, D. L. and Durant, J. L.: J. Photochem. Photobiol., 80, 85, 1994.Wolf, M., Yang, D. L. and Durant, J. L.: J. Phys. Chem. A, 101, 6243, 1997.Yu, T. and Lin, M. C.: J. Phys. Chem., 98, 2105, 1994.
Atmos. Chem. Phys., 4, 1461–1738, 2004 www.atmos-chem-phys.org/acp/4/1461/

R. Atkinson et al.: Evaluated kinetic and photochemical data for Ox, HOx, NOx and SOx 1571
I.A3.52NH2 + NO2 → N2O + H2O (1)
→ N2 + H2O2 (2)→ H2NO + NO (3)
1H ◦(1) = −381.7 kJ mol−1
1H ◦(2) = −358.2 kJ mol−1
Rate coefficient data (k = k1 + k2 + k3)
k/cm3 molecule−1 s−1 Temp./K Reference Technique/Comments
Absolute Rate Coefficients3.8×10−8T −1.30 298–505 Kurasawa and Lesclaux, 1979 FP-LIF (a)(2.3± 0.2)×10−11 298(2.11± 0.18)×10−11 297 Whyte and Phillips, 1983 PLP-LIF (a)(2.26± 0.08)×10−11 298 Xiang et al., 1985 PLP-LIF (b)(2.1± 0.4)×10−11(T /298)−1.7 295–620 Bulatov et al., 1989 FP (c)1.35×10⁻⁷T −1.44 exp(−135/T ) 300–910 Park and Lin, 1996,1997 PLP-MS (d)(1.39± 0.07)×10−11 300
Branching Ratiosk1/k = 0.14± 0.02 298 Quandt and Hershberger, 1996 PLP-TDLS (e)k1/k = 0.59± 0.03 298 Meunier et al., 1996 PR-TDLS (f)k3/k = 0.40± 0.05 298k1/k = 0.19± 0.02 300–990 Park and Lin, 1996, 1997 PLP-MS (g)k1/k = 0.24± 0.04 298 Lindholm and Hershberger, 1997 PLP-TDLS (h)k3/k = 0.76± 0.1 298
Comments
(a) [NH2] monitored by time resolved LIF at 598 nm.
(b) Pulsed infrared multiphoton dissociation NH3, CH3NH2, or N2H4 used for NH2 production. State selected NH2 concen-tration monitored by time resolved LIF at 533 nm. The rate constant for NH2(v”=1) was also measured and found to beless than that for ground state NH2.
(c) [NH2] was monitored by intracavity absorption.k was found to be independent of pressure over the range 13–870 mbar(10–650 Torr).
(d) NH2 produced by pulsed laser photolysis at 193 nm of NH3. NH3, H2O, N2O, NO2, and O2 were detected by quadrapolemass spectrometry. Values ofk were obtained from the concentration profiles of the [NO2] decay and from the formationof H2O and N2O. Substantial modelling was used to correct for effects of secondary chemistry.
(e) Pulsed laser photolysis at 193 nm of NH3-NO2-SF6 mixtures. [N2O], [NO], and [H2O] were monitored by time resolvedinfrared diode laser absorption spectroscopy. Large yields of NO are produced by unidentified secondary chemistryprecluding determination ofk3/k.
(f) Pulse radiolysis, of Ar-SF6-NH3-NO2 mixtures at a total pressure of 40 mbar. [NH2], [N2O], and [NO] were monitoredby time-resolved infrared diode laser spectroscopy.
(g) Technique as in (d). Branching ratios based on the N2O yields. The value ofk1/k derived depends on the expression fork
used in the detailed modelling of the system. In one of the studies (Park and Lin, 1996) the expression fork of Glarborget al. (1995) was used and in the other study (Park and Lin, 1997) values ofk measured in the same study were used. Thesame values ofk1/k was obtained in the two studies.
(h) Technique basically as in (e) but NH2 generated by photolysis of ICN at 248 nm in the presence of NH3, leading to thefast reaction CN + NH3 → HCN + NH2. Use of this source eliminates excessive NO production by secondary chemistryand allows derivation ofk3/k from the measured NO yield. [NH2], [N2O], and [NO] were monitored.
www.atmos-chem-phys.org/acp/4/1461/ Atmos. Chem. Phys., 4, 1461–1738, 2004
1572 R. Atkinson et al.: Evaluated kinetic and photochemical data for Ox, HOx, NOx and SOx
Preferred Values
k= 2.0×10⁻¹¹ cm3 molecule−1 s−1 at 298 K.k = 2.0×10⁻¹¹ (T /298)−1.3 cm3 molecule−1 s−1 over the temperature range 250–500 K.k1/k = 0.25 over the temperature range 298–500 K.k3/k = 0.75 over the temperature range 298–500 K.
Reliability
1log k = ± 0.2 at 298 K.1n = ± 0.71k1/k = 1k3/k = ± 0.15 over the temperature range 298–500 K.
Comments on Preferred Values
At 298 K the results of Kurasawa and Lesclaux (1979), Whyte and Phillips (1983), Xiang et al. (1985), Bulatov et al. (1989)and Park and Lin (1997) are in reasonable agreement and our preferred value fork(298 K) is taken as an average of the valuesfrom these studies. Other studies are those of Hack et al. (1979) and Pagsberg et al. (1991). Hack et al. (1979), using adischarge flow technique over the range 250–500 K, obtained a significantly lower value at 298 K than those from the otherstudies, and this discrepancy increases at higher temperatures, approaching a factor of 4 at 500 K. The pulse radiolysis studyof Pagsberg et al. (1991) also gives a low value at 298 K.
There are also significant differences in the values found for the temperature dependence ofk. The results of Kurasawa andLesclaux (1979) and of Park and Lin (1997) are in excellent agreement and are the basis for the temperature dependence ofk
in our preferred expression. Bulatov et al. (1989) observe a slightly greater temperature dependence but their results fall withinthe error limits assigned. Only the larger temperature dependence observed by Hack et al. (1979) (k ∝ T −3.0) appears to beincompatible with the other studies.
Theoretical treatments (Mebel et al., 1995) of the reaction mechanism suggest that channels (1) and (3) are the most probableand the experimental studies confirm this qualitatively but the quantitative agreement on the branching ratios is poor. The earlystudy by Hack et al. (1979) suggested that channel (1) should predominate to the extent of 95% of the total reaction andGlarborg et al. (1995), who studied the NH3/NO2 reaction in a flow reactor over the range 850–1350 K, from their modellingof the changes in reactant and product concentrations concluded also that channel (1) predominates at low temperatures, butchannel (3) is the more important at high temperatures. However the direct measurements favour channel (3) at all temperaturesup to 900 K (Park and Lin, 1996; 1997). The studies of Lindholm and Hershberger (1997) and of Park and Lin (1996; 1997)appear to be the most direct and are in reasonable agreement. Provisionally, the recommended branching ratios are based onthese studies (Park and Lin, 1996; 1997, Lindholm and Hershberger, 1997) but with substantial error limits.
No evidence has been found for the occurrence of channel (2) or for the other exothermic channels leading to N2 + 2HOand/or 2HNO (Lindholm and Hershberger, 1997).
References
Bulatov, V. P., Ioffe, A. A., Lozovsky, V. A. and Sarkisov, O. M.: Chem. Phys. Lett., 159, 171, 1989.Glarborg, P., Dam-Johansen, K. and Miller, J. A.: Int. J. Chem. Kinet., 27, 1207, 1995.Hack, W., Schacke, H., Schroter, M. and Wagner, H. Gg.: 17th Symp. (Int.) Combust., 505, 1979.Kurasawa, H. and Lesclaux, R.: Chem. Phys. Lett., 66, 602, 1979.Lindholm, N. and Hershberger, J. F.: J. Phys. Chem. A, 101, 4991, 1997.Mebel, A. M., Hsu, C. C-., Lin, M. C. and Morokuma, K.: J. Chem. Phys., 103, 5640, 1995.Meunier, H., Pagsberg P. and Sillesen, A.: Chem. Phys. Lett., 261, 277, 1996.Pagsberg, P., Sztuba, B., Ratajczak, E. and Sillesen, A.: Acta Chem. Scand., 45, 329, 1991.Park, J. and Lin, M. C.: J. Phys. Chem. A, 101, 2643, 1997.Park, J. and Lin, M. C.: Int. J. Chem. Kinet., 28, 879, 1996.Quandt, R. W. and Hershberger, J. F.: J. Phys. Chem., 100, 9407, 1996.Whyte, A. R. and Phillips, L. F.: Chem. Phys. Lett., 102, 451, 1983.Xiang, T.-X., Torres, L.M. and Guillory, W.A.: J. Chem. Phys., 83, 1623, 1985.
Atmos. Chem. Phys., 4, 1461–1738, 2004 www.atmos-chem-phys.org/acp/4/1461/

R. Atkinson et al.: Evaluated kinetic and photochemical data for Ox, HOx, NOx and SOx 1573
I.A3.53
2NO + O2 → 2NO2
1H ◦ = −114.1 kJ mol−1
Rate coefficient data
k/cm6 molecule−2 s−1 Temp./K Reference Technique/Comments
Absolute Rate Coefficients(2.0± 0.1)×10−38 298 Stedman and Niki, 1973 (a)1.8×10−47 exp(1600/T ) 226–758 Olbregts, 1985 (b)2.1×10−38 298
Comments
(a) Static system. Photolysis of 1–100 ppm mixing ratios of NO2 in air using chemiluminescence detectors to monitor NO,NO2, and O3.
(b) Static 1 L reactor. Total pressure was measured with a differential micromanometer, and [NO2] measured in absorptionat 436 nm. Pressures of NO and O2 ranged up to 35 mbar (26 Torr.). Non-Arrhenius behaviour was observed withk
first decreasing with increasing temperature, reaching a minimum value at 600 K, and then increasing with increasingtemperature.
Preferred Values
k= 2.0×10−38 cm6 molecule−2 s−1 at 298 K.k = 3.3×10−39 exp(530/T ) cm6 molecule−2 s−1 over the temperature range 270–600 K.
Reliability
1log k = ± 0.1 at 298 K.1(E/R) = ± 400 K.
Comments on Preferred Values
The preferred values are those recommended in the evaluation of Baulch et al. (1973), which are based on the evaluation ofa substantial quantity of consistent data reported up to 1972. The results of studies performed since that evaluation, which aregiven in the Table, are in excellent agreement with the preferred values.
Olbregts (1985) observed non-Arrhenius behaviour over the entire temperature range studied and expressedk by a modifiedArrhenius expression and, also, as the sum of two Arrhenius expressions. However, from 250 K to about 600 K the total ratecoefficients of Olbregts (1985) are in good agreement with the values calculated from the expression recommended here, whichis adequate for atmospheric modelling purposes. Olbregts (1985) interpreted his results in terms of a multi-step mechanisminvolving NO3 or the dimer (NO)2
References
Baulch, D. L., Drysdale, D. D. and Horne, D. G.:Evaluated Kinetic Data for High Temperature Reactions, Volume 2,Homogeneous Gas Phase Reactions of the H2 − N2 − O2 System, Butterworths, London, 1973.Olbregts, J.: Int. J. Chem. Kinet., 17, 835, 1985.Stedman, D. H. and Niki, H.: J. Phys. Chem., 77, 2604, 1973.
www.atmos-chem-phys.org/acp/4/1461/ Atmos. Chem. Phys., 4, 1461–1738, 2004
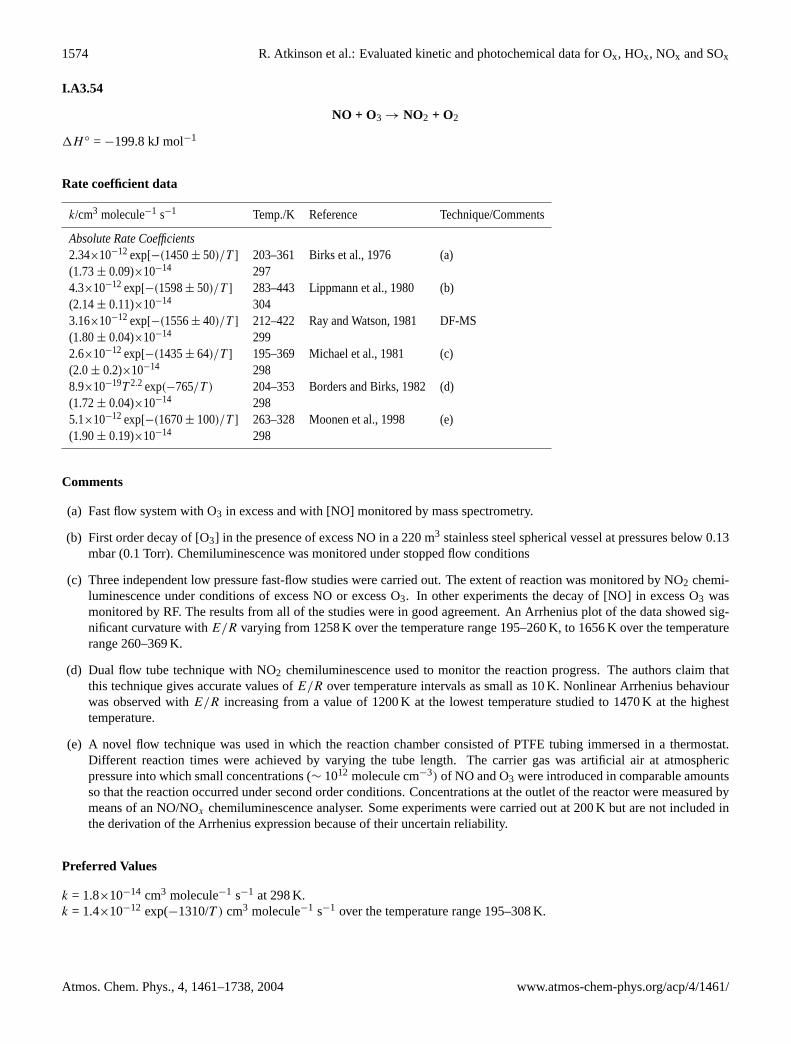
1574 R. Atkinson et al.: Evaluated kinetic and photochemical data for Ox, HOx, NOx and SOx
I.A3.54
NO + O3 → NO2 + O2
1H ◦ = −199.8 kJ mol−1
Rate coefficient data
k/cm3 molecule−1 s−1 Temp./K Reference Technique/Comments
Absolute Rate Coefficients2.34×10−12 exp[−(1450± 50)/T ] 203–361 Birks et al., 1976 (a)(1.73± 0.09)×10−14 2974.3×10−12 exp[−(1598± 50)/T ] 283–443 Lippmann et al., 1980 (b)(2.14± 0.11)×10−14 3043.16×10−12 exp[−(1556± 40)/T ] 212–422 Ray and Watson, 1981 DF-MS(1.80± 0.04)×10−14 2992.6×10−12 exp[−(1435± 64)/T ] 195–369 Michael et al., 1981 (c)(2.0± 0.2)×10−14 2988.9×10−19T 2.2 exp(−765/T ) 204–353 Borders and Birks, 1982 (d)(1.72± 0.04)×10−14 2985.1×10−12 exp[−(1670± 100)/T ] 263–328 Moonen et al., 1998 (e)(1.90± 0.19)×10−14 298
Comments
(a) Fast flow system with O3 in excess and with [NO] monitored by mass spectrometry.
(b) First order decay of [O3] in the presence of excess NO in a 220 m3 stainless steel spherical vessel at pressures below 0.13mbar (0.1 Torr). Chemiluminescence was monitored under stopped flow conditions
(c) Three independent low pressure fast-flow studies were carried out. The extent of reaction was monitored by NO2 chemi-luminescence under conditions of excess NO or excess O3. In other experiments the decay of [NO] in excess O3 wasmonitored by RF. The results from all of the studies were in good agreement. An Arrhenius plot of the data showed sig-nificant curvature withE/R varying from 1258 K over the temperature range 195–260 K, to 1656 K over the temperaturerange 260–369 K.
(d) Dual flow tube technique with NO2 chemiluminescence used to monitor the reaction progress. The authors claim thatthis technique gives accurate values ofE/R over temperature intervals as small as 10 K. Nonlinear Arrhenius behaviourwas observed withE/R increasing from a value of 1200 K at the lowest temperature studied to 1470 K at the highesttemperature.
(e) A novel flow technique was used in which the reaction chamber consisted of PTFE tubing immersed in a thermostat.Different reaction times were achieved by varying the tube length. The carrier gas was artificial air at atmosphericpressure into which small concentrations (∼ 1012 molecule cm−3) of NO and O3 were introduced in comparable amountsso that the reaction occurred under second order conditions. Concentrations at the outlet of the reactor were measured bymeans of an NO/NOx chemiluminescence analyser. Some experiments were carried out at 200 K but are not included inthe derivation of the Arrhenius expression because of their uncertain reliability.
Preferred Values
k = 1.8×10⁻¹⁴ cm3 molecule−1 s−1 at 298 K.k = 1.4×10⁻¹² exp(−1310/T ) cm3 molecule−1 s−1 over the temperature range 195–308 K.
Atmos. Chem. Phys., 4, 1461–1738, 2004 www.atmos-chem-phys.org/acp/4/1461/
R. Atkinson et al.: Evaluated kinetic and photochemical data for Ox, HOx, NOx and SOx 1575
Reliability
1log k = ± 0.08 at 298 K.1(E/R) = ± 200 K.
Comments on Preferred Values
The preferred Arrhenius expression is based on a least squares analysis of the data over the range 195–308 K reported byBirks et al. (1976), Lippmann et al. (1980), Ray and Watson (1981), Michael et al. (1981), Borders and Birks (1982) andMoonen et al. (1998). The data at closely spaced intervals reported by Lippmann et al. (1980) and by Borders and Birks(1982) were grouped to give approximately equal weight to the six studies. The temperature range was limited because ofthe non-linear Arrhenius behaviour observed by Clyne et al. (1964), Clough and Thrush (1967), Birks et al. (1976), Michaelet al. (1981) and by Borders and Birks (1982). Earlier room temperature results of Stedman and Niki (1973) and Bemand etal. (1974) are in good agreement with the preferred value at 298 K.
Clyne et al. (1964), Birks et al. (1976), Schurath et al. (1981) and Michael et al. (1981) have reported individual Arrheniusexpressions for each of two primary channels, one to produce NO2 in its electronic ground state and the other leading toelectronically excited NO2.
References
Bemand, P. B., Clyne, M. A. A. and Watson, R. T.: J. Chem. Soc. Faraday Trans. 2, 70, 564, 1974.Birks, J. W., Shoemaker, P., Leck, T. J. and Hinton, D. M.: J. Chem. Phys., 65, 5181, 1976.Borders, R. A. and Birks, J. W.: J. Phys. Chem., 86, 3295, 1982.Clough, P. N. and Thrush, B. A.: Trans. Faraday Soc., 63, 915, 1967.Clyne, M. A. A., Thrush, B. A. and Wayne, R. P.: Trans. Faraday Soc., 60, 359, 1964.Lippmann, H. H., Jesser, B. and Schurath, U.: Int. J. Chem. Kinet., 12, 547, 1980.Michael, J. V., Allen Jr., J. E. and Brobst, W. D.: J. Phys. Chem., 85, 4109, 1981.Moonen, P. C., Cape, J. N., Storeton-West, R. L. and McColm, R.: J. Atm. Chem., 29, 299, 1998.Ray, G. W. and Watson, R. T.: J. Phys. Chem., 85, 1673, 1981.Schurath, U., Lippmann, H. H. and Jesser, B.: Ber. Bunsenges. Phys. Chem., 85, 807, 1981.Stedman, D. H. and Niki, H.: J. Phys. Chem., 77, 2604, 1973.
www.atmos-chem-phys.org/acp/4/1461/ Atmos. Chem. Phys., 4, 1461–1738, 2004

1576 R. Atkinson et al.: Evaluated kinetic and photochemical data for Ox, HOx, NOx and SOx
I.A3.55
NO + NO2 + M → N2O3 + M
1H ◦ = −40.6 kJ·mol−1
Low-pressure rate coefficients
Rate coefficient data
k0/cm3 molecule−1 s−1 Temp./K Reference Technique/Comments
Absolute Rate Coefficients(6.7± 0.6)×10−33 [Ar] 207 ± 2 Smith and Yarwood, 1987 FP (a)(9.1± 0.7)×10−33 [N2] 208± 2(2.8± 2.8)×10−15T −(7.7±0.8) [Ar] 227–260 Markwalder et al., 1993 (b)4.1×10⁻³³ [Ar] 208 ± 2
Comments
(a) Partial photodissociation of N2O3 in equilibrium NO2-N2O4-NO-N2O3-M mixtures with M = He, Ar, Ne, N2 and CF4(see also Smith and Yarwood, 1986). The relaxation to equilibrium was monitored by observing the absorption of N2O3at theν1 band at 1829.59 cm−1. The total pressure was 253–667 mbar (190–500 Torr). Falloff curves were extrapolatedusingFc = 0.60 for Ar and N2.
(b) CO laser-induced temperature jump measurements with NO2-N2O4-N2O3-NO-SiF4-Ar equilibrium mixtures. The sub-sequent relaxation toward equilibrium was monitored by UV absorption of N2O3 at 253 nm.
Preferred Values
k0 = 3.1×10⁻³⁴ (T /300)−7.7 [N2] cm3 molecule−1 s−1 over the temperature range 200–300 K.
Reliability
1log k0 = ±0.3 at 298 K.1n = ±1.
Comments on Preferred Values
The preferred values are based on the data from Markwalder et al. (1993), after conversion by the ratiok0(N2)/k0(Ar) = 1.36of Smith and Yarwood (1987).Fc = 0.6 is chosen.
High-pressure rate coefficients
Rate coefficient data
k∞/cm3 molecule−1 s−1 Temp./K Reference Technique/Comments
Absolute Rate Coefficients(3.4± 1)×10−12 208 Smith and Yarwood, 1987 FP (a)(2.7± 0.9)×10−15T (1.4±0.2) 227–260 Markwalder et al., 1993 (b)4.7×10⁻¹² 208
Atmos. Chem. Phys., 4, 1461–1738, 2004 www.atmos-chem-phys.org/acp/4/1461/
R. Atkinson et al.: Evaluated kinetic and photochemical data for Ox, HOx, NOx and SOx 1577
Comments
(a) See comment (a) fork0.
(b) See comment (b) fork0.
Preferred Values
k∞ = 7.9×10⁻¹² (T /300)1.4 cm3 molecule−1 s−1 over the temperature range 200–300 K.
Reliability
1log k∞ = ±0.3 at 298 K.1n = ±0.5.
Comments on Preferred Values
The preferred values are those from Markwalder et al. (1993), where the largest ranges of the falloff curve were investigated.At 208 K, the values ofk∞ from Smith and Yarwood (1987) and Markwalder et al. (1993) are in reasonable agreement.
References
Markwalder, B., Gozel, P. and van den Bergh, H.: J. Phys. Chem., 97, 5260, 1993.Smith, I. W. M. and Yarwood, G.: Chem. Phys. Lett., 130, 24, 1986.Smith, I. W. M. and Yarwood, G.: Faraday Disc. Chem. Soc., 84, 205, 1987.
www.atmos-chem-phys.org/acp/4/1461/ Atmos. Chem. Phys., 4, 1461–1738, 2004

1578 R. Atkinson et al.: Evaluated kinetic and photochemical data for Ox, HOx, NOx and SOx
I.A3.56
N2O3 + M → NO + NO2 + M
1H ◦ = 40.6 kJ·mol−1
Low-pressure rate coefficients
Rate coefficient data
k0/s−1 Temp./K Reference Technique/Comments
Absolute Rate Coefficients5.0×1014T −(8.7±0.9) exp(−4880/T ) [Ar] 225–260 Markwalder et al., 1993 (a)
Comments
(a) CO2 laser-induced temperature jump measurements with NO2-N2O4-N2O3-NO-SiF4-Ar equilibrium mixtures. The sub-sequent relaxation toward equilibrium was monitored by UV absorption of N2O3 at 253 nm. Dissociation rate coefficientswere derived from the measured recombination rate coefficients and the equilibrium constant from Chao et al. (1974),of Kc = 1.8×1029T −1 exp(−4880/T ) molecule cm−3. Falloff curves with M=Ar were obtained over the pressure range0.5–200 bar and extrapolated tok0 andk∞ with Fc = 0.6. k0(N2)/k0(Ar) = 1.36 was taken from Smith and Yarwood(1987) (see reaction NO + NO2 + M → N2O3 + M).
Preferred Values
k0 = 1.6×10⁻¹⁴ [N2] s−1 at 298 K.k0 = 1.9×10⁻⁷ (T /300)−8.7 exp(−4880/T ) [N2] s−1 over the temperature range 225–300 K.
Reliability
1log k0 = ±0.4 at 298 K.1n = ±1.1(E/R) = ±200 K.
Comments on Preferred Values
The preferred values are based on the data of Markwalder et al. (1993), which are consistent with a theoretical analysis ofthe results (leading to collision efficienciesβc(Ar) = 0.3). The preferred values correspond to an analysis of the falloff curvewith Fc = 0.6 and the value ofk∞ given below.
High-pressure rate coefficients
Rate coefficient data
k∞/s−1 Temp./K Reference Technique/Comments
Absolute Rate Coefficients4.8×1014T (0.4±0.1) exp(−4880/T ) 225–260 Markwalder et al., 1993 (a)
Atmos. Chem. Phys., 4, 1461–1738, 2004 www.atmos-chem-phys.org/acp/4/1461/

R. Atkinson et al.: Evaluated kinetic and photochemical data for Ox, HOx, NOx and SOx 1579
Comments
(a) See comment (a) fork0.
Preferred Values
k∞ = 3.6×10⁸ s−1 at 298 K.k∞ = 4.7×10¹⁵ (T /300)0.4 exp(−4880/T ) s−1 over the temperature range 225–300 K.
Reliability
1log k∞ = ±0.3 at 298 K.1n = ±1.1(E/R) = ±100 K.
Comments on Preferred Values
The preferred values are based on the values of Markwalder et al. (1993) converted to dissociation data with the equilibriumconstant from Chao et al. (1974).
References
Chao, J., Wilhoit, R. C. and Zwolinski, B. J.: Thermochim. Acta, 10, 359, 1974.Markwalder, B., Gozel, P. and van den Bergh, H.: J. Phys. Chem., 97, 5260, 1993.Smith, I. W. M. and Yarwood, G.: Faraday Disc. Chem. Soc., 84, 205, 1987.
www.atmos-chem-phys.org/acp/4/1461/ Atmos. Chem. Phys., 4, 1461–1738, 2004
1580 R. Atkinson et al.: Evaluated kinetic and photochemical data for Ox, HOx, NOx and SOx
I.A3.57
NO + NO3 → 2NO2
1H ◦ = −97.6 kJ mol−1
Rate coefficient data
k/cm3 molecule−1 s−1 Temp./K Reference Technique/Comments
Absolute Rate Coefficients1.55×10−11 exp[(195± 39)/T ] 209–299 Hammer et al., 1986 DF-LIF (a)(2.95± 0.16)×10−11 299–4141.59×10−11 exp(122/T ) 224–328 Sander and Kircher, 1986 FP-A (b)(2.41± 0.48)×10−11 2981.68×10−11 exp[(103± 50)/T ] 223–400 Tyndall et al., 1991 DF-LIF (c)(2.34± 0.24)×10−11 298(2.6± 0.2)×10−11 296 Brown et al., 2000 (d)
Comments
(a) Arrhenius behaviour was observed fork over the temperature range 209–299 K, butk was independent of temperatureover the range 299–414 K.
(b) [NO3] was monitored by optical absorption. Total pressure was varied over the range 67–930 mbar (50–700 Torr) of Heand N2.
(c) NO3 was produced either by the F + HNO3 reaction or the NO2 + O3 reaction. In these experiments [NO3] was monitoredby LIF in an excess of NO. In other experiments the decay of [NO] in excess NO3 was monitored by chemiluminescence.The value at 298 K is the mean of the values obtained in these different systems.
(d) Cavity ring-down spectroscopy was used to follow the kinetics of the NO + NO3 reaction by monitoring the loss of lightintensity from an optical cavity in which the NO + NO3 reaction was occurring. NO3 radicals were generated by pulsedlaser photolysis of N2O5 at 248 nm in the presence of an excess of NO contained in the laser cavity. Ring-down profileswere obtained using laser pulses at wavelengths of 622 nm or 623 nm, which are absorbed by the NO3 radicals.
Preferred Values
k= 2.6×10⁻¹¹ cm3 molecule−1 s−1 at 298 K.k = 1.8×10⁻¹¹ exp(110/T ) cm3 molecule−1 s−1 over the temperature range 220–420 K.
Reliability
1log k = ± 0.1 at 298 K.1(E/R) = ± 100 K.
Comments on Preferred Values
Since our previous evaluation, IUPAC (1997), Brown et al. (2000) have measuredk at 298 K using a new technique basedon cavity ring down spectroscopy and obtain a value ofk in excellent agreement with our preferred value. The preferred valueof k at 298 K is the mean of the values reported by Hammer et al. (1986), Sander and Kircher (1986), Tyndall et al. (1991) andBrown et al. (2000), which are in excellent agreement, and the preferred value ofE/R is the average of the values obtained bySander and Kircher (1986) and Tyndall et al. (1991). The pre-exponential factor in the Arrhenius expression is adjusted to fitthe values ofk at 298 K.
Atmos. Chem. Phys., 4, 1461–1738, 2004 www.atmos-chem-phys.org/acp/4/1461/

R. Atkinson et al.: Evaluated kinetic and photochemical data for Ox, HOx, NOx and SOx 1581
References
Brown, S. S., Ravishankara, A. R. and Stark, H.: J. Phys. Chem. A, 104, 7044, 2000.Hammer, P. D., Dlugokencky, E. J. and Howard, C. J.: J. Phys. Chem., 90, 2491, 1986.IUPAC, Supplement VI: J. Phys. Chem. Ref. Data, 26, 1329, 1997.Sander, S. P. and Kircher, C. C.: Chem. Phys. Lett., 126, 149, 1986.Tyndall, G. S., Orlando, J. J., Cantrell, C. A., Shetter, R. E. and Calvert, J. G.: J. Phys. Chem., 95, 4381, 1991.
www.atmos-chem-phys.org/acp/4/1461/ Atmos. Chem. Phys., 4, 1461–1738, 2004

1582 R. Atkinson et al.: Evaluated kinetic and photochemical data for Ox, HOx, NOx and SOx
I.A3.58
NO2 + O3 → NO3 + O2
1H ◦ = −102.2 kJ mol−1
Rate coefficient data
k/cm3 molecule−1 s−1 Temp./K Reference Technique/Comments
Absolute Rate Coefficients(3.2± 0.5)×10−17 298 Ghormley et al., 1973, 1974 FP (a)9.76×10⁻¹⁴ exp[−(2427± 140)/T ] 260–343 Davis et al., 1974 (b)(3.42± 0.27)×10−17 3031.34×10−13 exp[−(2466± 30)/T ] 231–298 Graham and Johnston, 1974 (c)(3.49± 0.23)×10−17 2981.57×10−13 exp[−(2509± 76)/T ] 259–362 Huie and Herron, 1974 (d)(3.78± 0.07)×10−17 297(3.45± 0.12)×10−17 296 Cox and Coker, 1983 (e)
Comments
(a) Flash photolysis system. [O3] and [NO2] were monitored by optical absorption.
(b) Stopped flow system with detection of O3 by time-of-flight mass spectrometry. The exponential term given in the abstractis incorrect; the correct value is tabulated here (D. D. Davis, private communication).
(c) Long path static cell. [O3] and [NO2] monitored in separate experiments by UV absorption spectrometry. Stoichiometricratio (1NO2/1O3) was measured to be 1.89± 0.08.
(d) Stopped flow system. [O3] monitored by molecular-beam sampling mass spectrometry.
(e) Static system. Experiments performed with both NO2 and O3 in excess. Time resolved absorption spectroscopy wasused to monitor [N2O5] with a diode laser infrared source, and [NO2] and [O3] were monitored at 350 nm and 255 nm,respectively, using conventional UV techniques. Total pressure 13 mbar (10 Torr) N2. N2O5 was shown to be the onlynitrogen containing product. Overall stoichiometry (1NO2/1O3) was determined to have the value 1.85± 0.09. Minorrole for unsymmetrical NO3 species was suggested to account for a stoichiometric factor less than 2.
Preferred Values
k= 3.5×10⁻¹⁷ cm3 molecule−1 s−1 at 298 K.k = 1.4×10⁻¹³ exp(−2470/T ) cm3 molecule−1 s−1 over the temperature range 230–360 K.
Reliability
1log k = ± 0.06 at 298 K.1(E/R) = ± 150 K.
Comments on Preferred Values
The preferred value at 298 K is taken as the mean of the five values tabulated (Ghormley et al., 1973; 1974; Davis et al., 1974;Graham and Johnston, 1974; Huie and Herron, 1974; and Cox and Coker, 1983), corrected where necessary for the differencebetween the temperature of the measurement and 298 K. The temperature coefficient is taken as the mean of the values obtainedby Davis et al. (1974), Graham and Johnston (1974) and Huie and Herron (1974), which are in excellent agreement. Verheesand Adema (1985) obtained a significantly higher temperature coefficient fork and a higher pre-exponential factor, but wallcorrections were shown to be important in their work. There are also a number of other measurements ofk at, or close to,
Atmos. Chem. Phys., 4, 1461–1738, 2004 www.atmos-chem-phys.org/acp/4/1461/

R. Atkinson et al.: Evaluated kinetic and photochemical data for Ox, HOx, NOx and SOx 1583
298 K which have not been used in deriving the preferred values because of their substantial deviation from the majority of theother studies.
References
Cox, R. A. and Coker, G. B.: J. Atmos. Chem., 1, 53, 1983.Davis, D. D., Prusazcyk, J., Dwyer, M. and Kim, P.: J. Phys. Chem., 78, 1775, 1974.Ghormley, J. A., Ellsworth, R. L. and Hochenadel, C. J.: J. Phys. Chem., 77, 1341, 1973; Erratum, 78, 2698, 1974.Graham, R. A. and Johnston, H. S.: J. Chem. Phys., 60, 4628, 1974.Huie, R. E. and Herron, J. T.: Chem. Phys. Lett., 27, 411, 1974.Verhees, P. W. C. and Adema, E. H.: J. Atmos. Chem., 2, 387, 1985.
www.atmos-chem-phys.org/acp/4/1461/ Atmos. Chem. Phys., 4, 1461–1738, 2004

1584 R. Atkinson et al.: Evaluated kinetic and photochemical data for Ox, HOx, NOx and SOx
I.A3.59
NO2 + NO2 + M → N2O4 + M
1H ◦ = −57.3 kJ·mol−1
Low-pressure rate coefficients
Rate coefficient data
k0/cm3 molecule−1 s−1 Temp./K Reference Technique/Comments
Absolute Rate Coefficients(1.4± 0.2)×10−33 [N2] 298 Borrell et al., 1988 PLP (a)(1.0± 0.1)×10−33 [N2] 224 Brunning et al., 1988 FP (b)(2.1± 0.2)×10−12T (−9.0±0.9) [He] 255–273 Markwalder et al., 1992 (c)
Comments
(a) Relaxation of NO2-N2O4-N2 equilibrium mixtures after low intensity pulsed laser photolysis of N2O4 at 248 nm. Therelaxation to equilibrium was obtained by measuring the change in N2O4 absorption at 220 nm. Falloff curves (1–207bar) were extrapolated withFc = 0.40 and N = 1.26.
(b) Perturbation of equilibrium mixture of N2O4 and NO2 by photolysis of a fraction of the N2O4. The relaxation rate wasmonitored by IR absorption of N2O4 at 1565.5 cm−1.
(c) Temperature jumps induced by IR absorption of SiF4 in equilibrium mixtures of NO2-N2O4-He-SiF4. The relaxation toequilibrium was followed by measuring NO2 and N2O4 concentrations by absorption spectroscopy at 420 and 250 nm,respectively. Falloff curves (0.3–200 bar) were extrapolated withFc = 0.52 and N = 1.10 (see also earlier data from Gozelet al., 1984).
Preferred Values
k0 = 1.4×10⁻³³ (T /300)−3.8 [N2] cm3 molecule−1 s−1 over the temperature range 300–500 K.
Reliability
1log k0 = ±0.3 at 298 K.1n = ±1.
Comments on Preferred Values
The preferred values are from the most extensive study of Borrell et al. (1988), where a complete falloff curve was measured.Earlier less extensive measurements are in reasonable agreement with this curve, which usesFc = 0.40. The temperature de-pendence given is from the theoretical modeling of Borrell et al. (1988), rather than from the limited experimental informationof Markwalder et al. (1992).
High-pressure rate coefficients
Rate coefficient data
k∞/ cm3 molecule−1 s−1 Temp./K Reference Technique/Comments
Absolute Rate Coefficients(8.3± 1.0)×10−13 298 Borrell et al., 1988 PLP (a)(3.7± 0.3)×10−18T (2.3±0.2) 255–273 Markwalder et al., 1992 (b)
Atmos. Chem. Phys., 4, 1461–1738, 2004 www.atmos-chem-phys.org/acp/4/1461/

R. Atkinson et al.: Evaluated kinetic and photochemical data for Ox, HOx, NOx and SOx 1585
Comments
(a) See comment (a) fork0.
(b) See comment (b) fork0.
Preferred Values
k∞ = 1.0×10⁻¹² cm3 molecule−1 s−1, independent of temperature over the range 250–300 K.
Reliability
1log k∞ = ±0.3 over the temperature range 250–300 K.
Comments on Preferred Values
The preferred rate coefficient is the mean of the values of Borrell et al. (1988) and Markwalder et al. (1992). The temperaturedependence ofk0 andk∞ derived from the measurements of Markwarder et al. (1992) appears to be inadequate because itresults from the fitting of incomplete falloff curves.Fc = 0.4 is chosen such as derived in Borrell et al. (1988).
References
Borrell, P., Cobos, C. J. and Luther, K.: J. Phys. Chem., 92, 4377, 1988.Brunning, J., Frost, M. J. and Smith, I. W. M.: Int. J. Chem. Kinet., 20, 957, 1988.Gozel, P., Calpini, B. and van den Bergh, H.: Isr. J. Chem., 24, 210, 1984.Markwalder, B., Gozel, P. and van den Bergh, H.: J. Chem. Phys., 97, 5472, 1992.
www.atmos-chem-phys.org/acp/4/1461/ Atmos. Chem. Phys., 4, 1461–1738, 2004

1586 R. Atkinson et al.: Evaluated kinetic and photochemical data for Ox, HOx, NOx and SOx
I.A3.60
N2O4 + M → NO2 + NO2 + M
1H ◦ = 57.3 kJ·mol−1
Low-pressure rate coefficients
Rate coefficient data
k0/s−1 Temp./K Reference Technique/Comments
Absolute Rate Coefficients1.29×10−5(T /300)−3.8 exp(−6460/T ) [N2] 300–500 Borrell et al., 1988 PLP (a)1.6×10¹⁹T −(10.0±1.0) exp[−(6790± 700)/T ) [He] 255–273 Markwalder et al., 1992 (b)
Comments
(a) Relaxation of NO2-N2O4-N2 equilibrium mixtures after pulsed laser photolysis of N2O4 at 248 nm. The relaxation toequilibrium was followed by observing N2O4 in absorption at 220 nm. Falloff curves (1–207 bar) were extrapolated withFc = 0.40 and N = 1.26. The equilibrium constant from Chao et al. (1974) was employed.
(b) Temperature jumps induced by IR absorption of SiF4 in equilibrium mixtures of NO2-N2O4-He-SiF4. The relaxation toequilibrium was followed by absorption spectroscopy of NO2 and N2O4 at 420 and 250 nm, respectively. Falloff curves(0.3–200 bar) were extrapolated withFc = 0.52 and N = 1.10. Equilibrium constants from Vosper (1970) were employed.
Preferred Values
k0 = 6.1×10⁻¹⁵ [N2] s−1 at 298 K.k0 = 1.3×10⁻⁵ (T /300)−3.8 exp(−6400/T ) [N2] s−1 over the temperature range 300–500 K.
Reliability
1log k0 = ±0.3 at 298 K.1(E/R) = ±500 K.
Comments on Preferred Values
The preferred values are from the measurements of Borrell et al. (1988) in combination with the equilibrium constants fromChao et al. (1974). These data are based on the most complete falloff curve at 300 K, usingFc = 0.40.
High-pressure rate coefficients
Rate coefficient data
k∞/s−1 Temp./K Reference Technique/Comments
Absolute Rate Coefficients7.7×1015(T /300)−1.1 exp(−6460/T ) 300–600 Borrell et al., 1988 PLP (a)2.8×10¹³T (1.3±0.2) exp[−(6790± 700)/T ] 255–273 Markwalder et al., 1992 (b)
Atmos. Chem. Phys., 4, 1461–1738, 2004 www.atmos-chem-phys.org/acp/4/1461/

R. Atkinson et al.: Evaluated kinetic and photochemical data for Ox, HOx, NOx and SOx 1587
Comments
(a) See comment (a) fork0.
(b) See comment (b) fork0.
Preferred Values
k∞ = 4.4×10⁶ s−1 at 298 K.k∞ = 1.15×10¹⁶ exp(−6460/T ) s−1 over the temperature range 250–300 K.
Reliability
1log k∞ = ±0.4 at 298 K.1(E/R) = ±500 K.
Comments on Preferred Values
The preferred rate coefficient at room temperature is the average of the values of Borrell et al. (1988) and Markwalder etal. (1992). The recommended temperature coefficient corresponds to a temperature-independent value ofk∞ for the reverserecombination. Measurements from Fiedler and Hess (1990) and Van Roozendael and Herman (1990) in the intermediatefalloff range at 298 K are consistent with the preferred values ofk0, k∞ andFc = 0.4 at 300 K.
References
Borrell, P., Cobos, C. J. and Luther, K.: J. Phys. Chem., 92, 4377, 1988.Chao, J., Wilhoit, R. C. and Zwolinski, B. J.: Thermochem. Acta, 10, 359, 1974.Fiedler, M. and Hess, P.: J. Chem. Phys., 93, 8693, 1990.Markwalder, B., Gozel, P. and van den Bergh, H.: J. Chem. Phys., 97, 5472, 1992.Van Roozendael, M. and Herman, M.: Chem. Phys. Lett., 166, 233, 1990.Vosper, A. J.: J. Chem. Soc., A1, 625, 1970.
www.atmos-chem-phys.org/acp/4/1461/ Atmos. Chem. Phys., 4, 1461–1738, 2004

1588 R. Atkinson et al.: Evaluated kinetic and photochemical data for Ox, HOx, NOx and SOx
I.A3.61
NO2 + NO3 + M → N2O5 + M
1H ◦ = −95.6 kJ·mol−1
Low-pressure rate coefficients
Rate coefficient data
k0/cm3 molecule−1 s−1 Temp./K Reference Technique/Comments
Absolute Rate Coefficients9.6×10−33 exp(1550/T ) [N2] 262–295 Connell and Johnston, 1979 (a)1.7×10⁻³⁰ [N2] 2981.35×10−32 exp(1270/T ) [N2] 285–384 Viggiano et al., 1981 (b)9.6×10⁻³¹ [N2] 298(4.5± 1.1)×10−30(T /300)−(3.4±1.3) [N2] 236–358 Kircher et al., 1984 FP-A (c)2.12×10⁻³⁰ [N2] 298 Smith et al., 1985 DF-A (d)2.8×10⁻³⁰(T /300)−3.5 [N2] 236–358 Orlando et al., 1991 DF-LIF (e)
Comments
(a) From study of N2O5 decomposition. Static reaction vessel with multi-reflection White-cell optical arrangement for thetime-resolved detection of N2O5 by IR absorption at 8.028µm. Converted to recombination rate coefficients with theequilibrium constantKc = 8.4×1026 exp(−11180/T ) molecule cm−3 from Graham and Johnston (1978).
(b) From study of N2O5 decomposition. Flow system reactors of various size. N2O5 was detected by ion-molecule reactionsin a flowing afterglow system. Measurements were carried out at [N2] = 2.5×10¹⁷ to 2.7×10¹⁹ molecule cm−3. Convertedto recombination rate coefficients with the equilibrium constantKc = 8.4×1026 exp(−11180/T ) molecule cm−3 fromGraham and Johnston (1978).
(c) Visible absorption of NO3 monitored under pseudo-first order conditions. Falloff curve measured over the pressure range27–930 mbar (20–700 Torr) and extrapolated using reduced falloff curve representation withFc = 0.34 at 298 K.
(d) Visible absorption of NO3 monitored. Pressure range 1.3–10.7 mbar (1–8 Torr) in He, and 0.7–8 mbar (0.5–6 Torr) in N2.Reduced falloff curves extrapolated withFc = 0.47 for N2 at 298 K.
(e) Detection of NO3. Experiments were conducted over the pressure range 0.7–10.7 mbar (0.5–8 Torr) and the data evaluatedusingFc = {2.5 exp(−1950/T ) + 0.9 exp(−T /430)} (Fc(298 K) = 0.45).
Preferred Values
k0 = 3.6×10⁻³⁰ (T /300)−4.1 [N2] cm3 molecule−1 s−1 over the temperature range 200–300 K.
Reliability
1log k0 = ±0.10 at 298 K.1n = ±0.5.
Comments on Preferred Values
The preferred values are based on the data of Orlando et al. (1991), and the falloff extrapolation from Hahn et al. (2000)using the theoretically derivedFc = 0.35 independent of the temperature between 200 and 400 K. The temperature dependenceis from the theoretical modelling of Hahn et al. (2000). Different choices ofFc lead to different values of the extrapolatedk0andk∞, although the various representations all agree well with the experimental data.
Atmos. Chem. Phys., 4, 1461–1738, 2004 www.atmos-chem-phys.org/acp/4/1461/
R. Atkinson et al.: Evaluated kinetic and photochemical data for Ox, HOx, NOx and SOx 1589
High-pressure rate coefficients
Rate coefficient data
k∞/cm3 molecule−1 s−1 Temp./K Reference Technique/Comments
Absolute Rate Coefficients2.1×10−10 exp(−1360/T ) 262–295 Connell and Johnston, 1979 (a)2.2×10⁻¹² 2981.5×10−10 exp(−1610/T ) 285–384 Viggiano et al., 1981 (b)6.8×10⁻¹³ 298(2.2± 0.5)×10−12 293 Croce de Cobos et al., 1984 (c)(1.65± 0.15)×10−12(T /300)−(0.4±0.5) 236–358 Kircher et al., 1984 FP-A (d)1.85×10⁻¹² 298 Smith et al., 1985 DF-A (e)1.7×10⁻¹²(T /300)−0.2 236–358 Orlando et al., 1991 DF-LIF (f)(1.9± 0.3)×10−12(T /300)0.2 300–400 Hahn et al., 2000 PLP (g)
Comments
(a) See comment (a) fork0.
(b) See comment (b) fork0. Data obtained from extrapolation of data in a relatively narrow pressure range near to the centerof the falloff curve.
(c) Laser flash photolysis of N2O in the presence of NO2. NO3 radicals were monitored by visible absorption under pseudo-first order conditions. The falloff curve was measured over the pressure range 1–200 bar in N2, and extrapolated withFc
= 0.34.
(d) See comment (c) fork0.
(e) See comment (d) fork0.
(f) See comment (e) fork0.
(g) See comment (c); measurements over the pressure range 30–900 bar evaluated withk0 from Orlando et al. (1991) andFc
= 0.35.
Preferred Values
k∞ = 1.9×10⁻¹² (T /300)0.2 cm3 molecule−1 s−1 over the temperature range 200–400 K.
Reliability
1log k∞ = ±0.2 at 298 K.1n = ±0.6.
Comments on Preferred Values
The preferred values are based on the high pressure measurements from Hahn et al. (2000), which within experimentaluncertainty agree well with the extrapolated values from Kircher et al. (1984), Smith et al. (1985), Orlando et al. (1991) andCroce de Cobos et al. (1984). The theoretically calculated value ofFc = 0.35 does not influence thek∞-value but influencesthe extrapolated value ofk0.
www.atmos-chem-phys.org/acp/4/1461/ Atmos. Chem. Phys., 4, 1461–1738, 2004

1590 R. Atkinson et al.: Evaluated kinetic and photochemical data for Ox, HOx, NOx and SOx
References
Connell, P. and Johnston, H. S.: Geophys. Res. Lett., 6, 553, 1979.Croce de Cobos, A. E., Hippler, H. and Troe, J.: J. Phys. Chem., 88, 5083, 1984.Graham, R. A. and Johnston, H. S.: J. Phys. Chem., 82, 254, 1978.Hahn, J., Luther, K. and Troe, J.: Phys. Chem. Chem. Phys., 2, 5098, 2000.Kircher, C. C., Margitan, J. J. and Sander, S. P.: J. Phys. Chem., 88, 4370, 1984.Orlando, J. J., Tyndall, G. S., Cantrell, C. A. and Calvert, J. G.: J. Chem. Soc. Faraday Trans., 87, 2345, 1991.Smith, C. A., Ravishankara, A. R. and Wine, P. H.: J. Phys. Chem., 89, 1423, 1985.Viggiano, A. A., Davidson, J. A., Fehsenfeld, F. C. and Ferguson, E. E.: J. Chem. Phys., 74, 6113, 1981.
Atmos. Chem. Phys., 4, 1461–1738, 2004 www.atmos-chem-phys.org/acp/4/1461/

R. Atkinson et al.: Evaluated kinetic and photochemical data for Ox, HOx, NOx and SOx 1591
I.A3.62
N2O5 + M → NO2 + NO3 + M
1H ◦ = 95.6 kJ·mol−1
Low-pressure rate coefficients
Rate coefficient data
k0/s−1 Temp./K Reference Technique/Comments
Absolute Rate Coefficients1.04×10−3(T /300)−3.5 exp(−11 000/T ) [N2] 253–384 Cantrell et al., 1993 (a)
Comments
(a) Thermal decomposition of N2O5 in the presence of NO in N2. FTIR analysis of N2O5 in a stainless steel cell equippedwith multiple path optics. Falloff curves over the gas density 4.3×10¹⁴ to 1.1×10²⁰ molecule cm−3 were analyzed usingFc = [2.5 exp(−1950/T ) + 0.9 exp(−T /430)] [Fc(298 K) = 0.45]. In the analysis, data from Connell and Johnston (1979)and Viggiano et al. (1981) were also taken into account.
Preferred Values
k0 = 1.2×10⁻¹⁹ [N2] s−1 at 298 K.k0 = 1.3×10⁻³ (T /300)−3.5 exp(−11000/T ) [N2] s−1 over the temperature range 200–400 K.
Reliability
1log k0 = ±0.2 at 298 K.1n = ±0.5.
Comments on Preferred Values
The preferred values are based on the study of Cantrell et al. (1993), derived from the kinetic data. However, instead ofFc =0.45, the modeled value ofFc = 0.35 independent of the temperature was used for extrapolation to the low pressure limit. Therecombination and dissociation rate coefficients are internally consistent. At room temperature, the equilibrium constantKc =2.3×10⁻¹¹ cm3 molecule−1 compares well with the values from Hjorth et al. (1992) and Pritchard (1994).
High-pressure rate coefficients
Rate coefficient data
k∞/s−1 Temp./K Reference Technique/Comments
Absolute Rate Coefficients6.22×1014(T /300)−0.2 exp(−11 000/T ) 253–384 Cantrell et al., 1993 (a)
Comments
(a) See comment (a) fork0.
www.atmos-chem-phys.org/acp/4/1461/ Atmos. Chem. Phys., 4, 1461–1738, 2004

1592 R. Atkinson et al.: Evaluated kinetic and photochemical data for Ox, HOx, NOx and SOx
Preferred Values
k∞ = 6.9×10⁻² s−1 at 298 K.k∞ = 9.7×10¹⁴ (T /300)0.1 exp(−11080/T ) s−1 over the temperature range 200–300 K.
Reliability
1log k∞ = ±0.3 at 298 K.1n = ±0.2.
Comments on Preferred Values
The preferred values are based on the evaluation of Malko and Troe (1982), which agrees well with the recent determinationof Cantrell et al. (1993). For the equilibrium constant, see comments on preferred values fork0.
References
Cantrell, C. A., Shetter, R. E., Calvert, J. G., Tyndall, G. S. and Orlando, J. J.: J. Phys. Chem., 97, 9141, 1993.Connell, P. and Johnston, H. S.: Geophys. Res. Lett., 6, 553, 1979.Hjorth, J., Notholt, J. and Restelli, G.: Int. J. Chem. Kinet., 24, 51, 1992.Malko, M. W. and Troe, J.: Int. J. Chem. Kinet., 14, 399, 1982.Pritchard, H. O.:Int. J. Chem. Kinet., 26, 61, 1994.Viggiano, A. A., Davidson, J. A., Fehsenfeld, F. C. and Ferguson, E. E.:J. Chem. Phys., 74, 6113, 1981.
Atmos. Chem. Phys., 4, 1461–1738, 2004 www.atmos-chem-phys.org/acp/4/1461/
R. Atkinson et al.: Evaluated kinetic and photochemical data for Ox, HOx, NOx and SOx 1593
I.A3.63I.A3.64
N2O5 + H2O → 2HNO3 (1)N2O5 + 2H2O → 2HNO3 + H2O (2)
1H ◦(1) = 1H ◦(2) = −39. kJ mol−1
Rate coefficient data
k/cm3 molecule−1 s−1 Temp./K Reference Technique/Comments
Absolute Rate Coefficientsk1 = 2.5 × 10⁻²² 290–293 Wahner et al., 1998 (a)k2 = 1.8 × 10−39[H2O] 290–293
Comments
(a) [NO2], [N2O5], and [HNO3] in a 250 m3 FEP-Teflon chamber were monitored simultaneously by in-situ FTIR. [O3] wasmonitored by UV absorption. The wall area was varied by placing extra Teflon sheets in the chamber. The [N2O5] decaykinetics were found to have a second order and a third order gas phase component and a contribution from reaction on thechamber walls. Rate coefficients were derived for the three decay channels by fitting the [HNO3] and [N2O5] temporalprofiles.
Preferred Values
k1 = 2.5×10⁻²² cm3 molecule−1 s−1 at 290 K.k2 = 1.8×10−39 cm6 molecule−2 s−1 at 290 K.
Reliability
1logk1 = 1logk2 = ± 0.3 at 290 K.
Comments on Preferred Values
The study of Wahner et al. (1998) shows that channels (1) and (2) may both be significant under atmospheric conditions. Thevalues ofk1 andk2 obtained in their study are compatible with earlier studies (Mentel et al., 1996; Tuazon et al., 1983; Hjorthet al., 1987; Hatakeyama and Leu, 1989; Atkinson et al., 1986; Sverdrup et al., 1987) which only yielded upper limits. Thevalues of Wahner et al. (1998) are accepted as our preferred values but with substantial error limits until confirmatory studiesare made.
References
Atkinson, R., Tuazon, E. C., Mac Leod, H., Aschmann, S. M. and Winer, A. M.: Geophys. Res. Lett., 13, 117, 1986.Hatakeyama, S. and Leu, M.-T.: J. Phys. Chem., 93, 5784, 1989.Hjorth, J., Ottobrini, G., Cappellani, F. and Restelli, G.: J. Phys. Chem., 91, 1565, 1987.Mentel, Th. F., Bleilebens, D. and Wahner, H.: Atmos. Environ., 30, 4007, 1996.Sverdrup, G. M., Spicer, C. W. and Ward, G. F.: Int. J. Chem. Kinet., 19, 191, 1987.Tuazon, E. C., Atkinson, R., Plum, C. N., Winer, A. M. and Pitts Jr., J. N.: Geophys. Res. Lett., 10, 953, 1983.Wahner, A., Mentel, T. F. and Sohn, M.: Geophys. Res. Lett., 25, 2169, 1998.
www.atmos-chem-phys.org/acp/4/1461/ Atmos. Chem. Phys., 4, 1461–1738, 2004

1594 R. Atkinson et al.: Evaluated kinetic and photochemical data for Ox, HOx, NOx and SOx
I.A3.65
HONO + hν → products
Primary photochemical transitions
Reaction 1H ◦/kJ· mol−1 λthreshold/nm
HONO +hν → HO + NO (1) 207 578→ H + NO2 (2) 331 361→ HNO + O(3P) (3) 442 271
Absorption cross-section data
Wavelength range/nm Reference Comments
185–270 Kenner et al., 1986 (a)300–400 Bongartz et al., 1991, 1994 (b)
Quantum yield data
Measurement Wavelength/nm Reference Comments
φ1 = 0.92± 0.16 365± 5 Cox and Derwent, 1976 (c)φ(HO*) 193 Kenner et al., 1986 (d)φ(H) 351 Wollenhaupt et al., 2000 (e)
Comments
(a) A relative absorption spectrum was measured in the range 185–270 nm with absolute determinations at 193 nm and 215nm. A value ofσ =1.6×10⁻¹⁸ cm2 molecule−1 was obtained at 193 nm. Two different methods used to prepare HONOgave similar results. Theσ values agree with those of Cox and Derwent (1976) in the wavelength region 220–270 nm,but the peak at 215 nm seen in the Cox and Derwent (1976) study, which could have been due to NO absorption, was notobserved.
(b) Absolute absorption cross-sections were determined using conventional absorption spectroscopy, and with low, non-equilibrium concentrations of HONO determined by a combination of gas-phase and wet chemical analysis. Spectralresolution was 0.1 nm; cross sections averaged over 0.5 nm are given in a table. In their later work, improved condi-tions were used; specifically, higher HONO mole fractions, greater stability of HONO in the absorption chamber, anddetermination of the NO2 present by interference free optical absorption at 440 nm.
(c) Rates of photon absorption and decomposition of NO2 and HONO were measured in the same photolysis cell. The valueof φ obtained supersedes an earlier estimate (Cox, 1974) using the same technique but based on less reliable absorptioncross-section data.
(d) Laser photolysis of HONO at 193 nm. HO* was measured by emission spectroscopy. A small quantum yield of∼ 10−5
was determined.
(e) Pulsed laser photolysis at 351 nm of flowing HONO-N2 (or Ar) mixtures was used to generate HO and the system wasinvestigated using resonance absorption at 121.6 nm to discover the extent of any concomitant production of H. Thesystem was calibrated for [H] by 248 nm photolysis of CH3SH. An upper limit of 1% was obtained forφ (H).
Atmos. Chem. Phys., 4, 1461–1738, 2004 www.atmos-chem-phys.org/acp/4/1461/

R. Atkinson et al.: Evaluated kinetic and photochemical data for Ox, HOx, NOx and SOx 1595
Preferred Values
Absorption cross-sections of HONO at 298 K
λ/nm 1020σ /cm2 λ/nm 1020σ /cm2 λ/nm 1020σ /cm2
190 127 260 8.0 330 9.3195 172 265 5.2 335 6.5200 197 270 3.4 340 16.8205 220 275 2.5 345 9.6210 214 280 – 350 11.5215 179 285 – 355 23.6220 146 290 – 360 8.0225 120 295 – 365 16.1230 86 300 0.0 370 20.5235 60 305 0.7 375 4.9240 42 310 1.6 380 9.2245 30 315 2.5 385 14.5250 18.5 320 4.4 390 2.4255 12.4 325 5.0 395 0.6
Quantum Yields at 298 K
φ1 = 1.0 throughout the wavelength range 190–400 nm.
Comments on Preferred Values
Since our previous evaluation, IUPAC (1997), Wang and Zhang (2000) have measured the absorption cross-sections at 352.2nm, 354.2 nm and 357.0 nm and there have been three other new determinations by Stutz et al. (2000), Pagsberg et al. (1997)and Brust et al. (2000) of the absorption cross-sections over a range of wavelengths in the 300–400 nm range. The results ofWang and Zhang (2000), Stutz et al. (2000) and Pagsberg et al. (1997) are in good agreement but the values obtained by Brustet al. (2000) are much lower. The reason for this discrepancy is not clear.
The studies of Wang and Zhang (2000), Stutz et al. (2000) and Pagsberg et al. (1997) are also in agreement with the earlierstudies of Stockwell and Calvert (1978), Vasudev (1990) and Bongartz et al. (1991, 1994), which were the basis of the preferredvalues for the absorption cross-section given in our previous evaluation, IUPAC (1997), which are therefore unchanged. Thepreferred values of the cross-sections tabulated for the 300–395 nm range are obtained from the data of Bongartz et al. (1991,1994). In their later work (Bongartz et al., 1994), cross-sections were measured under better controlled conditions than in theirearlier study (Bongartz et al., 1991) and it was shown that their earlier data were consistently too high by, on average, 14.5%.The preferred values have been obtained, therefore, by averaging the data from Bongartz et al. (1991) over 5 nm intervalscentred on the wavelength specified in the Table and reducing these values by 14.5% as directed in Bongartz et al. (1994).
The HONO spectrum consists of a diffuse structured band between 300 and 390 nm and a broad structureless band from270 nm to below 180 nm, peaking at∼210 nm. The only direct determination of theφ(HO) in this region is that of Cox andDerwent (1976) who showed that channel (1) is the dominant process between 330 nm and 380 nm and obtained a quantumyield for HO production of 0.92± 0.16 at 365 nm. There is some indirect evidence for H atom production at∼ 350 nm(Burkholder et al., 1992) but Wollenhaupt et al. (2000) have shownφ(H) to be less than 0.01. We therefore takeφ(HO) to beunity throughout this band.
In the second absorption band, cross-sections over the range 185–275 nm are based on the data of Kenner et al. (1986),which show that channel (1) is the main photodissociation channel in this region also, but minor H atom producing channelsin the 193.3 nm photodissociation of a beam of jet-cooled HONO (Amaral et al., 2001) have also been observed.
www.atmos-chem-phys.org/acp/4/1461/ Atmos. Chem. Phys., 4, 1461–1738, 2004

1596 R. Atkinson et al.: Evaluated kinetic and photochemical data for Ox, HOx, NOx and SOx
References
Amaral, G., Xu, K. and Zhang, J.: J. Phys. Chem. A, 105, 1465, 2001.Bongartz, A., Kames, J., Welter, J. F. and Schurath, U.: J. Phys. Chem., 95, 1076, 1991.Bongartz, A., Kames, J., Schurath, U., George, Ch., Mirabel, Ph. and Ponche, J. L.: J. Atmos. Chem., 18, 149, 1994.Brust, A. S., Becker, K. H., Kleffman, J. E. and Wiesen, P.: Atmos. Environ., 34, 13, 2000.Burkholder, J., Mellouki, A., Talukdar, R. and Ravishankara, A. R.: Int. J. Chem. Kinet., 24, 711, 1992.Cox, R. A.: J. Photochem., 3, 175, 1974.Cox, R. A. and Derwent, R. G.: J. Photochem., 6, 23, 1976/77.Kenner, R. D., Rohrer, F. and Stuhl, F.: J. Phys. Chem., 90, 2635, 1986.IUPAC, Supplement VI: Phys. Chem, Ref. Data, 26, 1329, 1997.Pagsberg, P. E., Bjerbakke, E., Ratajczak, E. and Sillesen, A.: Chem. Phys. Lett., 272, 383, 1997.Stockwell, W. R. and Calvert, J. G.: J. Photochem., 8, 175, 1978.Stutz, J., Kim, E. S., Platt, U., Bruno, P., Perrino, C. and Febo, A.: J. Geophys. Res., 105, 14 585, 2000.Vasudev, R.: Geophys. Res. Lett., 17, 2153, 1990.Wang. L. and Zhang, J.: Env. Sci. Technol., 34, 4221, 2000.Wollenhaupt, M., Carl, S. A., Horowitz, A. and Crowley, J. N.: J. Phys. Chem. A, 104, 2695, 2000.
Atmos. Chem. Phys., 4, 1461–1738, 2004 www.atmos-chem-phys.org/acp/4/1461/
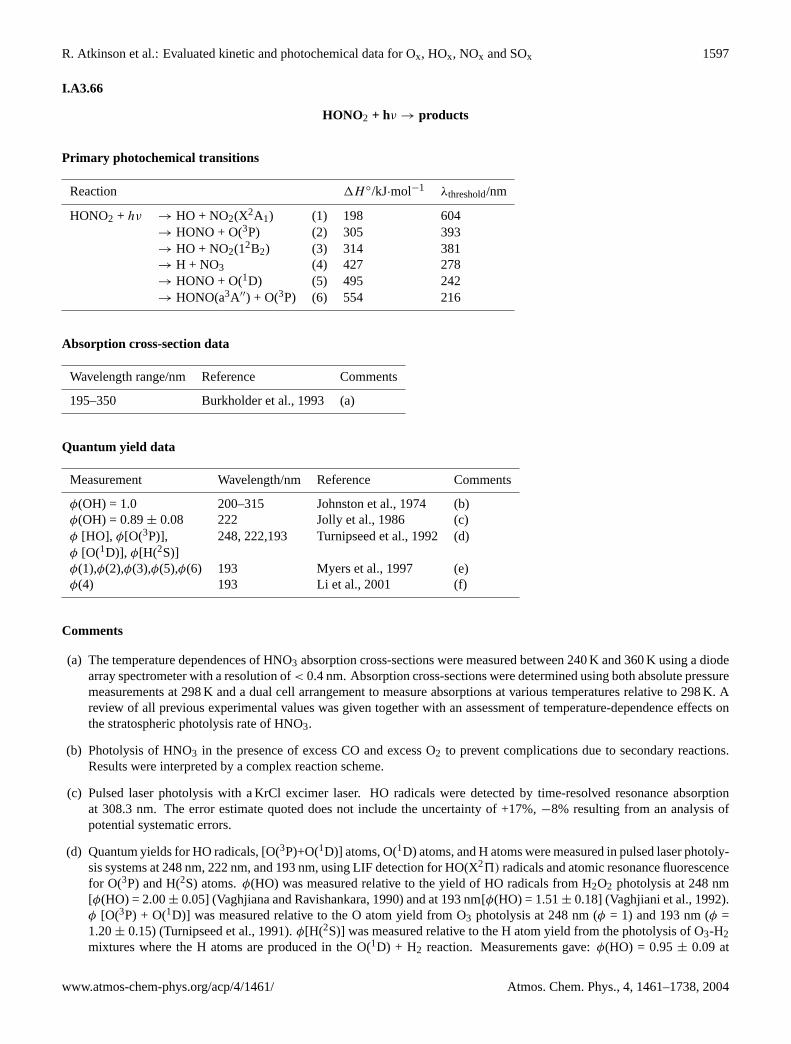
R. Atkinson et al.: Evaluated kinetic and photochemical data for Ox, HOx, NOx and SOx 1597
I.A3.66
HONO2 + hν → products
Primary photochemical transitions
Reaction 1H ◦/kJ·mol−1 λthreshold/nm
HONO2 + hν → HO + NO2(X2A1) (1) 198 604→ HONO + O(3P) (2) 305 393→ HO + NO2(12B2) (3) 314 381→ H + NO3 (4) 427 278→ HONO + O(1D) (5) 495 242→ HONO(a3A′′) + O(3P) (6) 554 216
Absorption cross-section data
Wavelength range/nm Reference Comments
195–350 Burkholder et al., 1993 (a)
Quantum yield data
Measurement Wavelength/nm Reference Comments
φ(OH) = 1.0 200–315 Johnston et al., 1974 (b)φ(OH) = 0.89± 0.08 222 Jolly et al., 1986 (c)φ [HO], φ[O(3P)], 248, 222,193 Turnipseed et al., 1992 (d)φ [O(1D)], φ[H(2S)]φ(1),φ(2),φ(3),φ(5),φ(6) 193 Myers et al., 1997 (e)φ(4) 193 Li et al., 2001 (f)
Comments
(a) The temperature dependences of HNO3 absorption cross-sections were measured between 240 K and 360 K using a diodearray spectrometer with a resolution of< 0.4 nm. Absorption cross-sections were determined using both absolute pressuremeasurements at 298 K and a dual cell arrangement to measure absorptions at various temperatures relative to 298 K. Areview of all previous experimental values was given together with an assessment of temperature-dependence effects onthe stratospheric photolysis rate of HNO3.
(b) Photolysis of HNO3 in the presence of excess CO and excess O2 to prevent complications due to secondary reactions.Results were interpreted by a complex reaction scheme.
(c) Pulsed laser photolysis with a KrCl excimer laser. HO radicals were detected by time-resolved resonance absorptionat 308.3 nm. The error estimate quoted does not include the uncertainty of +17%,−8% resulting from an analysis ofpotential systematic errors.
(d) Quantum yields for HO radicals, [O(3P)+O(1D)] atoms, O(1D) atoms, and H atoms were measured in pulsed laser photoly-sis systems at 248 nm, 222 nm, and 193 nm, using LIF detection for HO(X25) radicals and atomic resonance fluorescencefor O(3P) and H(2S) atoms.φ(HO) was measured relative to the yield of HO radicals from H2O2 photolysis at 248 nm[φ(HO) = 2.00± 0.05] (Vaghjiana and Ravishankara, 1990) and at 193 nm[φ(HO) = 1.51± 0.18] (Vaghjiani et al., 1992).φ [O(3P) + O(1D)] was measured relative to the O atom yield from O3 photolysis at 248 nm (φ = 1) and 193 nm (φ =1.20± 0.15) (Turnipseed et al., 1991).φ[H(2S)] was measured relative to the H atom yield from the photolysis of O3-H2mixtures where the H atoms are produced in the O(1D) + H2 reaction. Measurements gave:φ(HO) = 0.95± 0.09 at
www.atmos-chem-phys.org/acp/4/1461/ Atmos. Chem. Phys., 4, 1461–1738, 2004

1598 R. Atkinson et al.: Evaluated kinetic and photochemical data for Ox, HOx, NOx and SOx
248 nm, 0.90± 0.11 at 222 nm, and 0.33± 0.06 at 193 nm.φ[O(3P) + O(1D)] was observed to be 0.031± 0.010, 0.20± 0.03, and 0.81± 0.13, at 248 nm, 222 nm, and 193 nm respectively, with exclusively O(3P) production at 248 nm.φ[O(1D)] was 0.074± 0.03 at 222 nm and 0.28± 0.13 at 193 nm. H atom yields were low; only at 193 nm were any Hatoms detected, withφ[H(2S)] ≤ 0.012.
(e) Photofragment translational spectroscopy investigation of HONO2 photolysis at 193 nm. The primary processes and theirrelative yields were deduced from photofragment time-of-flight signals at masses 16 (O+), 17 (HO+), 30 (NO+), and 46(NO+
2 ). Two HO distributions arising from channels (1) and (3) were resolved and gaveφ1+φ3 = 0.33± 0.04,φ3/φ1=0.45. Two main O-atom producing channels were identified and attributed to channels (5) and (6), with quantum yieldsφ5+φ6 = 0.67± 0.04,φ5/φ6= 4.0.
(f) Photodissociation at 193 nm in a supersonic jet was studied using LIF and REMPI-TOF techniques. A bimodal rotationalstate distribution was observed for HO, consistent with the bimodal translational distribution found for HO by Myers etal. (1997). An additional decay channel yielding O(3P) was observed and attributed to channel (2), with a quantum yieldof ∼ 0.06.
Preferred Values
Absorption cross-sections at 298 Ka
λ/nm 1020σ /cm2 103 B/K−1 λ/nm 1020σ /cm2 103 B/K−1
190 1360 0 270 1.62 1.45195 1016 0 275 1.38 1.60200 588 1.66 280 1.12 1.78205 280 1.75 285 0.858 1.99210 104 1.97 290 0.615 2.27215 36.5 2.17 295 0.412 2.61220 14.9 2.15 300 0.263 3.10225 8.81 1.90 305 0.150 3.64230 5.78 1.80 310 0.081 4.23235 3.75 1.93 315 0.041 5.20240 2.58 1.97 320 0.020 6.45245 2.11 1.68 325 0.0095 7.35250 1.97 1.34 330 0.0043 9.75255 1.95 1.16 335 0.0022 10.1260 1.91 1.14 340 0.0010 11.8265 1.80 1.20 345 0.0006 11.2
350 0.0004 9.30
a Temperature dependence given by the expression: logeσ(T ) = logeσ (298) + B(T −298) withT in K.
Quantum Yields at 298 K
λ/nm
≥248 222 193
φ(HO) >0.97 0.90±0.10 0.33±0.06φ[O(1D) + O(3P)] 0.03±0.03 0.20±0.03 0.81±0.13
φ[O(1D)] <0.003 0.08±0.01 0.28±0.11φ(H) <0.01 <0.01 <0.01
Atmos. Chem. Phys., 4, 1461–1738, 2004 www.atmos-chem-phys.org/acp/4/1461/

R. Atkinson et al.: Evaluated kinetic and photochemical data for Ox, HOx, NOx and SOx 1599
Comments on Preferred Values
The results of Burkholder et al. (1993) for the cross-sections provide a high quality and comprehensive dataset over the rangeof temperatures and wavelengths of significance for atmospheric photolysis of HNO3. Over the wavelength range 205–310nm there is good agreement with the earlier studies of Rattigan et al. (1992), Biaume (1973), Molina and Molina (1981) andJohnston and Graham (1973). Atλ < 205 nm, the data from different studies show small and unexplained discrepancies. Atλ > 310 nm the room temperature results of Burkholder et al. (1993) are increasingly higher than all previously reported dataexcept those of Rattigan et al. (1992), which are in good agreement. The preferred values are those given by Burkholder etal. (1993).
The temperature dependences reported by Burkholder et al. (1993) are weaker than those reported by Rattigan et al. (1992).However, if the data at the lowest temperature (239 K) in the study of Rattigan et al. (1992) are omitted, the agreement is good.Burkholder et al. (1993) give values for the temperature coefficient,B, based on the two data sets (Burkholder et al., 1993;Rattigan et al., 1992) (excluding the 239 K data of Rattigan et al., 1992), and these are adopted here.
The quantum yield measurements confirm that, although channels (1) and (3) are the dominant channels atλ >∼ 260 nmwith φ(HO) close to unity, other channels become important at shorter wavelengths as suggested by the earlier work of Kenneret al. (1986). The quantum yield measurements of Turnipseed et al. (1992) and Schiffman et al. (1993) are in excellentagreement at 248 nm when the two sets of measurements are normalized to the same value of the quantum yield for HO radicalproduction from H2O2. The agreement is less good at 193 nm, where the direct measurements of Schiffman et al. (1993) givean HO radical yield higher by about 50%. The value ofφ(H2O2) obtained by Schiffman et al. (1993) is about 25% lower atboth 248 nm and 193 nm than the values obtained by Vaghjiani et al. (1991, 1992) (2.0 at 248 nm and 1.5 at 193 nm). Thepreferred values for the quantum yields atλ ≥ 248 nm are based on the indirect studies of Johnston et al. (1974) and the directobservation of Turnipseed et al. (1992). The small yield of O atoms observed by Turnipseed et al. (1992) is in agreement withthe value ofφ(O) = 0.03 at 266 nm obtained by Margitan and Watson (1982). At 222 nm the preferred values are based on thedata of Turnipseed et al. (1992) and Jolly et al. (1986).
The photolysis of HONO2 at 193 nm has been clarified by the recent molecular beam studies of Myers et al. (1997) and Li etal. (2001), which employed LIF and TOF techniques to detect the photolysis products and to measure their energy distributions.They obtained evidence for the occurrence of channels (1), (2), (3), (5), and (6), with O atom production becoming a majorprocess at this wavelength, directly through channels (2), (5), and (6), and indirectly through dissociation of the internallyexcited NO2 produced via channel (1). The minor pathway (φ2 =∼ 0.06) detected by Li et al. (2001) also produces internallyexcited HONO capable of subsequent dissociation. There are also pulsed laser photolysis studies at 193 nm on bulk gas samplesfrom Turnipseed et al. (1992) and Schiffman et al. (1993). As previously mentioned, in the study of Schiffman et al. (1993),there are inconsistencies in the measurements of HO yields from H2O2 dissociation atλ ≥ 260 nm. The results of Turnipseedet al. (1992) are therefore preferred and are the basis of our preferred values for the quantum yields at 193 nm. The valueφ(HO) obtained by Turnipseed et al. (1992) is the same as that from the molecular beam study of Myers et al. (1997), and thevalue ofφ[O(3P)+O(1D)] of Turnipseed et al. (1992) can also be reconciled with the molecular beam results when productionof O atoms from dissociation of internally excited NO2 from channel (1) is allowed for. However the value ofφ[O(1D)] =0.28 obtained by Turnipseed et al. (1992) is much smaller than the value ofφ5 = 0.52 found by Myers et al. (1997), and thisdiscrepancy remains to be resolved. The upper limits to the H-atom yield obtained by Turnipseed et al. (1992) suggest thatchannel (4) is unimportant atλ ≥ 193 nm.
Photodissociation of HONO2 via high-lying O-H overtone absorptions in the visible region of the spectrum is energeticallypossible for the 5νOH and higher overtones. Brown et al. (2000) have used cavity ring down spectroscopy to measure absorp-tion cross-sections at 296 K and 251 K for the 4νOH and 5νOH transitions. The values obtained agree well with those fromother studies (Donaldson et al., 1998; Zhang et al., 2000) and imply that the contribution of these absorptions to HO productionin the atmosphere is small, but larger than previous calculations (Donaldson et al., 1997; 1998) suggest.
References
Biaume, F.: J. Photochem., 2, 139, 1973.Brown, S. S., Wilson, R. W. and Ravishankara, A. R.: J. Phys. Chem. A, 104, 4976, 2000.Burkholder, J. B., Talukdar, R. K., Ravishankara, A. R. and Solomon, S.: J. Geophys. Res., 98, 22 937, 1993.Donaldson, D. J., Orlando, J. J., Amann, S., Tyndall, G. S., Proos, R. J., Henry, B. R. and Vaida, V.: J. Phys. Chem. A, 102,5171, 1998.Donaldson, D. J., Frost, G. J., Rosenlof, K. H., Tuck, A. F. and Vaida, V.: Geophys. Res. Lett., 24, 2651, 1997.Johnston, H. and Graham, R.: J. Phys. Chem., 77, 62, 1973.
www.atmos-chem-phys.org/acp/4/1461/ Atmos. Chem. Phys., 4, 1461–1738, 2004

1600 R. Atkinson et al.: Evaluated kinetic and photochemical data for Ox, HOx, NOx and SOx
Johnston, H. S., Chang, S.-G. and Whitten, G.: J. Phys. Chem., 78, 1, 1974.Jolly, G. S., Singleton, D. L., McKenney, D. J. and Paraskevopoulos, G.: J. Chem. Phys., 84, 6662, 1986.Kenner, R. D., Rohrer, F., Papenbrock, Th. and Stuhl, F.: J. Phys. Chem., 90, 1294, 1986.Li, Q., Carter, R. T. and Huber, J. R.: Chem. Phys. Lett., 334, 39, 2001.Margitan, J. J. and Watson, R. T.: J. Phys. Chem., 86, 3819, 1982.Molina, L. T. and Molina, M. J.: J. Photochem., 15, 97, 1981.Myers, T. L., Forde, N. R., Hu, B., Kitchen, D. C. and Butler, J. L.: J. Chem. Phys., 107, 5361, 1997.Rattigan, O., Lutman, E., Jones, R. L., Cox, R. A., Clemitshaw, K. and Williams, J.: J. Photochem. Photobiol. A: Chem., 66,313, 1992; corrigendum,ibid, 69, 125, 1992.Schiffman, A., Nelson Jr., D. D. and Nesbitt, D. J.: J. Chem. Phys., 98, 6935, 1993.Turnipseed, A. A., Vaghjiani, G. L., Gierczak, T., Thompson, J. E. and Ravishankara, A. R.: J. Chem. Phys., 95, 3244, 1991.Turnipseed, A. A., Vaghjiani, G. L., Thompson, J. E. and Ravishankara, A. R.: J. Chem. Phys., 96, 5887, 1992.Vaghjiana, G. L. and Ravishankara, A. R.: J. Chem. Phys., 92, 996, 1990.Vaghjiani, G. L., Turnipseed, A. A., Warren, R. F. and Ravishankara, A. R.: J. Chem. Phys., 96, 5878, 1992.Zhang, H., Roehl, C. M., Sander, S. P. and Wennberg, P. O.: J. Geophys. Res., 105, 14 599, 2000.
Atmos. Chem. Phys., 4, 1461–1738, 2004 www.atmos-chem-phys.org/acp/4/1461/

R. Atkinson et al.: Evaluated kinetic and photochemical data for Ox, HOx, NOx and SOx 1601
I.A3.67
HO2NO2 + hν → products
Primary photochemical transitions
Reaction 1H ◦/kJ· mol−1 λthreshold/nm
HO2NO2 + hν → HO2 + NO2 (1) 100 1191→ HO + NO3 (2) 164 731
Absorption cross-section data
Wavelength range/nm Reference Comments
190–330 Molina and Molina, 1981 (a)210–330 Singer et al., 1989 (b)
Quantum yield data
Measurement Wavelength/nm Reference Comments
φ2 248 Mac Leod et al., 1988 (c)φ1 248 Roehl et al., 2001 (d)
Comments
(a) Measured at 298 K and 1 bar total pressure. HO2NO2 was prepared in a flowing N2 stream in the presence of H2O, H2O2,and HO2. The composition of the mixture was established by FTIR spectroscopy, by the absorption spectrum in thevisible, and by chemical titration after absorption in aqueous solutions. Two methods were used to prepare the HO2NO2.In the first, 70% nitric acid was mixed with 90% H2O2, while in the second method solid nitronium tetrafluoroborate(NO2BF4) was added to a solution of 90% H2O2.
(b) Cross-sections were measured at 298 K, 273 K, and 253 K. Pernitric acid was producedin situ by photolysis of Cl2-H2-NO2-air mixtures and averaged absorption measurements were made at small extents of reaction. The relative spectrumover the range 210–230 nm was measured at a resolution of 1 nm in flowing mixtures of pernitric acid vapour obtainedfrom the reaction of BF4NO2 and H2O2. The spectrum was corrected for the impurities NO2, H2O2, and HNO3, whichwere determined by IR spectroscopy.
(c) Laser photolysis of pernitric acid at 248 nm. HO radicals were detected by LIF and their yield determined relative to theHO yield from H2O2 photolysis, with the assumption that the rotational distribution of the HO from the HO2NO2 and theH2O2 was the same under the conditions of the experiment. A value ofφ2 = 0.34± 0.16 was obtained after correctionfor impurities in the pernitric acid sample. Fluorescence from NO∗
2 was observed after photolysis and was assigned toproduction via channel (1). The upper limit for NO∗
2 production was 30%. It was concluded that under atmosphericconditionsφ1 ≈ 0.65 andφ2 ≈ 0.35.
(d) Laser photolysis of pernitric acid at 248 nm. NO2 was detected by LIF at 511 nm. The quantum yield for NO2 productionwas obtained by comparison with HNO3 photolysis under the same conditions and taking the quantum yield for NO2production from HNO3 to be unity. Experiments made over a range of pressures and concentrations gaveφ(NO2) = 0.56± 0.17.
www.atmos-chem-phys.org/acp/4/1461/ Atmos. Chem. Phys., 4, 1461–1738, 2004

1602 R. Atkinson et al.: Evaluated kinetic and photochemical data for Ox, HOx, NOx and SOx
Preferred Values
Absorption cross-sections of HO2NO2 at 296 K
λ/nm 1020σ /cm2 λ/nm 1020σ /cm2
190 1010 265 22.9195 816 270 18.0200 563 275 13.3205 367 280 9.3210 239 285 6.2215 161 290 3.9220 118 295 2.4225 93.2 300 1.4230 78.8 305 0.85235 68.0 310 0.53240 57.9 315 0.39245 49.7 320 0.24250 41.1 325 0.15255 34.9 330 0.09260 28.4
Quantum Yields at 298 K
φ1 = 0.59 at 248 nm.φ2 = 0.41 at 248 nm.
Comments on Preferred Values
The preferred values of the absorption cross-sections are based on the data of Molina and Molina (1981) and of Singeret al. (1989) which are in excellent agreement at wavelengths in the range 210–300 nm. Between 300 nm and 320 nm thecross-sections of Singer et al. (1989) are approximately a factor of 2 lower. A simple mean of the two data sets is taken overthe whole wavelength range.
When the value ofφ(HO) determined by Mac Leod et al. (1988) at 248 nm is revised to take into account the presentrecommendation for the absorption cross-section for H2O2 a slightly higher value of 0.39 is obtained. This is in very goodagreement with the value of 0.44 implied by the recent measurement ofφ(NO2) by Roehl et al. (2001) at 248 nm. Thepreferred values ofφ1 andφ2 are the average of the values from the studies of Roehl et al. (2001) and Mac Leod et al. (1988)The uncertainties in the quantum yields are large and it should be noted that the recommendations are restricted to a singlewavelength.
Photodissociation of HO2NO2 via high-lying O-H overtone absorptions in the visible region of the spectrum is energeticallypossible for the 3νOH and higher overtones. Zhang et al. (2000) have measured absorption cross-sections at 273 K for the3νOH and 4νOH transitions using conventional long-path-length absorption spectroscopy. Assuming that such absorptions aredissociative for HO2NO2 the values obtained imply that these modes will play a small role in the photochemistry of the lowerstratosphere.
References
Mac Leod, H., Smith, G. P. and Golden, D. M.: J. Geophys. Res., 93, 3813, 1988.Molina, L. T. and Molina, M. J.: J. Photochem., 15, 97, 1981.Roehl, C. M., Mazely, T. L., Friedl, R. R., Li, Y., Francisco, J. S. and Sander, S. P.: J. Phys. Chem. A, 105, 1592, 2001.Singer, R. J., Crowley, J. N., Burrows, J. P., Schneider, W. and Moortgat, G. K.: J. Photochem. Photobiol., 48, 17, 1989.Zhang, H., Roehl, C. M., Sander, S. P. and Wennberg, P. O.: J. Geophys. Res., 105, 14 593, 2000.
Atmos. Chem. Phys., 4, 1461–1738, 2004 www.atmos-chem-phys.org/acp/4/1461/
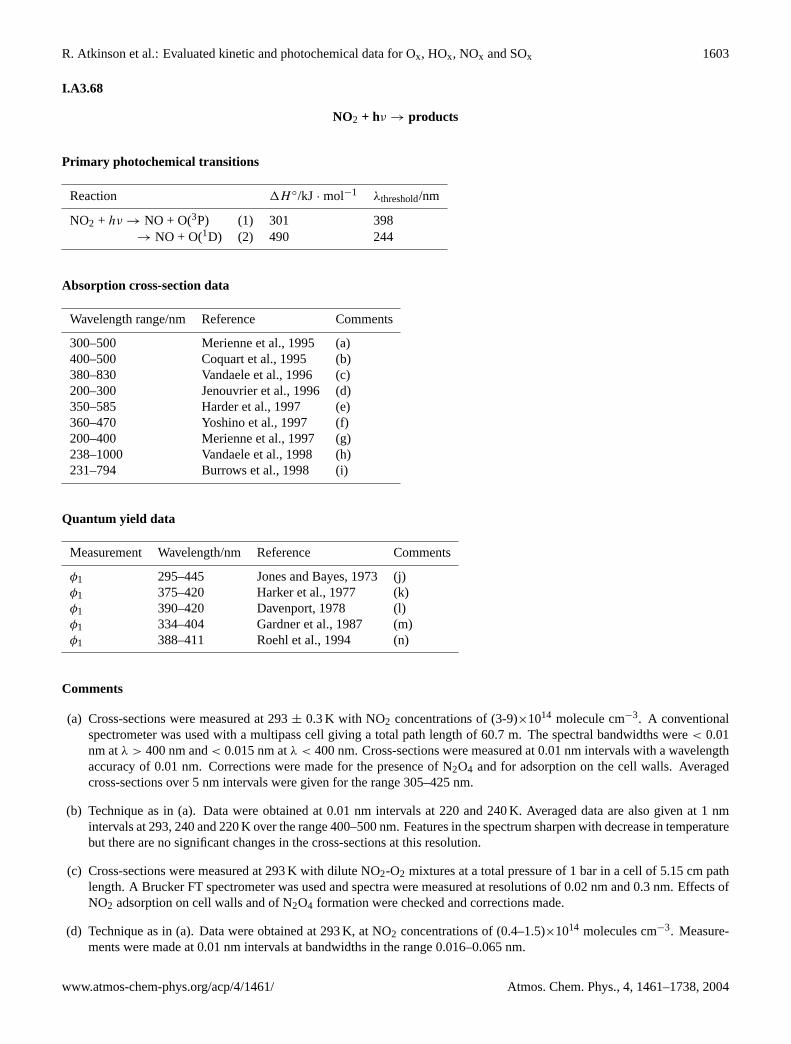
R. Atkinson et al.: Evaluated kinetic and photochemical data for Ox, HOx, NOx and SOx 1603
I.A3.68
NO2 + hν → products
Primary photochemical transitions
Reaction 1H ◦/kJ · mol−1 λthreshold/nm
NO2 + hν → NO + O(3P) (1) 301 398→ NO + O(1D) (2) 490 244
Absorption cross-section data
Wavelength range/nm Reference Comments
300–500 Merienne et al., 1995 (a)400–500 Coquart et al., 1995 (b)380–830 Vandaele et al., 1996 (c)200–300 Jenouvrier et al., 1996 (d)350–585 Harder et al., 1997 (e)360–470 Yoshino et al., 1997 (f)200–400 Merienne et al., 1997 (g)238–1000 Vandaele et al., 1998 (h)231–794 Burrows et al., 1998 (i)
Quantum yield data
Measurement Wavelength/nm Reference Comments
φ1 295–445 Jones and Bayes, 1973 (j)φ1 375–420 Harker et al., 1977 (k)φ1 390–420 Davenport, 1978 (l)φ1 334–404 Gardner et al., 1987 (m)φ1 388–411 Roehl et al., 1994 (n)
Comments
(a) Cross-sections were measured at 293± 0.3 K with NO2 concentrations of (3-9)×1014 molecule cm−3. A conventionalspectrometer was used with a multipass cell giving a total path length of 60.7 m. The spectral bandwidths were< 0.01nm atλ > 400 nm and< 0.015 nm atλ < 400 nm. Cross-sections were measured at 0.01 nm intervals with a wavelengthaccuracy of 0.01 nm. Corrections were made for the presence of N2O4 and for adsorption on the cell walls. Averagedcross-sections over 5 nm intervals were given for the range 305–425 nm.
(b) Technique as in (a). Data were obtained at 0.01 nm intervals at 220 and 240 K. Averaged data are also given at 1 nmintervals at 293, 240 and 220 K over the range 400–500 nm. Features in the spectrum sharpen with decrease in temperaturebut there are no significant changes in the cross-sections at this resolution.
(c) Cross-sections were measured at 293 K with dilute NO2-O2 mixtures at a total pressure of 1 bar in a cell of 5.15 cm pathlength. A Brucker FT spectrometer was used and spectra were measured at resolutions of 0.02 nm and 0.3 nm. Effects ofNO2 adsorption on cell walls and of N2O4 formation were checked and corrections made.
(d) Technique as in (a). Data were obtained at 293 K, at NO2 concentrations of (0.4–1.5)×1014 molecules cm−3. Measure-ments were made at 0.01 nm intervals at bandwidths in the range 0.016–0.065 nm.
www.atmos-chem-phys.org/acp/4/1461/ Atmos. Chem. Phys., 4, 1461–1738, 2004
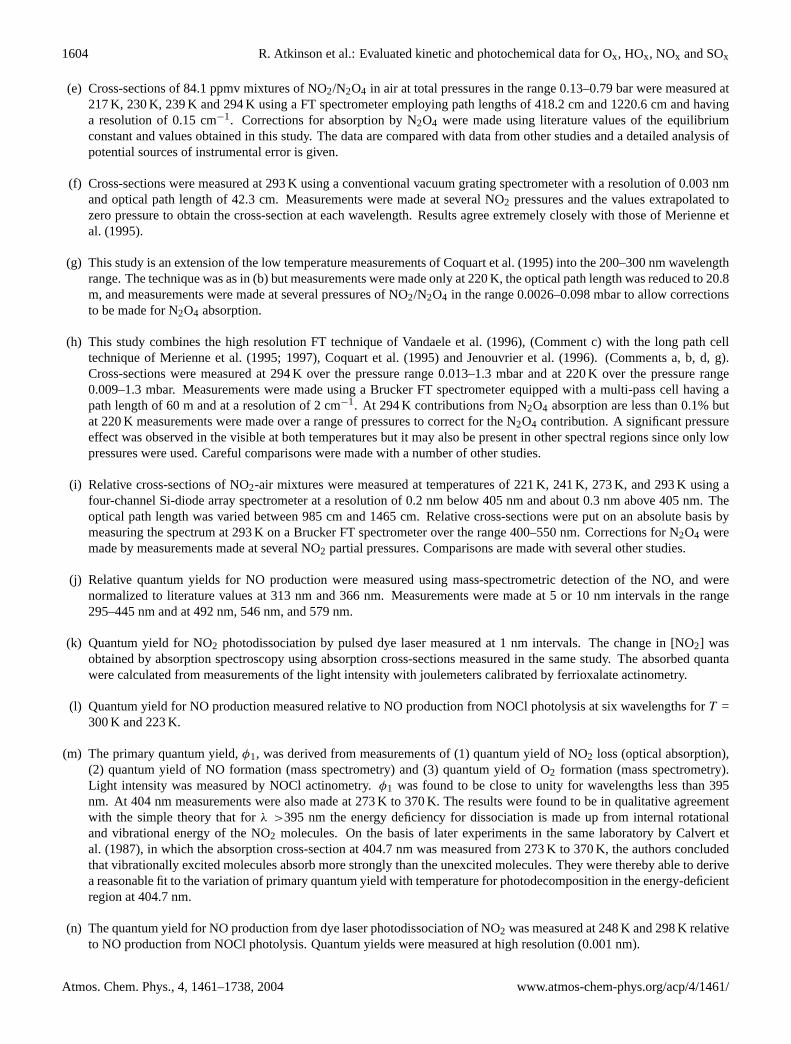
1604 R. Atkinson et al.: Evaluated kinetic and photochemical data for Ox, HOx, NOx and SOx
(e) Cross-sections of 84.1 ppmv mixtures of NO2/N2O4 in air at total pressures in the range 0.13–0.79 bar were measured at217 K, 230 K, 239 K and 294 K using a FT spectrometer employing path lengths of 418.2 cm and 1220.6 cm and havinga resolution of 0.15 cm−1. Corrections for absorption by N2O4 were made using literature values of the equilibriumconstant and values obtained in this study. The data are compared with data from other studies and a detailed analysis ofpotential sources of instrumental error is given.
(f) Cross-sections were measured at 293 K using a conventional vacuum grating spectrometer with a resolution of 0.003 nmand optical path length of 42.3 cm. Measurements were made at several NO2 pressures and the values extrapolated tozero pressure to obtain the cross-section at each wavelength. Results agree extremely closely with those of Merienne etal. (1995).
(g) This study is an extension of the low temperature measurements of Coquart et al. (1995) into the 200–300 nm wavelengthrange. The technique was as in (b) but measurements were made only at 220 K, the optical path length was reduced to 20.8m, and measurements were made at several pressures of NO2/N2O4 in the range 0.0026–0.098 mbar to allow correctionsto be made for N2O4 absorption.
(h) This study combines the high resolution FT technique of Vandaele et al. (1996), (Comment c) with the long path celltechnique of Merienne et al. (1995; 1997), Coquart et al. (1995) and Jenouvrier et al. (1996). (Comments a, b, d, g).Cross-sections were measured at 294 K over the pressure range 0.013–1.3 mbar and at 220 K over the pressure range0.009–1.3 mbar. Measurements were made using a Brucker FT spectrometer equipped with a multi-pass cell having apath length of 60 m and at a resolution of 2 cm−1. At 294 K contributions from N2O4 absorption are less than 0.1% butat 220 K measurements were made over a range of pressures to correct for the N2O4 contribution. A significant pressureeffect was observed in the visible at both temperatures but it may also be present in other spectral regions since only lowpressures were used. Careful comparisons were made with a number of other studies.
(i) Relative cross-sections of NO2-air mixtures were measured at temperatures of 221 K, 241 K, 273 K, and 293 K using afour-channel Si-diode array spectrometer at a resolution of 0.2 nm below 405 nm and about 0.3 nm above 405 nm. Theoptical path length was varied between 985 cm and 1465 cm. Relative cross-sections were put on an absolute basis bymeasuring the spectrum at 293 K on a Brucker FT spectrometer over the range 400–550 nm. Corrections for N2O4 weremade by measurements made at several NO2 partial pressures. Comparisons are made with several other studies.
(j) Relative quantum yields for NO production were measured using mass-spectrometric detection of the NO, and werenormalized to literature values at 313 nm and 366 nm. Measurements were made at 5 or 10 nm intervals in the range295–445 nm and at 492 nm, 546 nm, and 579 nm.
(k) Quantum yield for NO2 photodissociation by pulsed dye laser measured at 1 nm intervals. The change in [NO2] wasobtained by absorption spectroscopy using absorption cross-sections measured in the same study. The absorbed quantawere calculated from measurements of the light intensity with joulemeters calibrated by ferrioxalate actinometry.
(l) Quantum yield for NO production measured relative to NO production from NOCl photolysis at six wavelengths forT =300 K and 223 K.
(m) The primary quantum yield,φ1, was derived from measurements of (1) quantum yield of NO2 loss (optical absorption),(2) quantum yield of NO formation (mass spectrometry) and (3) quantum yield of O2 formation (mass spectrometry).Light intensity was measured by NOCl actinometry.φ1 was found to be close to unity for wavelengths less than 395nm. At 404 nm measurements were also made at 273 K to 370 K. The results were found to be in qualitative agreementwith the simple theory that forλ >395 nm the energy deficiency for dissociation is made up from internal rotationaland vibrational energy of the NO2 molecules. On the basis of later experiments in the same laboratory by Calvert etal. (1987), in which the absorption cross-section at 404.7 nm was measured from 273 K to 370 K, the authors concludedthat vibrationally excited molecules absorb more strongly than the unexcited molecules. They were thereby able to derivea reasonable fit to the variation of primary quantum yield with temperature for photodecomposition in the energy-deficientregion at 404.7 nm.
(n) The quantum yield for NO production from dye laser photodissociation of NO2 was measured at 248 K and 298 K relativeto NO production from NOCl photolysis. Quantum yields were measured at high resolution (0.001 nm).
Atmos. Chem. Phys., 4, 1461–1738, 2004 www.atmos-chem-phys.org/acp/4/1461/
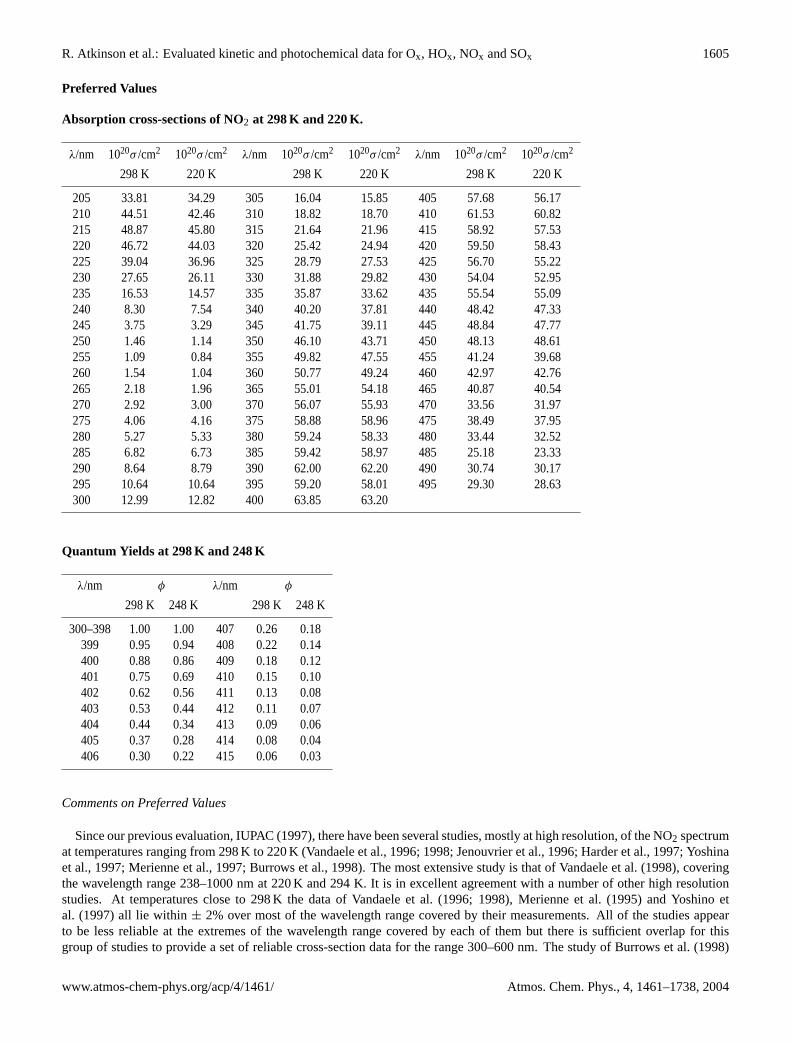
R. Atkinson et al.: Evaluated kinetic and photochemical data for Ox, HOx, NOx and SOx 1605
Preferred Values
Absorption cross-sections of NO2 at 298 K and 220 K.
λ/nm 1020σ /cm2 1020σ /cm2 λ/nm 1020σ /cm2 1020σ /cm2 λ/nm 1020σ /cm2 1020σ /cm2
298 K 220 K 298 K 220 K 298 K 220 K
205 33.81 34.29 305 16.04 15.85 405 57.68 56.17210 44.51 42.46 310 18.82 18.70 410 61.53 60.82215 48.87 45.80 315 21.64 21.96 415 58.92 57.53220 46.72 44.03 320 25.42 24.94 420 59.50 58.43225 39.04 36.96 325 28.79 27.53 425 56.70 55.22230 27.65 26.11 330 31.88 29.82 430 54.04 52.95235 16.53 14.57 335 35.87 33.62 435 55.54 55.09240 8.30 7.54 340 40.20 37.81 440 48.42 47.33245 3.75 3.29 345 41.75 39.11 445 48.84 47.77250 1.46 1.14 350 46.10 43.71 450 48.13 48.61255 1.09 0.84 355 49.82 47.55 455 41.24 39.68260 1.54 1.04 360 50.77 49.24 460 42.97 42.76265 2.18 1.96 365 55.01 54.18 465 40.87 40.54270 2.92 3.00 370 56.07 55.93 470 33.56 31.97275 4.06 4.16 375 58.88 58.96 475 38.49 37.95280 5.27 5.33 380 59.24 58.33 480 33.44 32.52285 6.82 6.73 385 59.42 58.97 485 25.18 23.33290 8.64 8.79 390 62.00 62.20 490 30.74 30.17295 10.64 10.64 395 59.20 58.01 495 29.30 28.63300 12.99 12.82 400 63.85 63.20
Quantum Yields at 298 K and 248 K
λ/nm φ λ/nm φ
298 K 248 K 298 K 248 K
300–398 1.00 1.00 407 0.26 0.18399 0.95 0.94 408 0.22 0.14400 0.88 0.86 409 0.18 0.12401 0.75 0.69 410 0.15 0.10402 0.62 0.56 411 0.13 0.08403 0.53 0.44 412 0.11 0.07404 0.44 0.34 413 0.09 0.06405 0.37 0.28 414 0.08 0.04406 0.30 0.22 415 0.06 0.03
Comments on Preferred Values
Since our previous evaluation, IUPAC (1997), there have been several studies, mostly at high resolution, of the NO2 spectrumat temperatures ranging from 298 K to 220 K (Vandaele et al., 1996; 1998; Jenouvrier et al., 1996; Harder et al., 1997; Yoshinaet al., 1997; Merienne et al., 1997; Burrows et al., 1998). The most extensive study is that of Vandaele et al. (1998), coveringthe wavelength range 238–1000 nm at 220 K and 294 K. It is in excellent agreement with a number of other high resolutionstudies. At temperatures close to 298 K the data of Vandaele et al. (1996; 1998), Merienne et al. (1995) and Yoshino etal. (1997) all lie within± 2% over most of the wavelength range covered by their measurements. All of the studies appearto be less reliable at the extremes of the wavelength range covered by each of them but there is sufficient overlap for thisgroup of studies to provide a set of reliable cross-section data for the range 300–600 nm. The study of Burrows et al. (1998)
www.atmos-chem-phys.org/acp/4/1461/ Atmos. Chem. Phys., 4, 1461–1738, 2004
1606 R. Atkinson et al.: Evaluated kinetic and photochemical data for Ox, HOx, NOx and SOx
also gives values within∼2% of these studies and provides reliable medium resolution data for the 300–600 nm range. Atshorter wavelengths (200–300 nm) there are studies of Bass et al. (1976), Jenouvrier et al. (1996), Merienne et al. (1997) andSchneider et al. (1987). The studies of Jenouvrier et al. (1996) and Merienne et al. (1997) are in excellent agreement withthe high resolution studies at longer wavelengths where they overlap and are preferred for the 200–300 nm range. There areuncertainties in the wavelength calibration of Schneider et al. (1987), but the older data of Bass et al. (1976) are in reasonableagreement. Our recommended values for cross-sections are those given in the studies just described and are preferred to thosein the older studies of Schneider et al. (1987), Harwood and Jones (1994) and Davidson et al. (1988), which were the basis ofour previous recommendation, IUPAC (1997). The recommended spectra are too detailed for cross-sections for an extensivelisting here but 5 nm averaged cross-sections are given, taken from the studies of Merienne et al. (1995; 1997), Coquart etal. (1995) and Jenouvrier et al. (1996). These latter studies suffer a little from undersampling at high resolution but are in goodagreement with the recommended high resolution studies. For more detailed spectra the original papers should be consulted;in most cases detailed spectra are available from the authors.
Studies at temperatures down to 220 K (Coquart et al., 1995; Harder et al., 1997; Merienne et al., 1997; Vandaele et al.,1998; Harwood and Jones, 1994) have shown that the effect of lowering the temperature is to increase the sharpness of thestructural features of the spectrum. There are no shifts in wavelength observed and those reported by Schneider et al. (1987)and Davidson et al. (1988) may have been due to small calibration errors. At 220 K the data of Vandaele et al. (1998), Coquartet al. (1995) and Merienne et al. (1997) agree to within∼ 2.5% in the regions where they overlap. The data of Harder etal. (1997) are in good agreement with these other studies over most of their wavelength range but show large deviations atlonger wavelengths (> 500 nm). The data of Harwood and Jones (1994) are lower by between 5% and 10 % over most of theirrange but up to 20% lower at long wavelengths.
A significant pressure effect on the spectrum has also been observed in pure NO2 (0.026–1.3 mbar) (Vandaele et al., 1998)and in highly dilute NO2/N2 mixtures (6.6–790 mbar) (Harder et al., 1997). The publications of Vandaele et al. (1998) andHarder et al. (1997) should be consulted for details.
The preferred values of the quantum yields in our previous evaluation, IUPAC (1997) were those derived by Gardner etal. (1987), based on their own data and a critical assessment of the earlier studies of Jones and Bayes (1973), Davenport (1978)and Harker et al. (1977). The measurements of Roehl et al. (1994) are agreement with these recommendations. Since thesestudies, Troe (2000) has corrected the values of Gardner et al. (1987) and Roehl et al. (1994) for small, but significant effectsof secondary reactions and fluctuations of the specific rate constant. The values presented by Troe (2000) are adopted as ourpreferred values.
References
Bass, A. M., Ledford Jr., A. E. and Laufer, A. H.: J. Res. Natl. Bur. Stand. Sect. A, 80, 143, 1976.Burrows, J. P., Dehn, A., Deters, B., Himmelmann, S., Richter, A., Voigt, S. and Orphal, J.: J. Quant. Spectr. Rad. Trans., 60,1025, 1998.Calvert, J. G., Madronich, S., Gardner, E. P., Davidson, J., Cantrell, C. A. and Shetter, R. E.: J. Phys. Chem., 91, 6339, 1987.Coquart, B., Jenouvrier, A. and Merienne, M. F.: J. Atmos. Chem., 21, 251, 1995.Davenport, J. E.:“Determinations of NO2 photolysis parameters for stratospheric modelling”, Final Report FAA-EQ-78-14,FAA Washington, D.C., 1978.Davidson, J. A., Cantrell, C. A., McDaniel, A. H., Shetter, R. E., Gardner, E. P., Sperry, P. D. and Calvert, J. G.: J. Geophys.Res., 92, 6642, 1987.Harder, J. W., Brault, J. W., Johnston, P. V. and Mount, G. H.: J. Geophys. Res., 102, 3861, 1997.Harker, A. B., Ho, W. and Ratto, J. J.: Chem. Phys. Lett., 50, 394, 1977.Harwood, M. H. and Jones, R. L.: J. Geophys. Res., 99, 22 955, 1994.IUPAC, Supplement VI: J. Phys. Chem. Ref. Data, 26, 1329, 1997.Jenouvrier, A., Coquart, B. and Merienne, M. F.: J. Atmos. Chem., 25, 21, 1996.Jones, I. T. N. and Bayes, K. D.: J. Chem. Phys., 59, 4836, 1973.Madronich, S. and Calvert, J. G.: J. Geophys. Res., 93, 7105, 1988.Merienne, M. F., Jenouvrier, A. and Coquart, B.: J. Atmos. Chem., 20, 281, 1995.Merienne, M. F., Jenouvrier, A., Coquart, B. and Lux, J. P.: J. Atmos. Chem., 27, 219, 1997.Roehl, C. M., Orlando, J. J., Tyndall, G. S., Shetter, R. E., Vasquez, G. J., Cantrell, C. A. and Calvert, J. G.: J. Phys. Chem.,98, 7837, 1994.Schneider, W., Moortgat, G. K., Tyndall, G. S. and Burrows, J. P.: J. Photochem. Photobiol. A, 40, 195, 1987.Troe, J.: Zeit. Phys. Chem., 214, 573, 2000.
Atmos. Chem. Phys., 4, 1461–1738, 2004 www.atmos-chem-phys.org/acp/4/1461/

R. Atkinson et al.: Evaluated kinetic and photochemical data for Ox, HOx, NOx and SOx 1607
Vandaele, A. C., Hermans, C., Simon, P. C., Van Roozendael, M., Guilmot, J. M., Carleer, M. and Colin, R.: J. Atmos. Chem.,25, 289, 1996.Vandaele, A. C., Hermans, C., Simon, P. C., Carleer, M. Colin, R., Fally, S., Merienne, M. F., Jenouvrier, A. and Coquart, B.:J. Quant. Spectr. Rad. Trans., 59, 171, 1998.Yoshino, K., Esmond, J. R. and Parkinson, W. H.: Chem. Phys., 221, 169, 1997.
www.atmos-chem-phys.org/acp/4/1461/ Atmos. Chem. Phys., 4, 1461–1738, 2004

1608 R. Atkinson et al.: Evaluated kinetic and photochemical data for Ox, HOx, NOx and SOx
I.A3.69
NO3 + hν → products
Primary photochemical transitions
Reaction 1H ◦/kJ· mol−1 λthreshold/nm
NO3 + hν → NO + O2(36) (1) 10.8 11 080→ NO + O2(11) (2) 105 1139→ NO + O2(16) (3) 168 714→ NO2 + O(3P) (4) 204 587
Absorption cross-section data
Wavelength range/nm Reference Comments
400–700 Sander, 1986 (a)
Quantum yield data
Measurement Wavelength/nm Reference Comments
φ(NO + O2), φ4 570–635 Orlando et al., 1993 (b)
Comments
(a) Two methods were used to produce NO3. In one, NO3 radicals were generated from the flash photolysis of Cl2-ClONO2mixtures, with NO3 formation and ClONO2 loss being monitored by UV absorption. Measurements were made at 230,250, and 298 K. The value ofσ (NO3) at 662 nm and 298 K, determined by this method (2.28×10⁻¹⁷ cm2 molecule−1),was preferred by the author. The cross section was observed to increase as the temperature was lowered. NO3 was alsoproduced in a discharge flow system by the F + HNO3 reaction. The value ofσ (NO3) at 662 nm and 298 K determinedby this method was 1.83×10⁻¹⁷ cm2 molecule−1. Values ofσ (NO3) were tabulated for 1 nm intervals from 400 nm to700 nm for 298 K and 230 K.
(b) The photodissociation of NO3 was studied at 298 K using pulsed laser photolysis, with resonance fluorescence detectionof O(3P) atoms and NO(X25). φ[O(3P)] was 1.0 over the range 570–585 nm, decreasing to a value of< 0.1 at 635 nm.φ(NO) was< 0.1 at 580 nm and about 0.20± 0.1 at 590 nm. These data were combined with earlier results of Magnottaand Johnston (1980) to provide quantum yields ofφ(NO+O2) andφ(4) as a function of wavelength (586–639 nm) and tocalculate photolysis rates for overhead Sun at the earth’s surface, withJ (NO2 + O) = 0.19 s−1 andJ (NO + O2) = 0.016s−1.
Atmos. Chem. Phys., 4, 1461–1738, 2004 www.atmos-chem-phys.org/acp/4/1461/
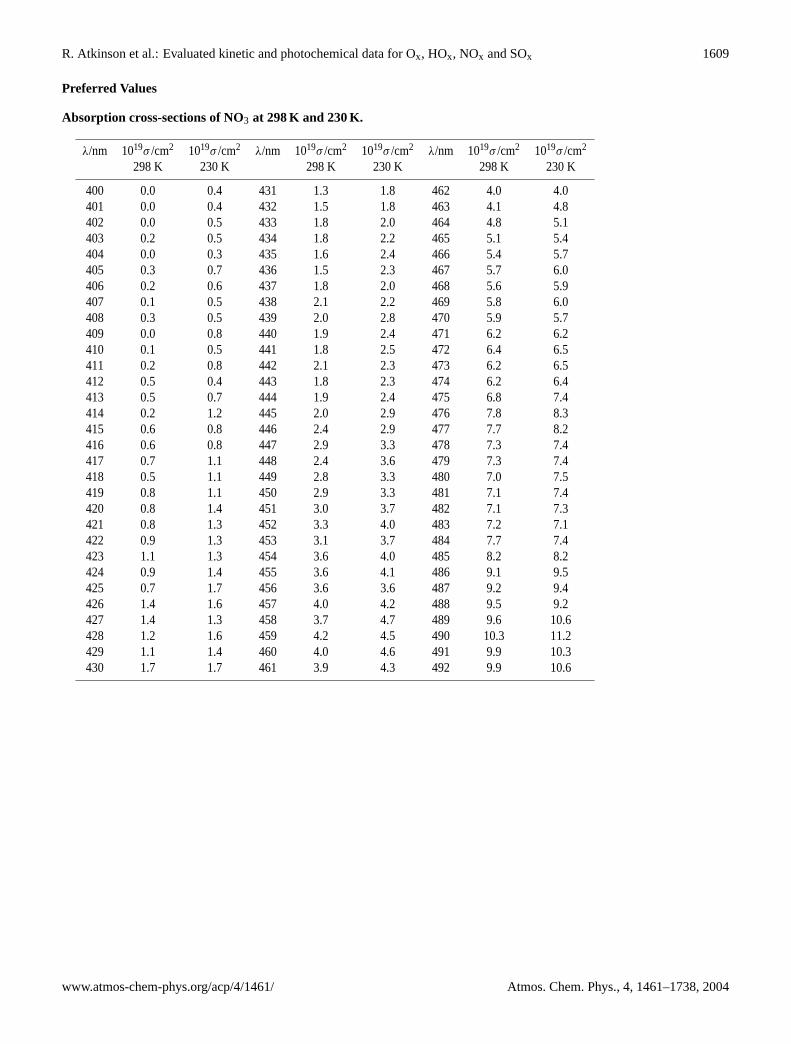
R. Atkinson et al.: Evaluated kinetic and photochemical data for Ox, HOx, NOx and SOx 1609
Preferred Values
Absorption cross-sections of NO3 at 298 K and 230 K.
λ/nm 1019σ /cm2 1019σ /cm2 λ/nm 1019σ /cm2 1019σ /cm2 λ/nm 1019σ /cm2 1019σ /cm2
298 K 230 K 298 K 230 K 298 K 230 K
400 0.0 0.4 431 1.3 1.8 462 4.0 4.0401 0.0 0.4 432 1.5 1.8 463 4.1 4.8402 0.0 0.5 433 1.8 2.0 464 4.8 5.1403 0.2 0.5 434 1.8 2.2 465 5.1 5.4404 0.0 0.3 435 1.6 2.4 466 5.4 5.7405 0.3 0.7 436 1.5 2.3 467 5.7 6.0406 0.2 0.6 437 1.8 2.0 468 5.6 5.9407 0.1 0.5 438 2.1 2.2 469 5.8 6.0408 0.3 0.5 439 2.0 2.8 470 5.9 5.7409 0.0 0.8 440 1.9 2.4 471 6.2 6.2410 0.1 0.5 441 1.8 2.5 472 6.4 6.5411 0.2 0.8 442 2.1 2.3 473 6.2 6.5412 0.5 0.4 443 1.8 2.3 474 6.2 6.4413 0.5 0.7 444 1.9 2.4 475 6.8 7.4414 0.2 1.2 445 2.0 2.9 476 7.8 8.3415 0.6 0.8 446 2.4 2.9 477 7.7 8.2416 0.6 0.8 447 2.9 3.3 478 7.3 7.4417 0.7 1.1 448 2.4 3.6 479 7.3 7.4418 0.5 1.1 449 2.8 3.3 480 7.0 7.5419 0.8 1.1 450 2.9 3.3 481 7.1 7.4420 0.8 1.4 451 3.0 3.7 482 7.1 7.3421 0.8 1.3 452 3.3 4.0 483 7.2 7.1422 0.9 1.3 453 3.1 3.7 484 7.7 7.4423 1.1 1.3 454 3.6 4.0 485 8.2 8.2424 0.9 1.4 455 3.6 4.1 486 9.1 9.5425 0.7 1.7 456 3.6 3.6 487 9.2 9.4426 1.4 1.6 457 4.0 4.2 488 9.5 9.2427 1.4 1.3 458 3.7 4.7 489 9.6 10.6428 1.2 1.6 459 4.2 4.5 490 10.3 11.2429 1.1 1.4 460 4.0 4.6 491 9.9 10.3430 1.7 1.7 461 3.9 4.3 492 9.9 10.6
www.atmos-chem-phys.org/acp/4/1461/ Atmos. Chem. Phys., 4, 1461–1738, 2004
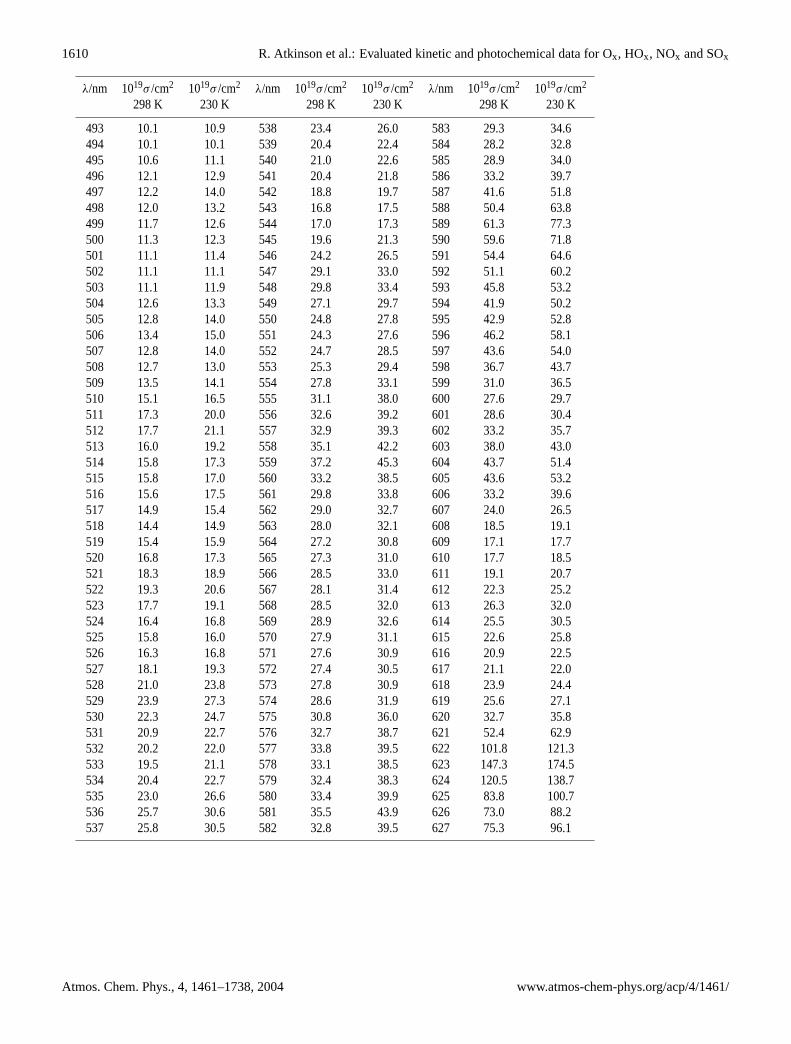
1610 R. Atkinson et al.: Evaluated kinetic and photochemical data for Ox, HOx, NOx and SOx
λ/nm 1019σ /cm2 1019σ /cm2 λ/nm 1019σ /cm2 1019σ /cm2 λ/nm 1019σ /cm2 1019σ /cm2
298 K 230 K 298 K 230 K 298 K 230 K
493 10.1 10.9 538 23.4 26.0 583 29.3 34.6494 10.1 10.1 539 20.4 22.4 584 28.2 32.8495 10.6 11.1 540 21.0 22.6 585 28.9 34.0496 12.1 12.9 541 20.4 21.8 586 33.2 39.7497 12.2 14.0 542 18.8 19.7 587 41.6 51.8498 12.0 13.2 543 16.8 17.5 588 50.4 63.8499 11.7 12.6 544 17.0 17.3 589 61.3 77.3500 11.3 12.3 545 19.6 21.3 590 59.6 71.8501 11.1 11.4 546 24.2 26.5 591 54.4 64.6502 11.1 11.1 547 29.1 33.0 592 51.1 60.2503 11.1 11.9 548 29.8 33.4 593 45.8 53.2504 12.6 13.3 549 27.1 29.7 594 41.9 50.2505 12.8 14.0 550 24.8 27.8 595 42.9 52.8506 13.4 15.0 551 24.3 27.6 596 46.2 58.1507 12.8 14.0 552 24.7 28.5 597 43.6 54.0508 12.7 13.0 553 25.3 29.4 598 36.7 43.7509 13.5 14.1 554 27.8 33.1 599 31.0 36.5510 15.1 16.5 555 31.1 38.0 600 27.6 29.7511 17.3 20.0 556 32.6 39.2 601 28.6 30.4512 17.7 21.1 557 32.9 39.3 602 33.2 35.7513 16.0 19.2 558 35.1 42.2 603 38.0 43.0514 15.8 17.3 559 37.2 45.3 604 43.7 51.4515 15.8 17.0 560 33.2 38.5 605 43.6 53.2516 15.6 17.5 561 29.8 33.8 606 33.2 39.6517 14.9 15.4 562 29.0 32.7 607 24.0 26.5518 14.4 14.9 563 28.0 32.1 608 18.5 19.1519 15.4 15.9 564 27.2 30.8 609 17.1 17.7520 16.8 17.3 565 27.3 31.0 610 17.7 18.5521 18.3 18.9 566 28.5 33.0 611 19.1 20.7522 19.3 20.6 567 28.1 31.4 612 22.3 25.2523 17.7 19.1 568 28.5 32.0 613 26.3 32.0524 16.4 16.8 569 28.9 32.6 614 25.5 30.5525 15.8 16.0 570 27.9 31.1 615 22.6 25.8526 16.3 16.8 571 27.6 30.9 616 20.9 22.5527 18.1 19.3 572 27.4 30.5 617 21.1 22.0528 21.0 23.8 573 27.8 30.9 618 23.9 24.4529 23.9 27.3 574 28.6 31.9 619 25.6 27.1530 22.3 24.7 575 30.8 36.0 620 32.7 35.8531 20.9 22.7 576 32.7 38.7 621 52.4 62.9532 20.2 22.0 577 33.8 39.5 622 101.8 121.3533 19.5 21.1 578 33.1 38.5 623 147.3 174.5534 20.4 22.7 579 32.4 38.3 624 120.5 138.7535 23.0 26.6 580 33.4 39.9 625 83.8 100.7536 25.7 30.6 581 35.5 43.9 626 73.0 88.2537 25.8 30.5 582 32.8 39.5 627 75.3 96.1
Atmos. Chem. Phys., 4, 1461–1738, 2004 www.atmos-chem-phys.org/acp/4/1461/

R. Atkinson et al.: Evaluated kinetic and photochemical data for Ox, HOx, NOx and SOx 1611
λ/nm 1019σ /cm2 1019σ /cm2 λ/nm 1019σ /cm2 1019σ /cm2 λ/nm 1019σ /cm2 1019σ /cm2
298 K 230 K 298 K 230 K 298 K 230 K
628 73.7 94.3 649 5.4 5.3 670 9.5 11.2629 69.8 90.3 650 5.0 5.0 671 7.9 9.4630 67.6 89.7 651 5.5 5.6 672 7.6 9.7631 48.4 61.0 652 6.1 6.6 673 6.4 8.1632 32.7 39.8 653 7.1 7.9 674 5.2 6.3633 21.7 25.1 654 8.2 9.2 675 4.8 5.5634 16.4 17.3 655 9.8 11.0 676 4.9 5.2635 14.4 14.0 656 13.3 14.4 677 5.9 6.2636 16.9 16.2 657 17.1 18.5 678 7.5 7.2637 20.7 20.1 658 24.2 25.9 679 7.8 7.3638 20.3 18.9 659 40.7 42.7 680 6.9 6.4639 15.8 14.2 660 74.5 79.0 681 5.3 5.3640 12.3 11.3 661 144.8 167.5 682 4.0 4.4641 10.0 9.5 662 210.0 266.9 683 3.0 3.2642 9.2 8.4 663 174.4 229.7 684 2.6 2.8643 9.7 8.1 664 112.9 145.5 685 1.8 2.4644 9.5 8.4 665 74.1 92.9 686 1.6 1.5645 8.6 8.0 666 49.6 62.9 687 1.2 2.3646 7.5 6.9 667 30.4 37.4 688 1.2 2.0647 7.0 6.8 668 19.0 23.3 689 1.2 1.9648 6.2 6.3 669 12.5 14.5 690 1.0 2.1
Quantum Yields at 298 K
φ4 = 1.0 forλ ≤ 587 nm.
Comments on Preferred Values
The preferred values of the absorption cross-sections are based on the data of Sander (1986) and are obtained by normalizingthe experimental values of Sander in the range 400–691 nm to the value of 2.1×10⁻¹⁷ cm2 molecule−1 for the peak value at662 nm. This peak value is adopted from the evaluation of Wayne et al. (1991). The measurements of Yokelson et al. (1994),made over the range 440–720 nm, which supersede previous data from the same laboratory (Ravishankara and Maudlin, 1986),are in good agreement with the data of Sander (1986).
There is also good agreement between the studies of Sander (1986) and of Yokelson et al. (1994) on the temperature depen-dence of the cross-sections, which were studied over the range 230–298 K by Sander (1986) and 200–298 K by Yokelson etal. (1994). A significant increase in cross-section is found as temperature is lowered, in contrast to the findings of Cantrell etal. (1987), who found temperature change to have little effect. To obtain the temperature dependence of the band at 662 nm,the value ofσ at 230 K obtained by Sander (1986) is accepted and combined with the preferred value at 298 K to giveσ(T ) ={4.59×10⁻¹⁷
−(8.37×10⁻²⁰T )} cm2 molecule−1 at 662 nm.The measurements of Orlando et al. (1993) confirm qualitatively the wavelength dependence ofφ(NO + O2) andφ4 observed
in the earlier room temperature measurements of Magnotta and Johnston (1980), and provide more accurate values forφ4. Theearlier problem (Magnotta and Johnston, 1980) of quantum yields in excess of 1.4 was not encountered in the work of Orlandoet al. (1993), which confirms that NO3 radical dissociation is exclusively to NO2 + O(3P) at wavelengths less than 587 nm.
A molecular beam study of Davis et al. (1993) has provided considerable insight into the photodissociation of the NO3radical. There is a very sharp threshold for channel (4) at 587 nm for cold NO3 and any dissociation at longer wavelengths viachannel (4) must occur from internally excited NO3. At λ ≥ 588 nm this process competes with photodissociation of NO3 toform NO + O2 via a three-centre transition state from the vibrationally excited ground state. The yield from this process fallsoff above 600 nm and may only occur from hot band absorption above 605 nm. These facts imply that the branching ratiofor bulk, thermally equilibrated NO3 radicals will depend very strongly on temperature, especially near the threshold for theNO2-forming channel, where higher temperatures will tend to favour the simple bond fission, channel (4).
www.atmos-chem-phys.org/acp/4/1461/ Atmos. Chem. Phys., 4, 1461–1738, 2004

1612 R. Atkinson et al.: Evaluated kinetic and photochemical data for Ox, HOx, NOx and SOx
Using the measured energy thresholds from the molecular beam experiments, Johnston et al. (1996) have modelled prod-uct yields from the excited NO3 resulting from photon absorption. The have calculated values ofφ(NO), φ(NO2), andφ(fluorescence) as a function of wavelength in the range 401–690 nm at temperatures of 190, 230, and 298 K. The valuesat 298 K agree well with the experimental findings of Orlando et al. (1993), with only some departures forφ(NO2) in the605–620 nm region.
On the basis of their measured quantum yields, Orlando et al. (1993) have suggested photodissociation rates at the earth’ssurface, for an overhead sun and the wavelength range 400–700 nm, ofJ (NO2 + O) = 0.19 s−1 andJ (NO + O2) = 0.016 s−1.These are preferred for atmospheric calculations. The experimental values of Magnotta and Johnston (1980) are in agreement,and the calculations of Johnston et al. (1996) also provide support for these photodissociation rates.
The information from the molecular beam experiments of Davis et al. (1993) dictates that these values ofJ only apply fortemperatures close to room temperature. Calculated values are available for lower temperatures, but further measurements ofthe quantum yields for NO3 radical photolysis in bulk samples at lower temperatures are required before recommendations canbe made for atmospheric photolysis rates at stratospheric temperatures.
References
Cantrell, C. A., Davidson, J. A., Shetter, R. E., Anderson, B. A. and Calvert, J.G.: J. Phys. Chem., 91, 5858, 1987.Davis, H. F., Kim, B., Johnston, H. S. and Lee, Y. T.: J. Phys. Chem., 97, 2172, 1993.Johnston, H. S., Davis, H. S. and Lee, Y. T.: J. Phys. Chem., 100, 4713, 1996.Magnotta, F. and Johnston, H. S.: Geophys. Res. Lett., 7, 769, 1980.Orlando, J. J., Tyndall, G. S., Moortgat, G. K. and Calvert, J. G.: J. Phys. Chem., 97, 10 996, 1993.Ravishankara, A. R. and Mauldin III, R. L.: J. Geophys. Res., 91, 8709, 1986.Sander, S. P.: J. Phys. Chem. 90, 4135, 1986.Wayne, R. P., Barnes, I., Biggs, P., Burrows, J. P., Canosa-Mas, C. E., Hjorth, J., Bras, G. Le, Moortgat, G. K., Perner, D.,Poulet, G., Restelli, G. and Sidebottom, H.: Atmos. Environ., 25A, 1, 1991.Yokelson, R. K., Burkholder, J. B., Fox, R. W., Talukdar, R. K. and Ravishankara, A. R.: J. Phys. Chem., 98, 13 144, 1994.
Atmos. Chem. Phys., 4, 1461–1738, 2004 www.atmos-chem-phys.org/acp/4/1461/

R. Atkinson et al.: Evaluated kinetic and photochemical data for Ox, HOx, NOx and SOx 1613
I.A3.70
N2O + hν → products
Primary photochemical transitions
Reaction 1H ◦/kJ · mol−1 λthreshold/nm
N2O + hν → N2 + O(3P) (1) 161 742→ N2 + O(1D) (2) 351 341→ N + NO (3) 483 248→ N2 + O(1S) (4) 568 211
Absorption cross-section data
Wavelength range/nm Reference Comments
173–240 Selwyn et al., 1977 (a)
Quantum yield data
Measurement Wavelength/nm Reference Comments
φ(-N2O) = 2.0 184.9 Greiner, 1967 (b)φ(NO) = 1.0 184.9φ(O2) = 0.5 184.9φ1 ≤ 0.03 214 Paraskevopoulos and Cvetanovic, 1969 (c)φ3 ≤ 0.01 185–230 Preston and Barr, 1971 (d)
Comments
(a) Measured at five temperatures from 194 K to 302 K, with a resolution of 0.7 nm. Values were tabulated at 1 nm intervals.A nine parameter fit expressingσ as a function ofλ andT was also given.
(b) N2O was photolyzed at 184.9 nm in a static system at temperatures in the range 299–301 K. Analysis for N2O, NO, andO2 was carried out by mass-spectrometry. No other products were observed but the analysis system was not sensitive toNO2. Pressure was varied in the range 5.3–285 mbar (4–214 Torr) of N2O. From the results obtained in this and otherstudies, it was concluded thatφ(−N2O) = 2.0,φ(NO) = 1.0, andφ(O2) = 0.5 over the range 138–210 nm.
(c) N2O was photolyzed at 298 K in the presence of neopentane, 1-butene, and added inert gases. The yield of O(3P) atomswas determined from the yield of addition products formed with 1-butene.
(d) N2O containing 1%15NO was photolyzed at 296 K andλ = 185 nm, 214 nm, and 229 nm. The isotopic composition ofthe N2 produced was measured.
www.atmos-chem-phys.org/acp/4/1461/ Atmos. Chem. Phys., 4, 1461–1738, 2004

1614 R. Atkinson et al.: Evaluated kinetic and photochemical data for Ox, HOx, NOx and SOx
Preferred Values
Absorption cross-sections of N2O at 298 K
λ/nm 1020σ /cm2 λ/nm 1020σ /cm2
175 12.6 210 0.755180 14.6 215 0.276185 14.3 220 0.092190 11.1 225 0.030195 7.57 230 0.009200 4.09 235 0.003205 1.95 240 0.001
Temperature dependence of absorption cross section
ln σ(λ, T ) = A1 + A2λ + A3λ2+ A4λ
3+ A5λ
4 + (T – 300)exp(B1 + B2λ + B3λ2 + B4λ
3)
where
A1 = 68.21023 B1 = 123.4014A2 = −4.071805 B2 = −2.116255A3 = 4.301146×10⁻² B3 = 1.111572×10⁻²
A4 = −1.777846×10⁻⁴ B4 = −1.881058×10⁻⁵
A5 = 2.520672×10⁻⁷
for λ = 173–240 nm andT = 194–302 K.
Quantum Yields
φ2 = 1.0 forλ = 185–230 nm.
Comments on Preferred Values
The preferred absorption cross-section and the expression for lnσ(λ, T ) are from Selwyn et al. (1977) These cross-sectionvalues have been confirmed both at room temperature and at 208 K by the studies of Hubrich and Stuhl (1980) and Merienneet al. (1990), who also determined the temperature dependence.
The preferred value of the quantum yield is based on the studies of Greiner (1967), Parakevopoulos and Cvetanovic (1969),and Preston and Barr (1971). Greenblatt and Ravishankara (1993) have also measured the quantum yield for production ofNO(25) and N(4S) atoms at 193 nm to be< 8×10⁻³.
Other relevant spectroscopic studies are those of Yoshino et al. (1984), who made high-resolution room temperature cross-section measurements in the 170–222 nm range, and of Lee and Suto (1984) who measured the photoabsorption and fluores-cence cross-sections in the 106–160 nm region.
The UV absorption spectrum of the heavier isotopomers of N2O (15N14NO, 14N15NO, 14N14N17O, 14N14N18O) are slightlyblue shifted due to their lower zero point energies and, as a result, are expected to be photolysed more slowly in the atmosphere.This is evident in the studies of Selwyn and Johnston (1981) who measured the absorption spectrum of N2O and its15N isotopicforms over the wavelength range 172–197 nm and the temperature range 150–500 K. Isotopic fractionation is valuable as ameans of investigating N2O sources and sinks in the atmospheric cycle and, consequently, the isotope effect to be expectedfor the photolysis has been analysed by Yung and Miller (1997), and has been the subject a number of recent experimentalstudies (Rahn et al., 1998; Umemoto, 1999; Turatti et al., 2000; Roeckmann et al., 2000; Zhang et al., 2000), which should beconsulted for details.
State-resolved photofragment spectroscopy studies of N2O photodissociation at 193 nm (Springsteen et al., 1993) and 205nm (Hanisco and Kummel, 1990) show that 43% of the energy deposited in the molecule appears as translational energy of theO(1D) atom.
Atmos. Chem. Phys., 4, 1461–1738, 2004 www.atmos-chem-phys.org/acp/4/1461/
R. Atkinson et al.: Evaluated kinetic and photochemical data for Ox, HOx, NOx and SOx 1615
References
Greenblatt, G. D. and Ravishankara, A. R.: J. Geophys. Res., 95, 3539, 1993.Greiner, N. R.: J. Chem. Phys., 47, 4373, 1967.Hanisco, T. F. and Kummel, A. C.: J. Phys. Chem., 97, 3539, 1990Hubrich, C. and Stuhl, F.: J. Photochem., 12, 93, 1980.Lee, L. C. and Suto, M.: J. Chem. Phys., 80, 4718, 1984.Merienne, M. F., Coquart, B. and Jenouvrier, A.: Planet. Space Sci., 38, 617, 1990.Paraskevopoulos, G. and Cvetanovic, R. J.: J. Am. Chem. Soc., 91, 7572, 1969.Preston, K. F. and Barr, R. F.: J. Chem. Phys., 54, 3347, 1971.Rahn, T., Zhang, H., Wahlen, M. and Blake, G. A.: Geophys. Res. Lett., 25, 4489, 1998.Roeckmann, T., Brenninkmeijer, C. A. M., Wollenhaupt, M., Crowley, J. N. and Crutzen, P. J.: Geophys. Res. Lett., 27, 1399,2000.Selwyn, G., Podolske, J. and Johnston, H. S.: Geophys. Res. Lett. 4, 427, 1977.Selwyn, G. S. and Johnston, H. S.: J. Chem. Phys., 74, 3791, 1981.Springsteen, L. L., Satyapal, S., Matsumi, Y., Dobeck, L. M. and Houston, P. L.: J. Phys. Chem., 97, 7239, 1993.Turatti, F., Griffith, D. W. T., Wilson, S. R., Besler, M., Rahn, T., Umemoto, H.: Chem. Phys. Lett., 314, 267, 1999.Yoshino, K., Freemen, D. E. and Parkinson, W. H.: Planet. Space Sci., 32, 1219, 1984.Yung, Y. L. and Miller, C. E.: Science, 278, 1778, 1997.Zhang, H. and Blake, G. A.: Geophys. Res. Lett., 27, 2489, 2000.Zhang, H., Wennberg, P. O., Wu, V. H. and Blake, G. A.: Geophys. Res. Lett., 27, 2481, 2000.
www.atmos-chem-phys.org/acp/4/1461/ Atmos. Chem. Phys., 4, 1461–1738, 2004
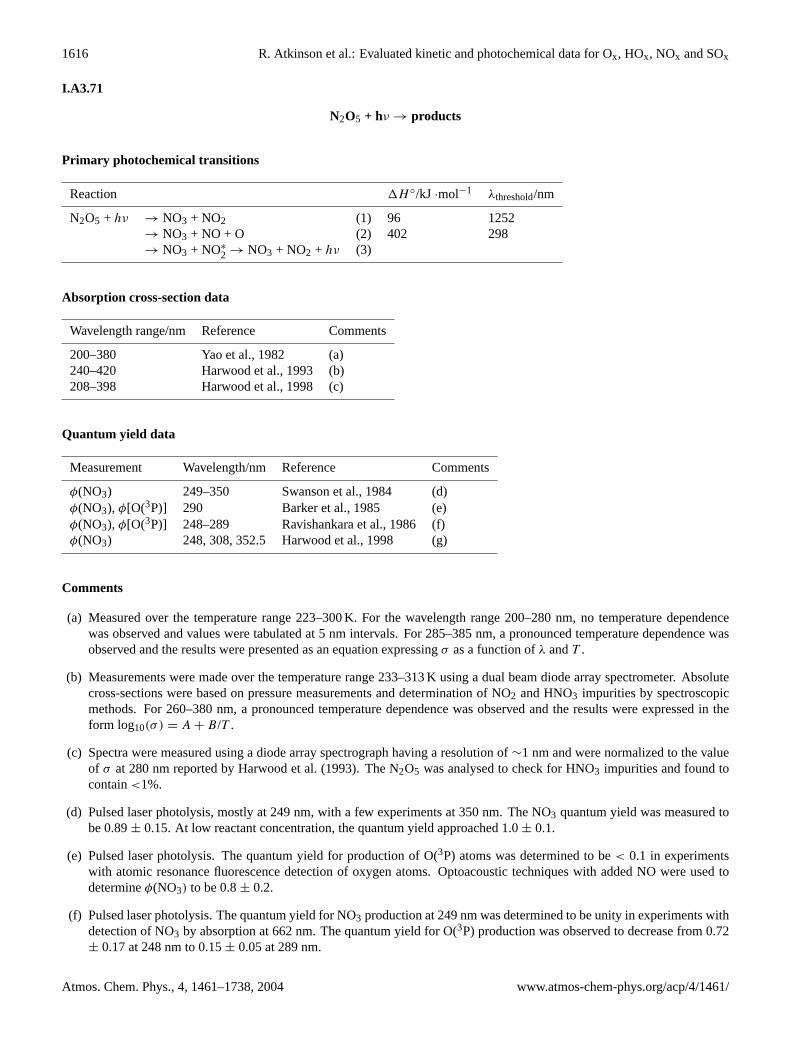
1616 R. Atkinson et al.: Evaluated kinetic and photochemical data for Ox, HOx, NOx and SOx
I.A3.71
N2O5 + hν → products
Primary photochemical transitions
Reaction 1H ◦/kJ ·mol−1 λthreshold/nm
N2O5 + hν → NO3 + NO2 (1) 96 1252→ NO3 + NO + O (2) 402 298→ NO3 + NO∗
2 → NO3 + NO2 + hν (3)
Absorption cross-section data
Wavelength range/nm Reference Comments
200–380 Yao et al., 1982 (a)240–420 Harwood et al., 1993 (b)208–398 Harwood et al., 1998 (c)
Quantum yield data
Measurement Wavelength/nm Reference Comments
φ(NO3) 249–350 Swanson et al., 1984 (d)φ(NO3), φ[O(3P)] 290 Barker et al., 1985 (e)φ(NO3), φ[O(3P)] 248–289 Ravishankara et al., 1986 (f)φ(NO3) 248, 308, 352.5 Harwood et al., 1998 (g)
Comments
(a) Measured over the temperature range 223–300 K. For the wavelength range 200–280 nm, no temperature dependencewas observed and values were tabulated at 5 nm intervals. For 285–385 nm, a pronounced temperature dependence wasobserved and the results were presented as an equation expressingσ as a function ofλ andT .
(b) Measurements were made over the temperature range 233–313 K using a dual beam diode array spectrometer. Absolutecross-sections were based on pressure measurements and determination of NO2 and HNO3 impurities by spectroscopicmethods. For 260–380 nm, a pronounced temperature dependence was observed and the results were expressed in theform log10(σ ) = A + B/T .
(c) Spectra were measured using a diode array spectrograph having a resolution of∼1 nm and were normalized to the valueof σ at 280 nm reported by Harwood et al. (1993). The N2O5 was analysed to check for HNO3 impurities and found tocontain<1%.
(d) Pulsed laser photolysis, mostly at 249 nm, with a few experiments at 350 nm. The NO3 quantum yield was measured tobe 0.89± 0.15. At low reactant concentration, the quantum yield approached 1.0± 0.1.
(e) Pulsed laser photolysis. The quantum yield for production of O(3P) atoms was determined to be< 0.1 in experimentswith atomic resonance fluorescence detection of oxygen atoms. Optoacoustic techniques with added NO were used todetermineφ(NO3) to be 0.8± 0.2.
(f) Pulsed laser photolysis. The quantum yield for NO3 production at 249 nm was determined to be unity in experiments withdetection of NO3 by absorption at 662 nm. The quantum yield for O(3P) production was observed to decrease from 0.72± 0.17 at 248 nm to 0.15± 0.05 at 289 nm.
Atmos. Chem. Phys., 4, 1461–1738, 2004 www.atmos-chem-phys.org/acp/4/1461/

R. Atkinson et al.: Evaluated kinetic and photochemical data for Ox, HOx, NOx and SOx 1617
(g) Pulsed laser photolysis at 248 nm, 308 nm, or 352.5 nm with [NO3] monitored by absorption at 661.9 nm. At each of thethree photolysis wavelengths two different actinometric methods were used to establish the laser fluence for calculating thequantum yield. Values ofφ(NO3) obtained were: at 248 nm (0.67±0.14, 0.64±0.08); at 308 nm (0.88±0.10, 1.03±0.10);at 352.5 nm (0.91±0.04, 1.21±0.04). The quantum yields were independent of pressure over the range 200–800 mbar(150–600 Torr).
Preferred Values
Absorption cross-sections of N2O5 at 298 K
λ/nm 1020σ /cm2 B/K λ/nm 1020σ /cm2 B/K
210 470 315 1.62 −0.253215 316 320 1.21 −0.294220 193 325 0.89 −0.338225 128 330 0.67 −0.388230 91 335 0.50 −0.409235 73 340 0.38 −0.492240 60 345 0.279 −0.530245 51 350 0.215 −0.583250 40 355 0.164 −0.719255 32 360 0.124 −0.770260 25.9 −0.091 365 0.091 −0.801265 20.4 −0.100 370 0.072 −0.885270 16.4 −0.104 375 0.053 −0.765275 13.2 −0.112 380 0.041 −0.992280 11.1 −0.112 385 0.032 −0.992285 8.59 −0.126 390 0.0228 −0.949290 6.71 −0.135 395 0.0171 −0.845295 5.11 −0.152 400 0.0138 −0.966300 3.87 −0.170 405 0.0103 −1.00305 2.91 −0.194 410 0.0080 −1.16310 2.17 −0.226
Temperature dependence: log10σT (cm2 molecule−1) = log10σ298 + 1000B(1/T −1/298).
Quantum Yields at 298 K
λ/nm φ(NO3) φ(O)
248 0.8 0.72266 0.38287 0.21289 0.15300 1.0350 1.0
Comments on Preferred Values
The absorption cross sections reported by Harwood et al. (1993) are in excellent agreement with the earlier data of Yao etal. (1982) and the more recent values obtained by Harwood et al. (1998) at wavelengths> 240 nm. At wavelengths shorterthan 240 nm the values obtained by Harwood et al. (1998) are lower than those of Yao et al. (1982), the divergence between thetwo studies increasing with decreasing wavelength so that at 210 nm the absorption cross-section obtained by Yao et al. (1982)is ∼ 50% greater than that of Harwood et al. (1998). The preferred values for the cross-sections at 298 K were obtained by
www.atmos-chem-phys.org/acp/4/1461/ Atmos. Chem. Phys., 4, 1461–1738, 2004
1618 R. Atkinson et al.: Evaluated kinetic and photochemical data for Ox, HOx, NOx and SOx
averaging the values obtained by Yao et al. (1982), Harwood et al. (1993) and Harwood et al. (1998) forλ ≥ 240 nm andaveraging those of Yao et al. (1982) and Harwood et al. (1998) in the range 210–240 nm.
The temperature dependences of the cross-sections measured by Harwood et al. (1993) agree well with the values obtainedby Yao et al. (1982), except at the longer wavelengths where the results in the former study show a slightly larger dependence.Thus, using the expressions for the temperature dependence and theA values given in the two studies, theσ values calculatedat 380 nm differ by about 30%. The preferred values of the temperature coefficients are taken from Harwood et al. (1993).
The quantum yields for NO3 and O atom formation have been measured at a number of wavelengths in the range 248–352.5nm. The preferred value ofφ(NO3) =1.0 at 300 nm and 350 nm are based on the results of Swanson et al. (1984) at 350 nm,Barker et al. (1985) at 290 nm, and Harwood et al. (1998) at 308 nm and 352.5 nm, which agree within the fairly substantialerror limits. The value ofφ(NO3) at wavelengths below 300 nm is less certain. A quantum yield close to unity has beenreported by Swanson et al. (1984) at 249 nm and by Ravishankara et al. (1986) over the range 248–289 nm, but the recentstudy of Harwood et al. (1998) suggests a substantially lower value at 248 nm. Our preferred value of 0.8, with suggested errorlimits of at least 10%, reflects the findings of all of these studies (Harwood et al., 1998; Swanson et al., 1984; Ravishankara etal., 1986).
The preferred quantum yields for O atom production are those reported by Ravishankara et al. (1986). Barker et al. (1985)also report a quantum yield for O atom production of< 0.1 at 290 nm in agreement with the findings of Ravishankara etal. (1986) thatφ(O) is substantial at 248 nm but decreases with increasing wavelength, approaching zero in the neighbourhoodof the thermodynamic threshold for O atom production at 298 nm.
The study of Oh et al. (1986) indicates that electronically excited NO2 in the2B1 state is produced, and photolysis inducedfluorescence (PIF) quantum yield values are reported.
References
Barker, J. R., Brouwer, J., Patrick, R., Rossi, M. J., Trevor, P. L. and Golden, D. M.: Int. J. Chem. Kinet., 17, 991, 1985.Harwood, M. H., Jones, R. L., Cox, R. A., Lutman, E. and Rattigan, O. V.: J. Photochem. Photobiol. A, 73, 167, 1993.Harwood, M. H., Burkholder, J. B. and Ravishankara, A. R.: J. Phys. Chem. A, 102, 1309, 1998.Oh, D., Sisk, W., Young, A. and Johnston, H. S.: J. Chem. Phys., 85, 7146, 1986.Ravishankara, A. R., Wine, P. H., Smith, C. A., Barbone, P. E. and Torabi, A.: J. Geophys. Res., 91, 5355, 1986.Swanson, D., Kan, B. and Johnston, H. S.: J. Phys. Chem., 88, 3115, 1984.Yao, F., Wilson, I. and Johnston, H. S.: J. Phys. Chem., 86, 3611, 1982.
Atmos. Chem. Phys., 4, 1461–1738, 2004 www.atmos-chem-phys.org/acp/4/1461/
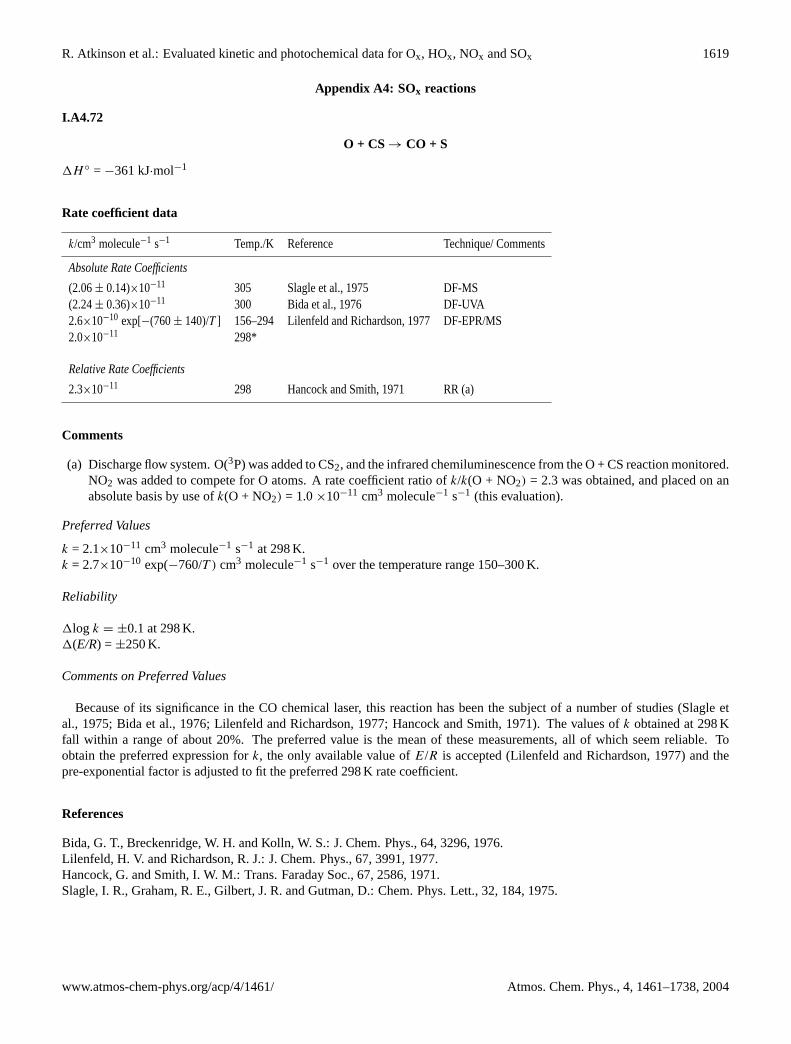
R. Atkinson et al.: Evaluated kinetic and photochemical data for Ox, HOx, NOx and SOx 1619
Appendix A4: SOx reactions
I.A4.72
O + CS→ CO + S
1H ◦ = −361 kJ·mol−1
Rate coefficient data
k/cm3 molecule−1 s−1 Temp./K Reference Technique/ Comments
Absolute Rate Coefficients
(2.06± 0.14)×10−11 305 Slagle et al., 1975 DF-MS(2.24± 0.36)×10−11 300 Bida et al., 1976 DF-UVA2.6×10−10 exp[−(760± 140)/T ] 156–294 Lilenfeld and Richardson, 1977 DF-EPR/MS2.0×10−11 298*
Relative Rate Coefficients
2.3×10⁻¹¹ 298 Hancock and Smith, 1971 RR (a)
Comments
(a) Discharge flow system. O(3P) was added to CS2, and the infrared chemiluminescence from the O + CS reaction monitored.NO2 was added to compete for O atoms. A rate coefficient ratio ofk/k(O + NO2) = 2.3 was obtained, and placed on anabsolute basis by use ofk(O + NO2) = 1.0×10⁻¹¹ cm3 molecule−1 s−1 (this evaluation).
Preferred Values
k = 2.1×10⁻¹¹ cm3 molecule−1 s−1 at 298 K.k = 2.7×10⁻¹⁰ exp(−760/T ) cm3 molecule−1 s−1 over the temperature range 150–300 K.
Reliability
1log k = ±0.1 at 298 K.1(E/R) = ±250 K.
Comments on Preferred Values
Because of its significance in the CO chemical laser, this reaction has been the subject of a number of studies (Slagle etal., 1975; Bida et al., 1976; Lilenfeld and Richardson, 1977; Hancock and Smith, 1971). The values ofk obtained at 298 Kfall within a range of about 20%. The preferred value is the mean of these measurements, all of which seem reliable. Toobtain the preferred expression fork, the only available value ofE/R is accepted (Lilenfeld and Richardson, 1977) and thepre-exponential factor is adjusted to fit the preferred 298 K rate coefficient.
References
Bida, G. T., Breckenridge, W. H. and Kolln, W. S.: J. Chem. Phys., 64, 3296, 1976.Lilenfeld, H. V. and Richardson, R. J.: J. Chem. Phys., 67, 3991, 1977.Hancock, G. and Smith, I. W. M.: Trans. Faraday Soc., 67, 2586, 1971.Slagle, I. R., Graham, R. E., Gilbert, J. R. and Gutman, D.: Chem. Phys. Lett., 32, 184, 1975.
www.atmos-chem-phys.org/acp/4/1461/ Atmos. Chem. Phys., 4, 1461–1738, 2004

1620 R. Atkinson et al.: Evaluated kinetic and photochemical data for Ox, HOx, NOx and SOx
I.A4.73
O + CH3SCH3 → CH3SO + CH3
1H ◦ = −133 kJ·mol−1
Rate coefficient data
k/cm3 molecule−1 s−1 Temp./K Reference Technique/Comments
Absolute Rate Coefficients
1.42×10⁻¹¹ exp[(366± 15)/T ] 268–424 Lee et al., 1976 FP-RF(4.84± 0.52)×10−11 2981.28×10−11 exp[(404± 30)/T ] 272–472 Lee et al., 1980 DF-RF(4.83± 0.46)×10−11 2961.11×10−11 exp[(460± 41)/T ] 296–557 Nip et al., 1981 (a)5.11×10⁻¹¹ 297
Comments
(a) O(3P) atoms were generated by the mercury-photosensitized photolysis of N2O using a sinusoidally-modulated mercurylamp, and monitored by NO2 chemiluminscence using a phase-shift technique.
Preferred Values
k = 5.0×10⁻¹¹ cm3 molecule−1 s−1 at 298 K.k = 1.3×10⁻¹¹ exp(409/T ) cm3 molecule−1 s−1 over the temperature range 270–560 K.
Reliability
1log k = ±0.1 at 298 K.1(E/R) = ±100 K.
Comments on Preferred Values
The data of Nip et al. (1981) are in excellent agreement, over the entire temperature range studied, with both of the studiesof Lee et al. (1976; 1980). The preferred values ofk at 298 K andE/R are obtained from a least-squares fit of the data fromthose three studies. The product study of Cvetanovic et al. (1981) suggests that at high pressures (0.39–1.58 bar) the reactionproceeds almost entirely by addition followed by rapid fragmentation to CH3 + CH3SO. A broad chemiluminescence spectrumin the range 240–460 nm from this reaction at 1.3 mbar (1 Torr) pressure has been reported by Pavanaja et al. (1994). Theyidentified the emitting species as electronically excited HO and SO2, and by numerical integration they showed that productionof these excited species is consistent with secondary chemistry following the initial reaction to give the products shown above.
References
Cvetanovic, R. J., Singleton, D. L. and Irwin, R. S.: J. Am. Chem. Soc., 103, 3530, 1981.Lee, J. H., Timmons, R. B. and Stief, L. J.: J. Chem. Phys., 64, 300, 1976.Lee, J. H., Tang, I. N. and Klemm, R. B.: J. Chem. Phys., 72, 1793, 1980.Nip, W. S., Singleton, D. L. and Cvetanovic, R. J.: J. Am. Chem. Soc., 103, 3526, 1981.Pavanaja, U. B., Upadhyaya, H. P., Sapre, A. V., Rama Rao, K. V. S. and Mittal, J. P.: J. Chem. Soc. Faraday Trans., 90, 825,1994.
Atmos. Chem. Phys., 4, 1461–1738, 2004 www.atmos-chem-phys.org/acp/4/1461/
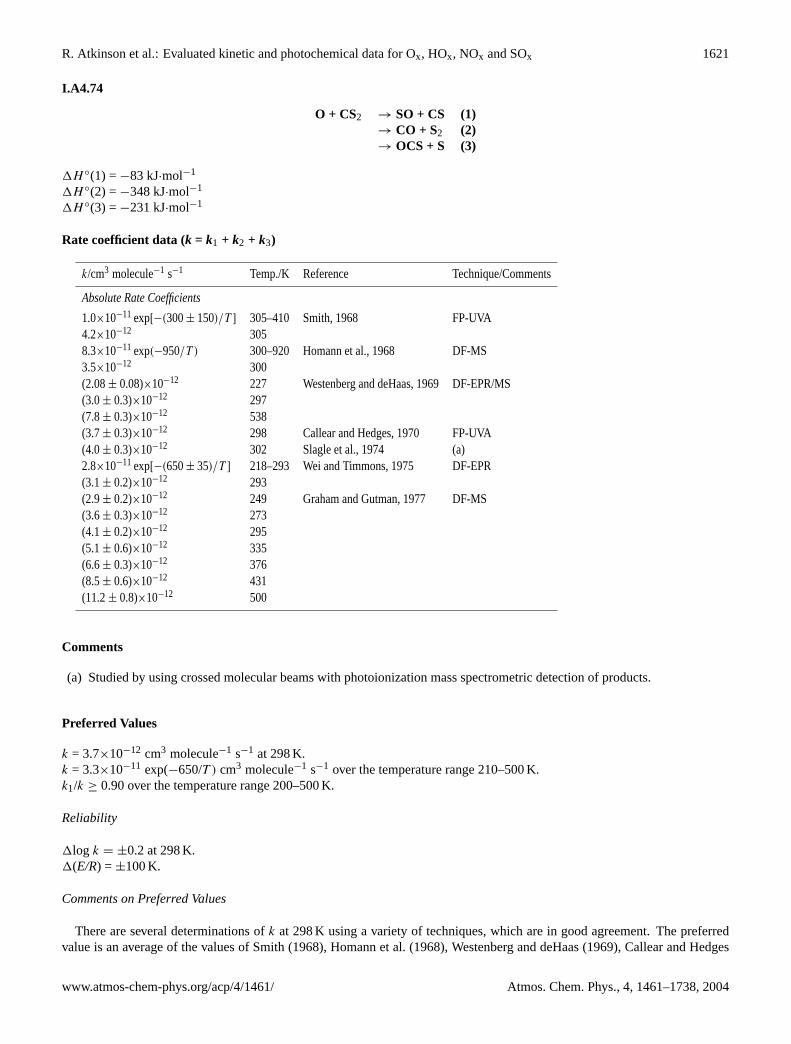
R. Atkinson et al.: Evaluated kinetic and photochemical data for Ox, HOx, NOx and SOx 1621
I.A4.74
O + CS2 → SO + CS (1)→ CO + S2 (2)→ OCS + S (3)
1H ◦(1) = −83 kJ·mol−1
1H ◦(2) = −348 kJ·mol−1
1H ◦(3) = −231 kJ·mol−1
Rate coefficient data (k = k1 + k2 + k3)
k/cm3 molecule−1 s−1 Temp./K Reference Technique/Comments
Absolute Rate Coefficients
1.0×10⁻¹¹ exp[−(300± 150)/T ] 305–410 Smith, 1968 FP-UVA4.2×10−12 3058.3×10−11 exp(−950/T ) 300–920 Homann et al., 1968 DF-MS3.5×10−12 300(2.08± 0.08)×10−12 227 Westenberg and deHaas, 1969 DF-EPR/MS(3.0± 0.3)×10−12 297(7.8± 0.3)×10−12 538(3.7± 0.3)×10−12 298 Callear and Hedges, 1970 FP-UVA(4.0± 0.3)×10−12 302 Slagle et al., 1974 (a)2.8×10⁻¹¹ exp[−(650± 35)/T ] 218–293 Wei and Timmons, 1975 DF-EPR(3.1± 0.2)×10−12 293(2.9± 0.2)×10−12 249 Graham and Gutman, 1977 DF-MS(3.6± 0.3)×10−12 273(4.1± 0.2)×10−12 295(5.1± 0.6)×10−12 335(6.6± 0.3)×10−12 376(8.5± 0.6)×10−12 431(11.2± 0.8)×10−12 500
Comments
(a) Studied by using crossed molecular beams with photoionization mass spectrometric detection of products.
Preferred Values
k = 3.7×10⁻¹² cm3 molecule−1 s−1 at 298 K.k = 3.3×10⁻¹¹ exp(−650/T ) cm3 molecule−1 s−1 over the temperature range 210–500 K.k1/k ≥ 0.90 over the temperature range 200–500 K.
Reliability
1log k = ±0.2 at 298 K.1(E/R) = ±100 K.
Comments on Preferred Values
There are several determinations ofk at 298 K using a variety of techniques, which are in good agreement. The preferredvalue is an average of the values of Smith (1968), Homann et al. (1968), Westenberg and deHaas (1969), Callear and Hedges
www.atmos-chem-phys.org/acp/4/1461/ Atmos. Chem. Phys., 4, 1461–1738, 2004
1622 R. Atkinson et al.: Evaluated kinetic and photochemical data for Ox, HOx, NOx and SOx
(1970), Slagle et al. (1974), Wei and Timmons (1975), and Graham and Gutman (1877). The preferred temperature coefficientis that of Wei and Timmons (1975), which is good agreement with that of Graham and Gutman (1977).
The reported values for the branching ratios show considerable scatter. Fork3/k values of 0.093 (Slagle et al., 1974), 0.096(Graham and Gutman, 1977), 0.015 (Hancock and Smith, 1971), 0.30 (Suart et al., 1972) and 0.085 (Cooper and Hershberger,1992) have been reported and fork2/k values of 0.05–0.20 (Slagle et al., 1974), 0.014 (Hsu et al., 1979) and 0.030 (Cooper andHershberger, 1992). Channel 1 is clearly the major channel but at this stage our only recommendation is thatk1/k ≥ 0.90.
References
Callear, A. B. and Hedges, R. E. M.: Trans. Faraday Soc., 66, 605, 1970.Cooper, W. F. and Hershberger, J. F.: J. Phys. Chem., 96, 5405, 1992.Graham, R. E. and Gutman, D.: J. Phys. Chem., 81, 207, 1977.Hancock, G. and Smith, I. W. M.: Trans. Faraday Soc., 67, 2586, 1971.Homann, K. H., Krome, G. and Wagner, H. Gg.: Ber. Bunsenges. Phys. Chem., 72, 998, 1968.Hsu, D. S. Y., Shaub, W. M., Burks, T. L. and Lin, M. C.: Chem. Phys. Lett., 44, 143, 1979.Slagle, I. R., Gilbert, J. R. and Gutman, D.: J. Chem. Phys., 61, 704, 1974.Smith, I. W. M.: Trans. Faraday Soc., 64, 378, 1968.Suart, R. D., Dawson, P. H. and Kimbell, G. H.: J. Appl. Phys., 43, 1022, 1972.Westenberg, A. A. and deHaas, N.: J. Chem. Phys., 50, 707, 1969.Wei, C. N. and Timmons, R. B.: J. Chem. Phys., 62, 3240, 1975.
Atmos. Chem. Phys., 4, 1461–1738, 2004 www.atmos-chem-phys.org/acp/4/1461/

R. Atkinson et al.: Evaluated kinetic and photochemical data for Ox, HOx, NOx and SOx 1623
I.A4.75
O + CH3SSCH3 → CH3SO + CH3S
1H ◦ = −167 kJ·mol−1
Rate coefficient data
k/cm3 molecule−1 s−1 Temp./K Reference Technique/Comments
Absolute Rate Coefficients
(2.12± 0.22)×10−10 270–329 Lee and Tang, 1980 DF-RF4.35×10−11 exp[(251± 61)/T ] 298–571 Nip et al., 1981 (a)(1.0± 0.3)×10−10 298
Comments
(a) O(3P) atoms were generated by the mercury-photosensitized photolysis of N2O using a sinusoidally-modulated mercurylamp, and monitored by NO2 chemiluminescence using a phase-shift technique.
Preferred Values
k = 1.5×10⁻¹⁰ cm3 molecule−1 s−1 at 298 K.k = 6.5×10⁻¹¹ exp(250/T ) cm3 molecule−1 s−1 over the temperature range 290–570 K.
Reliability
1log k = ±0.3 at 298 K.1(E/R) = ±100 K.
Comments on Preferred Values
The data of Nip et al. (1981), obtained using a modulated photolysis technique, are about a factor of 2 lower than thedata from the earlier discharge flow-resonance fluorescence study of Lee and Tang (1980), who reported no temperaturedependence over the rather limited range 270–329 K. The cause of the discrepancy between the two measurements is not clear.The preferred value at 298 K is an average of the values from the two studies (Nip et al., 1981, Lee and Tang, 1980). Thetemperature dependence is that from Nip et al. (1981) with theA factor adjusted to yield the preferred value at 298 K.
The product study of Cvetanovic et al. (1981) suggests that at high pressures, 0.39–1.58 bar, the reaction proceeds mainlyby addition followed by rapid fragmentation to CH3S + CH3SO. A broad chemiluminescence spectrum in the range 240–460nm from this reaction at 1.3 mbar (1 Torr) pressure has been reported by Pavanaja et al. (1994). They identified the emittingspecies as electronically excited HO and SO2, and showed from a computer simulation that production of these excited speciesis consistent with secondary chemistry following the initial reaction to give the products shown above.
References
Cvetanovic, R. J., Singleton, D. L. and Irwin, R. S.: J. Am. Chem. Soc., 103, 3530, 1981.Lee, J. H. and Tang, I. N.: J. Chem. Phys., 72, 5718, 1980.Nip, W. S., Singleton, D. L. and Cvetanovic, R. J.: J. Am. Chem. Soc., 103, 3526, 1981.Pavanaja, U. B., Upadhyaya, H. P., Sapre, A. V., Rama Rao, K. V. S. and Mittal, J. P.: J. Chem. Soc. Faraday Trans., 90, 825,1994.
www.atmos-chem-phys.org/acp/4/1461/ Atmos. Chem. Phys., 4, 1461–1738, 2004
1624 R. Atkinson et al.: Evaluated kinetic and photochemical data for Ox, HOx, NOx and SOx
I.A4.76
O + OCS → SO + CO (1)→ CO2 + S (2)
1H ◦(1) = −213 kJ·mol−1
1H ◦(2) = −224 kJ·mol−1
Rate coefficient data (k = k1 + k2)
k/cm3 molecule−1 s−1 Temp./K Reference Technique/Comments
Absolute Rate Coefficients
(9.1± 1.4)×10−15 298 Sullivan and Warneck, 1965 DF-MS2.0×10−10 exp(−2920/T ) 290–465 Hoyermann et al., 1967 DF-EPR1.2×10−14 3001.08×10−10 exp(−2770/T ) 300–1150 Homann et al., 1968 DF-MS1.1×10−14 3003.2×10−11 exp(−2280/T ) 273–808 Westenberg and deHaas, 1969 DF-EPR/MS(1.4± 0.1)×10−14 297(1.19± 0.06)×10−14 297 Breckenridge and Miller, 1972 DF-MS1.65×10−11 exp[−(2165± 30)/T ] 263–502 Klemm and Stief, 1974 FP-RF(1.2± 0.1)×10−14 2982.0×10−11 exp[−(2140± 40)/T ] 239–404 Wei and Timmons, 1975 DF-EPR(1.35± 0.13)×10−14 295(1.39± 0.14)×10−14 296 Manning et al., 1976 FP-RF(1.17± 0.12)×10−14 298 Yoshida and Saito, 1978 DF-A (a)
Comments
(a) SO radicals were monitored by microwave absorption at 13044 MHz.
Preferred Values
k = 1.2×10⁻¹⁴ cm3 molecule−1 s−1 at 298 K.k = 1.6×10⁻¹¹ exp(−2150/T ) cm3 molecule−1 s−1 over the temperature range 230–500 K.
Reliability
1log k = ±0.2 at 298 K.1(E/R) = ±150 K.
Comments on Preferred Values
The values obtained fork by a variety of techniques (Sullivan and Warneck, 1965; Hoyermann et al., 1967; Homann etal., 1968; Westenberg and deHaas, 1969; Breckenridge and Miller, 1972; Klemm and Stief, 1974; Wei and Timmons, 1975;Manning et al., 1976; Yoshida and Saito, 1978) are in excellent agreement over a wide range of temperatures and pressures(≤340 mbar). The available evidence suggests that at low temperatures the reaction proceeds by channel (1) and that channel(2) may only become significant at temperatures above 600 K.
Because of the possible enhancement of the rate by channel 2 at high temperatures, the recommended value ofE/R isthe mean of the values obtained in studies by Klemm and Stief (1974) and Wei and Timmons (1975) which were limited totemperatures below 502 K. The value ofk at 298 K is the mean of the values in Sullivan and Warneck (1965), Hoyermann etal. (1967), Homann et al. (1968), Westenberg and deHaas (1969), Breckenridge and Miller (1972), Klemm and Stief (1974),
Atmos. Chem. Phys., 4, 1461–1738, 2004 www.atmos-chem-phys.org/acp/4/1461/

R. Atkinson et al.: Evaluated kinetic and photochemical data for Ox, HOx, NOx and SOx 1625
Wei and Timmons (1975), Manning et al. (1976) and Yoshida and Saito (1978) and the pre-exponential factor is adjusted to fitthis value ofk and the recommended value ofE/R.
Approximate measurements ofk2/k1 are: 10−3 at 298 K (Dondes and Safrany, 1965) and 10−2 at 500 K (Homann et al.,1968). Studies of detailed dynamics of this reaction have been reported by Hsu et al. (1979), Nickolaisen et al. (1994) andChen et al. (1995).
References
Breckenridge, W. H. and Miller, T. A.: J. Chem. Phys., 56, 465, 1972.Chen, X., Wu, F. and Weiner, B. R.: Chem. Phys. Lett., 247, 313, 1995.Dondes, S. and Safrany, D.: reported in Rolfes, T. R., Reeves, R. R. and Harteck, P.: J. Phys. Chem., 69, 849, 1965.Homann, K. H., Krome, G. and Wagner, H. Gg.: Ber. Bunsenges. Phys. Chem., 72, 998, 1968.Hoyermann, K., Wagner, H. Gg. and Wolfrum, J.: Ber. Bunsenges. Phys. Chem., 71, 603, 1967.Hsu, D. S. Y., Shaub, W. M., Birks, T. L. and Lin, M. C.: Chem. Phys., 44, 143, 1979.Klemm, R. B. and Stief, L. J.: J. Chem. Phys., 61, 4900, 1974.Manning, R. G., Braun, W. and Kurylo, M. J.: J. Chem. Phys., 65, 2609, 1976.Nickolaisen, S. L., Veney, D. W. and Cartland, H. E.: J. Chem. Phys., 100, 4925, 1994.Sullivan, J. O. and Warneck, P.: Ber. Bunsenges. Phys. Chem., 69, 7, 1965.Wei, C. N. and Timmons, R. B.: J. Chem. Phys., 62, 3240, 1975.Westenberg, A. A. and deHaas, N.: J. Chem. Phys., 50, 707, 1969.Yoshida, N. and Saito, S.: Bull. Chem. Soc. Jpn., 51, 1635, 1978.
www.atmos-chem-phys.org/acp/4/1461/ Atmos. Chem. Phys., 4, 1461–1738, 2004

1626 R. Atkinson et al.: Evaluated kinetic and photochemical data for Ox, HOx, NOx and SOx
I.A4.77
O + SO2 + M→ SO3 + M
1H ◦ = −348.1 kJ·mol−1
Low-pressure rate coefficients
Rate coefficient data
k0/cm3 molecule−1 s−1 Temp./K Reference Technique/Comments
Absolute Rate Coefficients
3.1×10⁻³² exp(−1009/T ) [Ar] 299–400 Atkinson and Pitts, 1978 FP-CL (a)1.05×10⁻³³ [Ar] 2981.37×10−33 [N2] 298
Comments
(a) Flash photolysis technique with detection of O(3P) atoms by NO2 chemiluminescence. Relative efficiencies ofk(M=N2):k(M=Ar): k(M=SO2) = 1.0: 0.77: 6.9 were determined.
Preferred Values
k0 = 1.4×10⁻³³ [N2] cm3 molecule−1 s−1 at 298 K.k0 = 4.0×10⁻³² exp(−1000/T ) [N2] cm3 molecule−1 s−1 over the temperature range 200–400 K.
Reliability
1log k0 = ±0.3 at 300 K.1(E/R) = ±200 K over the temperature range 200–400 K.
Comments on Preferred Values
The preferred values are based on the absolute rate coefficient study of Atkinson and Pitts (1978). Because the reaction hasan activation barrier, the Arrhenius form is chosen. The falloff transition to the high pressure range is expected at pressures nottoo far above 1 bar. However, as yet no experimental data are available in this pressure region. Based on a theoretical analysisof dissociation (Astholz et al., 1979) and recombination data, fitting a barrier of 22 kJ·mol−1 for the spin-forbidden reactionO(3P) + SO2 (1A1) → SO3 (1A1), Troe (1979) derived the expression k0 = 1.1×10⁻³¹ (T /1000)−4 exp(−2646/T ) [Ar] overthe temperature range 250–2500 K, which agrees with the Atkinson and Pitts (1978) data to within a factor of 2 at 298 K.
References
Astholz, D. C., Glanzer, K. and Troe, J.: J. Chem. Phys., 70, 2409, 1979.Atkinson, R. and Pitts Jr., J. N.: Int. J. Chem. Kinet., 10, 1081, 1978.Troe, J.: Ann. Rev. Phys. Chem., 29, 223, 1978.
Atmos. Chem. Phys., 4, 1461–1738, 2004 www.atmos-chem-phys.org/acp/4/1461/

R. Atkinson et al.: Evaluated kinetic and photochemical data for Ox, HOx, NOx and SOx 1627
I.A4.78
S + O2 → SO + O
1H ◦ = −23.0 kJ·mol−1
Rate coefficient data
k/cm3 molecule−1 s−1 Temp./K Reference Technique/Comments
Absolute Rate Coefficients
(2.0± 0.5)×10−12 298 Fair and Thrush, 1969 DF-CL(2.8± 0.3)×10−12 298 Fair et al., 1971 FP-A2.2×10−12 exp[(0 ± 50)/T ] 252–423 Davis et al., 1972 FP-RF(1.7± 0.3)×10−12 298 Donovan and Little, 1972 FP-RA(1.5± 0.3)×10−12 298 Clyne and Townsend, 1975 DF-RF1.7×10−12 exp[(153± 108)/T ] 296–393 Clyne and Whitefield, 1979 DF-RF(2.6± 0.3)×10−12 298
Preferred Values
k = 2.1×10⁻¹² cm3 molecule−1 s−1, independent of temperature over the range 250–430 K.
Reliability
1log k = ±0.2 at 298 K.1(E/R) = ±200 K.
Comments on Preferred Values
All of the available measurements ofk are in good agreement. Clyne and Whitefield (1979) observed a small decreasein k with increasing temperature, but until more definitive measurements ofE/R are made a temperature independentk isrecommended with error limits encompassing the existing measured values. The preferred value at 298 K is the mean of valuesfrom Fair and Thrush (1969), Fair et al. (1971), Davis et al. (1972), Donovan and Little (1972), Clyne and Townsend (1975)and Clyne and Whitefield (1979).
References
Clyne, M. A. A. and Townsend, L. W.: Int. J. Chem. Kinet., Symp., 1, 73, 1975.Clyne, M. A. A. and Whitefield, P. D.: J. Chem. Soc. Faraday Trans. 2, 75, 1327, 1979.Davis, D. D., Klemm, R. B. and Pilling, M. J.: Int. J. Chem. Kinet., 4, 367, 1972.Donovan, R. J. and Little, D. J.: Chem. Phys. Lett., 13, 488, 1972.Fair, R. W. and Thrush, B. A.: Trans. Faraday Soc., 65, 1557, 1969.Fair, R. W., Van Roodselaar, A. and Strausz, O. P.: Can J. Chem., 49, 1659, 1971.
www.atmos-chem-phys.org/acp/4/1461/ Atmos. Chem. Phys., 4, 1461–1738, 2004
1628 R. Atkinson et al.: Evaluated kinetic and photochemical data for Ox, HOx, NOx and SOx
I.A4.79
S + O3 → SO + O2
1H ◦ = −415 kJ·mol−1
Rate coefficient data
k/cm3 molecule−1 s−1 Temp./K Reference Technique/Comments
Absolute Rate Coefficients
(1.2± 0.3)×10−11 298 Clyne and Townsend, 1975 DF-RF
Preferred Values
k = 1.2×10⁻¹¹ cm3 molecule−1 s−1 at 298 K.
Reliability
1log k = ±0.3 at 298 K.
Comments on Preferred Values
The only available experimental determination (Clyne and Townsend, 1975) is accepted as the preferred value. The methodwas direct, and in the same study a number of other rate coefficients for S atom reactions were measured giving results in goodagreement with other techniques.
References
Clyne, M. A. A. and Townsend, L. W.: Int. J. Chem. Kinet., Symp. 1, 73, 1975.
Atmos. Chem. Phys., 4, 1461–1738, 2004 www.atmos-chem-phys.org/acp/4/1461/
R. Atkinson et al.: Evaluated kinetic and photochemical data for Ox, HOx, NOx and SOx 1629
I.A4.80
Cl + H2S→ HCl + HS
1H ◦ = −50.0 kJ·mol−1
Rate coefficient data
k/cm3 molecule−1 s−1 Temp./K Reference Technique/Comments
Absolute Rate Coefficients
(7.3± 0.9)×10−11 298 Nesbitt and Leone, 1980 PLP-CL(4.00± 0.08)×10−11 296 Clyne and Ono, 1983 DF-RF(5.1± 0.7)×10−11 296 Clyne et al., 1984 DF-MS(6.29± 0.46)×10−11 211–353 Nava et al., 1985 FP-RF3.69×10−11 exp[(208± 24)/T ] 202–430 Nicovich et al., 1995 PLP-RF(7.4± 1.1)×10−11 298
Preferred Values
k = 7.4×10⁻¹¹ cm3 molecule−1 s−1 at 298 K.k = 3.7×10⁻¹¹ exp(208/T ) cm3 molecule−1 s−1 over the temperature range 200–430 K.
Reliability
1log k = ±0.1 at 298 K.1(E/R) = ±100 K.
Comments on Preferred Values
The preferred value accepts the results of the study of Nicovich et al. (1995) which was an extensive study conducted overa wide range of experimental conditions. In that study the value ofk at room temperature was found to be independent ofpressure over the range studied [33–800 mbar (25–600 Torr)]. The room temperature value ofk reported by Nesbitt and Leone(1980) is in excellent agreement with the preferred value. That of Nava et al. (1985) is 15% lower, and those of Clyne and Ono(1983) and Clyne et al. (1984) are significantly lower. In the study of Nicovich et al. (1995), experimental conditions wereadjusted to minimize interferences from radical-radical secondary reactions. Anab initio study of reactions of chlorine atomswith several reduced sulfur compounds has been reported by Wilson and Hirst (1997). For this reaction these results indicatethat adduct formation is the dominant reaction pathway but that hydrogen atom abstraction could be significant.
References
Clyne, M. A. A. and Ono, Y.: Chem. Phys. Lett., 94, 597, 1983.Clyne, M. A. A., MacRobert, A. J., Murrells, T. P. and Stief, L. J.: J. Chem. Soc. Faraday Trans. 2, 80, 877, 1984.Nava, D. F., Brobst, W. D. and Stief, L. J.: J. Phys. Chem., 89, 4703, 1985.Nesbitt, D. J. and Leone, S. R.: J. Chem. Phys., 72, 1722, 1980.Nicovich, J. M., Wang, S. and Wine, P. H.: Int. J. Chem. Kinet., 27, 359, 1995.Wilson, C. and Hirst, D. M.: J. Chem. Soc. Faraday Trans., 93, 2831, 1997.
www.atmos-chem-phys.org/acp/4/1461/ Atmos. Chem. Phys., 4, 1461–1738, 2004

1630 R. Atkinson et al.: Evaluated kinetic and photochemical data for Ox, HOx, NOx and SOx
I.A4.81
Cl + OCS → SCl + CO
Rate coefficient data
k/cm3 molecule−1 s−1 Temp./K Reference Technique/Comments
Absolute Rate Coefficients
<1.1×10⁻¹⁶ 298 Eibling and Kaufman, 1983 DF-MS<4×10⁻¹⁵ 298 Clyne et al., 1984 DF-MS<1×10⁻¹⁴ 298 Nava et al., 1985 FP-RF
Preferred Values
k < 1.0×10⁻¹⁶ at 298 K.
Comments on Preferred Values
The reaction of Cl atoms with OCS is extremely slow and only upper limits to the rate coefficient have been obtained (Eiblingand Kaufman, 1983; Clyne et al., 1984; Nava et al., 1985). The lowest of these upper limits (Eibling and Kaufman, 1983) isthe preferred value.
References
Clyne, M. A. A., MacRobert, A. J., Murrells, T. P. and Stief, L. J.: J. Chem. Soc., Faraday Trans. 2, 80, 877, 1984.Eibling, R. E. and Kaufman, M.: Atmos. Environ., 17, 429, 1983.Nava, D. F., Brobst, W. D. and Stief, L. J.: J. Phys. Chem., 89, 4703, 1985.
Atmos. Chem. Phys., 4, 1461–1738, 2004 www.atmos-chem-phys.org/acp/4/1461/
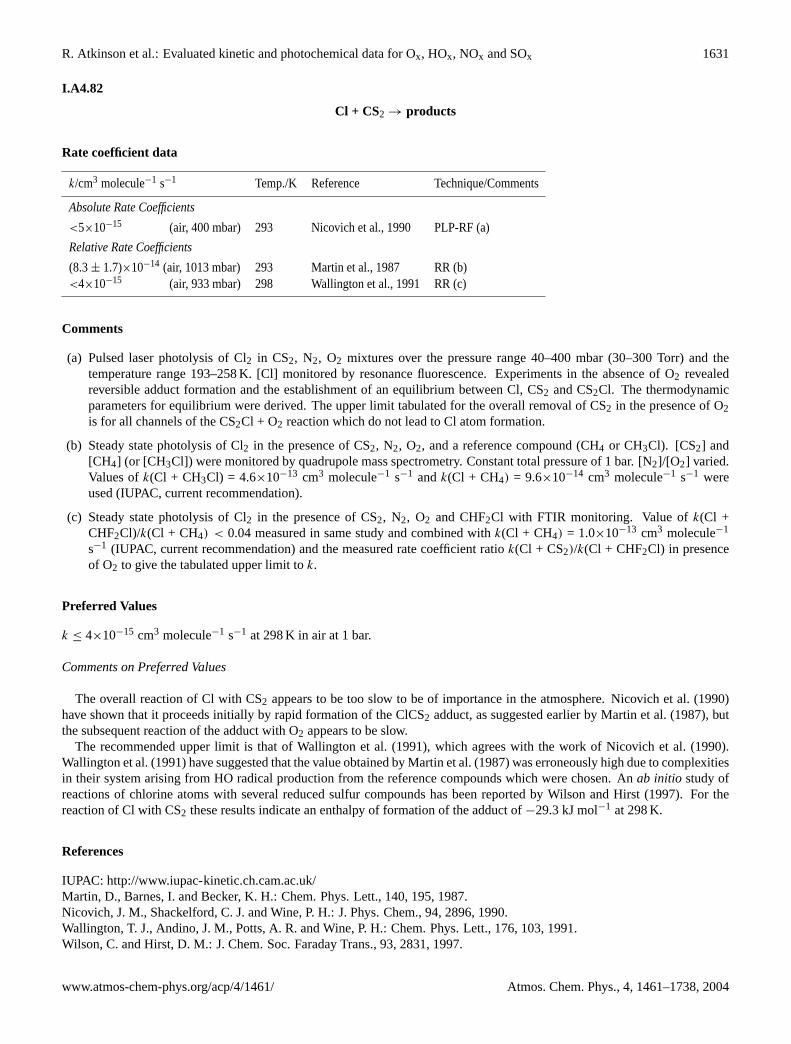
R. Atkinson et al.: Evaluated kinetic and photochemical data for Ox, HOx, NOx and SOx 1631
I.A4.82
Cl + CS2 → products
Rate coefficient data
k/cm3 molecule−1 s−1 Temp./K Reference Technique/Comments
Absolute Rate Coefficients
<5×10⁻¹⁵ (air, 400 mbar) 293 Nicovich et al., 1990 PLP-RF (a)
Relative Rate Coefficients
(8.3± 1.7)×10−14 (air, 1013 mbar) 293 Martin et al., 1987 RR (b)<4×10⁻¹⁵ (air, 933 mbar) 298 Wallington et al., 1991 RR (c)
Comments
(a) Pulsed laser photolysis of Cl2 in CS2, N2, O2 mixtures over the pressure range 40–400 mbar (30–300 Torr) and thetemperature range 193–258 K. [Cl] monitored by resonance fluorescence. Experiments in the absence of O2 revealedreversible adduct formation and the establishment of an equilibrium between Cl, CS2 and CS2Cl. The thermodynamicparameters for equilibrium were derived. The upper limit tabulated for the overall removal of CS2 in the presence of O2is for all channels of the CS2Cl + O2 reaction which do not lead to Cl atom formation.
(b) Steady state photolysis of Cl2 in the presence of CS2, N2, O2, and a reference compound (CH4 or CH3Cl). [CS2] and[CH4] (or [CH3Cl]) were monitored by quadrupole mass spectrometry. Constant total pressure of 1 bar. [N2]/[O2] varied.Values ofk(Cl + CH3Cl) = 4.6×10⁻¹³ cm3 molecule−1 s−1 andk(Cl + CH4) = 9.6×10⁻¹⁴ cm3 molecule−1 s−1 wereused (IUPAC, current recommendation).
(c) Steady state photolysis of Cl2 in the presence of CS2, N2, O2 and CHF2Cl with FTIR monitoring. Value ofk(Cl +CHF2Cl)/k(Cl + CH4) < 0.04 measured in same study and combined withk(Cl + CH4) = 1.0×10⁻¹³ cm3 molecule−1
s−1 (IUPAC, current recommendation) and the measured rate coefficient ratiok(Cl + CS2)/k(Cl + CHF2Cl) in presenceof O2 to give the tabulated upper limit tok.
Preferred Values
k ≤ 4×10⁻¹⁵ cm3 molecule−1 s−1 at 298 K in air at 1 bar.
Comments on Preferred Values
The overall reaction of Cl with CS2 appears to be too slow to be of importance in the atmosphere. Nicovich et al. (1990)have shown that it proceeds initially by rapid formation of the ClCS2 adduct, as suggested earlier by Martin et al. (1987), butthe subsequent reaction of the adduct with O2 appears to be slow.
The recommended upper limit is that of Wallington et al. (1991), which agrees with the work of Nicovich et al. (1990).Wallington et al. (1991) have suggested that the value obtained by Martin et al. (1987) was erroneously high due to complexitiesin their system arising from HO radical production from the reference compounds which were chosen. Anab initio study ofreactions of chlorine atoms with several reduced sulfur compounds has been reported by Wilson and Hirst (1997). For thereaction of Cl with CS2 these results indicate an enthalpy of formation of the adduct of−29.3 kJ mol−1 at 298 K.
References
IUPAC: http://www.iupac-kinetic.ch.cam.ac.uk/Martin, D., Barnes, I. and Becker, K. H.: Chem. Phys. Lett., 140, 195, 1987.Nicovich, J. M., Shackelford, C. J. and Wine, P. H.: J. Phys. Chem., 94, 2896, 1990.Wallington, T. J., Andino, J. M., Potts, A. R. and Wine, P. H.: Chem. Phys. Lett., 176, 103, 1991.Wilson, C. and Hirst, D. M.: J. Chem. Soc. Faraday Trans., 93, 2831, 1997.
www.atmos-chem-phys.org/acp/4/1461/ Atmos. Chem. Phys., 4, 1461–1738, 2004
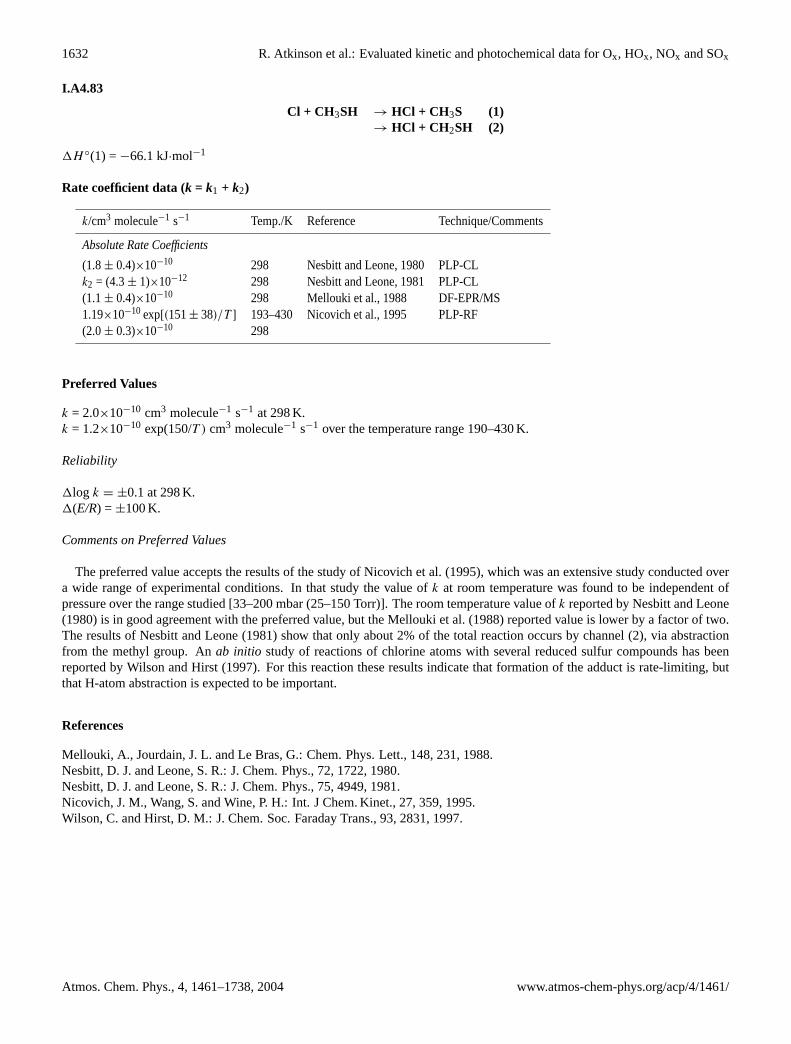
1632 R. Atkinson et al.: Evaluated kinetic and photochemical data for Ox, HOx, NOx and SOx
I.A4.83
Cl + CH3SH → HCl + CH 3S (1)→ HCl + CH 2SH (2)
1H ◦(1) = −66.1 kJ·mol−1
Rate coefficient data (k = k1 + k2)
k/cm3 molecule−1 s−1 Temp./K Reference Technique/Comments
Absolute Rate Coefficients
(1.8± 0.4)×10−10 298 Nesbitt and Leone, 1980 PLP-CLk2 = (4.3± 1)×10−12 298 Nesbitt and Leone, 1981 PLP-CL(1.1± 0.4)×10−10 298 Mellouki et al., 1988 DF-EPR/MS1.19×10−10 exp[(151± 38)/T ] 193–430 Nicovich et al., 1995 PLP-RF(2.0± 0.3)×10−10 298
Preferred Values
k = 2.0×10⁻¹⁰ cm3 molecule−1 s−1 at 298 K.k = 1.2×10⁻¹⁰ exp(150/T ) cm3 molecule−1 s−1 over the temperature range 190–430 K.
Reliability
1log k = ±0.1 at 298 K.1(E/R) = ±100 K.
Comments on Preferred Values
The preferred value accepts the results of the study of Nicovich et al. (1995), which was an extensive study conducted overa wide range of experimental conditions. In that study the value ofk at room temperature was found to be independent ofpressure over the range studied [33–200 mbar (25–150 Torr)]. The room temperature value ofk reported by Nesbitt and Leone(1980) is in good agreement with the preferred value, but the Mellouki et al. (1988) reported value is lower by a factor of two.The results of Nesbitt and Leone (1981) show that only about 2% of the total reaction occurs by channel (2), via abstractionfrom the methyl group. Anab initio study of reactions of chlorine atoms with several reduced sulfur compounds has beenreported by Wilson and Hirst (1997). For this reaction these results indicate that formation of the adduct is rate-limiting, butthat H-atom abstraction is expected to be important.
References
Mellouki, A., Jourdain, J. L. and Le Bras, G.: Chem. Phys. Lett., 148, 231, 1988.Nesbitt, D. J. and Leone, S. R.: J. Chem. Phys., 72, 1722, 1980.Nesbitt, D. J. and Leone, S. R.: J. Chem. Phys., 75, 4949, 1981.Nicovich, J. M., Wang, S. and Wine, P. H.: Int. J Chem. Kinet., 27, 359, 1995.Wilson, C. and Hirst, D. M.: J. Chem. Soc. Faraday Trans., 93, 2831, 1997.
Atmos. Chem. Phys., 4, 1461–1738, 2004 www.atmos-chem-phys.org/acp/4/1461/

R. Atkinson et al.: Evaluated kinetic and photochemical data for Ox, HOx, NOx and SOx 1633
I.A4.84
Cl + CH3SCH3 → CH3SCH2 + HCl (1)→ [CH3SClCH3]* → products (2)
1H ◦(1) = −39.6 kJ·mol−1
Rate coefficient data
k/cm3 molecule−1 s−1 Temp./K Reference Technique/Comments
Absolute Rate Coefficients
1.8×10⁻¹⁰ (4 mbar N2) 297 Stickel et al., 1992 PLP-RF(3.3± 0.5)×10−10 (933 mbar N2) 297
Relative Rate Coefficients
(3.2± 0.3)×10−10 (1013 mbar N2) 295 Nielsen et al., 1990 RR (a)(3.61± 0.21)×10−10 (1013 mbar N2) 298 Kinnison et al., 1996 RR (b)
Branching Ratios
k1/k > 0.97 (1.3 mbar He) 298 Butkovskaya et al., 1995 DF-MSk1/k > 0.98 (13–40 mbar N2) 298 Zhao et al., 1996 PLP-TDLS
Comments
(a) Photolysis of mixtures of COCl2-CH3SCH3-cyclohexane-N2 in a Teflon chamber. [Cyclohexane] and [CH3SCH3] mea-sured at intervals by GC. A rate coefficient ofk(Cl + cyclohexane) = 3.1×10⁻¹⁰ cm3 molecule−1 s−1 was used (Atkinsonand Aschmann, 1985).
(b) Photolysis of mixtures of COCl2-CH3SCH3 − n-butane-N2 in a Teflon chamber. [n-Butane] and [CH3SCH3] measuredby GC.k(Cl + n-butane) = 1.94×10⁻¹⁰ cm3 molecule−1 s−1 used (Atkinson and Aschmann, 1985).
Preferred Values
k = 3.3×10⁻¹⁰ cm3 molecule−1 s−1 at 298 K and 1 bar N2.
Reliability
1log k = ±0.15 at 298 K and 1 bar N2.
Comments on Preferred Values
The study of this reaction by Stickel et al. (1992) shows the reaction kinetics to have a complex dependency on temperatureand pressure. The overall reaction rate is close to collisional and increases with decreasing temperature and with increasingpressure. The HCl yield (measured by TDLS) approaches unity as the pressure tends to zero but decreases to a value of∼0.5at 270 mbar (203 Torr) N2 and 297 K (Stickel et al., 1992).
These findings are interpreted in terms of the occurrence of two reaction channels, Cl abstraction and adduct formation. Atlow pressures the abstraction channel is dominant (Stickel et al., 1992; Butkovskaya et al., 1995; Zhao et al., 1996) but withincreasing pressure the adduct can be stabilized leading to an increase in the totalk as pressure increases and temperaturedecreases.
Langer et al. (1996) using a UV photolysis system with gas chromatographic detection, reported the yield of CH3Cl formedin this reaction at 298 K and 1 bar air to be (1.34± 0.07)×10−3. The authors concluded that the most likely source isdecomposition of the adduct formed in pathway (2) to give CH3Cl + CH3S.
An ab initio study of reactions of chlorine atoms with several reduced sulfur compounds has been reported by Wilson andHirst (1997). For this reaction the structure of the adduct has been characterized, vibrational frequencies reported, and reactionenergetics calculated.
www.atmos-chem-phys.org/acp/4/1461/ Atmos. Chem. Phys., 4, 1461–1738, 2004
1634 R. Atkinson et al.: Evaluated kinetic and photochemical data for Ox, HOx, NOx and SOx
Until the reaction is studied in more detail and a complete analysis of the temperature and pressure dependence can be made,our recommendations are limited to high pressures and 298 K. They are based on the results of Stickel et al. (1992), Nielsen etal. (1990) and Kinnison et al. (1996), which are in excellent agreement. There is also a value of 2.0×10⁻¹⁰ cm3 molecule−1
s−1 at 298 K and 1 bar N2 reported by Barnes et al. (1989), but no experimental details are given.
References
Atkinson, R. and Aschmann, S. M.: Int. J. Chem. Kinet., 17, 33, 1985.Barnes, I., Bastian, V., Becker, K. H. and Martin, D.: “Biogenic Sulfur in the Environment, edited by Saltzman, E. S. andCooper, W. J.: ACS Symposium Series 393, p. 476, 1989.Butkovskaya, N. I. , Poulet, G. and Le Bras, G.: J. Phys. Chem., 99, 4536, 1995.Kinnison, D. J., Mengon, W. and Kerr, J. A.: J. Chem. Soc. Faraday Trans., 92, 369, 1996.Langer, S., McGovney, B. T., Finlayson-Pitts, B. J. and Moore, R. M.: Geophys. Res. Lett., 23, 1661, 1996.Nielsen, O. J., Sidebottom, H. W., Nelson, L., Rattigan, O., Treacy, J. and O’Farrell, D. J.: Int. J. Chem. Kinet., 22, 603, 1990.Stickel, R. E., Nicovich, J. M., Wang, S., Zhao, Z. and Wine, P. H.: J. Phys. Chem., 96, 9875, 1992.Wilson, C. and Hirst, D. M.: J. Chem. Soc. Faraday Trans., 93, 2831, 1997.Zhao, Z., Stickel, R. E. and Wine, P. H.: Chem. Phys. Lett., 251, 59, 1996.
Atmos. Chem. Phys., 4, 1461–1738, 2004 www.atmos-chem-phys.org/acp/4/1461/

R. Atkinson et al.: Evaluated kinetic and photochemical data for Ox, HOx, NOx and SOx 1635
I.A4.85
HO + H2S→ H2O + HS
1H ◦ = −115.4 kJ mol−1
Rate coefficient data
k/cm3 molecule−1 s−1 Temp./K Reference Technique/Comments
Absolute Rate Coefficients
2.3×10⁻¹¹ exp(−443/T ) 298–885 Westenberg and deHaas, 1973 DF-EPR(5.48± 0.33)×10−12 298(3.1± 0.5)×10−12 298 Stuhl, 1974 FP-RF(5.2± 0.5)×10−12 298–423 Perry et al., 1976 FP-RF6.4×10−12 exp[−(55± 58)/T ] 245–366 Wine et al., 1981 FP-RF(5.13± 0.57)×10−12 2972.27×10−19T 2.5 exp(725/T ) 228–518 Leu and Smith, 1982 DF-RF(3.9± 0.7)×10−12 298(5.01± 0.55)×10−12 228–437 Michael et al., 1982 FP-RF7.8×10−12 exp[−(146± 105)/T ] 239–425 Lin, 1982 FP-RF(4.42± 0.48)×10−12 295(4.3± 0.6)×10−12 300 Wang and Lee, 1985 DF-RF3.81×10−19T 2.43 exp(732/T ) 245–450 Lin et al., 1985 DF-RF(4.4± 0.7)×10−12 299(4.9± 0.9)×10−12 245 Lafage et al., 1987 DF-RF/LIF(3.8± 0.6)× 10−12
1.32×10⁻¹¹ exp[−(394± 190/T ] 294–450(3.3± 0.5)×10−12 294
Relative Rate Coefficients
(5.31± 0.35)×10−12 297± 2 Cox and Sheppard, 1980 RR (a)(5.5± 0.9)×10−12 300 Barnes et al., 1986 RR (b)
Comments
(a) HO radicals were generated by the photolysis of HONO-NO-air mixtures at atmospheric pressure. The decay of H2S wasmeasured relative to that of C2H4 by GC, and the relative rate coefficient placed on an absolute basis by use of a ratecoefficient ofk(HO + C2H4) = 8.57 x 10⁻¹² cm3 molecule−1 s−1 at 297 K and atmospheric pressure of air (Atkinson,1997).
(b) HO radicals were generated by the photolysis of CH3ONO in N2-O2 mixtures at atmospheric pressure. The decay of H2Swas measured relative to that for ethene by GC, and the relative rate coefficient placed on an absolute basis by use of arate coefficient ofk(HO + C2H4) = 8.44×10⁻¹² cm3 molecule−1 s−1 at 300 K and atmospheric pressure of air (Atkinson,1997).
Preferred Values
k = 4.7×10⁻¹² cm3 molecule−1 s−1 at 298 K.k = 6.1×10⁻¹² exp(−80/T ) cm3 molecule−1 s−1 over the temperature range 220–520 K.
www.atmos-chem-phys.org/acp/4/1461/ Atmos. Chem. Phys., 4, 1461–1738, 2004

1636 R. Atkinson et al.: Evaluated kinetic and photochemical data for Ox, HOx, NOx and SOx
Reliability
1log k = ±0.08 at 298 K.1(E/R) = ±80 K.
Comments on Preferred Values
The preferred values are obtained from a unit-weighted least-squares analysis of the absolute rate constants of Perry etal. (1976), Wine et al. (1981), Leu and Smith (1982), Michael et al. (1982), Lin (1982), Wang and Lee (1985), Lin et al. (1985)and Lafage et al. (1987), which are in good agreement. The earlier studies of Westenberg and deHaas (1973) and Stuhl (1974)reported a significantly higher temperature dependence of the rate coefficient and a lower room temperature rate coefficent,respectively, than later studies, and the data from these studies (Westenberg and deHaas, 1973; Stuhl, 1974) are not used in theevaluation of the preferred values. The studies of Leu and Smith (1982), Lin et al. (1985) and Lafage et al. (1987) show non-Arrhenius behavior of the rate coefficient, with a shallow minimum in the rate coefficient at∼270–300 K. The rate coefficientis independent of pressure (Leu and Smith, 1982; Michael et al., 1982; Lin, 1982; Lin et al., 1985) and the nature of thediluent gas (Lin et al., 1985). These findings cast some doubt upon the suggestion that the non-Arrhenius behavior is due tothe occurrence of both addition and abstraction channels.
Despite the non-Arrhenius behavior of the rate coefficientk over an extended temperature range, the preferred expression isgiven in the Arrhenius form which is satisfactory for the temperature range covered by our recommendation.
References
Atkinson, R.: J. Phys. Chem. Ref. Data 26, 215, 1997.Barnes, I., Bastian, V., Becker, K. H., Fink, E. H. and Nelsen, W.: J. Atmos. Chem., 4, 445, 1986.Cox, R. A. and Sheppard, D. W.: Nature (London) 284, 330, 1980.Lafage, C., Pauwels, J.-F., Carlier, M. and Devolder, P.: J. Chem. Soc. Faraday Trans. 2, 83, 731, 1987.Leu, M.-T. and Smith, R. H.: J. Phys. Chem., 86, 73, 1982.Lin, C. L.: Int. J. Chem. Kinet., 14, 593, 1982.Lin, Y.-L., Wang, N.-S. and Lee, Y.-P.: Int. J. Chem. Kinet., 17, 1201, 1985.Michael, J. V., Nava, D. F., Brobst, W. D., Borkowski, R. P. and Stief, L. J.: J. Phys. Chem., 86, 81, 1982.Perry, R. A., Atkinson, R. and Pitts Jr., J. N.: J. Chem. Phys., 64, 3237, 1976.Stuhl, F.: Ber. Bunsenges. Phys. Chem., 78, 230, 1974.Wang, N.-S. and Lee, Y.-P.: Proc. Natl. Sci. Counc. ROC(A) 9, 87, 1985.Westenberg, A. A. and deHaas, N.: J. Chem. Phys., 59, 6685, 1973.Wine, P. H., Kreutter, N. M., Gump, C. A. and Ravishankara, A. R.: J. Phys. Chem., 85, 2660, 1981.
Atmos. Chem. Phys., 4, 1461–1738, 2004 www.atmos-chem-phys.org/acp/4/1461/

R. Atkinson et al.: Evaluated kinetic and photochemical data for Ox, HOx, NOx and SOx 1637
I.A4.86
HO + SO2 + M → HOSO2 + M
1H ◦ = −125 kJ·mol−1
Low-pressure rate coefficients
Rate coefficient data
k0/cm3 molecule−1 s−1 Temp./K Reference Technique/Comments
Absolute Rate Coefficients
(7.2± 2.6)×10−31 [N2] 300 Harris and Wayne, 1975 DF-RF7.0×10−31(T /300)−2.9 [N2] (a) Erler et al., 1975 DF-RF4.9×10−31 [N2] 300 Davis, 1976 (b)(1.6± 0.3)×10−31 [Ar] 298 Atkinson et al., 1976 FP-RF (c)3.6×10⁻³¹ [N2] 300 Erler and Zellner, 1978 FP-RA(2.54± 0.33)×10−31 [N2] 298 Leu, 1982 DF-RF (d)(7.91± 0.24)×10−32 261–414
×(T /298)−(2.85±0.21) [He]1.6×10⁻³¹ [N2] 297 Paraskevopoulos et al., 1983 FP-RA (e)5.8×10⁻³¹(T /300)−2.6 [N2] 260–420 Wine et al., 1984 FP-RF (f)(2.4± 0.7)×10−31 [N2] 298 Lee et al., 1990 DF-RF(1.1± 0.3)×10−32 exp(640/T ) [He] 280–413
Comments
(a) Temperature range not cited.
(b) Measurements cited in Hampson and Garvin (1978) in the pressure range 6.7–670 mbar (5–500 Torr), extrapolated tok0andk∞.
(c) Pressure range 33–870 mbar (25–650 Torr).
(d) Measurements at pressures near 1.3 mbar (1 Torr).
(e) Pressure range 73–1013 mbar (55–760 Torr). Falloff extrapolation using Lindemann-Hinshelwood (i.e. neglecting broad-ening factors), and hence responsible for low value.
(f) Temperature range 260–420 K, pressure range 17–928 mbar (13–696 Torr), bath gases He, Ar, N2 and SF6. Expressionderived from fall-off parameterisation usingFc = exp(−T /388).
Preferred Values
k0 = 4.5×10⁻³¹ (T /300)−3.9 [N2] cm3 molecule−1 s−1 over the temperature range 200–300 K.
Reliability
1log k0 = ± 0.3 at 300 K.1n = ± 1.
Comments on Preferred Values
The preferred value is that given by Wine et al. (1984) based on a falloff analysis usingFc = 0.525. In combination withk∞, (see below) this expression accurately reproduces the data of Wine et al. (1984), Paraskevopoulos et al. (1983), Lee et
www.atmos-chem-phys.org/acp/4/1461/ Atmos. Chem. Phys., 4, 1461–1738, 2004

1638 R. Atkinson et al.: Evaluated kinetic and photochemical data for Ox, HOx, NOx and SOx
al. (1990) and Leu (1982) in N2 at room temperature and covers the atmospheric pressure range without any extrapolation. Thetemperature dependence ofk0 was based on an analysis of data obtained in Ar, He andF6.
High-pressure rate coefficients
Rate coefficient data
k∞/cm3 molecule−1 s−1 Temp./K Reference Technique/Comments
Absolute Rate Coefficients
1.8×10⁻¹² 435 Gordon and, 1975 (a)9.0×10⁻¹³ 300 Davis, 1976 (b)8.3×10⁻¹³ 300 Atkinson et al., 1976 FP-RF (c)1.2×10⁻¹² 297 Paraskevopoulos et al., 1983 FP-RA (d)1.26×10⁻¹²(T /300)−0.7 260–420 Wine et al., 1984 FP-RF (e)1.2×10⁻¹¹ exp(−360/T ) 220–400 Fulle et al., 1999 LP-LIF (f)
Comments
(a) Pulse radiolysis in H2O vapor at 1 bar.
(b) See comment (b) fork0.
(c) See comment (c) fork0.
(d) See comment (e) fork0.
(e) See comment (f) fork0.
(f) Pressure range 1–96 bar (He).
Preferred Values
k∞ = 1.3×10⁻¹² (T/300)−0.7 over the temperature range 200–300 K.
Reliability
1log k∞ = ± 0.3 over the temperature range 200–300 K.
Comments on Preferred Values
See Comments on preferred values fork0. Falloff representation withFc = 0.525 near 250 K. The data obtained by Fulle etal. (1999) at pressures up to 96 bar (He) indicate a larger value for the rate coefficient at the high pressure limit (factors of 1.5and 2.8 at 220 and 300 K, respectively), and also a barrier of≈ 3 kJ/mol for the recombination process. These large values forthe high pressure limit appear to be in disaccord with measured values for the rate constant for deactivation of HO (v=1) bySO2 which are more in line with the recommended values above (Blitz et al., 2000). Further experimental and theoretical inputwould be useful in resolving this discrepancy.
References
Atkinson, R., Perry, R. A. and Pitts Jr., J. N.: J. Chem. Phys., 65, 306, 1976.Blitz, M. A., McKee, W. and Pilling, M. J.: 28th International Symposium on Combustion: The Combustion Institute, 28, p2491, 2000Davis, D. D., 1976: (cited in: Hampson, R. F. and Garvin, D.: Nat. Bur. Stand. (U.S.), Spec. Publ. 513, 1978.)
Atmos. Chem. Phys., 4, 1461–1738, 2004 www.atmos-chem-phys.org/acp/4/1461/

R. Atkinson et al.: Evaluated kinetic and photochemical data for Ox, HOx, NOx and SOx 1639
Erler, K., Field, D. and Zellner, R., 1975: (cited in Zellner, R.: Ber. Bunsenges. Phys. Chem., 82, 1172, 1978).Erler, K. and Zellner, R., 1978: (cited in Zellner, R.: Ber. Bunsenges. Phys. Chem., 82, 1172, 1978).Fulle, D., Hamann, H. F. and Hippler, H.: Phys. Chem. Chem. Phys., 1, 2695, 1999.Gordon, S. and Mulac, W. A.: Int. J. Chem. Kinet., Symp., 1, 289, 1975.Hampson, R. F. and Garvin, D.: Nat. Bur. Stand. (U.S.), Spec. Publ. 513, 1978.Harris, G. W. and Wayne, R. P.: J. Chem. Soc. Faraday Trans. 1, 71, 610, 1975.Lee, Y.-Y., Cao, W.-C. and Lee, Y.-P.: J. Phys. Chem., 94, 4535, 1990.Leu, M. T.:J. Phys. Chem., 86, 4558, 1982.Paraskevopoulos, G., Singleton, D. L. and Irwin, R. S.: Chem. Phys. Lett., 100, 83, 1983.Wine, P. H., Semmes, D. H., Thompson, R. J., Gump, C. A., Ravishankara, A. R., Torabi, A. and Nicovich, J. M.: J. Phys.Chem., 88, 2095, 1984.
www.atmos-chem-phys.org/acp/4/1461/ Atmos. Chem. Phys., 4, 1461–1738, 2004
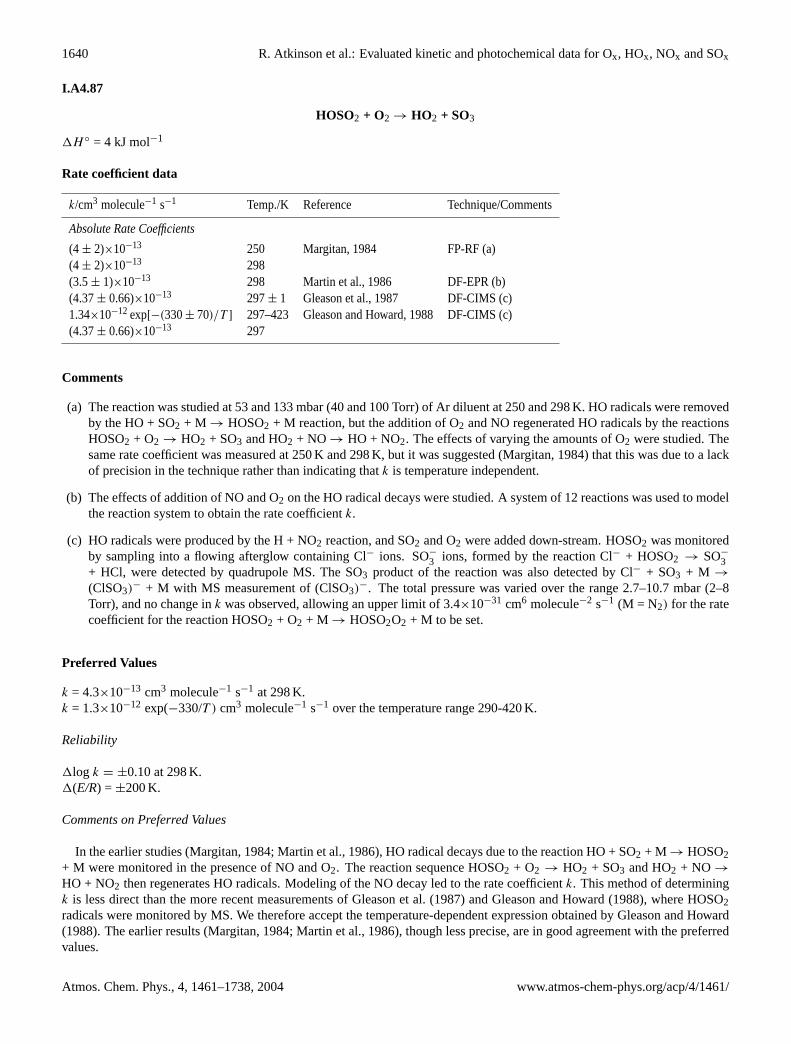
1640 R. Atkinson et al.: Evaluated kinetic and photochemical data for Ox, HOx, NOx and SOx
I.A4.87
HOSO2 + O2 → HO2 + SO3
1H ◦ = 4 kJ mol−1
Rate coefficient data
k/cm3 molecule−1 s−1 Temp./K Reference Technique/Comments
Absolute Rate Coefficients
(4 ± 2)×10−13 250 Margitan, 1984 FP-RF (a)(4 ± 2)×10−13 298(3.5± 1)×10−13 298 Martin et al., 1986 DF-EPR (b)(4.37± 0.66)×10−13 297± 1 Gleason et al., 1987 DF-CIMS (c)1.34×10⁻¹² exp[−(330± 70)/T ] 297–423 Gleason and Howard, 1988 DF-CIMS (c)(4.37± 0.66)×10−13 297
Comments
(a) The reaction was studied at 53 and 133 mbar (40 and 100 Torr) of Ar diluent at 250 and 298 K. HO radicals were removedby the HO + SO2 + M → HOSO2 + M reaction, but the addition of O2 and NO regenerated HO radicals by the reactionsHOSO2 + O2 → HO2 + SO3 and HO2 + NO → HO + NO2. The effects of varying the amounts of O2 were studied. Thesame rate coefficient was measured at 250 K and 298 K, but it was suggested (Margitan, 1984) that this was due to a lackof precision in the technique rather than indicating thatk is temperature independent.
(b) The effects of addition of NO and O2 on the HO radical decays were studied. A system of 12 reactions was used to modelthe reaction system to obtain the rate coefficientk.
(c) HO radicals were produced by the H + NO2 reaction, and SO2 and O2 were added down-stream. HOSO2 was monitoredby sampling into a flowing afterglow containing Cl− ions. SO−
3 ions, formed by the reaction Cl− + HOSO2 → SO−
3+ HCl, were detected by quadrupole MS. The SO3 product of the reaction was also detected by Cl− + SO3 + M →
(ClSO3)− + M with MS measurement of (ClSO3)−. The total pressure was varied over the range 2.7–10.7 mbar (2–8
Torr), and no change ink was observed, allowing an upper limit of 3.4×10⁻³¹ cm6 molecule−2 s−1 (M = N2) for the ratecoefficient for the reaction HOSO2 + O2 + M → HOSO2O2 + M to be set.
Preferred Values
k = 4.3×10⁻¹³ cm3 molecule−1 s−1 at 298 K.k = 1.3×10⁻¹² exp(−330/T ) cm3 molecule−1 s−1 over the temperature range 290-420 K.
Reliability
1log k = ±0.10 at 298 K.1(E/R) = ±200 K.
Comments on Preferred Values
In the earlier studies (Margitan, 1984; Martin et al., 1986), HO radical decays due to the reaction HO + SO2 + M → HOSO2+ M were monitored in the presence of NO and O2. The reaction sequence HOSO2 + O2 → HO2 + SO3 and HO2 + NO →
HO + NO2 then regenerates HO radicals. Modeling of the NO decay led to the rate coefficientk. This method of determiningk is less direct than the more recent measurements of Gleason et al. (1987) and Gleason and Howard (1988), where HOSO2radicals were monitored by MS. We therefore accept the temperature-dependent expression obtained by Gleason and Howard(1988). The earlier results (Margitan, 1984; Martin et al., 1986), though less precise, are in good agreement with the preferredvalues.
Atmos. Chem. Phys., 4, 1461–1738, 2004 www.atmos-chem-phys.org/acp/4/1461/

R. Atkinson et al.: Evaluated kinetic and photochemical data for Ox, HOx, NOx and SOx 1641
References
Gleason, J. F., Sinha, A. and Howard, C. J.: J. Phys. Chem., 91, 719, 1987.Gleason, J. F. and Howard, C. J.: J. Phys. Chem., 92, 3414, 1988.Margitan, J. J.: J. Phys. Chem., 88, 3314, 1984.Martin, D., Jourdain, J. L. and Le Bras, G.: J. Phys. Chem., 90, 4143, 1986.
www.atmos-chem-phys.org/acp/4/1461/ Atmos. Chem. Phys., 4, 1461–1738, 2004

1642 R. Atkinson et al.: Evaluated kinetic and photochemical data for Ox, HOx, NOx and SOx
I.A4.88
HO + OCS → products
Rate coefficient data
k/cm3 molecule−1 s−1 Temp./K Reference Technique/Comments
Absolute Rate Coefficients
1.3×10⁻¹² exp[−(2300± 100)/T ] 300–517 Leu and Smith, 1981 DF-RF (a)(6 ± 4)×10−16 3001.13×10−13 exp[−(1200± 400)/T ] 255–483 Cheng and Lee, 1986 DF-RF (b)(2.0+0.4
−0.8)×10−15 300(1.92± 0.25)×10−15 298 Wahner and Ravishankara, 1987 FP/PLP-LIF (c)
Comments
(a) The measured HO radical decay rates were corrected for the presence of H2S in the OCS sample used (0.01± 0.003%H2S for the experiments at 300–421 K and 0.04± 0.01% H2S for the experiments at 517 K). At 300 K the measured ratecoefficient, uncorrected for the presence of H2S, was 1.0×10⁻¹⁵ cm3 molecule−1 s−1.
(b) The purity of OCS was checked by FTIR spectroscopy, showing that H2S was present at less then 0.005%. The measuredrate coefficientk was independent of pressure (1.2–7.9 mbar) and the addition of O2 (up to 18% or 0.36 mbar of O2).
(c) The rate coefficientk was independent of pressure (120–400 mbar), the nature of buffer gas, and the addition of O2 (up to48 mbar).
Preferred Values
k = 2.0×10⁻¹⁵ cm3 molecule−1 s−1 at 298 K.k = 1.1×10⁻¹³ exp(−1200/T ) cm3 molecule−1 s−1 over the temperature range 250–500 K.
Reliability
1log k = ±0.3 at 298 K.1(E/R) = ±500 K.
Comments on Preferred Values
The rate coefficients measured by Cheng and Lee (1986) and Wahner and Ravishankara (1987) are approximately a factor of3 higher at 298 K than the earlier value of Leu and Smith (1981). This may be due to the corrections applied by Leu and Smith(1981) to account for the presence of traces of H2S in their system, because in the absence of any correction to the measuredrate coefficient of Leu and Smith (1981) there is reasonable agreement between the studies (Leu and Smith, 1981; Cheng andLee, 1986; Wahner and Ravishankara, 1987). Cheng and Lee (1986) took care to keep the H2S level in their OCS very low andthis, together with the confirmatory measurements of Wahner and Ravishankara (1987), leads us to recommend their values.These recommendations are compatible with the earlier upper limits given by Atkinson et al. (1978) and Ravishankara etal. (1980), but not with the higher value obtained by Kurylo (1978), which may have been due to the occurrence of interferingsecondary chemistry and/or excited state reactions.
Kurylo and Laufer (1979) have suggested that the reaction proceeds through adduct formation, as found for the reaction ofHO with CS2, followed by decomposition of the adduct to yield mainly HS + CO2. This is supported by the product study ofLeu and Smith (1981) at 517 K. However, in contrast to the HO + CS2 reaction, there is no marked effect of O2 on the ratecoefficient. Furthermore, very little oxygen atom exchange between H18O and OCS is found (Greenblatt and Howard, 1989),which may suggest that any adduct formed is weakly bound and short-lived.
Atmos. Chem. Phys., 4, 1461–1738, 2004 www.atmos-chem-phys.org/acp/4/1461/

R. Atkinson et al.: Evaluated kinetic and photochemical data for Ox, HOx, NOx and SOx 1643
References
Atkinson, R., Perry, R. A. and Pitts Jr., J. N.: Chem. Phys. Lett., 54, 14, 1978.Cheng, B.-M. and Lee, Y.-P.: Int. J. Chem. Kinet., 18, 1303, 1986.Greenblatt, G. D. and Howard, C. J.: J. Phys. Chem., 93, 1035, 1989.Kurylo, M. J.: Chem. Phys. Lett., 58, 238, 1978.Kurylo, M. J. and Laufer, A. H.: J. Chem. Phys., 70, 2032, 1979.Leu, M.-T. and Smith, R. H.: J. Phys. Chem., 85, 2570, 1981.Ravishankara, A. R., Kreutter, N. M., Shah, R. C. and Wine, P. H.: Geophys. Res. Lett., 7, 861, 1980.Wahner, A. and Ravishankara, A. R.: J. Geophys. Res., 92, 2189, 1987.
www.atmos-chem-phys.org/acp/4/1461/ Atmos. Chem. Phys., 4, 1461–1738, 2004

1644 R. Atkinson et al.: Evaluated kinetic and photochemical data for Ox, HOx, NOx and SOx
I.A4.89I.A4.90
HO + CS2 + M → HOCS2 + M (1)HO + CS2 → HS + OCS (2)
1H ◦(1) = −44 kJ·mol−1
1H ◦(2) = −153 kJ·mol−1
Low-pressure rate coefficients
Rate coefficient data
k01/cm3 molecule−1 s−1 Temp./K Reference Technique/Comments
Absolute Rate Coefficients
1×10⁻¹² at 70 Torr [N2] 247–299 Hynes et al., 1988 PLP-LIF (a)6×10⁻¹³ at 30 Torr [N2] 259–318 Murrells et al., 1990 PLP-LIF (b)5.0×10⁻³² [He] 298 Diau and Lee, 1991 PLP-LIF (c)8.9×10⁻³² [He] 26914.7×10−32 [He] 249
Comments
(a) Photolysis of H2O2 at 248 nm in mixtures of CS2 and He, N2, air, or O2. Pressure range 87–920 mbar (65–690 Torr).
(b) Photolysis of H2O2 at 248 nm or 266 nm in mixtures of CS2 and He-N2 or He-SF6 mixtures. Pressure range 12–80 mbar(9–60 Torr). The effect of O2 [0.7–20 mbar (0.5–15 Torr)] on the rate was studied.
(c) Photolysis of H2O2 at 248 nm in mixtures of CS2 and added He or Ar (limited data set). Pressure range 12–360 mbar(9–270 Torr) of Ar or He. Effect of CS2 on rate was studied.
Preferred Values
k01 = 8×10⁻³¹ [N2] cm3 molecule−1 s−1, independent of temperature over the range 250–320 K.
Reliability
1log k01 = ±0.5 over the temperature range 250–320 K.
Comments on Preferred Values
Because of the low thermal stability of HOCS2, experimental studies have to account for the re-dissociation of the adduct.After clarification of the mechanism, rate coefficients now can be specified. The preferred values are based on a combinationof the data for M=N2 from Hynes et al. (1988) and Murrells et al. (1990), with a falloff representation. The data and a falloffrepresentation indicates that the low pressure limit is approached within 10% only at pressures below about 27 mbar (20 Torr).The strong temperature dependence ofk01 for M = He derived by Diau and Lee (1991) (E/R = −1610 K) is not consistentwith the results from Hynes et al. (1988) in He or Murrells et al. (1990) in N2. Hynes et al. (1988) did however report a strongtemperature dependence at 680±20 Torr N2 or O2 or air, withk = 6.9×10⁻¹⁴ exp(1150/T ) cm3 molecule−1s−1. It appears thatreaction (2) is slow, with a rate coefficient ofk2 < 2×10⁻¹⁵ cm3 molecule−1 s−1 at 298 K.
Atmos. Chem. Phys., 4, 1461–1738, 2004 www.atmos-chem-phys.org/acp/4/1461/
R. Atkinson et al.: Evaluated kinetic and photochemical data for Ox, HOx, NOx and SOx 1645
High-pressure rate coefficients
Rate coefficient data
k∞1/cm3 molecule−1 s−1 Temp./K Reference Technique/Comments
Absolute Rate Coefficients
5.8×10⁻¹² at 0.91 bar [N2] 250–270 Hynes et al., 1988 PLP-LIF (a)3.1×10⁻¹² at 0.88 bar [N2] 2971.9×10−12 at 0.20 bar [Ar] 209 Bulatov et al., 1988 PLP-LIF (b)1.3×10⁻¹² at 1.01 bar [air] 295 Becker et al., 1990 PLP-LIF (c)
Comments
(a) See comment (a) fork0.
(b) Mixtures of O2-H2O-CS2-Ar. The rates of HOCS2 formation and decomposition were measured, with an equilibriumconstant ofKc = 2.6×10⁻¹⁷ cm3 molecule−1.
(c) H2O2 photolyzed at 248 nm in mixtures of CS2 and N2-O2 or Ar-O2. The partial pressure of O2 was in the range 0.32–1013 mbar (0.24–760 Torr), at a total pressure of 1.01 bar (760 Torr). The rate coefficient was found to increase furtherwhen more O2 was added, with a value of 2.79×10⁻¹² cm3 molecule s−1 obtained at 996 mbar of O2.
Preferred Values
k∞1 = 8×10⁻¹² cm3 molecule−1 s−1, independent of temperature over the range 250–300 K.
Reliability
1log k∞1 = ±0.5 over the temperature range 250–300 K.
Comments on Preferred Values
The preferred rate coefficientk∞1 is based on a falloff representation of the data from Hynes et al. (1988) and Murrells etal. (1990), with high-pressure data mostly from Hynes et al. (1988). The largest weight is given to the measurements near 250K where decomposition of the adduct and the subsequent kinetics are of comparably minor influence in contrast to the roomtemperature experiments. A falloff curve with an estimated value ofFc = 0.8 was employed for extrapolation. Experiments at 1bar total pressure are apparently still far below the high pressure limit. An extensive discussion of the complicated mechanismis given in Hynes et al. (1988), Murrells et al. (1990) and Lovejoy et al. (1990). Rate expressions combining adduct formation,dissociation, and subsequent reaction with O2 have been proposed which are not reproduced here (see also data sheets onHOCS2 + M and HOCS2 + O2). More experiments separating the individual steps are required, as are temperature dependentstudies.
References
Becker, K. H., Nelsen, W., Su, Y. and Wirtz, K.: Chem. Phys. Lett., 168, 559, 1990.Bulatov, V. P., Cheskis, S. G., Iogansen, A. A., Kulatov, P. V., Sarkisov, O. M. and Hassinen, E.: Chem. Phys. Lett., 153, 258,1988.Diau, E. W.-G. and Lee, Y.-P.: J. Phys. Chem., 95, 379, 1991.Hynes, A. J., Wine, P. H. and Nicovich, J. M.: J. Phys. Chem., 92, 3846, 1988.Lovejoy, E. R., Murrells, T. P., Ravishankara, A. R. and Howard, C. J.:J. Phys. Chem., 94, 2386, 1990.Murrells, T. P., Lovejoy, E. R. and Ravishankara, A. R.: J. Phys. Chem., 94, 2381, 1990.
www.atmos-chem-phys.org/acp/4/1461/ Atmos. Chem. Phys., 4, 1461–1738, 2004
1646 R. Atkinson et al.: Evaluated kinetic and photochemical data for Ox, HOx, NOx and SOx
I.A4.91
HOCS2 + M→ HO + CS2 + M
1H ◦ = 44.0 kJ·mol−1
Low-pressure rate coefficients
Rate coefficient data
k0[M]/s−1 Temp./K Reference Technique/Comments
Absolute Rate Coefficients
1.3×10⁴ at 0.100 bar N2 255 Hynes et al., 1988 PLP-LIF (a)2.6×10⁴ at 0.108 bar N2 2804.3×103 at 0.020 bar N2 277 Murrells et al., 1990 PLP-LIF (b)3.0×10⁴ at 0.032 bar N2 2987.36×10−15 [He] 298 Diau and Lee, 1991 PLP-LIF (c)2.14×10⁻¹⁵ [He] 2690.46×10−15 [He] 249
Comments
(a) Photolysis at 298 K in mixtures of CS2 and He, N2, air or O2. Pressure range 87–920 mbar (65–690 Torr). A value ofKc
(297 K) = 1.39×10⁻¹⁷ cm3 molecule−1 was obtained for the equilibrium between HO + CS2 and HOCS2 as well asKc
(247 K) = 3.5×10⁻¹⁶ cm3 molecule−1.
(b) Photolysis of H2O2 at 248 nm and 266 nm in He-N2-CS2 or He-SF6-CS2 mixtures. Pressure range = 12–80 mbar (9–60Torr). The effect of O2 [0.7–20 mbar (0.5–15 Torr)] on the rate was studied.Kc (299 K) = 1.7×10⁻¹⁷ cm3 molecule−1, Kc
(274 K) = 7.5×10⁻¹⁷ cm3 molecule−1 andKc (249 K) = 5.1×10⁻¹⁶ cm3 molecule−1 were obtained for the equilibriumbetween HO + CS2 and HOCS2.
(c) Photolysis of H2O2 at 248 nm in mixtures of CS2 and He or Ar. Pressure range 12–360 mbar (9–270) Torr of He.The effect of CS2 on the rate was studied.Kc (298 K) = 0.87×10⁻¹⁷ cm3 molecule−1, Kc (273 K) = 4.2×10⁻¹⁷ cm3
molecule−1 andKc (249 K) = 2.6×10⁻¹⁶ cm3 molecule−1 were obtained for the equilibrium between HO + CS2 andHOCS2.
Preferred Values
k0 = 4.8×10⁻¹⁴ [N2] s−1 at 298 K.k0 = 1.6×10⁻⁶ exp(−5160/T ) [N2] s−1 over the temperature range 250–300 K.
Reliability
1log k0 = ±0.5 at 298 K.1(E/R) = ±500 K.
Comments on Preferred Values
The preferred values are based on a falloff representation from Hynes et al. (1988) and Murrells et al. (1990) of the data forthe reverse process HO + CS2 + M → HOCS2 + M and the determination of the equilibrium constant from the same work.The data from Diau and Lee (1991) are not consistent with this evaluation (with differences of about a factor of 2). HOCS2formation and dissociation are characterized by an equilibrium constant ofKc = 5.16×10⁻²⁵ exp(5160/T ) cm3 molecule−1,such as derived from the data of Murrells et al. (1990).
Atmos. Chem. Phys., 4, 1461–1738, 2004 www.atmos-chem-phys.org/acp/4/1461/

R. Atkinson et al.: Evaluated kinetic and photochemical data for Ox, HOx, NOx and SOx 1647
High-pressure rate coefficients
Rate coefficient data
k∞/s−1 Temp./K Reference Technique/Comments
Absolute Rate Coefficients
3.1×10⁴ at 0.907 bar N2 252 Hynes et al., 1988 PLP-LIF (a)6.5×10⁴ at 0.913 bar N2 2702.2×105 at 0.880 bar N2 2977.4×104 at 0.200 bar Ar 298 Bulatov et al., 1988 PLP-LIF (b)
Comments
(a) See comment (a) fork0.
(b) Photolysis of O3 in the presence of H2O, CS2 and Ar. Rate of HOCS2 formation and decomposition measured andevaluated with an equilibrium constant ofKc = 2.6×10⁻¹⁷ cm3 molecule−1.
Preferred Values
k∞ = 4.8×10⁵ s−1 at 298 K.k∞ = 1.6×10¹³ exp(−5160/T ) s−1 over the temperature range 250–300 K.
Reliability
1log k∞ = ±0.5 at 298 K.1(E/R) = ±500 K.
Comments on Preferred Values
The preferred values are based on the falloff extrapolation of the data for the reverse reaction and the equilibrium constantKc = 5.16×10⁻²⁵ exp(5160/T ) cm3 molecule−1 from Murrells et al. (1990). Falloff curves are constructed with an estimatedvalue ofFc = 0.8. The small pre-exponential factor ofk∞ can be explained theoretically as being due to the low bond energyof HOCS2. For discussion of the mechanism see Hynes et al. (1988), Murrells et al. (1990) and Lovejoy et al. (1990).
References
Bulatov, V. P., Cheskis, S. G., Iogansen, A. A., Kulatov, P. V., Sarkisov, O. M. and Hassinen, E.: Chem. Phys. Lett., 153, 258,1988.Diau, E. W.-G. and Lee, Y.-P.: J. Phys. Chem., 95, 379, 1991.Hynes, A. J., Wine, P. H. and Nicovich, J. M.: J. Phys. Chem., 92, 3846, 1988.Lovejoy, E. R., Murrells, T. P., Ravishankara, A. R. and Howard, C. J.:J. Phys. Chem., 94, 2386, 1990.Murrells, T. P., Lovejoy, E. R. and Ravishankara, A. R.: J. Phys. Chem., 94, 2381, 1990.
www.atmos-chem-phys.org/acp/4/1461/ Atmos. Chem. Phys., 4, 1461–1738, 2004
1648 R. Atkinson et al.: Evaluated kinetic and photochemical data for Ox, HOx, NOx and SOx
I.A4.92
HOCS2 + O2 → products
Rate coefficient data
k/cm3 molecule−1 s−1 Temp./K Reference Technique/Comments
Absolute Rate Coefficients
1.4×10⁻¹⁴ exp[(217± 301)/T ] 251–348 Hynes et al., 1988 PLP-LIF (a)(3.26± 0.70)×10−14 295± 1(2.6± 1.0)×10−14 249–299 Murrells et al., 1990 PLP-LIF(2.4± 0.4)×10−14 273 Lovejoy et al., 1990a PLP-LIF (b)(3.1± 0.6)×10−14 298 Diau and Lee, 1991 PLP-LIF (c)
Comments
(a) The effects of He, N2, air and O2 were studied, and the total pressure was varied over the range 87–920 mbar (65–690Torr). If the rate coefficientk is assumed to be temperature independent, the average of the measured values is (2.9±
1.1)×10−14 cm3 molecule−1 s−1 over the range 251–348 K.
(b) A rate coefficient for the reaction of the DOCS2 radical with O2 of (2.3± 0.4)×10−14 cm3 molecule−1 s−1 at 273 K wasalso measured (Lovejoy et al., 1990a), showing no significant deuterium isotope effect and hence no evidence for a directH-atom abstraction process.
(c) Values ofk(HOCS2 + NO) = (7.3± 1.8)×10−13 cm3 molecule−1 s−1 andk(HOCS2 + NO2) = (4.2± 1.0) x 10−11 cm3
molecule−1 s−1 at 298 K were also obtained in this work. The latter is the first measurement of the rate coefficient for thereaction with NO2. The rate coefficient for the reaction with NO is consistent with the values ofk(HOCS2 + NO) = (1.3± 0.4)×10−12 cm3 molecule−1 s−1 at 249 K andk(HOCS2 + NO) = (9.1± 3.5)×10−13 cm3 molecule−1 s−1 at 299 Kmeasured by Lovejoy et al. (1990b).
Preferred Values
k = 2.8×10⁻¹⁴ cm3 molecule−1 s−1, independent of temperature over the range 240–350 K.
Reliability
1log k = ±0.15 over the temperature range 240–350 K.
Comments on Preferred Values
The reaction of HOCS2 with O2 is an intermediate step in the overall reaction of the HO radical with CS2 under atmosphericconditions. The HOCS2 is formed by the addition of HO to CS2; once formed it may undergo dissociation back to HO andCS2 or react with O2.
The four studies (Hynes et al., 1988; Murrells et al., 1990; Lovejoy et al., 1990a; Diau et al., 1991) of the kinetics of thisreaction, all using the same general experimental technique, are in good agreement. The rate coefficients measured by Hyneset al. (1988) over the temperature range 251–348 K could equally well be represented by either the Arrhenius expression citedin the table, with a small negative temperature dependence, or by a temperature-independent rate coefficient. The results ofMurrells et al. (1990) favor the latter. For the preferred values we assume the rate coefficient to be temperature independentover the temperature range studied and take a mean of the values of Hynes et al. (1988), Murrells et al. (1990), Lovejoy etal. (1990a) and Diau and Lee (1991).
Lovejoy et al. (1990b; 1994) used LP-LIF to measure an HO2 radical formation yield of 0.95± 0.15 (249–300 K) from thereaction of the HO radical with CS2 in the presence of O2 (by converting HO2 radicals to HO radicals by reaction with NO)
Atmos. Chem. Phys., 4, 1461–1738, 2004 www.atmos-chem-phys.org/acp/4/1461/
R. Atkinson et al.: Evaluated kinetic and photochemical data for Ox, HOx, NOx and SOx 1649
(Lovejoy et al., 1990b), and used DF-CIMS to measure an SO2 yield from the HO radical reaction with CS2 in the presence ofO2 of 0.90± 0.20 at 340 K (Lovejoy et al., 1994).
The main steps in the atmospheric oxidation of CS2 initiated by HO are then
HO + CS2 ↔ HOCS2
followed by the overall reaction
HOCS2 + 2O2 → HO2 + SO2 + OCS
In the atmosphere, reaction of the HOCS2 with O2 predominates over reaction with NO or NO2. The study by Stickel etal. (1993) has provided some further insight into the mechanism of this complex reaction. Two types of experiment wereperformed. In one, the reaction was initiated by pulsed laser photolysis and product concentrations monitored in real timeby tunable diode laser absorption spectroscopy. In the other, continuous photolysis was used with FTIR product detection.Products observed were OCS, SO2, CO, and CO2. Both experiments gave concordant values for the yields of OCS and COof 0.83± 0.08 and 0.16± 0.03, respectively. The yield of CO2 was small (<0.01). The overall yield of SO2 (1.15± 0.10)was made up of two components, a ’prompt’ value of 0.84± 0.20 resulting from SO2 produced in a primary channel of thereaction and a longer time component assumed due to production of SO2 from reaction of O2 with S or SO produced in anotherprimary channel. The data of Stickel et al. (1993) thus suggest two primary channels, the major one leading to OCS and SO2and a minor channel leading to CO and SO. There are a number of possible reaction channels leading directly to these speciesor to their precursors, which subsequently produce them on a very short time scale.
Lovejoy et al. (1994) used DF-CIMS to investigate the products of the reaction of the H18O radical with CS2 in 16O2 at∼340 K, and observed the formation of16OS18O with a yield of 0.90± 0.20. S16O2 formation was observed (Lovejoy et al.,1994), and this may be consistent with the formation of S atoms or SO radicals (Stickel et al., 1993).
These studies suggest that the reaction pathway
HOCS2 + O2 → HCO+ SO2 + S
followed by reactions of HCO and S to form HO2 + CO and SO2 accounts for∼15% of the overall reaction (Stickel et al.,1993), with the remainder (∼85%) proceeding by (Lovejoy et al., 1994)
HOCS2 + O2 → HO2 + CS2O
CS2O + O2 → OCS+ SO2
or
HOCS2 + O2 → HOSO+ OCS
HOSO+ O2 → HO2 + SO2
or
HOCS2 + O2 → HOCS+ SO2
HOCS+ O2 → HO2 + OCS
A theoretical study of the HOCS2-O2 intermediate (Zhang and Qin, 2000) suggests that HOSO and OCS are the maindissociation products, which would then be followed by the reaction HOSO + O2 → HO2 + SO2.
References
Diau, E. W.-G. and Lee, Y.-P.: J. Phys. Chem., 95, 7726, 1991.Hynes, A. J., Wine, P. H. and Nicovich, J. M.: J. Phys. Chem., 92, 3846, 1988.Lovejoy, E. R., Kroeger, K. S. and Ravishankara, A. R.: Chem. Phys. Lett., 167, 183, 1990a.Lovejoy, E. R., Murrells, T. P., Ravishankara, A. R. and Howard, C. J.:J. Phys. Chem., 94, 2386, 1990b.Lovejoy, E. R., Ravishankara, A. R. and Howard, C. J.: Int. J. Chem. Kinet., 26, 551, 1994.Murrells, T. P., Lovejoy, E. R. and Ravishankara, A. R.: J. Phys. Chem., 94, 2381, 1990.Stickel, R. E., Chin, M., Daykin, E. P., Hynes, A. J., Wine, P. H. and Wallington, T. J.: J. Phys. Chem., 97, 13 653, 1993.Zhang, L. and Qin, Q.: J. Mole. Struct., 531, 375, 2000.
www.atmos-chem-phys.org/acp/4/1461/ Atmos. Chem. Phys., 4, 1461–1738, 2004

1650 R. Atkinson et al.: Evaluated kinetic and photochemical data for Ox, HOx, NOx and SOx
I.A4.93
HO + CH3SH → products
Rate coefficient data
k/cm3 molecule−1 s−1 Temp./K Reference Technique/Comments
Absolute Rate Coefficients
8.89×10⁻¹² exp[(398± 151)/T ] 300–423 Atkinson et al., 1977 FP-RF(3.39± 0.34)×10−11 3001.15×10−11 exp[(338± 100)/T ] 244–366 Wine et al., 1981 FP-RF(3.37± 0.41)×10−11 2981.01×10−11 exp[(347± 59)/T ] 254–430 Wine et al., 1984 FP-RF3.24×10−11 2983.69×10−11 270 Hynes and Wine, 1987 PLP-LIF (a)3.17×10⁻¹¹ 300
Relative Rate Coefficients
(9.68± 0.97)×10−11 297± 2 Cox and Sheppard, 1980 RR (b)(3.72± 0.37)×10−11 300 Barnes et al., 1986 RR (c)(3.50± 0.49)×10−11 313
Comments
(a) The rate coefficients were observed to be independent of total pressure and of the presence or absence of O2, up to 196mbar O2 at 270 K or 933 mbar O2 at 300 K.
(b) HO radicals were generated by the photolysis of HONO-NO-air mixtures at atmospheric pressure. The decay of CH3SHwas measured relative to that of C2H4 by GC, and the relative rate coefficient placed on an absolute basis by use of a ratecoefficient ofk(HO + C2H4) = 8.57 x 10⁻¹² cm3 molecule−1 s−1 at 297 K and atmospheric pressure of air (Atkinson,1997).
(c) HO radicals were generated by the photolysis of H2O2 in N2 at atmospheric pressure. The decay of CH3SH was measuredrelative to that for propene by GC, and the relative rate coefficients placed on an absolute basis by use of a rate coefficientof k(HO + propene) = 4.85×10⁻¹² exp(504/T ) cm3 molecule−1 s−1 at atmospheric pressure of air (Atkinson, 1997).
Preferred Values
k = 3.3×10⁻¹¹ cm3 molecule−1 s−1 at 298 K.k = 9.9×10⁻¹² exp(356/T ) cm3 molecule−1 s−1 over the temperature range 240–430 K.
Reliability
1log k = ±0.10 at 298 K.1(E/R) = ±100 K.
Comments on Preferred Values
The preferred values are based upon a least-squares analysis of the absolute rate coefficients of Atkinson et al. (1977), Wineet al. (1981; 1984) and Hynes and Wine (1987), which are in excellent agreement. The relative rate study of Barnes et al. (1986)shows that erroneous rate coefficient data are obtained in the presence of O2 and NO, thus accounting for the much higher valueof Cox and Sheppard (1980).
Atmos. Chem. Phys., 4, 1461–1738, 2004 www.atmos-chem-phys.org/acp/4/1461/

R. Atkinson et al.: Evaluated kinetic and photochemical data for Ox, HOx, NOx and SOx 1651
The study of Hynes and Wine (1987) shows that there is no observable effect of O2 on the measured rate coefficient, andthe rate coefficients at 298 K for the reactions of the HO radical with CD3SH (Hynes and Wine, 1987) and CH3SD (Wine etal., 1984) are within 15% of that for HO + CH3SH. These data indicate (Wine et al., 1984; Hynes and Wine, 1987) that thereaction proceeds via initial addition of HO to form the adduct CH3S(OH)H (Wine et al., 1984). Tyndall and Ravishankara(1989) have determined, by monitoring the CH3S radical by LIF, a CH3S radical yield from the reaction of the HO radical withCH3SH of 1.1± 0.2. The reaction then proceeds by
HO + CH3SH → [CH3S(OH)H] → H2O + CH3S
Butkovskaya and Setser (1999) concluded, from observations of the IR chemiluminescent spectra of reactions of HO andDO radicals with CH3SH and CH3SD, that direct H-atom abstraction from the CH3 group accounts for 11± 4% of the totalof the DO radical reactions and 24± 8% of the total of the HO radical reactions.
References
Atkinson, R., Perry, R. A. and Pitts Jr., J. N.: J. Chem. Phys., 66, 1578, 1977.Atkinson, R.: J. Phys. Chem. Ref. Data, 26, 215, 1997.Barnes, I., Bastian, V., Becker, K. H., Fink, E. H. and Nelsen, W.: J. Atmos. Chem., 4, 445, 1986.Butkovskaya, N. I. and Setser, D. W.: J. Phys. Chem. A, 103, 6921, 1999.Cox, R. A. and Sheppard, D.: Nature, 284, 330, 1980.Hynes, A. J. and Wine, P. H.: J. Phys. Chem., 91, 3672, 1987.Tyndall, G. S. and Ravishankara, A. R.: J. Phys. Chem., 93, 4707, 1989.Wine, P. H., Kreutter, N. M., Gump, C. A. and Ravishankara, A. R.: J. Phys. Chem., 85, 2660, 1981.Wine, P. H., Thompson, R. J. and Semmes, D. H.: Int. J. Chem. Kinet., 16, 1623, 1984.
www.atmos-chem-phys.org/acp/4/1461/ Atmos. Chem. Phys., 4, 1461–1738, 2004

1652 R. Atkinson et al.: Evaluated kinetic and photochemical data for Ox, HOx, NOx and SOx
I.A4.94
HO + CH3SCH3 → H2O + CH2SCH3 (1)→ CH3S(OH)CH3 (2)→ CH3S + CH3OH (3)→ CH3 + CH3SOH (4)
1H ◦(1) = −105 kJ·mol−1
1H ◦(2) ≈ −43 kJ·mol−1[uses1Hf CH3S(OH)CH3 =43 kJ·mol−1 (Turnipseed et al., 1996)]1H ◦(3) = −77 kJ·mol−1
1H ◦(4) ≈ 0 kJ·mol−1
Rate coefficient data (k = k1 + k2+ k3 + k4)
k/cm3 molecule−1 s−1 Temp./K Reference Technique/Comments
Absolute Rate Coefficients
k1 = 1.15×10⁻¹¹ exp[−(338± 100)/T ] 248–363 Wine et al., 1981 FP-RFk1 = (4.26± 0.56)×10−12 298(6.28± 0.10)×10−12 (1 bar of air) 298 Hynes et al., 1986 PLP-LIF (a)k1 = 1.36×10⁻¹¹ exp[−(332± 96)/T ] 276–397 Hynes et al., 1986 FP-RFk1 = 4.46×10⁻¹² 298k1 = 1.18×10⁻¹¹ exp[−(236± 150)/T ] 260–393 Hsu et al., 1987 DF-RF (b)k1 = (5.54± 0.15)×10−12 298k1 = 1.35×10⁻¹¹ exp[−(285± 135)/T ] 297–368 Abbatt et al., 1992 DF-LIF (c)k1 = (4.98± 0.46)×10−12 297± 2k1 = (4.95± 0.35)×10−12 298 Barone et al., 1996 PLP-LIF
Branching Ratios
k1/k = 0.84± 0.15 298 Stickel et al., 1993 (d)k1/k = 0.84± 0.26 298 Turnipseed et al., 1996 (e)k3/k < 0.04 298 Turnipseed et al., 1996 (f)k4/k < 0.07 298 Zhao et al., 1996 (g)
Comments
(a) Detection of HO, with the effects of O2 being investigated over the temperature range 261–321 K. The measured ratecoefficient was observed to depend on the O2 concentration, and the rate coefficient given in the table is that measured at1 bar (750 Torr) total pressure of air. The rate coefficient measured in the absence of O2 is ascribed to reaction (1), withthe adduct formed in (2) rapidly dissociating back to the reactants. In the presence of O2 this adduct reacts rapidly withO2, and hence the measured rate coefficient increases with the O2 concentration.
(b) Rate coefficient not affected by the addition of up to 1.3 mbar (1 Torr) of O2.
(c) HO generated from the H + NO2 reaction. The total pressure was varied over the range 14.1–130 mbar (10.6–97.5 Torr)of N2. The measured rate coefficient was invariant to the total pressure over this range.
(d) For the reaction DO + CH3SCH3, HDO was monitored by tunable diode laser absorption spectroscopy, and the branchingratio obtained by assuming a unit HDO yield from the DO radical reaction withn-hexane and cyclohexane. The branchingratio was independent of total pressure of N2 [13–40 mbar (10–30 Torr)], temperature (298–348 K) and replacement of 13mbar (10 Torr) total pressure of N2 by 13 mbar total pressure of O2. From the temporal profiles of the HDO signals, ratecoefficientsk1 for the reaction of the DO radical with CH3SCH3 of (5.4± 0.4)×10−12 cm3 molecule−1 s−1 at 298 K and13 mbar (10 Torr) N2, (5.8± 1.9)×10−12 cm3 molecule−1 s−1 at 298 K and 40 mbar (30 Torr) N2, and (4.4± 1.0)×10−12
cm3 molecule−1 s−1 at 348 K and 13 mbar (10 Torr) N2 were also obtained, in agreement with the rate coefficients for theHO radical reaction.
(e) Indirect measurement of CH3SCH2 by addition of O2 and NO and measuring CH3S formation by LIF.
Atmos. Chem. Phys., 4, 1461–1738, 2004 www.atmos-chem-phys.org/acp/4/1461/
R. Atkinson et al.: Evaluated kinetic and photochemical data for Ox, HOx, NOx and SOx 1653
(f) Direct detection of CH3S by LIF
(g) Direct detection of CH3 using TDLAS
Preferred Values
k1 = 1.13×10⁻¹¹ exp(−253/T ) cm3 molecule−1 s−1 over the temperature range 240–400 K.k2 = 1.0×10−39 [O2] exp(5820/T )/{1 + 5.0×10⁻³⁰ [O2] exp(6280/T )} cm3 molecule−1 s−1 over the temperature range240–360 K.
Reliability
1log k1 = ±0.10 at 298 K.1(E1/R) = ±150 K.1log k2 = ±0.3 at 298 K and 1 bar of air.
Comments on Preferred Values
It is now recognized (Hynes et al., 1986; Barone et al., 1996; Atkinson, 1994; Barnes et al., 1988; Wallington et al., 1986)that this reaction proceeds via the two reaction steps (1) and (2). The CH3S(OH)CH3 adduct radical decomposes sufficientlyrapidly such that in the absence of O2 only the rate coefficientk1 is measured. In the presence of O2 the CH3S(OH)CH3 radicalreacts by CH3S(OH)CH3 + O2 → products. Hence only in the presence of O2 is the addition channel (2) observed, with therate coefficient being dependent on the O2 concentration (but, to at least a first approximation, not on the concentration of otherthird bodies such as N2, Ar or SF6 (Hynes et al., 1986)). HO2 is formed at≈ 50% yield in the reaction of CH3S(OH)CH3withO2
The relative rate study of Wallington et al. (1986) showed that previous relative studies carried out in the presence of NOare dubious. The rate coefficients measured in the absence of O2 by Wine et al. (1981), Martin et al. (1985), Wallington et al.(1986), Hynes et al. (1986), Hsu et al. (1987), Barnes et al. (1988), Nielsen et al. (1989), Abbatt et al. (1992) and Barone etal. (1996) confirm that the earlier absolute rate coefficients of Atkinson et al. (1978) and Kurylo (1978) were erroneously high,and those of Mac Leod et al. (1984) were in error because of wall reactions (Martin et al., 1985). The preferred rate coefficientsk1 for the abstraction channel (1) are based on the studies of Wine et al. (1981), Hynes et al. (1986), Hsu et al. (1987), Abbattet al. (1992) and Barone et al. (1996) and the rate coefficient for the HO radical addition channel (2) utilizes the data of Hyneset al. (1986) and Williams et al. (2001). The expression fork2 reproduces the O2 andT dependence ofkobs (kobs = k1 + k2+k3+ k4 ≡ k1 + k2) of Hynes et al. (1986) and Williams et al. (2001) at pressures close to one atmosphere (where the ratecoefficients for HO addition to CH3SCH3 and the reverse dissociation step may be in the falloff region). This equation fits theroom temperature data obtained at pressures of air from 0.07 to 0.93 bar, though there are large differences in measured valuesof k at 100 Torr and 760 Torr at low temperatures (Hynes et al., 1986; Barone et al., 1996; Williams et al., 2001).
References
Abbatt, J. P. D., Fenter, F. F. and Anderson, J. G.: J. Phys. Chem., 96, 1780, 1992.Atkinson, R.: J. Phys. Chem. Ref. Data, Monograph 2, 1, 1994.Atkinson, R., Perry, R. A. and Pitts Jr., J. N.: Chem. Phys. Lett., 54, 14, 1978.Barnes, I., Bastian V. and Becker, K. H.: Int. J. Chem. Kinet., 20, 415, 1988.Barone, S. B., Turnipseed, A. A. and Ravishankara, A. R.: J. Phys. Chem., 100, 14 694, 1996.Hynes, A. J., Wine, P. H. and Semmes, D. H.: J. Phys. Chem., 90, 4148, 1986.Hsu, Y.-C., Chen, D.-S. and Lee, Y.-P.: Int. J. Chem. Kinet., 19, 1073, 1987.Kurylo, M. J.: Chem. Phys. Lett., 58, 233, 1978.Mac Leod, H., Jourdain, J. L., Poulet, G. and Le Bras, G.: Atmos. Environ., 18, 2621, 1984.Martin, D., Jourdain, J. L. and Le Bras, G.: Int. J. Chem. Kinet., 17, 1247, 1985.Nielsen, O. J., Sidebottom, H. W., Nelson, L., Treacy, J. J. and O’Farrell, D. J.: Int. J. Chem. Kinet., 21, 1101, 1989.Stickel, R. E., Zhao, Z. and Wine, P. H.: Chem. Phys. Lett., 212, 312, 1993.Turnipseed, A. A., Barone, S. B. and Ravishankara, A. R.: J. Phys. Chem., 100, 14 703, 1996.Wallington, T. J., Atkinson, R., Tuazon, E. C. and Aschmann, S. M.: Int. J. Chem. Kinet., 18, 837, 1986.Williams, M. B., Campuzano-Jost, P., Bauer, D. and Hynes, A. J.: Chem. Phys. Lett., 344, 61, 2001.Wine, P. H., Kreutter, N. M., Gump, C. A. and Ravishankara, A. R.: J. Phys. Chem., 85, 2660, 1981.Zhao, Z., Stickel, R. E. and Wine, P. H.: Chem. Phys. Lett., 251, 59, 1996.
www.atmos-chem-phys.org/acp/4/1461/ Atmos. Chem. Phys., 4, 1461–1738, 2004
1654 R. Atkinson et al.: Evaluated kinetic and photochemical data for Ox, HOx, NOx and SOx
I.A4.95
HO + CH3SSCH3 → products
Rate coefficient data
k/cm3 molecule−1 s−1 Temp./K Reference Technique/Comments
Absolute Rate Coefficients
5.9×10⁻¹¹ exp[(380± 160)/T ] 249–367 Wine et al., 1981 FP-RF(1.98± 0.18)×10−10 2986.2×10−11 exp[(410± 210)/T ] 297–366 Abbatt et al., 1992 DF-LIF(2.39± 0.30)×10−10 297(2.4± 0.9)×10−10 298 Domine and Ravishankara, 1992 (a)
Relative Rate Coefficients
(2.40± 0.86)×10−10 297± 2 Cox and Sheppard, 1980 RR (b)
Comments
(a) Discharge-flow system with photoionization-MS detection of CH3SOH and CH3S product species. The temporal profilesof these product species yielded the cited rate coefficient. The CH3S radical formation yield from the HO radical reactionwith CH3SSCH3 was measured to be 0.28± 0.20 using a pulsed laser photolysis system with LIF detection of CH3S.The photolysis of CH3SSCH3 at 266 nm was used to normalize the CH3S radical signal, with the CH3S radical formationyield from the photolysis of CH3SSCH3 being 1.8± 0.2 at 248 nm (Turnipseed et al., 1993).
(b) A rate coefficient ratio ofk(HO + CH3SSCH3)/k(HO + ethene) = 28± 10 was measured by GC analyses of CH3SSCH3and ethene in irradiated HONO-CH3SSCH3-ethene-air mixtures at atmospheric pressure. The measured rate coefficientratio is placed on an absolute basis by use of a rate coefficient ofk(HO + ethene) = 8.57×10⁻¹² cm3 molecule−1 s−1 at297 K and atmospheric pressure of air (Atkinson, 1997).
Preferred Values
k = 2.3×10⁻¹⁰ cm3 molecule−1 s−1 at 298 K.k = 7.0×10⁻¹¹ exp(350/T ) cm3 molecule−1 s−1 over the temperature range 250–370 K.
Reliability
1log k = ±0.10 at 298 K.1(E/R) = ±200 K.
Comments on Preferred Values
The absolute rate coefficients of Wine et al. (1981), Abbatt et al. (1992) and Domine and Ravishankara (1992) are in excellentagreement. The preferred values are derived from a least-squares analysis of the absolute rate coefficients of Wine et al. (1981)and Abbatt et al. (1992). The magnitude of the rate coefficient and the negative temperature dependence indicates that thereaction proceeds by initial HO radical addition to the S atoms:
HO + CH3SSCH3 → CH3SS(OH)CH3
Domine and Ravishankara (1992) measured a CH3S yield of 0.28± 0.20, independent of pressure (73–640 mbar) and diluentgas (N2 and SF6) at 298 K, indicating that products other than CH3S and CH3SOH are formed in this reaction. Butkovskayaand Setser (1999), from a study of the IR chemiluminescence from the reactions of HO and DO radicals with CH3SSCH3,concluded that the major reaction pathway is that to form CH3SH (or CH3SD) + CH3SO, with these products dominatingby a factor of≥3 over formation of CH3S + CH3SOH (Butkovskaya and Setser, 1999). Hence the studies of Domine andRavishankara (1992) and Butkovskaya and Setser (1999) are not inconsistent.
Atmos. Chem. Phys., 4, 1461–1738, 2004 www.atmos-chem-phys.org/acp/4/1461/
R. Atkinson et al.: Evaluated kinetic and photochemical data for Ox, HOx, NOx and SOx 1655
References
Abbatt, J. P. D., Fenter F. F. and Anderson, J. G.: J. Phys. Chem., 96, 1780, 1992.Atkinson, R.: J. Phys. Chem. Ref. Data, 26, 215, 1997.Butkovskaya, N. I. and Setser, D. W.: Chem. Phys. Lett., 312, 37, 1999.Cox, R. A. and Sheppard, D.: Nature, 284, 330, 1980.Domine, F. and Ravishankara, A. R.: Int. J. Chem. Kinet., 24, 943, 1992.Turnipseed, A. A., Barone, S. B. and Ravishankara, A. R.: J. Phys. Chem., 97, 5926, 1993.Wine, P. H., Kreutter, N. M., Gump, C. A. and Ravishankara, A. R.: J. Phys. Chem., 85, 2660, 1981.
www.atmos-chem-phys.org/acp/4/1461/ Atmos. Chem. Phys., 4, 1461–1738, 2004

1656 R. Atkinson et al.: Evaluated kinetic and photochemical data for Ox, HOx, NOx and SOx
I.A4.96
HO2 + H2S→ products
Rate coefficient data
k/cm3 molecule−1 s−1 Temp./K Reference Technique/Comments
Absolute Rate Coefficients
(5 ± 1)×10−12 298 Bulatov et al., 1990 FP-A (a)<3×10⁻¹⁵ 298 Mellouki and Ravishankara, 1994 DF-LMR
Comments
(a) HO2 radicals were monitored by intracavity laser absorption in the near IR.
Preferred Values
k <3×10⁻¹⁵ cm3 molecule−1 s−1 at 298 K.
Comments on Preferred Values
This upper limit is taken from the study of Mellouki and Ravishankara (1994). It is consistent with the upper limits reportedfor the corresponding reactions of HO2 with CH3SH and CH3SCH3. This upper limit is three orders of magnitude lower thanthe value reported by Bulatov et al. (1990) from a flash photolysis study using intracavity laser absorption in the near infraredto monitor HO2. The results of the more direct study (Mellouki and Ravishankara, 1994) are preferred.
References
Bulatov, V. P., Vereschuk, S. I., Dzegilenko, F. N., Sarkisov, O. M. and Khabarov, V. N.: Khim Fiz., 9, 1214, 1990.Mellouki, A. and Ravishankara, A. R.: Int. J. Chem. Kinet., 26, 355, 1994.
Atmos. Chem. Phys., 4, 1461–1738, 2004 www.atmos-chem-phys.org/acp/4/1461/

R. Atkinson et al.: Evaluated kinetic and photochemical data for Ox, HOx, NOx and SOx 1657
I.A4.97
HO2 + SO2 → products
Rate coefficient data
k/cm3 molecule−1 s−1 Temp./K Reference Technique/Comments
Relative Rate Coefficients
(1.0± 0.2)×10−15 300 Payne et al., 1973 RR (a)≤1×10⁻¹⁸ 300 Graham et al., 1979 RR (b)≤4.3×10⁻¹⁷
∼298 Burrows et al., 1979 RR (c)
Comments
(a) Photolysis of H2O-CO-18O2-N2 mixtures at 184.9 and 253.7 nm, with formation of C16O2 and C16,18O2 being monitored
by MS.k/k1/2(HO2 + HO2) was determined. The value tabulated here was calculated using the effective value ofk(HO2
+ HO2) in this system of 3.8×10⁻¹² cm3 molecule−1 s−1 (this review).
(b) Thermal decomposition of HO2NO2 monitored by IR absorption. Upper limit tok derived from the absence of a detectableeffect of added SO2 on the HO2NO2 decay rate.
(c) DF-LMR study.k/k(HO + H2O2) was determined. Value tabulated here was calculated usingk(HO + H2O2) = 1.7×10⁻¹²
cm3 molecule−1 s−1 (this review).
Preferred Values
k < 1×10⁻¹⁸ cm3 molecule−1 s−1 at 298 K.
Comments on Preferred Values
The most recent determination of Burrows et al. (1979) confirms that the reaction is slower than some earlier results (Payneet al., 1973) had suggested and supports the even lower upper limit set by Graham et al. (1979) which we take as the preferredvalue.
References
Burrows, J. P., Cliff, D. I., Harris, G. W., Thrush, B. A. and Wilkinson, J. P. T.: Proc. R. Soc. (London) A368, 463, 1979.Graham, R. A., Winer, A. M., Atkinson, R. and. Pitts Jr., J. N: J. Phys. Chem., 83, 1563, 1979.Payne, W. A., Stief, L. J. and Davis, D. D.: J. Am. Chem. Soc., 95, 7614, 1973.
www.atmos-chem-phys.org/acp/4/1461/ Atmos. Chem. Phys., 4, 1461–1738, 2004

1658 R. Atkinson et al.: Evaluated kinetic and photochemical data for Ox, HOx, NOx and SOx
I.A4.98
HO2 + CH3SH → products
Rate coefficient data
k/cm3 molecule−1 s−1 Temp./K Reference Technique/Comments
Absolute Rate Coefficients
<4×10⁻¹⁵ 298 Mellouki and Ravishankara, 1994 DF-LMR
Preferred Values
k < 4×10⁻¹⁵ cm3 molecule−1 s−1 at 298 K.
Comments on Preferred Values
This upper limit is taken from the study of Mellouki and Ravishankara (1994). It is consistent with the upper limits reportedfor the corresponding reactions of HO2 with H2S and CH3SCH3. It is also consistent with results noted in the Barnes etal. (1986) study of the reactions of the HO radical with various sulfur compounds. In that publication (Barnes et al., 1986) theauthors stated that previous experiments in that laboratory had shown that the rate coefficients for reactions of HO2 with thiolswere<1×10⁻¹⁵ cm3 molecule−1 s−1.
References
Barnes, I., Bastian, V., Becker, K. H., Fink, E. H. and Nelsen, W.: J. Atmos. Chem., 4, 445, 1986.Mellouki, A. and Ravishankara, A. R.: Int. J. Chem. Kinet., 26, 355, 1994.
Atmos. Chem. Phys., 4, 1461–1738, 2004 www.atmos-chem-phys.org/acp/4/1461/
R. Atkinson et al.: Evaluated kinetic and photochemical data for Ox, HOx, NOx and SOx 1659
I.A4.99
HO2 + CH3SCH3 → products
Rate coefficient data
k/cm3 molecule−1 s−1 Temp./K Reference Technique/Comments
Absolute Rate Coefficients
<5×10⁻¹⁵ 298 Mellouki and Ravishankara, 1994 DF-LMR
Preferred Values
k < 5×10⁻¹⁵ cm3 molecule−1 s−1 at 298 K.
Comments on Preferred Values
This upper limit is taken from the study of Mellouki and Ravishankara (1994). It is consistent with the upper limits reportedfor the corresponding reactions of the HO2 radical with H2S and CH3SH. It is also consistent with unpublished results of Niki,who in a study of the decay of CH3SCH3 in the presence of HO2 in 1 bar air showed the reaction of HO2 with CH3SCH3 to bevery slow withk < 1×10⁻¹⁵ cm3 molecule−1 s−1 (reported in Mellouki and Ravishankara (1994) as a private communicationfrom H. Niki).
References
Mellouki, A. and Ravishankara, A. R.: Int. J. Chem. Kinet., 26, 355, 1994.
www.atmos-chem-phys.org/acp/4/1461/ Atmos. Chem. Phys., 4, 1461–1738, 2004

1660 R. Atkinson et al.: Evaluated kinetic and photochemical data for Ox, HOx, NOx and SOx
I.A4.100
NO3 + H2S→ products
Rate coefficient data
k/cm3 molecule−1 s−1 Temp./K Reference Technique/Comments
Absolute Rate Coefficients
≤3×10⁻¹⁴ 298± 2 Wallington et al., 1986 FP-A<8×10⁻¹⁶ 298 Dlugokencky and Howard, 1988 F-LIF
Relative Rate Coefficients
<2.5×10⁻¹⁴ 298 Cantrell et al., 1987 RR (a)
Comments
(a) NO3 radicals were generated by the thermal decomposition of N2O5, and the rate coefficient placed on an absolute basisby use of an equilibrium constant for the NO3 + NO2 ↔ N2O5 reactions of 2.90×10⁻¹¹ cm3 molecule−1 at 298 K(IUPAC, current recommendation).
Preferred Values
k < 1×10⁻¹⁵ cm3 molecule−1 s−1 at 298 K.
Comments on Preferred Values
The preferred upper limit to the rate coefficient is based upon the absolute rate coefficient study of Dlugokencky and Howard(1988).
References
Cantrell, C. A., Davidson, J. A., Shetter, R. E., Anderson, B. A. and Calvert, J. G.: J. Phys. Chem., 91, 6017, 1987.Dlugokencky, E. J. and Howard, C. J.: J. Phys. Chem., 92, 1188, 1988.IUPAC: http://www.iupac-kinetic.ch.cam.ac.uk/Wallington, T. J., Atkinson, R., Winer, A. M. and Pitts Jr., J. N.: J. Phys. Chem., 90, 5393, 1986.
Atmos. Chem. Phys., 4, 1461–1738, 2004 www.atmos-chem-phys.org/acp/4/1461/
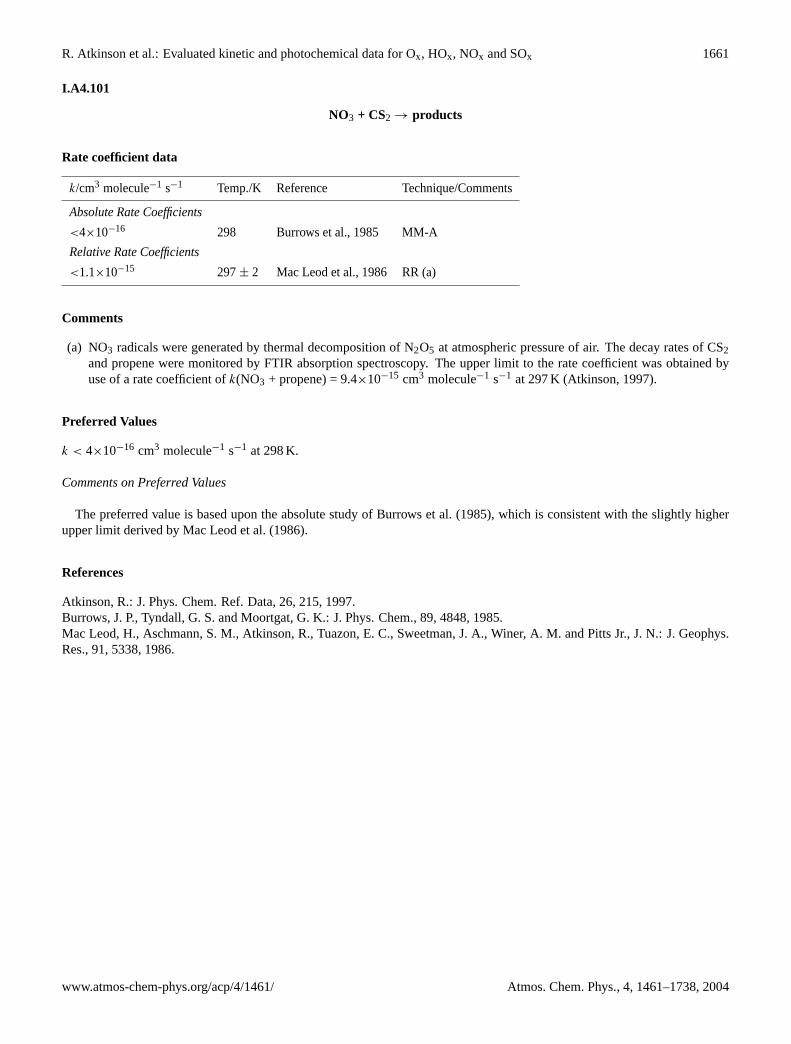
R. Atkinson et al.: Evaluated kinetic and photochemical data for Ox, HOx, NOx and SOx 1661
I.A4.101
NO3 + CS2 → products
Rate coefficient data
k/cm3 molecule−1 s−1 Temp./K Reference Technique/Comments
Absolute Rate Coefficients
<4×10⁻¹⁶ 298 Burrows et al., 1985 MM-A
Relative Rate Coefficients
<1.1×10⁻¹⁵ 297± 2 Mac Leod et al., 1986 RR (a)
Comments
(a) NO3 radicals were generated by thermal decomposition of N2O5 at atmospheric pressure of air. The decay rates of CS2and propene were monitored by FTIR absorption spectroscopy. The upper limit to the rate coefficient was obtained byuse of a rate coefficient ofk(NO3 + propene) = 9.4×10⁻¹⁵ cm3 molecule−1 s−1 at 297 K (Atkinson, 1997).
Preferred Values
k < 4×10⁻¹⁶ cm3 molecule−1 s−1 at 298 K.
Comments on Preferred Values
The preferred value is based upon the absolute study of Burrows et al. (1985), which is consistent with the slightly higherupper limit derived by Mac Leod et al. (1986).
References
Atkinson, R.: J. Phys. Chem. Ref. Data, 26, 215, 1997.Burrows, J. P., Tyndall, G. S. and Moortgat, G. K.: J. Phys. Chem., 89, 4848, 1985.Mac Leod, H., Aschmann, S. M., Atkinson, R., Tuazon, E. C., Sweetman, J. A., Winer, A. M. and Pitts Jr., J. N.: J. Geophys.Res., 91, 5338, 1986.
www.atmos-chem-phys.org/acp/4/1461/ Atmos. Chem. Phys., 4, 1461–1738, 2004
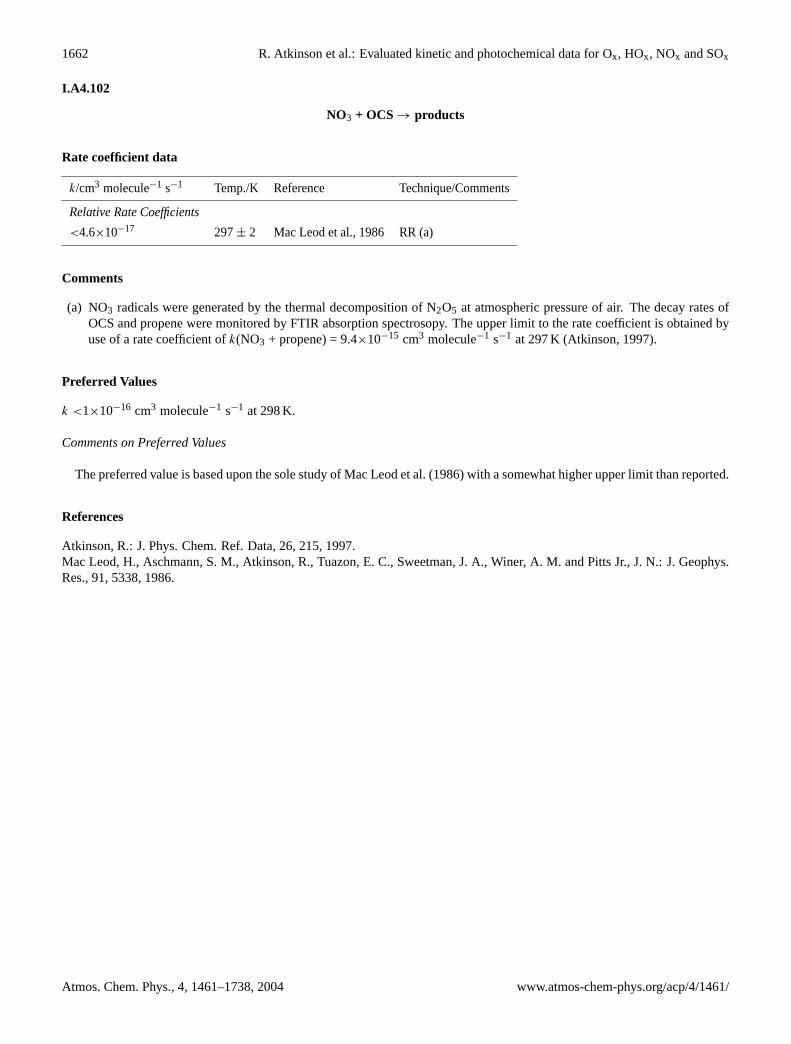
1662 R. Atkinson et al.: Evaluated kinetic and photochemical data for Ox, HOx, NOx and SOx
I.A4.102
NO3 + OCS→ products
Rate coefficient data
k/cm3 molecule−1 s−1 Temp./K Reference Technique/Comments
Relative Rate Coefficients
<4.6×10⁻¹⁷ 297± 2 Mac Leod et al., 1986 RR (a)
Comments
(a) NO3 radicals were generated by the thermal decomposition of N2O5 at atmospheric pressure of air. The decay rates ofOCS and propene were monitored by FTIR absorption spectrosopy. The upper limit to the rate coefficient is obtained byuse of a rate coefficient ofk(NO3 + propene) = 9.4×10⁻¹⁵ cm3 molecule−1 s−1 at 297 K (Atkinson, 1997).
Preferred Values
k <1×10⁻¹⁶ cm3 molecule−1 s−1 at 298 K.
Comments on Preferred Values
The preferred value is based upon the sole study of Mac Leod et al. (1986) with a somewhat higher upper limit than reported.
References
Atkinson, R.: J. Phys. Chem. Ref. Data, 26, 215, 1997.Mac Leod, H., Aschmann, S. M., Atkinson, R., Tuazon, E. C., Sweetman, J. A., Winer, A. M. and Pitts Jr., J. N.: J. Geophys.Res., 91, 5338, 1986.
Atmos. Chem. Phys., 4, 1461–1738, 2004 www.atmos-chem-phys.org/acp/4/1461/

R. Atkinson et al.: Evaluated kinetic and photochemical data for Ox, HOx, NOx and SOx 1663
I.A4.103
NO3 + SO2 → products
Rate coefficient data
k/cm3 molecule−1 s−1 Temp./K Reference Technique/Comments
Absolute Rate Coefficients
<4×10⁻¹⁶ 298 Burrows et al., 1985 MM-A≤4×10⁻¹⁶ 298± 2 Wallington et al., 1986 FP-A<1×10⁻¹⁷ 295± 2 Canosa-Mas et al., 1988a DF-A<1.2×10⁻¹⁷ 473 Canosa-Mas et al., 1988b DF-A<1×10⁻¹⁵ 298 Dlugokencky and Howard, 1988 F-LIF
Relative Rate Coefficients
<7×10⁻²¹ 303 Daubendiek and Calvert, 1975 RR (a)
Comments
(a) Derived from the lack of observation of SO3 formation in N2O5-SO2-O3 mixtures, using IR absorption spectroscopy tomeasure the concentrations of SO3.
Preferred Values
k <1×10⁻¹⁹ cm3 molecule−1 s−1 at 298 K.
Comments on Preferred Values
The preferred value is based upon the relative rate study of Daubendiek and Calvert (1975), with a much higher upperlimit. This preferred upper limit to the 298 K rate coefficient is consistent with the upper limits measured in the absolute ratecoefficient studies of Burrows et al. (1985), Wallington et al. (1986), Canosa-Mas et al. (1988a; 1988b) and Dlugokencky andHoward (1988).
References
Burrows, J. P., Tyndall, G. S. and Moortgat, G. K.: J. Phys. Chem., 89, 4848, 1985.Canosa-Mas, C., Smith, S. J., Toby, S. and Wayne, R. P.: J. Chem. Soc. Faraday Trans. 2, 84, 247, 1988a.Canosa-Mas, C., Smith, S. J., Toby, S. and Wayne, R. P.: J. Chem. Soc. Faraday Trans. 2, 84, 263, 1988b.Daubendiek, R. L. and Calvert, J. G.: Environ. Lett., 8, 103, 1975.Dlugokencky, E. J. and Howard, C. J.: J. Phys. Chem., 92, 1188, 1988.Wallington, T. J., Atkinson, R., Winer, A. M. and Pitts Jr., J. N.: J. Phys. Chem., 90, 5393, 1986.
www.atmos-chem-phys.org/acp/4/1461/ Atmos. Chem. Phys., 4, 1461–1738, 2004

1664 R. Atkinson et al.: Evaluated kinetic and photochemical data for Ox, HOx, NOx and SOx
I.A4.104
NO3 + CH3SH → products
Rate coefficient data
k/cm3 molecule−1 s−1 Temp./K Reference Technique/Comments
Absolute Rate Coefficients
1.0×10⁻¹³ exp[(600± 400)/T ] 280–350 Wallington et al., 1986 FP-A(8.1± 0.6)×10−13 298(7.7± 0.5)×10−13 298 Rahman et al., 1988 DF-MS1.09×10−12 exp[(0 ± 50)/T ] 254–367 Dlugokencky and Howard, 1988 F-LIF(1.09± 0.13)×10−12 298
Relative Rate Coefficients
(1.00± 0.22)×10−12 297± 2 Mac Leod et al., 1986 RR (a)
Comments
(a) NO3 radicals were generated by the thermal decomposition of N2O5 in N2O5-NO2-air mixtures at atmospheric pressure.The decay rates of CH3SH andtrans-2-butene were monitored by FTIR and GC respectively, and the measured ratecoefficient ratio ofk(NO3 + CH3SH)/k(NO3 + trans-2-butene) = 2.57± 0.55 is placed on an absolute basis by use of arate coefficient ofk(NO3 + trans-2-butene) = 3.89 x 10⁻¹³ cm3 molecule−1 s−1 (Atkinson, 1997).
Preferred Values
k = 9.2×10⁻¹³ cm3 molecule−1 s−1, independent of temperature over the range 250–370 K.
Reliability
1log k = ±0.15 at 298 K.1(E/R) = ±400 K.
Comments on Preferred Values
The preferred value at 298 K is the mean of the four studies carried out to date (Wallington et al., 1986; Rahman et al., 1988;Dlugokencky and Howard, 1988; Mac Leod et al., 1986), which are in reasonably good agreement. Although a significantnegative temperature dependence is indicated by the absolute rate coefficient study of Wallington et al. (1986), this is dueto the rate coefficient measured at 350 K, and the rate coefficients at 280 and 298 K are identical (Wallington et al., 1986).The temperature independence of the rate coefficient determined by Dluogokencky and Howard (1988) is accepted. Theexperimental data indicate that there is no pressure dependence of the rate coefficient, at least over the range∼0.0013–1 bar.
The magnitude of the rate coefficient and the lack of a temperature dependence of the rate coefficient shows that this reactionproceeds by initial addition, followed by decomposition of the adduct to yield CH3S radicals (see also the data sheet on theNO3 + CH3SCH3 reaction)
NO3 + CH3SH ↔ [CH3S(ONO2)H]‡
→ CH3S+ HNO3
This conclusion is consistent with the product studies carried out by Mac Leod et al. (1986) and Jensen et al. (1992). Jensenet al. (1992) identified CH3SO3H (methanesulfonic acid), SO2, HCHO, CH3ONO2, CH3SNO, and HNO3 as products of theNO3 radical reaction with CH3SH at 295± 2 K and 0.99± 0.01 bar (740± 10 Torr) total pressure of purified air.
Atmos. Chem. Phys., 4, 1461–1738, 2004 www.atmos-chem-phys.org/acp/4/1461/
R. Atkinson et al.: Evaluated kinetic and photochemical data for Ox, HOx, NOx and SOx 1665
References
Atkinson, R.: J. Phys. Chem. Ref. Data, 26, 215, 1997.Dlugokencky, E. J. and Howard, C. J.: J. Phys. Chem., 92, 1188, 1988.Jensen, N. R., Hjorth, J., Lohse, C., Skov, H. and Restelli, G.: J. Atmos. Chem., 14, 95, 1992.Mac Leod, H., Aschmann, S. M., Atkinson, R., Tuazon, E. C., Sweetman, J. A., Winer, A. M. and Pitts Jr., J. N.: J. Geophys.Res., 91, 5338, 1986.Rahman, M. M., Becker, E., Benter, Th. and Schindler, R. N.: Ber. Bunsenges. Phys. Chem., 92, 91, 1988.Wallington, T. J., Atkinson, R., Winer, A. M. and Pitts Jr., J. N.: J. Phys. Chem., 90, 5393, 1986.
www.atmos-chem-phys.org/acp/4/1461/ Atmos. Chem. Phys., 4, 1461–1738, 2004
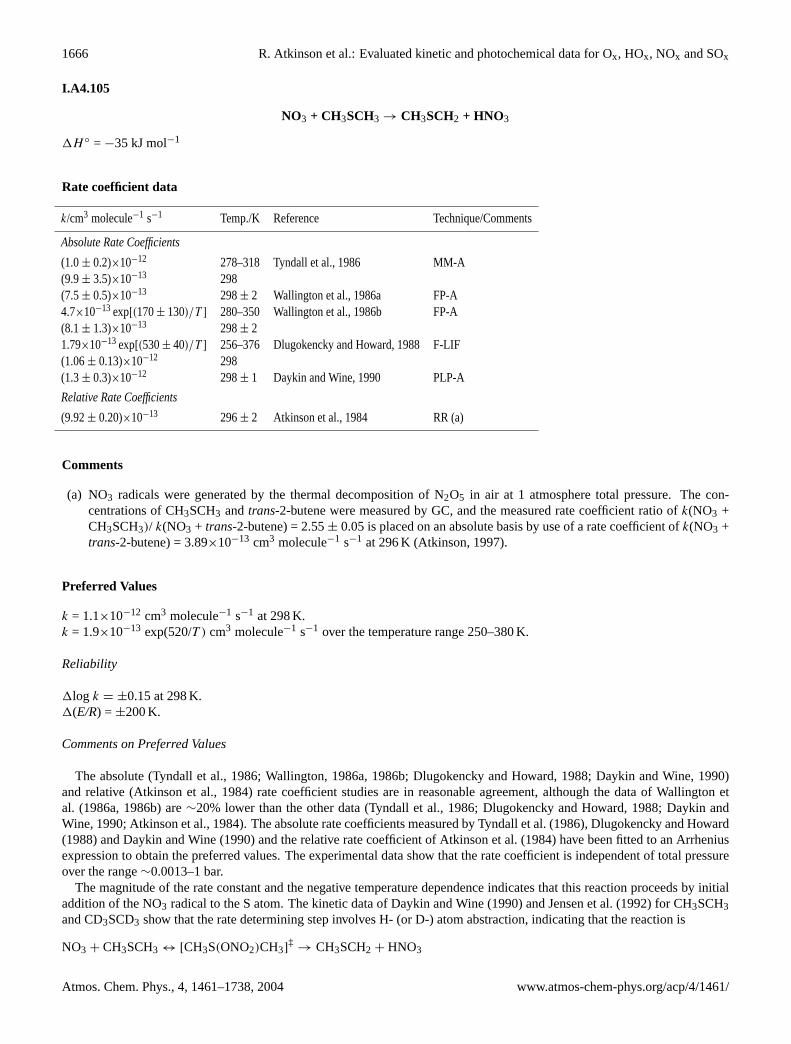
1666 R. Atkinson et al.: Evaluated kinetic and photochemical data for Ox, HOx, NOx and SOx
I.A4.105
NO3 + CH3SCH3 → CH3SCH2 + HNO3
1H ◦ = −35 kJ mol−1
Rate coefficient data
k/cm3 molecule−1 s−1 Temp./K Reference Technique/Comments
Absolute Rate Coefficients
(1.0± 0.2)×10−12 278–318 Tyndall et al., 1986 MM-A(9.9± 3.5)×10−13 298(7.5± 0.5)×10−13 298± 2 Wallington et al., 1986a FP-A4.7×10−13 exp[(170± 130)/T ] 280–350 Wallington et al., 1986b FP-A(8.1± 1.3)×10−13 298± 21.79×10⁻¹³ exp[(530± 40)/T ] 256–376 Dlugokencky and Howard, 1988 F-LIF(1.06± 0.13)×10−12 298(1.3± 0.3)×10−12 298± 1 Daykin and Wine, 1990 PLP-A
Relative Rate Coefficients
(9.92± 0.20)×10−13 296± 2 Atkinson et al., 1984 RR (a)
Comments
(a) NO3 radicals were generated by the thermal decomposition of N2O5 in air at 1 atmosphere total pressure. The con-centrations of CH3SCH3 andtrans-2-butene were measured by GC, and the measured rate coefficient ratio ofk(NO3 +CH3SCH3)/ k(NO3 + trans-2-butene) = 2.55± 0.05 is placed on an absolute basis by use of a rate coefficient ofk(NO3 +trans-2-butene) = 3.89×10⁻¹³ cm3 molecule−1 s−1 at 296 K (Atkinson, 1997).
Preferred Values
k = 1.1×10⁻¹² cm3 molecule−1 s−1 at 298 K.k = 1.9×10⁻¹³ exp(520/T ) cm3 molecule−1 s−1 over the temperature range 250–380 K.
Reliability
1log k = ±0.15 at 298 K.1(E/R) = ±200 K.
Comments on Preferred Values
The absolute (Tyndall et al., 1986; Wallington, 1986a, 1986b; Dlugokencky and Howard, 1988; Daykin and Wine, 1990)and relative (Atkinson et al., 1984) rate coefficient studies are in reasonable agreement, although the data of Wallington etal. (1986a, 1986b) are∼20% lower than the other data (Tyndall et al., 1986; Dlugokencky and Howard, 1988; Daykin andWine, 1990; Atkinson et al., 1984). The absolute rate coefficients measured by Tyndall et al. (1986), Dlugokencky and Howard(1988) and Daykin and Wine (1990) and the relative rate coefficient of Atkinson et al. (1984) have been fitted to an Arrheniusexpression to obtain the preferred values. The experimental data show that the rate coefficient is independent of total pressureover the range∼0.0013–1 bar.
The magnitude of the rate constant and the negative temperature dependence indicates that this reaction proceeds by initialaddition of the NO3 radical to the S atom. The kinetic data of Daykin and Wine (1990) and Jensen et al. (1992) for CH3SCH3and CD3SCD3 show that the rate determining step involves H- (or D-) atom abstraction, indicating that the reaction is
NO3 + CH3SCH3 ↔ [CH3S(ONO2)CH3]‡
→ CH3SCH2 + HNO3
Atmos. Chem. Phys., 4, 1461–1738, 2004 www.atmos-chem-phys.org/acp/4/1461/
R. Atkinson et al.: Evaluated kinetic and photochemical data for Ox, HOx, NOx and SOx 1667
This conclusion is consistent with the product studies of Jensen et al. (1991, 1992) and Butkovskaya and Le Bras (1994).Butkovskaya and Le Bras (1994) used a DF-MS technique to show that the alternative reaction pathway yielding CH3SONO2+ CH3 accounts for< 2% of the overall reaction at 298 K and 1.3 mbar total pressure.
References
Atkinson, R., Pitts Jr., J. N. and Aschmann, S. M.: J. Phys. Chem., 88, 1584, 1984.Atkinson, R.: J. Phys. Chem. Ref. Data, 26, 215, 1997.Butkovskaya, N. I. and Le Bras, G.: J. Phys. Chem., 98, 2582, 1994.Daykin, E. P. and Wine, P. H.: Int. J. Chem. Kinet., 22, 1083, 1990.Dlugokencky, E. J. and Howard, C. J.: J. Phys. Chem., 92, 1188, 1988.Jensen, N. R., Hjorth, J., Lohse, C., Skov, H. and Restelli, G.: Atmos. Environ., 25A, 1897, 1991.Jensen, N. R., Hjorth, J., Lohse, C., Skov, H. and Restelli, G: J. Atmos. Chem., 14, 95, 1992.Tyndall, G. S., Burrows, J. P., Schneider, W. and Moortgat, G. K.: Chem. Phys. Lett., 130, 463, 1986.Wallington, T. J., Atkinson, R., Winer, A. M. and Pitts Jr., J. N.: J. Phys. Chem., 90, 4640, 1986a.Wallington, T. J., Atkinson, R., Winer, A. M. and Pitts Jr., J. N.: J. Phys. Chem., 90, 5393, 1986b.
www.atmos-chem-phys.org/acp/4/1461/ Atmos. Chem. Phys., 4, 1461–1738, 2004
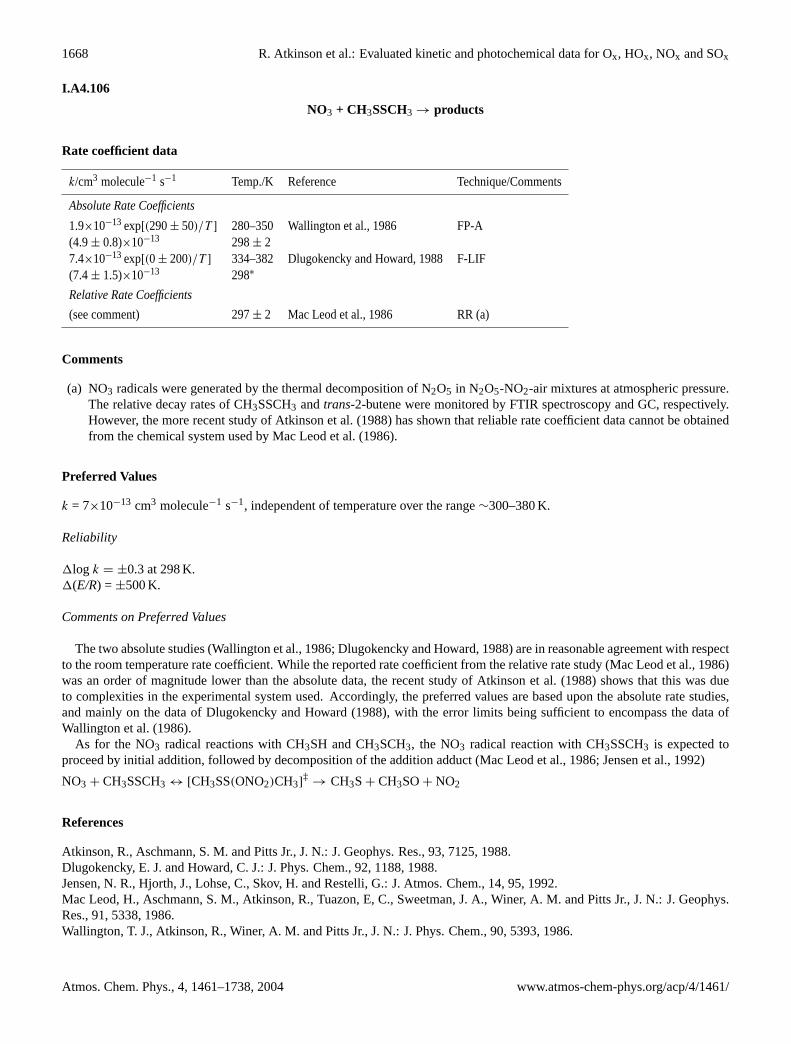
1668 R. Atkinson et al.: Evaluated kinetic and photochemical data for Ox, HOx, NOx and SOx
I.A4.106
NO3 + CH3SSCH3 → products
Rate coefficient data
k/cm3 molecule−1 s−1 Temp./K Reference Technique/Comments
Absolute Rate Coefficients
1.9×10⁻¹³ exp[(290± 50)/T ] 280–350 Wallington et al., 1986 FP-A(4.9± 0.8)×10−13 298± 27.4×10⁻¹³ exp[(0 ± 200)/T ] 334–382 Dlugokencky and Howard, 1988 F-LIF(7.4± 1.5)×10−13 298∗
Relative Rate Coefficients
(see comment) 297± 2 Mac Leod et al., 1986 RR (a)
Comments
(a) NO3 radicals were generated by the thermal decomposition of N2O5 in N2O5-NO2-air mixtures at atmospheric pressure.The relative decay rates of CH3SSCH3 andtrans-2-butene were monitored by FTIR spectroscopy and GC, respectively.However, the more recent study of Atkinson et al. (1988) has shown that reliable rate coefficient data cannot be obtainedfrom the chemical system used by Mac Leod et al. (1986).
Preferred Values
k = 7×10⁻¹³ cm3 molecule−1 s−1, independent of temperature over the range∼300–380 K.
Reliability
1log k = ±0.3 at 298 K.1(E/R) = ±500 K.
Comments on Preferred Values
The two absolute studies (Wallington et al., 1986; Dlugokencky and Howard, 1988) are in reasonable agreement with respectto the room temperature rate coefficient. While the reported rate coefficient from the relative rate study (Mac Leod et al., 1986)was an order of magnitude lower than the absolute data, the recent study of Atkinson et al. (1988) shows that this was dueto complexities in the experimental system used. Accordingly, the preferred values are based upon the absolute rate studies,and mainly on the data of Dlugokencky and Howard (1988), with the error limits being sufficient to encompass the data ofWallington et al. (1986).
As for the NO3 radical reactions with CH3SH and CH3SCH3, the NO3 radical reaction with CH3SSCH3 is expected toproceed by initial addition, followed by decomposition of the addition adduct (Mac Leod et al., 1986; Jensen et al., 1992)
NO3 + CH3SSCH3 ↔ [CH3SS(ONO2)CH3]‡
→ CH3S+ CH3SO+ NO2
References
Atkinson, R., Aschmann, S. M. and Pitts Jr., J. N.: J. Geophys. Res., 93, 7125, 1988.Dlugokencky, E. J. and Howard, C. J.: J. Phys. Chem., 92, 1188, 1988.Jensen, N. R., Hjorth, J., Lohse, C., Skov, H. and Restelli, G.: J. Atmos. Chem., 14, 95, 1992.Mac Leod, H., Aschmann, S. M., Atkinson, R., Tuazon, E, C., Sweetman, J. A., Winer, A. M. and Pitts Jr., J. N.: J. Geophys.Res., 91, 5338, 1986.Wallington, T. J., Atkinson, R., Winer, A. M. and Pitts Jr., J. N.: J. Phys. Chem., 90, 5393, 1986.
Atmos. Chem. Phys., 4, 1461–1738, 2004 www.atmos-chem-phys.org/acp/4/1461/

R. Atkinson et al.: Evaluated kinetic and photochemical data for Ox, HOx, NOx and SOx 1669
I.A4.107
HS + O2 → products
Rate coefficient data
k/cm3 molecule−1 s−1 Temp./K Reference Technique/Comments
Absolute Rate Coefficients
<4×10⁻¹⁷ 298 Black, 1984 PLP-LIF≤1×10⁻¹⁷ 298 Friedl et al., 1985 DF-LIF<1×10⁻¹⁴ 298 Schoenle et al., 1987 DF-MS<4×10⁻¹⁹ 298 Stachnik and Molina, 1987 PLP-UVA<1.5×10⁻¹⁷ 295 Wang et al., 1987 DF-LMR
Preferred Values
k < 4×10⁻¹⁹ cm3 molecule−1 s−1 at 298 K.
Comments on Preferred Values
The reaction of HS with O2 is so slow that attempts to measure the rate coefficient have yielded only upper limits that fall inthe range 4×10⁻¹⁹ to 4×10⁻¹⁷ cm3 molecule−1 s−1 at 298 K. The preferred value is from the study of Stachnik and Molina(1987), which gives the lowest upper limit and appears reliable.
In a theoretical study by Goumri et al. (1995), the kinetics of the reaction HS + O2 → HSOO were analyzed using RRKMtheory with Gaussian-2 (G2) theory being used to calculate the thermochemistry. Under atmospheric conditions the rateconstant is close to the low-pressure limitk0 = 9.2 x 10⁻³⁴ (T /298)−1.69 cm6 molecule−2 s−1 for T = 200–400 K. The lowvalue of the S-O bond dissociation energy (91.5 kJ·mol−1) implies that HSOO formation is unimportant in the atmosphere.
References
Black, G.: J. Chem. Phys., 80, 1103, 1984.Friedl, R. R., Brune, W. H. and Anderson, J. G.: J. Phys. Chem., 89, 5505, 1985.Goumri, A., Rocha, J.-D. R. and Marshall, P.: J. Phys. Chem., 99, 10 834, 1995.Schoenle, G., Rahman, M. M. and Schindler, R. N.: Ber. Bunsenges. Phys. Chem., 91, 66, 1987.Stachnik, R. A. and Molina, M. J.: J. Phys. Chem., 91, 4603, 1987.Wang, N. S., Lovejoy, E. R. and Howard, C. J.: J. Phys. Chem., 91, 5743, 1987.
www.atmos-chem-phys.org/acp/4/1461/ Atmos. Chem. Phys., 4, 1461–1738, 2004
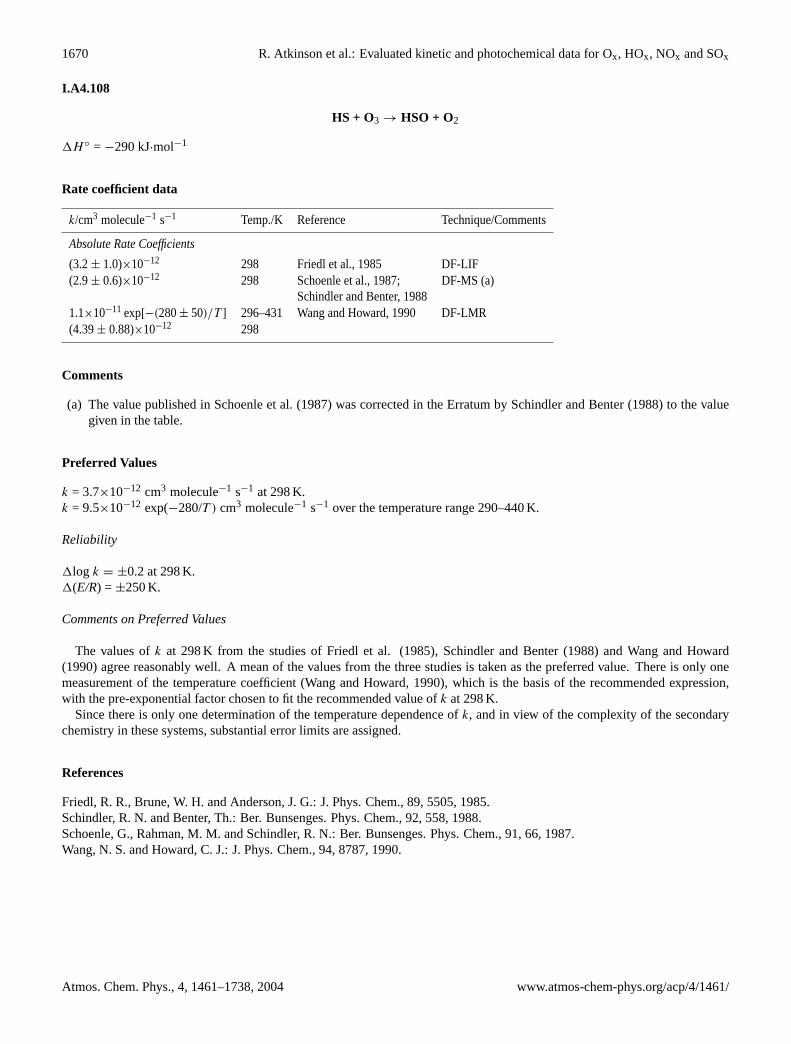
1670 R. Atkinson et al.: Evaluated kinetic and photochemical data for Ox, HOx, NOx and SOx
I.A4.108
HS + O3 → HSO + O2
1H ◦ = −290 kJ·mol−1
Rate coefficient data
k/cm3 molecule−1 s−1 Temp./K Reference Technique/Comments
Absolute Rate Coefficients
(3.2± 1.0)×10−12 298 Friedl et al., 1985 DF-LIF(2.9± 0.6)×10−12 298 Schoenle et al., 1987; DF-MS (a)
Schindler and Benter, 19881.1×10−11 exp[−(280± 50)/T ] 296–431 Wang and Howard, 1990 DF-LMR(4.39± 0.88)×10−12 298
Comments
(a) The value published in Schoenle et al. (1987) was corrected in the Erratum by Schindler and Benter (1988) to the valuegiven in the table.
Preferred Values
k = 3.7×10⁻¹² cm3 molecule−1 s−1 at 298 K.k = 9.5×10⁻¹² exp(−280/T ) cm3 molecule−1 s−1 over the temperature range 290–440 K.
Reliability
1log k = ±0.2 at 298 K.1(E/R) = ±250 K.
Comments on Preferred Values
The values ofk at 298 K from the studies of Friedl et al. (1985), Schindler and Benter (1988) and Wang and Howard(1990) agree reasonably well. A mean of the values from the three studies is taken as the preferred value. There is only onemeasurement of the temperature coefficient (Wang and Howard, 1990), which is the basis of the recommended expression,with the pre-exponential factor chosen to fit the recommended value ofk at 298 K.
Since there is only one determination of the temperature dependence ofk, and in view of the complexity of the secondarychemistry in these systems, substantial error limits are assigned.
References
Friedl, R. R., Brune, W. H. and Anderson, J. G.: J. Phys. Chem., 89, 5505, 1985.Schindler, R. N. and Benter, Th.: Ber. Bunsenges. Phys. Chem., 92, 558, 1988.Schoenle, G., Rahman, M. M. and Schindler, R. N.: Ber. Bunsenges. Phys. Chem., 91, 66, 1987.Wang, N. S. and Howard, C. J.: J. Phys. Chem., 94, 8787, 1990.
Atmos. Chem. Phys., 4, 1461–1738, 2004 www.atmos-chem-phys.org/acp/4/1461/
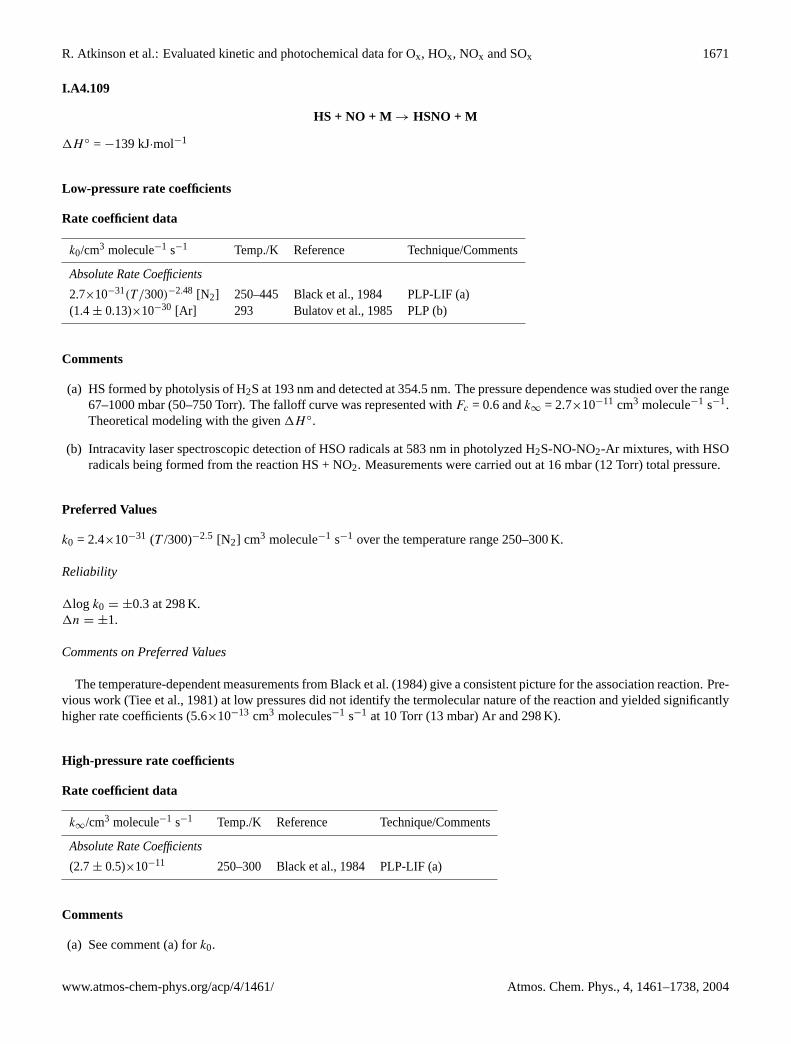
R. Atkinson et al.: Evaluated kinetic and photochemical data for Ox, HOx, NOx and SOx 1671
I.A4.109
HS + NO + M → HSNO + M
1H ◦ = −139 kJ·mol−1
Low-pressure rate coefficients
Rate coefficient data
k0/cm3 molecule−1 s−1 Temp./K Reference Technique/Comments
Absolute Rate Coefficients
2.7×10⁻³¹(T /300)−2.48 [N2] 250–445 Black et al., 1984 PLP-LIF (a)(1.4± 0.13)×10−30 [Ar] 293 Bulatov et al., 1985 PLP (b)
Comments
(a) HS formed by photolysis of H2S at 193 nm and detected at 354.5 nm. The pressure dependence was studied over the range67–1000 mbar (50–750 Torr). The falloff curve was represented withFc = 0.6 andk∞ = 2.7×10⁻¹¹ cm3 molecule−1 s−1.Theoretical modeling with the given1H ◦.
(b) Intracavity laser spectroscopic detection of HSO radicals at 583 nm in photolyzed H2S-NO-NO2-Ar mixtures, with HSOradicals being formed from the reaction HS + NO2. Measurements were carried out at 16 mbar (12 Torr) total pressure.
Preferred Values
k0 = 2.4×10⁻³¹ (T /300)−2.5 [N2] cm3 molecule−1 s−1 over the temperature range 250–300 K.
Reliability
1log k0 = ±0.3 at 298 K.1n = ±1.
Comments on Preferred Values
The temperature-dependent measurements from Black et al. (1984) give a consistent picture for the association reaction. Pre-vious work (Tiee et al., 1981) at low pressures did not identify the termolecular nature of the reaction and yielded significantlyhigher rate coefficients (5.6×10⁻¹³ cm3 molecules−1 s−1 at 10 Torr (13 mbar) Ar and 298 K).
High-pressure rate coefficients
Rate coefficient data
k∞/cm3 molecule−1 s−1 Temp./K Reference Technique/Comments
Absolute Rate Coefficients
(2.7± 0.5)×10−11 250–300 Black et al., 1984 PLP-LIF (a)
Comments
(a) See comment (a) fork0.
www.atmos-chem-phys.org/acp/4/1461/ Atmos. Chem. Phys., 4, 1461–1738, 2004

1672 R. Atkinson et al.: Evaluated kinetic and photochemical data for Ox, HOx, NOx and SOx
Preferred Values
k∞ = 2.7×10⁻¹¹ cm3 molecule−1 s−1, independent of temperature over the range 250–300 K.
Reliability
1log k∞ = ± 0.5 over the temperature range 250–300 K.
Comments on Preferred Values
The falloff extrapolation withFc = 0.6 of Black et al. (1984) towardsk∞ appears less certain than tok0. The preferred valuesare based on the data of Black et al. (1984).
References
Black, G., Patrick, R., Jusinski, L. E. and Slanger, T. G.: J. Chem. Phys., 80, 4065, 1984.Bulatov, V. P., Kozliner, M. Z. and Sarkisov, O. M.: Khim Fiz., 4, 1353, 1985.Tiee, J. J., Wampler, F. B., Oldenburg, R. C. and Rice, W. W.: Chem. Phys. Lett., 82, 80, 1981.
Atmos. Chem. Phys., 4, 1461–1738, 2004 www.atmos-chem-phys.org/acp/4/1461/

R. Atkinson et al.: Evaluated kinetic and photochemical data for Ox, HOx, NOx and SOx 1673
I.A4.110
HS + NO2 → HSO + NO
1H ◦ = −90 kJ·mol−1
Rate coefficient data
k/cm3 molecule−1 s−1 Temp./K Reference Technique/Comments
Absolute Rate Coefficients
(3.5± 0.4)×10−11 298 Black, 1984 PLP-LIF(2.4± 0.2)×10−11 293 Bulatov et al., 1984 PLP-A (a)(3.0± 0.8)×10−11 298 Friedl et al., 1985 DF-LIF(8.6± 0.9)×10−11 298 Schoenle et al., 1987 DF-MS (b)4.8± 1.0)×10−11 298 Stachnik and Molina, 1987 PLP-UVA2.9×10−11 exp(237/T ) 221–415 Wang et al., 1987 DF-LMR(6.7± 1.0)×10−11 298
Comments
(a) HSO radical product was monitored by intracavity laser absorption at 583 nm.
(b) Measured both HS decay and HSO formation by MS. If the HS decay data are taken alone, the rate coefficient (oncecorrected according to erratum paper) increases to 1.0×10⁻¹⁰ cm3 molecule−1 s−1.
Preferred Values
k = 6.7×10⁻¹¹ cm3 molecule−1 s−1 at 298 K.k = 2.9×10⁻¹¹ exp(240/T ) cm3 molecule−1 s−1 over the temperature range 220–420 K.
Reliability
1log k = ±0.3 at 298 K.1(E/R) = ±100 K.
Comments on Preferred Values
There is considerable scatter in the measured values ofk (Black, 1984; Bulatov et al., 1984; Friedl et al., 1985; Schoenle etal., 1987; Stachnik and Molina, 1987; Wang et al., 1987) with no obvious correlation with the conditions used or the technique.The presence of H atoms in the system is known to lead to complicating secondary chemistry, and some of the differences maybe due to this, particularly where HS has been generated by photolysis of H2S. In more recent studies (Stachnik and Molina,1987; Wang et al., 1987) care has been taken to eliminate or model such effects, but significant differences still persist. Thestudy of Wang et al. (1987) represents the only dataset in which different sources of HS have been employed to get the sameresult, and the only study in which data was obtained in the absence of H2S. Wang et al. (1987) also showed that the reactionDS + NO2 has the same rate coeffficient as HS + NO2. In a further study, using C2H4S as DS source, Fenter and Anderson(1994) obtainedk(273–373 K) = (3.4± 0.8)×10−11 exp [(210± 70)/T ] cm3 molecule−1 s−1 for the reaction of DS with NO2.This is in good agreement with the result of Wang et al. (1987). The preferred value at 298 K and the temperarure coefficientare taken from the study of Wang et al. (1987). The absence of any pressure effect on the rate coefficient at pressures up to0.96 bar (Black, 1984; Stacknik and Molino, 1987) indicates that any addition channel is unimportant up to these pressures.
www.atmos-chem-phys.org/acp/4/1461/ Atmos. Chem. Phys., 4, 1461–1738, 2004

1674 R. Atkinson et al.: Evaluated kinetic and photochemical data for Ox, HOx, NOx and SOx
References
Black, G,: J. Chem. Phys., 80, 1103, 1984.Bulatov, V. P. Kozliner, M. Z. and Sarkisov, O. M.: Khim. Fiz., 3, 1300, 1984.Fenter, F. F. and Anderson, J. G.: Int. J. Chem. Kin., 26, 801, 1994.Friedl, R. R., Brune, W. H. and Anderson, J. G.: J. Phys. Chem., 89, 5505, 1985.Schoenle, G., Rahman, M. M. and Schindler, R. N.: Ber. Bunsenges. Phys. Chem., 91, 66, 1987, revised by Schindler, R. N.and Benter, Th.: Ber. Bunsenges. Phys. Chem., 92, 558, 1988.Stachnik, R. A. and Molina, M. J.: J. Phys. Chem., 91, 4603, 1987.Wang, N. S., Lovejoy, E. R. and Howard, C. J.: J. Phys. Chem., 91, 5743, 1987.
Atmos. Chem. Phys., 4, 1461–1738, 2004 www.atmos-chem-phys.org/acp/4/1461/

R. Atkinson et al.: Evaluated kinetic and photochemical data for Ox, HOx, NOx and SOx 1675
I.A4.111
HSO + O2 → products
Rate coefficient data
k∞/cm3 molecule−1 s−1 Temp./K Reference Technique/Comments
Absolute Rate Coefficients
≤2.0×10⁻¹⁷ 296 Lovejoy et al., 1987 DF-LMR
Preferred Values
k ≤ 2.0×10⁻¹⁷ cm3 molecule−1 s−1 at 296 K.
Comments on Preferred Values
The reaction is slow and only an upper limit tok is available (Lovejoy et al., 1987).
References
Lovejoy, E. R., Wang, N. S. and Howard, C. J.: J. Phys. Chem., 91, 5749, 1987.
www.atmos-chem-phys.org/acp/4/1461/ Atmos. Chem. Phys., 4, 1461–1738, 2004

1676 R. Atkinson et al.: Evaluated kinetic and photochemical data for Ox, HOx, NOx and SOx
I.A4.112
HSO + O3 → HS + 2O2 (1)→ HO + SO + O2 (2)→ HSO2 + O2 (3)
1H ◦(1) = 4 kJ·mol−1
1H ◦(2) = −95 kJ·mol−1
1H ◦(3) = −361 kJ·mol−1
Rate coefficient data (k = k1 + k2 + k3)
k/cm3 molecule−1 s−1 Temp./K Reference Technique/Comments
Absolute Rate Coefficients
k3 = 1×10⁻¹² exp(−1000/T ) 296–404 Wang and Howard, 1990 (a,b)k3 = (3.5± 1.5)×10−14 296k3 = 2.1×10⁻¹² exp[−(1120± 320)/T ] 273–423 Lee et al., 1994 DF-LIF/Ak3 = (4.7± 1.0)×10−14 298
Relative Rate Coefficients
k1 = 7×10⁻¹⁴ 297 Wang and Howard, 1990 DF-LMR (c)k1 = 2.7×10⁻¹³ exp(−400/T ) 297–405 (b)1.1×10⁻¹³ 298 Friedl et al., 1985 (d)
Comments
(a) DF-LMR. Monitoring HSO decay gives the sum of all reaction channels apart from (1). However, HO is not detected (seebelow) and in the absence of further information on other reaction channels we equate this to reaction 3.
(b) No error limits given on the temperature dependence as only a very limited data set obtained.
(c) Value obtained by numerical fitting to HS profile in excess of O3. Value of rate coefficient for HS + O3 used in simulation(4.4×10⁻¹² cm3 molecule−1 s−1) was taken from the same study. Use of the recommended value fork(HS + O3) willreduce the value obtained for k1.
(d) Discharge flow system. The HS + O3 reaction was studied with HS radicals being monitored by LIF. Addition of O3 gavean initial decrease in [HS], which finally attained a steady state indicating regeneration of HS, postulated to be by theHSO + O3 reaction. A rate coefficient ratio ofk/k(HS + O3) = 0.031 was obtained and placed on an absolute basis by useof k(HS + O3) = 3.7×10⁻¹² cm3 molecule−1 s−1 (this evaluation).
Preferred Values
k = 1.1×10⁻¹³ cm3 molecule−1 s−1 at 298 K.k1 = 6×10⁻¹⁴ cm3 molecule−1 s−1 at 298 K.k3 = 5×10⁻¹⁴ cm3 molecule−1 s−1 at 298 K.
Reliability
1log k = ±0.2 at 298 K.1log k1 = ±0.3 at 298 K.1log k3 = ±0.3 at 298 K.
Atmos. Chem. Phys., 4, 1461–1738, 2004 www.atmos-chem-phys.org/acp/4/1461/
R. Atkinson et al.: Evaluated kinetic and photochemical data for Ox, HOx, NOx and SOx 1677
Comments on Preferred Values
In the study by Lee et al. (1994) the rate coefficient measured is that for HSO removal by all channels other than channel 1giving HS as a product, which subsequently regenerates HSO by reaction with the O3 present. However, in our recommenda-tions the rate coefficients measured by Lee et al. (1994) are assigned to channel 3 on the grounds that Friedl et al. (1985) couldnot detect HO production (channel 2); some further support for channel 3 comes from the work of Lovejoy et al. (1987) whofound that HSO2 is readily formed by the HSO + NO2 reaction.
Although both Wang and Howard (1990) and Lee et al. (1994) measured a similar temperature coefficient fork3, the preferredvalues are only given at 298 K until further studies are made on the effects of temperature on all of the rate coefficients.
References
Friedl, R. R., Brune, W. H. and Anderson, J. G.: J. Phys. Chem., 89, 5505, 1985.Lee, Y.-Y., Lee, Y.-P. and Wang, N. S.: J. Chem. Phys., 100, 387, 1994.Lovejoy, E. R., Wang, N. S. and Howard, C. J.: J. Phys. Chem., 91, 5749, 1987.Wang, N. S. and Howard, C. J.: J. Phys. Chem., 94, 8787, 1990.
www.atmos-chem-phys.org/acp/4/1461/ Atmos. Chem. Phys., 4, 1461–1738, 2004
1678 R. Atkinson et al.: Evaluated kinetic and photochemical data for Ox, HOx, NOx and SOx
I.A4.113
HSO + NO → products
Rate coefficient data
k/cm3 molecule−1 s−1 Temp./K Reference Technique/Comments
Absolute Rate Coefficients
(2.6± 0.4)×10−14 293 Bulatov et al., 1985 PLP-A (a)≤1.0×10⁻¹⁵ 298 Lovejoy et al., 1987 DF-LMR
Comments
(a) HSO radicals monitored by intra-cavity laser absorption at 583 nm.
Preferred Values
k < 1.0×10⁻¹⁵ cm3 molecule−1 s−1 at 298 K.
Comments on Preferred Values
The only two available measurements ofk differ by at least a factor of 26. This is unlikely to be due to the higher pressuresused in the Bulatov et al. (1985) study, but may arise from secondary chemistry in their HSO source which employed relativelylarge H2S concentrations. Provisionally, the upper limit to the rate coefficient reported by Lovejoy et al. (1987) is preferred.
References
Bulatov, V. P., Kozliner, M. Z. and Sarkisov, O. M.: Khim. Fiz., 4, 1353, 1985.Lovejoy, E. R., Wang, N. S. and Howard, C. J.: J. Phys. Chem., 91, 5749, 1987.
Atmos. Chem. Phys., 4, 1461–1738, 2004 www.atmos-chem-phys.org/acp/4/1461/
R. Atkinson et al.: Evaluated kinetic and photochemical data for Ox, HOx, NOx and SOx 1679
I.A4.114
HSO + NO2 → products
Rate coefficient data
k/cm3 molecule−1 s−1 Temp./K Reference Technique/Comments
Absolute Rate Coefficients
4×10⁻¹² 293 Bulatov et al., 1984 PLP-A (a)(9.6± 2.4)×10−12 298 Lovejoy et al., 1987 DF-LMR
Comments
(a) HSO radicals monitored by intracavity laser absorption at 583 nm.
Preferred Values
k = 9.6×10⁻¹² cm3 molecule−1 s−1 at 298 K.
Reliability
1log k = ±0.3 at 298 K.
Comments on Preferred Values
The only two measurements ofk differ by at least a factor of 2. Lovejoy et al. (1987) have suggested that the relatively highH2S concentrations used by Bulatov et al. (1984) may have led to side reactions regenerating HSO. The value of Lovejoy etal. (1987) is preferred, but wide error limits are assigned awaiting confirmatory studies. HO2 was observed as a product of thereaction by Lovejoy et al. (1987), which they suggest arises from the reaction sequence:
HSO+ NO2 → HSO2 + NO
HSO2 + O2 → HO2 + SO2.
References
Bulatov, V. P., Kozliner, M. Z. and Sarkisov, O. M. Khim. Fiz., 3, 1300, 1984.Lovejoy, E. R., Wang, N. S. and Howard, C. J.: J. Phys. Chem., 91, 5749, 1987.
www.atmos-chem-phys.org/acp/4/1461/ Atmos. Chem. Phys., 4, 1461–1738, 2004

1680 R. Atkinson et al.: Evaluated kinetic and photochemical data for Ox, HOx, NOx and SOx
I.A4.115
HSO2 + O2 → products
Rate coefficient data
k/cm3 molecule−1 s−1 Temp./K Reference Technique/Comments
Absolute Rate Coefficients
3.0×10⁻¹³ 296 Lovejoy et al., 1987 DF-LMR
Preferred Values
k = 3.0×10⁻¹³ cm3 molecule−1 s−1 at 298 K.
Reliability
1log k = ±0.8 at 298 K.
Comments on Preferred Values
There is only one study of this reaction (Lovejoy et al., 1987). The method used to obtain the rate coefficient was indirect,and this leads us to suggest substantial error limits despite the high quality of the experimental work.
References
Lovejoy, E. R., Wang, N. S. and Howard, C. J.: J. Phys. Chem., 91, 5749, 1987.
Atmos. Chem. Phys., 4, 1461–1738, 2004 www.atmos-chem-phys.org/acp/4/1461/

R. Atkinson et al.: Evaluated kinetic and photochemical data for Ox, HOx, NOx and SOx 1681
I.A4.116
SO + O2 → SO2 + O
1H ◦ = −52.6 kJ·mol−1
Rate coefficient data
k/cm3 molecule−1 s−1 Temp./K Reference Technique/Comments
Absolute Rate Coefficients
(1.07± 0.16)×10−16 298 Black et al., 1982a (a)2.4×10⁻¹³ exp[−(2370+200
−250)/T ] 230–420 Black et al., 1982b (a)8.4×10⁻¹⁷ 2981.00×10−13 exp[−(2180± 117)/T ] 262–363 Goede and Schurath, 1983 (b)6.7×10⁻¹⁷ 2982.2×10−13 exp[−(2340± 90)/T ] 250–585 Garland, 1998 (c)8.6×10⁻¹⁷ 298
Comments
(a) Pulsed laser photolysis of SO2 at 193 nm, with SO radicals being detected by chemiluminescence from the SO + O3reaction. Pseudo-first-order decays of SO were monitored in the presence of excess O2. Total pressure = 133–667 mbar(100–500 Torr) of O2 + He.
(b) SO produced from the O + OCS reaction in a flow system. Controlled admission of SO radicals to a static volumewhere the pseudo-first-order decay of SO in excess O2 was followed by SO + O3 chemiluminescence. Total pressure =0.0013–0.27 mbar (1–200 mTorr) O2. Only an Arrhenius expression was given with no individual rate coefficients at thetemperatures studied.
(c) PLP of CH3S(O)CH3 (DMSO) at 222 nm coupled with LIF detection of SO at 236.35 nm at 2×10⁻³ mbar of DMSO,up to 13.3 mbar of O2 and 27 mbar total pressure of Ar in a flowing gas experiment. The measurements were performedunder pseudo-first order conditions in the range 450–585 K and resulted in the Arrhenius expression displayed in the tablewhen combined with the data of Black et al. (1982b)
Preferred Values
k = 7.6×10⁻¹⁷ cm3 molecule−1 s−1 at 298 K.k = 1.6×10⁻¹³ exp(−2280/T ) over the temperature range 230–420 K.
Reliability
1log k = ±0.15 at 298 K.1(E/R) = ±500 K.
Comments on Preferred Values
This reaction is very slow and measurement of the rate coefficientk is subject to errors due to impurities. For this reason,Black et al. (1982a; 1982b) favour their lower value ofk at 298 K obtained in the temperature dependence study (Black et al.,1982b). The Goede and Schurath (1983) values are systematically about 35% lower than those from Black et al. (1982b) butappear to have less experimental uncertainty at temperatures<300 K. The preferred value for the rate coefficientk at 298 Kand for the temperature dependence are from Black et al. (1982b) and Goede and Schurath (1983). TheA-factor has beenadjusted to give the preferred 298 K rate coefficient.
www.atmos-chem-phys.org/acp/4/1461/ Atmos. Chem. Phys., 4, 1461–1738, 2004

1682 R. Atkinson et al.: Evaluated kinetic and photochemical data for Ox, HOx, NOx and SOx
References
Black, G., Sharpless, R. L. and Slanger, T. G.: Chem. Phys. Lett., 90, 55, 1982a.Black, G., Sharpless, R. L. and Slanger, T. G.: Chem. Phys. Lett., 93, 598, 1982b.Garland, N. L.: Chem. Phys. Lett., 290, 385, 1998.Goede, H.-J. and Schurath, U.: Bull. Soc. Chim. Belg., 92, 661, 1983.
Atmos. Chem. Phys., 4, 1461–1738, 2004 www.atmos-chem-phys.org/acp/4/1461/

R. Atkinson et al.: Evaluated kinetic and photochemical data for Ox, HOx, NOx and SOx 1683
I.A4.117
SO + O3 → SO2 + O2
1H ◦ = −444.5 kJ·mol−1
Rate coefficient data
k/cm3 molecule−1 s−1 Temp./K Reference Technique/Comments
Absolute Rate Coefficients
2.5×10⁻¹² exp[−(1057± 202)/T ] 223–300 Halstead and Thrush, 1966 DF-CL7.2×10−14 298(8.7± 1.6)×10−14 296± 4 Robertshaw and Smith, 1980 PLP-CL(1.06± 0.16)×10−13 298 Black et al., 1982a (a)4.8×10⁻¹² exp[−(1170+80
−120)/T ] 230–420 Black et al., 1982b (a)9.46×10⁻¹⁴ 298
Comments
(a) Pulsed laser photolysis of SO2-O3 mixtures at 193 nm with SO2 being monitored by CL from the SO + O3 reaction.Excess O3 was determined by UV absorption. The total pressure = 267 mbar (200 Torr) of He.
Preferred Values
k = 8.9×10⁻¹⁴ cm3 molecule−1 s−1 at 298 K.k = 4.5×10⁻¹² exp(−1170/T ) cm3 molecule−1 s−1 over the temperature range 230–420 K.
Reliability
1log k = ±0.1 at 298 K.1(E/R) = ±150 K.
Comments on Preferred Values
The studies of Halstead and Thrush (1966), Robertshaw and Smith (1980) and Black et al. (1982a; 1982b) are in generalagreement. The preferred 298 K rate coefficient is the mean of these measurements. The temperature dependence of Black etal. (1982b) is accepted since this study covered a much larger temperature range than the earlier study of Halstead and Thrush(1966), which nevertheless gave a value ofE/R within the experimental error of the later study of Black et al. (1982b).
References
Black, G., Sharpless, R. L. and Slanger, T. G.: Chem. Phys. Lett., 90, 55, 1982a.Black, G., Sharpless, R. L. and Slanger, T. G.: Chem. Phys. Lett., 93, 598, 1982b.Halstead, C. J. and Thrush, B. A.: Proc. R. Soc. London Ser. A, 295, 380, 1966.Robertshaw, J. S. and Smith, I. W. M.: Int. J. Chem. Kinet., 12, 729, 1980.
www.atmos-chem-phys.org/acp/4/1461/ Atmos. Chem. Phys., 4, 1461–1738, 2004

1684 R. Atkinson et al.: Evaluated kinetic and photochemical data for Ox, HOx, NOx and SOx
I.A4.118
SO + NO2 → SO2 + NO
1H ◦ = −244.5 kJ·mol−1
Rate coefficient data
k/cm3 molecule−1 s−1 Temp./K Reference Technique/Comments
Absolute Rate Coefficients
(1.37± 0.07)×10−11 210–363 Brunning and Stief, 1986 DF-MS
Preferred Values
k = 1.4×10⁻¹¹ cm3 molecule−1 s−1, independent of temperature over the range 210–360 K.
Reliability
1log k = ±0.1 at 298 K.1(E/R) = ±100 K.
Comments on Preferred Values
The measurements of Brunning and Stief (1986) are the only available temperature dependent study of the rate coefficient,and indicate no measurable change in the rate coefficientk over the temperature range 210–363 K. This finding is the basis forour present recommendation for the rate coefficient, which agrees with three previous studies performed at ambient temperature(Clyne and MacRobert, 1980; Black et al., 1982; Clyne et al., 1966).
References
Black, G., Sharpless, R. L. and Slanger, T. G.: Chem. Phys. Lett., 90, 55, 1982.Brunning, J. and Stief, L. J.: J. Chem. Phys., 84, 4371, 1986.Clyne, M. A. A., Halstead, C. J. and Thrush, B. A.: Proc. Roy. Soc. London, Ser. A, 295, 355, 1966.Clyne, M. A. A. and MacRobert, A. J.: Int. J. Chem. Kinet., 12, 79, 1980.
Atmos. Chem. Phys., 4, 1461–1738, 2004 www.atmos-chem-phys.org/acp/4/1461/

R. Atkinson et al.: Evaluated kinetic and photochemical data for Ox, HOx, NOx and SOx 1685
I.A4.119
SO3 + H2O → products
Rate coefficient data
k/cm3 molecule−1 s−1 Temp./K Reference Technique/Comments
Absolute Rate Coefficients
9×10⁻¹³ 300 Castleman et al., 1975 F-MS≤(5.7± 0.9)×10−15 298 Wang et al., 1989 (a)≤2.4×10⁻¹⁵
∼298 Reiner and Arnold, 1993 (b)(1.2± 0.2)×10−15 298 Reiner and Arnold, 1994 (b)Complex mechanism 295 Kolb et al., 1994 (c)Complex mechanism 250–360 Lovejoy et al., 1996 (d)Complex mechanism 283–370 Jayne et al., 1997 (e)
Comments
(a) Flow system with He and N2 as carrier gases and H2O in large excess over SO3. SO3 was monitored by the photodisso-ciation of SO3 at 147 nm and detection of SO2 fluorescence at 300–390 nm. A halocarbon wall coating of the flow tubewas used.
(b) Fast flow system at pressures of 31 to 260 mbar of synthetic air, using CIMS to detect SO3, H2O and H2SO4. Smallcorrections for wall reactions were applied.
(c) Atmospheric pressure turbulent flow reactor using N2 as a carrier gas in the pressure range 133–1013 mbar (100–760Torr) and CIMS detection. Both the decrease in SO3 as well as the increase in H2SO4 were monitored. The rate lawwas found to be first-order in [SO3] and second-order in [H2O]. Rate constants ranging from 2×10⁻¹⁰ to 1.4×10⁻¹² cm3
molecule−1 s−1 were estimated based on H2O dimers and the SO3·H2O adduct, respectively.
(d) Laminar flow reactor with detection by CIMS. The observations were consistent with rapid association of SO3 with H2Oto form the adduct H2O·SO3, which then reacts with water to form H2SO4.
(e) Details at (c). The pressure-independent first-order loss rate coefficient for SO3 may be expressed ask = (3.9 ±
0.8)×10−41exp(6830/T )[H2O]2s−1 over the range 283 to 370 K. The onset of H2SO4 homogeneous nucleation was ob-served at [SO3] > 1012 molecule cm−3.
Preferred Values
k = 5.7×10⁴ s−1 at 298 K and 50% relative humidity.
Comments on Preferred Values
No recommendation was made on the basis of the work of Castleman et al. (1975), due to the likely interference of wallreactions in their work. The studies of Wang et al. (1989), Reiner and Arnold (1993; 1994) and Kolb et al. (1994) have nowconfirmed that suspicion. Wang et al. (1989) obtained an upper limit to the rate coefficient which is more than two orders ofmagnitude lower than the value of Castleman et al. (1975) by treatment of the flow tube walls to reduce wall effects, and thestudies of Reiner et al. (1993; 1994), using the laminar flow tube method, obtained the lowest values for the rate constant. Theflow studies of Kolb et al. (1994), Lovejoy et al. (1996) and Jayne et al. (1997) arrive at a rate law first order in SO3 and secondorder in H2O.
www.atmos-chem-phys.org/acp/4/1461/ Atmos. Chem. Phys., 4, 1461–1738, 2004
1686 R. Atkinson et al.: Evaluated kinetic and photochemical data for Ox, HOx, NOx and SOx
References
Castleman Jr., A. W., Davis, R. E., Munkelwitz, H. R., Tang, I. N. and Wood, W. P.: Int. J. Chem. Kinet., Symp. 1, 629, 1975.Jayne, J. T., Poschl, U., Chen, Y., Dai, D., Molina, L. T.,Worsnop, D. R., Kolb, C. E. and Molina, M. J.: J. Phys. Chem. A,101, 10 000, 1997.Kolb, C. E., Jayne, J. T., Worsnop, D. R., Molina, M. J., Meads, R. F. and Viggiano, A. A.: J. Am. Chem. Soc., 116, 10 314,1994.Lovejoy, E. R., Hanson, D. R. and Huey, L. G.: J. Phys. Chem., 100, 19 911, 1996.Reiner, T. and Arnold, F.: Geophys. Res. Lett., 20, 2659, 1993.Reiner, T. and Arnold, F.: J. Chem. Phys., 101, 7399, 1994.Wang, X., Yin, Y. G., Suto, M. Lee, L. C. and O’Neal, H. E.: J. Chem. Phys., 89, 4853, 1989.
Atmos. Chem. Phys., 4, 1461–1738, 2004 www.atmos-chem-phys.org/acp/4/1461/
R. Atkinson et al.: Evaluated kinetic and photochemical data for Ox, HOx, NOx and SOx 1687
I.A4.120
SO3 + NH3 → products
Rate coefficient data
k/cm3 molecule−1 s−1 Temp./K Reference Technique/Comments
Absolute Rate Coefficients
(6.9± 1.5)×10−11 298 Shen et al., 1990 (a)(2.0± 0.6)×10−11 295 Lovejoy and Hanson, 1996 (b)(1.8± 0.5)×10−11 300 Lovejoy, 1997 (c)
Comments
(a) Flow system with NH3 in large excess. [SO3] monitored by observation of SO2 fluorescence in range 280–390 nm fromphotofragmentation of SO3 by 147 nm radiation. He carrier gas at 1.3–2.7 mbar (1–2 Torr) total pressure.
(b) Laminar flow reactor study with N2 as the carrier gas in the pressure range 13–533 mbar (10–400 Torr), using CIMSdetection. Both the decrease of SO3 as well as the formation of SO3·NH3 were monitored. The rate constant was pressuredependent withko = (3.9± 0.8)×10−30 cm6 molecule−2 s−1 andk∞ = (4.7± 1.4)×10−11 cm3 molecule−1 s−1 at 295 K.
(c) Experimental details in (b) except for a reduced pressure range of 27–106 mbar (20–80 Torr) of N2 and a temperaturerange of 280–340 K. The rate constant is pressure dependent withko = (3.6± 0.4)×10−30 cm6 molecule−2 s−1 andk∞ =(4.3± 1.2)×10−11 cm3 molecule−1 s−1 at 300 K. A third law determination of the reaction enthalpy for SO3 + NH3 ↔
H3NSO3 resulted in1H o298 = −100.4± 4.2 kJ mol−1.
Preferred Values
k = 2.0×10⁻¹¹ cm3 molecule−1 s−1 at 298 K and 1 bar.
Reliability
1log k = ±0.2 at 298 K.
Comments on Preferred Values
The preferred value is given for one atmosphere pressure from the work of Lovejoy and Hanson (1996) in view of theextended pressure range used. The extrapolation ofk to 1 atm has been performed following the Troe formalism. The morerecent work (Lovejoy and Hanson, 1996; Lovejoy, 1997) showed the product of the reaction to be the association complexNH3·SO3, sulfamic acid.
References
Lovejoy, E. R.: J. Phys. Chem. A 101, 4950, 1997.Lovejoy, E. and Hanson, D. R.: J. Phys. Chem., 100, 4459, 1996.Shen, G., Suto, M. and Lee, L. C.: J. Geophys. Res., 95, 13 981, 1990.
www.atmos-chem-phys.org/acp/4/1461/ Atmos. Chem. Phys., 4, 1461–1738, 2004

1688 R. Atkinson et al.: Evaluated kinetic and photochemical data for Ox, HOx, NOx and SOx
I.A4.121
CS + O2 → CO + SO (1)→ OCS + O (2)
1H ◦(1) = −378 kJ·mol−1
1H ◦(2) = −165 kJ·mol−1
Rate coefficient data (k = k1 + k2)
k/cm3 molecule−1 s−1 Temp./K Reference Technique/Comments
Absolute Rate Coefficients
k2 = (4.5± 1.7)×10−19 293 Richardson, 1975 (a)k2 = (5.9± 1.3)×10−18 495(2.9± 0.4)×10−19 298 Black et al., 1983 (b)
Branching Ratios
k2/k1 = 1.2 298 Wood and Heicklen, 1971a, 1973/74 (c)k2/k1 = 1.2 341–415 Wood and Heicklen, 1971b (d)
Comments
(a) Discharge flow system used. CS radicals were produced by a discharge through CS2. CS, SO2, CO and OCS weremeasured by MS. A very slow linear flow rate (∼ 100 cm s−1) was necessary to observe the reaction. SO2, a productformed via channel (1), was at least one order of magnitude lower in concentration than CO and OCS.
(b) CS radicals were produced by pulsed laser photolysis of CS2 in He bath gas [32 mbar (24 Torr)], and were monitored byLIF at 257.7 nm.
(c) Photolysis of CS2-O2 mixtures, with analysis of CO, OCS, SO2 and S2O products by GC. Light of wavelength 313 nmwas used in Wood and Heicklen (1971a), which has insufficient energy to dissociate the CS2, but CS was postulated tohave been formed by reaction of electronically excited CS2 with O2. In the later study (Wood and Heicklen, 1973/74),λ
= 213.9 nm was used which can photodissociate CS2.
(d) Explosion limits of CS2-O2 mixtures were determined by GC. The [CO]/[OCS] ratio was relatively unaffected by pressureand temperature changes, and the value of 0.84 found for this ratio is the same as that observed in photochemical studies(Wood and Heicklen, 1971a; 1973/74). The explosion limits were modeled on the basis of an assumed mechanism ofeight reactions, and a computer fit to the data yielded the value fork2/k1.
Preferred Values
k = 2.9×10⁻¹⁹ cm3 molecule−1 s−1 at 298 K.
Reliability
1log k = ±0.6 at 298 K.
Comments on Preferred Values
The reaction of CS with O2 is slow at 298 K and difficult to study. The technique used by Black et al. (1983) seems the mostsuitable for avoiding the difficulties associated with the slowness of the reaction, and their rate coefficient at 298 K is preferred.
The relative importance of the two possible reaction channels is in dispute. Evidence from the photochemical and explosionlimit studies (Wood and Heicklen, 1971a; 1971b; 1973/74) indicate a comparable importance of channels (1) and (2), but in themore direct flow (Richardson, 1975) system study,k1 was found to be at least an order of magnitude less thank2. However, the
Atmos. Chem. Phys., 4, 1461–1738, 2004 www.atmos-chem-phys.org/acp/4/1461/

R. Atkinson et al.: Evaluated kinetic and photochemical data for Ox, HOx, NOx and SOx 1689
value ofk2 obtained in the fast flow study (Richardson, 1975) appears to be unacceptably high. We make no recommendationfor the branching ratio.
The one available measurement ofk at higher temperatures (Richardson, 1975), when combined with the 298 K values,leads to an Arrhenius expression with an extremely low pre-exponential factor. No recommendation is hence made for thetemperature dependence.
References
Black, G., Jusinski, L. E. and Slanger, T. G.: Chem. Phys. Lett., 102, 64, 1983.Richardson, R. J.: J. Phys. Chem., 79, 1153, 1975.Wood, W. P. and Heicklen, J.: J. Phys. Chem., 75, 854, 1971a.Wood, W. P. and Heicklen, J.: J. Phys. Chem., 75, 861, 1971b.Wood, W. P. and Heicklen, J.: J. Photochem., 2, 173, 1973/74.
www.atmos-chem-phys.org/acp/4/1461/ Atmos. Chem. Phys., 4, 1461–1738, 2004

1690 R. Atkinson et al.: Evaluated kinetic and photochemical data for Ox, HOx, NOx and SOx
I.A4.122
CS + O3 → OCS + O2
1H ◦(1) = −557 kJ·mol−1
Rate coefficient data
k/cm3 molecule−1 s−1 Temp./K Reference Technique/Comments
Absolute Rate Coefficients
(3.0± 0.4)×10−16 298 Black et al., 1983 (a)
Comments
(a) CS radicals were produced by pulsed laser photolysis of CS2 at 193 nm, with He as the buffer gas at a total pressure of67–400 mbar (50–300 Torr). CS radicals were monitored by LIF at 257.7 nm.
Preferred Values
k = 3.0×10⁻¹⁶ cm3 molecule−1 s−1 at 298 K.
Reliability
1log k = ±0.5 at 298 K.
Comments on Preferred Values
The only available measurement of the rate coefficientk is that of Black et al. (1983). Their value is accepted, with substantialerror limits.
References
Black, G., Jusinski, L. E. and Slanger, T. G.: Chem. Phys. Lett., 102, 64, 1983.
Atmos. Chem. Phys., 4, 1461–1738, 2004 www.atmos-chem-phys.org/acp/4/1461/
R. Atkinson et al.: Evaluated kinetic and photochemical data for Ox, HOx, NOx and SOx 1691
I.A4.123
CS + NO2 → OCS + NO
1H ◦ = −357 kJ·mol−1
Rate coefficient data
k/cm3 molecule−1 s−1 Temp./K Reference Technique/Comments
Absolute Rate Coefficients
(7.6± 1.1)×10−17 298 Black et al., 1983 (a)
Comments
(a) CS radicals were produced by pulsed laser photolysis of CS2 at 193 nm and monitored by LIF at 257.7 nm. He [32 mbar(24 Torr) total pressure] was used as the buffer gas.
Preferred Values
k = 7.6×10⁻¹⁷ cm3 molecule−1 s−1 at 298 K.
Reliability
1log k = ±0.5 at 298 K.
Comments on Preferred Values
The only available measurement ofk is that of Black et al. (1983). Their value is accepted, but with substantial error limits.
References
Black, G., Jusinski, L. E. and Slanger, T. G.: Chem. Phys. Lett., 102, 64, 1983.
www.atmos-chem-phys.org/acp/4/1461/ Atmos. Chem. Phys., 4, 1461–1738, 2004
1692 R. Atkinson et al.: Evaluated kinetic and photochemical data for Ox, HOx, NOx and SOx
I.A4.124
CH2SH + O2 → products
Rate coefficient data
k/cm3 molecule−1 s−1 Temp./K Reference Technique/Comments
Absolute Rate Coefficients
(8.5± 1.0)×10−12 298 Anastasi et al., 1992 (a)(4.6± 1.9)×10−12 298 Rahman et al., 1992 (b)
Comments
(a) Pulsed radiolysis of CH3SH-O2-SF6 mixtures at 1 bar total pressure. CH2SH and CH3S radicals were generated by reac-tions of the radiolytically produced F atoms with CH3SH. [CH2SH] was monitored by UV absorption over the wavelengthrange 220–380 nm.
(b) Fast flow discharge study. CH2SH radicals were generated by reaction of F atoms with CH3SH, and [CH2SH] wasmonitored by mass spectrometry. The source reactions were simulated to check consumption of F atoms. The totalpressure was 3 mbar.
Preferred Values
k = 6.6×10⁻¹² cm3 molecule−1 s−1 at 298 K.
Reliability
1log k = ±0.3 at 298 K.
Comments on Preferred Values
The only two measurements ofk differ by almost a factor of 2. The values ofk(CH2SH + NO2) measured in these twostudies also differ, although the error limits are large enough to encompass the two results. Until further studies are carried out,a mean of the two values is recommended, with substantial error limits.
References
Anastasi, C., Broomfield, M., Nielsen, O. J. and Pagsberg, P.: J. Phys. Chem., 96, 696, 1992.Rahman, M. M., Becker, E., Wille, U. and Schindler, R. N.: Ber. Bunsenges. Phys. Chem., 96, 783, 1992.
Atmos. Chem. Phys., 4, 1461–1738, 2004 www.atmos-chem-phys.org/acp/4/1461/

R. Atkinson et al.: Evaluated kinetic and photochemical data for Ox, HOx, NOx and SOx 1693
I.A4.125
CH2SH + O3 → products
Rate coefficient data
k/cm3 molecule−1 s−1 Temp./K Reference Technique/Comments
Absolute Rate Coefficients
(3.5± 1.2)×10−11 298 Rahman et al., 1992 (a)
Comments
(a) Fast-flow discharge study. CH2SH radicals were generated by the reaction of F atoms with CH3SH, and monitored byMS. Source reactions were simulated to check consumption of F atoms. The total pressure was 3 mbar.
Preferred Values
k = 3.5×10⁻¹¹ cm3 molecule−1 s−1 at 298 K.
Reliability
1log k = ±0.3 at 298 K.
Comments on Preferred Values
The only available determination (Rahman et al., 1992) ofk is accepted, but with substantial error limits until confirmatorystudies can be made.
References
Rahman, M. M., Becker, E., Wille, U. and Schindler, R. N.: Ber. Bunsenges. Phys. Chem., 96, 783, 1992.
www.atmos-chem-phys.org/acp/4/1461/ Atmos. Chem. Phys., 4, 1461–1738, 2004
1694 R. Atkinson et al.: Evaluated kinetic and photochemical data for Ox, HOx, NOx and SOx
I.A4.126
CH2SH + NO → products
Rate coefficient data
k/cm3 molecule−1 s−1 Temp./K Reference Technique/Comments
Absolute Rate Coefficients
(1.5± 0.2)×10−11 298 Anastasi et al., 1992 (a)
Comments
(a) Pulsed radiolysis of CH3SH-O2-SF6 mixtures at 1 bar total pressure. CH2SH and CH3S radicals were generated byreactions of the radiolytically produced F atoms with CH3SH, and [CH2SH] was monitored by UV absorption over thewavelength range 220–380 nm.
Preferred Values
k = 1.5×10⁻¹¹ cm3 molecule−1 s−1 at 298 K.
Reliability
1log k = ±0.3 at 298 K.
Comments on Preferred Values
The only available determination (Anastasi et al., 1992) ofk is accepted, but with substantial error limits until confirmatorystudies are made.
References
Anastasi, C., Broomfield, M., Nielsen, O. J. and Pagsberg, P.: J. Phys. Chem., 96, 696, 1992.
Atmos. Chem. Phys., 4, 1461–1738, 2004 www.atmos-chem-phys.org/acp/4/1461/

R. Atkinson et al.: Evaluated kinetic and photochemical data for Ox, HOx, NOx and SOx 1695
I.A4.127
CH2SH + NO2 → products
Rate coefficient data
k/cm3 molecule−1 s−1 Temp./K Reference Technique/Comments
Absolute Rate Coefficients
(3.8± 1.0)×10−11 298 Anastasi et al., 1992 (a)(6.9± 4)×10−11 298 Rahman et al., 1992 (b)
Comments
(a) Pulsed radiolysis of CH3SH-O2-SF6 mixtures at 1 bar total pressure. CH2SH and CH3S radicals were generated byreactions of the radiolytically produced F atoms with CH3SH, and [CH2SH] was monitored by UV absorption over thewavelength range 220–380 nm.
(b) Fast flow discharge study. CH2SH radicals were generated by the reaction of F atoms with CH3SH and were monitoredby MS. Source reactions were simulated to check consumption of F atoms. The total pressure was 3 mbar.
Preferred Values
k = 4.4×10⁻¹¹ cm3 molecule−1 s−1 at 298 K.
Reliability1log k = ±0.5 at 298 K.
Comments on Preferred Values
The only two measurements (Anastasi et al., 1992; Rahman et al., 1992) ofk differ substantially but because the error limitsare large enough to encompass the two results it is difficult to know whether the difference is significant. In the same twostudies the values obtained fork(CH2SH + O2) differed to the same degree with much smaller error limits.
Until further studies are carried out, we recommend a weighted mean of the two values and substantial error limits.
References
Anastasi, C., Broomfield, M., Nielsen, O. J. and Pagsberg, P.: J. Phys. Chem., 96, 696, 1992.Rahman, M. M., Becker, E., Wille, U. and Schindler, R. N.: Ber. Bunsenges. Phys. Chem., 96, 783, 1992.
www.atmos-chem-phys.org/acp/4/1461/ Atmos. Chem. Phys., 4, 1461–1738, 2004

1696 R. Atkinson et al.: Evaluated kinetic and photochemical data for Ox, HOx, NOx and SOx
I.A4.128
CH3S + O2 + M → CH3SOO + M
1H ◦ = −48.9 kJ·mol−1
Rate coefficient data
k/cm3 molecule−1 s−1 Temp./K Reference Technique/Comments
Absolute Rate Coefficients
<2×10⁻¹⁷ 298 Balla et al., 1986 PLP-LIF<1×10⁻¹⁶ 298 Black and Jusinski, 1986 PLP-LIF<2.5×10⁻¹⁸ 298 Tyndall and Ravishankara, 1989 PLP-LIF(1.81± 0.28)×10−13 107 mbar He 216 Turnipseed et al., 1992 (a)(1.55± 0.23)×10−13 107 mbar He 222(1.05± 0.20)×10−13 107 mbar He 233(9.0± 1.6)×10−14 107 mbar He 237(8.62± 0.84)×10−14 107 mbar He 242(7.0± 2.0)×10−14 107 mbar He 250
Relative Rate Coefficients
2×10⁻¹⁴ 298 Hatakeyama and Akimoto, 1983 RR (b)3×10⁻¹⁷ 298 Grosjean, 1984 RR (c)>2.3×10⁻¹⁶ 296 Balla and Heicklen, 1985 RR (d)
Comments
(a) Pulsed laser photolysis system with LIF detection of CH3S radicals. The measured rate coefficients were observed tovary with the total pressure and the diluent gas. An upper limit to the rate coefficient for the reaction of the CH3SOOradical with O2 of 4×10⁻¹⁷ cm3 molecule−1 s−1 at 258 K was also derived. The CH3S-OO bond energy was determinedto be 49 kJ mol−1 at 298 K from measurements of the equilibrium constant over the temperature range 216–258 K, with1Hf (CH3SOO) = 75.7± 4.2 kJ mol−1 at 298 K.
(b) Photolysis of CH3SSCH3-RONO-NO-air mixtures. The products were analyzed by FTIR and GC-MS and the yields ofSO2 and CH3SNO measured. From an assumed mechanism, the rate coefficient ratiok(CH3S + NO)/k = 2×10³ wasderived. A rate coefficient ofk(CH3S + NO) = 4×10⁻¹¹ cm3 molecule−1 s−1 was used to obtain the rate coefficient givenin the table.
(c) Environmental chamber study using the oxidation of organo-sulfur compounds in air by natural sunlight. Major productswere SO2, CH3SO3H and HCHO. Production of SO2 and sulphur were related to an unidentified compound (assumed tobe CH3SNO2) formed from CH3S + NO2. A rate coefficient ratio ofk(CH3S + NO2)/k = 2×10⁶ was derived, and placedon an absolute basis by use ofk(CH3S + NO2) = 6×10⁻¹¹ cm3 molecule−1 s−1 (this evaluation).
(d) From the photolysis of (CH3S)2-O2-N2 mixtures at 253.7 nm, with product analysis by GC and MS. The SO2 yield wasmeasured as a function of [(CH3S)2], [O2] and light intensity. From an assumed mechanism, a value ofk2/2k(CH3S +CH3S)> 6×10⁻²² cm3 molecule−1 s−1 was derived. A rate coefficient ofk(CH3S + CH3S) = 4.1×10⁻¹¹ cm3 molecule−1
s−1 (from Graham et al., 1964) was used to obtain the rate coefficient given in the table.
Preferred Values
The data of Turnipseed et al. (1992) given in the above Table are preferred. These data at 107 mbar He are described byk
(210–250 K) = 1.2×10⁻¹⁶ exp (1580/T ) cm3 molecule−1 s−1.
Atmos. Chem. Phys., 4, 1461–1738, 2004 www.atmos-chem-phys.org/acp/4/1461/
R. Atkinson et al.: Evaluated kinetic and photochemical data for Ox, HOx, NOx and SOx 1697
Reliability
1log k = ±0.3 over the temperature range 216–250 K at 107 mbar He.
Comments on Preferred Values
The study of Turnipseed et al. (1992) was the first to observe addition of O2 to the CH3S radical to form CH3SOO [andnot CH3S(O)O], because the reaction was observed to be reversible leading to equilibrium between CH3S radicals, O2 andCH3SOO radicals (Turnipseed et al., 1992). Previous studies (Balla et al., 1986; Black and Jusinski, 1986; Tyndall andRavishankara, 1989) of the reaction of CH3S radicals with O2 at 298 K did not observe the equilibrium addition of O2 to CH3Sradicals, and the rate coefficients measured correspond to upper limits to the rate coefficients for the reactions
CH3S+ O2 → products other than CH3SOO
and/or
CH3SOO+ O2 → products
The reaction of CH3S radicals with O2 to form the CH3SOO radical, and the reverse reaction, result in∼33% of CH3Sradicals being present as the CH3SOO adduct at 298 K and ground level (Turnipseed et al., 1992), with the [CH3SOO]/[CH3S]ratio being strongly temperature dependent (Turnipseed et al., 1992).
References
Balla, R. J. and Heicklen, J.: J. Photochem., 29, 297, 1985.Balla, R. J., Nelson, H. H. and McDonald, J. R.: Chem. Phys., 109, 101, 1986.Black, G. and Jusinski, L. E.: J. Chem. Soc. Faraday Trans. 2, 82, 2143, 1986.Graham, D. M., Mieville, R. L., Pallen, R. H. and Sivertz, C.: Can. J. Chem., 42, 2250, 1964.Grosjean, D.: Environ. Sci. Technol., 18, 460, 1984.Hatakeyama, S. and Akimoto, H.: J. Phys. Chem., 87, 2387, 1983.Turnipseed, A. A., Barone, S. B. and Ravishankara, A. R.: J. Phys. Chem., 96, 7502, 1992.Tyndall, G. S. and Ravishankara, A. R.: J. Phys. Chem., 93, 2426, 1989.
www.atmos-chem-phys.org/acp/4/1461/ Atmos. Chem. Phys., 4, 1461–1738, 2004
1698 R. Atkinson et al.: Evaluated kinetic and photochemical data for Ox, HOx, NOx and SOx
I.A4.129
CH3SOO + M → CH3S + O2 + M
1H ◦ = 48.9 kJ·mol−1
Rate coefficient data
k/s−1 Temp./K Reference Technique/Comments
Absolute Rate Coefficients
(1.99± 0.74)×103 at 107 mbar He 216 Turnipseed et al., 1992 (a)(3.20± 0.80)×103 at 107 mbar He 222(9.1± 2.6)×103 at 107 mbar He 233(1.00± 0.12)×104 at 107 mbar He 237(1.28± 0.12)×104 at 107 mbar He 242(2.4± 0.4)×104 at 107 mbar He 250>3.5×10⁴ at 107 mbar He 258
Comments
(a) Pulsed laser photolysis system with LIF detection of CH3S radicals. The formation and decay rate coefficients of CH3SOOradicals were derived from the observed time-concentration profiles of CH3S radicals in the presence of O2. The measuredrate coefficients for the reactions CH3S + O2 → CH3SOO were observed to vary with total pressure and with the diluentgas.
Preferred Values
The data of Turnipseed et al. (1992) given in above table are preferred. These data at 107 mbar He are described by:k(216–250 K) =3.5×10¹⁰ exp (−3560/T ) s−1.
Reliability
1log k = ±0.3 at 107 mbar He over the temperature range 216–250 K.
Comments on Preferred Values
The data presented by Turnipseed et al. (1992) were the first reported for the dissociation of the CH3SOO radical (see alsothe data sheet in this evaluation for the reverse reaction CH3S + O2 + M → CH3SOO + M). In the atmosphere,∼33% of CH3Sradicals will be present as the CH3SOO adduct at 298 K at ground level (Turnipseed et al., 1992), with the [CH3SOO]/[CH3S]ratio being strongly temperature dependent (Turnipseed et al., 1992).
References
Turnipseed, A. A., Barone, S. B. and Ravishankara, A. R.: J. Phys. Chem., 96, 7502, 1992.
Atmos. Chem. Phys., 4, 1461–1738, 2004 www.atmos-chem-phys.org/acp/4/1461/

R. Atkinson et al.: Evaluated kinetic and photochemical data for Ox, HOx, NOx and SOx 1699
I.A4.130
CH3S + O3 → products
Rate coefficient data
k/cm3 molecule−1 s−1 Temp./K Reference Technique/Comments
Absolute Rate Coefficients
<8×10⁻¹⁴ 298 Black and Jusinski, 1986 PLP-LIF(4.1± 2.0)×10−12 298 Tyndall and Ravishankara, 1989 PLP-LIF(5.7± 1.4)×10−12 300 Domine et al., 1992 (a)1.98×10⁻¹² exp[(290± 40)/T ] 295–359 Turnipseed et al., 1993 (b)5.16×10⁻¹² 2981.02×10−12 exp[(432± 77)/T ] 259–381 Martinez et al., 2000 (c)(4.6± 0.6)×10−12 298
Comments
(a) Discharge flow study. CH3S radicals were generated by reaction of Cl with CH3SH. Photoionization mass spectrometrywas used to monitor CH3S radicals. C2F3Cl was added to scavenge OH radicals and hence suppress OH radical-initiatedchain reaction which regenerates CH3S. Some curvature was observed on [CH3S] logarithmic decay plots in excess O3.The initial slope was used to calculatek.
(b) Pulsed laser photolysis of (CH3)2S-O3-O2-He (193 nm) mixtures. [CH3S] was monitored by LIF. Pressure range 27–267mbar (20–200 Torr).
(c) Pulsed laser photolysis of CH3SCH3–O3 mixtures at 193 nm in the range 33–400 mbar He and 259–381 K. [CH3S] wasmonitored by LIF leading to the pressure-independentk with a slight negative activation energy. No regeneration of CH3Swas observed under the chosen experimental conditions (5–15% O2 impurity relative to [O3], observation of CH3S overup to 7–10 lifetimes).
Preferred Values
k = 4.9×10⁻¹² cm3 molecule−1 s−1 at 298 K.k = 1.15×10⁻¹²exp (430/T ) cm3 molecule−1 s−1 over the temperature range 250–390 K.
Reliability
1log k = ±0.2 at 298 K.1(E/R) = ±100 K.
Comments on Preferred Values
It is difficult to study this reaction because in some conditions rapid chain processes involving the reaction products occur toregenerate CH3S radicals (Tyndall and Ravishankara, 1989; Domine et al., 1992; Turnipseed et al., 1993). This complicationappears to be absent in the most recent studies of Turnipseed et al. (1993) and Martinez et al. (2000) under the conditions usedfor rate coefficient determinations. Their value ofk at 298 K is in good agreement with other studies in which care was takento allow for this complication (Tyndall and Ravishankara, 1989; Domine et al., 1992). The mean of the values from the twomost recent studies (Turnipseed et al., 1993; Martinez et al., 2000) is taken as our recommended value at 298 K.
There are two studies of the temperature dependence ofk (Turnipseed et al., 1993; Martinez et al., 2000). The rate parametersresulting from the most recent study covering the widest temperature range are accepted and the pre-exponential factor isadjusted to yield the recommended value ofk at 298 K.
www.atmos-chem-phys.org/acp/4/1461/ Atmos. Chem. Phys., 4, 1461–1738, 2004

1700 R. Atkinson et al.: Evaluated kinetic and photochemical data for Ox, HOx, NOx and SOx
References
Black, G. and Jusinski, L. E.: J. Chem. Soc. Faraday Trans. 2, 82, 2143, 1986.Domine, F., Ravishankara, A. R. and Howard, C. J.: J. Phys. Chem., 96, 2171, 1992.Martinez, E., Albaladejo, J., Notario, A. and Jimenez, E.: Atm. Env., 34, 5295, 2000.Turnipseed, A. A., Barone, S. B. and Ravishankara, A. R.: J. Phys. Chem., 97, 5926, 1993.Tyndall, G. S. and Ravishankara, A. R.: J. Phys. Chem., 93, 4707, 1989.
Atmos. Chem. Phys., 4, 1461–1738, 2004 www.atmos-chem-phys.org/acp/4/1461/
R. Atkinson et al.: Evaluated kinetic and photochemical data for Ox, HOx, NOx and SOx 1701
I.A4.131
CH3S + NO + M → CH3SNO + M
Low-pressure rate coefficients
Rate coefficient data
k/cm3 molecule−1 s−1 Temp./K Reference Technique/Comments
Absolute Rate Coefficients
(3.24± 0.36)×10−29 [N2] 295 Balla et al., 1986 (a)(1.43± 0.36)×10−29 [N2] 351(1.13± 0.20)×10−29 [N2] 397(5.84± 0.66)×10−30 [N2] 453
Comments
(a) Pulsed laser photolysis of (CH3S)2-NO-N2 (or SF6) mixtures at 266 nm, with CH3S being monitored by LIF. Lower partof the falloff curves were measured over the pressure range 2–400 mbar (1.5–300 Torr) of N2. Falloff extrapolations werecarried out with fitted values ofFc of 0.6, 0.86, 0.77, and 0.94 at 295, 351, 397, and 453 K, respectively.
Preferred Values
k0 = 3.3×10⁻²⁹ (T /300)−4 [N2] cm3 molecule−1 s−1 over the temperature range 290–450 K. This value was obtained byfitting to the pressure and temperature dependent data in N2 using a temperature independent values ofFc = 0.54 andk∞
derived from data in SF6 (see below).
Reliability
1log k0 = ± 0.3 at 298 K.1n = ±2.
Comments on Preferred Values
The preferred values are based on the data of Balla et al. (1986). A further determination in N2 at a single temperature andpressure (298 K and 33 mbar) by Turnipseed et al. (1996) is in good agreement. Although the falloff extrapolations in Balla etal. (1986) were made with a theoretically improbable temperature coefficient ofFc, the low-pressure rate coefficients are muchless influenced by this extrapolation than the high-pressure rate coefficients.
High-pressure rate coefficients
Rate coefficient data
k∞/cm3 molecule−1 s−1 Temp./K Reference Technique/Comments
Absolute Rate Coefficients
1.81×10⁻¹² exp(900/T ) 295–453 Balla et al., 1986 (a)(3.97± 0.44)×10−11 in 300 Torr SF6 295
www.atmos-chem-phys.org/acp/4/1461/ Atmos. Chem. Phys., 4, 1461–1738, 2004

1702 R. Atkinson et al.: Evaluated kinetic and photochemical data for Ox, HOx, NOx and SOx
Comments
(a) See comment (a) fork0. High-pressure limit was obtained from measurements at 267 and 400 mbar (200 and 300 Torr)of SF6.
Preferred Values
k∞ = 4.0×10⁻¹¹ cm3 molecule−1 s−1, independent of temperature over the range 290–450 K.
Reliability
1log k∞ = ±0.5 over the temperature range 290–450 K.
Comments on Preferred Values
The negative temperature coefficient ofk∞ reported in Balla et al. (1986) is most probably due to an increasing underestimateof the falloff corrections with increasing temperature. We recommend the use of the extrapolatedk∞ value at 298 K over largetemperature ranges together withFc = 0.54. Along with the values recommended fork0 above, this parameterisation accuratelyreproduces all the data in N2.
Intermediate Falloff Range
Rate coefficient data
k/cm3 molecule−1 s−1 P/mbar M Temp./K Reference Technique/Comments
Absolute Rate Coefficients
(1.69± 0.04)×10−11 28 He 227 Turnipseed et al., 1993 (a)(1.30± 0.09)×10−11 25 He 242(1.89± 0.08)×10−11 25 He 242
Comments
(a) CH3S radicals were generated by either photolysis of dimethyl sulfide at 193 nm or photolysis of dimethyl disulfide at248 nm. The decay of CH3S radical concentrations was followed by LIF. Experiments were performed under slow gasflow conditions.
References
Balla, R. J., Nelson, H. H. and McDonald, J. R.: Chem. Phys., 109, 101, 1986.Turnipseed, A. A., Barone, S. B. and Ravishankara, A. R.: J. Phys. Chem., 97, 5926, 1993.Turnipseed, A. A., Barone, S. B. and Ravishankara, A. R.: J. Phys. Chem., 100, 14 703, 1996.
Atmos. Chem. Phys., 4, 1461–1738, 2004 www.atmos-chem-phys.org/acp/4/1461/

R. Atkinson et al.: Evaluated kinetic and photochemical data for Ox, HOx, NOx and SOx 1703
I.A4.132
CH3S + NO2 → CH3SO + NO
1H ◦ = −135 kJ·mol−1
Rate coefficient data
k/cm3 molecule−1 s−1 Temp./K Reference Technique/Comments
Absolute Rate Coefficients
8.3×10⁻¹¹ exp[(80± 60)/T ] 295–511 Balla et al., 1986 PLP-LIF9.8×10−11 295(6.10± 0.90)×10−11 298 Tyndall and Ravishankara, 1989 PLP-LIF(5.1± 0.9)×10−11 297 Domine et al., 1990 DF-MS2.1×10−11 exp[(320± 40)/T ] 242–350 Turnipseed et al., 1993 (a)(6.28± 0.28)×10−11 2983.8×10−11 exp[(160± 22)/T ] 263–381 Martınez, et al., 1999 PLP-LIF (b)(6.52± 0.65)×10−11 2984.3×10−11 exp[(241± 62)/T ] 222–420 Chang et al., 2000 PLP-LIF (c)(10.1± 0.5)×10−11 297
Comments
(a) Pulsed laser photolysis at 193 nm or 248 nm of (CH3)2S-NO2 or (CH3)2S2-NO2 mixtures in bath gas of He, N2 or SF6.[CH3S] was monitored by LIF. Pressure varied over the range of 27–267 mbar (20–200 Torr) He.
(b) Pulsed laser photolysis of CH3SCH3 (193 nm) or CH3SSCH3(248 nm) mixed with NO2 in 30–300 Torr He bath gas,detection of CH3S by LIF. Addition of up to 5 Torr O2 (as scavenger of CH3 formed in photolysis of CH3SCH3) had noinfluence on the rate coefficient.
(c) Pulsed laser photolysis of CH3SSCH3(248 nm) mixed with NO2 in 55–202 Torr He bath gas, detection of CH3S by LIF.
Preferred Values
k = 6.0×10⁻¹¹ cm3 molecule−1 s−1 at 298 K.k = 3.0×10⁻¹¹ exp(210/T ) cm3 molecule−1 s−1 over the temperature range 240–350 K.
Reliability
1log k = ±0.15 at 298 K.1(E/R) = ±200 K.
Comments on Preferred Values
The recommended value at 298 K is the mean of the studies of Tyndall and Ravishankara (1989), Domine et al. (1990),Turnipseed et al. (1993) and Martınez et al. (1999), which are in good agreement. There are four studies (Balla et al., 1986;Turnipseed et al., 1993; Martınez et al., 1999; Chang et al., 2000) of the temperature dependence ofk, all giving a negativevalue ofE/R but differing significantly in magnitude. Two studies, Balla et al. (1986) and Chang et al. (2000), obtained valuesof k nearly twice as large as those found in the other studies. It has been suggested (Tyndall and Ravishankara, 1989) that thiscould arise from secondary chemistry arising from the higher radical concentrations used in the work of Balla et al. (1986),though this argument does not apply to Chang et al. (2000). The temperature dependent expression fork is derived by fittingto the data of Turnipseed et al. (1993) and Martınez et al. (1999) and the recommended value ofk at 298 K.
www.atmos-chem-phys.org/acp/4/1461/ Atmos. Chem. Phys., 4, 1461–1738, 2004
1704 R. Atkinson et al.: Evaluated kinetic and photochemical data for Ox, HOx, NOx and SOx
The lack of pressure dependence ofk found in the recent (Turnipseed et al., 1993; Martınez et al., 1999; Chang et al., 2000)and earlier studies (Balla et al., 1986; Tyndall and Ravishankara, 1989) is consistent with the major pathway for the reactionproceeding directly to NO and CH3SO rather than by addition to give CH3SNO2. The CH3SO yield has been determined byDomine et al. (1990) to be 1.07± 0.15, the yield of NO was determined by Tyndall and Ravishankara (1989) to be 0.8± 0.2.End product studies (Barnes et al., 1987) are in agreement with this conclusion.
References
Balla, R. J., Nelson, H. H. and McDonald, J. R.: Chem. Phys., 109, 101, 1986.Barnes, I., Bastian, V., Becker, K. H. and Niki, H.: Chem. Phys. Lett., 140, 451, 1987.Chang, P.-F., Wang, T. T., Wang, N. S., Hwang, Y.-L. and Lee, Y.-P.: J. Phys. Chem., 104, 5525, 2000.Domine, F., Murrells, T. P. and Howard, C. J.: J. Phys. Chem., 94, 5839, 1990.Martınez, E., Albaladejo, J., Jimenez, E., Notario, A. and Aranda, A.: Chem. Phys. Lett., 308, 37, 1999.Turnipseed, A. A., Barone, S. B. and Ravishankara, A. R.: J. Phys. Chem., 97, 5926, 1993.Tyndall, G. S. and Ravishankara, A. R.: J. Phys. Chem., 93, 2426, 1989.
Atmos. Chem. Phys., 4, 1461–1738, 2004 www.atmos-chem-phys.org/acp/4/1461/

R. Atkinson et al.: Evaluated kinetic and photochemical data for Ox, HOx, NOx and SOx 1705
I.A4.133
CH3SO + O3 → products
Rate coefficient data
k/cm3 molecule−1 s−1 Temp./K Reference Technique/Comments
Absolute Rate Coefficients
1×10⁻¹² 298 Tyndall and Ravishankara, 1989 PLP-LIF(6.0± 3.0)×10−13 300 Domine et al., 1992 (a)
Comments
(a) Discharge flow study. Photoionization mass spectrometry was used to monitor CH3SO radicals. The reaction of O(3P) +C2H5SCH3 was used as a source of CH3SO radicals. The rate coefficient obtained was considered preliminary.
Preferred Values
k = 6.0×10⁻¹³ cm3 molecule−1 s−1 at 298 K.
Reliability
1log k = ±0.3 at 298 K.
Comments on Preferred Values
The measurement ofk by Domine et al. (1992) is more direct than the previous study of Tyndall and Ravishankara (1989)in which the rate coefficient was derived by a complex analysis of the reaction system. However, there are still a number ofuncertainties in the study by Domine et al. (1992) who consider their quoted value ofk to be preliminary. This value (Domineet al., 1992) is accepted but substantial error limits are recommended.
References
Domine, F., Ravishankara, A. R. and Howard, C. J.: J. Phys. Chem., 96, 2171, 1992.Tyndall, G. S. and Ravishankara, A. R.: J. Phys. Chem., 93, 4707, 1989.
www.atmos-chem-phys.org/acp/4/1461/ Atmos. Chem. Phys., 4, 1461–1738, 2004

1706 R. Atkinson et al.: Evaluated kinetic and photochemical data for Ox, HOx, NOx and SOx
I.A4.134
CH3SO + NO2 → products
Rate coefficient data
k/cm3 molecule−1 s−1 Temp./K Reference Technique/Comments
Absolute Rate Coefficients
(3 ± 2)×10−11 298 Mellouki et al., 1988 DF-MS(8 ± 5)×10−12 298 Tyndall and Ravishankara, 1989 PLP-LIF(1.2± 0.25)×10−11 298 Domine et al., 1990 DF-MS(1.5± 0.4)×10−11 300 Kukui et al., 2000 PLP-LIF, DF-LIF (a)
Comment
(a) PLP of CH3SSCH3-NO2 mixtures at 248 nm relative to CH3I-NO2 at 351 nm in the range 16–814 mbar He at 300 K. Thetemporal profile of CH3O was monitored using LIF and fit to obtaink which was independent of pressure. Supportingmeasurements on absolute CH3 yields in the range 243–33 K in 16–814 mbar He have been performed, and branchingratios of the methyl forming rate constant to the total rate constant, and absolute SO2 yields at 1.3 mbar He, have beenmeasured.
Preferred Values
k = 1.2×10⁻¹¹ cm3 molecule−1 s−1 at 298 K.
Reliability
1log k = ±0.2 at 298 K.
Comments on Preferred Values
The measured values (Mellouki et al., 1988; Tyndall and Ravishankara, 1989; Domine et al., 1990; Kukui et al., 2000) ofk at 298 K agree within their error limits, some of which are substantial. The preferred value is that of Domine et al. (1990),which lies between the two values of Mellouki et al. (1988) and Tyndall and Ravishankara (1989), both of which have muchlarger error limits. The rate coefficient for this reaction is difficult to measure because of the lack of a clean primary sourceof CH3SO radicals and the complexity of the secondary chemistry. The two most recent determinations (Domine et al., 1990;Kukui et al., 2000) agree well with each other.
References
Domine, F., Murrells, T. P. and Howard, C. J.: J. Phys. Chem., 94, 5839, 1990.Kukui, A., Bossoutrot, V., Laverdet, G. and Le Bras, G.: J. Phys. Chem. A, 104, 935, 2000.Mellouki, A., Jourdain, J. L. and Le Bras, G.: Chem. Phys. Lett., 148, 231, 1988.Tyndall, G. S. and Ravishankara, A. R.: J. Phys. Chem., 93, 2426, 1989.
Atmos. Chem. Phys., 4, 1461–1738, 2004 www.atmos-chem-phys.org/acp/4/1461/
R. Atkinson et al.: Evaluated kinetic and photochemical data for Ox, HOx, NOx and SOx 1707
I.A4.135
CH3SOO + O3 → products
Rate coefficient data
k/cm3 molecule−1 s−1 Temp./K Reference Technique/Comments
Absolute Rate Coefficients
<8×10⁻¹³ 227 Turnipseed et al., 1993 (a)
Comments
(a) Pulsed laser photolysis of (CH3)2S-O2-O3 mixtures at 193 nm in bath gas of He, N2, or SF6. CH3S + O2 ↔ CH3SOOequilibrium established. [CH3S] was monitored by LIF. [CH3S] temporal profiles were simulated to obtaink. k(CH3S +O3) obtained in the same study was used in the fitting procedure.
Preferred Values
k < 8×10⁻¹³ cm3 molecule−1 s−1 at 227 K.
Comments on Preferred Values
The single study of the rate of this reaction (Turnipseed et al., 1993) has provided only an upper limit tok at 227 K, whichis accepted as the preferred value.
References
Turnipseed, A. A., Barone, S. B. and Ravishankara, A. R.: J. Phys. Chem., 97, 5926, 1993.
www.atmos-chem-phys.org/acp/4/1461/ Atmos. Chem. Phys., 4, 1461–1738, 2004

1708 R. Atkinson et al.: Evaluated kinetic and photochemical data for Ox, HOx, NOx and SOx
I.A4.136
CH3SOO + NO→ products
Rate coefficient data
k/cm3 molecule−1 s−1 Temp./K Reference Technique/Comments
Absolute Rate Coefficients
(1.10± 0.38)×10−11 227–256 Turnipseed et al., 1993 (a)
Comments
(a) Pulsed laser photolysis of (CH3)2S2-O2-NO mixtures at 248 nm with He or SF6 as the bath gas. Only a limited pressurerange could be studied [21–28 mbar (16–21 Torr) He, 25 mbar (19 Torr) SF6], but no effect of pressure onk was observed.[CH3S] was monitored by LIF and the temporal profile simulated to obtaink.
Preferred Values
k = 1.1×10⁻¹¹ cm3 molecule−1 s−1, independent of temperature over the range 227–256 K.
Reliability
1log k = ±0.3 over the range 227–256 K.
Comments on Preferred Values
The value ofk obtained in the only study of this reaction (Turnipseed et al., 1993) is accepted but substantial error limits areassigned until confirmatory studies are made.
References
Turnipseed, A. A., Barone, S. B. and Ravishankara, A. R.: J. Phys. Chem., 97, 5926, 1993.
Atmos. Chem. Phys., 4, 1461–1738, 2004 www.atmos-chem-phys.org/acp/4/1461/
R. Atkinson et al.: Evaluated kinetic and photochemical data for Ox, HOx, NOx and SOx 1709
I.A4.137
CH3SOO + NO2 → products
Rate coefficient data
k/cm3 molecule−1 s−1 Temp./K Reference Technique/Comments
Absolute Rate Coefficients
(2.2± 0.6)×10−11 227–246 Turnipseed et al., 1993 (a)
Comments
(a) Pulsed laser photolysis of (CH3)2S2-O2-NO2 mixtures at 248 nm in He [107–467 mbar (80–350 Torr)] or SF6 [87 mbar(65 Torr)]. [CH3S] was monitored and the temporal profile simulated to obtaink. No variation ofk with pressure ortemperature was observed.
Preferred Values
k = 2.2×10⁻¹¹ cm3 molecule−1 s−1, independent of temperature over the range 227–246 K.
Reliability1log k = ±0.3 over the range 227–246 K.
Comments on Preferred Values
The value ofk obtained in the only study (Turnipseed et al., 1993) of this reaction is accepted but substantial error limits areassigned until confirmatory studies are made.
References
Turnipseed, A. A., Barone, S. B. and Ravishankara, A. R.: J. Phys. Chem., 97, 5926, 1993.
www.atmos-chem-phys.org/acp/4/1461/ Atmos. Chem. Phys., 4, 1461–1738, 2004

1710 R. Atkinson et al.: Evaluated kinetic and photochemical data for Ox, HOx, NOx and SOx
I.A4.138
CH3SO2 + NO2 → Products (CH3SO3 + NO)
Rate coefficient data
k/cm3 molecule−1 s−1 Temp./K Reference Technique/Comments
Absolute Rate Coefficients
≤ 1×10⁻¹⁵ 300 Kukui et al., 2000 (a)
Comments
(a) Discharge flow study of Cl-CH3SH-NO2 reaction mixtures using MS/LIF detection at 13 mbar He and 300 K. The flu-orescence of both CH3O and SO2 were recorded as a function of time and the temporal profiles were fitted to obtaink
using an upper limit of 50 s−1 for the lifetime of CH3SO2 with respect to dissociation into CH3 + SO2.
Preferred Values
k ≤ 1×10⁻¹⁵ cm3 molecule−1 s−1 at 300 K.
Comments on Preferred Values
k is independent of pressure whose upper limit depends on the lifetime of CH3SO2 and on the absolute yield of SO2approaching unity at long reaction times.
References
Kukui, A., Bossoutrot, V., Laverdet, G. and Le Bras, G.: J. Phys. Chem. A, 104, 935, 2000.
Atmos. Chem. Phys., 4, 1461–1738, 2004 www.atmos-chem-phys.org/acp/4/1461/

R. Atkinson et al.: Evaluated kinetic and photochemical data for Ox, HOx, NOx and SOx 1711
I.A4.139
CH3SCH2 + O2 → CH3SCH2O2
Rate coefficient data
k/cm3 molecule−1 s−1 Temp./K Reference Technique/Comments
Absolute Rate Coefficients
(5.7± 0.4)×10−12 (1 bar) 298 Wallington et al., 1993 (a)2.3×10⁻¹³ (1.3 mbar He) 298 Butkovskaya and Le Bras, 1994 (b)1.9×10⁻¹³ (1.3 mbar He) 298
Comments
(a) Pulsed radiolysis of SF6-CH3SCH3-O2 mixtures. CH3SCH2 radicals were generated by reaction of F atoms withCH3SCH3, and monitored in absorption at 290 nm. The total pressure was approximately 1 bar.
(b) Discharge flow study of the NO3-CH3SCH3-Br2-O2 system at 1.3 mbar (1 Torr) He. NO3 radicals were produced byF + HNO3 reaction and added to CH3SCH3 to give CH3SCH2. Subsequent addition of Br2-O2 mixtures allowed moni-toring of competition between O2 and Br2 for CH3SCH2. Competition followed by mass spectrometric measurement of[CH3SCH2Br] profile. Modeling of profile givesk = 2.3×10⁻¹³ cm3 molecule−1 s−1. Similar study of Cl-Cl2-CH3SCH3-O2 system in which CH3SCH2 was produced by Cl + CH3SCH3 reaction gavek = 1.9×10⁻¹³ cm3 molecule−1 s−1.
Preferred Values
k = 5.7×10⁻¹² cm3 molecule−1 s−1 at 298 K and 1 bar.
Reliability
1log k = ±0.4 at 298 K and 1 bar.
Comments on Preferred Values
The preferred value ofk is taken from the study of Wallington et al. (1993). Until confirmatory studies are made we confineour recommendations to 1 bar and assign substantial error limits.
References
Butkovskaya, N. I. and Le Bras, G.: J. Phys. Chem., 98, 2582, 1994.Wallington, T. J., Ellermann, T. and Nielsen, O. J.: J. Phys. Chem., 97, 8442, 1993.
www.atmos-chem-phys.org/acp/4/1461/ Atmos. Chem. Phys., 4, 1461–1738, 2004

1712 R. Atkinson et al.: Evaluated kinetic and photochemical data for Ox, HOx, NOx and SOx
I.A4.140
CH3SCH2O2 + NO → CH3SCH2O + NO2
Rate coefficient data
k/cm3 molecule−1 s−1 Temp./K Reference Technique/Comments
Absolute Rate Coefficients
(1.9± 0.6)×10−11 298 Wallington et al., 1993 (a)(8.0± 3.1)×10−12 298 Turnipseed et al., 1996 (b)4.9×10⁻¹² exp[(263± 132)/T ] 261–400 Urbanski et al., 1997 (c)(1.14± 0.05)×10−11 298
Comments
(a) Pulse radiolysis of CH3SCH3-SF6-O2-NO mixtures. Generation of CH3SCH2O2 radicals occurred by F + CH3SCH3 →
CH3SCH2 + HF, followed by CH3SCH2 + O2 → CH3SCH2O2. [NO2] was monitored at 400 nm. Yield of NO2 comparedwith yield of F atoms suggested that 80% of the reaction leads to NO2 production.
(b) Derived from pulsed laser photolysis of H2O2-NO-CH3SCH3-O2 mixtures at 29 mbar total pressure, with monitoring ofthe temporal profiles of HO and CH3S radicals by LIF. The cited rate coefficient was obtained from numerical modelingusing a 34 step mechanism and assuming that CH3SCH2O2 + CH3SCH2O2 → CH3SCH2O + CH3SCH2O + O2 followedby decomposition of the CH3SCH2O radical to HCHO + CH3S.
(c) CH3SCH2O2 radicals were generated by the 248 nm pulsed laser photolysis of C(O)Cl2-CH3SCH3-O2-N2 mixtures at 13mbar total pressure, and the rate of formation of the product HCl was monitored in the presence of varying concentrationsof NO by TDLAS. Secondary reactions were shown to be unimportant, and a HCHO yield of 1.04± 0.13 was measured,with the HCHO arising from decomposition of CH3SCH2O radicals.
Preferred Values
k = 4.9×10⁻¹² exp(260/T ) cm3 molecule−1 s−1 over the temperature range 260–400 K.k = 1.2×10⁻¹¹ cm3 molecule−1 s−1 at 298 K.
Reliability
1log k = ±0.2 at 298 K.1(E/R) = ±300 K.
Comments on Preferred Values
The three studies carried out to date (Wallington et al., 1993; Turnipseed et al., 1996; Urbanski et al., 1997) result inroom temperature rate coefficients varying by a factor of 2.4. In the study of Wallington et al. (1993), the formation rate ofCH3SCH2O2 radicals was not much faster than the loss rate by reaction with NO (Urbanski et al., 1997). The Turnipseedet al. (1996) study was more indirect and subject to significant uncertainties. Accordingly, the preferred value of the ratecoefficient is based on the most direct study of Urbanski et al. (1997). The CH3SCH2O radical decomposes rapidly to formHCHO + CH3S (Urbanski et al., 1997).
References
Turnipseed, A. A., Barone, S. B. and Ravishankara, A. R.: J. Phys. Chem., 100, 14,703, 1996.Urbanski, S. P., Stickel, R. E., Zhao, Z. and Wine, P. H.: J. Chem. Soc. Faraday Trans., 93, 2813, 1997.Wallington, T. J., Ellermann, T. and Nielsen, O. J.: J. Phys. Chem., 97, 8442, 1993.
Atmos. Chem. Phys., 4, 1461–1738, 2004 www.atmos-chem-phys.org/acp/4/1461/

R. Atkinson et al.: Evaluated kinetic and photochemical data for Ox, HOx, NOx and SOx 1713
I.A4.141
CH3SCH2O2 + NO2 + M → CH3SCH2O2NO2 + M
Rate coefficient data
k/cm3 molecule−1 s−1 P/mbar M Temp./K Reference Technique/Comments
Absolute Rate Coefficients
(9.2± 0.9)×10−12 1000 SF6 296 Nielsen et al., 1995 (a)(7.1± 0.9)×10−12 300 SF6 296
Comments
(a) Pulse radiolysis of SF6-CH3SCH3-O2-NO2 mixtures with measurement of the rate of decay of NO2 via its absorption at400 nm. Insufficient data to obtaink0 or k∞, although the reaction was measured near the high-pressure limit.
Preferred Values
k = 9×10⁻¹² cm3 molecule−1 s−1 at 1 bar and 298 K.
Reliability
1log k = ±0.5 at 1 bar and 298 K.
Comments on Preferred Values
The preferred value is based on the sole study of Nielsen et al. (1995). Until further studies confirm this value, we assignlarge error limits.
References
Nielsen, O. J., Sehested, J. and Wallington, T. J.: Chem. Phys. Lett., 236, 385, 1995.
www.atmos-chem-phys.org/acp/4/1461/ Atmos. Chem. Phys., 4, 1461–1738, 2004
1714 R. Atkinson et al.: Evaluated kinetic and photochemical data for Ox, HOx, NOx and SOx
I.A4.142
CH3SCH2O2 + CH3SCH2O2 → CH3SCH2OH + CH3SCHO + O2 (1)→ 2CH3SCH2O + O2 (2)
Rate coefficient data (k = k1 + k2)
k/cm3 molecule−1 s−1 Temp./K Reference Technique/Comments
Absolute Rate Coefficients
≤7.9×10⁻¹² 298 Wallington et al., 1993 (a)(1.2± 0.5)×10−11 298 Urbanski et al., 1997 (b)
Comments
(a) k is defined by -d[CH3SCH2O2]/dt = 2k[CH3SCH2O2]2. Pulse radiolysis study of CH3SCH3-O2-SF6 mixtures withmonitoring of CH3SCH2O2 radical concentrations by UV absorption withσ250 = (4.3 ± 0.7)×10−18 cm2 molecule−1.The observed value ofkobs = (7.9± 1.4)×10−12 cm3 molecule−1 s−1 is an upper limit tok because of the possibility ofsecondary reactions giving rise to an increasing decay rate of CH3SCH2O2 radicals.
(b) CH3SCH2O2 radicals were generated by the 248 nm pulsed laser photolysis of C(O)Cl2-CH3SCH3-O2-N2 mixtures at 27mbar total pressure, and the products HCl and HCHO were monitored by TDLAS. The importance of secondary reactions(including from photolysis products of CH3SCH3) was investigated experimentally and by computer modeling, and a yieldof HCHO from the self-reaction of CH3SCH2O2 radicals of 0.97± 0.08 was obtained by extrapolation to zero CH3SCH3concentration. The cited value of the rate coefficient was obtained from numerical modeling. It was concluded that thereaction leads to formation of CH3SCH2O radicals via pathway (2), with the CH3SCH2O radical rapidly decomposing toform HCHO (and CH3S).
Preferred Values
k = 1.0×10⁻¹¹ cm3 molecule−1 s−1 at 298 K.k2/k = 1.0 at 298 K.
Reliability
1log k = ±0.3 at 298 K.1(k2/k) = ±0.3 at 298 K.
Comments on Preferred Values
The preferred value is an average of the measured overall rate coefficients of Wallington et al. (1993) and Urbanski etal. (1997). The product data of Urbanski et al. (1997) show that the reaction proceeds by channel (2), and that the alkoxyradical CH3SCH2O decomposes: CH3SCH2O → CH3S + HCHO. Reaction of the CH3S radical with the CH3SCH2O2 radicalcould lead to an enhanced decay rate of the CH3SCH2O2 radicals, and hence the preferred value of the rate coefficient isrigorously an upper limit.
References
Urbanski, S. P., Stickel, R. E., Zhao, Z. and Wine, P. H.: J. Chem. Soc. Faraday Trans., 93, 2813, 1997.Wallington, T. J., Ellermann, T. and Nielsen, O. J.: J. Phys. Chem., 97, 8442, 1993.
Atmos. Chem. Phys., 4, 1461–1738, 2004 www.atmos-chem-phys.org/acp/4/1461/

R. Atkinson et al.: Evaluated kinetic and photochemical data for Ox, HOx, NOx and SOx 1715
I.A4.143
CH3SS + O3 → products
Rate coefficient data
k/cm3 molecule−1 s−1 Temp./K Reference Technique/Comments
Absolute Rate Coefficients
(4.6± 1.1)×10−13 300 Domine et al., 1992 (a)
Comments
(a) Discharge-flow study. Photoionization mass spectrometry was used to monitor CH3SS radicals. CH3S radicals weregenerated by Cl + CH3SH, and CH3SS was observed to be formed in the CH3S source and thought to be due to the CH3S+ S2 reaction on walls. [CH3SS] was monitored in the presence of excess O3 to obtaink.
Preferred Values
k = 4.6×10⁻¹³ cm3 molecule−1 s−1 at 298 K.
Reliability
1log k = ±0.3 at 298 K.
Comments on Preferred Values
The only available measurement (Domine et al., 1992) ofk is accepted but substantial error limits are assigned until confir-matory studies are made.
References
Domine, F., Ravishankara, A. R. and Howard, C. J.: J. Phys. Chem., 96, 2171, 1992.
www.atmos-chem-phys.org/acp/4/1461/ Atmos. Chem. Phys., 4, 1461–1738, 2004
1716 R. Atkinson et al.: Evaluated kinetic and photochemical data for Ox, HOx, NOx and SOx
I.A4.144
CH3SS + NO2 → products
Rate coefficient data
k/cm3 molecule−1 s−1 Temp./K Reference Technique/Comments
Absolute Rate Coefficients
(1.8± 0.3)×10−11 297 Domine et al., 1990 (a)
Comments
(a) Fast-flow discharge study. CH3SS radicals were produced as a by-product of CH3S radical production. CH3S radicalswere produced by the Cl + CH3SH reaction. CH3SS was observed to be formed in the CH3S source and thought to bedue to the CH3S + S2 reaction on walls. [CH3SS] was monitored by photoionization mass spectrometry in excess NO2.
Preferred Values
k = 1.8×10⁻¹¹ cm3 molecule−1 s−1 at 298 K.
Reliability
1log k = ±0.3 at 298 K.
Comments on Preferred Values
The study of Domine et al. (1990) has provided the only available value for the rate coefficient of this reaction. This valueis accepted but with substantial error limits until confirmatory studies are made.
References
Domine, F., Murrells, T. P. and Howard, C. J.: J. Phys. Chem., 94, 5839, 1990.
Atmos. Chem. Phys., 4, 1461–1738, 2004 www.atmos-chem-phys.org/acp/4/1461/
R. Atkinson et al.: Evaluated kinetic and photochemical data for Ox, HOx, NOx and SOx 1717
I.A4.145
CH3SSO + NO2 → products
Rate coefficient data
k/cm3 molecule−1 s−1 Temp./K Reference Technique/Comments
Absolute Rate Coefficients
(4.5± 1.2)×10−12 297 Domine et al., 1990 (a)
Comments
(a) Fast-flow discharge system with photoionization mass spectrometric detection of products. CH3SSO radicals were pro-duced by CH3SS + NO2 → CH3SSO + NO. Mass 47 peak was monitored in excess NO2 and the contributions fromCH3S and CH3SSO (from CH3SSO + hυ → CH3S+ + e− + SO) were separated by modeling using data from other masspeaks.
Preferred Values
k = 4.5×10⁻¹² cm3 molecule−1 s−1 at 298 K.
Reliability
1log k = ±0.3 at 298 K.
Comments on Preferred Values
The study of Domine et al. (1990) has provided the only available value for the rate coefficient of this reaction. This valueis accepted but with substantial error limits until confirmatory studies are made.
References
Domine, F., Murrells, T. P. and Howard, C. J.: J. Phys. Chem., 94, 5839, 1990.
www.atmos-chem-phys.org/acp/4/1461/ Atmos. Chem. Phys., 4, 1461–1738, 2004
1718 R. Atkinson et al.: Evaluated kinetic and photochemical data for Ox, HOx, NOx and SOx
I.A4.146
O3 + CH3SCH3 → products
Rate coefficient data
k/cm3 molecule−1 s−1 Temp./K Reference Technique/Comments
Absolute Rate Coefficients
<8.3×10⁻¹⁹ 296 Martinez and Herron, 1978 S-MS
Preferred Values
k < 1×10⁻¹⁸ cm3 molecule−1 s−1 at 298 K.
Comments on Preferred Values
The preferred upper limit to the rate coefficient is based upon the sole study of Martinez and Herron (1978).
References
Martinez, R. I. and Herron, J. T.: Int. J. Chem. Kinet., 10, 433, 1978.
Atmos. Chem. Phys., 4, 1461–1738, 2004 www.atmos-chem-phys.org/acp/4/1461/

R. Atkinson et al.: Evaluated kinetic and photochemical data for Ox, HOx, NOx and SOx 1719
I.A4.147
ClO + CH3SCH3 → products
Rate coefficient data
k/cm3 molecule−1 s−1 Temp./K Reference Technique/Comments
Absolute Rate Coefficients
(3.9± 0.5)×10−14 298 Barnes et al., 1989 DF-MS(9.5± 2.0)×10−15 298± 1 Barnes et al., 1991 DF-MS
Preferred Values
k = 9×10⁻¹⁵ cm3 molecule−1 s−1 at 298 K.
Reliability
1log k = ±0.5 at 298 K.
Comments on Preferred Values
The two available measurements (Barnes et al., 1989; 1991) of this rate coefficient are from the same laboratory usingbasically the same technique. In the earlier study (Barnes et al., 1989), wall effects were evident and it was recognized that therate coefficientk obtained was likely to be an upper limit. Better control of wall effects was obtained in the later study (Barneset al., 1991), and the rate coefficient obtained was preferred (Barnes et al., 1991). The reaction is usually assumed to produceCH2S(O)CH3 + Cl but, although the sulfoxide has been detected (Barnes et al., 1989), no yields have been measured.
In view of the potential for heterogeneous wall reactions (as evident from the discrepancies between the two studies ofBarnes et al., 1989; 1991) the preferred value is based on the rate coefficient reported in the most recent study of Barnes etal. (1991) but with substantial uncertainty limits. Clearly, further studies of this reaction as a function of temperature andpressure are required.
References
Barnes, I., Becker, K. H., Martin, D., Carlier, P., Mouvier, G., Jourdain, J. L., Laverdet, G. and Le Bras, G.: “Biogenic Sulfurin the Environment, edited by Saltzman, E. S. and Cooper, W. J.: ACS Symposium Series, No. 393, p. 464, 1989.Barnes, I., Bastian, V., Becker, K. H. and Overath, R. D.: Int. J. Chem. Kinet., 23, 579, 1991.
www.atmos-chem-phys.org/acp/4/1461/ Atmos. Chem. Phys., 4, 1461–1738, 2004
1720 R. Atkinson et al.: Evaluated kinetic and photochemical data for Ox, HOx, NOx and SOx
I.A4.148
BrO + CH 3SCH3 → Br + CH 3S(O)CH3
Rate coefficient data
k/cm3 molecule−1 s−1 Temp./K Reference Technique/Comments
Absolute Rate Coefficients
(2.65± 0.65)×10−13 298 Barnes et al., 1989 DF-MS(2.7± 0.5)×10−13 298± 1 Barnes et al., 1991 DF-MS1.5×10−14 exp[(845± 175)/T ] 246–320 Bedjanian et al., 1996 DF-MS (a)(2.7± 0.2)×10−13 297(4.40± 0.66)×10−13 295± 2 Ingham et al., 1999 PLP-A (b)
Comments
(a) CH3S(O)CH3 was observed as a reaction product, with a measured formation yield at 320 K and 1.3 mbar (1 Torr) totalpressure of 0.94± 0.11.
(b) BrO radicals were generated by the reaction of O(3P) atoms (formed from 248 nm photolysis of O3) with Br2, and detectedby absorption at 338.3 nm. Experiments were carried out at 80, 133 and 267 mbar total pressure, with measured ratecoefficients of (4.40± 0.60) x 10−13, (4.40± 0.66)×10−13 and (4.36± 0.65) x 10−13 cm3 molecule−1 s−1, respectively.Formation of CH3S(O)CH3 was observed, with a formation yield of 1.17± 0.34.
Preferred Values
k = 4.4×10⁻¹³ cm3 molecule−1 s−1 at 298 K.
Reliability
1log k = ±0.3 at 298 K.
Comments on Preferred Values
The most recent measurement of the rate coefficient by Ingham et al. (1999) was carried out total pressures of 80–267mbar, compared to the earlier measurements of Barnes et al. (1989; 1991) and Bedjanian et al. (1996), which were carriedout at 0.5–6.8 mbar pressure. The higher rate coefficient of Ingham et al. (1999) may then reflect a pressure dependenceof the rate coefficient at pressures below∼80 mbar. The preferred value of the rate coefficient at 298 K is taken from themore atmospherically relevant study of Ingham et al. (1999). The uncertainty is sufficient to encompass the reported roomtemperature rate coefficients of Barnes et al. (1989; 1991), Bedjanian et al. (1996) and Ingham et al. (1999). Until furtherconfirmation of the room temperature rate coefficient is obtained, no temperature dependence is recommended.
The reaction produces CH3S(O)CH3 + Br as the dominant, if not only, products under the experimental conditions employed(Bedjanian et al., 1996; Ingham et al., 1999). The reaction is postulated (Bedjanian et al., 1996; Ingham et al., 1999) to proceedby:
BrO + CH3SCH3 ↔ [CH3S(OBr)CH3]∗
→ CH3S(O)CH3 + Br
References
Barnes, I., Becker, K. H., Martin, D., Carlier, P., Mouvier, G., Jourdain, J. L., Laverdet, G. and Le Bras, G.: Biogenic Sulfur inthe Environment, Saltzman, E. S. and Cooper, W. J.: ACS Symposium Series, No. 393, p. 464, 1989.Barnes, I., Bastian, V., Becker, K. H. and Overath, R. D.: Int. J. Chem. Kinet., 23, 579, 1991.Bedjanian, Y., Poulet, G. and Le Bras, G.: Int. J. Chem. Kinet., 28, 383, 1996.Ingham, T., Bauer, D., Sander, R., Crutzen, P. J. and Crowley, J. N.: J. Phys. Chem. A, 103, 7199, 1999.
Atmos. Chem. Phys., 4, 1461–1738, 2004 www.atmos-chem-phys.org/acp/4/1461/
R. Atkinson et al.: Evaluated kinetic and photochemical data for Ox, HOx, NOx and SOx 1721
I.A4.149
IO + CH 3SCH3 → I + CH 3S(O)CH3
Rate coefficient data
k/cm3 molecule−1 s−1 Temp./K Reference Technique/Comments
Absolute Rate Coefficients
(3.0± 1.5)×10−11 296± 2 Barnes et al., 1987 (a)(1.5± 0.5)×10−11 298 Martin et al., 1987 DF-MS≤3.5×10⁻¹⁴ 298± 2 Daykin and Wine, 1990 PLP-A (b)(1.5± 0.2)×10−14 298 Maguin et al., 1991 DF-MS(8.8± 2.1)×10−15 298± 1 Barnes et al., 1991 DF-MS(1.6± 0.1)×10−14 298 Knight and Crowley, 2001 DF-MS
Comments
(a) Photolysis of NO2-I2-CH3SCH3-N2 mixtures. Photolytic production of O(3P) atoms from NO2 formed IO radicals via thereaction O(3P) + I2 → IO + I. The concentrations of NO, NO2, CH3SCH3, and CH3SOCH3 were followed as a functionof time by FTIR absorption spectroscopy. A computer fit of the measured product yields to a 16-step reaction mechanismyielded the cited rate coefficient.
(b) IO radicals were monitored by long-pathlength absorption at 427 nm.
Preferred Values
k = 1.3×10⁻¹⁴ cm3 molecule−1 s−1 at 298 K.
Reliability
1log k = ±0.2 at 298 K.
Comments on Preferred Values
In the earlier studies of this reaction by Barnes et al. (1987) and Martin et al. (1987), erroneously high values were obtainedwhich are now believed to have been due to features of the secondary chemistry and heterogeneous processes occurring underthe conditions used. The three most recent studies (Maguin et al., 1991; Barnes et al., 1991; Knight and Crowley, 2001), usingbasically the same technique, give much lower values but differ from each other by almost a factor of two. Support for theselower values comes from the laser photolysis study by Daykin and Wine (1990), where an upper limit to the rate coefficientwas obtained which is some three orders of magnitude lower than those derived in the earlier studies of Barnes et al. (1987)and Martin et al. (1987). In the most recent study of Knight and Crowley (2001), the initial IO radical concentrations wereabout an order of magnitude lower than employed by Maguin et al. (1991) and Barnes et al. (1991), and corrections for theconcurrent self-reaction of IO radicals were not required in the data analysis (Knight and Crowley, 2001).
CH3S(O)CH3 has been detected in a number of studies (Barnes et al., 1987; 1991; Martin et al., 1987; Maguin et al., 1991;Knight and Crowley, 2001), and a semi-quantitative measurement of the yield by Barnes et al. (1991) gave a yield of 0.84± 0.40. The preferred value is the mean of the rate coefficients of Maguin et al. (1991), Barnes et al. (1991) and Knightand Crowley (2001), with the uncertainty being sufficient to encompass the rate coefficients measured in all three studies. Atemperature-dependent study of this reaction is needed.
References
Barnes, I., Becker, K. H., Carlier, P. and Mouvier, G.: Int. J. Chem. Kinet., 19, 489, 1987.Barnes, L., Bastian, V., Becker, K. H. and Overath, R. D.: Int. J. Chem. Kinet., 23, 579, 1991.
www.atmos-chem-phys.org/acp/4/1461/ Atmos. Chem. Phys., 4, 1461–1738, 2004

1722 R. Atkinson et al.: Evaluated kinetic and photochemical data for Ox, HOx, NOx and SOx
Daykin, E. P. and Wine, P. H.: J. Geophys. Res., 95, 18 547, 1990.Knight, G. P. and Crowley, J. N.: Phys. Chem. Chem. Phys., 3, 393, 2001.Maguin, F., Mellouki, A., Laverdet, G., Poulet, G. and Le Bras, G.: Int. J. Chem. Kinet., 23, 237, 1991.Martin, D., Jourdain, J. L., Laverdet, G. and Le Bras, G.: Int. J. Chem. Kinet., 19, 503, 1987.
Atmos. Chem. Phys., 4, 1461–1738, 2004 www.atmos-chem-phys.org/acp/4/1461/
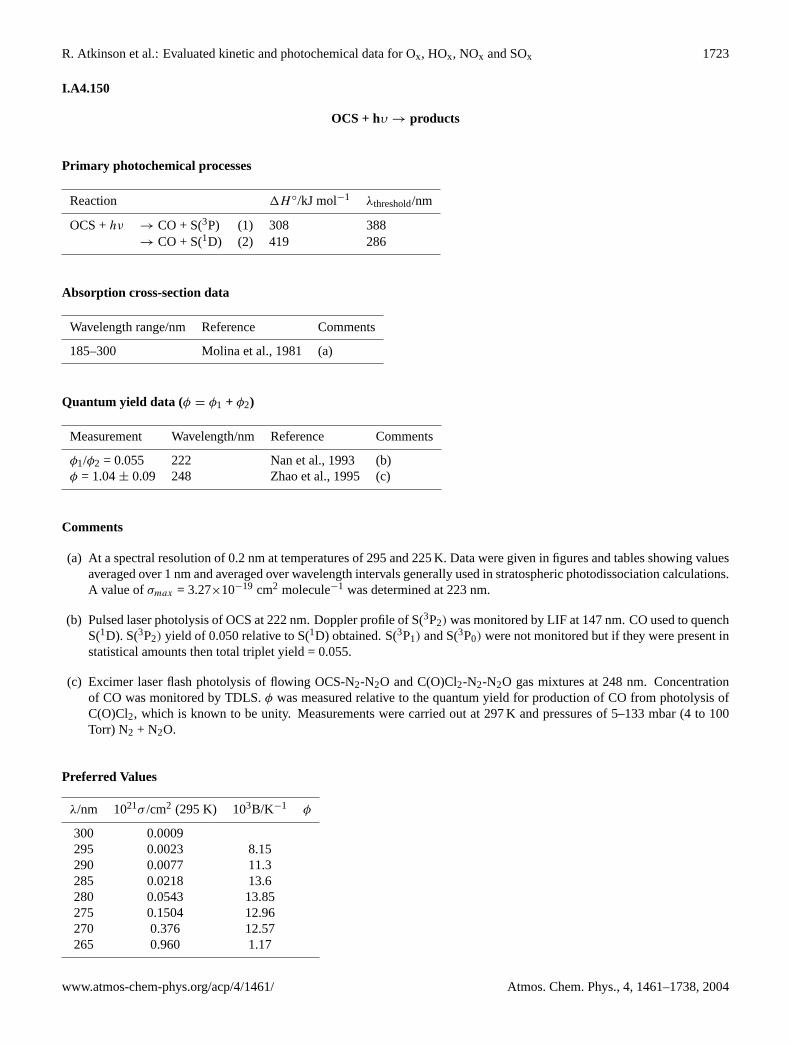
R. Atkinson et al.: Evaluated kinetic and photochemical data for Ox, HOx, NOx and SOx 1723
I.A4.150
OCS + hυ → products
Primary photochemical processes
Reaction 1H ◦/kJ mol−1 λthreshold/nm
OCS +hν → CO + S(3P) (1) 308 388→ CO + S(1D) (2) 419 286
Absorption cross-section data
Wavelength range/nm Reference Comments
185–300 Molina et al., 1981 (a)
Quantum yield data (φ = φ1 + φ2)
Measurement Wavelength/nm Reference Comments
φ1/φ2 = 0.055 222 Nan et al., 1993 (b)φ = 1.04± 0.09 248 Zhao et al., 1995 (c)
Comments
(a) At a spectral resolution of 0.2 nm at temperatures of 295 and 225 K. Data were given in figures and tables showing valuesaveraged over 1 nm and averaged over wavelength intervals generally used in stratospheric photodissociation calculations.A value ofσmax = 3.27×10⁻¹⁹ cm2 molecule−1 was determined at 223 nm.
(b) Pulsed laser photolysis of OCS at 222 nm. Doppler profile of S(3P2) was monitored by LIF at 147 nm. CO used to quenchS(1D). S(3P2) yield of 0.050 relative to S(1D) obtained. S(3P1) and S(3P0) were not monitored but if they were present instatistical amounts then total triplet yield = 0.055.
(c) Excimer laser flash photolysis of flowing OCS-N2-N2O and C(O)Cl2-N2-N2O gas mixtures at 248 nm. Concentrationof CO was monitored by TDLS.φ was measured relative to the quantum yield for production of CO from photolysis ofC(O)Cl2, which is known to be unity. Measurements were carried out at 297 K and pressures of 5–133 mbar (4 to 100Torr) N2 + N2O.
Preferred Values
λ/nm 1021σ /cm2 (295 K) 103B/K−1 φ
300 0.0009295 0.0023 8.15290 0.0077 11.3285 0.0218 13.6280 0.0543 13.85275 0.1504 12.96270 0.376 12.57265 0.960 1.17
www.atmos-chem-phys.org/acp/4/1461/ Atmos. Chem. Phys., 4, 1461–1738, 2004

1724 R. Atkinson et al.: Evaluated kinetic and photochemical data for Ox, HOx, NOx and SOx
λ/nm 1021σ /cm2 (295 K) 103B/K−1 φ
260 2.52 1.11 1.0255 6.64 9.31 1.0250 16.5 7.46 1.0245 38.2 6.00 1.0240 81.3 4.51 1.0235 153.6 3.09 1.0230 243.8 2.01 1.0225 310.4 1.32 1.0220 304.8 0.835 1.0215 241.6 0.323 1.0210 150.8 −0.0756205 82.0 −0.0868200 39.3 0195 20.2 0.950190 39.7 5.61185 190.3 4.83
Comments on Preferred Values
There is good agreement among all cross-section measurements forλ < 280 nm obtained since 1970 (Molina et al., 1981;Ferro and Reuben, 1971; Breckenridge and Taube, 1970; LeRoy et al., 1981; Rudolf and Inn, 1981; Locker et al., 1983; Wuet al., 1999). The data of Molina et al. (1981) is the only data set that extends beyond 280 nm, and provides the basis ofthe recommendation. The temperature dependence of the cross-sections of Molina et al. (1981) are described byσ(λ, T ) =σ(λ,295)exp[B(λ)(T -295)] whereT is in K and wavelength dependent values of B are taken from the Table above. This simpleparameterisation perfectly reproduces the data of Molina et al. (1981) at 225 K and accurately reproduces the temperaturedependence of the Wu et al. (1999) data at 170 to 370 K atλ > 230 nm.
The preferred overall quantum yield of 1.0 is based on results reported recently by Zhao et al. (1995). Results of all studiesindicate that S atoms are produced predominately in the S(1D) electronically excited state. Sidhu et al. (1966) reportedφ2/φ ≥
0.74 and Breckenridge and Taube (1970) reportedφ2/φ = 0.74± 0.04. Nan et al. (1993) reportedφ1/φ2 = 0.055 which, whencombined with the preferred value ofφ = φ1 + φ2 = 1.0, yieldsφ2/φ = 0.95.
References
Breckenridge, W. H. and Taube, H.: J. Chem. Phys., 53, 1750, 1970.Ferro, B. M. and Reuben, B. G.: Trans. Faraday Soc., 67, 2847, 1971.LeRoy, B., LeBras, G. and Rigaud, P.: Ann. Geophys., 37, 297, 1981.Locker, J. R., Burkholder, J. B., Bair, E. J. and Webster, H. A.: J. Phys. Chem., 87, 1864, 1983.Molina, L. T., Lamb, J. J. and Molina, M. J.: Geophys. Res. Lett., 8, 1008, 1981.Nan, G., Burak, I. and Houston, P. L.: Chem. Phys. Lett., 209, 383, 1993.Rudolf, R. N. and Inn, E. C. Y.: J. Geophys. Res., 86, 9891, 1981.Sidhu, K. S., Csizmadia, I. G., Strausz, O. P. and Gunning, H. E.: J. Am. Chem. Soc., 88, 2412, 1966.Wu, C. Y. R., Chen, F. Z. and Judge, D. L.: J. Quant. Spectrosc. Radiat. Trans., 61, 265, 1999.Zhao, Z., Stickel, R. E. and Wine, P. H.: Geophys. Res. Lett., 22, 615, 1995.
Atmos. Chem. Phys., 4, 1461–1738, 2004 www.atmos-chem-phys.org/acp/4/1461/

R. Atkinson et al.: Evaluated kinetic and photochemical data for Ox, HOx, NOx and SOx 1725
I.A4.151
CS2 + hυ → products
Primary photochemical processes
Reaction 1H ◦
298/kJ·mol−1 λthreshold/nm
CS2 + hν → CS∗
2 (1) >277→ CS + S(3P) (2) 432 281→ CS + S(1D) (3) 543 223
Absorption cross-section data
Wavelength range/nm Reference Comments
180–230 Chen and Wu, 1995 (a)187–230 Xu and Joens, 1993 (b)185–220 Molina et al., 1981 (c)188–213, 287.5-339.5 Ahmed and Kumar, 1992 (d)271–374 Hearn and Joens, 1991 (e)318–350 Wu and Judge, 1981 (f)280–360 Wine et al., 1981 (g)315–330 Leroy et al., 1983 (h)
Comments
(a) Spectral resolution 0.08 nm. Synchroton radiation was used as a continuum light source. Measurements were made at203, 295, and 385 K. Significant temperature effects and hot bands were observed. Results were presented in graphicalform in the paper but the authors can provide data points at 0.005 nm intervals on request.
(b) Spectral resolution of 0.2 nm. Deuterium lamp as continuum light source.
(c) As part of their study of the OCS spectrum. Spectral resolution of 0.2 nm. Results in graphical form.
(d) Spectral resolution of 0.2 nm. Ar-arc lamp as continuum light source.
(e) Spectral resolution 0.06 nm. Deuterium lamp as continuum light source. Results presented in graphical form in the paperbut the authors can provide data points at 0.02 nm intervals on request.
(f) Spectral resolution 0.06 nm. Synchroton radiation was used as a continuum light source.
(g) Spectral resolution 0.4 nm.
(h) Spectral resolution 0.2 nm.
www.atmos-chem-phys.org/acp/4/1461/ Atmos. Chem. Phys., 4, 1461–1738, 2004
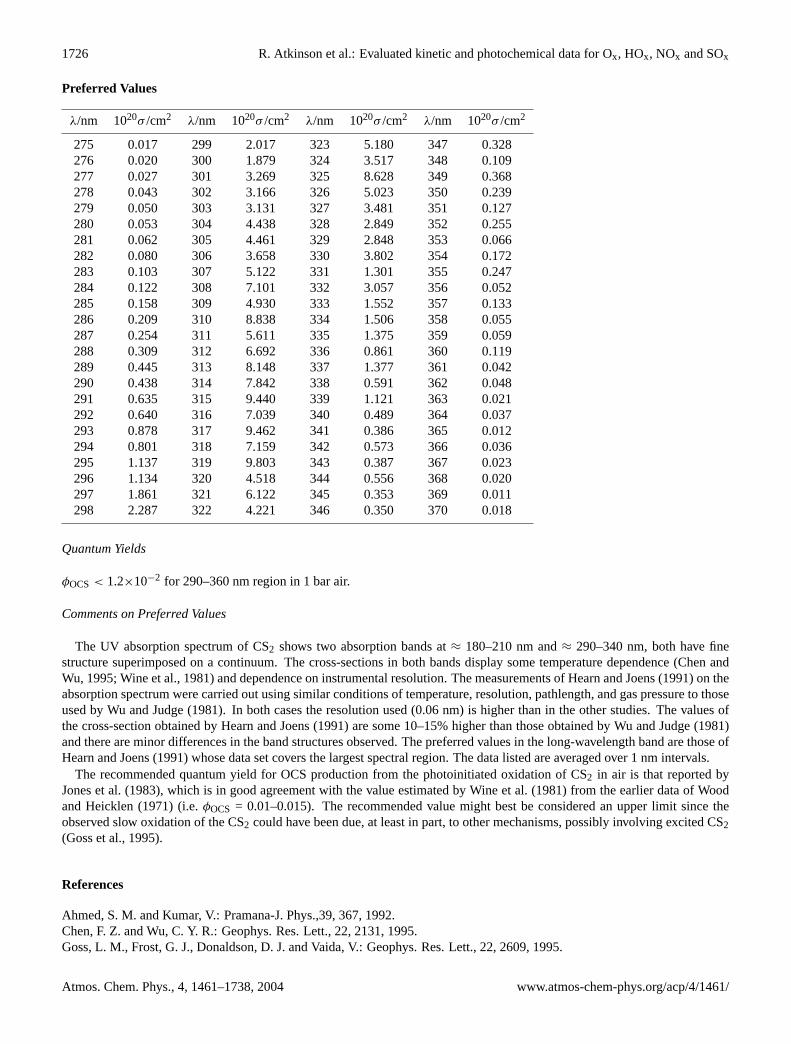
1726 R. Atkinson et al.: Evaluated kinetic and photochemical data for Ox, HOx, NOx and SOx
Preferred Values
λ/nm 1020σ /cm2 λ/nm 1020σ /cm2 λ/nm 1020σ /cm2 λ/nm 1020σ /cm2
275 0.017 299 2.017 323 5.180 347 0.328276 0.020 300 1.879 324 3.517 348 0.109277 0.027 301 3.269 325 8.628 349 0.368278 0.043 302 3.166 326 5.023 350 0.239279 0.050 303 3.131 327 3.481 351 0.127280 0.053 304 4.438 328 2.849 352 0.255281 0.062 305 4.461 329 2.848 353 0.066282 0.080 306 3.658 330 3.802 354 0.172283 0.103 307 5.122 331 1.301 355 0.247284 0.122 308 7.101 332 3.057 356 0.052285 0.158 309 4.930 333 1.552 357 0.133286 0.209 310 8.838 334 1.506 358 0.055287 0.254 311 5.611 335 1.375 359 0.059288 0.309 312 6.692 336 0.861 360 0.119289 0.445 313 8.148 337 1.377 361 0.042290 0.438 314 7.842 338 0.591 362 0.048291 0.635 315 9.440 339 1.121 363 0.021292 0.640 316 7.039 340 0.489 364 0.037293 0.878 317 9.462 341 0.386 365 0.012294 0.801 318 7.159 342 0.573 366 0.036295 1.137 319 9.803 343 0.387 367 0.023296 1.134 320 4.518 344 0.556 368 0.020297 1.861 321 6.122 345 0.353 369 0.011298 2.287 322 4.221 346 0.350 370 0.018
Quantum Yields
φOCS < 1.2×10⁻² for 290–360 nm region in 1 bar air.
Comments on Preferred Values
The UV absorption spectrum of CS2 shows two absorption bands at≈ 180–210 nm and≈ 290–340 nm, both have finestructure superimposed on a continuum. The cross-sections in both bands display some temperature dependence (Chen andWu, 1995; Wine et al., 1981) and dependence on instrumental resolution. The measurements of Hearn and Joens (1991) on theabsorption spectrum were carried out using similar conditions of temperature, resolution, pathlength, and gas pressure to thoseused by Wu and Judge (1981). In both cases the resolution used (0.06 nm) is higher than in the other studies. The values ofthe cross-section obtained by Hearn and Joens (1991) are some 10–15% higher than those obtained by Wu and Judge (1981)and there are minor differences in the band structures observed. The preferred values in the long-wavelength band are those ofHearn and Joens (1991) whose data set covers the largest spectral region. The data listed are averaged over 1 nm intervals.
The recommended quantum yield for OCS production from the photoinitiated oxidation of CS2 in air is that reported byJones et al. (1983), which is in good agreement with the value estimated by Wine et al. (1981) from the earlier data of Woodand Heicklen (1971) (i.e.φOCS = 0.01–0.015). The recommended value might best be considered an upper limit since theobserved slow oxidation of the CS2 could have been due, at least in part, to other mechanisms, possibly involving excited CS2(Goss et al., 1995).
References
Ahmed, S. M. and Kumar, V.: Pramana-J. Phys.,39, 367, 1992.Chen, F. Z. and Wu, C. Y. R.: Geophys. Res. Lett., 22, 2131, 1995.Goss, L. M., Frost, G. J., Donaldson, D. J. and Vaida, V.: Geophys. Res. Lett., 22, 2609, 1995.
Atmos. Chem. Phys., 4, 1461–1738, 2004 www.atmos-chem-phys.org/acp/4/1461/

R. Atkinson et al.: Evaluated kinetic and photochemical data for Ox, HOx, NOx and SOx 1727
Hearn, C. H. and Joens, J. A.: J. Quant. Spectrosc. Radiat. Trans., 45, 69, 1991.Jones, B. M. R., Cox, R. A. and Penkett, S. A.: J. Atmos. Chem., 1, 65, 1983.Leroy, B., Rigaud, P., Jourdain, J. L. and Le Bras, G.: Moon Planet, 29, 177, 1983.Molina, L. T., Lamb, J. J. and Molina, M. J.: Geophys. Res. Lett., 8, 1008, 1981.Wine, P. H., Chameides, W. L. and Ravishankara, A. R.: Geophys. Res. Lett., 8, 543, 1981.Wood, W. P. and Heicklen, J.: J. Phys. Chem., 75, 854, 1971.Wu, C. Y. R. and Judge, D. L.: Geophys. Res. Lett., 8, 769, 1981.Xu, H. and Joens, J. A.: Geophys. Res. Lett., 20, 1035, 1993.
www.atmos-chem-phys.org/acp/4/1461/ Atmos. Chem. Phys., 4, 1461–1738, 2004
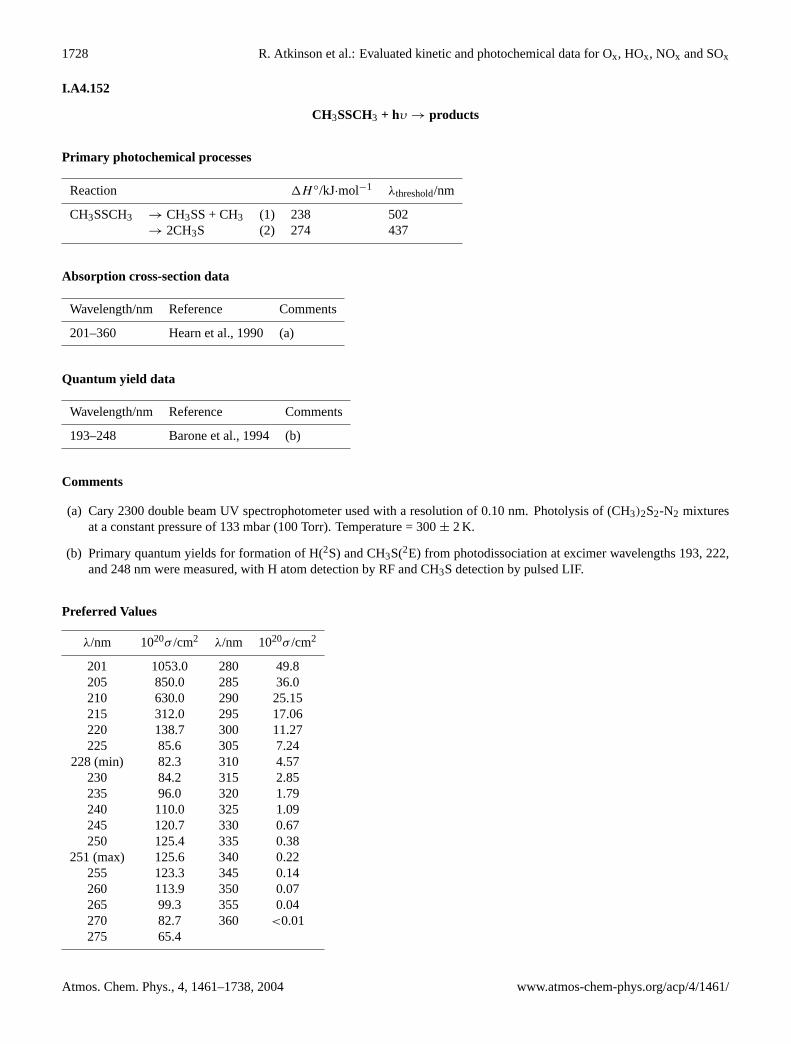
1728 R. Atkinson et al.: Evaluated kinetic and photochemical data for Ox, HOx, NOx and SOx
I.A4.152
CH3SSCH3 + hυ → products
Primary photochemical processes
Reaction 1H ◦/kJ·mol−1 λthreshold/nm
CH3SSCH3 → CH3SS + CH3 (1) 238 502→ 2CH3S (2) 274 437
Absorption cross-section data
Wavelength/nm Reference Comments
201–360 Hearn et al., 1990 (a)
Quantum yield data
Wavelength/nm Reference Comments
193–248 Barone et al., 1994 (b)
Comments
(a) Cary 2300 double beam UV spectrophotometer used with a resolution of 0.10 nm. Photolysis of (CH3)2S2-N2 mixturesat a constant pressure of 133 mbar (100 Torr). Temperature = 300± 2 K.
(b) Primary quantum yields for formation of H(2S) and CH3S(2E) from photodissociation at excimer wavelengths 193, 222,and 248 nm were measured, with H atom detection by RF and CH3S detection by pulsed LIF.
Preferred Values
λ/nm 1020σ /cm2 λ/nm 1020σ /cm2
201 1053.0 280 49.8205 850.0 285 36.0210 630.0 290 25.15215 312.0 295 17.06220 138.7 300 11.27225 85.6 305 7.24
228 (min) 82.3 310 4.57230 84.2 315 2.85235 96.0 320 1.79240 110.0 325 1.09245 120.7 330 0.67250 125.4 335 0.38
251 (max) 125.6 340 0.22255 123.3 345 0.14260 113.9 350 0.07265 99.3 355 0.04270 82.7 360 <0.01275 65.4
Atmos. Chem. Phys., 4, 1461–1738, 2004 www.atmos-chem-phys.org/acp/4/1461/
R. Atkinson et al.: Evaluated kinetic and photochemical data for Ox, HOx, NOx and SOx 1729
Comments on Preferred Values
The preferred values forσ are those of Hearn et al. (1990), which agree well with the earlier values cited in Calvert andPitts (1966). Sheraton and Murray’s spectrum (Sheraton and Murray, 1981) agrees qualitatively with the other studies, but thereported absorption coefficients are significantly lower.
Barone et al. (1994) report the primary quantum yield for CH3S production to be 1.65± 0.38 at 248 nm and 1.20± 0.14 at193 nm. These authors report that no H atoms were observed at 248 nm, and that at 193 and 222 nm H atom production wasonly a minor process and could be due to sample impurities. These results and those of Balla and Heicklen (1984) indicatethat at wavelengths of importance to atmospheric photochemistry dissociation occurs primarily by S-S bond scission to give2 CH3S. The significantly lower value ofφ(CH3S) at 193 nm implies the existence of an additional channel at these shortwavelengths.
References
Balla, R. J. and Heicklen, J.: Can. J. Chem., 62, 162, 1984.Barone, S. B., Turnipseed, A. A., Gierczak, T. and Ravishankara, A. R.: J. Phys. Chem., 98, 11 969, 1994.Calvert, J. G. and Pitts Jr., J. N.: Photochemistry, (Wiley), p. 490, 1966.Hearn, C. H., Turcu, E. and Joens, J. A.: Atmos. Environ. 24A, 1939, 1990.Sheraton, D. F. and Murray, F. E.: Can J. Chem., 59, 2750, 1981.
www.atmos-chem-phys.org/acp/4/1461/ Atmos. Chem. Phys., 4, 1461–1738, 2004

1730 R. Atkinson et al.: Evaluated kinetic and photochemical data for Ox, HOx, NOx and SOx
I.A4.153
CH3SNO + hυ → products
Primary photochemical processes
Reaction 1H ◦/kJ·mol−1 λthreshold/nm
CH3SNO → CH3S + NO (1)→ CH3 + SNO (2)
Absorption cross-section data
Wavelength/nm Reference Comments
190–430 Niki et al., 1983 (a)
Quantum yield data
No data available
Comments
(a) Cary 14 double beam spectrophotometer used; the spectral resolution was not reported. Measurements ofσ were madeover the range 190–600 nm, but only the results in the range 190–430 nm were given in graphical form. Values ofσ =2.4×10⁻²⁰ and 5.8×10⁻²⁰ cm2 molecule−1 were quoted for 510 and 545 nm, respectively. Values given in the table weretaken from the graph. Temperature = 298 K.
Preferred Values
λ/nm 1019σ /cm2 λ/nm 1019σ /cm2
190 5 310 14.9195 104 320 18.5
200 (max) 162 330 21.3205 91 335 (max) 21.6
210 (min) 81 340 21.5215 98 350 19.6
218 (max) 104 360 16.5220 96 370 12.7225 73 380 9.6230 40 390 6.7240 16 400 4.5250 3.5 410 2.9260 1.7 420 2.0
264 (min) 1.5 430 1.3270 1.8280 2.7 510 0.24290 5.2 545 0.58300 9.3
Atmos. Chem. Phys., 4, 1461–1738, 2004 www.atmos-chem-phys.org/acp/4/1461/

R. Atkinson et al.: Evaluated kinetic and photochemical data for Ox, HOx, NOx and SOx 1731
Comments on Preferred Values
The spectrum of CH3SNO consists of a weak transition in the 500–600 nm region showing some vibrational fine structureand stronger continuous bands at shorter wavelengths (McCoustra and Pfab, 1987). The CH3S-NO dissociation energy hasbeen estimated (Benson, 1978) to be approximately 110 kJ mol−1 but because more reliable data are not available we do notgive wavelength limits for the dissociation channels tabulated.
The only available data forσ values in the gas phase appear to be those of Niki et al. (1983) who have published their resultsmainly in the form of graphs covering the range 190–430 nm. Their published spectrum shows no fine structure but appearsto consist of overlapping continua with three maxima at approximately 200, 218 and 335 nm. The preferred values ofσ in therange 190–430 nm are taken from the graphs of Niki et al. (1983) and cannot be considered to be very precise. The two valuesat 510 and 545 nm are numerical values quoted in the same study (Niki et al., 1983).
There have been no quantum yield measurements. By analogy with CH3ONO photolysis the primary products are expectedto be CH3S and NO. This is supported by the work of McCoustra and Pfab (1987) who studied the photodissociation ofCH3SNO in a molecular beam and by the study of Niki et al. (1983) who found CH3SSCH3 and NO to be the only majorproducts from CH3SNO photolysis at 300–400 nm.
References
Benson, S. W.: Chem. Rev, 78, 23, 1978.McCoustra, M. R. S. and Pfab, J.: Chem. Phys. Lett. 137, 355, 1987.Niki, H., Maker, P. D., Savage, C. M. and Breitenbach, L. P.: J. Phys. Chem., 87, 7, 1983.
www.atmos-chem-phys.org/acp/4/1461/ Atmos. Chem. Phys., 4, 1461–1738, 2004

1732 R. Atkinson et al.: Evaluated kinetic and photochemical data for Ox, HOx, NOx and SOx
Appendix A5: Enthalpy Data
Most of the thermochemical data have been taken from evaluations or reviews. In some cases, we have selected more recentexperimental data, which appear to be reliable. The error limits are those given by the original author or reviewer.
Species 1f H◦
298/kJ mol−1 1f H◦
0/kJ mol−1 Reference
H 217.998± 0.006 216.03± 0.006 Cox et al., 1989H2 0 0 Cox et al., 1989O(3P) 249.18± 0.10 246.79± 0.10 Cox et al., 1989O(1D) 438.9 436.6 Domalski et al., 1978O2 0 0 Cox et al., 1989O2(
11) 94.3 94.3 Domalski et al., 1978O2(
16) 156.9 156.9 Domalski et al., 1978O3 142.7 145.4 Wagman et al., 1982HO 37.20± 0.38 36.91± 0.38 Ruscic et al., 2001HO2 14.6 Kerr and Stocker, 2000H2O −241.826± 0.04 −238.92± 0.04 Cox et al., 1989H2O2 −136.31 −130.04 Wagman et al., 1982N 472.68± 0.40 Cox et al., 1989N2 0 0 Cox et al., 1989NH 352± 10 Piper, 1979NH2 188.7± 1.3 Kerr and Stocker, 2000NH3 −45.94± 0.35 Cox et al., 1989NO 90.25 89.75 Wagman et al., 1982NO2 33.18 35.98 Wagman et al., 1982NO3 73.72± 1.4 78.95± 1.4 Davis et. al., 1993N2O 82.05 85.500 Wagman et al., 1982N2O4 9.1± 1.7 18.7± 1.7 Chase, 1998N2O5 11.3 Davis et al., 1993, Chase, 1998HNO 112.95± 0.25 110.02± 0.25 Dixon, 1996HNO2 −79.5 Wagman et al., 1982HNO3 −135.06 −125.27 Wagman et al., 1982HO2NO2 −52.7± 8 Sander and Peterson, 1984CH 596.4± 1.2 Kerr and Stocker, 2000CH2(
3B1) 390.4± 4 Kerr and Stocker, 2000CH2(
1A1) 428.3± 4 Kerr and Stocker, 2000CH3 146.4± 0.4 Kerr and Stocker, 2000CH4 −74.81 −66.818 Wagman et al., 1982CN 441.4± 4.6 Kerr and Stocker, 2000HCN 135± 8 Chase, 1998HCO 43.1 Becerra et al., 1997, Chuang et al., 1987CH2O −108.6 −104.7 Domalski et al., 1978CH3O 17.2± 3.8 Kerr and Stocker, 2000CH2OH −17.8± 1.3 −11.5± 1.3 Johnson and Hudgens, 1996CH3OH −201.6± 0.2 Cox and Pilcher, 1970CO −110.53± 0.17 Cox et al., 1989NCO 127.0 Kerr and Stocker, 2000HOCO −217 + 10 −205± 10 Kerr and Stocker, 2000, Fulle et al.,1997HCOOH −378.8± 0.5 −371.6 Cox and Pilcher, 1970CH2OOH 46 Tyndall et al., 2001CH3O2 9.0± 5.1 Kerr and Stocker, 2000CH3OOH −131 Chase, 1998HOCH2O2 −162.1± 2.1 Lightfoot et al., 1992
Atmos. Chem. Phys., 4, 1461–1738, 2004 www.atmos-chem-phys.org/acp/4/1461/
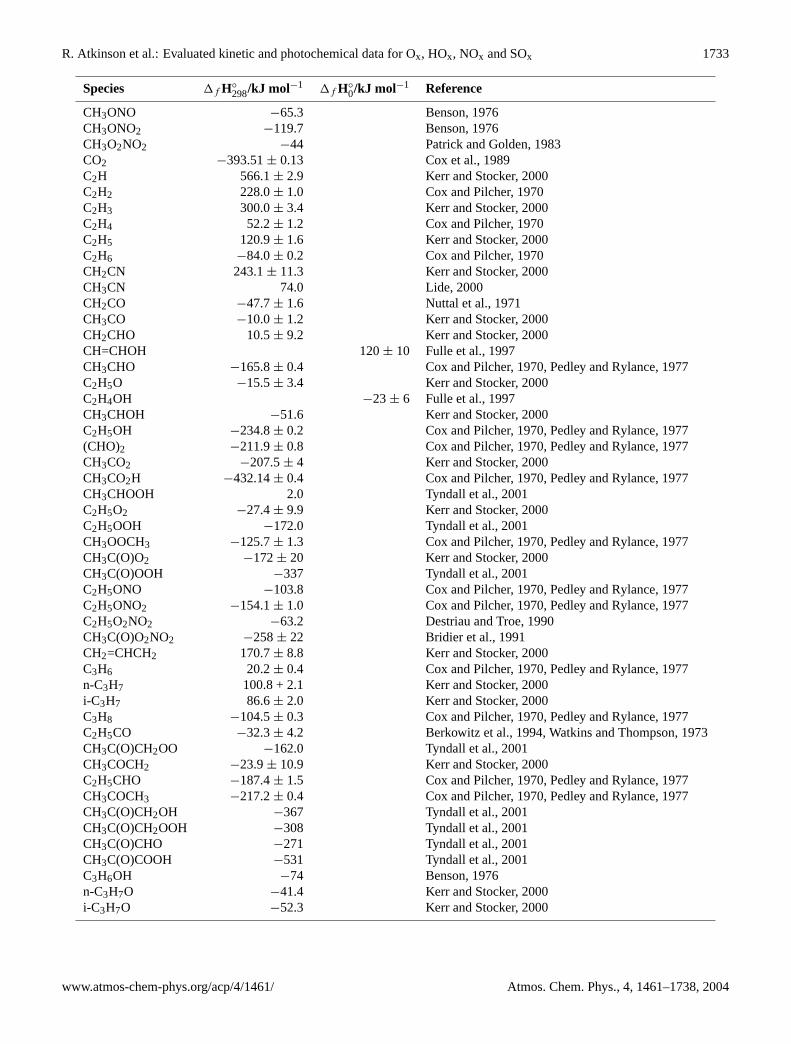
R. Atkinson et al.: Evaluated kinetic and photochemical data for Ox, HOx, NOx and SOx 1733
Species 1f H◦
298/kJ mol−1 1f H◦
0/kJ mol−1 Reference
CH3ONO −65.3 Benson, 1976CH3ONO2 −119.7 Benson, 1976CH3O2NO2 −44 Patrick and Golden, 1983CO2 −393.51± 0.13 Cox et al., 1989C2H 566.1± 2.9 Kerr and Stocker, 2000C2H2 228.0± 1.0 Cox and Pilcher, 1970C2H3 300.0± 3.4 Kerr and Stocker, 2000C2H4 52.2± 1.2 Cox and Pilcher, 1970C2H5 120.9± 1.6 Kerr and Stocker, 2000C2H6 −84.0± 0.2 Cox and Pilcher, 1970CH2CN 243.1± 11.3 Kerr and Stocker, 2000CH3CN 74.0 Lide, 2000CH2CO −47.7± 1.6 Nuttal et al., 1971CH3CO −10.0± 1.2 Kerr and Stocker, 2000CH2CHO 10.5± 9.2 Kerr and Stocker, 2000CH=CHOH 120± 10 Fulle et al., 1997CH3CHO −165.8± 0.4 Cox and Pilcher, 1970, Pedley and Rylance, 1977C2H5O −15.5± 3.4 Kerr and Stocker, 2000C2H4OH −23± 6 Fulle et al., 1997CH3CHOH −51.6 Kerr and Stocker, 2000C2H5OH −234.8± 0.2 Cox and Pilcher, 1970, Pedley and Rylance, 1977(CHO)2 −211.9± 0.8 Cox and Pilcher, 1970, Pedley and Rylance, 1977CH3CO2 −207.5± 4 Kerr and Stocker, 2000CH3CO2H −432.14± 0.4 Cox and Pilcher, 1970, Pedley and Rylance, 1977CH3CHOOH 2.0 Tyndall et al., 2001C2H5O2 −27.4± 9.9 Kerr and Stocker, 2000C2H5OOH −172.0 Tyndall et al., 2001CH3OOCH3 −125.7± 1.3 Cox and Pilcher, 1970, Pedley and Rylance, 1977CH3C(O)O2 −172± 20 Kerr and Stocker, 2000CH3C(O)OOH −337 Tyndall et al., 2001C2H5ONO −103.8 Cox and Pilcher, 1970, Pedley and Rylance, 1977C2H5ONO2 −154.1± 1.0 Cox and Pilcher, 1970, Pedley and Rylance, 1977C2H5O2NO2 −63.2 Destriau and Troe, 1990CH3C(O)O2NO2 −258± 22 Bridier et al., 1991CH2=CHCH2 170.7± 8.8 Kerr and Stocker, 2000C3H6 20.2± 0.4 Cox and Pilcher, 1970, Pedley and Rylance, 1977n-C3H7 100.8 + 2.1 Kerr and Stocker, 2000i-C3H7 86.6± 2.0 Kerr and Stocker, 2000C3H8 −104.5± 0.3 Cox and Pilcher, 1970, Pedley and Rylance, 1977C2H5CO −32.3± 4.2 Berkowitz et al., 1994, Watkins and Thompson, 1973CH3C(O)CH2OO −162.0 Tyndall et al., 2001CH3COCH2 −23.9± 10.9 Kerr and Stocker, 2000C2H5CHO −187.4± 1.5 Cox and Pilcher, 1970, Pedley and Rylance, 1977CH3COCH3 −217.2± 0.4 Cox and Pilcher, 1970, Pedley and Rylance, 1977CH3C(O)CH2OH −367 Tyndall et al., 2001CH3C(O)CH2OOH −308 Tyndall et al., 2001CH3C(O)CHO −271 Tyndall et al., 2001CH3C(O)COOH −531 Tyndall et al., 2001C3H6OH −74 Benson, 1976n-C3H7O −41.4 Kerr and Stocker, 2000i-C3H7O −52.3 Kerr and Stocker, 2000
www.atmos-chem-phys.org/acp/4/1461/ Atmos. Chem. Phys., 4, 1461–1738, 2004

1734 R. Atkinson et al.: Evaluated kinetic and photochemical data for Ox, HOx, NOx and SOx
Species 1f H◦
298/kJ mol−1 1f H◦
0/kJ mol−1 Reference
i-C3H7OH −272.5± 0.4 Cox and Pilcher, 1970, Pedley and Rylance, 1977CH3COCHO −271.1± 4.7 Cox and Pilcher, 1970, Pedley and Rylance, 1977C3H5O2 87.9± 5.5 Kerr and Stocker, 2000i-C3H7O2 −68.8± 11.3 Kerr and Stocker, 2000n-C3H7ONO2 −174.1± 1.3 Cox and Pilcher, 1970, Pedley and Rylance, 1977i-C3H7ONO2 −190.8± 1.7 Cox and Pilcher, 1970, Pedley and Rylance, 1977n-C4H9 80.9± 2.2 Kerr and Stocker, 2000s-C4H9 66.7± 2.1 Kerr and Stocker, 2000n-C4H10 −125.7± 0.4 Cox and Pilcher, 1970n-C3H7CHO −211.8± 0.9 Wiberg et al., 1991CH3COC2H5 −238.5± 0.5 Cox and Pilcher, 1970n-C4H9O −62.8 Kerr and Stocker, 2000s-C4H9O −69.5± 3.3 Kerr and Stocker, 2000S 277.17± 0.15 Cox et al., 1989HS 143.01± 2.85 142.55± 3.01 Nicovich et al., 1992H2S −20.6± 0.5 Cox et al., 1989HSO −4 Kerr and Stocker, 2000SO 5.0± 1.3 5.0± 1.3 Chase, 1998HSO2 −222 Kerr and Stocker, 2000SO2 −296.81± 0.20 Cox et al., 1989HOSO2 −385 Kerr and Stocker, 2000SO3 −395.72 −389.99 Wagman et al., 1982HSNO 94 Black et al., 1984CH3S 124.60± 1.84 Nicovich et al., 1992CH3SH −22.9± 0.6 Pedley et al., 1986CH3SCH2 136.8± 5.9 Kerr and Stocker, 2000CH3SCH3 −37.24 −21.058 Wagman et al., 1982CS 278.5± 3.8 Kerr and Stocker, 2000CH3SO −67± 10 see note ’a’ (end of refs)CH3SOO 75.7± 4.2 87.9± 4.6 Turnipseed et al., 1992OCS −142.09 −142.218 Wagman et al., 1982S2 128.60 Cox et al., 1989CH3SS 68.6± 8 Kerr and Stocker, 2000CH3SSCH3 −24.3 Benson, 1978CS2 117.36 116.57 Wagman et al., 1982HOCS2 110.5± 4.6 Murrells et al., 1990F 79.38± 0.30 Cox et al., 1989HF −273.30± 0.70 Cox et al., 1989HOF −98.3± 4.2 −95.4± 4.2 Chase, 1998FO 109± 10 108± 10 Chase, 1998FO2 25.4± 2 27.2± 2 Chase, 1998FONO 67 see note ’b’ (end of refs)FNO2 −108.8 Patrick and Golden, 1983FONO2 10 18 Chase, 1998CH2F −31.8± 8.4 Kerr and Stocker, 2000CH3F −232.6 Kolesov, 1978CH3CH2F −263± 2 Lias et al., 1988HCOF −392.5± 6.3 Zhao and Francisco, 1990FCO −152.1± 12 −172±63 Kerr and Stocker, 2000F2 0 0 Cox et al., 1989CHF2 −238.9± 4 Kerr and Stocker, 2000CH2F2 −453± 8 Lias et al., 1988
Atmos. Chem. Phys., 4, 1461–1738, 2004 www.atmos-chem-phys.org/acp/4/1461/

R. Atkinson et al.: Evaluated kinetic and photochemical data for Ox, HOx, NOx and SOx 1735
Species 1f H◦
298/kJ mol−1 1f H◦
0/kJ mol−1 Reference
CH3CHF2 −501± 6 Lias et al., 1988CF2 −184.1± 8.4 Kerr and Stocker, 2000COF2 −634.7 −631.57 Wagman et al., 1982CHF3 −697.6 Lias et al., 1988CF3 −466.1± 3.8 Kerr and Stocker, 2000CH2CF3 −517.1± 5.0 Kerr and Stocker, 2000CH3CF3 −748.7± 3.2 Kolesov and Papino 1983CH2FCHF2 −691± 10 Kolesov and Papino 1983CF3O −655.6± 6.3 Batt and Walsh, 1982CF3OH −923.4± 13.4 Chyall and Squires, 1996CF3OF −785 Lias et al., 1988CF3O2 −614.0± 15.4 Lightfoot et al., 1992CF3CO2H −1031 Pedley et al., 1986CF3O2NO2 −686 Destriau and Troe, 1990CF4 −933 −927 Rodgers et al., 1974Cl 121.301± 0.008 Cox et al., 1989HCl −92.31± 0.10 Cox et al., 1989HOCl −78 −75 Domaski et al., 1978, Molina and Molina, 1978ClO 101.63± 0.1 Chase, 1998ClOO 97.457 99.128 Baer et al., 1991OClO 94.6± 1.3 Nickolaisen et al., 1994sym-ClO3 217.2± 21 Colussi et al., 1992ClNO 51.7 53.6 Chase, 1998ClNO2 12.5 17.95 Wagman et al., 1982ClONO 56 Patrick and Golden, 1983ClONO2 22.9± 2.2 Anderson and Fahey, 1990CH2Cl 117.3± 3.1 Kerr and Stocker, 2000CH2ClO2 −5.1± 13.6 Kerr and Stocker, 2000CH3Cl −81.96± 0.67 −74.04± 0.67 Rodgers et al., 1974CH3OCl −64.4± 6.2 Jung et al., 2000CHF2Cl −483.7± 5.9 Chen et al., 1976CH3CHFCl −313.4± 2.6 Kolesov and Papino, 1983CH3CF2Cl −536.2± 5.2 Kolesov and Papino, 1983ClCO −21.8± 2.5 −23.4± 2.9 Nicovich et al., 1990COFCl −427 −423 Chase, 1998CFCl 31.0± 13.4 Kerr and Stocker, 2000CF2Cl −279.1± 8.3 Kerr and Stocker, 2000CF2ClO2 −406.5± 14.6 Lightfoot et al., 1992CF2ClO2NO2 −480 Koppenkastrop and Zabel, 1991CF3Cl −707.9± 3.8 −702.8± 3.8 Chen et al., 1976Cl2 0 0 Cox et al., 1989Cl2O 77.2± 3.4 Thorn et al., 1996Cl2O2 127.6± 2.9 Nickolaisen et al., 1994Cl2O3 153 Burkholder et al., 1993CCl2 230.1± 8.4 Kerr and Stocker, 2000CHCl2 89.0± 3.0 Kerr and Stocker, 2000CHCl2O2 −19.2± 11.2 Kerr and Stocker, 2000CH2Cl2 −95.4± 0.8 −88.5± 0.8 Rodgers et al., 1974CHFCl2 −284.9± 8.8 Chen et al., 1976COCl2 −220.1 −218.4 Chase, 1998CFCl2 −89.1± 10.0 Kerr and Stocker, 2000CFCl2O2 −213.7 Kerr and Stocker, 2000
www.atmos-chem-phys.org/acp/4/1461/ Atmos. Chem. Phys., 4, 1461–1738, 2004

1736 R. Atkinson et al.: Evaluated kinetic and photochemical data for Ox, HOx, NOx and SOx
Species 1f H◦
298/kJ mol−1 1f H◦
0/kJ mol−1 Reference
CFCl2O2NO2 −287.4 Koppenkastrop and Zabel, 1991CF2Cl2 −493.3± 2.5 −489.1± 2.5 Chen et al., 1976CH2ClCF2Cl −543± 10 Lias et al., 1988CF3CHCl2 −740± 10 Lias et al., 1988CF2ClCHFCl −724± 10 Lias et al., 1988CF2ClCF2Cl −925.5± 4.3 Kolesov and Papino, 1983CCl3 71.1± 2.5 69.9± 2.5 Hudgens et al., 1991CCl3O2 −20.9± 8.9 Kerr and Stocker, 2000CCl3O2NO2 −83.7 Koppenkastrop and Zabel, 1991CHCl3 −103.3± 1.3 Chase, 1998C2HCl3 −7.78 −4.318 Wagman et al., 1982CH3CCl3 −144.6± 0.8 Kolesov and Papino, 1983CFCl3 −284.9± 1.7 −281.1 Chen et al., 1976CF2ClCFCl2 −726.8± 2.8 Kolesov and Papino, 1983CCl4 −95.8± 0.6 −93.6± 0.6 Rodgers et al., 1974C2Cl4 −12.4 −11.9 Chase, 1998C2Cl5 33.5± 5.4 33.9± 6.3 Nicovich et al., 1996Br 111.87± 0.12 Cox et al., 1989HBr −36.29± 0.16 Cox et al., 1989HOBr ≥ −56 Ruscic and Berkowitz, 1994BrO 119.7± 5.9 Bedjanian et al., 1997OBrO 163.9± 4.4 172.9± 4.4 Klemm et al., 2001BrOO 108± 40 116± 40 Chase, 1998BrNO 82.17 91.46 Wagman et al., 1982BrONO2 42.3± 8 Orlando and Tyndall, 1996CH2Br 169.0± 4.2 Kerr and Stocker, 2000CH3Br −38.1± 1.3 Cox and Pilcher, 1970CH2ClBr −20± 7 Skorobogatov et al., 1996CF3Br −650 Lias et al., 1988CF2ClBr −438± 8 Lias et al., 1988BrCl 14.6± 1.3 22.1± 1.3 Chase, 1998Br2(g) 30.91 Cox et al., 1989Br2O 107.1± 3.5 Thorn et al., 1996Br2O2 181± 12 Harwood et al., 1998CHBr2 188.3± 9.2 Kerr and Stocker, 2000CH2Br2 −11.1± 5.0 Bickerton et al., 1984CF2Br2 −379± 8 Lias et al., 1988CF2BrCF2Br −789.9 Kolesov and Papino, 1983CHBr3 23.8± 4.5 Bickerton et al., 1984I 106.76± 0.04 Cox et al., 1989HI 26.50 Cox et al., 1989HOI −69.6± 5.4 −64.9 Berry et al., 1998, Misra and Marshall, 1998IO 115.9± 5.0 Bedjanian et al., 1997OIO 76.7± 15 Mistra and Marshall, 1998INO 121.3± 4.2 124.3± 4.2 van den Bergh and Troe, 1976, Hippler et al., 1977INO2 60.2± 4.2 66.5± 4.2 van den Bergh and Troe, 1976, Hippler et al., 1977IONO2 70± 16 Allan and Plane, 2002CH2I 230.1± 6.7 Kerr and Stocker, 2000CH3I 14.2± 0.9 Cox and Pilcher, 1970CF3I −589.1± 3.3 Chase, 1998CH2ClI ∼7.1 Kolesov, 1978
Atmos. Chem. Phys., 4, 1461–1738, 2004 www.atmos-chem-phys.org/acp/4/1461/
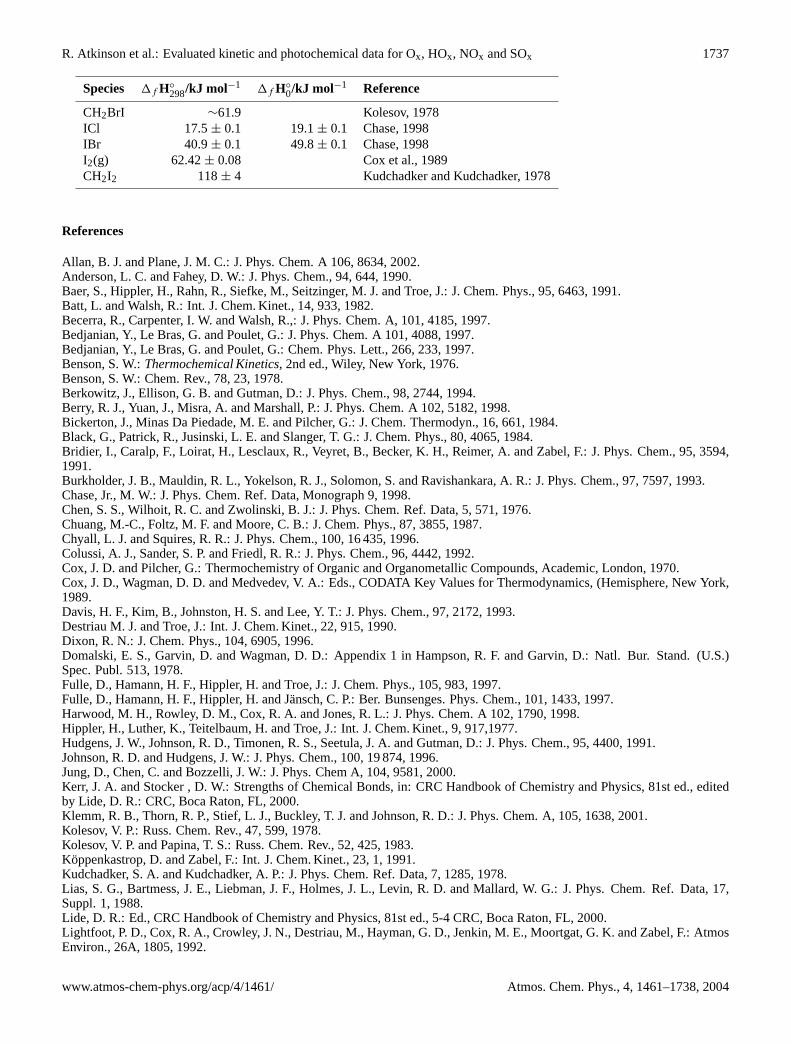
R. Atkinson et al.: Evaluated kinetic and photochemical data for Ox, HOx, NOx and SOx 1737
Species 1f H◦
298/kJ mol−1 1f H◦
0/kJ mol−1 Reference
CH2BrI ∼61.9 Kolesov, 1978ICl 17.5± 0.1 19.1± 0.1 Chase, 1998IBr 40.9± 0.1 49.8± 0.1 Chase, 1998I2(g) 62.42± 0.08 Cox et al., 1989CH2I2 118± 4 Kudchadker and Kudchadker, 1978
References
Allan, B. J. and Plane, J. M. C.: J. Phys. Chem. A 106, 8634, 2002.Anderson, L. C. and Fahey, D. W.: J. Phys. Chem., 94, 644, 1990.Baer, S., Hippler, H., Rahn, R., Siefke, M., Seitzinger, M. J. and Troe, J.: J. Chem. Phys., 95, 6463, 1991.Batt, L. and Walsh, R.: Int. J. Chem. Kinet., 14, 933, 1982.Becerra, R., Carpenter, I. W. and Walsh, R.,: J. Phys. Chem. A, 101, 4185, 1997.Bedjanian, Y., Le Bras, G. and Poulet, G.: J. Phys. Chem. A 101, 4088, 1997.Bedjanian, Y., Le Bras, G. and Poulet, G.: Chem. Phys. Lett., 266, 233, 1997.Benson, S. W.:Thermochemical Kinetics, 2nd ed., Wiley, New York, 1976.Benson, S. W.: Chem. Rev., 78, 23, 1978.Berkowitz, J., Ellison, G. B. and Gutman, D.: J. Phys. Chem., 98, 2744, 1994.Berry, R. J., Yuan, J., Misra, A. and Marshall, P.: J. Phys. Chem. A 102, 5182, 1998.Bickerton, J., Minas Da Piedade, M. E. and Pilcher, G.: J. Chem. Thermodyn., 16, 661, 1984.Black, G., Patrick, R., Jusinski, L. E. and Slanger, T. G.: J. Chem. Phys., 80, 4065, 1984.Bridier, I., Caralp, F., Loirat, H., Lesclaux, R., Veyret, B., Becker, K. H., Reimer, A. and Zabel, F.: J. Phys. Chem., 95, 3594,1991.Burkholder, J. B., Mauldin, R. L., Yokelson, R. J., Solomon, S. and Ravishankara, A. R.: J. Phys. Chem., 97, 7597, 1993.Chase, Jr., M. W.: J. Phys. Chem. Ref. Data, Monograph 9, 1998.Chen, S. S., Wilhoit, R. C. and Zwolinski, B. J.: J. Phys. Chem. Ref. Data, 5, 571, 1976.Chuang, M.-C., Foltz, M. F. and Moore, C. B.: J. Chem. Phys., 87, 3855, 1987.Chyall, L. J. and Squires, R. R.: J. Phys. Chem., 100, 16 435, 1996.Colussi, A. J., Sander, S. P. and Friedl, R. R.: J. Phys. Chem., 96, 4442, 1992.Cox, J. D. and Pilcher, G.: Thermochemistry of Organic and Organometallic Compounds, Academic, London, 1970.Cox, J. D., Wagman, D. D. and Medvedev, V. A.: Eds., CODATA Key Values for Thermodynamics, (Hemisphere, New York,1989.Davis, H. F., Kim, B., Johnston, H. S. and Lee, Y. T.: J. Phys. Chem., 97, 2172, 1993.Destriau M. J. and Troe, J.: Int. J. Chem. Kinet., 22, 915, 1990.Dixon, R. N.: J. Chem. Phys., 104, 6905, 1996.Domalski, E. S., Garvin, D. and Wagman, D. D.: Appendix 1 in Hampson, R. F. and Garvin, D.: Natl. Bur. Stand. (U.S.)Spec. Publ. 513, 1978.Fulle, D., Hamann, H. F., Hippler, H. and Troe, J.: J. Chem. Phys., 105, 983, 1997.Fulle, D., Hamann, H. F., Hippler, H. and Jansch, C. P.: Ber. Bunsenges. Phys. Chem., 101, 1433, 1997.Harwood, M. H., Rowley, D. M., Cox, R. A. and Jones, R. L.: J. Phys. Chem. A 102, 1790, 1998.Hippler, H., Luther, K., Teitelbaum, H. and Troe, J.: Int. J. Chem. Kinet., 9, 917,1977.Hudgens, J. W., Johnson, R. D., Timonen, R. S., Seetula, J. A. and Gutman, D.: J. Phys. Chem., 95, 4400, 1991.Johnson, R. D. and Hudgens, J. W.: J. Phys. Chem., 100, 19 874, 1996.Jung, D., Chen, C. and Bozzelli, J. W.: J. Phys. Chem A, 104, 9581, 2000.Kerr, J. A. and Stocker , D. W.: Strengths of Chemical Bonds, in: CRC Handbook of Chemistry and Physics, 81st ed., editedby Lide, D. R.: CRC, Boca Raton, FL, 2000.Klemm, R. B., Thorn, R. P., Stief, L. J., Buckley, T. J. and Johnson, R. D.: J. Phys. Chem. A, 105, 1638, 2001.Kolesov, V. P.: Russ. Chem. Rev., 47, 599, 1978.Kolesov, V. P. and Papina, T. S.: Russ. Chem. Rev., 52, 425, 1983.Koppenkastrop, D. and Zabel, F.: Int. J. Chem. Kinet., 23, 1, 1991.Kudchadker, S. A. and Kudchadker, A. P.: J. Phys. Chem. Ref. Data, 7, 1285, 1978.Lias, S. G., Bartmess, J. E., Liebman, J. F., Holmes, J. L., Levin, R. D. and Mallard, W. G.: J. Phys. Chem. Ref. Data, 17,Suppl. 1, 1988.Lide, D. R.: Ed., CRC Handbook of Chemistry and Physics, 81st ed., 5-4 CRC, Boca Raton, FL, 2000.Lightfoot, P. D., Cox, R. A., Crowley, J. N., Destriau, M., Hayman, G. D., Jenkin, M. E., Moortgat, G. K. and Zabel, F.: AtmosEnviron., 26A, 1805, 1992.
www.atmos-chem-phys.org/acp/4/1461/ Atmos. Chem. Phys., 4, 1461–1738, 2004

1738 R. Atkinson et al.: Evaluated kinetic and photochemical data for Ox, HOx, NOx and SOx
Misra, A. and Marshall, P.: J. Phys. Chem. A 102, 9056, 1998.Molina, L. T. and Molina, M. J.: J. Phys. Chem., 82, 2410, 1978.Murrells, T. P., Lovejoy, E. R. and Ravishankara, A. R.: J. Phys. Chem., 94, 2381, 1990.Nickolaisen, S. L., Friedl, R. R. and Sander, S. P.: J. Phys. Chem., 98, 155, 1994.Nicovich, J. M., Kreutter, K. D. and Wine, P. H.: J. Chem. Phys., 92, 3539, 1990.Nicovich, J. M., Wang, S., McKee, M. L. and Wine, P. H.: J. Phys. Chem., 100, 680, 1996.Nicovich, J. M., Kreutter, K. D., van Dijk, C. A. and Wine, P. H.: J. Phys. Chem., 96, 2518, 1992.Nuttall, R. L., Laufer, A. H. and Kilday, M. V.: J. Chem. Thermodyn., 3, 167, 1971.Orlando, J. J. and Tyndall, G. S.: J. Phys. Chem., 100, 19 398, 1996.Patrick, R and Golden, D. M.: Int. J. Chem. Kinet., 15, 1189, 1983.Pedley, J. B. and Rylance, J.: Sussex-N.P.L., Computer Analyzed Thermochemical Data: Organic and OrganometallicCompounds, University of Sussex, England, 1977.Pedley, J. B., Naylor, R. D. and Kirby, S. P.: Thermochemical Data of Organic Compounds, 2nd. ed., Chapman and Hall,London, 1986.Piper, L. G.: J. Chem. Phys., 70, 3417, 1979.Rodgers, A. S., Chao, J., Wilhoit, R. C. and Zwolinski, B. J.: J. Phys. Chem. Ref. Data, 3, 117, 1974.Ruscic, B. and Berkowitz, J.: J. Chem. Phys., 101, 7795, 1994.Ruscic, B., Feller, D., Dixon, D. A., Peterson, K. A., Harding, L. B., Asher, R. L. and Wagner, A. F.: J. Phys. Chem. A, 105,1, 2001.Sander, S. P. and Peterson, M.: J. Phys. Chem., 88, 1566, 1984.Skorobogatov, G. A., Dymov, B. P. and Nedozrelova, I. V.: Russ. J. Gen. Chem. (Engl. Transl.) 66, 1777, 1996.Thorn, R. P., Stief, L. J., Kuo, S.-C. and Klemm, R. B.: J. Phys. Chem., 100, 14 178, 1996.Thorn, R. P., Monks, P. S., Steif, L. F., Kuo, S.-C., Zhang, Z. and Klemm, R. B.: J. Phys. Chem., 100, 121 199 1996.Turnipseed, A. A., Barone, S. B. and Ravishankara, A. R.: J. Phys. Chem., 96, 7502, 1992.Tyndall, G. S., Cox, R. A., Granier, C., Lesclaux, R., Moortgat, G. K., Pilling, M. J., Ravishankara, A. R. and Wallington, T.J.: J. Geophys. Res., 106, 12 157, 2001.van den Bergh, H. and Troe, J.: J. Chem. Phys., 64, 736, 1976Wagman, D. D., Evans, W. H., Parker, V. B., Schumm, R. H., Halow, I., Bailey, S. M., Churney, K. L. and Nuttall, R. L.: J.Phys. Chem. Ref. Data 11, Suppl. 2, 1982.Watkins, K. W. and Thompson, W. W.: Int. J. Chem. Kinet., 5, 791, 1973.Wiberg, K. B., Crocker, L. S. and Morgan, K. M.: J. Am. Chem. Soc., 113, 3447, 1991.Zhao, W. G. and Francisco, J. S.: Chem. Phys. Lett., 173, 551, 1990.
a) Calculated from1Hf ((CH3)2SO) and the valueD(CH3-SOCH3) = 230 kJ mol−1 estimated by Benson (1978).b) Based on equating FO-N bond strengths in FONO and FONO2.
Atmos. Chem. Phys., 4, 1461–1738, 2004 www.atmos-chem-phys.org/acp/4/1461/