eva as a performance tool & as an indicator of swm
DESCRIPTION
EVA as a performance tool & as an indicator of SWM - end term MBA projectTRANSCRIPT
EVA as a performance tool &
as an indicator of SWM
Course: Corporate Finance
Submitted To: Dr. Sandeep Goel
Group 1
Name Roll No Arindam Bera 15PGHR09
Ashmeet Singh 15PGHR14
Hansika Jain 15PGHR17
Parul Jain 15PGHR31
Shrutkirti Kothari 15PGHR42
Vipul Verma 15PGHR51

EVA as a performance tool & as an indicator of SWM
Corporate Finance Project | Group 1 Page 2
Acknowledgement
We take this opportunity to express our gratitude to Dr. Sandeep Goel for his invaluable guidance,
excellent supervision and constant inspiration throughout the course. He helped all of us to understand
the elements of Corporate Finance and the issues involved with it. His encouragement and advice
helped us throughout the project, and helped us in the timely completion of the project.
We thank MDI Administration and the Library Staff for maintaining such an excellent repository for
Corporate Finance related material & EBSCO, without which the project would not have been possible.
Last but not the least, we thank all those who were directly or indirectly involved in the completion of
this project.
Date: 15/03/2016
EVA as a performance tool & as an indicator of SWM
Corporate Finance Project | Group 1 Page 3
Contents
Acknowledgement ........................................................................................................................................ 2
Executive Summary ....................................................................................................................................... 4
EVA (Economic Value Added) ....................................................................................................................... 5
Introduction .............................................................................................................................................. 5
EVA: ............................................................................................................................................................... 5
Significance of EVA .................................................................................................................................... 5
EVA Calculation ......................................................................................................................................... 5
EVA = NOPAT - Cost of Capital ..................................................................................................................... 5
WACC = Ke * W1 + Kd (1 - T) * W2 ............................................................................................................... 6
Advantages of EVA Reporting ................................................................................................................... 6
Limitations of EVA Reporting .................................................................................................................... 6
Relationship between Market Price and EVA ........................................................................................... 6
EVA Trend Analysis .................................................................................................................................... 7
Hindustan Unilever Limited ......................................................................................................................... 7
EVA (Rs. Crore) vs FY | Source: HUL Annual Reports .................................................................................. 7
Coca Cola Limited ......................................................................................................................................... 7
EVA (Rs. Crore) vs FY | Source: Coca Cola Annual Reports ......................................................................... 7
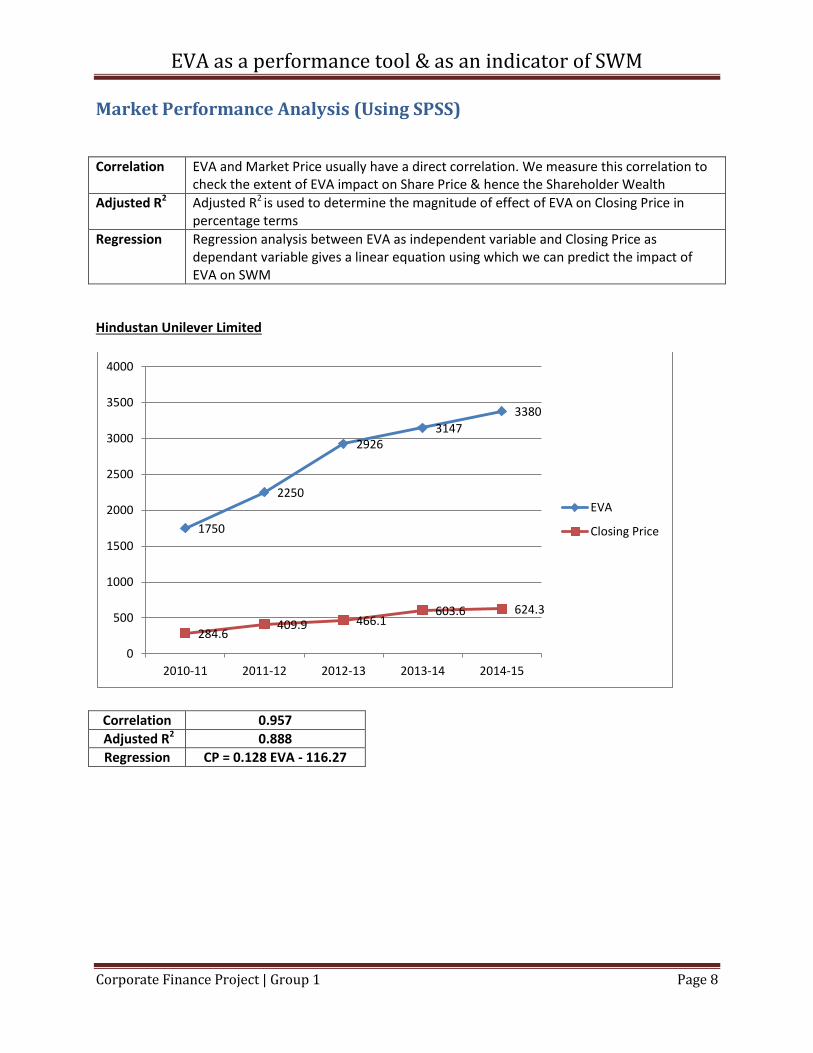
Market Performance Analysis (Using SPSS) .................................................................................................. 8
Hindustan Unilever Limited ......................................................................................................................... 8
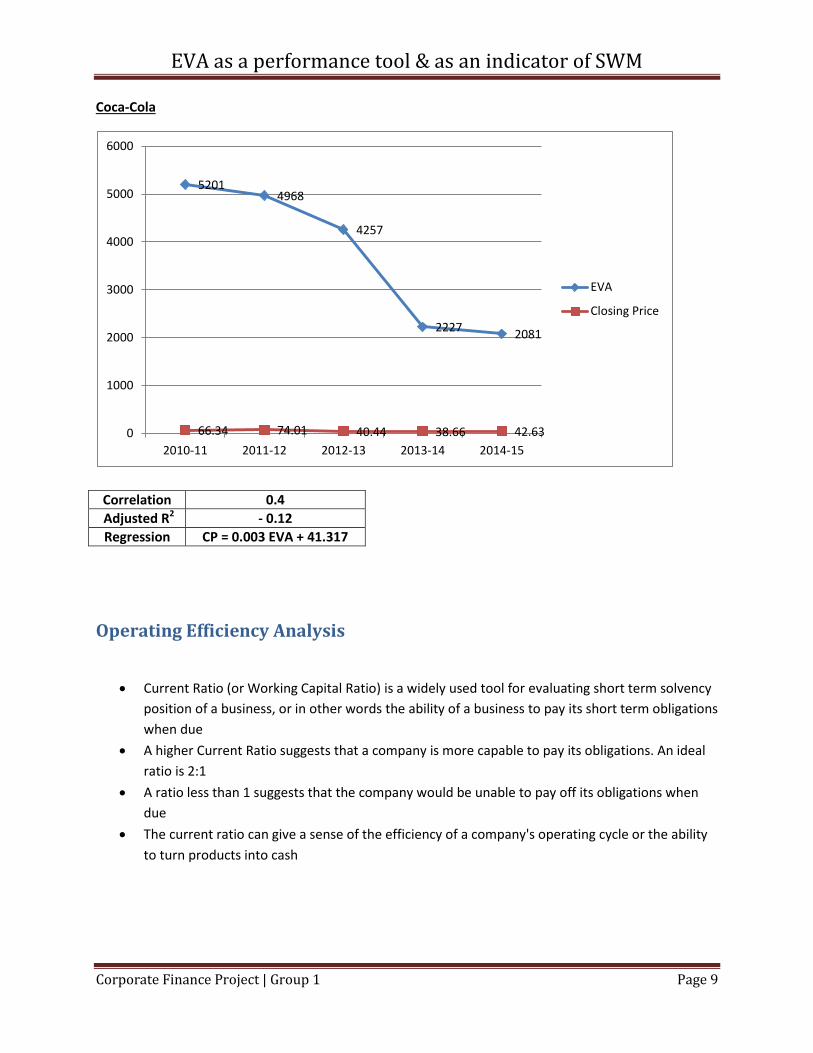
Coca-Cola ...................................................................................................................................................... 9
Operating Efficiency Analysis ........................................................................................................................ 9
5 Year Trend of Current Ratios .................................................................................................................. 10
Working Capital Analysis - Management Approach ................................................................................... 11
Total Debt : 5 Year trends .......................................................................................................................... 11
Conclusion & Recommendations ................................................................................................................ 12
References .................................................................................................................................................. 13
Annual Reports ........................................................................................................................................... 14
EVA as a performance tool & as an indicator of SWM
Corporate Finance Project | Group 1 Page 4
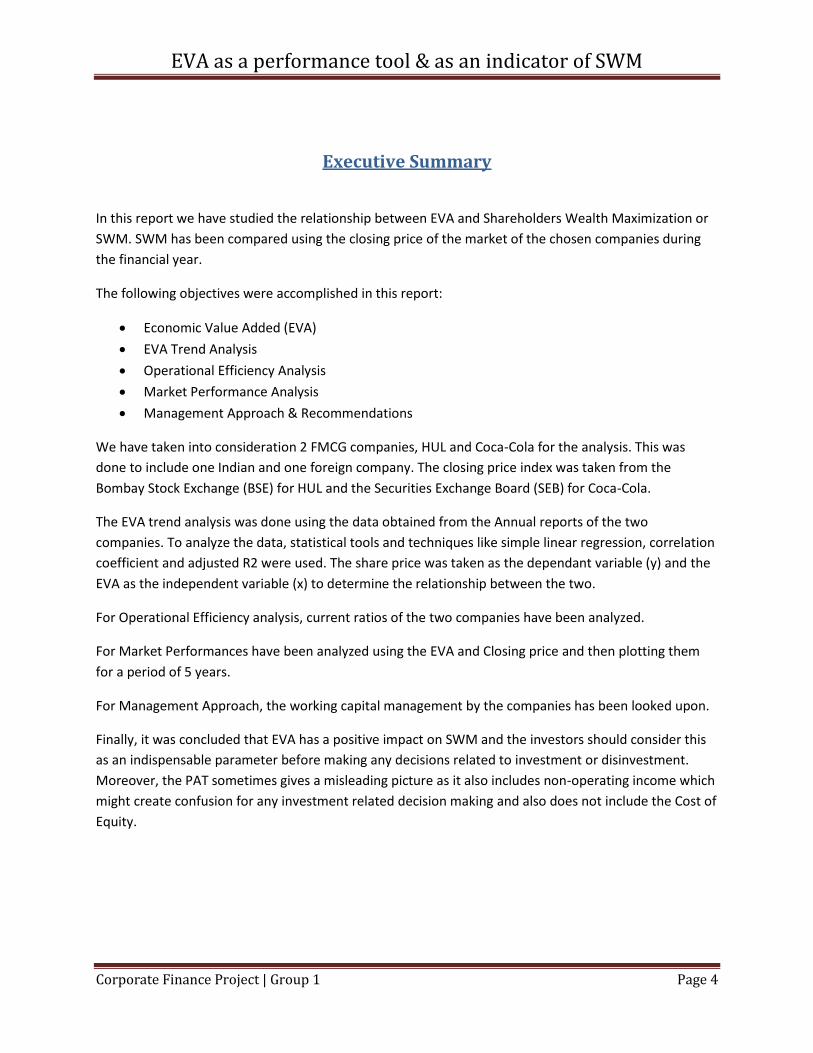
Executive Summary
In this report we have studied the relationship between EVA and Shareholders Wealth Maximization or
SWM. SWM has been compared using the closing price of the market of the chosen companies during
the financial year.
The following objectives were accomplished in this report:
Economic Value Added (EVA)
EVA Trend Analysis
Operational Efficiency Analysis
Market Performance Analysis
Management Approach & Recommendations
We have taken into consideration 2 FMCG companies, HUL and Coca-Cola for the analysis. This was
done to include one Indian and one foreign company. The closing price index was taken from the
Bombay Stock Exchange (BSE) for HUL and the Securities Exchange Board (SEB) for Coca-Cola.
The EVA trend analysis was done using the data obtained from the Annual reports of the two
companies. To analyze the data, statistical tools and techniques like simple linear regression, correlation
coefficient and adjusted R2 were used. The share price was taken as the dependant variable (y) and the
EVA as the independent variable (x) to determine the relationship between the two.
For Operational Efficiency analysis, current ratios of the two companies have been analyzed.
For Market Performances have been analyzed using the EVA and Closing price and then plotting them
for a period of 5 years.
For Management Approach, the working capital management by the companies has been looked upon.
Finally, it was concluded that EVA has a positive impact on SWM and the investors should consider this
as an indispensable parameter before making any decisions related to investment or disinvestment.
Moreover, the PAT sometimes gives a misleading picture as it also includes non-operating income which
might create confusion for any investment related decision making and also does not include the Cost of
Equity.

EVA as a performance tool & as an indicator of SWM
Corporate Finance Project | Group 1 Page 5
EVA (Economic Value Added)
Introduction Economic Value Added (EVA) is the financial performance measure that captures the true economic
profit of any company closest to the actual and is the performance measure which is most directly linked
to creating shareholder wealth over time. There has been several studies which show the connection
between change in shareholder wealth and EVA.
EVA:
Is a value based performance measure appreciating value created by management for its
owners
Evaluates how a company is performing by maximizing wealth for its shareholders
Is most directly linked to creating shareholder wealth
A number of giant organizations, both in India and abroad report EVA in their annual reports. A few
examples include HUL, Godrej, TCS in India, whereas outside, companies like Coca Cola, PepsiCo, Eli Lily,
ANZ Bank have all implemented EVA financial management systems.
Significance of EVA EVA has the following critical aspects linked to it:
It helps organizations determine the actual profit once the taxes and capital amount has been
taken under consideration
It separates bonus plans from budgetary targets and covers all aspects of the business cycle
It helps in taking better assessment of decisions that affect the balance sheet and income
statement or tradeoffs between each through the use of the capital charge against NOPAT
A positive EVA indicates that the business has created wealth for the shareholders, whereas a
negative EVA means that the business has destroyed wealth for shareholders
EVA Calculation In mathematical terms, this concept is expressed as (Maheswari, 2009) -
EVA = NOPAT - Cost of Capital
Where,
EVA = Economic Value Added Cost of Capital = Capital Employed x WACC
NOPAT = Net Operating Profit After Tax WACC = Weighted Average Cost of Capital
WACC used in the calculations is calculated as:

EVA as a performance tool & as an indicator of SWM
Corporate Finance Project | Group 1 Page 6
WACC = Ke * W1 + Kd (1 - T) * W2
Where,
W1 = Weight of Equity W2 = Weight of Debt
Kd = Effective cost of debt Ke = Effective cost of equity
Advantages of EVA Reporting 1. Provides a summary of how much and from where a company created wealth
2. Relatively easy to calculate
3. Can be used for compensating management
4. Includes the balance sheet in the calculation thereby encouraging managers to think about
assets as well as expenses in their decisions
5. Can be used as a management tool to improve performance
Limitations of EVA Reporting 1. Economic Value Added only applies to the period measured; it is not predictive of future
performance
2. Seemingly infinite cash adjustments associated with calculating economic value can be time
consuming
3. Requires accurate estimate of After tax cost of capital
4. Does not take into account the effects of inflation, investment profile or currency effects on
accounting value of capital and accounting profit
Relationship between Market Price and EVA EVA and market price usually have a direct correlation. As the company's expected EVA becomes higher,
so does the market value. However, under exceptional circumstances, it might be possible that -
A positive EVA is accompanied by a fall in the market price and vice versa, due to market
outlooks or growth potential
Thus a positive change in EVA is better than a positive yet unchanging base level of EVA as it is
consistent with shareholder value added
In theory, EVA and Market Price walk hand in hand, up or down, however, as discussed, due to positive
market outlook or investors recognizing huge growth potential in the firm might reverse that trend and
negative EVA can also result in a positive Market price.
EVA as a performance tool & as an indicator of SWM
Corporate Finance Project | Group 1 Page 7
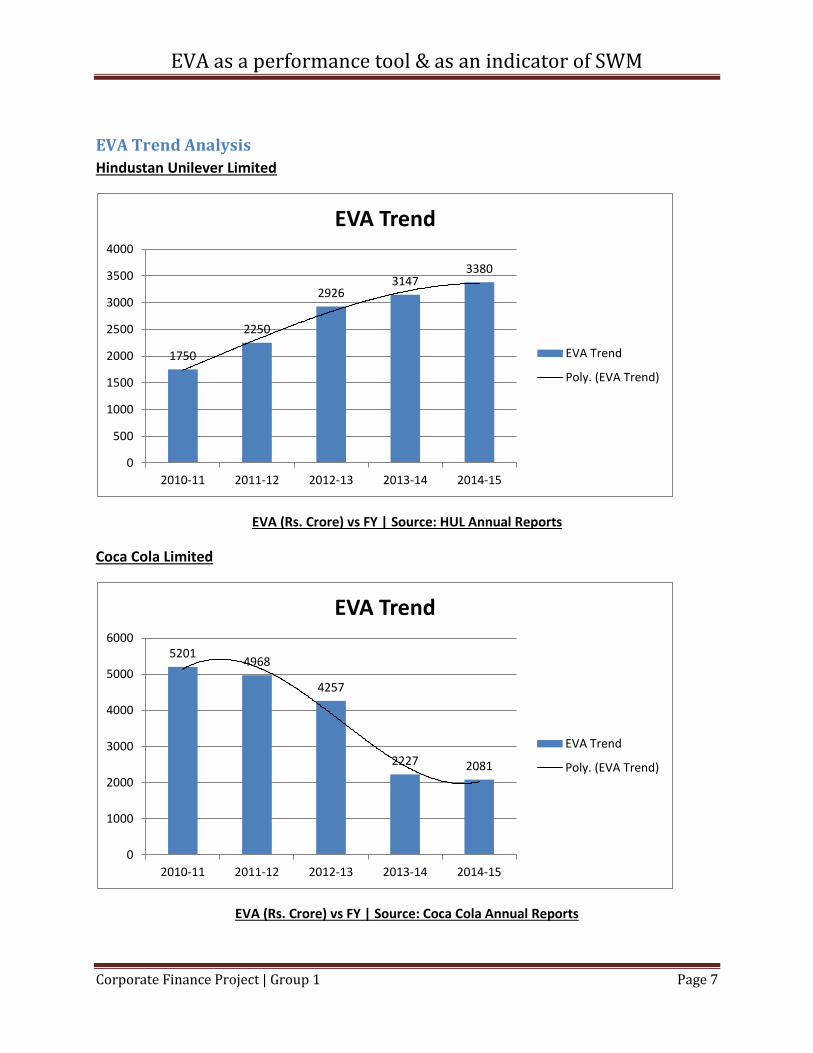
EVA Trend Analysis
Hindustan Unilever Limited
EVA (Rs. Crore) vs FY | Source: HUL Annual Reports
Coca Cola Limited
EVA (Rs. Crore) vs FY | Source: Coca Cola Annual Reports
1750
2250
2926 3147
3380
0
500
1000
1500
2000
2500
3000
3500
4000
2010-11 2011-12 2012-13 2013-14 2014-15
EVA Trend
EVA Trend
Poly. (EVA Trend)
5201 4968
4257
2227 2081
0
1000
2000
3000
4000
5000
6000
2010-11 2011-12 2012-13 2013-14 2014-15
EVA Trend
EVA Trend
Poly. (EVA Trend)
EVA as a performance tool & as an indicator of SWM
Corporate Finance Project | Group 1 Page 8
Market Performance Analysis (Using SPSS)
Correlation EVA and Market Price usually have a direct correlation. We measure this correlation to check the extent of EVA impact on Share Price & hence the Shareholder Wealth
Adjusted R2 Adjusted R2 is used to determine the magnitude of effect of EVA on Closing Price in percentage terms
Regression Regression analysis between EVA as independent variable and Closing Price as dependant variable gives a linear equation using which we can predict the impact of EVA on SWM
Hindustan Unilever Limited
Correlation 0.957
Adjusted R2 0.888
Regression CP = 0.128 EVA - 116.27
1750
2250
2926 3147
3380
284.6 409.9 466.1
603.6 624.3
0
500
1000
1500
2000
2500
3000
3500
4000
2010-11 2011-12 2012-13 2013-14 2014-15
EVA
Closing Price
EVA as a performance tool & as an indicator of SWM
Corporate Finance Project | Group 1 Page 9
Coca-Cola
Correlation 0.4
Adjusted R2 - 0.12
Regression CP = 0.003 EVA + 41.317
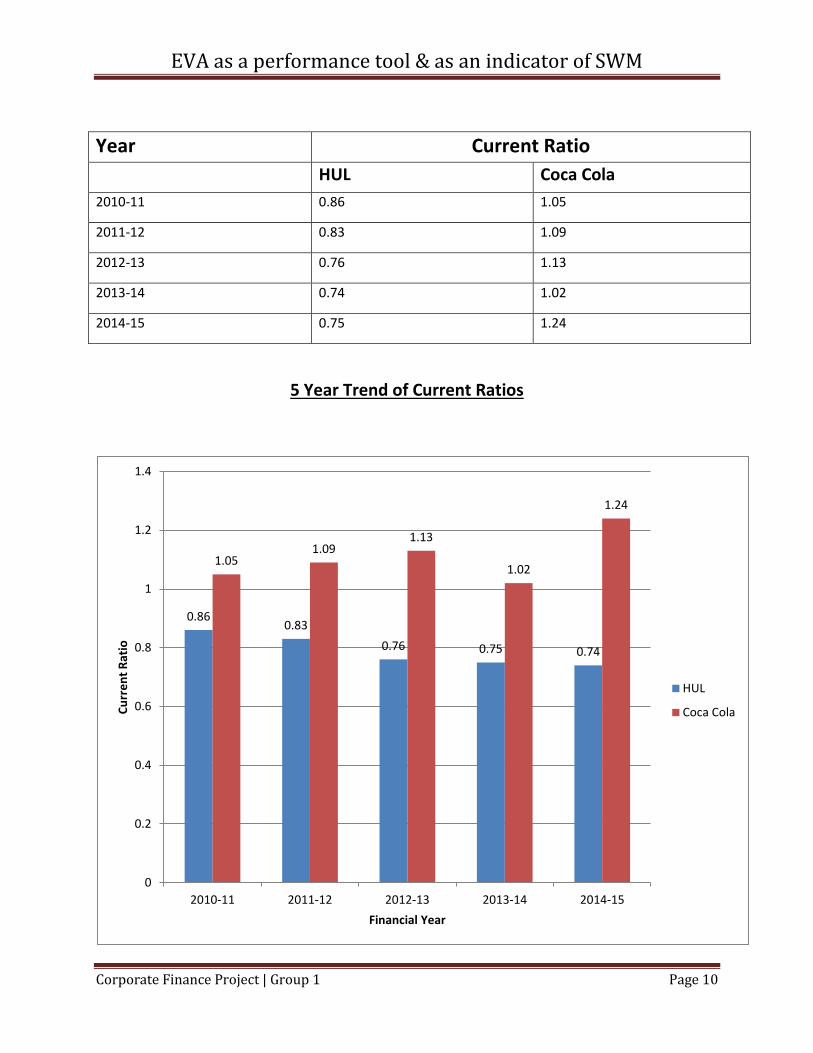
Operating Efficiency Analysis
Current Ratio (or Working Capital Ratio) is a widely used tool for evaluating short term solvency
position of a business, or in other words the ability of a business to pay its short term obligations
when due
A higher Current Ratio suggests that a company is more capable to pay its obligations. An ideal
ratio is 2:1
A ratio less than 1 suggests that the company would be unable to pay off its obligations when
due
The current ratio can give a sense of the efficiency of a company's operating cycle or the ability
to turn products into cash
5201 4968
4257
2227 2081
66.34 74.01 40.44 38.66 42.63 0
1000
2000
3000
4000
5000
6000
2010-11 2011-12 2012-13 2013-14 2014-15
EVA
Closing Price
EVA as a performance tool & as an indicator of SWM
Corporate Finance Project | Group 1 Page 10
Year Current Ratio
HUL Coca Cola
2010-11 0.86 1.05
2011-12 0.83 1.09
2012-13 0.76 1.13
2013-14 0.74 1.02
2014-15 0.75 1.24
5 Year Trend of Current Ratios
0.86 0.83
0.76 0.75 0.74
1.05 1.09
1.13
1.02
1.24
0
0.2
0.4
0.6
0.8
1
1.2
1.4
2010-11 2011-12 2012-13 2013-14 2014-15
Cu
rre
nt
Rat
io
Financial Year
HUL
Coca Cola
EVA as a performance tool & as an indicator of SWM
Corporate Finance Project | Group 1 Page 11
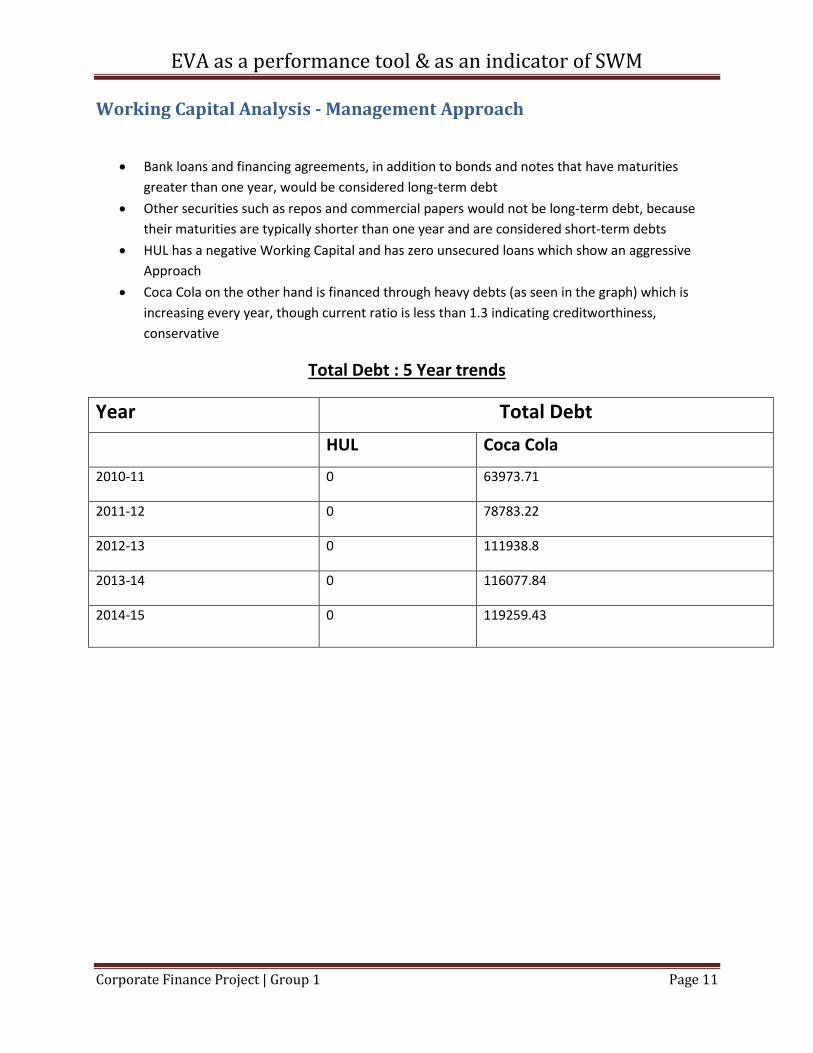
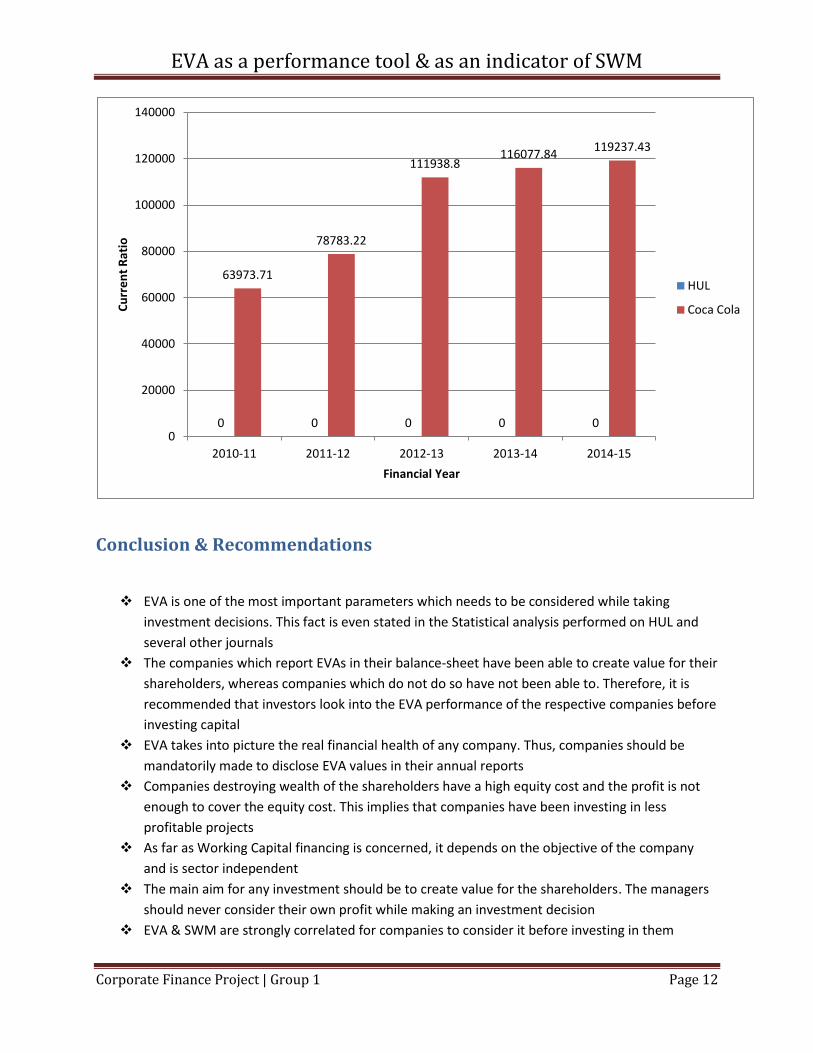
Working Capital Analysis - Management Approach
Bank loans and financing agreements, in addition to bonds and notes that have maturities
greater than one year, would be considered long-term debt
Other securities such as repos and commercial papers would not be long-term debt, because
their maturities are typically shorter than one year and are considered short-term debts
HUL has a negative Working Capital and has zero unsecured loans which show an aggressive
Approach
Coca Cola on the other hand is financed through heavy debts (as seen in the graph) which is
increasing every year, though current ratio is less than 1.3 indicating creditworthiness,
conservative
Total Debt : 5 Year trends
Year Total Debt
HUL Coca Cola
2010-11 0 63973.71
2011-12 0 78783.22
2012-13 0 111938.8
2013-14 0 116077.84
2014-15 0 119259.43
EVA as a performance tool & as an indicator of SWM
Corporate Finance Project | Group 1 Page 12
Conclusion & Recommendations
EVA is one of the most important parameters which needs to be considered while taking
investment decisions. This fact is even stated in the Statistical analysis performed on HUL and
several other journals
The companies which report EVAs in their balance-sheet have been able to create value for their
shareholders, whereas companies which do not do so have not been able to. Therefore, it is
recommended that investors look into the EVA performance of the respective companies before
investing capital
EVA takes into picture the real financial health of any company. Thus, companies should be
mandatorily made to disclose EVA values in their annual reports
Companies destroying wealth of the shareholders have a high equity cost and the profit is not
enough to cover the equity cost. This implies that companies have been investing in less
profitable projects
As far as Working Capital financing is concerned, it depends on the objective of the company
and is sector independent
The main aim for any investment should be to create value for the shareholders. The managers
should never consider their own profit while making an investment decision
EVA & SWM are strongly correlated for companies to consider it before investing in them
0 0 0 0 0
63973.71
78783.22
111938.8 116077.84
119237.43
0
20000
40000
60000
80000
100000
120000
140000
2010-11 2011-12 2012-13 2013-14 2014-15
Cu
rre
nt
Rat
io
Financial Year
HUL
Coca Cola
EVA as a performance tool & as an indicator of SWM
Corporate Finance Project | Group 1 Page 13
References
EVA as a performance tool & as an indicator of SWM
Corporate Finance Project | Group 1 Page 14
Annual Reports
https://www.hul.co.in/Images/hul-annual-report-2014-15_tcm1255-
436328_en.pdf
https://www.coca-
colacompany.com/content/dam/journey/us/en/private/fileassets/pdf/2
015/02/2014-annual-report-on-form-10-k.pdf