ev11 final report - belspo.be · spsd ii – part 2 – global change, ecocystems and biodiversity...
TRANSCRIPT
S C I E N T I F I C S U P P O R T P L A N F O R A S U S T A I N A B L E D E V E L O P M E N T P O L I C Y
BELGIAN SCIENCE POLICY
HEAD OF THE DEPARTMENT ‘RESEARCH PROGRAMMES’: NICOLE HENRY (UNTIL SEPTEMBER 2007)
DIRECTOR GENERAL ‘RESEARCH AND APPLICATIONS’ : DOMINIQUE FONTEYN (FROM APRIL 2006)
CONTACT PERSONS: MARTINE VANDERSTRAETEN
SPSD II (2000-2005)
FOR MORE GENERAL INFORMATION:
SECRETARIAT: VÉRONIQUE MICHIELS
WETENSCHAPSSTRAAT 8, RUE DE LA SCIENCE
B-1000 BRUSSELS
TEL : +32 (0)2 238 36 13
FAX : +32 (0)2 230 59 12
EMAIL : [email protected]
S P S D I I C H A R A C T E R I S A T I O N A N D S O U R C E SO F C A R B O N A C E O U S A T M O S P H E R I CA E R O S O L SW. MAENHAUT, M. CLAEYS
PART 2
GLOBAL CHANGE, ECOSYSTEMS AND BIODIVERSITY ATMOSPHERE AND CLIMATE
MARINE ECOSYSTEMS AND BIODIVERSITY
TERRESTRIAL ECOSYSTEMS AND BIODIVERSITY
NORTH SEA
ANTARCTICA
BIODIVERSITY
SP
SD
I
IC
HA
RA
CT
ER
ISA
TIO
N A
ND
SO
UR
CE
S O
F C
AR
BO
NA
CE
OU
S A
TM
OS
PH
ER
IC A
ER
OS
OL
SEV
-11

Part 2:
Global change, Ecosystems and Biodiversity
Willy MAENHAUT
Ghent University (UGent) Department of Analytical Chemistry, Institute for Nuclear Sciences
Research group “Tropospheric Aerosol Research and Nuclear Microanalysis”
Proeftuinstraat 86, B-9000 Gent
Magda CLAEYS University of Antwerp (UA)
Department of Pharmaceutical Sciences Research group “Bio-organic Mass Spectrometry”
Universiteitsplein 1, B-2610 Antwerpen
SCIENTIFIC SUPPORT PLAN FOR A SUSTAINABLE DEVELOPMENT POLICY (SPSD II)
FINAL REPORT
CHARACTERISATION AND SOURCES OF CARBONACEOUS
ATMOSPHERIC AEROSOLS
EV/11

D/2007/1191/52 Published in 2007 by the Belgian Science Policy Rue de la Science 8 Wetenschapsstraat 8 B-1000 Brussels Belgium Tel: +32 (0)2 238 34 11 – Fax: +32 (0)2 230 59 12 http://www.belspo.be Contact person: Mrs Martine Vanderstraeten Secretariat: +32 (0)2 238 36 13 Neither the Belgian Science Policy nor any person acting on behalf of the Belgian Science Policy is responsible for the use which might be made of the following information. The authors are responsible for the content.
No part of this publication may be reproduced, stored in a retrieval system, or transmitted in any form or by any means, electronic, mechanical, photocopying, recording, or otherwise, without indicating the reference.

Project EV/11 - Characterisation and sources of carbonaceous atmospheric aerosols
SPSD II – PART 2 – Global Change, Ecocystems and Biodiversity – Climate 3
Table of content
ABSTRACT................................................................. 5 1. INTRODUCTION ......................................................... 11 2. METHODS AND TECHNIQUES .............................................. 15
2.1. Aerosol collections for subsequent chemical analysis...................... 15 2.2. Measurement of in-situ aerosol characteristics and of atmospheric trace
gases ........................................................ 15 2.3. Bulk chemical analyses ........................................... 16 2.4. Aerosol chemical mass closure calculations, source identification and source
apportionment .................................................. 17 3. DEVELOPMENT AND DEPLOYMENT OF IMPROVED COLLECTION PROCEDURES
FOR CARBONACEOUS AEROSOLS ......................................... 19 3.1. Assessment of (and correction) for artifacts by the tandem filter approach or
by the use of a two-port sampling system .............................. 19 3.2. Elimination of adsorptive artifacts by the use of a diffusion denuder............ 22
4. IMPROVED METHODS FOR CHARACTERISATION OF THE CARBONACEOUS ATMOSPHERIC AEROSOL................................................. 25
4.1. Improved differentiation between organic carbon (OC) and elemental carbon (EC) ......................................................... 25
4.2. Methods for the separation of the organic carbon (OC) in water-soluble and insoluble fractions (WSOC and WinsOC) and for the further separation of each fraction in major classes....................................... 29
4.3. More complete molecular characterisation of the organic carbon (OC), with special emphasis on organic compounds with high molecular weight or high polarity........................................................ 31
5. IDENTIFICATION OF NEW ORGANIC COMPOUNDS IN CONTINENTAL AEROSOLS THAT CAN BE USED AS MARKERS FOR SPECIFIC SOURCES, SOURCE TYPES OR PROCESSES, AND/OR ATMOSPHERIC PROCESSES ............................ 35
6. AEROSOL CHARACTERISATION STUDIES IN EUROPE .......................... 39 6.1. Aerosol studies in Ghent........................................... 39 6.2. Aerosol studies at EUROTRAC-2 AEROSOL intercomparison sites............ 41 6.3. Aerosol studies in Hungary ......................................... 41 6.4. Aerosol studies at other European sites................................ 43
7. AEROSOL CHARACTERISATION STUDIES IN EQUATORIAL AND TROPICAL REGIONS .............................................................. 47
7.1. Aerosol research in South America ................................... 47 7.2. Aerosol research in South Africa..................................... 50 7.3. Aerosol research in Rukomechi, Zimbabwe ............................. 53 7.4. Aerosol reseach at two sites in Tanzania............................... 53 7.5. Aerosol research in South-east Asia and North-west Australia ............... 53
8. CHEMICAL MASS CLOSURE, SOURCE IDENTIFICATION AND SOURCE APPORTIONMENT ....................................................... 55
8.1. Aerosol chemical mass closure...................................... 55 8.2. Source identification and apportionment ............................... 62
9. RELATIONSHIPS BETWEEN THE CARBONACEOUS AEROSOL CHARACTERISTICS AND THE PHYSICAL AND OPTICAL/RADIATIVE AEROSOL PROPERTIES ............ 71
10. VALORISATION ACTIVITIES AND EXPLOITATION OF THE RESULTS ................ 73 11. CONCLUSIONS AND RECOMMENDATIONS ................................... 75 ACKNOWLEDGEMENTS ..................................................... 77 REFERENCES ............................................................. 79


Project EV/11 - Characterisation and sources of carbonaceous atmospheric aerosols
SPSD II – PART 2 – Global Change, Ecocystems and Biodiversity – Climate 5
ABSTRACT Atmospheric aerosols are of importance for a wide range of geophysical and environmental problems ranging from local issues to global scale. Carbonaceous aerosols, i.e., organic carbon (OC) and elemental carbon (EC), make up a large fraction of the (fine) aerosol, often up to 50% or more, and are thought to play a major role in the climatic and health effects of aerosols. Yet, our knowledge about them is very deficient. This is to a large extent due to their complexity and to problems associated with their collection. In this project we investigated improved collection procedures, whereby the sampling artifacts are better controlled or can be corrected for. These procedures included the use of tandem quartz fibre filter set-ups (with front and back filters, Q1Q2), of a two-port sampling train (with parallel deployment of a quartz fibre filter holder, Q1, and of a sampler with sequential front Teflon filter and back-up quartz fibre filter, TQ3), and of a tandem quartz fibre filter set-up that was preceded with a diffusion denuder for volatile organic compounds (VOCs) and important gaseous inorganic oxidants (O3, NO2), DQ1Q2. From the simultaneous deployment of the DQ1Q2 and Q1Q2 set-ups at several urban and rural locations in Europe, it could be concluded that positive sampling artifacts (i.e., the adsorption of VOCs by the quartz fibre filters) prevail in a Q1Q2 set-up and that negative artifacts (i.e., the loss of semivolatile OC from the particulate phase) prevail in a DQ1Q2 set-up and that the same particulate phase OC data are generally obtained by subtracting the back filter OC from the front filter OC in a Q1Q2 set-up as found by adding the front and back filter OC in a DQ1Q2 set-up. It is therefore suggested that the rather simple Q1Q2 set-up and subtraction of front and back filter OC can generally be deployed to obtain reliable particulate phase OC data. It was also found that the percentage of the OC on the back-up filter (Q2) of a Q1Q2 set-up was higher during summer than winter and that there was a tendency for higher percentages at locations with warmer ambient temperatures than at colder locations. The highest percentages of OC on the back filter relative to the front filter that were obtained with our Q1Q2 set-ups at our various sampling sites were around 16-17%. Secondly, we developed improved methods for the characterisation of the carbonaceous atmospheric aerosol, going from (a) a better discrimination between EC and OC over (b) separation into a number of main classes, for which the major functional groups are characterised, to (c) a more complete molecular characterisation, whereby special attention was given to high-molecular weight organics and highly polar compounds. Extensive work was done on the appropriate discrimination between EC and OC by thermal-optical analysis. It appeared that the results depend to a large extent on the temperature program used, particulary on the maximum temperature in the first stage (in pure He) of the analysis. Higher EC/TC

Project EV/11 - Characterisation and sources of carbonaceous atmospheric aerosols
SPSD II – PART 2 – Global Change, Ecocystems and Biodiversity – Climate 6
ratios (with TC = OC + EC) were obtained at lower maximum temperatures in the first stage. It was also found that the composition of the carbonaceous aerosol plays an important role in the EC/OC split point setting. Very serious discrepancies were observed between the EC (or black carbon (BC)) of different techniques for samples with large amounts of biomass burning (or brown carbon) aerosol. A very recent study to which the UGent team contributed shed some light on this issue. As to the separation into main classes, the UGent team developed a method for measuring water-soluble OC (WSOC) and applied it to samples from various sites. The largest WSOC percentages (expressed as % of the OC) were observed for rural and biomass burning sites, where they were in the range of 60-70%; at urban sites the WSOC percentages were in the range of 35-43%. This indicates that the OC at the rural and biomass burning sites is more oxygenated than at the urban sites. It also implies that the multiplication factor to convert OC data into data for organic matter (OM) should be higher for the rural and biomass burning sites than for urban sites. With regard to the more complete molecular characterisation, extensive work was done by the UA team. Methods, involving derivatisation of extracts from quartz fibre filter samples or aluminium cascade impactor foils and analysis by gas chromatography with flame ionisation detection (GC-FID) or by capillary GC/mass spectrometry (GC/MS), were developed for a variety of polar compounds, including saccharidic compounds, other polyols, and several organic acids. Third, we identified new organic compounds in continental aerosols that can be used as markers for specific sources, source types or processes, and/or atmospheric processes. A major achievement was the discovery of the 2-methyltetrols in aerosol samples from the Amazon basin. These compounds were attributed to secondary organic aerosol (SOA) formation from the photo-oxidation of isoprene. The discovery was published in the scientific top journal Science. Although isoprene is emitted in very large quantities by the terrestrial vegetation, it was up to our finding not considered to give rise to SOA in the ambient air. The 2-methyltetrols were subsequently also found to be present in aerosols from a number of forested locations in Europe and, in addition, other SOA products from isoprene were discovered, such as 2-methylglyceric acid. The formation of the SOA products from isoprene was confirmed by smog chamber experiments, which were carried out in co-operation with the U.S. Environmental Protection Agency. Fourth, our already existing and newly developed samplers and analytical methods were used for detailed carbonaceous aerosol characterisation studies at various sites in Europe, in part within the framework of the EUROTRAC-2 AEROSOL subproject. Extensive collections and measurements were performed for urban background sites (Ghent and Uccle), a kerbside (Budapest), a rural background site (Melpitz,

Project EV/11 - Characterisation and sources of carbonaceous atmospheric aerosols
SPSD II – PART 2 – Global Change, Ecocystems and Biodiversity – Climate 7
Germany), and the forested site of K-puszta in Hungary, whereas less extensive work was done for the urban background site of Barcelona, a traffic site in Amsterdam, forested sites in Finland and Germany, and some other European sites. For Ghent and especially K-puszta, detailed molecular characterisation work was carried out. For Ghent, large concentrations of the wood-burning indicator levoglucosan were found in winter samples, whereas in summer sugars and sugar alcohols were present, which are indicators for natural primary emissions from the vegetation. The samples at K-puszta had been collected during a hot 2003 summer campaign and substantial concentrations of isoprene SOA compounds and sugar alcohols were observed. Diel patterns, with highest concentrations and highest percentage contributions to the OC during day-time, were observed for the 2-methyltetrols, which can be regarded as supporting evidence for their fast photochemical formation from isoprene that is locally emitted during the day-time. Similar diel patterns were noted for the sugar alcohols (which are markers for fungal spores), suggesting that the release of fungal fragments is enhanced during the day-time. Our existing and improved methods for aerosol collection and chemical analysis were also used for studies in tropical and equatorial regions (South America, southern Africa, South-east Asia, North-west Australia). The measurements in South America and South Africa were conducted within large international field campaigns that were organised under the auspices of IGBP-IGAC activities, such as those of the Large Scale Biosphere-Atmosphere Experiment in Amazonia (LBA). Several campaigns were conducted in Amazonia, but the UGent and UA teams were especially active in the work of the ground-based field campaign that took place in 2002 at a pasture site in the state of Rondônia, Brazil, within the EU project “Smoke Aerosols, Clouds, Rainfall and Climate: Aerosols from Biomass Burning Perturb Global and Regional Climate” (SMOCC). The UGent team deployed several aerosol collectors at the site from early September until mid-November. These 2.5 months encompassed a dry period, with intensive biomass burning and very high levels (often more than 100 µg/m3) of PM2.5 (particulate matter smaller than 2.5 µm), a transition period with intermediate levels, and a wet period with PM2.5 mass levels below 5 µg/m3. Extensive chemical analyses were performed on the UGent samples from this campaign, not only by our own teams, but also by other SMOCC partners. Significant variations in the aerosol composition and concentrations were observed within each period, which can be classified into two categories: a) diurnal oscillations, caused by the diurnal cycle of the boundary layer and the different combustion phase active during day (flaming) or night (smouldering); b) day-to-day variations, due to alternating phases of relatively wet and dry conditions. There were large differences in the composition of the total identified organic compound fraction of the PM2.5 aerosol between the three periods. The relative contribution of the biomass burning

Project EV/11 - Characterisation and sources of carbonaceous atmospheric aerosols
SPSD II – PART 2 – Global Change, Ecocystems and Biodiversity – Climate 8
products (i.e., the anhydrosugars, which include levoglucosan, and the aromatic acids and aldehydes) decreased from the dry to the wet period (with percentage contributions of 55, 33, and 16% for the dry, transition, and wet periods, respectively), while this of the biogenic and biological aerosol products, including the 2-methyltetrols, the sugar alcohols, and the sugars, showed an opposite pattern (with average percentage contributions of 5.6, 11, and 36%). Whereas the concentration of the PM2.5 aerosol mass varied over about 2 orders of magnitude over the course of the campaign, that of the coarse (2.5-10 µm) aerosol varied over less than one order of magnitude, pointing to a fairly constant emission of coarse particles from the natural background. As a consequence, the PM2.5/PM10 percentage ratio for the aerosol mass was substantially lower during the wet period (i.e., on average, 42%) than during the transition period (69%) and dry period (84%). Extensive aerosol collections and chemical analyses were also made for the ground-based field component of the final dry season (biomass burning) campaign in August-September 2000 of the “Southern African Regional Science Initiative” (SAFARI 2000). The field work for this took place at Skukuza in the Kruger National Park. Levoglucosan and oxalic acid were the dominant organic species measured, they accounted for 2.5% and 1.25% of the PM10 OC; the dicarboxylic (and other organic) acids accounted, on average, for 2.5% of the PM10 OC and the saccharidic compounds accounted for 4.9% of the PM10 OC. It can thus be concluded that the bulk of the WSOC eluded analysis by our techniques; this may be predominantly high molecular weight in nature. The data sets on the carbonaceous aerosol were used in combination with data on the inorganic aerosol constituents and on the particulate mass (PM) for source (source type) identification and apportionment, for assessing the relative proportions of SOA and primary OC, and for aerosol chemical mass “closure” work (that is for examining to which extent the experimental gravimetric PM can be reconstituted on the basis of the measured aerosol types and components). Up to 8 aerosol types (components) were included in the mass closure calculations, i.e., OM, EC, ammonium, nitrate, non-sea-salt (nss-) sulphate, sea salt, crustal matter, and other elements. The aerosol composition at our Belgian sites (Ghent and Uccle) was dominated by secondary inorganic aerosol (SIA), that is the sum of ammonium, nitrate, and nss-sulphate. In winter, the sum of these 3 components accounted, on average, for 40% or more of the PM10 mass. For PM2.5 even larger percentage contributions of SIA were observed. Also a substantial fraction of the OM may consist of secondary aerosol and thus be SOA, especially in summer. The total contribution of secondary aerosol to PM10 is likely over 50% in all seasons in Belgium. Also for our other European sites (i.e., Melpitz, Budapest, and K-puszta) large percentages of SIA were observed. Quite different results, with very low SIA percentages of typically

Project EV/11 - Characterisation and sources of carbonaceous atmospheric aerosols
SPSD II – PART 2 – Global Change, Ecocystems and Biodiversity – Climate 9
5%, were obtained for our two sites in Tanzania. Whereas the higher temperatures may play a role for the lower nitrate percentages there, other explanations have to be invoked for the lower percentages of nss-sulphate. They indicate that the emissions of the precursor gas SO2 on the regional scale are substantially lower for our Tanzanian sites than they are for our European sites, as is also evident from the GEIA emission inventory [see http://geiacenter.org/]. OM was clearly the dominant aerosol component in SAFARI 2000 and SMOCC 2002. It accounted for 50% of the PM10 mass during SAFARI 2000 and for about 80% of the PM10 mass during SMOCC 2002. Overall, excellent aerosol chemical mass closure was obtained for all our sites for which all important aerosol constituents (with the exception of water) were determined. The unexplained mass may be attributed to water, which may easily represent 10% or more of the gravimetric PM10 mass at 20°C and 50% relative humidity (which are the conditions at which the weighings were done). Several of our data sets were subjected to multivariate and other receptor modelling. For the combined UGent/UA data set of SMOCC 2002 seven aerosol components were identified: (1) a very important pyrogenic (biomass burning) component, which contained anhydrosugars, phenolic acids, and several other species, (2) a component with dicarboxylic and hydroxycarboxylic acids, (3) crustal matter, (4) aged sea salt, (5) isoprene SOA, with the 2-methyltetrols, (6) a primary biogenic component, and (7) a biological aerosol component with the fungal spore indicators arabitol and mannitol. Although the dicarboxylic and hydroxycarboxylic acids were on a separate component, some of these acids were also in part associated with the pyrogenic component. In co-operation with other groups (especially within the IGBP-IGAC activities), we examined the relationships between the carbonaceous aerosol characteristics and physical and optical/radiative aerosol properties (e.g., condensation nuclei (CN) and cloud condensation nuclei (CCN) concentrations and particle number size distributions, light scattering and absorption coefficients) in order to assess the contribution of the carbonaceous aerosol to the direct and indirect effects of aerosols on climate. Part of the work was done within International collaboration with Central European countries and with China. Special attention was given to the exploitation of the research results. This included transfer of knowledge and results from this project to policy advisers and makers, administrators, the members of the users committee and the general public. Keywords: atmosphere, carbonaceous aerosols, organic carbon, elemental carbon, secondary organic aerosols, aerosol sources, mass closure.


Project EV/11 - Characterisation and sources of carbonaceous atmospheric aerosols
SPSD II – PART 2 – Global Change, Ecocystems and Biodiversity – Climate 11
1. INTRODUCTION Atmospheric aerosols consist of supermicrometer- and submicrometer-sized particles of liquid and solid materials suspended in the air. Both natural and anthropogenic materials occur in the aerosol particles. Most supermicrometer-sized (coarse) particles are of primary origin, that is produced by direct injection into the atmosphere (e.g., soil dust, sea salt, biological aerosol), whereas most of the submicrometer-sized (fine) particles are of secondary origin, that is they result from the transformation of inorganic and organic gaseous precursors into aerosols (e.g., conversion of SO2 into sulphate). Since the early 1990s, a continuously growing amount of attention has been focused on the role of aerosols in climate and atmospheric chemistry [Andreae and Crutzen, 1997] and on their effects on human and animal health and welfare [Turpin, 1999]. The climatic effect of aerosols stems from the fact that they physically affect the heat balance of the Earth, both directly by reflecting and absorbing solar radiation and by absorbing and emitting some terrestrial infrared radiation and indirectly by influencing the properties and processes of clouds, and, possibly, by changing the heterogeneous chemistry of reactive greenhouse gases (e.g., O3) [Charlson and Heintzenberg, 1995]. The role and effects of aerosols depend strongly on their size, chemical composition, and other properties such as water-solubility or hygroscopicity. For both the climatic and health effects, fine aerosols are of primary importance. It is therefore common to concentrate on the fine aerosols, i.e., those with diameter <2.5 µm aerodynamic diameter (AD) (the so-called PM2.5 aerosol). The chemical composition and other properties of the aerosol show large spatial and temporal variability. In the industrial world, anthropogenic sulphate tended to make up most of the PM2.5 mass, but reductions in SO2 emissions had for effect that carbonaceous aerosols become equally or more important and account for 30-60% of the total fine particulate matter [e.g., Chow et al., 1996; Maenhaut et al., 2002a]. Over forested equatorial and tropical regions, such as the Amazon basin, carbonaceous aerosols may even account for up to 90% of the aerosol mass [Andreae and Crutzen, 1997]. Despite their importance, our knowledge on carbonaceous aerosols is rather poor, particularly in relation to that on the inorganic aerosol components, such as sulphate and crustal material [Jacobson et al., 2000; Turpin et al., 2000]. These authors and several others [e.g., Cass, 1998; Hoffmann, 1999] called therefore for increased research on the characterisation, formation, and sources of carbonaceous aerosols. Carbonaceous aerosols consist, on the one hand, of a very wide variety of organic compounds, which are generally denoted by the generic term organic carbon (OC) and, on the other hand, of elemental carbon (EC) [Depending upon the analytical

Project EV/11 - Characterisation and sources of carbonaceous atmospheric aerosols
SPSD II – PART 2 – Global Change, Ecocystems and Biodiversity – Climate 12
method used or upon the researcher, EC is often denoted as soot or black carbon (BC)]. OC can be directly emitted in the particulate form (and thus be primary), or formed in the atmosphere through photochemical reactions on reactive organic gases (ROGs) (and thus be secondary organic aerosol or SOA). Both primary OC and SOA can be of either anthropogenic or natural origin. One form of natural primary OC results from the disintegration and dispersion of bulk plant material; also biological particles, such as bacteria, viruses, plant pollen, and fungal spores, are natural primary particles. Anthropogenic primary OC is produced by a variety of processes, including fossil fuel and biomass burning, motor vehicle emissions, and meat cooking [Cass, 1998; Jacobson et al., 2000]. ROGs leading to SOA include alkadienes and other gases in automobile exhaust and terpenes which are naturally emitted by trees [Jacobson et al., 2000]. EC is a primary aerosol constituent and combustion processes are generally its sole source [Liousse et al., 1996; Cachier, 1998], so that it is mostly of anthropogenic origin. The reasons for our deficiency in knowledge on the carbonaceous aerosols lie in their complexity and in problems associated with their collection. Particulate organic matter is an aggregate of hundreds of individual compounds whose concentrations cannot be determined by a single analytical technique. Extraction followed by gas chromatography and mass spectrometry (GC/MS) is a proven method for characterising individual organics, but it typically resolves only around 10-20% of the organic mass into specific compounds [Rogge et al., 1993; Kubátová et al., 2002]. This is mostly because high-molecular weight organics (i.e., > C40) and highly polar compounds do not elute through the GC column [Turpin et al., 2000]. In addition, some organic compounds are not easily extracted or their GC/MS signatures cannot be resolved at the molecular level [Rogge et al., 1993; Saxena and Hildemann, 1996]. The problems associated with the collection arise from the fact that (a) the collection process itself can alter the gas-particle equilibrium of a number of condensable (semi-volatile) organics, and (b) some volatile organics can be adsorbed by collection substrates like quartz fibre filters which are normally used in filter samplers [Jacobson et al., 2000; Turpin et al., 2000]. This leads to both negative and positive biases in sampling. Two types of approaches can be used to eliminate or at least to assess (and to correct for) these artifacts. One can employ multiple or parallel filter systems, such as a two-port (quartz and Teflon/quartz) sampling system, to assess the importance of the gaseous adsorption. The other approach is to make use of denuder-based sampling methods, whereby a denuder, a filter and an adsorbent bed are placed in series [Eatough et al., 1996]. Within Europe there was up to the year 2000 very little experience with either one of the two approaches. The EUROTRAC-2 AEROSOL participants who concentrated on organic aerosol characterisation did not use either one in their routine work [ten Brink et al., 1999].

Project EV/11 - Characterisation and sources of carbonaceous atmospheric aerosols
SPSD II – PART 2 – Global Change, Ecocystems and Biodiversity – Climate 13
Besides the already mentioned GC/MS methodology, several other methods are used for characterising carbonaceous aerosols. It is common and highly recommended to measure OC and EC by means of a thermal method. There are several variants of it, including the thermal-optical methods [Chow et al., 1993; Birch and Cary, 1996], which allow one to correct for artifact formation of EC during the analysis. However, even the seemingly simple issue of properly discriminating between OC and EC is not settled, and in intercomparison exercises, large variations in the EC/OC ratios have been obtained [e.g., Schmid et al., 2001]. Furthermore, thermal methods deliver OC data in terms of mass of carbon; to convert the OC data into organic aerosol mass (OM) one needs to account for the presence of other atoms in the molecules and multiplying factors ranging from 1.2 to 1.8 are used to do so [Seinfeld and Pandis, 1998]. Turpin and Lim [2001] suggested to use an OC-to-OM conversion factor of 1.6±0.2 for urban aerosols and of 2.1±0.2 for nonurban aerosols, but they also indicated that more research on the topic is needed. Since then, several more papers on this topic have been published. While there is a consensus that the factor is lower for freshly emitted organic matter at urban sites than for aged or rural aerosols, which factor should be used for a particular site or data set is still far from clear, which means that the derived organic aerosol mass has a substantial associated uncertainty. A sensible intermediate way of characterising organic aerosols in between the relatively simple measurement of OC and the complex full characterisation at the molecular level is to measure water-soluble OC (WSOC) and insoluble OC, and to separate each into a number of main classes, for which the major functional groups are characterised [Decesari et al., 2000]. The WSOC contributes to the ability of aerosol particles to act as cloud condensation nuclei (CCN) and thus to the indirect effect of aerosols on climate. With regard to the full characterisation of organic aerosols at the molecular level, in addition to the GC/MS methodology, other methods can be used or have been proposed. Light-molecular weight organic acids and other water-soluble organics can be measured with ion chromatography [e.g., Li and Winchester, 1993; Jaffrezo et al., 1998] and even by GC and GC/MS after appropriate derivatisation [Kawamura, 1993]. According to Turpin et al. [2000] and others, perhaps the most promising technique for molecular-level quantitation of polar organics is high-pressure liquid chromatography/mass spectrometry (HPLC/MS). To assess the impact from human activities on the concentration, composition, and climatic and other effects of carbonaceous atmospheric aerosols, it is necessary to

Project EV/11 - Characterisation and sources of carbonaceous atmospheric aerosols
SPSD II – PART 2 – Global Change, Ecocystems and Biodiversity – Climate 14
determine the relative contributions of anthropogenic and natural sources and to distinguish between the various source types in each of these broad categories. Furthermore, to allow modellers to test their models versus experimental data, the relative proportions of SOA and primary OC should be known. Qualitative (and semi-quantitative) information about both issues can be obtained from the presence of marker compounds [Seinfeld and Pandis, 1998]. For a more quantitative source apportionment of the primary OC, chemical mass balance (CMB) receptor modelling can be used [Schauer et al., 1996; Cass, 1998]. The contribution of SOA to the total carbonaceous aerosol can be roughly estimated by examining the diurnal variations of OC and EC [Turpin and Huntzicker, 1995]. An alternative approach is to use the difference between the experimentally measured OC and the CMB-modelled primary OC as a measure for SOA [Schauer et al., 1996; Cass, 1998]. Considering the above description of the state of the art, the gaps in our knowledge on carbonaceous aerosols, and their importance for a wide range of geophysical and environmental problems, ranging from local issues (e.g., human health) to global scale (e.g., climate change) [Jacobson et al., 2000], the project had the following objectives: (1) to deploy improved collection procedures for carbonaceous aerosols, whereby the sampling artifacts are better controlled or can be corrected for; (2) to develop improved methods for characterisation of the carbonaceous atmospheric aerosol, from OC/EC over differentiation in broad classes to a more complete molecular characterisation; (3) to identify new organic compounds in continental aerosols that can be used as markers for specific sources, source types or processes, and/or atmospheric processes; (4) to employ the already existing and newly developed samplers (including devices with high size resolution) and analytical methods for detailed carbonaceous aerosol characterisation studies in Europe (within the framework of the EUROTRAC-2 AEROSOL subproject) and (5) in tropical and equatorial regions, mainly within large international campaigns that are organised under the auspices of IGBP-IGAC activities; (6) to use the data on the carbonaceous aerosol in combination with data on inorganic aerosol constituents and on the particulate mass for source apportionment and chemical mass closure work; (7) in joint studies with other groups (especially within the IGBP-IGAC activities) to examine the relationships between the carbonaceous aerosol and physical aerosol and optical/radiative aerosol characteristics (e.g., condensation nuclei (CN) and CCN concentrations and particle number size distributions, light scattering and absorption coefficients) to assess the contribution of the carbonaceous aerosol to the direct and indirect effects of aerosols on climate.

Project EV/11 - Characterisation and sources of carbonaceous atmospheric aerosols
SPSD II – PART 2 – Global Change, Ecocystems and Biodiversity – Climate 15
2. METHODS AND TECHNIQUES 2.1. Aerosol collections for subsequent chemical analysis A wide variety of aerosol collectors are employed, but those actually used at a given site depend on the logistical support, on the type of measurement (long-term, campaign, aircraft), on the subsequent analyses, and on the co-operating institutions. The collection devices used in the current project included “total” filter samplers, PM10 (particulate matter <10 µm AD) and PM2.5 (particulate matter <2.5 µm AD) filter devices, dichotomous samplers, and two types of cascade impactors. A commonly used filter device was the “Gent” PM10 stacked filter unit (SFU) sampler [Maenhaut et al., 1994; Hopke et al., 1997]. This device separates the aerosol particles into a coarse and a fine size fraction, with the division between the two fractions at around 2 µm AD. Another filter device that provided two size fractions, with the division at 2.5 µm AD, was the high-volume dichotomous sampler (HVDS) [Solomon et al., 1983]. As cascade impactors we used the 12-stage, 11-L/min small deposit area low pressure impactor (SDI) [Maenhaut et al., 1996a], and the 10-stage rotating micro-orifice uniform deposit impactor (MOUDI) [Marple et al., 1991]. Filters of organic material (polycarbonate, Teflon, cellulose, cellulose esters) were used for measuring major, minor, and trace elements and water-soluble inorganic and organic species. For organic and elemental carbon and higher molecular weight organic compounds, the filter material consisted of quartz fibre, glass fibre or Teflon-coated glass fibre. Most filters used had a diameter of 47 mm. This was the case for the Nuclepore polycarbonate filters, Gelman Pall Teflo filters, and Whatman QM-A quartz fibre filters. The filters in the HVDS were 102-mm diameter Gelman Pall quartz fibre filters. The impaction substrates in the cascade impactors consisted of 1.5-µm thick Kimfol polycarbonate films, which were coated with vaseline or paraffin, for the SDI, and of 4-mg/cm2 thick aluminium foils for the MOUDI. Before use, the quartz fibre filters and MOUDI aluminium foils were normally pre-fired for 24 h at 550°C to remove organic contaminants. 2.2. Measurement of in-situ aerosol characteristics and of atmospheric trace
gases A Rupprecht and Patashnick tapered element oscillating microbalance (TEOM, model 1400A), and a Magee Scientific aethalometer (tape-feeder model AE 14U),

Project EV/11 - Characterisation and sources of carbonaceous atmospheric aerosols
SPSD II – PART 2 – Global Change, Ecocystems and Biodiversity – Climate 16
both equipped with a PM2.5 inlet, were used to measure, respectively, the particulate mass (PM) and the absorption coefficient (ba) in-situ and in real time. Both instruments were operated with 5-min time resolution. From the ba data the concentration of BC can be deduced [Hansen et al., 1984]. At some sites and during certain campaigns, other in-situ aerosol optical and physical parameters (e.g., of aerosol light scattering, number of CN and CCN, aerosol number size distributions), vertical column-integrated aerosol characteristics (e.g., aerosol optical depth (AOD)), and concentrations of atmospheric trace gases (e.g., O3, NOx, SO2) were measured by groups with whom we co-operated. 2.3. Bulk chemical analyses The bulk analyses included determination of the particulate mass (PM), of organic carbon (OC) and elemental (or black or soot) carbon (EC or BC), of water-soluble inorganic species (sulphate, nitrate, ammonium) and some water-soluble organic compounds (e.g., methanesulphonate (MSA), lower molecular weight (MW) organic acids), of major, minor, and trace elements, and of selected higher MW organic compounds. Many of these species and elements were measured with techniques and methods which were already used by us before the start of this project. The techniques include gravimetry (for the PM), a simple light reflectance technique (for BC), a thermal-optical transmission (TOT) technique, ion chromatography (IC), particle-induced X-ray emission spectrometry (PIXE), instrumental neutron activation analysis (INAA), gas chromatography with flame ionisation detection (GC-FID) and capillary GC/mass spectrometry (GC/MS). For the structural characterisation of organic compounds use was made of collision-induced dissociation (CID) in combination with tandem mass spectrometry (MS/MS). More details on the various techniques can be found in Maenhaut [1996], Maenhaut et al. [2002e, 2004a] and Kubátová et al. [2000, 2002]. The weighings for the gravimetric PM determination were done with a microbalance (with 1 µg sensitivity) at 20°C and 50% relative humidity (RH), and the filters and impaction substrates were equilibrated at these conditions for 24 hours prior to weighing. The analysis for OC and EC by the TOT technique is described in section 4.1 below. For the determination of water-soluble OC (WSOC) and for the measurement and structural characterisation of organic compounds, methodology was developed as part of the current project. Details on the methods are given in section 4.3.

Project EV/11 - Characterisation and sources of carbonaceous atmospheric aerosols
SPSD II – PART 2 – Global Change, Ecocystems and Biodiversity – Climate 17
2.4. Aerosol chemical mass closure calculations, source identification and source apportionment
The concentrations obtained for OC, EC, sulphate, ammonium, and nitrate, and for indicator elements of important aerosol types (such as Al for crustal matter and Na for sea salt) can be used to examine to which extent the experimentally measured (gravimetric) PM can be reconstituted from the sum of the aerosol components and types, and thus chemical mass closure can be obtained. This work can be done for the fine aerosol as a whole [Maenhaut et al., 2002e], but also for several different size fractions in this fine aerosol, down to about 50 nm [Maenhaut et al., 2002a]. It allows us to determine the percentage contribution of the organic aerosol and of EC to the PM2.5 mass (and to up to 7 size fractions therein). For reconstructing the gravimetric PM in the current project, we normally included the following 8 aerosol components (aerosol types): (1) organic aerosol, which was for urban sites generally estimated as 1.4 OC [Turpin et al., 2000] (for non-urban sites higher OC-to-OM conversion factors were used, up to 1.8); (2) EC; (3) ammonium; (4) nitrate; (5) non-sea-salt (nss-) sulphate, which was obtained by correcting sulphate for the sea salt contribution, whereby the latter was calculated on the basis of the Na data for the aerosol and the sulphate/Na concentration ratio in sea water [Riley and Chester, 1971]; (6) sea salt, estimated as Cl + 1.4486 Na, whereby 1.4486 is the ratio of the concentration of all elements except Cl in sea water to the Na concentration in sea water [Riley and Chester, 1971]; (7) crustal matter = 1.16 (1.90 Al + 2.15 Si + 1.41 Ca + 1.67 Ti + 2.09 Fe), where the factor 1.16 is to compensate for the exclusion of MgO, Na2O, K2O, and H2O from the crustal mass calculation [Chan et al., 1997]; and (8) elements, which is the sum of the mass of all non-crustal/non-sea-salt elements measured by INAA and PIXE (S and K were excluded from this sum). Another major objective is to identify the major sources (or source categories) of the various aerosol components, in particular of the organic aerosol and EC, and to quantify the contributions from these sources. This work was done with multivariate receptor models. Besides absolute principal component analysis (APCA) with VARIMAX rotation [Henry et al., 1984; Maenhaut and Cafmeyer, 1987], also more recent approaches, such as positive matrix factorization (PMF) [Paatero and Tapper, 1994], multilinear engine (ME) [Paatero, 1999], and UNMIX [Henry, 1997], were applied and/or their potential examined. In addition to multivariate modelling, also CMB modelling [Lowenthal et al., 1987; Watson et al., 1984; Maenhaut et al., 1996b] was occasionally applied. The concentrations of the aerosol types and/or of the source categories, as obtained by receptor models, or of good indicators for the aerosol types or source categories

Project EV/11 - Characterisation and sources of carbonaceous atmospheric aerosols
SPSD II – PART 2 – Global Change, Ecocystems and Biodiversity – Climate 18
can also be related to air mass back trajectories in order to assess the source regions and transport pathways. For large data sets (of at least 100 samples collected over long time spans), this can be done by implementing statistical approaches to pinpoint the source areas [Seibert et al., 1994; Stohl, 1996; Polissar et al., 2001]. In the current project, two approaches for identification of source locations and preferred transport pathways of atmospheric particulate trace elements and aerosol species were investigated, namely, versions of the potential source contribution function method (PSCF) and the concentration field method (CF). Both methods are based on combining chemical data with calculated air parcel backward trajectories.

Project EV/11 - Characterisation and sources of carbonaceous atmospheric aerosols
SPSD II – PART 2 – Global Change, Ecocystems and Biodiversity – Climate 19
3. DEVELOPMENT AND DEPLOYMENT OF IMPROVED COLLECTION PROCEDURES FOR CARBONACEOUS AEROSOLS
3.1. Assessment of (and correction) for artifacts by the tandem filter approach
or by the use of a two-port sampling system Two types of approaches can be used to eliminate or at least to assess (and to correct for) the artifacts during collection of carbonaceous aerosols. The first type of approach, which is easiest to implement, is (a) to use two quartz fibre filters in series (Q1Q2) in the sampler (the so-called tandem filter approach) or (b) to resort to parallel samplings with a single quartz fibre filter holder (Q1) and with a Teflon filter with a quartz fibre filter behind it (T-Q3) (a so-called two-port sampling system). Instead of a T-Q3 filter sampler, one can also employ a MOUDI with quartz fibre back-up filter (MOUDI-Q3). The organic carbon collected on Q2 or Q3 can then be used as a measure of the gaseous organics (volatile organic compounds (VOCs) and the gas-phase component of semi-volatile organic compounds (SOCs)) collected by Q1 and subtracted from it to arrive at corrected (i.e., particulate-phase) OC. The two-port variant (b) was examined during winter and summer campaigns on the top roof (at about 15 meters above ground) of the Institute of Nuclear Sciences (INW) in Ghent. From November 2000 until March 2001 (winter 2001), 4 aerosol samplers (all with 47-mm diameter filters) were deployed in parallel. Two of the samplers were equipped with a PM2.5 inlet and operated at a flow rate of 17 L/min; in one of them (Q1Q2) two quartz fibre filters were used in series, the other was a T-Q3 sampler. The other two samplers were “total” filter holders (PMtot collectors), which operated at a flow rate of about 100 L/min; they were a Q1Q2 and a T-Q3Q4 sampler, with Q4 a second quartz fibre filter after the Teflon filter. All quartz fibre filters were pre-fired Whatman QM-A filters; the Teflon filters were Gelman Teflo filters of 2 µm pore size. The collection time per sample was typically 48 h, with start in the morning, and a total of 55 parallel collections were done. For the PM2.5 samplers, it was found that the 1st filter (T) of T-Q3 collected, on average, only 84(±8)% of the PM on the 1st filter (Q1) of Q1Q2, whereas the 2nd filter (Q3) of T-Q3 had 14(±8)% of the PM on Q1. The 2nd filter (Q2) of Q1Q2 had 10(±5)% of the PM on the 1st filter. Again for the PM2.5 samplers, the OC on Q3 was 17(±6)% of the OC on Q1, whereas the OC on Q2 was 8(±3)% of that on Q1. For the results for the PMtot samplers and for a discussion of the data, we refer to Maenhaut et al. [2001]. In summer 2001, similar experiments were done as in winter 2001, but in addition to the filter samplers, also a MOUDI with double back-up filters was deployed. For the PM2.5 filter holders, the 1st filter (T) of T-Q3 collected, on average, 85(±9)% of the

Project EV/11 - Characterisation and sources of carbonaceous atmospheric aerosols
SPSD II – PART 2 – Global Change, Ecocystems and Biodiversity – Climate 20
PM on the 1st filter (Q1) of Q1Q2, whereas the 2nd filter (Q3) of T-Q3 had 24(±9)% of the PM on Q1. The 2nd filter (Q2) of Q1Q2 had 18(±9)% of the PM on the 1st filter. The OC on Q3 was 33(±7)% of the OC on Q1, whereas the OC on Q2 was 17(±3)% of that on Q1. The percentages on Q2 and Q3 are both for the PM and the OC substantially larger in summer than in winter, suggesting that the adsorption artifact (i.e, adsorption of inorganic gaseous species and of VOCs) is higher in summer than in winter. This is likely due to higher concentrations of volatiles in the air during the warm summer than in the cold winter. It is also noteworthy that both for the PM and OC, and both in winter and summer, Q3 has more mass than Q2. That this is the case for OC has commonly been observed in earlier studies with two-port sampling systems [Turpin et al., 2000; and references therein]. According to Turpin et al. [2000], condensable organics might not have reached equilibrium between the gas phase and the adsorbed phase in the vicinity of the Q1Q2 front filter. Quartz fibre filters have a surface area roughly 5 times that of Teflon membrane filters [Turpin et al., 1994], and can therefore be expected to take considerably longer to reach equilibrium. If condensable organics had not yet reached equilibrium in the vicinity of the quartz front filter, the front filter would be depleting the concentration reaching the back-up filter. This would result in higher loadings on T-Q3 back-ups than on Q1Q2 back-ups, as observed. According to Turpin et al. [2000], this logic suggests that a T-Q3 back-up is a better estimate of adsorbed vapor on a quartz fibre filter than a Q1Q2 back-up. A possible alternative explanation for the higher OC mass on Q3 than on Q2 is that the volatilisation of semi-volatile compounds from the particulate phase (and thus the extent of negative artifacts) is greater from the Teflon filter than from the quartz fibre filter. The fact that the PM on T is lower than that on Q1 is consistent with such explanation. If the greater OC mass on Q3 than on Q2 is indeed due to loss of semi-volatile compounds from T, this would imply that subtracting the OC on Q3 from that on Q1 in order to arrive at corrected particulate-phase OC will lead to an overcorrection and thus to too low results. The variant (a), i.e., to use two quartz fibre filters in series (the tandem filter approach), was routinely used throughout the project with all samplers that were deployed for subsequent analysis of carbonaceous species. Incidentally, this was also already the case for the samplers Q1Q2 in the variant (b) just described. In several campaigns, PM2.5, PM10, and PMtot filter holders and one or two HVDS were hereby operated in parallel. The face velocity through the filters in these 4 sampler types was thereby not the same. It was 22 cm/s for the PM2.5 and PM10 samplers, 160 cm/s for PMtot, and 80 cm/s for the fine (PM2.5) size fraction of the HVDS. Also the filter types used were not the same. Pre-fired Whatman QM-A filters (of 47 mm diameter) were used in the PM2.5, PM10, and PMtot filter holders versus pre-fired Gelman Pall quartz fibre filters (of 102 mm diameter) in the HVDS. The

Project EV/11 - Characterisation and sources of carbonaceous atmospheric aerosols
SPSD II – PART 2 – Global Change, Ecocystems and Biodiversity – Climate 21
mean percentages of OC on the second filter, relative to that on the first filter, for the different samplers in the various campaigns are given in Table 1. For the PM2.5 filter holder, for which most data are available, the mean percentages range from 3.2 to 16.7%. At the urban sites (Ghent, Barcelona, Amsterdam) there is clearly a tendency for higher values during summer than during winter. Furthermore, high values are observed for the summer campaigns at the rural sites in the Czech Republic and Hungary (Bily Kriz and K-puszta). This is all likely due to higher ratios of adsorbable VOCs to particulate PM2.5 OC in summer (and at higher temperatures) than in winter. It appears further that the percentages for the PM10 and PMtot samplers are rather similar to those for the PM2.5 sampler. During most of the campaigns, over two thirds of the PM10 or even “total” particulate OC was in the PM2.5 size fraction. The similarity between the percentages for PM2.5 and PM10 is therefore not surprising. For the PMtot sampler, which was operated at a 7 times higher face velocity than the PM2.5 and PM10 devices, lower percentages were expected than for the other two devices. Indeed, according to Turpin et al. [2000], the adsorptive artifact is expected to decrease with increasing face velocity. Similarly, since the fine size fraction in the HVDS was collected at a 3.5 times higher face velocity than in the PM2.5 filter holder, lower percentages were expected for the HVDS. In contrast, there is a tendency for the HVDS to give higher percentages than the PM2.5 sampler. This may be due to the use of a different filter type in the HVDS; the Pall quartz fibre filter used in it may have a higher adsorptive capacity for VOCs than the Whatman QM-A. If all the OC found on the second filter (Q2) in a tandem filter (Q1Q2) set-up is due to the adsorption of gaseous organics and if the amount of these organics that is adsorbed to the first filter (Q1) is the same as that adsorbed on the second filter, and if we further assume that evaporation of semi-volatile OC from the particulate phase on Q1 is negligible in such set-up (and thus also does not contribute to the OC on Q2), then the amount of particulate-phase OC on Q1 can be calculated as the difference between the observed OC amounts on Q1 and Q2. This approach was adopted in this work. The validity of this approach will be addressed below.

Project EV/11 - Characterisation and sources of carbonaceous atmospheric aerosols
SPSD II – PART 2 – Global Change, Ecocystems and Biodiversity – Climate 22
Table 1 : Percentage OC on the 2nd quartz fibre filter, relative to 1st quartz fibre filter, for 4 different samplers in various campaigns.
Campaign PM2.5 PM10 PMtot HVDS(PM2.5) mean ± std. mean ± std. mean ± std. mean ± std.
Ghent win. 2000-2001 7.9 ±2.9 8.7 ±3.2 Ghent summer 2001 16.7 ±3.2 8.0 ±2.9 Ghent summer 2002 16.1 ±4.3 Ghent win./spr. 2003 10.6 ±3.3 Ghent winter 2003 3.2 ±3.9 13.4 ±16.4 7.0 ±2.6 8.7 ±2.3 Ghent winter 2004 7.8 ±3.5 6.7 ±1.6 4.9 ±11.5 9.6 ±2.8 Ghent summer 2004 4.6 ±5.9 5.3 ±4.0 7.2 ±14.0 14.2 ±12.3 Ghent winter 2005 6.2 ±4.3 6.5 ±5.0 6.8 ±15.0 11.1 ±13.6 Ghent summer 2005 10.0± 4.6 Buda. spring 2002 a 15.1 ±2.4 10.3 ±11.7 4.5 ±1.3 17.2 ±4.2 Barc. summer 2004 16.0 ±15.6 Barc. winter 2004 10.7 ±11.8 Amst. summer 2005 11.8 ±14.3 Amst. winter 2006 4.4 ±12.4 Bily Kriz sum. 2003 b 16.7 ±15.7 K-puszta sum. 2003 16.5 ±14.8 12.7 ±15.6 7.8 ±2.5 13.3 ±4.3 SAFARI 2000 4.1 ±1.8 6.7 ±13.1 SMOCC 2002 4.8 ±15.3 5.2 ±5.5 5.9 ±4.3
a Buda., Barc., and Amst. stand for Budapest, Barcelona, and Amsterdam, resp. b Bily Kriz and K-puszta are rural sites in the Czech republic and Hungary, resp. 3.2. Elimination of adsorptive artifacts by the use of a diffusion denuder Another type of approach to correct for (or to eliminate) artifacts is to make use of denuder-based sampling methods, whereby a denuder, a filter, and an adsorbent bed are placed in series. Research on this type of approach was done within International collaboration with the team of Dr. Z. Večeřa (Brno, Czech Republic). For use upstream of the filter, a cylindical dry diffusion denuder was developed; this denuder also contained an oxidant scrubber in order to avoid the oxidation during sampling of the particulate organics collected on the filter. As far as the adsorbent bed is concerned, experiments were done during the summer 2005 campaign in Ghent whereby wet diffusion denuders were used downstream of the filter. In these wet denuders, water and organic solvents (heptane, dodecane) served as adsorbents. Only preliminary results of these wet denuder experiments were available at the completion date of the current project. Therefore, they will not be discussed.

Project EV/11 - Characterisation and sources of carbonaceous atmospheric aerosols
SPSD II – PART 2 – Global Change, Ecocystems and Biodiversity – Climate 23
The dry annular diffusion denuder was developed and tested in the course of 2002. It was developed for use with a 47-mm diameter filter holder with PM2.5 inlet that operates at a flow rate of 17 L/min and for insertion in between the inlet and the filter holder. The denuder consists of two stainless steel tubes (each of 470 mm length x 60 mm I.D. x 63 mm O.D.) in which two tubes (with a diameter of 46 mm and 51 mm, respectively, length 450 mm) from copper wire net are coaxially placed to form an annulus width of 2.5 mm. The space within the inner cupreous net and the space between the outer cupreous net and the stainless steel tube are filled up with a relevant sorbent. Two sorbent sections were used: first a 22-cm long section of Na2SO3 on molecular sieve and then a 68-cm long section of activated charcoal. The collection efficiency of the denuder was examined for sub-ppm concentrations of several VOCs (benzene, toluene, xylene, alkanes (C8-C10), monoterpenes) and for the two major gaseous inorganic oxidants (O3 and NO2), as described by Mikuška et al. [2003], and was found to be larger than 99%. It is estimated that a newly prepared denuder, as used in the current project, retains its efficiency during several months, perhaps up to half a year or more. A drawback of using a denuder is that it disturbs the equilibrium between the gas- and particulate-phase components for semi-volatile compounds, thereby driving volatilisation of particulate material from the filter [Turpin et al., 2000]. In addition, particulate off-gassing artifacts (e.g., for polyaromatic hydrocarbons (PAHs)) can occur inside the denuder [Kamens and Coe, 1997; Strommen and Kamens, 1999]. The latter artifacts will depend upon the residence time of the air within the denuder, which is in our case 1.26 s at the air flow rate of 17 L/min. On the other hand, shortening the denuder would increase the danger of incomplete collection of real VOCs. When using a tandem filter set-up behind the denuder (thus in a DQ1Q2 set-up), the OC found on the back-up filter (Q2) would result from the presence of negative artifacts (volatilisation of organic compounds from the front filter) or from the fact that the collection efficiency of the denuder for some VOCs is lower than 100%. If we assume that the latter can be excluded, and if the negative artifacts prevail for the front filters in a DQ1Q2 set-up, corrected particulate phase OC can then be calculated for the denuded samples as the sum of the OC on the front filter and that on the back filter [Mader et al., 2003]. As indicated in section 3.1, for the undenuded tandem filters (Q1Q2), we calculated corrected particulate phase OC as the difference of the OC on the front filter and that on the back filter. In several campaigns [Maenhaut et al., 2003, 2004b, 2005a; Viana et al., 2006a, 2006b, 2007b], DQ1Q2 and Q1Q2 set-ups were operated in parallel, and it was examined whether the corrected OC data from the two set-ups agreed with each other (and whether the various assumptions that underly the corrections were thus

Project EV/11 - Characterisation and sources of carbonaceous atmospheric aerosols
SPSD II – PART 2 – Global Change, Ecocystems and Biodiversity – Climate 24
indeed valid). The comparison between the data from the two set-ups was done in terms of individual ratios (first filter of Q1Q2)/(first filter of DQ1Q2) and these ratios were averaged over all samples from the same campaign. The average ratios and associated standard deviations for the PM, uncorrected and corrected OC, and EC are shown in Figure 1. The average ratios for corrected OC are overall fairly close to 1.0, generally within 10%. The two major exceptions are for the campaigns in Ghent of summer 2002 and summer 2004. Furthermore, the average ratio for corrected OC is for all campaigns closer to 1.0 than the uncorrected ratio, with the exception of the summer 2002 campaign in Ghent. It can therefore be concluded that the assumptions that underly the corrections (both for the Q1Q2 and DQ1Q2 set-ups) were generally valid. It is further noteworthy that the percentage OC on the second filter, relative to the first filter, was in all campaigns smaller for the DQ1Q2 set-up than for the Q1Q2 set-up. [The data for the Q1Q2 set-up were given in Table 1].
1.031.12
1.00
1.33
1.04 1.09
1.21 1.211.13
1.401.49
1.04
1.56
1.21
1.43
1.23 1.211.12
1.271.21
1.15
1.35
0.82
1.46
0.93
1.171.08
1.17
0.99
1.131.07
0.95
1.081.04
0.86
1.051.11
0.94 0.94 0.99 0.96 0.95 0.92 0.93
0.00
0.20
0.40
0.60
0.80
1.00
1.20
1.40
1.60
02sumGhent
04sumGhent
04sumBarc.
04winBarc.
05sumAmst.
06winAmst.
03win/sprGhent
05winGhent
05sumGhent
03sumBilyKriz
03sumKpuszta
Mea
n ra
tio ±
std
. dev
. PMOCOC_corrEC
Figure 1
Average ratio (1st filter Q1Q2)/(1st filter DQ1Q2) for the PM, OC, corrected OC, and EC in several sampling campaigns [Bily Kriz and K-puszta are rural background sites in the
Czech Republic and Hungary, respectively].

Project EV/11 - Characterisation and sources of carbonaceous atmospheric aerosols
SPSD II – PART 2 – Global Change, Ecocystems and Biodiversity – Climate 25
4. IMPROVED METHODS FOR CHARACTERISATION OF THE CARBONA-CEOUS ATMOSPHERIC AEROSOL
4.1. Improved differentiation between organic carbon (OC) and elemental
carbon (EC) For the measurement of OC and EC in the current project, use was made of the thermal-optical transmission (TOT) technique, thereby employing two TOT instruments from Sunset Lab (OR, U.S.A.), whereby the first instrument (A) was acquired in 1997 and the second one (B) in 2002. These instruments are designed for measuring OC, EC, and total carbon (TC = OC + EC) in aerosol samples that are collected on quartz fibre filters. Powdered solid samples or liquids can also be analysed by the technique after depositing a fraction of the sample on a quartz fibre filter punch. During the stepwise heath treatment of the filter punch (in the first stage in pure He; subsequently in a O2/He mixture of 2% O2 and 98% He), laser light (of 670 nm) is continuously transmitted through the punch and the light transmission is continuously monitored, so that it is possible to correct for the artifact EC that is formed by charring during pyrolysis of organic material in the first stage. The desorbed (first stage) or oxidised (second stage) carbonaceous species are first catalytically oxidised to CO2 and subsequently reduced to CH4 for measurement with an FID detector. When the transmission through the punch reaches the same value as at the start of the analysis, the OC/EC split point is set and the carbon measured up to then is considered as OC, whereas the carbon measured after the split point is considered as EC. This is illustrated in Figure 2, which shows a thermogram for a HVDS sample (fine size fraction) collected at Ghent.
Program ST
0
20
40
60
80
100
120
0 50 100 150 200 250 300 350 400 450 500Time (s)
Lase
r (re
l. un
its)
0
200
400
600
800
1000
1200Te
mp.
(°C
); FI
D (r
el. u
nits
)
HeHe:O2LaserTemp.FIDSplit
Figure 2
Thermogram obtained by TOT analysis with the UGent standard temperature program (ST) for a HVDS quartz fibre filter sample (fine size fraction) collected at Ghent.

Project EV/11 - Characterisation and sources of carbonaceous atmospheric aerosols
SPSD II – PART 2 – Global Change, Ecocystems and Biodiversity – Climate 26
With regard to the differentiation between OC and EC, we participated in intercomparisons with other European groups within the framework of EUROTRAC-2 AEROSOL subproject and we worked on it within International collaboration with the team of Dr. X. Liu (Beijing, China). In the course of 2000 (thus before the start of the current project) we had already observed that the EC/TC ratio obtained in TOT with automatic “split point setting” depends upon the temperature program used, particularly that in the first stage (in pure He) of the analysis, and that the highest EC/TC ratios were obtained for programs with the lowest maximum temperature. This was further investigated in the course of 2001 in co-operation with Prof. H. Puxbaum of Vienna (Austria) and Prof. C. Pio of Aveiro (Portugal). Prof. Puxbaum distributed sections of PM10 high-volume (Hi-Vol) quartz fibre filter samples from Austria (16 from a rural site in Carinthia and 2 from Vienna) and samples of powdered material (reference soot and 4 different samples of leaves). We analysed the various samples with 3 different temperature programs (ST, P2, P3). Program ST is our “standard” program and was also used for the Carbon Shootout Stage I [Schmid et al., 2001]. Its maximum temperature in the first stage is 900°C (maintained during 100 s); the maximum temperature in program P2 was 870°C (maintained during 50 s), whereas it was only 550°C in program P3. The 3 programs were also used for the analysis of powdered samples of Nordic Aquatic Humic Acid and Fulvic Acid. The TOT measurements with the 3 different temperature programs confirmed our observations of 2000. The 3 programs gave the same TC values, but the EC/TC ratio was highest for the program with lowest maximum temperature in the first stage (thus for program P3). Program ST gave TC values and EC/TC ratios for the 16 samples from the Austrian rural site in the ranges of 16-36 µg cm-2 and 0.076-0.132, respectively; for the 2 urban samples the EC/TC ratio was 0.16. The average and associated standard deviation for the ratio (EC/TC with P2) over (EC/TC with ST) were 1.19 ± 0.07 [N=18], and the corresponding results for the ratio (EC/TC with P3) over (EC/TC with ST) were 1.60 ± 0.33 [N=18]. The latter ratio was for the rural Austrian samples clearly dependent upon the date of collection (and thus implicitly on the composition of the aerosol). It was only 0.98 ± 0.12 [N=3] for the samples, which had collected in April, but as high as 1.76 ± 0.14 [N=7] for the samples from fall. Other researchers also found that even for the same thermal-optical technique, such as TOT, the results depend upon the operational parameters, and in particular on the analysis temperature program [Schauer et al., 2003]. In 2003-2004 and within International collaboration with the team of Dr. X. Liu, the effect of the temperature program was therefore further examined [Maenhaut et al., 2004c]. For the new analyses we resorted to samples from widely different origin and we used now 2 different TOT instruments (A and B). We also paid attention to the transit time from the laser to the FID; this is an important parameter, which often seems to be neglected by

Project EV/11 - Characterisation and sources of carbonaceous atmospheric aerosols
SPSD II – PART 2 – Global Change, Ecocystems and Biodiversity – Climate 27
TOT users. The samples were, on the one hand, aerosol samples and, on the other hand, pure OC and EC compounds and mixtures of known composition thereof. The aerosol samples were urban samples from Ghent (3 series), Beijing (2 sites), and Fushun (an industrial town at about 500 km to the north-east of Beijing); rural samples from Hungary (K-puszta) and Austria (i.e., the same samples from Carinthia as studied in 2001); and samples that were taken at a pasture site in Amazonia during the dry (biomass burning) season; all these aerosol samples were collected on quartz fibre filters. The pure OC compound was hippuric acid (C6H5CONHCH2COOH), while the pure EC compounds were Elftex 124 (obtained from Prof. R. Hitzenberger, Vienna) and Flammruss 101 (Degussa); OC/EC mixture #1 consisted of a mixture of hippuric acid and Elftex, with a EC/TC ratio of 0.473 and mixture #2 was a mixture of hippuric acid and Flammruss, with a nominal EC/TC ratio of 0.397. Three different TOT analysis temperature programs were used for the various samples, i.e., our “standard” program (ST); a program called NIOSH2 (N2), which is very similar to the ACE-Asia base case program of Schauer et al. [2003] and to program P2 mentioned above; and a program called ACE-Asia alternate3 (A3), which is identical to the one used by Schauer et al. [2003] and similar to program P3. The detailed temperature steps for the 3 programs are given in Table 2.
Table 2 : Temperature programs used for TOT analysis.
Ghent standard (ST) NIOSH2 program (N2) ACE-ASIA alternate3 (A3) gas time (s) temp (°C) gas time (s) temp (°C) gas time (s) temp (°C)
He 60 250 He 60 310 He 60 120 He 50 500 He 60 480 He 60 250 He 60 650 He 60 615 He 60 450 He 100 900 He 90 870 He 90 550 He 50 0 He 40 0 He 45 0 He 5 600 He:O2 45 550 He:O2 45 550 He:O2 30 600 He:O2 45 625 He:O2 45 625 He:O2 30 700 He:O2 45 700 He:O2 45 700 He:O2 40 850 He:O2 45 775 He:O2 45 775 He:O2 75 900 He:O2 45 850 He:O2 45 850 He:O2 120 900 He:O2 120 900
After determining the laser-FID transit times for our two TOT instruments, fairly similar EC/TC ratios were obtained when analysing the same sample with the same temperature program on both instruments. The agreement was typically within 10%. The ranges for TC and for EC/TC, as obtained with our program ST and instrument A, for each of 9 series of aerosol samples are given in Table 3. Figure 3 shows the

Project EV/11 - Characterisation and sources of carbonaceous atmospheric aerosols
SPSD II – PART 2 – Global Change, Ecocystems and Biodiversity – Climate 28
average ratios (EC/TC with N2) / (EC/TC with ST) and (EC/TC with A3) / (EC/TC with ST), as obtained with our instrument A for the 9 series of aerosol samples. The EC/TC ratios obtained with program N2 are only slightly larger (by 5 – 8%) than those obtained with program ST, while with program A3, the EC/TC ratios are 1.5 to 2 times larger. In the study of Schauer et al. [2003], about 50% larger EC/TC ratios were obtained with program A3 than with the base case program for their ambient (urban) samples. It further appears that the differences between A3 and ST are of the same order for the urban and rural samples. For the samples for rural Austria, the difference depended upon the time of sample collection, though, in agreement with our observations in 2001. For the pure OC and EC compounds, the EC/TC ratios were very close to 0 and to 1, respectively, and this with each of the 3 analysis programs. As to the results for the 2 mixtures of pure compounds, for program N2 there was good agreement (within 5%) between the experimental and nominal EC/TC ratios, whereas for program A3, there was clearly a tendency to obtain higher EC/TC ratios than the nominal values.
Table 3 : Ranges for TC and for EC/TC, as obtained with our program ST and instrument A, for 9 series of aerosol filter samples [Note: The data for BeijingSite2 and Fushun are from program N2
instead of ST, as these 2 series were not analysed with program ST].
no. of Range Range Sample series samples TC (µg/cm2) EC/TC
Ghent#1 6 39 – 67 0.12 –0.30 Ghent#2 26 9 – 69 0.11 –0.34 Ghent#3 10 15 – 52 0.10 –0.35 BeijingSite1 5 46 – 160 0.15 –0.23 BeijingSite2 10 12 – 67 0.066 –0.16 Fushun 10 32 – 120 0.089 –0.48 Hun/Ama#1 10 14 – 110 0.034 –0.074 Hun/Ama#2 10 15 – 92 0.024 –0.061 Austria 16 16 – 36 0.076 –0.13
Since our 2003-2004 study, several other workers have also performed research on the discrimination between OC and EC. Watson et al. [2005] gave a summary of organic and elemental carbon/black carbon analysis methods and intercomparisons and conclude that further work is needed. In the meantime, there is a consensus that the method used should be clearly indicated when reporting OC and EC data. For the samples analysed in our various aerosol studies, our “standard” program (ST) was used.

Project EV/11 - Characterisation and sources of carbonaceous atmospheric aerosols
SPSD II – PART 2 – Global Change, Ecocystems and Biodiversity – Climate 29
1.04 1.05 1.08 1.06 1.08 1.061.58 2.02 1.67 1.86 1.71 1.530.0
0.2
0.4
0.6
0.8
1.0
1.2
1.4
1.6
1.8
2.0
2.2
2.4
2.6
Gent#1 Gent#2 Gent#3 BeijingSite1 BeijingSite2 Fushun Hun/Ama#1 Hun/Ama#2 Austria
Mea
n ra
tio ±
std
. dev
.N2 A3
Figure 3
Average ratios (EC/TC with N2) / (EC/TC with ST) and (EC/TC with A3) / (EC/TC with ST), as obtained with the UGent TOT instrument A, for 9 series of aerosol samples.
In 2006 we contributed to an intercomparison exercise for EC and/or BC, for which the field work took place in winter in Vienna. Samples taken on pre-fired Whatman QM-A quartz fibre filters were analysed by us by TOT, using the N2 and A3 temperature programs. There was a large variation in the EC (or BC) levels obtained by the various participants, especially on cold days when there was substantial wood burning in the area. The differences were explained by the contribution from brown wood-burning carbon to the BC measured with some techniques. An article on this work is in press [Reisinger et al., 2007]. 4.2. Methods for the separation of the organic carbon (OC) in water-soluble
and insoluble fractions (WSOC and WinsOC) and for the further separation of each fraction in major classes
The UGent team developed a method for the determination of WSOC in aerosol samples. For this method use is made of the “Total Organic Carbon (TOC) analyser” of Shimadzu (model TOC-V CPH), which was delivered in December 2001. In the first phase of the method development, it was examined which aqueous extraction procedure (manual shaking or ultrasonic agitation) is most appropriate. This work involved intercomparisons with the teams of Dr. M.C. Facchini and Dr. S. Fuzzi of the Institute of Atmospheric Sciences and Climate (ISAC), Bologna, Italy, and of Prof. M.O. Andreae of the Max Planck Institute for Chemistry (MPIC), Mainz, Germany. (These teams had already developed or were developing their own methods for WSOC). On the basis of the results obtained it was decided that the UGent team would resort to manual shaking in ultrapure water and subject the sample to WSOC

Project EV/11 - Characterisation and sources of carbonaceous atmospheric aerosols
SPSD II – PART 2 – Global Change, Ecocystems and Biodiversity – Climate 30
analysis within 2 hours of the sample extraction. This approach was subsequently applied throughout the project. It was applied to PM2.5 aerosol samples, which had been collected with a HVDS in sampling campaigns at two urban sites (Budapest, Hungary, in spring 2002, and Ghent, in winter 2003, winter 2004, summer 2004, winter 2005), at a rural site (K-puszta near Kecskemét, Hungary, in summer 2003) and at sites in South Africa (during the SAFARI 2000 dry season (biomass burning) campaign) and in Brazil (during the SMOCC 2002 campaign). Double pre-fired 102-mm diameter Gelman Pall quartz fibre filters (type 2500QAT-UP) were used for all collections and the collection time per sample was 12 or 24 hours (depending upon the campaign and/or the atmospheric aerosol levels). The double filters (front and back) were used to assess the extent of the artifacts in the collection of the carbonaceous aerosol (see section 3.1). The front and back filters of all PM2.5 samples (and field blanks) were analysed for OC and EC with the TOT technique. For the measurement of WSOC, filter punches of 1 or 1.5 cm2 were placed in a 15 mL polystyrene tube, 5 mL Millipore Simplicity water was added and the tube was hand-shaken during 5 min, after which it was allowed to stand for 30 min. The sample extract was then filtered through a PVDF syringe filter (pore size 0.2 µm) and the filtered extract was analysed using the Shimadzu TOC Analyzer. Measurements were done for total water-soluble carbon (TCWS) and inorganic water-soluble carbon (ICWS). Total water-soluble organic carbon (TOCWS) was calculated as the difference between the two, thus: TOCWS = TCWS - ICWS, and was used as WSOC [Viana et al., 2006a]. The median concentrations (and ranges) in µg/m3 for PM2.5 TC, as deduced from the “front” filters, were in the different campaigns as follows: 8.8 (3.4 – 23) for Budapest 2002; 4.3 (2.1 – 17) for Ghent 2003 winter; 5.4 (2.4 – 12) for Ghent 2004 winter; 3.1 (1.5 – 5.4) for Ghent 2004 summer; 4.1 (1.1 – 20) for Ghent 2005 winter; 4.4 (2.0 – 7) for K-puszta 2003; 6.5 (1.2 – 33) for SAFARI 2000; and 15 (0.9 – 68) for SMOCC 2002. Table 4 gives a summary of other data that were derived from TOT and TOC analyses. EC on the back filters was insignificant for all samples. At the rural Hungarian site and in the dry season (biomass burning) campaigns in South Africa and Brazil a much larger percentage of the front filter OC was water-soluble that at the urban sites, i.e., on average 60-70% versus 35-43%. The percentages OC on the back filter (relative to the front filter) were highest for Budapest (where the samples were taken in spring in a street canyon) and for K-puszta 2003 summer, which indicates that the artifacts (presumably mainly positive artifacts) were largest during these two campaigns. Interestingly, for WSOC systematically greater Back/Front ratios are noted than for OC. If we assume that the artifacts are predominantly positive, this seems to suggest that the adsorbed VOCs are more water-soluble than the particulate organic carbon.

Project EV/11 - Characterisation and sources of carbonaceous atmospheric aerosols
SPSD II – PART 2 – Global Change, Ecocystems and Biodiversity – Climate 31
Table 4 : Averages and associated standard deviations for selected parameters during 8 sampling campaigns, as derived from the analysis
of HVDS fine fraction (PM2.5) quartz fibre filter samples.
Campaign EC/TC %WSOC (of OC) OC ratio WSOC ratio (Front filter) (Front filter) Back/Front (%) Back/Fr. (%) Budapest 2002 0.34 ± 0.12 36 ± 8 17.2 ± 4.2 28.4 ± 6.7 Ghent 2003W 0.18 ± 0.08 35 ± 8 8.7 ± 2.3 16.1 ± 5.4 Ghent 2004W 0.16 ± 0.08 38 ± 7 9.6 ± 2.8 17.1 ± 7.2 Ghent 2004S 0.26 ± 0.08 43 ± 7 14.2 ± 2.3 21.5 ± 5.3 Ghent 2005W 0.21 ± 0.12 43 ± 9 11.1 ± 3.6 18.0 ± 7.1 K-puszta 2003 0.049 ± 0.014 61 ± 9 13.3 ± 4.3 19.3 ± 6.3 SAFARI 2000 0.082 ± 0.026 70 ± 8 6.7 ± 3.1 8.2 ± 3.9 SMOCC 2002 0.040 ± 0.011 68 ± 8 5.9 ± 4.3 7.2 ± 7.4 At the start of the project it was also planned to develop and implement methods for the fractionation of the WSOC and WinsOC in major classes of compounds. In the course of 2001, both the UA and UGent teams became partners of the project “Smoke Aerosols, Clouds, Rainfall and Climate: Aerosols from Biomass Burning Perturb Global and Regional Climate” (SMOCC) within the 5th Framework programme of the EU. Dr. Facchini, Dr. Fuzzi and their team from ISAC were also partners in SMOCC and were doing the fractionation of WSOC and WinsOC. It was therefore decided that the UA and UGent teams would not do this work themselves, but would do it in co-operation with the ISAC team. 4.3. More complete molecular characterisation of the organic carbon (OC), with
special emphasis on organic compounds with high molecular weight or high polarity
An improved analytical method was developed and validated for the determination of the monosaccharide anhydrides levoglucosan, mannosan, and galactosan in atmospheric aerosol samples [Zdráhal et al., 2002]. The method uses an external recovery standard, extraction in dichloromethane, trimethylsilylation, addition of an internal standard (1-phenyl dodecane), and analysis by gas chromatography with FID and MS detection. As external recovery standard, we selected 1,2,3-trihydroxyhexane, which has a similar polarity as the monosaccharide anhydrides; furthermore, it was ensured that the trimethylsilylation step leads to complete derivatisation into trimethylsilyl ethers. The reproducibility of the combined trimethylsilylation and analysis of levoglucosan was about 2% for standard solutions, whereas the precision of the entire method for the sum of all three monosaccharide anhydrides (MAs) in real aerosol filter samples was about 5%. The method was

Project EV/11 - Characterisation and sources of carbonaceous atmospheric aerosols
SPSD II – PART 2 – Global Change, Ecocystems and Biodiversity – Climate 32
applied to aerosol samples from urban and tropical locations. The atmospheric concentration of the MAs in fine (<2.5 µm) aerosols at a primary forest site in Rondônia, Brazil, was on average 2.15 µg m-3 during the dry season when intensive biomass burning occurs, which was almost 400 times higher than during the wet (nonburning) season. Urban total (PMtot) aerosols collected in Ghent, Belgium, showed an average atmospheric concentration of MAs of 0.56 µg m-3 for the winter season, which was a factor of 20 higher than for the summer season. The carbon in the MAs accounted on average for about 5.1% and 1.8% of the organic carbon in the Brazilian dry season and Ghent winter aerosols, respectively. Levoglucosan was the major MA, with a relative abundance in the range of 76-93%. Subsequently, we developed and validated a GC/ion trap MS method for the determination of levoglucosan and the related monosaccharide anhydrides, mannosan, galactosan, and 1,6-anhydro-β-D-glucofuranose, in urban atmospheric aerosols collected on quartz fibre filters [Pashynska et al., 2002]. The method is based on extraction with dichloromethane-methanol (80:20, v/v), trimethylsilylation, multiple reaction monitoring in the tandem MS mode using the ion at m/z 217, and the use of an internal standard calibration procedure with the structurally related compound methyl-β-L-arabinopyranoside. In addition, the method allows the quantification of other saccharidic compounds, arabitol, mannitol, glucose, fructose, inositol, and sucrose, which were found to be important in summer aerosols. The recovery of levoglucosan was estimated by spiking blank filters and was better than 90%. The precision evaluated by analysing parts of the same filters was about 2-5% for the monosaccharide anhydrides and 7-8% for the other saccharidic compounds. The method was applied to urban PM10 aerosols collected at Ghent, Belgium, during a 2000-2001 winter and a 2001 summer episode and revealed interesting seasonal variations. While monosaccharide anhydrides were relatively more important during the winter season owing to wood burning, the other saccharidic compounds were more prevalent during the summer season, with some of them, if not all, originating from the vegetation. The method was further applied to samples of the SAFARI 2000 campaign and of the SMOCC project, including those of the LBA-SMOCC 2002 campaign in Rondônia, Brazil. For the analysis of the latter samples, the method was modified. Instead of detection in the MS/MS multiple reaction monitoring mode (at m/z 217) the “full scan” was used, as its sensitivity suffices for the anhydrosugars levoglucosan, galactosan, and mannosan, which are the dominant water-soluble compounds in biomass burning aerosols. Also, methyl-β-xylanopyranoside was used as internal standard, because methyl-β-L-arabinopyranoside coelutes with 2-methylerythritol, which is present in substantial amounts in tropical aerosols (see Chapter 5). This modified method was further applied to the HVDS samples from the 2003 summer campaign at K-puszta, Hungary, and to other quartz fibre samples

Project EV/11 - Characterisation and sources of carbonaceous atmospheric aerosols
SPSD II – PART 2 – Global Change, Ecocystems and Biodiversity – Climate 33
from forested sites in Finland and Germany (see section 6.4 for details on the latter samples). Since it was also the aim to perform analyses for anhydrosugars for MOUDI samples, whereby the collection substrates consist of aluminium foils, the modified method was further adjusted for those MOUDI samples. The adjusted method is based on ultrasonic extraction with dichloromethane-methanol (80:20, v/v), trimethylsilylation, selected ion monitoring with use of specific ions, and use of an internal standard calibration procedure with the structurally related compound methyl-β-L-xylanopyranoside. The following compounds were measured in the MOUDI samples: levoglucosan, erythritol, 2-methylthreitol, 2-methylerythritol, arabitol, mannitol, and malic acid. We also developed a GC/MS method for the quantitative determination of organic acids in atmospheric aerosols. The method is based on the use of internal recovery standards, extraction with methanol with ultrasonic agitation, trimethylsilylation and GC/MS analysis in the full scan mode. With this new method three classes of compounds are determined, i.e., 3 dicarboxylic acids (succinic, fumaric, glutaric), 7 hydroxycarboxylic acids (glyceric, β-hydroxyglutaric, malic, 2 isomers of threonic acid (i.e., the threo and erythro forms of 2,3,4-trihydroxybutyric acid), α-hydroxyglutaric, and tartaric) and 5 phenolic acids (o-hydroxy benzoic, m-hydroxybenzoic, p-hydroxybenzoic, and the vanillic acids (2 isomers)). Deuterated glutaric acid, deuterated malic acid, and tropic acid are used as recovery standards for the three classes of compounds. The method was applied to HVDS samples, which were collected during the SAFARI 2000 campaign in South Africa and the SMOCC 2002 campaign in Rondônia, Brazil. We also contributed to the development of a novel method for the determination of levoglucosan in aerosol samples [Scholnik et al., 2005]. In this new method the aerosol samples are extracted with water and use is made of separation with ion-exclusion high-performance liquid chromatography (IEC-HPLC) and spectroscopic detection at 194 nm. The method was applied to HVDS and MOUDI samples from the SMOCC 2002 campaign and a comparison was made with results obtained by GC/ion trap MS. The UGent team also developed methods, based on ion chromatography (IC), for the determination of non-substituted and substituted C2-C5 dicarboxylic acids and other low-molecular weight (LMW) organic acids in the WSOC. Initially, use was made of a Dionex AS11 separation column and a gradient of hydroxide and methanol. The method was applied to aerosol samples that had been collected in Ghent in 1999-2000 and in South Africa during the SAFARI 2000 campaign. For the latter samples concentration data were obtained for oxalic, malonic, succinic, glutaric, glyoxylic,

Project EV/11 - Characterisation and sources of carbonaceous atmospheric aerosols
SPSD II – PART 2 – Global Change, Ecocystems and Biodiversity – Climate 34
pyruvic, malic, tartaric, and methanesulphonic acid. Because of various problems with the use of methanol, it was decided to switch to a pure hydroxide gradient and at the same time to make use of a EG40 KOH eluent generator. For simultaneous separation of inorganic and short-chain organic anions, investigations were done with various gradients (linear and exponential ones) and durations (between 20 and 40 min), but it was decided to retain a 0.22-26 mM KOH gradient (0.5 mL/min) with a duration of 25 min for analysing the actual samples. This method was applied to HVDS and MOUDI samples that had been collected during 2004 summer and 2005 winter campaigns in Ghent and during a 2003 summer campaign at K-puszta, Hungary.

Project EV/11 - Characterisation and sources of carbonaceous atmospheric aerosols
SPSD II – PART 2 – Global Change, Ecocystems and Biodiversity – Climate 35
5. IDENTIFICATION OF NEW ORGANIC COMPOUNDS IN CONTINENTAL AEROSOLS THAT CAN BE USED AS MARKERS FOR SPECIFIC SOURCES, SOURCE TYPES OR PROCESSES, AND/OR ATMOSPHERIC PROCESSES
Tropical aerosols, which had been collected in the dry season (September-October 1999) in Rondônia, Brazil, were examined for novel organic compounds, which are formed by photo-oxidation and biomass burning processes and which could be used as markers for such processes. The aerosol filter samples were extracted with dichloromethane and the final extract was methylated with diazomethane and analysed with GC/MS/MS. Use was made of CID in the first field-free region of the mass spectrometer with helium as collision gas and the CID spectra were obtained via B/E coupled scanning. Tricarboxylic acids (TCAs) were present as a fairly important group in the fine fraction (<2.5 µm AD) aerosol filter samples. Electron impact (EI) mass spectra of the methyl esters were used for the structural elucidation and selected ions were subjected to CID. Deuterated methyl esters were prepared to substantiate the proposed fragmentation path. Besides α-cleavages and H-rearrangements, neutral losses of CO and CH3OH were observed for all compounds. The tricarboxylic acid TCA2 was identified as 1,1,2-ethane tricarboxylic acid on the basis of a library search. The structures of TCA1 and TCA3 were tentatively assigned as methanetricarboxylic acid and 1,1,2-propanetricarboxylic acid. The tricarboxylic acids occur likely in the aerosol as organic salts. Because of their polarity these acids can contribute to the hygroscopic properties of the fine aerosol and influence the formation of clouds [Zdráhal et al., 2001]. Previously unobserved water-soluble organic compounds were characterised in aerosol samples, which had been collected in Amazonia during the wet season in the LBA-CLAIRE-1998 and -2001 field campaigns. The characterisation of the novel compounds as enantiomeric 2-methyltetrols (threo and erythro) was based on the detailed interpretation of the mass spectrometric and gas chromatographic behaviour of their trimethylsilyl derivatives, and was confirmed by comparison with authentic reference compounds. These compounds were synthetised from 2-methyl-2-vinyloxirane (isoprene oxide) following a peroxidation/hydrolysis procedure. Besides the 2-methyltetrols we detected also known hydroxydicarboxylic acids (e.g., malic, α-hydroxyglutaric, and tartaric) and we also tentatively characterised a novel dihydroxy dicarboxylic acid as 2,3-dihydroxyglutaric acid. The 2-methyltetrols were enriched in the fine particle size fraction (<2.5 µm), which suggests that they are formed by a gas-to-particle conversion process, and they accounted for about 2% of the OC mass. The median atmospheric concentration of the 2-methyltetrols, as obtained for total filter samples, which had been collected by the UGent team during the LBA-

Project EV/11 - Characterisation and sources of carbonaceous atmospheric aerosols
SPSD II – PART 2 – Global Change, Ecocystems and Biodiversity – Climate 36
CLAIRE-1998 field campaign, was 31 ng m-3 (range 14-83 ng m-3; N=10). The formation of the 2-methyltetrols, which have retained the C5 isoprene skeleton, can be explained by the photo-oxidation of isoprene, which is emitted in large amounts by the rain forest vegetation [Claeys et al., 2004a]. It was estimated that the atmospheric concentration of the 2-methyltetrols corresponds to 0.2% of the isoprene mixing ratio (calculated for an isoprene mixing ratio of 5 ppb). It was suggested that in contrast to widespread assumption, isoprene participates in the formation of aerosols above forests. The 2-methyltetrols were also observed in samples of the dry season SMOCC 2002 campaign and of the 2003 summer field campaign at K-puszta, Hungary. The MS fragmentation behaviour of the trimethylsilyl derivatives of the 2-methyltetrols was studied in detail and NMR measurements of the 2-methyltetrols were performed [Wang et al., 2004]. In the aerosols from the summer field campaign at K-puszta a novel polar organic compound was characterised, i.e., 2-methylglyceric acid (also called 2,3-dihydroxymethacrylic acid), which can be considered as a secondary oxidation product of isoprene. This dihydroxycarboxylic acid is explained by further oxidation of methacrolein, which is formed by gas-phase oxidation of isoprene [Claeys et al., 2004b]. In the SMOCC 2002 and K-puszta samples other compounds were observed, i.e. C5-alkene triols, which are ascribed to photo-oxidation of isoprene. In a first instance it was thought that these other compounds were dehydrated 2-methyltetrols, which were possibly formed by acid-catalyzed dehydration of the tetrols, either during the sample collection or during the storage of the samples. Later on, it was thought more plausible that the observed compounds were formed by acid-catalyzed ring-opening of epoxydiol derivatives of isoprene. Additional experiments confirmed that the latter interpretation was indeed more plausible [Wang et al., 2005]. The UA team started a co-operation with the National Exposure Research Laboratory of the U.S. Environmental Protection Agency (US EPA) with the aim to confirm the origin of the 2-methyltetrols and 2-methylglyceric acid, which first had been observed in field campaigns. Smog chamber experiments were carried out with isoprene in the presence of NOx and air, and in the presence or absence of SO2, to determine the SOA yield from isoprene and to evaluate whether the 2-methyltetrols and 2-methylglyceric acid are present in isoprene SOA. In absence of SO2 the SOA yield was, as expected, low (only 0.2%), but in the presence of SO2 (which by oxidation is converted to sulphuric acid) the SOA yield increased considerably to 2%. Analysis of the SOA samples after trimethylsilylation by means of GC/MS showed 2-methyltetrol chamber concentrations of 0.1 μg/m3 and a 2-methylglyceric acid concentration of 0.3 μg/m3 in absence of SO2, and significantly increased concentrations of

Project EV/11 - Characterisation and sources of carbonaceous atmospheric aerosols
SPSD II – PART 2 – Global Change, Ecocystems and Biodiversity – Climate 37
respectively 4.8 μg/m3 and 0.9 μg/m3 after addition of SO2. The results show that the compounds can serve as marker compounds for isoprene SOA and that the presence of SO2 significantly increases the SOA that is formed through photo-oxidation of isoprene [Edney et al., 2005].


Project EV/11 - Characterisation and sources of carbonaceous atmospheric aerosols
SPSD II – PART 2 – Global Change, Ecocystems and Biodiversity – Climate 39
6. AEROSOL CHARACTERISATION STUDIES IN EUROPE 6.1. Aerosol studies in Ghent The improved method of Zdráhal et al. [2002] for measuring monosaccharidic anhydrides (MAs) was applied on PM10 filter samples, which had been collected in 1998 during winter and summer sampling campaigns in Ghent. The average concentration of the MAs was 560 ng m-3 in winter and 25 ng m-3 in summer. The MAs accounted, on average, for 2.9% of the organic matter (OM) in winter versus only 0.5% in summer, and levoglucosan was the prevailing MA, with a relative abundance of 85% in winter and 76% in summer. Fine et al. [2001] reported concentrations of levoglucocan in fine particle (PM2.5) emissions from fireplace combustion of wood in the northeastern United States. They found an average concentration of 100 ± 40 mg of levoglucosan/g of OC in the emitted particles, which corresponds to 44 ± 18 mg of levoglucosan carbon/g of OC. If we assume that the composition of wood burning emissions in Ghent is roughly similar to that from the fireplaces in the northeastern United States, we can derive a first, rough estimate for the contribution of wood combustion to the OC in Ghent during winter and arrive at an average percentage contribution of 35%. Clearly, this contribution should be verified by further work. In their source apportionment study for the fine OC of the year 1982 in the Los Angeles area, Schauer et al. [1996] attributed 19% and 22% of the OC to wood smoke for the Pasadena and West Los Angeles sites, respectively. PM10 filter samples from Ghent were also analysed by the GC/ion trap method of Pashynska et al. [2002]. The method was applied to 9 samples of a 2000-2001 winter sampling campaign and 10 samples of a 2001 summer campaign. The atmospheric concentrations of the monosaccharidic anhydrides and their percentage contributions to the OC were higher in winter than in summer, as was also observed in our study on samples from 1998 [Zdráhal et al., 2002]. The results indicate that the contribution of wood combustion to the aerosol in Ghent is much larger in winter than in summer. For the other saccharidic compounds (i.e., arabitol, mannitol, glucose, fructose, inositol, and sucrose) the atmospheric concentrations and percentage contributions to the OC were larger in summer than in winter. The atmospheric levels of glucose, fructose, inositol, and sucrose (and their contributions to the OC) were highest in the beginning of summer (in June), whereas the highest levels (and contributions to the OC) for the sugar alcohols (i.e., arabitol and mannitol) were noted later in the summer (i.e., in July-September). The sugar alcohols arabitol and mannitol are mainly attributed to fungal spores. The source of the other saccharidic compounds, glucose, fructose, inositol, and sucrose, is most likely grass pollen, which are known to be present in highest concentrations in the beginning of summer. The carbon in

Project EV/11 - Characterisation and sources of carbonaceous atmospheric aerosols
SPSD II – PART 2 – Global Change, Ecocystems and Biodiversity – Climate 40
the saccharidic compounds contributed, on average, 3.6% of the OC during winter and 5.7% of the OC during summer. Expressed as percentages of organic aerosol mass (organic matter, OM), thereby using a multiplying factor of 1.4 to convert the measured OC value into OM, the average contributions of the saccharidic compounds to the OM amount to 5.4% during winter and 8.9% during summer. In a previous study at the same Ghent sampling site [Kubátová et al., 2002], it was found that the identified extractable and elutable organic matter represented 3.1% of the OM during both a 1998 winter and a 1998 summer episode. About 100 compounds were quantified in that study, which belonged to seven classes, i.e. (1) n-alkanes, (2) fatty acids, (3) dicarboxylic and oxocarboxylic acids, (4) diterpenoic acids, (5) lignin pyrolysis products, (6) polyaromatic hydrocarbons, and (7) other compounds. Phthalates were the major contributers to the class of other compounds, and the class of the fatty acids was the most prominent of the seven classes, particularly during winter. The present study indicates that the saccharidic compounds contribute more to the OM than the sum of the above seven classes measured in the study of Kubátová et al. [2002]. During summer the contribution of the saccharidic compounds was nearly three times larger than that of the seven classes combined. In 2004 winter and summer and 2005 winter, extensive sampling campaigns were conducted in Ghent, whereby different filter samplers and two types of cascade impactors were deployed. The filter samplers in 2004 winter consisted of Gent PM10 SFU samplers, a HVDS, and PM2.5, PM10, and PMtot 47-mm diameter filter samplers. During 2004 summer and 2005 winter, in addition a PM2.5 47-mm diameter filter sampler with diffusion denuder and Hi-Vol PM2.5 and PM10 15-cm diameter filter samplers were deployed. Furthermore, in all three campaigns, samples were collected with two types of cascade impactors, a MOUDI and an SDI. The samples of the MOUDI and of all filter holders (with the exception of those of the HVDS) were analysed for the PM by weighing with a microbalance. All quartz fibre filter samples were analysed for OC and EC with the TOT technique. The samples of both Hi-Vol 15-cm diameter filter collectors and the fine filters of the HVDS were also analysed for WSOC with a TOC analyser. The results for OC, EC, and WSOC for a number of the samplers were briefly discussed in sections 3.1, 3.2, and 4.2 above and in more detail by Viana et al. [2006a, 2007b]. The samples from the SFU collectors were analysed by PIXE and IC, and the SDI samples were analysed by PIXE. Selected MOUDI samples and fine filters of the HVDS were also subjected to IC analyses for LMW organic acids. The samples from the Hi-Vol PM2.5 and PM10 15-cm diameter filter collectors were analysed by inductively-coupled mass spectrometry (ICP-MS), inductively-coupled atomic emission spectrometry (ICP-AES), and IC. These analyses were done in the “Institute of Earth Sciences Jaume Almera” (IJA) in Barcelona, Spain. The mass size distributions for the PM and the

Project EV/11 - Characterisation and sources of carbonaceous atmospheric aerosols
SPSD II – PART 2 – Global Change, Ecocystems and Biodiversity – Climate 41
elements, as derived from the MOUDI and SDI samples are discussed by Raes and Maenhaut [2007]. 6.2. Aerosol studies at EUROTRAC-2 AEROSOL intercomparison sites In April 2000 the AEROSOL Intercomp 2000 campaign took place in Melpitz, at about 80 km north-east of Leipzig. Eight European research teams, including the UGent team, participated in the field campaign. The UGent team performed measurements in situ and in real time for the PM and BC with a TEOM and aethalometer, respectively (both instruments were equipped with a PM2.5 inlet). Besides, aerosol samples were taken in parallel with various types of collectors. The samples were analysed in the laboratory for the following parameters: PM, OC and EC, BC, water-soluble inorganic anions and cations, and up to 50 elements. The UGent data were compared with those of the other participating teams and the results of this work were published in a special issue of Atmospheric Environment. The UGent team contributed to 5 papers of this special issue [i.e., Müller et al., 2004; Hitzenberger et al., 2004; ten Brink et al., 2004; Wieprecht et al., 2004; Schaap et al., 2004]. The experience of a number of EUROTRAC-2 AEROSOL subproject groups, who were dealing with carbonaceous aerosol measurements, was alo written up for the EUROTRAC Newsletter [ten Brink et al., 2002/2003]. 6.3. Aerosol studies in Hungary In the spring of 2002 a field campaign, with emphasis on the carbonaceous aerosol, was undertaken at two sites in Budapest. The work was done within International collaboration with the team of Prof. I. Salma (Budapest, Hungary). The two sites were a kerbside (Rákoczi street), where the equipment of the UGent team was installed, and an urban background site (FKFI campus), where aerosol collectors of the team of Prof. Salma were set up. The UGent equipment was installed at 7.5 m above street level. A TEOM and an aethalometer (both equipped with PM2.5 inlet) were used for the measurement in situ and in real time of the PM and BC. Besides, aerosol collections in parallel were made with MOUDI and SDI cascade impactors and several filter samplers. The filter samplers included PM2.5, PM10, and PMtot filter holders with two pre-fired Whatman QM-A quartz fibre filters in series, two Gent PM10 SFU samplers (one with coarse and fine Nuclepore polycarbonate filters in series, the other with a coarse Nuclepore polycarbonate filter and a fine Gelman Pall Teflo filter (pore size 2 µm) in series), and a HVDS with double pre-fired Gelman Pall quartz fibre filters. The campaign started on 23 April and lasted until 5 May. Separate day-time and night-time collections were made and 23 samples were taken with each sampler. The samples of the MOUDI and of all filter holders (with the exception of

Project EV/11 - Characterisation and sources of carbonaceous atmospheric aerosols
SPSD II – PART 2 – Global Change, Ecocystems and Biodiversity – Climate 42
those of the HVDS) were analysed for the PM by weighing with a microbalance. All quartz fibre filter samples were analysed for OC and EC with the TOT technique. The fine filters of the HVDS were also analysed for WSOC with a TOC analyser; in addition, they were subjected to some other analyses by the team of Prof. Salma and other Hungarian teams. The samples from the SFU collectors were analysed by INAA, PIXE, and IC, and the SDI samples were analysed by PIXE. The results of the various analyses are described and discussed in several publications [Salma et al., 2004, 2005, 2006, 2007; Maenhaut et al., 2005b; Salma and Maenhaut, 2006; Krivácsy et al., 2007]. In collaboration with two Hungarian teams, i.e., of Prof. I. Salma (Budapest) and of Prof. A. Gelencsér (Veszprém), an intensive field campaign was conducted in 2003 summer at K-puszta, a continental background site at 15 km north-east of Kecskemét. The UGent team deployed the same instrumentation and samplers as in the 2002 spring campaign at the Budapest kerbside, and in addition a denuded PM2.5 filter holder (DQ1Q2) with two pre-fired Whatman QM-A quartz fibre filters in series. The campaign lasted from 4 June until 10 July, the collection time per sample was typically 12 hours, with separate day and night collections (It was typically 24 hours for the PM2.5 DQ1Q2 and Q1Q2 samplers). With each sampler 63 actual samples were taken (for the PM2.5 DQ1Q2 and Q1Q2 samplers: 32). The UGent team subjected the samples to the same analyses as done for the Budapest 2002 samples, and performed IC analyses for LMW organic compounds on selected fine fine fraction filters of the HVDS and selected MOUDI samples. The UA team subjected the fine fraction filters of the HVDS and selected MOUDI samples to detailed organic analyses by capillary GC-FID and capillary GC/MS. The results for OC, EC, and WSOC for some of the samplers were briefly discussed in sections 3.1, 3.2, and 4.2. The data were also presented and discussed in some publications [Raes et al., 2004; Maenhaut et al., 2004f; Ion et al., 2005; Ocskay et al., 2006]. The analyses of the fine fraction filters of the HVDS for detailed organic compounds [Ion et al., 2005] indicated that the major components detected at significant atmospheric concentrations were: (a) photo-oxidation products of isoprene including the 2-methyltetrols (2-methylthreitol and 2-methylerythritol) and 2-methylglyceric acid, (b) levoglucosan, a marker for biomass burning, (c) malic acid, an intermediate in the oxidation of unsaturated fatty acids, and (d) the sugar alcohols, arabitol and mannitol, markers for fungal spores.
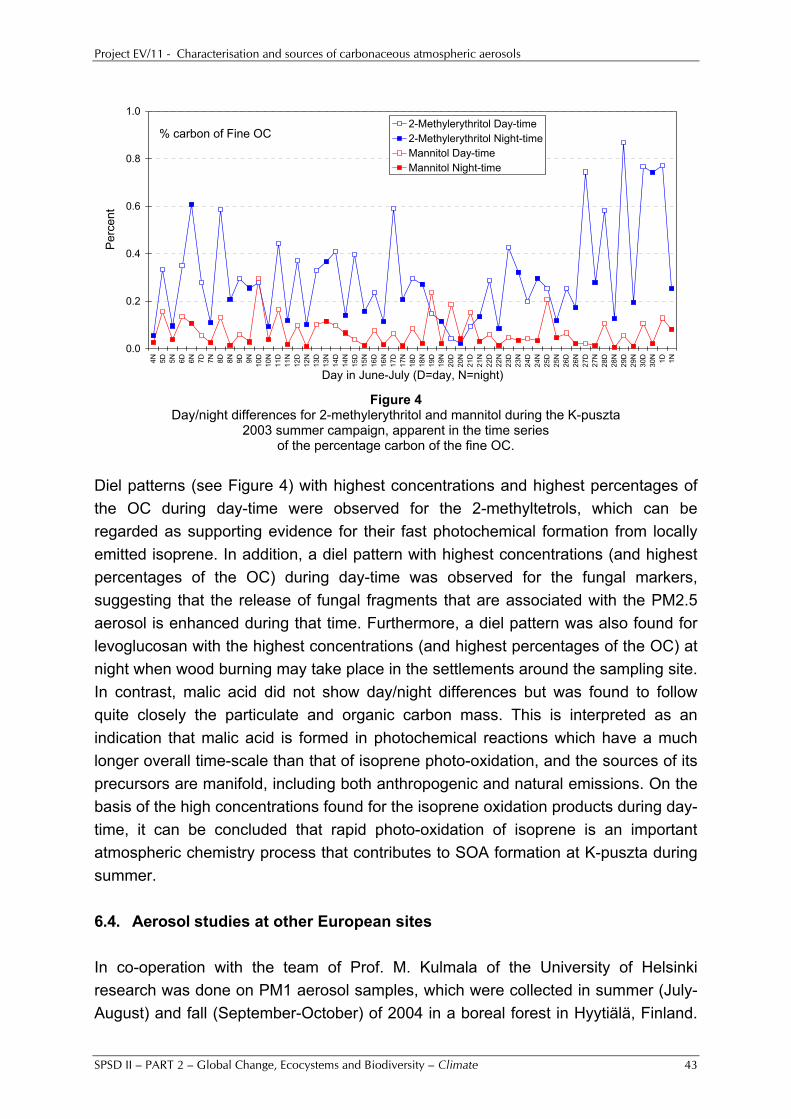
Project EV/11 - Characterisation and sources of carbonaceous atmospheric aerosols
SPSD II – PART 2 – Global Change, Ecocystems and Biodiversity – Climate 43
% carbon of Fine OC
0.0
0.2
0.4
0.6
0.8
1.0
4N 5D 5N 6D 6N 7D 7N 8D 8N 9D 9N 10D
10N
11D
11N
12D
12N
13D
13N
14D
14N
15D
15N
16D
16N
17D
17N
18D
18N
19D
19N
20D
20N
21D
21N
22D
22N
23D
23N
24D
24N
25D
25N
26D
26N
27D
27N
28D
28N
29D
29N
30D
30N 1D 1N
Day in June-July (D=day, N=night)
Per
cent
2-Methylerythritol Day-time2-Methylerythritol Night-timeMannitol Day-timeMannitol Night-time
Figure 4
Day/night differences for 2-methylerythritol and mannitol during the K-puszta 2003 summer campaign, apparent in the time series
of the percentage carbon of the fine OC. Diel patterns (see Figure 4) with highest concentrations and highest percentages of the OC during day-time were observed for the 2-methyltetrols, which can be regarded as supporting evidence for their fast photochemical formation from locally emitted isoprene. In addition, a diel pattern with highest concentrations (and highest percentages of the OC) during day-time was observed for the fungal markers, suggesting that the release of fungal fragments that are associated with the PM2.5 aerosol is enhanced during that time. Furthermore, a diel pattern was also found for levoglucosan with the highest concentrations (and highest percentages of the OC) at night when wood burning may take place in the settlements around the sampling site. In contrast, malic acid did not show day/night differences but was found to follow quite closely the particulate and organic carbon mass. This is interpreted as an indication that malic acid is formed in photochemical reactions which have a much longer overall time-scale than that of isoprene photo-oxidation, and the sources of its precursors are manifold, including both anthropogenic and natural emissions. On the basis of the high concentrations found for the isoprene oxidation products during day-time, it can be concluded that rapid photo-oxidation of isoprene is an important atmospheric chemistry process that contributes to SOA formation at K-puszta during summer. 6.4. Aerosol studies at other European sites In co-operation with the team of Prof. M. Kulmala of the University of Helsinki research was done on PM1 aerosol samples, which were collected in summer (July-August) and fall (September-October) of 2004 in a boreal forest in Hyytiälä, Finland.

Project EV/11 - Characterisation and sources of carbonaceous atmospheric aerosols
SPSD II – PART 2 – Global Change, Ecocystems and Biodiversity – Climate 44
The samples were analysed for OC and EC and for detailed organic compounds. The results are described in Kourtchev et al. [2005a]. Similar research was done in co-operation with the team of Prof. T. Hoffmann of the University of Mainz. The samples here were PM2.5 samples, which had been collected in a mixed deciduous forest in Jülich, which is located in an area that is clearly influenced by anthropogenic pollution. Some details about this study can be found in Kourtchev et al. [2005b]. In co-operation with the team of Dr. J. Querol of IJA, Barcelona, Spain, a 2004 summer and a 2004 winter aerosol sampling campaign were conducted at the IJA site. The samplers included undenuded and denuded PM2.5 47-mm diameter filter samplers and Hi-Vol PM2.5 and PM10 15-cm diameter filter samplers. All filters used were quartz fibre filters. The UGent team performed analyses for the PM, OC, and EC on all samples and for the Hi-Vol filters also for WSOC. Various other analyses were done by the IAJ team. The results are discussed in Viana et al. [2006b, 2007a, 2007b]. In co-operation with IJA and with Dr. H.M. ten Brink of the Energy Research Centre of the Netherlands (ECN), Petten, a 2005 summer and a 2006 winter campaign were conducted in Amsterdam. The samplers and analyses were the same as for the IJA site, except that only one Hi-Vol sampler (i.e., the PM2.5 sampler) was deployed at Amsterdam. Results from this campaign can be found in Viana et al. [2007b]. During 2006, a study was undertaken at Uccle, Belgium, to examine the relationship between the vertical column-integrated Aerosol Optical Depth (AOD) and the boundary layer aerosol characteristics. This study was done in co-operation with A. Cheymol, Dr. H. De Backer and others of the Royal Meteorological Institute (RMI) of Belgium. As part of the study, PM2.5 and PM10 aerosol samples were collected on 0.4 µm pore size Nuclepore polycarbonate filters and on pre-fired Whatman QM-A quartz fibre filters. The collections were done during the day-time only and on days with no or few clouds when 50% or more valid AOD data were to be expected. A total of 109 collections were performed with each sampler. The PM was obtained from weighing each filter before and after sampling with a microbalance. All quartz fibre filters were analysed for OC and EC by TOT, and the Nuclepore filters were analysed for 29 elements (from Na to Pb) by PIXE and for major anions and cations by IC. Seasonal median atmospheric concentrations (ranges and other descriptive statistics) were calculated. From examining these data, it appeared that (for both PM2.5 and PM10) the median atmospheric levels of the PM were about a factor of two higher in winter than in the other three seasons. Also the other major aerosol species (OC, ammonium, nitrate, and sulphate) exhibited higher medians in winter than in the other 3 seasons. The high levels in winter were due to the strong pollution episode at the end of January and beginning of February 2006, which persisted from

Project EV/11 - Characterisation and sources of carbonaceous atmospheric aerosols
SPSD II – PART 2 – Global Change, Ecocystems and Biodiversity – Climate 45
western to central Europe. Nitrate and the Cl-/Na+ ratio were clearly lowest in summer; for nitrate this is at least in part due to the fact that the volatile ammonium nitrate is rather in the gas phase than in the particulate phase within the atmosphere during this season, but volatilisation of nitrate from the aerosol collected on the filter may also play a role; the low Cl-/Na+ ratios during summer (medians of 0.05 and 0.35 in PM2.5 and PM10, resp., versus, for example, 0.82 and 1.25 in PM2.5 and PM10, resp., in spring) indicate that the loss of Cl from the sea-salt aerosol (because of reactions with acidic species within the atmosphere or on the filter) is clearly most pronounced in this season. Seasonal variations for the elements measured by PIXE were also investigated [Maenhaut et al., 2007a]. The UGent team contributed to an aerosol study over the Eastern Mediterranean Sea, which was conducted within the Mediterranean Intensive Oxidant Study (MINOS) [Sciare et al., 2005]. It also contributed to the European aerosol phenomenology exercise [Van Dingenen et al., 2004; Putaud et al., 2004], to a one-year measurement campaign on EC and OC in PM10 within the European monitoring and Evaluation Programme EMEP [Yttri et al., 2007] and to long-term studies of OC and EC in two valleys in the French Alps [Aymoz et al., 2007] and in Prague [Schwarz et al., 2007].


Project EV/11 - Characterisation and sources of carbonaceous atmospheric aerosols
SPSD II – PART 2 – Global Change, Ecocystems and Biodiversity – Climate 47
7. AEROSOL CHARACTERISATION STUDIES IN EQUATORIAL AND TROPICAL REGIONS
7.1. Aerosol research in South America Our studies in South America were conducted within the framework of the “Large Scale Biosphere-Atmosphere Experiment in Amazonia” (LBA), and in particular within its atmospheric chemistry component. Through co-operations with the MPIC and with the University of Sao Paulo (USP), Brazil (Prof. P. Artaxo) aerosol samples were obtained from campaigns in Brazil, i.e., from Rondônia (in 1999) and from Balbina and near Manaus (in 2001), and also from a long-term study in Alta Floresta. The results of this work are discussed in several publications [Maenhaut et al., 2002c; Zdráhal et al., 2002; Graham et al., 2002, 2003a, 2003b; Guyon et al., 2003a, 2003b, 2004; Claeys et al., 2004a].
0
20
40
60
80
100
120
140
160
180
200
8-S
ep10
-Sep
12-S
ep14
-Sep
16-S
ep18
-Sep
20-S
ep22
-Sep
24-S
ep26
-Sep
28-S
ep30
-Sep
2-O
ct4-
Oct
6-O
ct8-
Oct
10-O
ct12
-Oct
14-O
ct16
-Oct
18-O
ct20
-Oct
22-O
ct24
-Oct
26-O
ct28
-Oct
30-O
ct1-
Nov
3-N
ov5-
Nov
7-N
ov9-
Nov
11-N
ov13
-Nov
15-N
ov
Midpoint of sampling (local time)
Con
c. (µ
g/m
3 )
PMTC (x2)WSOC (x2)Levogl. (x10)
Dry period
Transition period
Wet period
Figure 5
Time series of the PM, TC, WSOC, and levoglucosan, all for the PM2.5 aerosol, during the SMOCC 2002 campaign. During the dry period, the collection time
per sample was generally 12 hours, during the transition period 24 hours, and during the wet period 48 hours.
A large effort was devoted to the study of biomass burning aerosol within the EU project SMOCC, in which both the UA and UGent teams were partners. The field work for this project (i.e., SMOCC 2002) took place in September-November 2002 in the Brazilian part of Amazonia and involved aircraft-based and ground-based components. The latter component was carried out at the Fazenda Nossa Senhora (FNS) pasture site in the state Rondônia. The UGent team deployed the same aerosol samplers there as used in the 2002 campaign at the kerbside in Budapest

Project EV/11 - Characterisation and sources of carbonaceous atmospheric aerosols
SPSD II – PART 2 – Global Change, Ecocystems and Biodiversity – Climate 48
(see section 6.3) and in addition also a second HVDS. Various types of analyses were done on the collected samples, not only by the UGent and UA teams, but also by other partners of the SMOCC project, i.e., by the team of Dr. M.C. Facchini and Dr. S. Fuzzi (ISAC, Bologna, Italy) and by the team of Prof. Y. Rudich of the Weizmann Institute (WI), Rehovot, Israel. Several publications resulted from this work [Maenhaut et al., 2004e; Falkovich et al., 2005; Schkolnik et al., 2005; Mircea et al., 2005; Decesari et al., 2006; Tagliavini et al., 2006; Fuzzi et al., 2007; Trebs et al., 2007]. Here, we only briefly present some results. Figure 5 shows the time series of 12-hour, 24-hour or 48-hour averaged concentrations in the PM2.5 size fraction for the PM, TC, WSOC, and levoglucosan. Three main periods are clearly distinguished: i) dry period (intense burning; 11 September to 7 October), with the 10 to 90 percentile concentration range for the PM from 25 to 120 µg/m3; ii) transition period (8 October to 29 October), during which the 10 to 90 percentile concentration range for the PM was from 12 to 28 µg/m3; iii) wet period (30 October to 14 November), characterised by a PM concentration range from 2.4 to 4.6 µg/m3. The time series of the PM and of the biomass burning tracer levoglucosan follow each other quite closely (the R2 between both variables was 0.87); the time series of the PM also reflected that of CO (another biomass burning indicator). The decrease in PM over the campaign is thus directly linked to the decreasing intensity of the biomass burning activities from September through to November, due to the progressive onset of the wet season. Figure 6 shows the mass size distributions for the PM and selected organic compounds, as derived from 4 selected MOUDI samples. Two prominent aerosol modes, in the submicrometer and supermicrometer size ranges, were detected throughout the campaign. Dry period size distributions were dominated by the fine mode, while the fine and coarse modes showed almost the same concentrations during the wet period. The supermicrometer fraction of the aerosol was composed mainly of primary particles of crustal or biological origin (arabitol and mannitol are indicators for the latter, i.e., for fungal spores), whereas submicrometer particles were produced in high concentrations only during the biomass burning periods, and were mainly composed of organic material, mostly water-soluble (such as levoglucosan), and ca. 10% of soluble inorganic salts, with sulphate as the major anion. Size-resolved average aerosol chemical compositions were calculated for the dry, transition, and wet periods. However, significant variations in the aerosol composition and concentrations were observed within each period, which can be classified into two categories: a) diurnal oscillations, caused by the diurnal cycle of the boundary layer and the different combustion phase active during day (flaming) or night (smouldering); b) day-to-day variations, due to alternating phases of relatively wet and dry conditions.

Project EV/11 - Characterisation and sources of carbonaceous atmospheric aerosols
SPSD II – PART 2 – Global Change, Ecocystems and Biodiversity – Climate 49
dry period [25 Sept. (day)]
0.001
0.01
0.1
1
10
100
1000
0.01 0.1 1 10 100
MOUDI stage diameter (µm)
dM/d
logD
p (µ
g/m
3 )
dry period [17-18 Sept. (night)]
0.001
0.01
0.1
1
10
100
1000
0.01 0.1 1 10 100
MOUDI stage diameter (µm)
dM/d
logD
p (µ
g/m
3 )
PMlevoglucosanmalic acid2-methyltetrolsmannitolarabitol
transition period (18-19 Oct.)
0.001
0.01
0.1
1
10
100
0.01 0.1 1 10 100
MOUDI stage diameter (µm)
dM/d
logD
p (µ
g/m
3 )
wet period (10-12 Nov.)
0.0001
0.001
0.01
0.1
1
10
100
0.01 0.1 1 10 100MOUDI stage diameter (µm)
dM/d
logD
p (µ
g/m
3 )
PMlevoglucosanmalic acid2-methyltetrolsmannitolarabitol
Figure 6 Size distributions of the PM and of the main identified organic compounds
determined by GC/MS, as derived from MOUDI samples collected during the dry period (day and night conditions), and during the transition and wet periods of the SMOCC 2002 campaign.
The average composition of the total identified organic compound fraction for the PM2.5 aerosol in each of the three periods, as derived from GC/MS, IC, and IEC analysis of HVDS and SFU samples, is shown in Figure 7. The relative contribution of the biomass burning products (i.e., the anhydrosugars, which include levoglucosan, and the aromatic acids and aldehydes) decreases from the dry to the wet period (with a percentage of 55, 33, and 16% for the dry, transition, and wet periods, respectively), while this of the biogenic and biological aerosol products, including the 2-methyltetrols, the sugar alcohols, and the sugars, shows an opposite pattern (with a percentage of 5.6, 11, and 36%). Whereas the concentration of the PM2.5 aerosol mass varied over about 2 orders of magnitude over the course of the campaign, that of the coarse (2.5-10 µm) aerosol varied over less than one order of magnitude, pointing to a fairly constant emission of coarse particles from the natural background. As a consequence, the PM2.5/PM10 percentage ratio for the aerosol mass was substantially lower during the wet period (i.e., on average, 42±10%) than during the transition period (69±8%) and dry period (84±6%).

Project EV/11 - Characterisation and sources of carbonaceous atmospheric aerosols
SPSD II – PART 2 – Global Change, Ecocystems and Biodiversity – Climate 50
Dry period Transition period MCAOxalic acidDCA C3-C6TCAArom. acidsArom. aldehydesAnhydrosugarsSugar alcoholsSugars2-Methyltetrols
Wet period MCAOxalic acidDCA C3-C6TCAArom. acidsArom. aldehydesAnhydrosugarsSugar alcoholsSugars2-Methyltetrols
Figure 7
Mean composition of the total identified organic compound (TIOC) fraction for the PM2.5 aerosol, as obtained from analysis at the molecular level by GC/MS, IC, and IEC methods of
fine filter samples collected in the different periods of the SMOCC 2002 campaign (MCA: monocarboxylic acids;
DCA C3-C6: C3-C6 dicarboxylic acids; TCA: tricarboxylic acids). The mean concentrations of TIOC, TIOC carbon, WSOC, and OC were 6.1 μg m-3, 2.5 μg C m-3, 19.5 μg C m-3, and 26.9 μg C m-3, respectively, for the dry period; 1.6 μg m-3, 0.63 μg C m-3, 6.4 μg C m-3,
and 8.0 μg C m-3 during the transition period, and 0.25 μg m-3, 0.10 μg C m-3, 0.85 μg C m-3, and 1.42 μg C m-3 during the wet period.
[Figure adapted from Decesari et al., 2006] 7.2. Aerosol research in South Africa In August and September 2000 the UGent team participated in the ground-based field component of the final dry season (biomass burning) campaign of the “Southern African Regional Science Initiative” (SAFARI 2000) [Swap et al., 2002]. This was done in co-operation with Prof. H.J. Annegarn (then at the University of Witwatersrand, Johannesburg, South Africa). At Skukuza in the Kruger National

Project EV/11 - Characterisation and sources of carbonaceous atmospheric aerosols
SPSD II – PART 2 – Global Change, Ecocystems and Biodiversity – Climate 51
Park, South Africa, PM and BC (both in PM2.5) were measured in situ with a TEOM and aethalometer, and several UGent filter samplers and MOUDI and SDI cascade impactors were deployed. The campaign lasted from 16 August to 19 September 2000. The in situ measurements indicated that there were occasionally episodes (of several hours) with strongly enhanced concentration levels. This was the case in the period from 30 August to 4 September and on 14 September. The highest hourly-averaged concentrations were noted in the early morning of 1 September. From the analyses of the filter samples it appeared that the average PM2.5/PM10 ratio for the PM amounted to 0.66 ± 0.12. The TC/PM ratio in PM2.5 was, on average, 0.33 ± 0.07 and the average EC/TC ratio for the same size fraction was 0.082 ± 0.022. The UGent team performed WSOC and IC analyses on 27 PM10 quartz filter samples (of 24 hour) from the campaign. The UA team performed analyses for levoglucosan and other saccharidic compounds with the GC/ion trap MS method of Pashynska et al. [2002] on 52 day-time and night-time PMtot samples and subjected the fine (PM2.5) front filters of 34 HVDS samples (of 24 hour) to the same analyses and also to an analysis for oxygenated carboxylic acids (i.e., dicarboxylic acids, hydroxycarboxylic acids, and phenolic acids), using a separate GC/ion trap MS method. The PM2.5 HVDS filters were also analysed for WSOC by the UGent team. The median concentrations and concentration ranges for the PM, OC, WSOC, EC, and the various organic species in the three sample sets are given in Table 5. It appeared that, on average, 62(±9)% of the PM10 OC and 70(±8)% of the PM2.5 OC was WSOC. Levoglucosan and oxalic acid were the dominant organic species measured, they accounted for 2.5% and 1.25% of the PMtot or PM10 OC; the dicarboxylic (and other organic) acids accounted, on average, for 2.5% of the PM10 OC and the saccharidic compounds accounted for 4.9% of the PMtot OC. It can thus be concluded that the bulk of the WSOC eluded analysis by IC and GC/MS; this may be predominantly high molecular weight in nature, as indicated by Graham et al. [2002] and others. It further appeared from the IC analyses that nitrate, sulphate, and chloride accounted, on average, for respectively 5.6%, 9.1% and 4.7% of the PM10 aerosol mass. The PM, OC, WSOC, OC, levoglucosan (and other anhydrosugars), o-OH benzoic acid, p-OH benzoic acid, and vanillic acids were well correlated with each other (all R > 0.8), suggesting that they were associated with the biomass burning source. PM10 oxalic acid was well correlated with other PM10 dicarboxylic acids, but not so much with biomass burning species. The PM2.5 hydroxycarboxylic acids (glyceric, β-hydroxyglutaric, malic, α-hydroxyglutaric, tartaric, and threonic acids (2 isomers)) were very well correlated with each other (all R > 0.85); these acids may be secondary (aged) products that were formed from precursors that were emitted by biomass burning. Other species that were well correlated with each other (but not at all with the biomass burning species) were the sugar alcohols arabitol and mannitol (R = 0.92) and the sugars fructose and glucose.

Project EV/11 - Characterisation and sources of carbonaceous atmospheric aerosols
SPSD II – PART 2 – Global Change, Ecocystems and Biodiversity – Climate 52
Table 5 : Median concentrations and concentration ranges at Skukuza during SAFARI 2000. Data for PM, OC, WSOC, and EC are in µg.m–3; for all other species in ng.m–3.
Species Median conc. Conc. range
PM10(Q) (N=27) PM (µg.m–3) 40 25 – 107 OC 9.0 5.0 – 37 WSOC 6.0 2.9 – 25 EC 0.87 0.38 – 3.6 Oxalic (ng.m–3) 460 250 – 1000 Malonic 100 43 – 300 Succinic 77 42 – 188 Glyoxylic 34 17.0 – 129 Pyruvic 14.3 6.1 – 40 Malic 78 35 – 200 PMtot (N=27) a PM (µg.m–3) 40 16.8 – 142 OC 9.4 3.1 – 42 EC 0.79 0.21 – 2.7 Levoglucosan (ng.m–3) 580 200 – 3500 Mannosan 48 16.3 – 196 Galactosan 25 8.7 – 123 Glucofuranose 48 15.7 – 320 Arabitol 99 43 – 230 Mannitol 56 21 – 155 Inositol 12.1 3.5 – 84 Fructose 48 5.3 – 110 Glucose 101 27 – 300 Sucrose 68 27 – 190 PM2.5 HVDS (N=34) OC (µg.m–3) 6.0 1.03 – 32 WSOC 4.1 0.78 – 18.4 EC 0.55 0.083 – 1.84 Levoglucosan (ng.m–3) 390 68 – 3200 Succinic 60 2.6 – 175 Fumaric 7.8 0.39 – 24 Glutaric 2.8 0.33 – 15.5 Glyceric 10.6 1.32 – 38 β-OH glutaric 3.4 0.59 – 10.9 Malic 38 4.2 – 146 Threonic isomer 4.1 0.53 – 22 Threonic 2.1 0.34 – 11.1 α-OH glutaric 14.6 1.77 – 55 Tartaric 4.3 0.34 – 35 o-OH benzoic 0.58 0.114 – 7.9 m-OH benzoic 0.28 DL – 1.17 p-OH benzoic 3.3 0.52 – 21 Vanillic acids 10.9 1.72 – 92
a The PMtot data listed here are volume-weighted 24-hour averages that were calculated from the 12-hour PMtot data.

Project EV/11 - Characterisation and sources of carbonaceous atmospheric aerosols
SPSD II – PART 2 – Global Change, Ecocystems and Biodiversity – Climate 53
Additional results from the SAFARI 2000 campaign at Skukuza are presented in Maenhaut et al. [2002d]. The UGent team also contributed to the airborne component of SAFARI 2000 [Formenti et al., 2003]. 7.3. Aerosol research in Rukomechi, Zimbabwe From September 1994 to January 2000, long-term aerosol collections were carried out with a Gent PM10 SFU sampler at the Rukomechi Research Station (16.11°S, 29.41°E), Zimbabwe. The work was carried out in co-operation with the team of Dr. F.X. Meixner (MPIC, Mainz). The filters were analysed by the UGent team for the PM, BC, and major, minor, and trace elements. The results are discussed in some detail in Nyanganyura et al. [2007]. 7.4. Aerosol reseach at two sites in Tanzania As part of a programme of the VLIR-SUA (Vlaamse Interuniversaire Raad – Sokoine University of Agriculture), aerosol samplings with PM2.5 and PM10 filter holders and with a Gent PM10 SFU sampler were conducted at two sites in Tanzania. The sites were at Dar es Salaam and at Morogoro (200 km west of Dar es Salaam). The PM2.5 and PM10 filter holders had two Whatman QM-A quartz fibre filters in series, whereas the SFU sampler had coarse and fine Nuclepore polycarbonate filters in series, so that it provided coarse (2-10 µm) and fine (<2 µm) size fractions. Three sampling campaigns took place, first in the 2005 wet season (May-June), which was actually rather dry, then in the 2005 dry season (July-September), and finally in the 2006 wet season (March-May). During each campaign, the aerosol samplers were first deployed in Morogoro and then transferred to Dar es Salaam for deployment there. Depending upon the season and the location, either 24-hour collections or separate day-time and night-time samplings were performed. All filters were analysed for the PM; the quartz fibre filters were subjected to analyses for OC, EC, and WSOC, and the Nuclepore filters were analysed by PIXE and IC. All analyses were done at UGent. The PIXE data are discussed in Maenhaut et al. [2007b] and all data from the 2005 wet season campaigns are discussed in Mkoma et al. [2007]. 7.5. Aerosol research in South-east Asia and North-west Australia This research was conducted in co-operation with the team of Prof. M. Hooper, Monash University, Australia. It involved aerosol collections with Gent PM10 SFU samplers and analysis of the samples for the PM, BC, and up to 47 elements. The gravimetric measurements for the PM were conducted by the Australian team. BC was measured independently by both the Australian and UGent teams, and the

Project EV/11 - Characterisation and sources of carbonaceous atmospheric aerosols
SPSD II – PART 2 – Global Change, Ecocystems and Biodiversity – Climate 54
elemental analyses (by INAA and PIXE) were done by the UGent team. The collections were done in at Jabiru (12°40’S, 132°53’E) in the Kakadu National Park, North-west Australia, where 97 SFU samples were taken from mid-May 1995 until December 1996, and at two sites in Indonesia, i.e., at Bukit Tinggi (0°18’S, 100°20’E, 864 m asl), a mountain site on Sumatra at about 50 km from the coast, and at Pontianak (0°5’S, 109°16’E), a sea level site on Kalimantan at about 35 km from the coast. At Bukit Tinggi, 209 SFU samples were taken from April 1996 until June 2001 and at Pontianak, 137 SFU samples from the end of December 1997 until mid-June 2001. The PM and BC results of the Jabiru study are discussed in Vanderzalm et al. [2003], whereas some results from the two Indonesian sites are presented in Maenhaut et al. [2002b].

Project EV/11 - Characterisation and sources of carbonaceous atmospheric aerosols
SPSD II – PART 2 – Global Change, Ecocystems and Biodiversity – Climate 55
8. CHEMICAL MASS CLOSURE, SOURCE IDENTIFICATION AND SOURCE APPORTIONMENT
8.1. Aerosol chemical mass closure Aerosol chemical mass closure calculations, as described in section 2.4, were performed for several of our study sites, i.e., for Ghent and Uccle in Belgium, for Melpitz in Germany, for Budapest and the K-puszta site in Hungary, and for Dar es Salaam and Morogoro in Tanzania. The sites of Ghent and Uccle can be considered as urban background sites, the sites in Budapest and Dar es Salaam are kerbsides, the Melpitz site is a near-city background site, and the sites at K-puszta and Morogoro are rural background sites [Van Dingenen et al., 2004; Putaud et al., 2004]. For most of the sites, the calculations were not only done for the PM10 aerosol, but also for the separate fine (PM2 or PM2.5) and coarse size fractions. The average concentrations of the PM10 mass and of 8 aerosol types (components) in the PM10 aerosol for Ghent and Uccle are shown in Figure 8. For Ghent, separate data are given for the winter 2004, summer 2004, and winter 2005 campaigns, whereas for Uccle, the data are for winter-spring 2006 and summer-fall 2006, respectively. Of the 8 components, only one (i.e., sea salt) is purely natural; EC, ammonium, nitrate, nss-sulphate, and other elements are in Flanders and Brussels essentially from anthropogenic origin, and OM and crustal matter are probably also mostly due to anthropogenic sources (For the last component there are contributions from road dust and agriculture). In agreement with what is generally found in Belgium [Maenhaut, 2007], there is a tendency for higher PM10 levels in winter than in summer. Particularly for nitrate, much higher concentrations are observed in winter than in summer. This finding is in agreement with the findings of the European Aerosol Phenomenology study [Putaud et al., 2004]. The low nitrate values in summer are due to the fact that the volatile ammonium nitrate is rather in the gas phase than in the particulate phase within the atmosphere during this season (Volatilisation of nitrate from the aerosol collected on the filter may also play a role). In order to better examine the differences in PM10 aerosol composition between the sites and seasons, the data from Figure 8 were also expressed as percentage of the gravimetric PM10 mass. The results of this calculation are shown in Table 6. Even expressed as % instead of as absolute concentrations, there are clearly differences for nitrate between winter and summer, with lower percentages in summer. It further appears that the average PM10 aerosol composition is fairly similar for the 3 winter campaigns. The most noteworthy difference is observed for the sea-salt component, with a percentage as high as 18% for Ghent 2005 winter. In Figure 8, it can be seen that also the absolute concentration of the sea-salt component was high during this campaign, and that, on the other hand, the average PM10 level was on the low side.

Project EV/11 - Characterisation and sources of carbonaceous atmospheric aerosols
SPSD II – PART 2 – Global Change, Ecocystems and Biodiversity – Climate 56
3.92.3 2.2
4.0 4.0
3.3
2.15.2 2.4 2.1
4.2
2.4
2.9 4.83.3
7.8
2.5
5.6
7.9
2.8
4.9
1.4
2.9
4.5
1.6
9.2
4.8
8.1
8.7
5.9
0
5
10
15
20
25
30
35
40
G04win G04sum G05win U06win_spr U06sum_fal
Ave
rage
con
c. (µ
g/m
3 )
UnexplainedOMECAmmoniumNitratenss-SulphateSea SaltCrustalElements
Figure 8
Average concentrations of 8 aerosol types in PM10 and of the unexplained gravimetric PM10 mass during 5 sampling campaigns in Belgium
[G04win, G04sum, and G05win stand for Ghent 2004 winter, Ghent 2004 summer, and Ghent 2005 winter, resp.; U06win_spr and U06sum_fal stand for Uccle 2006 winter-spring and
Uccle 2006 summer-fall, resp]. OM was calculated as 1.4 OC. The average concentrations for 6 of the 8 aerosol types
are also given in numeric form.
Table 6 : Percentage attribution of the mean gravimetric PM10 mass concentration to 8 aerosol types (components) for Ghent and Uccle.
Species Ghent Uccle 2004 2004 2005 2006 2006 winter summer winter win-spr sum-fall
OM 26 25 28 25 26 EC 2.8 5.4 4.4 3.1 4.8 Ammonium 13.9 7.3 10.0 13.1 6.9 Nitrate 22 13.2 19.2 23 11.9 Nss-sulphate 12.0 12.5 10.1 13.9 14.1 Sea salt 9.3 11.0 17.9 7.0 9.1 Crustal matter 11.2 11.9 7.8 11.6 17.4 Other elements 0.36 0.36 0.41 0.49 0.54 Unexplained 2.6 13.0 2.4 2.9 9.8
Examination of the data for the individual samples of this campaign indicated that the percentage contribution of sea salt to the PM10 mass was especially high for samples with low PM10 mass concentration and was low for samples with high PM10 mass concentration [Viana et al., 2007a]. The individual data from the various

Project EV/11 - Characterisation and sources of carbonaceous atmospheric aerosols
SPSD II – PART 2 – Global Change, Ecocystems and Biodiversity – Climate 57
campaigns clearly indicated that sea salt cannot really be invoked as cause for exceedance of the daily PM10 EU limit value of 50 µg/m3 in Belgium. When such exceedances occur, both the absolute concentrations of sea salt and the percentages of sea salt in the PM10 aerosol are quite low. Table 6 further indicates that there is a large contribution of secondary aerosol to the PM10 mass. Ammonium, nitrate, and nss-sulphate are all secondary inorganic aerosol (SIA) components. In winter, the sum of these 3 components accounts, on average, for 40% or more of the PM10 mass. For PM2.5 even larger percentage contributions of SIA were observed. Also a substantial fraction of the OM may consist of secondary aerosol and thus be SOA, especially in summer. The total contribution of secondary aerosol to PM10 is likely over 50% in all seasons in Belgium. The SIA components in the PM in Belgium are undoutedly predominantly from anthropogenic origin, wereby the precursor gases (NH3, NOx, and SO2) are not only emitted within Belgium, but also in neighbouring countries and in the rest of Europe. As far as the emissions in Flanders are concerned, agricultural activities, in particular intensive cattle breeding and storage and spread of animal manure, is the major source of NH3; NOx originates mainly from combustion processes associated with traffic, electricity production, and industry (which contributed with 47%, 14%, and 21%, resp., of the total NOx emission in 2005); and SO2 is predominantly due to the combustion of fossil fuels (oil and coal), with 78% of the total SO2 emissions in 2005 originating from industry, refineries, and electricity production combined [Anonymous, 2005; VMM, 2006]. In contrast to SIA, the sources of the OM in the PM in Belgium are much less clear and it is also highly uncertain which fraction of the OM is SOA. While a substantial fraction of the primary OM (and most of the EC) is likely derived from traffic, other anthropogenic sources and emissions from the biosphere (especially the vegetation) also contribute to both the primary OM and SOA. Several particulate organic compounds within the PM are quite useful for identifying certain sources or source types (or even the formation of SOA) and for assessing their contribution. In a co-operation between the UA and UGent teams, work has been (and is being) done on these topics [Kubátová et al., 2002; Zdráhal et al., 2002; Pashynska et al., 2002; Claeys et al., 2004a, 2007]. As indicated in section 6.1, by using levoglucosan as a tracer, it was estimated that wood burning was responsible for 35% of the particulate OC in PM10 in Ghent during winter 1998 [Zdráhal et al., 2002]. As also indicated in section 6.1, by measuring other saccharidic compounds, including arabitol, mannitol, fructose, and sucrose, in PM10 samples from winter and summer campaigns at Ghent [Pashynska et al., 2002], it was found that the concentrations of these compounds were much higher during summer than during winter, which indicates larger concentrations of primary biogenic aerosols (e.g., plant pollen and fungal spores) during summer. Currently, work is being done on the use of particulate-phase photo-oxidation products of biogenic VOCs, in particular isoprene [Claeys et

Project EV/11 - Characterisation and sources of carbonaceous atmospheric aerosols
SPSD II – PART 2 – Global Change, Ecocystems and Biodiversity – Climate 58
al., 2004a] and monoterpenes [Claeys et al., 2007], to estimate the contribution of biogenic SOA to the OM. For the 2004 summer and 2005 winter campaigns at Ghent and for the 2004 summer and winter campaigns at Barcelona, aerosol chemical mass closure calculations were also done using another approach than that described in section 2.4, thereby using data that were obtained by IAJ for PM2.5 and PM10 Hi-Vol samples. The results of these calculations are described in detail in Viana et al. [2007a]. For the two Ghent campaigns, there was good agreement with the results obtained using the approach of section 2.4 (using data obtained by UGent on samples from UGent collection devices).
1.8
20.5
5.7
4.1
2.5
0.8
4.9
18.3
10.4
0
10
20
30
40
50
60
Melpitz Budapest K-puszta
Aver
age
conc
. (µg
/m3 )
UnexplainedOMECAmmoniumNitratenss-SulphateSea SaltCrustalElements
Figure 9
Average concentrations of 8 aerosol types in PM10 and of the unexplained gravimetric PM10 mass during the INTERCOMP 2000 campaign in Melpitz,
the 2002 spring campaign in Budapest, and the 2003 summer campaign at K-puszta. OM was calculated as 1.4 OC for Melpitz and Budapest and as 1.8 OC for K-puszta.
The results, using the approach of section 2.4, for the campaigns at Melpitz, Budapest, and K-puszta are presented in Figure 9 and Table 7. Noteworthy are the high levels of the PM10 mass and of the crustal component and EC at the Budapest kerbside. Expressed as percentage of the average gravimetric mass (Table 7), the crustal component and EC are more important than at any of the study sites discussed in this section (with the exception of Dar es Salaam). The crustal component at Budapest is mainly in the coarse size fraction and is to a large extent due to resuspended road dust. EC at this site is likely mainly attributable to traffic. Larger percentages of crustal matter and EC at kerbsides than at other sides were also found in the European Aerosol Phenomenology exercise [Putaud et al., 2004]. It

Project EV/11 - Characterisation and sources of carbonaceous atmospheric aerosols
SPSD II – PART 2 – Global Change, Ecocystems and Biodiversity – Climate 59
further appears from Figure 9 and Table 7 that, both in terms of absolute concentrations and percentages, nitrate is most important at Melpitz, followed by Budapest, and the K-puszta site comes last. It should be noted here that ambient temperatures were lowest during the Melpitz campaign and highest at K-puszta, so that the data for nitrate are to a large extent the reflection of volatilisation of ammonium nitrate at higher temperatures.
Table 7 Percentage attribution of the mean gravimetric PM10 mass concentration to 8 aerosol types (components) for campaigns in Melpitz, Budapest, and K-puszta.
Species Melpitz Budapest K-puszta 2000 spring 2002 spring 2003 summer
OM 27 34 45 EC 3.2 8.6 0.61 Ammonium 9.2 2.6 7.9 Nitrate 23 4.5 3.5 Nss-sulphate 16.3 7.4 16.8 Sea Salt 3.3 1.57 0.95 Crustal matter 10.1 37 25 Other elements 0.29 0.62 0.19 Unexplained 7.9 3.8 0.54
Figure 10 and Table 8 show the results for the campaigns at the two sites in Tanzania. The lowest absolute concentrations at each of the two sites are noted in the 2006 wet season and the highest in the dry season (during the 2005 wet season campaign it was rather dry). This is a reflection of the removal of aerosol from the air by wet deposition processes. The absolute concentrations of the PM10 mass, crustal matter, and EC (and also the percentages for the crustal matter and EC) are much larger for the Dar es Salaam kerbside than for the Morogoro rural site. Incidentally, the percentage contributions of the two components at Dar es Salaam are quite similar to those for the Budapest kerbside. The largest differences between the PM10 aerosol composition at the Tanzanian sites and that of the European sites resides in the much lower contribution of SIA in Tanzania. Whereas the higher temperatures may play a role for the lower nitrate percentages, other explanations have to be invoked for the lower percentages of nss-sulphate. They indicate that the emissions of the precursor gas SO2 on the regional scale are substantially lower for our Tanzanian sites than they are for our European sites, as is also evident from the GEIA emission inventory [see http://geiacenter.org/ and, e.g., Verma et al., 2006].

Project EV/11 - Characterisation and sources of carbonaceous atmospheric aerosols
SPSD II – PART 2 – Global Change, Ecocystems and Biodiversity – Climate 60
1115
4
1623
16
0.5
0.9
0.5
4.6
4.7
4.812
20
7
19
25
18
0
10
20
30
40
50
60
70
80
M05wet M05dry M06wet D05wet D05dry D06wet
Ave
rage
con
c. (µ
g/m
3 )
UnexplainedOMECNH4NO3nss-SulphateSea SaltCrustalElements
Figure 10
Average concentrations of 8 aerosol types in PM10 and of the unexplained gravimetric PM10 mass during the 2005 wet, 2005 dry, and 2006 wet season campaigns at Morogoro and Dar es Salaam.
OM was calculated as 1.8 OC for Morogoro and as 1.6 OC for Dar es Salaam.
Table 8 : Percentage attribution of the mean gravimetric PM10 mass concentration to 8 aerosol types (components) for campaigns in Morogoro and Dar es Salaam.
Species Morogoro Dar es Salaam 05wet 05dry 06wet 05wet 05dry 06wet
OM 48 44 53 37 36 37 EC 1.99 1.91 3.7 9.0 6.7 10.3 Ammonium 0.66 0.84 1.18 0.34 0.27 0.21 Nitrate 1.63 3.4 1.66 1.31 1.43 0.93 Nss-sulphate 2.5 4.5 3.7 3.3 2.8 2.5 Sea salt 4.0 5.6 2.7 9.1 13.9 7.7 Crustal matter 44 33 32 32 33 33 Other elements 0.05 0.05 0.05 1.14 1.29 0.75 Unexplained -2.8 7.1 2.7 6.9 4.3 6.9
Aerosol chemical mass closure calculations were also made for the two biomass burning campaigns (i.e., SAFARI 2000 and SMOCC 2002). Only partial IC analyses were done for these campaigns at UGent. Therefore, only 5 components were retained for Figure 11 and Table 9. Furthermore, in contrast to Figs. 8 to 10 (and Tables 6 to 8), the nss-sulphate data for Figure 11 and Table 9 were not derived from IC, but from PIXE, thereby assuming that all the S was present as sulphate. OM is clearly the dominant component of the PM10 PM at the two biomass burning sites.

Project EV/11 - Characterisation and sources of carbonaceous atmospheric aerosols
SPSD II – PART 2 – Global Change, Ecocystems and Biodiversity – Climate 61
For SAFARI 2000 there is a sizeable contribution from sea salt and crustal matter, as was also the case for the SAFARI-92 campaign at the same Skukuza site [Maenhaut et al., 1996]. The unexplained mass at both sites is in part attributable to nitrate and ammonium. IC analyses on selected samples from SAFARI 2000 indicated that nitrate was responsible for 5.6% of the PM10 PM (ammonium was not measured) and from IC analyses on selected samples from SMOCC 2002 [Falkovich et al., 2005] it may be concluded that the combined contribution of ammonium and nitrate to the PM10 PM was smaller than that of nss-sulphate (i.e., at most 4%).
5.2 2.9 1.5
17
48
19
0
10
20
30
40
50
60
SAF2000 SMOCC02dry SMOCC02trans
Aver
age
conc
. (µg
/m3 )
UnexplainedOMECnss-SulphateSea SaltCrustal
Figure 11
Average concentrations of 5 aerosol types in PM10 and of the unexplained gravimetric PM10 mass during the SAFARI 2000 campaign and during the dry and transition periods
of the SMOCC 2002 campaign. OM was calculated as 1.6 OC for SAFARI 2000 and as 1.8 OC for SMOCC 2002.
Overall, excellent aerosol chemical mass closure was obtained for all our sites for which all important aerosol constituents (with the exception of water) were determined. The unexplained mass may be attributed to water, which may easily represent 10% or more of the gravimetric PM10 mass at 20°C and 50% RH. It should also be realised that there is an uncertainty associated with the estimation of several aerosol components from their indicator species or elements, especially with that of OM (which OC-to-OM conversion factor to use?), but also with that of sea salt and crustal matter (not all Na and Cl are from sea salt and for Fe there may be important other (and anthropogenic) sources besides soil dust dispersal).
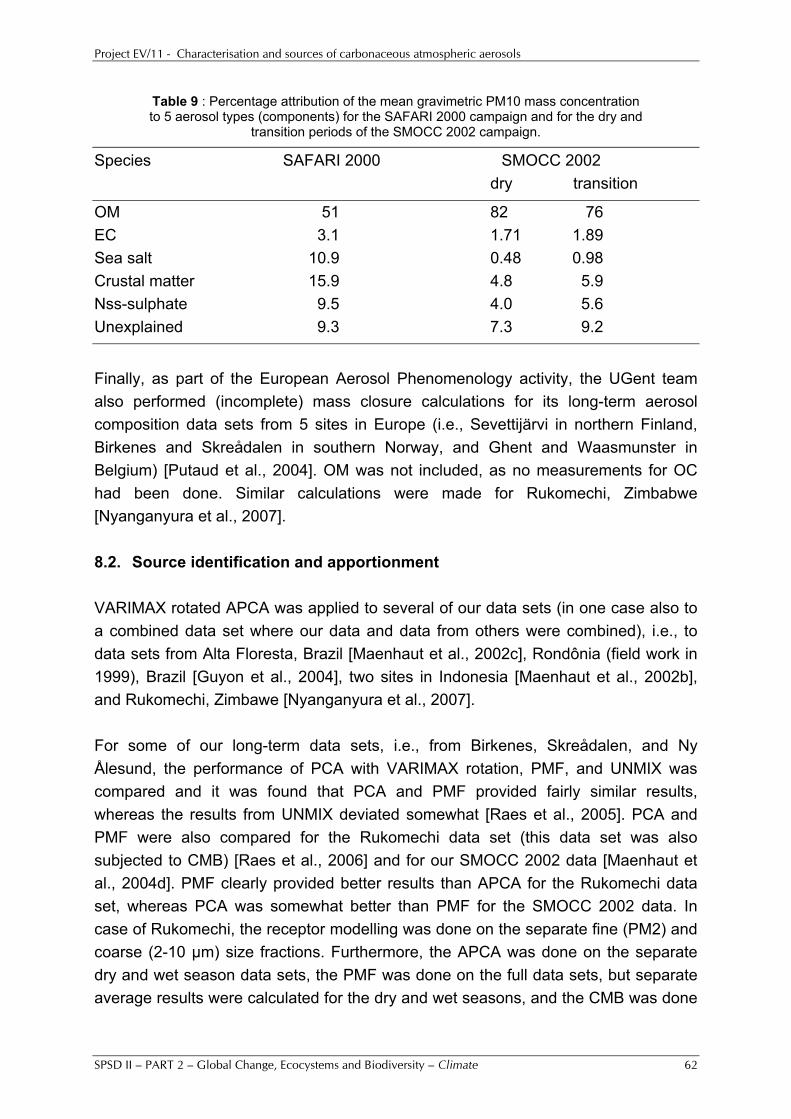
Project EV/11 - Characterisation and sources of carbonaceous atmospheric aerosols
SPSD II – PART 2 – Global Change, Ecocystems and Biodiversity – Climate 62
Table 9 : Percentage attribution of the mean gravimetric PM10 mass concentration to 5 aerosol types (components) for the SAFARI 2000 campaign and for the dry and
transition periods of the SMOCC 2002 campaign.
Species SAFARI 2000 SMOCC 2002 dry transition
OM 51 82 76 EC 3.1 1.71 1.89 Sea salt 10.9 0.48 0.98 Crustal matter 15.9 4.8 5.9 Nss-sulphate 9.5 4.0 5.6 Unexplained 9.3 7.3 9.2
Finally, as part of the European Aerosol Phenomenology activity, the UGent team also performed (incomplete) mass closure calculations for its long-term aerosol composition data sets from 5 sites in Europe (i.e., Sevettijärvi in northern Finland, Birkenes and Skreådalen in southern Norway, and Ghent and Waasmunster in Belgium) [Putaud et al., 2004]. OM was not included, as no measurements for OC had been done. Similar calculations were made for Rukomechi, Zimbabwe [Nyanganyura et al., 2007]. 8.2. Source identification and apportionment VARIMAX rotated APCA was applied to several of our data sets (in one case also to a combined data set where our data and data from others were combined), i.e., to data sets from Alta Floresta, Brazil [Maenhaut et al., 2002c], Rondônia (field work in 1999), Brazil [Guyon et al., 2004], two sites in Indonesia [Maenhaut et al., 2002b], and Rukomechi, Zimbawe [Nyanganyura et al., 2007]. For some of our long-term data sets, i.e., from Birkenes, Skreådalen, and Ny Ålesund, the performance of PCA with VARIMAX rotation, PMF, and UNMIX was compared and it was found that PCA and PMF provided fairly similar results, whereas the results from UNMIX deviated somewhat [Raes et al., 2005]. PCA and PMF were also compared for the Rukomechi data set (this data set was also subjected to CMB) [Raes et al., 2006] and for our SMOCC 2002 data [Maenhaut et al., 2004d]. PMF clearly provided better results than APCA for the Rukomechi data set, whereas PCA was somewhat better than PMF for the SMOCC 2002 data. In case of Rukomechi, the receptor modelling was done on the separate fine (PM2) and coarse (2-10 µm) size fractions. Furthermore, the APCA was done on the separate dry and wet season data sets, the PMF was done on the full data sets, but separate average results were calculated for the dry and wet seasons, and the CMB was done

Project EV/11 - Characterisation and sources of carbonaceous atmospheric aerosols
SPSD II – PART 2 – Global Change, Ecocystems and Biodiversity – Climate 63
on a sample by sample basis, but separate average results were calculated for the dry and wet seasons. Three source profiles were included in the CMB for the coarse size fraction, i.e., mineral dust, based on the average crustal rock composition from Mason [1966], sea salt, based on Riley and Chester [1971], and a pure (NH4)2SO4 profile. For the CMB on the the fine size fraction, 4 source profiles were included, i.e., the same three as for the coarse size fraction and in addition, a biomass burning (pyrogenic) profile, the same as used in Maenhaut et al. [1996b]. For the coarse size fraction, 3 components were identified by PMF, i.e., a mineral dust component with some pyrogenic aerosols (BC, Zn) mixed in, sea salt (with Na, Cl), and biogenic particles (with P, I); APCA on the coarse dry season data identified 4 components, i.e., mineral dust (with Al, Si, Sc, Ti, and various other typical crustal elements), a pyrogenic component (with BC, S, K, I), with some mineral dust mixed in, sea salt (with Na, Cl, Mg), and biogenic particles (with P, Ca, Sr); by APCA on the coarse wet season data, 4 components were identified, i.e., mineral dust (with Al, Si, Sc, Ti, and various other typical crustal elements), sea salt (with Na, Mg, S, Cl), biogenic particles (with P), with some pyrogenic particles (BC) mixed in, and a Cu component. For the fine size fraction, 5 components were identified by PMF, i.e., a pyrogenic component (with BC, K, Zn, Br, I), mineral dust (with Al, Sc, Ti, Mn, Fe, La, Sm), sea salt (with Na, Cl, Ca), sulphate (with S), non-ferrous smelters (with As, Pb); APCA on the fine dry season data identified 5 components, i.e., the same 5 components as identified by PMF; for the fine wet season data, 4 components were identified: there was no separate sulphate component, S was mainly on the pyrogenic component. The average source apportionments of APCA, PMF, and APCA for the coarse size fraction, expressed as percentage contribution of the components to the mean gravimetric coarse PM, are given in Table 10 for the separate dry and wet seasons. Table 11 gives the analogous results for the fine size fraction. It can be seen in Table 10 that, for the coarse size fraction in the dry season, the crustal component dominated (according to PMF and CMB) with about 70% [Note that some pyrogenic particles were mixed in with the crustal PMF component]; the summed contribution of the crustal + pyrogenic components from APCA is only 52% [Note that some mineral dust was mixed in with the pyrogenic component from APCA]; this sum is clearly lower than the crustal contribution from PMF or CMB, so that it may be concluded that the crustal contribution is underestimated in APCA. On the other hand, the sea-salt contribution is a factor of 2 higher in PMF than in APCA or CMB, and likely overestimated in PMF. The unexplained mass of CMB is most likely due to biogenic particles [There was no biogenic source profile available (and included) in CMB]. For the coarse fraction in the wet season, the contribution from the crustal component is clearly smaller in APCA than in PMF or CMB (and likely underestimated in APCA), the contribution from the sea-salt component is smaller in
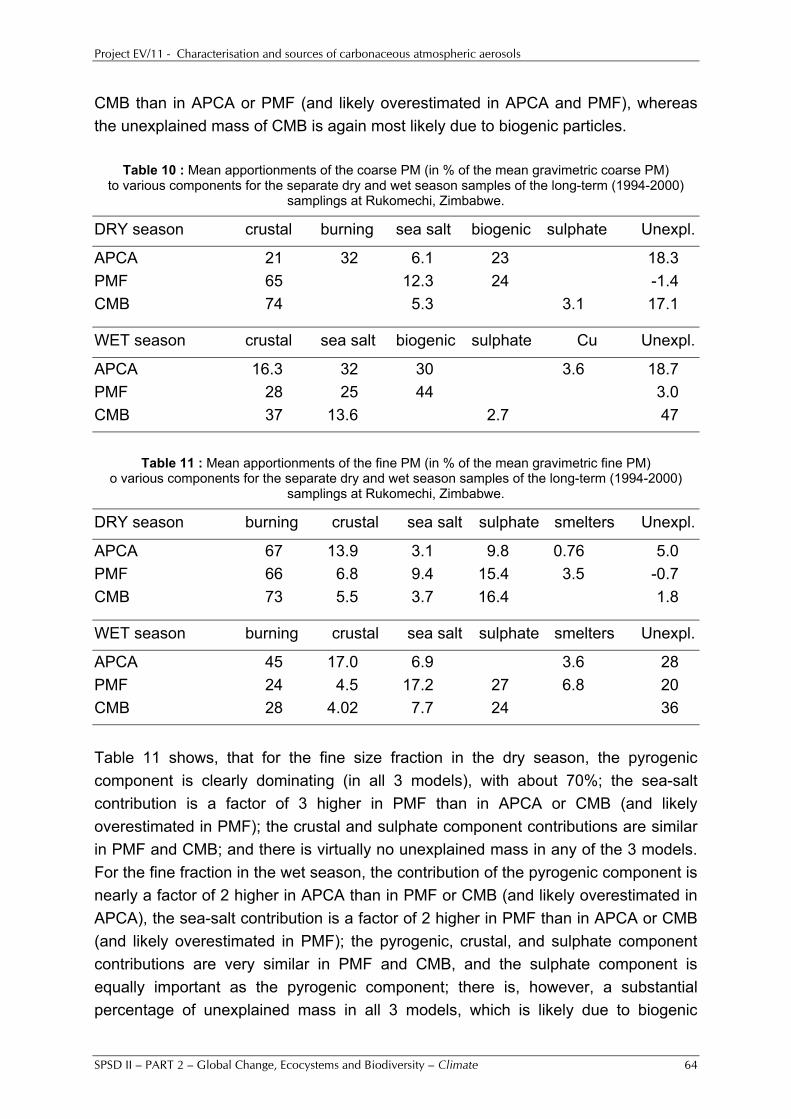
Project EV/11 - Characterisation and sources of carbonaceous atmospheric aerosols
SPSD II – PART 2 – Global Change, Ecocystems and Biodiversity – Climate 64
CMB than in APCA or PMF (and likely overestimated in APCA and PMF), whereas the unexplained mass of CMB is again most likely due to biogenic particles.
Table 10 : Mean apportionments of the coarse PM (in % of the mean gravimetric coarse PM) to various components for the separate dry and wet season samples of the long-term (1994-2000)
samplings at Rukomechi, Zimbabwe.
DRY season crustal burning sea salt biogenic sulphate Unexpl.
APCA 21 32 6.1 23 18.3 PMF 65 12.3 24 -1.4 CMB 74 5.3 3.1 17.1
WET season crustal sea salt biogenic sulphate Cu Unexpl.
APCA 16.3 32 30 3.6 18.7 PMF 28 25 44 3.0 CMB 37 13.6 2.7 47
Table 11 : Mean apportionments of the fine PM (in % of the mean gravimetric fine PM)
o various components for the separate dry and wet season samples of the long-term (1994-2000) samplings at Rukomechi, Zimbabwe.
DRY season burning crustal sea salt sulphate smelters Unexpl.
APCA 67 13.9 3.1 9.8 0.76 5.0 PMF 66 6.8 9.4 15.4 3.5 -0.7 CMB 73 5.5 3.7 16.4 1.8
WET season burning crustal sea salt sulphate smelters Unexpl.
APCA 45 17.0 6.9 3.6 28 PMF 24 4.5 17.2 27 6.8 20 CMB 28 4.02 7.7 24 36
Table 11 shows, that for the fine size fraction in the dry season, the pyrogenic component is clearly dominating (in all 3 models), with about 70%; the sea-salt contribution is a factor of 3 higher in PMF than in APCA or CMB (and likely overestimated in PMF); the crustal and sulphate component contributions are similar in PMF and CMB; and there is virtually no unexplained mass in any of the 3 models. For the fine fraction in the wet season, the contribution of the pyrogenic component is nearly a factor of 2 higher in APCA than in PMF or CMB (and likely overestimated in APCA), the sea-salt contribution is a factor of 2 higher in PMF than in APCA or CMB (and likely overestimated in PMF); the pyrogenic, crustal, and sulphate component contributions are very similar in PMF and CMB, and the sulphate component is equally important as the pyrogenic component; there is, however, a substantial percentage of unexplained mass in all 3 models, which is likely due to biogenic

Project EV/11 - Characterisation and sources of carbonaceous atmospheric aerosols
SPSD II – PART 2 – Global Change, Ecocystems and Biodiversity – Climate 65
particles. No biogenic source profile was available (and included) in CMB. Furthermore, P or other good biogenic indicators were not available for the fine size fraction, so that no biogenic component could be extracted by the two multivariate receptor models APCA and PMF. The following conclusions can be drawn from the APCA/PMF/CMB comparison for Rukomechi. First, CMB is generally considered more reliable than multivariate receptor models. It had as drawback, though, that source profiles should be available for the contributing sources, and no source profile was available for the biogenic particles, so that the contribution from such particles ends up in the unexplained mass in CMB. This was especially the case for the wet season, when the percentage contribution from the biogenic aerosol should be substantial. Overall, fairly good agreement was obtained between the apportionments from PMF and CMB, but the sea-salt component is overestimated in PMF, though. The APCA results deviated somewhat from those of PMF and CMB. In the PCA and PMF for the SMOCC 2002 campaign, we included the combined UGent/UA data set (for 80 samplings) with PM2.5 concentrations of OC, WSOC, EC, and organic compounds, and with the fine (PM2) and coarse (2-10 µm) concentrations of the PM, BC, and selected elements. Seven components were identified by the VARIMAX rotated PCA (see Table 12). Together, they explained more than 90% of the variance in the data set. PMF gave similar results as the VARIMAX rotated PCA, but the primary biogenic/biological component (P_coarse, K_coarse) and the fungal spores component (mannitol, arabitol) merged into a single component. It can be concluded from both PMF and PCA that the pyrogenic component was clearly the dominant component in the fine aerosol during the SMOCC 2002 campaign. On the other hand, several other components were also identified. Although the dicarboxylic and hydroxycarboxylic acids were on a separate component, some of these acids were also in part associated with the pyrogenic component. It is further comforting that a separate 2-methyltetrol component was identified. This is consistent with a separate source, which is photo-oxidation of isoprene [Claeys et al., 2004a; 2004b].

Project EV/11 - Characterisation and sources of carbonaceous atmospheric aerosols
SPSD II – PART 2 – Global Change, Ecocystems and Biodiversity – Climate 66
Table 12 : Components identified by VARIMAX rotated PCA on the SMOCC 2002 data set, with species that are highly loaded (loading> 0.7, indicated by ++) or loaded
(loading in the range 0.55 – 0.7, indicated by +).
Component 1: pyrogenic ++ fine PM, OC, WSOC, EC, ++ anhydrosugars (levoglucosan, mannosan, galactosan, 1,6-anhydro-β-D-
glucofuranose), ++ phenolic acids (o-OH-benzoic acid, m-OH-benzoic acid, p-OH-benzoic acid,
vanillic acids), ++ K_Fine, Zn_Fine, Br_Fine, Rb_Fine, BC_Fine + succinic acid, fumaric acid, glutaric acid, α-OH-glutaric acid, S_Fine, I_Fine
Component 2: dicarboxylic acids / hydroxycarboxylic acids ++ fumaric acid, glutaric, β-OH-glutaric acid, malic acid, threonic acids, tartaric + succinic acid, glyceric acid, α-OH-glutaric acid
Component 3: crustal matter ++ Al_Fine, Fe_Fine, Al_Coarse, Fe_Coarse, ++ various other typical crustal elements (Si, Sc, Ti, La, Sm)
Component 4: Na component (aged sea salt) ++ Na_Fine, Na_Coarse
Component 5: tetrols ++ 2-methylthreitol, 2-methylerythritol
Component 6: primary biogenic component ++ P_Coarse + K_Coarse
Component 7: fungal spores ++ arabitol, mannitol Weakly associated with several components: S_Coarse, Ca_Coarse
Besides multivariate techniques and CMB, also tracers were used for source identification and apportionment. As indicated in section 6.1, the analyses of the UA team for saccharidic compounds allowed us to identify wood burning as an important source of the OC during winter in Ghent [Zdráhal et al., 2002]. In addition, from the concentrations of glucose, fructose, inositol, sucrose, and the sugar alcohols (arabitol and mannitol) for the same site, it could be concluded that primary biogenic/biological particles, such as grass pollen and fungal spores, provide a sizeable contribution to the OC during summer [Pashynska et al., 2002]. For the two sites in Tanzania, use was made of non-crustal, non-sea-salt K to apportion the OC to biomass burning and

Project EV/11 - Characterisation and sources of carbonaceous atmospheric aerosols
SPSD II – PART 2 – Global Change, Ecocystems and Biodiversity – Climate 67
other sources. Non-crustal, non-sea-salt K is considered a good indicator for biomass burning and it is reasonable to assume that it derives nearly exclusively from this source in Tanzania. Particulate OC at our two Tanzanian sites may originate from several sources, with for the rural site of Morogoro, biomass burning and primary and secondary biogenic organic matter as likely sources. At the Dar es Salaam kerbside, the OC is thought to originate essentially from automotive emissions and biomass burning. Andreae and Merlet [2001] reviewed the emissions of trace gases and aerosols from biomass burning and provided emission factors for many pyrogenic species that are emitted from various types of biomass burning, including (1) savanna and grassland, (2) tropical forest, (3) extratropical forest, (4) biofuel burning, (5) charcoal making, (6) charcoal burning, and (7) agricultural residues. For all these burning activities, with the exception of charcoal making, emission factors for particulate OC and K are available. Although charcoal making may be a source of OC at our two sites, because of the absence of emission factor data, it was not further considered in our analysis. Of the remaining activities, biofuel burning, charcoal burning, and to a lesser extent agricultural residues are thought to be possible contributors to the K and OC at Morogoro, whereas at Dar es Salaam, only charcoal burning is thought to be important. From the data given inTable 2 of Andreae and Merlet [2001], OC/K mass ratios of 76, 9, and 12 can be calculated for the emissions of biofuel burning, charcoal burning, and agricultural residues, respectively. Since we only included two tracers (i.e., K and OC) in our analysis, the contributions from only two sources could be estimated. We retained biofuel burning and charcoal burning as sources for the Morogoro site, and for Dar es Salaam, we included charcoal burning and automotive emissions. The average percentage apportionments of the OC to the two retained sources for each of the three campaigns at each of the sites are given in Table 13. The apportionments were done on a sample by sample basis and the individual percentages were then averaged over all samples for each campaign and each site. Very consistent results were obtained for Dar es Salaam, both on a sample by sample basis (as can be seen from the associated standard deviations) and from campaign to campaign. For Morogoro, there is a large difference between the results from the 2005 dry season campaign and the two wet season campaigns. It is hard to indicate the reasons for this behaviour. It may well be that there was a substantial contribution to the OC at Morogoro from the non-included natural biogenic/biological aerosol. The results for Morogoro should therefore be considered with great caution and further research is needed on the sources of OC for this site. For the Dar es Salaam kerbside, where the contribution from natural biogenic/biological aerosol should be very minor, the apportionment results are thought to be much more reliable.

Project EV/11 - Characterisation and sources of carbonaceous atmospheric aerosols
SPSD II – PART 2 – Global Change, Ecocystems and Biodiversity – Climate 68
Table 13 : Mean percentage attribution of the OC to two sources for the campaigns in Morogoro and Dar es Salaam.
Morogoro 05wet 05dry 06wet mean ± stdv. mean ± stdv. mean ± stdv.
biofuel 80 ± 15 14 ± 33 93 ± 9 charcoal 20 ± 15 86 ± 33 7 ± 9
Dar es Salaam 05wet 05dry 06wet mean ± stdv. mean ± stdv. mean ± stdv.
traffic 68 ± 13 73 ± 9 70 ± 12 charcoal 32 ± 13 27 ± 9 30 ± 12
The UGent team developed computer codes for the implementation of two methods for the identification of source locations and preferred transport pathways of atmospheric particulate trace elements and aerosol species. The two methods were versions of the potential source contribution function method (PSCF) and the concentration field method (CF). Both methods are based on combining chemical data with calculated air parcel backward trajectories. To calculate the backward trajectories, the three-dimensional model “Hybrid Single-Particle Lagrangian Integrated Trajectory” (HYSPLIT4) [Draxler and Hess, 1997] was installed on a Windows PC. NCEP/NCAR reanalysis data, obtained from the NOAA ftp site, were used as meteorological data input. The computer codes were applied for the analysis of four long-term multi-species aerosol time series of sites in Norway (Birkenes and Skreådalen), Finland (Sevettijärvi), and Israel (Sde Boker). The results obtained with the CF method for fine S are shown in Figure 12. It appears that the European part of Russia and the Urals are a common major source region for this species at the four sites. The same was largely also the case for the fine PM, but for Sde Boker there was also a local/regional source area, whereas the two sites in southern Norway were more impacted by sources in Poland, Belarussia, and the northern part of Ukraine. It was concluded that the application of trajectory statistical methods gives in many cases quite reasonable qualitative information on the source regions. More information on this study can be found in Lupu and Maenhaut [2002].

Project EV/11 - Characterisation and sources of carbonaceous atmospheric aerosols
SPSD II – PART 2 – Global Change, Ecocystems and Biodiversity – Climate 69
Figure 12 Fine sulphur concentration field (ng/m3), as computed using the CF method for Sevettijärvi,
Sde Boker, Birkenes, and Skreådalen. The location of the sites is indicated with an ‘x’.


Project EV/11 - Characterisation and sources of carbonaceous atmospheric aerosols
SPSD II – PART 2 – Global Change, Ecocystems and Biodiversity – Climate 71
9. RELATIONSHIPS BETWEEN THE CARBONACEOUS AEROSOL CHARAC-TERISTICS AND THE PHYSICAL AND OPTICAL/RADIATIVE AEROSOL PROPERTIES
This research was done in close co-operation with MPIC. MPIC performed the physical and optical/radiative measurements and the aerosol collections at the field sites discussed in this section.
During two intensive LBA measurement campaigns in 1999 at a remote rainforest site in Rondônia, Brazil, chemical, physical, and optical/radiative aerosol characteristics had been determined. The measurements included background (wet season), biomass burning (dry season), and transition period conditions. The optical measurements of light scattering and absorption were combined with data on number/size distributions in a new iterative method, which retrieves the effective imaginary refractive index of the particles at a wavelength of 545 nm. For ambient relative humidities lower than 80%, background aerosols exhibited an average refractive index of 1.42 - 0.006i. Biomass burning aerosols displayed a much larger imaginary part, with an average refractive index of 1.41 - 0.013i. Other climate-relevant parameters were estimated from Mie calculations. These included single-scattering albedos of 0.93 ± 0.03 and 0.90 ± 0.03 (at ambient humidity), asymmetry parameters of 0.63 ± 0.02 and 0.70 ± 0.03, and backscatter ratios of 0.12 ± 0.01 and 0.08 ± 0.01 for background and biomass burning aerosols, respectively [Guyon et al., 2003a].
The optical data of light scattering and absorption from the above campaigns at the forest site in Rondônia, Brazil, and also those from campaigns at a pasture site in the same state were used together with the aerosol chemical data in an APCA receptor modelling to identify and apportion the sources of light scattering and absorption [Guyon et al., 2004]. The wet season aerosol consisted mainly of a natural biogenic component, whereas pyrogenic aerosols dominated the dry season aerosol mass. The third component identified was soil dust, which was often internally mixed with the biomass-burning aerosol. All three components contributed significantly to light extinction during both the wet and dry seasons. At the pasture site, up to 47% of the light absorption was attributed to biogenic particles during the wet season, and up to 35% at the forest site during the wet-to-dry transition period. The results from the study suggested that, in addition to pyrogenic particles, biogenic and soil dust aerosols must be taken into account when modeling the physical and optical properties of aerosols in forested regions such as the Amazon Basin. The UGent team also worked together with the MPIC for assessing the light scattering by mineral dust and anthropogenic aerosol at Sde Boker in the Negev desert, Israel [Andreae et al., 2002].


Project EV/11 - Characterisation and sources of carbonaceous atmospheric aerosols
SPSD II – PART 2 – Global Change, Ecocystems and Biodiversity – Climate 73
10. VALORISATION ACTIVITIES AND EXPLOITATION OF THE RESULTS Throughout the entire duration of the project, extensive efforts were dedicated to the valorisation and exploitation of the research results. This work included writing of publications for international peer-reviewed scientific journals and presenting the results at several international conferences and meetings, such as at the final EUROTRAC-2 Symposium (in Garmisch-Partenkirchen in 2002), at two IGAC Conferences (the first one in Crete in 2002, the second in Cape Town, South Africa, in 2006), at the EGS-AGU-EUG Joint Assembly (in Nice in 2003), at the Eighth International Conference on Carbonaceous Particles in the Atmosphere (in Vienna in 2004), and at several European Aerosol Conferences (EACs). W. Maenhaut was quite active, as member of the steering committee, within the EUROTRAC 2 AEROSOL subproject (1997-2003) and he provided input for the Synthesis and Integration project of EUROTRAC-2. Further on the European level, he contributed to the European Aerosol Phenomenology activity [Van Dingenen et al., 2004; Putaud et al., 2004] and to the EMEP-TFMM (Task Force on Measurements and Modelling) activity [Maenhaut, 2007]. He participated in the joint EC-EUROTRAC aerosol data workshop, which was held in January 2001 in Ispra, Italy, in the workshop “Towards a Global Aerosol Phenomenology: Contrasting the Physical and Chemical Characteristics of European, North American and Asian Aerosols”, which was organised in October 2004 at the same location, and in the EMEP-TFMM workshop that was held in November 2006 in Paris. Inside Belgium, W. Maenhaut gave presentations at meetings for a broader public (including policy makers), i.e., at the “Studiedagen Fijn Stof”, which were organised by the Flemish Environmental Agency (VMM) in 2005, and at meetings in 2002 and 2005 organised by the “Koninklijke Vlaamse Ingenieursvereniging” (KVIV). He also provided input for the MIRA-T report in 2006. Both promoters contributed to Chapter 1 of the “Belgian global change research 1990-2002: Assessment and integration report” [den Ouden and Vanderstraeten, 2005]. W. Maenhaut and M. Claeys organised three half-day workshops at the UA, the first one took place in 2001 and was entitled “Physico-chemical Characterization, Source Identification, and Transboundary Transport of Atmospheric Aerosols over Southern Africa”, the two others were held in 2004 and were entitled “Analysis and Speciation of Long-range Transported Atmospheric Particles” and “Urban and rural carbonaceous aerosols in Flanders and Hungary: Characterisation, Source Identification and Apportionment, and Chemical Mass Closure”. A major organisational activity was that of the European Aerosol Conference 2005 (EAC 2005), which took place from 28 August to 2 September 2005, in Ghent and drew over 700 participants. W. Maenhaut was the chairman and editor of the abstract book

Project EV/11 - Characterisation and sources of carbonaceous atmospheric aerosols
SPSD II – PART 2 – Global Change, Ecocystems and Biodiversity – Climate 74
[Maenhaut, 2005] and M. Claeys a member of the Organising Committee. Within EAC 2005, there were several special SPO-related sessions, including one on policy relevant atmospheric aerosol research. The project also had a Users Committee, with as members (1) Dr. H.M. ten Brink from ECN, Petten, The Netherlands, (2) representatives from the “Ministerie van de Vlaamse Gemeenschap, Administratie Leefmilieu en Infrastructuur” (LIN - AMINAL), (3) representatives from the VMM, and (4) Dr. H. Duflou from SGS Depauw&Stokoe N.V., Antwerp. Two formal meetings of the Users Committee were held at the UA in the course of the project (one in 2003 and one in 2004), but there were also several contacts at other meetings, through E-mail or by phone, in particular with Dr. ten Brink and with the VMM. W. Maenhaut provided advice on aerosol sampling and analysis to the VMM and his team performed chemical analyses on samples from the VMM.

Project EV/11 - Characterisation and sources of carbonaceous atmospheric aerosols
SPSD II – PART 2 – Global Change, Ecocystems and Biodiversity – Climate 75
11. CONCLUSIONS AND RECOMMENDATIONS Significant progress was made for reaching the various objectives of the project, which were indicated in Chapter 1. With regard to objective (1), several approaches for the improved collection of carbonaceous aerosols, whereby the sampling artifacts are better controlled or can be corrected for, were examined. It was found that the relatively simple tandem filter approach, whereby two quartz fibre filters are used in series, and subtracting the back filter OC from the front filter OC gave in general reliable particulate OC data for our study sites. This approach is therefore suggested for routine aerosol composition studies in Europe. As to objective (2), improved methods were developed for the characterisation of the carbonaceous atmospheric aerosol. Better insights were obtained in the discrimination between EC and OC with thermal-optical methods, but the issue of the correct discrimination between both is still not settled. The discrimination clearly depends on the operational conditions. Therefore, these conditions should be clearly indicated when reporting EC and OC data from thermal-optical analysis. Several methods were developed in order to arrive at a complete molecular characterisation of the organic aerosol. Most of the OM remained unidentified by our techniques. More research on this topic is needed, in particular to elucidate the molecular composition of the HULIS, which makes up a large fraction of the WSOC. We identified new organic compounds in continental aerosols that can be used as markers for specific sources, source types or processes, and/or atmospheric processes. A major achievement was the discovery of the 2-methyltetrols, which are isoprene SOA compounds, in wet season aerosols from Amazonia. The same and additional isoprene SOA compounds were also found at a number of forested sites in Europe. Several additional tracer compounds are needed, though, for example, for SOA from other biogenic VOCs. It is worth mentioning that our discovery of the 2-methyltetrols has stimulated several aerosol research groups, including top groups such as that of Prof. J.H. Seinfeld (California Institute of Technology, Pasadena, CA, U.S.A.) and that of Prof. H. Herrmann (Leibniz Institute for Tropospheric Research, Leipzig, Germany), to investigate the SOA formation from isoprene in more detail. Our already existing and newly developed samplers and analytical methods were applied for detailed carbonaceous aerosol characterisation studies at several sites in Europe, in part within the framework of the EUROTRAC-2 AEROSOL subproject, and in tropical and equatorial regions, mainly within large international field campaigns that were organised under the auspices of IGBP-IGAC activities. The data on the carbonaceous aerosol were used in combination with data on inorganic aerosol

Project EV/11 - Characterisation and sources of carbonaceous atmospheric aerosols
SPSD II – PART 2 – Global Change, Ecocystems and Biodiversity – Climate 76
constituents and on the particulate mass for source apportionment and aerosol chemical mass closure work. At our sites in Belgium and elsewhere in Europe, SIA proved to be a very important aerosol component, whereas this was not the case at all for two sites in Tanzania. Although differences in ambient temperatures may be responsible for the observed differences in ammonium nitrate percentages, they cannot be invoked for the much lower nss-sulphate percentages in Tanzania. The very different percentages for this species are attributed to differences on the regional scale in the emissions of the SO2 precursor gas between our European sites and Tanzania. OM was the major aerosol component at the forested site at K-puszta and for SAFARI 2000 and SMOCC 2002; it was responsible for 45%, 50%, and 80% of the PM10 mass in these three studies. Although the OM is likely predominantly from natural origin at K-puszta, it remains unclear which fraction of it is biogenic SOA and which fraction is due to primary biogenic and biological aerosol. For the biomass burning campaigns in Rondônia and South Africa, the OM is undoubtedly mostly attributable to pyrogenic emissions. At our urban background sites in Belgium, OM accounted for between 25% and 30% of the PM10 mass. A large fraction of it is undoubtedly attributable to traffic and various other fossil fuel combustion sources, but the contributions from wood burning (in winter) and from natural biogenic and biological organic aerosol (in summer) are definitely not negligible. It is also unclear which fraction of the OM is SOA. Recent research has indicated a SOA dominance, even in heavily urbanized areas, which is in contrast with was generally thought [Robinson et al., 2007]. Further research is definitely needed in Belgium and Europe on the relative contributions to the OM of primary and secondary organic aerosol and of the anthropogenic and natural sources. It also should be kept in mind that there is a substantial uncertainty involved in the calculation of the OM from the experimentally measured OC. It is obvious that there is no single, generally applicable OC-to-OM conversion factor. The factor certainly depends on the type of site, the season, and the age of the aerosol. Further research on this topic is also needed. Within joint studies with other groups (especially within the IGBP-IGAC activities), we examined the relationships between the carbonaceous aerosol and physical aerosol and optical/radiative aerosol characteristics (e.g., CN and CCN concentrations and particle number size distributions, light scattering and absorption coefficients) in order to assess the contribution of the carbonaceous aerosol to the direct and indirect effects of aerosols on climate. However, much research remains to be done on the link of aerosols and climate, in particular on the indirect effects of aerosols on climate and the role of carbonaceous aerosols therein.

Project EV/11 - Characterisation and sources of carbonaceous atmospheric aerosols
SPSD II – PART 2 – Global Change, Ecocystems and Biodiversity – Climate 77
ACKNOWLEDGEMENTS This project was funded by the Belgian Federal Science Policy Office (SPO). Part of the research was done through complementary SPO-funded projects of the main project. Financial support was also received from other sources, i.e., the “Fonds voor Wetenschappelijk Onderzoek - Vlaanderen”, the Special Research Funds of Ghent University and the University of Antwerp, and the 5th Framework Programme of the European Commission through the project “Smoke Aerosols, Clouds, Rainfall and Climate: Aerosols from Biomass Burning Perturb Global and Regional Climate (SMOCC)” (Contract: EVK2-CT2001-00110). For the research team of W. Maenhaut, contributions were provided by Jan Cafmeyer, Xuguang Chi, Lucian Copolovici, Sheila Dunphy, Robert Hubacz, Alexandru Lupu, Urszula Majewska, Antonije Onjia, Nico Raes, Mar Viana, and Wang Wan. In the team of M. Claeys, contributions were provided by Alina Ion, Jozsef Jeko, Ivan Kourtchev, Vlada Pashynska, Hilde Van den Heuvel, Gyorgy Vas, Reinhilde Vermeylen, Wu Wang, Zbynek Zdráhal, and Ting Zhang. The complementary SPO-funded projects involved International collaboration with the Czech Republic, Hungary, and the Peoples Republic of China; i.e., with Zbynek Večeřa and co-workers, Institute of Analytical Chemistry, Academy of Sciences of the Czech Republic, Brno; Imre Salma and co-workers, Institute of Chemistry, Eötvös University, Budapest; and Xiande Liu and co-workers, at the start of the project at: National Research Centre for Environmental Analysis and Measurements (NRCEAM), Beijing, later at: Chinese Research Academy of Environmental Sciences (CRAES), Beijing. Furthermore, we benefited from co-operation with the following universities and institutes: - Biogeochemistry Department, Max Planck Inst. for Chemistry (MPIC), Mainz,
Germany: M.O. Andreae, F.X. Meixner and others (and also several other universities and institutions within the framework of the EU SMOCC project);
- Institute of Physics, University of Sao Paulo, Brazil: P. Artaxo and others; - Institute of Atmospheric Sciences and Climate (ISAC), Bologna, Italy: S. Fuzzi,
M.C. Facchini and others; - Department of Environmental Sciences, Weizmann Institute, Rehovot, Israel: Y.
Rudich and others; - Energy Research Centre of the Netherlands (ECN), Petten, The Netherlands: H.
ten Brink (and also several other European universities and institutions within the framework of the EUROTRAC-2 AEROSOL project);

Project EV/11 - Characterisation and sources of carbonaceous atmospheric aerosols
SPSD II – PART 2 – Global Change, Ecocystems and Biodiversity – Climate 78
- Department of Earth and Environmental Sciences, University of Pannonia, Veszprém, Hungary: A. Gelencsér and others;
- Institute of Earth Sciences ‘‘Jaume Almera’’, Barcelona, Spain: M. Viana and others;
- Department of Physical Sciences, University of Helsinki, Helsinki, Finland: M. Kulmala and others;
- Department of Inorganic and Analytical Chemistry, University of Mainz, Mainz, Germany: T. Hoffmann;
- National Exposure Research Laboratory, US Environmental Protection Agency, Research Triangle Park, NC, U.S.A.: T. Kleindienst, E. Edney and others;
- Laboratoire de Glaciologie et Géophysique de l'Environnement (LGGE), Saint-Martin-d'Hères, France: J.-L. Jaffrezo;
- Institute for Analytical Chemistry, Vienna University of Technology, Vienna, Austria: H. Puxbaum and others;
- Centre for Environmental and Marine Studies and Department of Environment, University of Aveiro, Aveiro, Portugal: C. Pio and others;
- Institute for Experimental Physics, University of Vienna, Vienna, Austria: R. Hitzenberger and others;
- Norwegian Institute for Air Research (NILU), Kjeller, Norway: K.E. Yttri, J.E. Hanssen and others;
- Institute of Chemical Process Fundamentals, Academy of Sciences of the Czech Republic, Prague, Czech Republic: J. Schwarz and others;
- J. Blaustein Institute for Desert Reserach, Ben Gurion University of the Negev, Sde Boker, Israel: A. Karnieli and others;
- University of the Witwatersrand, Johannesburg, South Africa: H.J. Annegarn and others;
- Department of Environmental Sciences, University of Virginia, Charlottesville, VA, U.S.A.: R. Swap;
- School of Applied Science, Monash University, Churchill, Australia: M.A. Hooper and others;
- Royal Meteorological Institute (RMI), Uccle, Belgium: H. De Backer and others; - Department of Chemistry, University of Antwerp (UA), Belgium: A. Worobiec, R.
Van Grieken and others; The financial support by the funding agencies and the work and/or assistance of the internal and external contributors is very much appreciated.

Project EV/11 - Characterisation and sources of carbonaceous atmospheric aerosols
SPSD II – PART 2 – Global Change, Ecocystems and Biodiversity – Climate 79
REFERENCES Andreae, M.O. and P.J. Crutzen. 1997. Atmospheric aerosols: Biogeochemical
sources and role in atmospheric chemistry, Science, 276: 1052-1058. Andreae, M.O. and P. Merlet. 2001. Emission of trace gases and aerosols from
biomass burning, Global Biogeochem. Cycles, 15: 955-966. Andreae, T.W., M.O. Andreae, C. Ichoku, W. Maenhaut, J. Cafmeyer, A. Karnieli and
L. Orlovsky. 2002. Light scattering by dust and anthropogenic aerosol at a remote site in the Negev desert, Israel, J. Geophys. Res., 107(D1): 4008, doi:10.1029/2001JD900252.
Anonymous. 2005. Lozingen in de lucht 1990-2005, Vlaamse Milieumaatschappij, Aalst, 236 pages + appendices.
Aymoz, G., J.L. Jaffrezo, D. Chapuis, J. Cozic and W. Maenhaut. 2007. Seasonal variation of PM10 main constituents in two valleys of the French Alps. I: EC/OC fractions, Atmos. Chem. Phys., 7: 661-675.
Birch, M.E. and R.A. Cary. 1996. Elemental carbon-based method for monitoring occupational exposures to particulate diesel exhaust, Aerosol Sci. Technol., 25: 221-241.
Cachier, H. 1998. Carbonaceous combustion aerosols, In: Atmospheric Particles. Harrison R.M. and R. Van Grieken (eds.). Wiley, New York: 295-348.
Cass, G.R. 1998. Organic molecular tracers for particulate air pollution sources, Trends Anal. Chem., 17: 356-366.
Chan, Y.C., R.W. Simpson, G.H. McTainsh, P.D. Vowles, D.D. Cohen and G.M. Bailey. 1997. Characterisation of chemical species in PM2.5 and PM10 aerosols in Brisbane, Australia, Atmos. Environ., 31: 3773-3785.
Charlson, R.J. and J. Heintzenberg (eds.). 1995. Aerosol Forcing of Climate, Wiley, Chichester, 416 pages.
Chow, J.C., J.G. Watson, L.C. Pritchett, W.R. Pierson, C.A. Frazier and R.G. Purcell. 1993. The DRI thermal/optical reflectance carbon analysis system: description, evaluation and applications in US air quality studies, Atmos. Environ., 27A: 1185-1201.
Chow, J.C., J.G. Watson, Z. Lu, D.H. Lowenthal, C.A. Frazier, P.A. Solomon, R.H. Thuillier and K. Magliano. 1996. Descriptive analysis of PM2.5 and PM10 at regionally representative locations during SJVAQS/AUSPEX, Atmos. Environ., 30: 2079-2112.
Claeys, M., B. Graham, G. Vas, W. Wang, R. Vermeylen, V. Pashynska, J. Cafmeyer, P. Guyon, M.O. Andreae, P. Artaxo and W. Maenhaut. 2004a. Formation of secondary organic aerosols through photooxidation of isoprene, Science, 303: 1173-1176.

Project EV/11 - Characterisation and sources of carbonaceous atmospheric aerosols
SPSD II – PART 2 – Global Change, Ecocystems and Biodiversity – Climate 80
Claeys, M., W. Wang, A.C. Ion, I. Kourtchev, A. Gelencsér and W. Maenhaut. 2004b. Formation of secondary organic aerosols from isoprene and its gas-phase oxidation products through reaction with hydrogen peroxide, Atmos. Environ., 38: 4093-4098.
Claeys, M., R. Szmigielski, I. Kourtchev, P. Van der Veken, R. Vermeylen, W. Maenhaut, M. Jaoui, T. Kleindienst, M. Lewandowski, J.H. Offenberg and E.O. Edney. 2007. Hydroxydicarboxylic acids: markers for secondary organic aerosol from the photooxidation of α-pinene, Environ. Sci. Technol., 41: 1628-1634.
Decesari, S., M.C. Facchini, S. Fuzzi and E. Tagliavini. 2000. Characterization of water-soluble organic compounds in atmospheric aerosol: A new approach, J. Geophys. Res., 105: 1481-1489.
Decesari, S., S. Fuzzi, M.C. Facchini, M. Mircea, L. Emblico, F. Cavalli, W. Maenhaut, X. Chi, G. Schkolnik, A. Falkovich, Y. Rudich, M. Claeys, V. Pashynska, G. Vas, I. Kourtchev, R. Vermeylen, A. Hoffer, M.O. Andreae, E. Tagliavini, F. Moretti and P. Artaxo. 2006. Characterization of the organic composition of aerosols from Rondônia, Brazil, during the LBA-SMOCC 2002 experiment and its representation through model compounds, Atmos. Chem. Phys., 6: 375-402.
den Ouden, G. and M. Vanderstraeten. 2005. Belgian global change research 1990-2002: Assessment and integration report, Belgian Federal Science Policy Office, Brussels, 214 pages (D/2004/1191/48).
Draxler, R.R. and G.D. Hess. 1997. Description of the HYSPLIT_4 modeling system, NOAA Technical Memorandum ERL ARL-224, Air Resources Laboratory, Silver Spring, MD, Web address: http://www.arl.noaa.gov/ready/hysplit4.html.
Eatough, D.J., D.A. Eatough, L. Lewis and A.D. Lewis. 1996. Fine particulate chemical composition and light extinction at Canyonlands National Park using organic particulate material concentrations obtained with a multisystem, multichannel diffusion denuder sampler, J. Geophys. Res., 101: 19515-19531.
Edney, E.O., T.E. Kleindienst, M. Jaoui, M. Lewandowski, J.H. Offenberg, W. Wang, and M. Claeys. 2005. Formation of 2-methyl tetrols and 2-methylglyceric acid in secondary organic aerosol from laboratory irradiated isoprene/NOx/SO2/air mixtures and their detection in ambient PM2.5 samples collected in the eastern United States, Atmos. Environ., 39: 5281-5289.
Falkovich, A.H., E.R. Graber, G. Schkolnik, Y. Rudich, W. Maenhaut and P. Artaxo. 2005. Low molecular weight organic acids in aerosol particles from Rondônia, Brazil, during the biomass-burning, transition and wet periods, Atmos. Chem. Phys., 5: 781-797.
Fine, P.M., G.R. Cass and B.R.T. Simoneit. 2001. Chemical characterization of fine particle emissions from fireplace combustion of woods grown in the northeastern United States, Environ. Sci. Technol., 35: 2665-2675.

Project EV/11 - Characterisation and sources of carbonaceous atmospheric aerosols
SPSD II – PART 2 – Global Change, Ecocystems and Biodiversity – Climate 81
Formenti, P., W. Elbert, W. Maenhaut, J. Haywood, S. Osborne and M.O. Andreae. 2003. Inorganic and carbonaceous aerosols during the Southern African Regional Science Initiative (SAFARI 2000) experiment: Chemical characteristics, physical properties, and emission data for smoke from African biomass burning, J. Geophys. Res., 108(D13): 8488, doi:10.1029/2002JD002408.
Fuzzi, S., S. Decesari, M.C. Facchini, F. Cavalli, L. Emblico, M. Mircea, M.O. Andreae, I. Trebs, A. Hoffer, P. Guyon, P. Artaxo, L.V. Rizzo, L.L. Lara, T. Pauliquevis, W. Maenhaut, N. Raes, X. Chi, O.L. Mayol-Bracero, L.L. Soto-García, M. Claeys, I. Kourtchev, J. Rissler, E. Swietlicki, E. Tagliavini, G. Schkolnik, A.H. Falkovich, Y. Rudich, G. Fisch and L.V. Gatti. 2007. Overview of the inorganic and organic composition of size-segregated aerosol in Rondônia, Brazil, from the biomass burning period to the onset of the wet season, J. Geophys. Res., 112: D01201, doi:10.1029/2005JD006741.
Graham, B., O.L. Mayol-Bracero, P. Guyon, G.C. Roberts, S. Decesari, M.C. Facchini, P. Artaxo, W. Maenhaut, P. Köll and M.O. Andreae. 2002. Water-soluble organic compounds in biomass burning aerosols over Amazonia, J. Geophys. Res., 107(D20): 8047, doi:10.1029/2001JD000336.
Graham, B., P. Guyon, W. Maenhaut, P.E. Taylor, M. Ebert, S. Matthias-Maser, O.L. Mayol-Bracero, R.H.M. Godoi, P. Artaxo, F.X. Meixner, M.A. Lima Moura, C.H. Eça D'Almeida Rocha, R. Van Grieken, M.M. Glovsky, R.C. Flagan and M.O. Andreae. 2003a. Composition and diurnal variability of the natural Amazonian aerosol, J. Geophys. Res., 108(D24): 4765, doi:10.1029/2003JD004049.
Graham, B., P. Guyon, P.E. Taylor, P. Artaxo, W. Maenhaut, M.M. Glovsky, R.C. Flagan and M.O. Andreae. 2003b. Organic compounds present in the natural Amazonian aerosol: Characterization by gas chromatography-mass spectrometry, J. Geophys. Res., 108(D24): 4766, doi:10.1029/2003JD003990.
Guyon, P., O. Boucher, B. Graham, J. Beck, O.L. Mayol-Bracero, G.C. Roberts, W. Maenhaut, P. Artaxo and M.O. Andreae. 2003a. Refractive index of aerosol particles over the Amazon tropical forest during LBA-EUSTACH 1999, J. Aerosol Sci., 34: 883-907.
Guyon, P., B. Graham, G.C. Roberts, O.L. Mayol-Bracero, W. Maenhaut, P. Artaxo and M.O. Andreae. 2003b. In-canopy gradients, composition, sources, and optical properties of aerosol over the Amazon forest, J. Geophys. Res., 108(D18): 4591, doi:10.1029/2003JD003465.
Guyon, P., B. Graham, G.C. Roberts, O.L. Mayol-Bracero, W. Maenhaut, P. Artaxo and M.O. Andreae. 2004. Sources of optically active aerosol particles over the Amazon forest, Atmos. Environ., 38: 1039-1051.
Hansen, A.D.A., H. Rosen and T. Novakov. 1984. The aethalometer, an instrument for the real time measurement of optical absorption by aerosol particles, Sci. Total Environ., 36: 191-196.

Project EV/11 - Characterisation and sources of carbonaceous atmospheric aerosols
SPSD II – PART 2 – Global Change, Ecocystems and Biodiversity – Climate 82
Henry, R.C. 1997. History and fundamentals of multivariate air quality receptor models, Chemom. Intell. Lab. Syst., 37: 525-530.
Henry, R.C., C.W. Lewis, P.K. Hopke and H.J. Williamson. 1984. Review of receptor model fundamentals, Atmos. Environ., 18: 1507-1515.
Hitzenberger, R., A. Berner, Z. Galambos, W. Maenhaut, J. Cafmeyer, J. Schwarz, K. Müller, G. Spindler, W. Wieprecht, K. Acker, R. Hillamo and T. Mäkelä. 2004. Intercomparison of methods to measure the mass concentration of the atmospheric aerosol during INTERCOMP2000 - influence of instrumentation and size cuts, Atmos. Environ., 38: 6467-6476.
Hoffmann, T. 1999. Atmospheric chemistry of biogenic hydrocarbons: The contribution of vegetation to secondary organic aerosols, EUROTRAC Newsletter, 21: 12-21.
Hopke, P.K., Y. Xie, T. Raunemaa, S. Biegalski, S. Landsberger, W. Maenhaut, P. Artaxo and D. Cohen. 1997. Characterization of the Gent stacked filter unit PM10 sampler, Aerosol Sci. Technol., 27: 726-735.
Ion, A.C., R. Vermeylen, I. Kourtchev, J. Cafmeyer, X. Chi, A. Gelencsér, W. Maenhaut and M. Claeys. 2005. Polar organic compounds in rural PM2.5 aerosols from K-puszta, Hungary, during a 2003 summer field campaign: sources and diel variations, Atmos. Chem. Phys., 5: 1805-1814.
Jacobson, M.C., H.-C. Hansson, K.J. Noone and R.J. Charlson. 2000. Organic atmospheric aerosols: Review and state of the science, Rev. Geophys., 38: 267-294.
Jaffrezo, J.L., N. Calas and M. Bouchet. 1998. Carboxylic acids measurements with ionic chromatography, Atmos. Environ., 32: 2705-2708.
Kamens, R.M. and D.L. Coe. 1997. A large gas-phase stripping device to investigate rates of PAH evaporation from airborne diesel soot particles, Environ. Sci. Technol., 31: 1830-1833.
Kawamura, K. 1993. Identification of C2-C10 ω-oxocarboxylic acids, pyruvic acid, and C2-C3 α-dicarbonyls in wet precipitation and aerosol samples by capillary GC and GC/MS, Anal. Chem., 65: 3505-3511.
Kourtchev, I., T. Ruuskanen, W. Maenhaut, M. Kulmala and M. Claeys. 2005a. Observation of 2-methyltetrols and related photo-oxidation products of isoprene in boreal forest aerosols from Hyytiälä, Finland, Atmos. Chem. Phys., 5: 2761-2770.
Kourtchev, I., J. Warnke, W. Maenhaut, T. Hoffmann and M. Claeys. 2005b. Characterisation of polar organic compounds in PM2.5 aerosols from Jülich, Germany, In: Abstracts of the European Aerosol Conference 2005 (EAC 2005), 28 August - 2 September 2005, Ghent, Belgium. Maenhaut W. (ed.). Abstract no. 546. (ISBN: 9080915939).
Krivácsy, Z., G. Kiss, D. Ceburnis, G. Jennings, W. Maenhaut, I. Salma and D. Shooter. 2007. Study of water-soluble atmospheric humic matter in urban and

Project EV/11 - Characterisation and sources of carbonaceous atmospheric aerosols
SPSD II – PART 2 – Global Change, Ecocystems and Biodiversity – Climate 83
marine environments, Atmos. Res., in press. Kubátová, A., R. Vermeylen, M. Claeys, J. Cafmeyer, W. Maenhaut, G. Roberts and
P. Artaxo. 2000. Carbonaceous aerosol characterisation in the Amazon basin, Brazil: Novel dicarboxylic acids and related compounds, Atmos. Environ., 34: 5037-5051.
Kubátová, A., R. Vermeylen, M. Claeys, J. Cafmeyer and W. Maenhaut. 2002. Organic compounds in urban aerosols from Gent, Belgium: Characterization, sources, and seasonal differences, J. Geophys. Res., 107(D21): 8343, doi:10.1029/2001JD000556.
Li, S.-M. and J.W. Winchester. 1993. Water soluble organic constituents in Arctic aerosols and snow pack, Geophys. Res. Lett., 20: 45-48.
Liousse, C., J.E. Penner, C. Chuang, J.J. Walton, H. Eddleman and H. Cachier. 1996. A global three-dimensional model study of carbonaceous aerosols, J. Geophys. Res., 101: 19411-19432.
Lowenthal, D.H., R.C. Hanumara, K.A. Rahn and L.A. Currie. 1987. Effects of systematic error, estimates and uncertainties in chemical mass balance apportionments: Quail Roost II revisited, Atmos. Environ., 21: 501-510.
Lupu, A. and W. Maenhaut. 2002. Application and comparison of two statistical trajectory techniques for identification of source regions of atmospheric aerosol species, Atmos. Environ., 36: 5607-5618.
Mader, B.T., J.J. Schauer, J.H. Seinfeld, R.C. Flagan, J.Z. Yu, H. Yang, H.J. Lim, B.J. Turpin, J.T. Deminter, G. Heidemann, M.S. Bae, P. Quinn, T. Bates, D.J. Eatough, B.J. Huebert, T. Bertram and S. Howell. 2003. Sampling methods used for the collection of particle-phase organic and elemental carbon during ACE-Asia, Atmos. Environ., 37: 1435-1449.
Maenhaut, W. 1996. Composition and origin of the regional atmospheric aerosol at great distance from anthropogenic source areas. Assessment of the extent of the anthropogenic perturbation. Belgian Impulse Programme “Global Change” 1990-1996, Final Report, Federal Office for Scientific, Technical and Cultural Affairs, 105 pages [published in 1997].
Maenhaut, W. (ed.). 2005. Abstracts of the European Aerosol Conference 2005 (EAC 2005), 28 August - 2 September 2005, Ghent, Belgium, 801 pages (ISBN: 9080915939).
Maenhaut, W. 2007. Atmospheric particulate matter in Belgium, In: EMEP Particulate Matter Assessment Report. Aas, W., P. Bruckmann, R. Derwent, N. Poisson, J.-P. Putaud, L. Rouil, S. Vidic and K.-E. Yttri (eds.). EMEP/CCC-Report 8/2007, O-7726, Norwegian Institute for Air Research, Kjeller, Norway: 95-108.
Maenhaut, W. and J. Cafmeyer. 1987. Particle induced X-ray emission analysis and multivariate techniques: an application to the study of the sources of respirable atmospheric particles in Gent, Belgium, J. Trace Microprobe Techn., 5: 135-158.

Project EV/11 - Characterisation and sources of carbonaceous atmospheric aerosols
SPSD II – PART 2 – Global Change, Ecocystems and Biodiversity – Climate 84
Maenhaut, W., F. François and J. Cafmeyer. 1994. The “Gent” stacked filter unit (SFU) sampler for the collection of aerosols in two size fractions: Description and instructions for installation and use, In: Applied Research on Air Pollution using Nuclear-Related Analytical Techniques. NAHRES-19, IAEA, Vienna: 249-263.
Maenhaut, W., R. Hillamo, T. Mäkelä, J.L. Jaffrezo, M.H. Bergin and C.I. Davidson. 1996a. A new cascade impactor for aerosol sampling with subsequent PIXE analysis, Nucl. Instr. and Meth., B109/110: 482-487.
Maenhaut, W., I. Salma, J. Cafmeyer, H.J. Annegarn and M.O. Andreae. 1996b. Regional atmospheric aerosol composition and sources in the eastern Transvaal, South Africa, and impact of biomass burning, J. Geophys. Res., 101: 23631-23650.
Maenhaut, W., J. Cafmeyer, X. Chi and J. Schwarz. 2001. Assessment of artifacts in filter collections for carbonaceous aerosols and the particulate mass, J. Aerosol Sci., 32, Suppl. 1: S673-S674.
Maenhaut, W., J. Cafmeyer, S. Dubtsov and X. Chi. 2002a. Detailed mass size distributions of elements and species, and aerosol chemical mass closure during fall 1999 at Gent, Belgium, Nucl. Instrum. and Meth., B189: 238-242.
Maenhaut, W., D.J.A. De Ridder, M.-T. Fernández-Jiménez, M.A. Hooper, B. Hooper and Ms Nurhayati. 2002b. Long-term observations of regional aerosol composition at two sites in Indonesia, Nucl. Instr. and Meth., B189: 259-265.
Maenhaut, W., M.-T. Fernández-Jiménez, I. Rajta and P. Artaxo. 2002c. Two-year study of atmospheric aerosols in Alta Floresta, Brazil: Multielemental composition and source apportionment, Nucl. Instr. and Meth., B189: 243-248.
Maenhaut, W., J. Schwarz, J. Cafmeyer and H.J. Annegarn. 2002d. Study of elemental mass size distributions at Skukuza, South Africa, during the SAFARI 2000 dry season campaign, Nucl. Instr. and Meth., B189: 254-258.
Maenhaut, W., J. Schwarz, J. Cafmeyer and X. Chi. 2002e. Aerosol chemical mass closure during the EUROTRAC-2 AEROSOL Intercomparison 2000, Nucl. Instrum. and Meth., B189: 233-237.
Maenhaut, W., X. Chi, J. Cafmeyer, P. Mikuška, Z. Večeřa and A. Broškovičová. 2003. Field investigations with a diffusion denuder for the elimination of sampling artifacts for carbonaceous aerosols, J. Aerosol Sci., Abstracts of the European Aerosol Conference 2003: S1171-S1172. (ISSN: 0021-8502).
Maenhaut, W., F. Adams and M. Claeys. 2004a. Sources, physico-chemical characteristics, and climate forcing of atmospheric aerosols, In: Scientific Support Plan for a Sustainable Development Policy, SPSD1. Volume I. Atmospheric Processes, Final Reports, Belgian Federal Science Policy Office, Brussels, Section III, 77 pages. (D/2002/47)
Maenhaut, W., X. Chi, J. Cafmeyer, I. Salma, P. Mikuška, A. Broškovičová and Z. Večeřa. 2004b. Investigations during summer field campaigns in central Europe on

Project EV/11 - Characterisation and sources of carbonaceous atmospheric aerosols
SPSD II – PART 2 – Global Change, Ecocystems and Biodiversity – Climate 85
the performance of a diffusion denuder for the elimination of sampling artifacts for carbonaceous aerosols, J. Aerosol Sci., Abstracts of the European Aerosol Conference 2004: S1069-S1070.
Maenhaut, W., S. Dong and X. Chi. 2004c. To which extent do organic and elemental carbon data from the thermal-optical transmission technique depend upon the operational parameters used? In: Abstract Book of the Eighth International Conference on Carbonaceous Particles in the Atmosphere, September 14-16, 2004, Vienna, Austria, p. 80.
Maenhaut, W., V. Pashynska, R. Vermeylen, G. Vas, X. Chi, N. Raes, J. Cafmeyer, P. Artaxo and M. Claeys. 2004d. Interrelationships and source identification of inorganic and organic aerosol constituents during the LBA/CLAIRE/SMOCC-2002 campaign, In: Abstract Book of the Eighth International Conference on Carbonaceous Particles in the Atmosphere, September 14-16, 2004, Vienna, Austria, p. 55.
Maenhaut, W., N. Raes, J. Cafmeyer and P. Artaxo. 2004e. Study of elemental mass size distributions in Amazonia during the LBA/CLAIRE/SMOCC 2002 campaign, In: Proceedings of the 10th International Conference on Particle-Induced X-ray Emission and its Analytical Applications, 4-8 June 2004, Portorož, Slovenia. Budnar M. and M. Kavčič (eds.). Ljubljana, J. Stefan Institute, pages 920.1 – 920.3 (published on CD rom). (ISBN: 961 6303-62-7).
Maenhaut, W., N. Raes, X. Chi, W. Wang, J. Cafmeyer, R. Ocskay and I. Salma. 2004f. Chemical composition and mass closure of the atmospheric aerosol at K-puszta, Hungary, in summer 2003, J. Aerosol Sci., Abstracts of the European Aerosol Conference 2004: S799-S800.
Maenhaut, W., X. Chi, M. Viana, J. Cafmeyer, P. Mikuška and Z. Večeřa. 2005a. Investigations during summer field campaigns in Ghent and Barcelona on the performance of a diffusion denuder for the elimination of sampling artifacts for carbonaceous aerosols, In: Abstracts of the European Aerosol Conference 2005 (EAC 2005), 28 August - 2 September 2005, Ghent, Belgium. Maenhaut W. (ed.). Abstract no. 572. (ISBN: 9080915939).
Maenhaut, W., N. Raes, X. Chi, J. Cafmeyer, W. Wang and I. Salma. 2005b. Chemical composition and mass closure for fine and coarse aerosols at a kerbside in Budapest, Hungary, in spring 2002, X-Ray Spectrom., 34: 290-296.
Maenhaut, W., N. Raes, H. De Backer and A. Cheymol. 2007a. Seasonal variability in atmospheric aerosol levels and elemental composition during 2006 at Uccle, Belgium, In: Proceedings of the 11th International Conference on Particle-Induced X-ray Emission and its Analytical Applications, Puebla, Mexico, 25-29 May 2007, in press (to be published on CD-rom).
Maenhaut, W., N. Raes and S. Mkoma. 2007b. Atmospheric levels and elemental composition of fine and coarse aerosols during wet and dry season campaigns at

Project EV/11 - Characterisation and sources of carbonaceous atmospheric aerosols
SPSD II – PART 2 – Global Change, Ecocystems and Biodiversity – Climate 86
two sites in Tanzania, In: Proceedings of the 11th International Conference on Particle-Induced X-ray Emission and its Analytical Applications, Puebla, Mexico, 25-29 May 2007, in press (to be published on CD-rom).
Marple, V.A., K.L. Rubow and S.M. Behm. 1991. A microorifice uniform deposit impactor (MOUDI): description, calibration and use, Aerosol Sci. Technol., 14: 434-446.
Mason, B. 1966. Principles of Geochemistry, 3rd Edition, Wiley, New York. Mikuška, P., Z. Večeřa, A. Broškovičová, M. Stepán, X. Chi and W. Maenhaut. 2003.
Development of a diffusion denuder for the elimination of sampling artifacts for carbonaceous aerosols, J. Aerosol Sci., Abstracts of the European Aerosol Conference 2003: S761-S762. (ISSN: 0021-8502).
Mircea, M., M.C. Facchini, S. Decesari, F. Cavalli, L. Emblico, S. Fuzzi, A. Vestin, J. Rissler, E. Swietlicki, G. Frank, M.O. Andreae, W. Maenhaut, Y. Rudich and P. Artaxo. 2005. Importance of the organic aerosol fraction for modeling aerosol hygroscopic growth and activation: a case study in the Amazon Basin, Atmos. Chem. Phys., 5: 3111-3126.
Mkoma, S.L., W. Maenhaut, X. Chi, W. Wang and N. Raes. 2007. Characterisation of PM10 atmospheric aerosols for the wet season 2005 at two sites in Tanzania, East Africa, Atmos. Environ., submitted.
Müller, K., G. Spindler, W. Maenhaut, R. Hitzenberger, W. Wieprecht, U. Baltensperger and H. ten Brink. 2004. INTERCOMP2000, a campaign to assess the comparability of methods in use in Europe for measuring aerosol composition, Atmos. Environ., 38: 6459-6466.
Nyanganyura, D., W. Maenhaut, M. Mathutu, A. Makarau and F.X. Meixner. 2007. The chemical composition of tropospheric aerosols and their contributing sources to a continental background site in northern Zimbabwe from 1994 to 2000, Atmos. Environ., 41: 2644-2659.
Ocskay, R., I. Salma, W. Wang and W. Maenhaut. 2006. Characterization and diurnal variation of size-resolved inorganic water-soluble ions at a rural background site in Hungary, J. Environ. Monit., 8: 300-306.
Paatero, P. 1999. The multilinear engine – a table-driven least squares program for solving multilinear problems, including the n-way parallel factor analysis model, J. Comput. Graphical Stat., 8: 854-888.
Paatero, P. and U. Tapper. 1994. Positive Matrix Factorization: a non-negative factor model with optimal utilization of error estimates of data values, Environmetrics, 5: 111-126.
Pashynska, V., R. Vermeylen, G. Vas, W. Maenhaut and M. Claeys. 2002. Development of a gas chromatography/ion trap mass spectrometry method for determination of levoglucosan and saccharidic compounds in atmospheric aerosols. Application to urban aerosols, J. Mass Spectrom., 37: 1249-1257.

Project EV/11 - Characterisation and sources of carbonaceous atmospheric aerosols
SPSD II – PART 2 – Global Change, Ecocystems and Biodiversity – Climate 87
Polissar, A.V., P.K. Hopke and J.M. Harris. 2001. Source regions for atmospheric aerosol measured at Barrow, Alaska, Environ. Sci. Technol., 35: 4214-4226.
Putaud, J.-P., F. Raes, R. Van Dingenen, U. Baltensperger, E. Brüggemann, M.-C. Facchini, S. Decesari, S. Fuzzi, R. Gehrig, C. Hüglin, P. Laj, G. Lorbeer, W. Maenhaut, N. Mihalopoulos, K. Müller, X. Querol, S. Rodriguez, J. Schneider, G. Spindler, H. ten Brink, K. Tørseth and A. Wiedensohler. 2004. A European Aerosol Phenomenology. 2: chemical characteristics of particulate matter at kerbside, urban, rural and background sites in Europe, Atmos. Environ., 38: 2579-2595.
Raes, N. and W. Maenhaut. 2007. Detailed aerosol and elemental mass size distributions during winter and summer campaigns in Ghent, Belgium, In: Proceedings of the 11th International Conference on Particle-Induced X-ray Emission and its Analytical Applications, Puebla, Mexico, 25-29 May 2007, in press (to be published on CD-rom).
Raes, N., W. Maenhaut, J. Cafmeyer and I. Salma. 2004. Detailed aerosol and elemental mass size distributions at K-Puszta, Hungary, during summer 2003, In: Proceedings of the 10th International Conference on Particle-Induced X-ray Emission and its Analytical Applications, 4-8 June 2004, Portorož, Slovenia. Budnar M. and M. Kavčič (eds.). Ljubljana, J. Stefan Institute, pages 922.1 – 922.3 (published on CD-rom). (ISBN: 961 6303-62-7).
Raes, N., R. Hubacz, J.E. Hanssen and W. Maenhaut. 2005. Application of three different receptor models to long-term data sets from southern Norway and the Norwegian Arctic, In: Abstracts of the European Aerosol Conference 2005 (EAC 2005), 28 August - 2 September 2005, Ghent, Belgium. Maenhaut W. (ed.). Abstract no. 288. (ISBN: 9080915939).
Raes, N., W. Maenhaut, D. Nyanganyura and F.X. Meixner. 2006. Examination of long-term aerosol data sets for Rukomechi, Zimbabwe, with three receptor models, In: Atmospheric Chemistry at the Interfaces, Cape Town, Sept 2006, Joint IGAC/CACGP/WMO Symposium, 17-22 September 2006, Cape Town, South Africa, p. 307. (published on CD-rom).
Reisinger, P., A. Wonaschütz, R. Hitzenberger, A. Petzold, H. Bauer, N. Jankowski, H. Puxbaum, X. Chi and W. Maenhaut. 2007. Intercomparison of measurement techniques for black or elemental carbon under urban background conditions in wintertime – influence of biomass combustion, Environ. Sci. Technol., in press.
Riley, J.P. and R. Chester. 1971. Introduction to Marine Chemistry, Academic, New York.
Robinson, A.L., N.M. Donahue, M.K. Shrivastava, E.A. Weitkamp, A.M. Sage, A.P. Grieshop, T.E. Lane, J.R. Pierce and S.N. Pandis. 2007. Rethinking organic aerosols: Semivolatile emissions and photochemical aging, Science, 315: 1259-1262.
Rogge, W.F., M.A. Mazurek, L.M. Hildemann and G.R. Cass. 1993. Quantification of

Project EV/11 - Characterisation and sources of carbonaceous atmospheric aerosols
SPSD II – PART 2 – Global Change, Ecocystems and Biodiversity – Climate 88
urban organic aerosols at a molecular level: Identification, abundance and seasonal variation, Atmos. Environ., 27A: 1309-1330.
Salma, I. and W. Maenhaut. 2006. Changes in elemental composition and mass of atmospheric aerosol between 1996 and 2002 in a Central European city, Environ. Pollution, 143: 479-488.
Salma, I., X. Chi and W. Maenhaut. 2004. Elemental and organic carbon in urban canyon and background environments in Budapest, Hungary, Atmos. Environ., 38: 27-36.
Salma, I., R. Ocskay, N. Raes and W. Maenhaut. 2005. Fine structure of mass size distributions in urban environment, Atmos. Environ., 39: 5363-5374.
Salma, I., R. Ocskay, I. Varga and W. Maenhaut. 2006. Surface tension of atmospheric humic-like substances in connection with relaxation, dilution, and solution pH, J. Geophys. Res., 111: D23205, doi:10.1029/2005JD007015.
Salma, I., R. Ocskay, X. Chi and W. Maenhaut. 2007. Sampling artefacts, concentration and chemical composition of fine water-soluble organic carbon and humic-like substances in a continental urban atmospheric environment, Atmos. Environ., 41: 4106-4118.
Saxena, P. and L.M. Hildemann. 1996. Water-soluble organics in atmospheric particles: A critical review of the literature and application of thermodynamics to identify candidate compounds, J. Atmos. Chem., 24: 57-109.
Schaap, M., G. Spindler, M. Schulz, K. Acker, W. Maenhaut, A. Berner, W. Wieprecht, N. Streit, K. Müller, E. Brüggemann, X. Chi, J.-P. Putaud, R. Hitzenberger, H. Puxbaum, U. Baltensperger and H. ten Brink. 2004. Artefacts in the sampling of nitrate studied in the “INTERCOMP” campaigns of EUROTRAC-AEROSOL, Atmos. Environ., 38: 6487-6496.
Schauer, J.J., W.F. Rogge, L.M. Hildemann, M.A. Mazurek, G.R. Cass and B.R.T. Simoneit. 1996. Source apportionment of airborne particulate matter using organic compounds as tracers, Atmos. Environ., 30: 3837-3855.
Schauer, J.J., B.T. Mader, J.T. Deminter, G. Heidemann, M.S. Bae, J.H. Seinfeld, R.C. Flagan, R.A. Cary, D. Smith, B.J. Huebert, T. Bertram, S. Howell, J.T. Kline, P. Quinn, T. Bates, B. Turpin, H.J. Lim, J.Z. Yu, H. Yang and M.D. Keywood. 2003. ACE-Asia intercomparison of a thermal-optical method for the determination of particle-phase organic and elemental carbon, Environ. Sci. Technol., 37: 993-1001.
Schkolnik, G., A.H. Falkovich, Y. Rudich, W. Maenhaut and P. Artaxo. 2005. New analytical method for the determination of levoglucosan, polyhydroxy compounds, and 2-methylerythritol and its application to smoke and rainwater samples, Environ. Sci. Technol., 39: 2744-2752.
Schmid, H., L. Laskus, H.J. Abraham, U. Baltensperger, V. Lavanchy, M. Bizjak, P. Burba, H. Cachier, D. Crow, J. Chow, T. Gnauk, A. Even, H.M. ten Brink, K.-P. Giesen, R. Hitzenberger, C. Hueglin, W. Maenhaut, C. Pio, A. Carvalho, J.-P.

Project EV/11 - Characterisation and sources of carbonaceous atmospheric aerosols
SPSD II – PART 2 – Global Change, Ecocystems and Biodiversity – Climate 89
Putaud, D. Toom-Sauntry and H. Puxbaum. 2001. Results of the “carbon conference” international aerosol carbon round robin test stage I, Atmos. Environ., 35: 2111-2121.
Schwarz, J., X. Chi, W. Maenhaut, M. Civiš, J. Hovorka and J. Smolík. 2007. Elemental and organic carbon in atmospheric aerosols at two urban background sites in Prague, Atmos. Res., submitted.
Sciare, J., K. Oikonomou, H. Cachier, N. Mihalopoulos, M.O. Andreae, W. Maenhaut and R. Sarda-Estève. 2005. Aerosol mass closure and reconstruction of the light scattering coefficient over the Eastern Mediterranean Sea during the MINOS campaign, Atmos. Chem. Phys., 5: 2253-2265.
Seibert, P., H. Kromp-Kolb, U. Baltensperger, D.T. Jost, M. Schwikowski, A. Kasper and H. Puxbaum. 1994. Trajectory analysis of aerosol measurements at high alpine sites, In: Transport and Transformation of Pollutants in the Troposphere. Borrell, P.M., P. Borrell and T. Cvitaš (eds.). Academic Publishing, Den Haag: 689-693.
Seinfeld, J.H. and S.N. Pandis. 1998. Atmospheric Chemistry and Physics, Wiley, New York, 1326 pages.
Solomon, P.A., J.L. Moyers and R.A. Fletcher. 1983. High-volume dichotomous sampler virtual impactor for the fractionation and collection of particles according to aerodynamic size, Aerosol Sci. Technol., 2: 455-464.
Stohl, A. 1996. Trajectory statistics - a new method to establish source-receptor relationships of air pollutants and its application to the transport of particulate sulfate in Europe, Atmos. Environ., 30: 579-587.
Strommen, M.R. and R.M. Kamens. 1999. Simulation of semivolatile organic compound microtransport at different time scales in airborne diesel soot particles, Environ. Sci. Technol., 33: 1738-1746.
Swap, R.J., H.J. Annegarn, J.T. Suttles, J. Haywood, M.C. Helmlinger, C. Hely, P.V. Hobbs, B.N. Holben, J. Ji, M.D. King, T. Landmann, W. Maenhaut, L. Otter, B. Pak, S.J. Piketh, S. Platnick, J. Privette, D. Roy, A.M. Thompson, D. Ward and R. Yokelson. 2002. The Southern African Regional Science Initiative (SAFARI 2000): overview of the dry season field campaign, S. Afr. J. Sci., 98, Nos. 3-4: 125-130.
Tagliavini, E., F. Moretti, S. Decesari, M.C. Facchini, S. Fuzzi and W. Maenhaut. 2006. Functional group analysis by H NMR / chemical derivatization for the characterization of organic aerosol from the SMOCC field campaign, Atmos. Chem. Phys., 6: 1003-1019.
ten Brink, H., U. Baltensperger, R. Jaenicke, W. Maenhaut, M. Memmesheimer, K. Mueller, H. Puxbaum and F. Raes. 1999. EUROTRAC-2 AEROSOL, Annual Report 1998, EUROTRAC-2 ISS, GSF, München, 101 pages.
ten Brink, H., H. Puxbaum, W. Maenhaut, J.-P. Putaud, U. Baltensperger and K. Müller. 2002/2003. Challenges in sampling and analysis of aerosol carbon. A

Project EV/11 - Characterisation and sources of carbonaceous atmospheric aerosols
SPSD II – PART 2 – Global Change, Ecocystems and Biodiversity – Climate 90
central research topic in the Eurotrac-2 AEROSOL subproject, Eurotrac Newsletter, no. 24: 26-31.
ten Brink, H., W. Maenhaut, R. Hitzenberger, T. Gnauk, G. Spindler, A. Even, X. Chi, H. Bauer, H. Puxbaum, J.-P. Putaud, J. Tursic and A. Berner. 2004. INTERCOMP2000: the comparability of methods in use in Europe for measuring the carbon content of aerosol, Atmos. Environ., 38: 6507-6519.
Trebs, I., M.O. Andreae, W. Elbert, O.L. Mayol-Bracero, L.L. Soto-García, Y. Rudich, A.H. Falkovich, W. Maenhaut, P. Artaxo, R. Otjes and J. Slanina. 2007. Aerosol inorganic composition at a tropical site: Discrepancies between filter-based samplers and a semi-continuous method, Aerosol Sci. Technol., submitted.
Turpin, B.J. 1999. Options for characterizing organic particulate matter, Environ. Sci. Technol., 33: 76A-79A.
Turpin, B.J. and J.J. Huntzicker. 1995. Identification of secondary organic aerosol episodes and quantitation of primary and secondary organic aerosol concentrations during SCAQS, Atmos. Environ., 29: 3527-3544.
Turpin, B.J. and H.J. Lim. 2001. Species contributions to PM2.5 mass concentrations: Revisiting common assumptions for estimating organic mass, Aerosol Sci. Technol., 35: 602-610.
Turpin, B.J., S.V. Hering and J.J. Huntzicker. 1994. Investigation of organic aerosol sampling artifacts in the Los Angeles Basin, Atmos. Environ., 28: 3061-3071.
Turpin, B.J., P. Saxena and E. Andrews. 2000. Measuring and simulating particulate organics in the atmosphere: problems and prospects, Atmos. Environ., 34: 2983-3013.
Vanderzalm, J.L., M.A. Hooper, B. Ryan, W. Maenhaut, P. Martin, P.R. Rayment and B.M. Hooper. 2003. Impact of seasonal biomass burning on air quality in the “Top End” of regional Northern Australia, Clean Air and Environmental Quality, 37, No. 3: 28-34.
Van Dingenen, R., F. Raes, J.-P. Putaud, U. Baltensperger, A. Charron, M.-C. Facchini, S. Decesari, S. Fuzzi, R. Gehrig, H.-C. Hansson, R.M. Harrison, C. Hüglin, A.M. Jones, P. Laj, G. Lorbeer, W. Maenhaut, F. Palmgren, X. Querol, S. Rodriguez, J. Schneider, H. ten Brink, P. Tunved, K. Tørseth, B. Wehner, E. Weingartner, A. Wiedensohler and P. Wåhlin. 2004. A European Aerosol Phenomenology. 1: physical characteristics of particulate matter at kerbside, urban, rural and background sites in Europe, Atmos. Environ., 38: 2561-2577.
Verma, S., O. Boucher, H.C. Upadhyaya and O.P. Sharma. 2006. Sulfate aerosols forcing: An estimate using a three-dimensional interactive chemistry scheme, Atmos. Environ., 40: 7953-7962.
Viana, M., X. Chi, W. Maenhaut, J. Cafmeyer, X. Querol, A. Alastuey, P. Mikuška and Z. Večeřa. 2006a. Influence of sampling artefacts on PM, OC and EC levels in carbonaceous aerosols in an urban area, Aerosol Sci. Technol., 40: 107-117.

Project EV/11 - Characterisation and sources of carbonaceous atmospheric aerosols
SPSD II – PART 2 – Global Change, Ecocystems and Biodiversity – Climate 91
Viana, M., X. Chi, W. Maenhaut, X. Querol, A. Alastuey, P. Mikuška and Z. Večeřa. 2006b. Organic and elemental carbon concentrations in carbonaceous aerosols during summer and winter sampling campaigns in Barcelona, Spain, Atmos. Environ., 40: 2180-2193.
Viana, M., W. Maenhaut, X. Chi, X. Querol and A. Alastuey. 2007a. Comparative chemical mass closure of fine and coarse aerosols at two sites in South and West Europe: implications for EU air pollution policies, Atmos. Environ., 41: 315-326.
Viana, M., W. Maenhaut, H.M. ten Brink, X. Chi, E. Weijers, X. Querol, A. Alastuey, P. Mikuška and Z. Večeřa. 2007b. Comparative analysis of organic and elemental carbon concentrations in carbonaceous aerosols in three European cities, Atmos. Environ., 41: 5972-5983.
VMM. 2006. Luchtkwaliteit in het Vlaamse Gewest – 2005, Vlaamse Milieumaatschappij, Aalst, 166 pages + appendices.
Wang, W., G. Vas, R. Dommisse, K. Loones and M. Claeys. 2004. Fragmentation study of diastereoisomeric 2-methyltetrols, oxidation products of isoprene, as their trimethylsilyl ethers, using gas chromatography/ion trap mass spectrometry, Rapid Commun. Mass Spectrom., 18: 1787-1797.
Wang, W., I. Kourtchev, B. Graham, J. Cafmeyer, W. Maenhaut and M. Claeys. 2005. Characterization of oxygenated derivatives of isoprene related to 2-methyltetrols in Amazonian aerosols using trimethylsilylation and gas chromatography/ion trap mass spectrometry, Rapid Commun. Mass Spectrom., 19: 1343-1351.
Watson, J.G., J.A. Cooper and J.J. Huntzicker. 1984. The effective variance weighting for least squares calculations applied to the mass balance receptor model, Atmos. Environ., 18: 1347-1355.
Watson, J.G., J.C. Chow and L.-W.A. Chen. 2005. Summary of organic and elemental carbon/black carbon analysis methods and intercomparisons, Aerosol and Air Quality Res., 5: 65-102.
Wieprecht, W., K. Acker, K. Müller, G. Spindler, E. Brüggemann, W. Maenhaut, X. Chi, R. Hitzenberger, H. Bauer and H. ten Brink. 2004. INTERCOMP2000: Ionic constitution and comparison of filter and impactor, Atmos. Environ., 38: 6477-6486.
Yttri, K.E., W. Aas, A. Bjerke, D. Ceburnis, C. Dye, L. Emblico, M.C. Facchini, C. Forster, J.E. Hanssen, H.C. Hansson, S.G. Jennings, W. Maenhaut, J.P. Putaud and K. Tørseth. 2007. Elemental and organic carbon in PM10: A one year measurement campaign within the European monitoring and Evaluation Programme EMEP, Atmos. Chem. Physics Discuss., 7: 3859-3899.
Zdráhal, Z., R. Vermeylen, M. Claeys and W. Maenhaut. 2001. Characterization of tricarboxylic acids in tropical biomass burning aerosols, In: Proceedings of the 49th ASMS Conference on Mass Spectrometry and Allied Topics, Chicago, Illinois,

Project EV/11 - Characterisation and sources of carbonaceous atmospheric aerosols
SPSD II – PART 2 – Global Change, Ecocystems and Biodiversity – Climate 92
May 27-31, 2001, 2 pages. (published on CD rom). Zdráhal, Z., J. Oliveira, R. Vermeylen, M. Claeys and W. Maenhaut. 2002. Improved
method for quantifying levoglucosan and related monosaccharide anhydrides in atmospheric aerosols and application to samples from urban and tropical locations, Environ. Sci. Technol., 36: 747-753.