ev project: solar-assisted charging demo · ev project - solar-assisted charging demo . ... and...
TRANSCRIPT

ORNL is managed by UT-Battelle for the US Department of Energy
Principal Investigator: Melissa Lapsa
2014 DOE Vehicle Technologies Office Review Presentation EV Project - Solar-Assisted Charging Demo
VSS138
2014 U.S. DOE Hydrogen Program and Vehicle Technologies Program Annual Merit Review and Peer Evaluation Meeting
June 16-20, 2014
This presentation does not contain any proprietary, confidential, or otherwise restricted information

Overview
2
Timeline • Start date August 2009 • End date September 2014 • 80% complete
Barriers • Integrating multiple technologies • Securing site hosts • Market acceptance of EVs • Securing cost-share partners
Budget • Total project funding
• DOE share $6.8 million • Matching partners’ share $6.8
million • Yearly spending:
FY10 $514,000 FY11 $1,661,000 FY12 $2,777,000 FY13 $1,283,000 FY14 $280,000 (through March)
Partners • Project lead – ORNL • Project partners – TVA, Nissan, EPRI, State of Tennessee, and eight site hosts across Tennessee

Objectives
3
• Advance the adoption of clean vehicle technology (plug-in vehicles) through: - The deployment of 125 solar-assisted EV charging stations and 19
non-solar-assisted EV charging stations - Encouraging the acquisition and use of plug-in vehicles - Creating key partnerships across Tennessee
• Integrate renewable energy, vehicle charging, grid connection, and external battery storage into a single design
• Develop and test peak-shaving algorithms for offsetting plug-in vehicle grid demand
• Collect and analyze vehicle charging data for understanding grid impacts and station use patterns
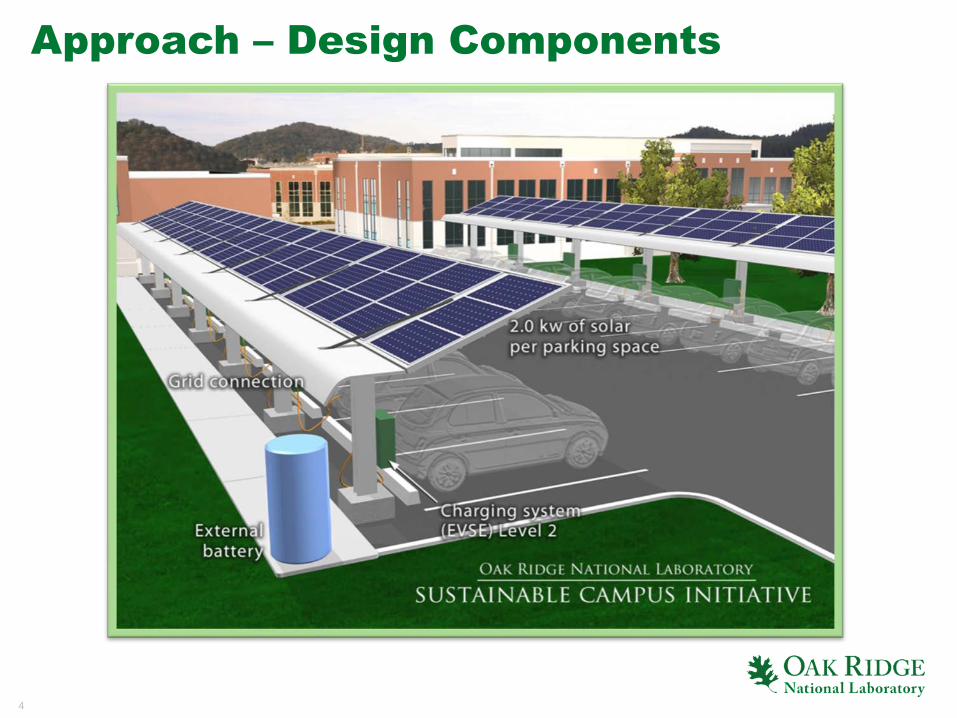
Approach – Design Components
4
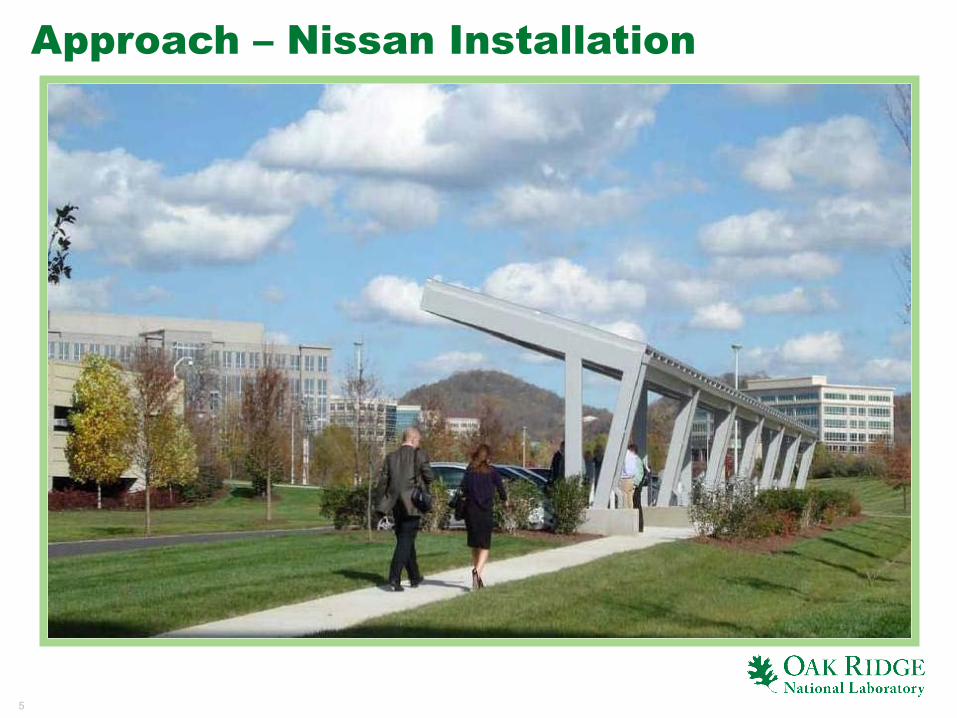
Approach – Nissan Installation
5
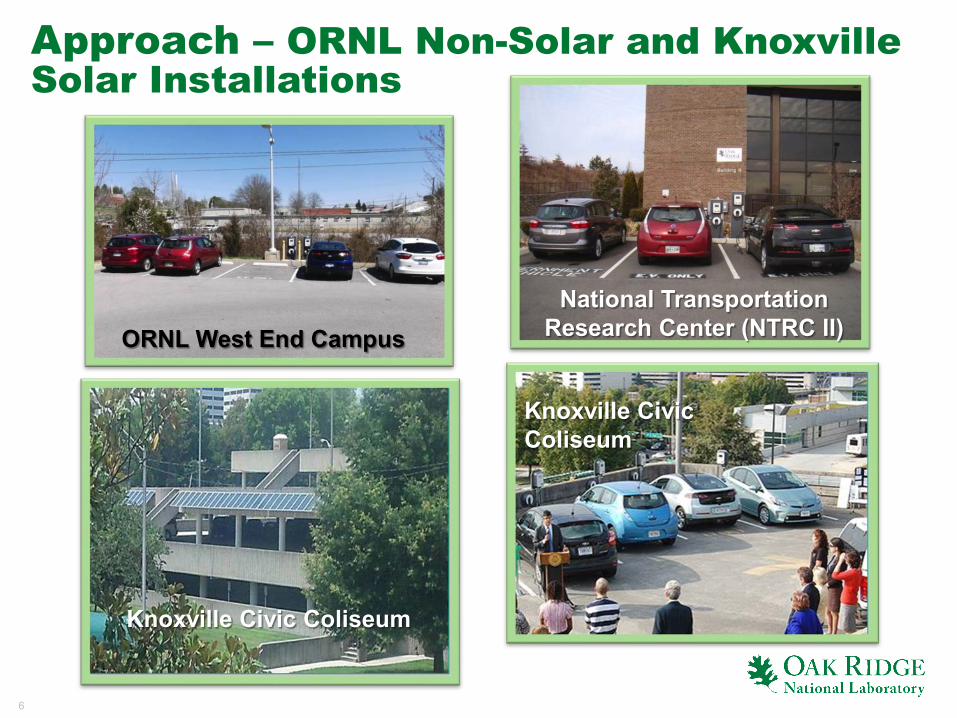
Approach – ORNL Non-Solar and Knoxville Solar Installations
6
ORNL West End Campus
Knoxville Civic Coliseum
National Transportation Research Center (NTRC II)
Knoxville Civic Coliseum

Approach – Other Installations
7
ORNL Solar Assisted
Vanderbilt University
Technical Approach
8
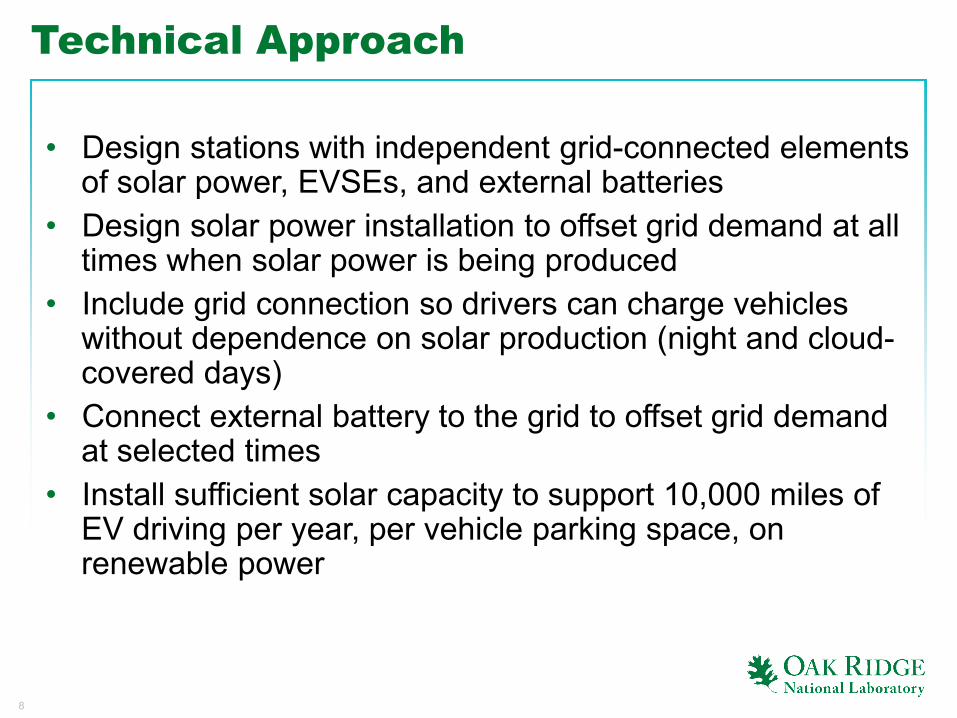
• Design stations with independent grid-connected elements
of solar power, EVSEs, and external batteries • Design solar power installation to offset grid demand at all
times when solar power is being produced • Include grid connection so drivers can charge vehicles
without dependence on solar production (night and cloud-covered days)
• Connect external battery to the grid to offset grid demand at selected times
• Install sufficient solar capacity to support 10,000 miles of EV driving per year, per vehicle parking space, on renewable power

Technical Approach - Continued
9
• Use commercially-available, UL-listed components given
public use of the stations
• Develop real-time website to display cars charging, solar production, state of external battery, and ‘net solar vs. demand’ for project to date
• Collect and analyze data on charging station utilization and energy use (consistent with requirements of the DOE grant)
• Develop an ongoing statewide team for review of data and for making strategic choices (TEVAC – Tennessee Electric Vehicle Advisory Council)

Technical Approach - General System Diagram
10
Power Grid
EVSE-1 EVSE-2
… EVSE-##
Photovoltaic Array
Battery Bank

Technical Accomplishments and Progress
11
• Installed 144 fully-functional EV charging stations • Cost-share partners made the agreed-to investments and
installed the agreed-to infrastructure • Successfully integrated the power grid, solar power,
EVSE, and external batteries into a single design • Developed a real-time website for monitoring the solar-
assisted station at ORNL https://extwebapps.ornl.gov/pvev_ext
• Tested, selected, and deployed a peak-shaving algorithm to optimize use of the external battery
• Converted raw data into user-friendly energy consumption and station utilization charts
• Embarked on the creation of an I-40 corridor EV charging route across Tennessee
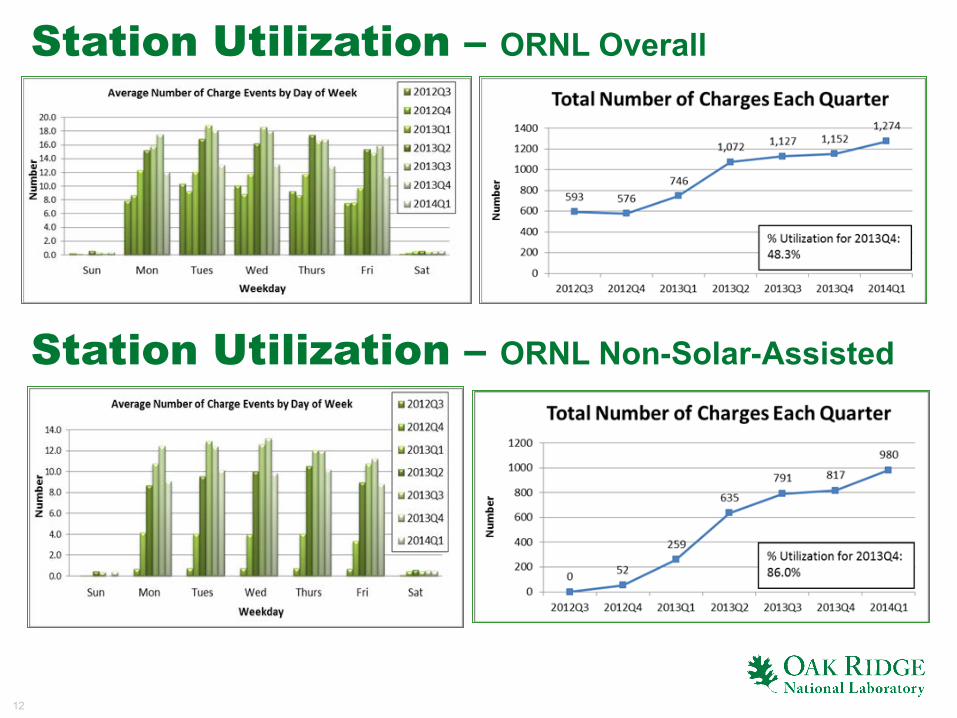
Station Utilization – ORNL Overall
12
Station Utilization – ORNL Non-Solar-Assisted

Station Utilization – ORNL Solar-Assisted
13

ORNL (Quarter 3, 2013) Nashville State (Quarter 3, 2013)
Comparison of ORNL Campus and Public Setting – Energy Consumption
0
100
200
300
400
500
0 30 60 90
Freq
uenc
y
Miles/charge (mi)
Additional miles available from each charge event
Min: 0.00 Max: 63.41 Avg: 24.45
0
100
200
300
400
0 6 12 18 24 30
Freq
uenc
y
Energy consumed per plug-in (kWh)
Energy consumption per charge
Min: 0.00 Max: 22.17 Avg: 8.55
0
10
20
30
0 6 12 18 24 30
Freq
uenc
y
Energy consumed per plug-in (kWh)
Energy consumption per charge
Min: 0.36 Max: 20.81 Avg: 9.10
0
10
20
30
40
50
0 20 40 60 80 100
Freq
uenc
y
MIles/charge (mi)
Additional miles available from each charge event
Min: 1.03 Max: 59.52 Avg: 26.04

ORNL (Quarter 3, 2013) Nashville State (Quarter 3, 2013)
Comparison of ORNL Campus and Public Settings: Charging Times
0
50
100
150
200
250
1 4 7 10 13 16 19 22
Freq
uenc
y
Time (hh)
Disconnect Times Min: 12:13 AM Max: 11:44 PM Avg: 3:24 PM
0
100
200
300
400
1 4 7 10 13 16 19 22
Freq
uenc
y
Time (hh)
Connection Times Min: 2:32 AM Max: 9:17 PM Avg: 9:37 AM
0
10
20
30
40
1 4 7 10 13 16 19 22
Freq
uenc
y
Time (hh)
Disconnect Times
Min: 12:21 AM Max: 11:51 PM Avg: 4:39 PM
0
10
20
30
40
1 4 7 10 13 16 19 22
Freq
uenc
y
Time (hh)
Connection Times Min: 1:30 AM Max: 11:40 PM Avg: 1:21 PM

Technical Accomplishments and Progress - Peak Shaving Algorithms
16
Control System #1
• Open-loop system
• Discharge/charge batteries at constant rate
• Defined times to start and stop discharging
• Does not take PV power and EV charging load into consideration
• Charging occurs during the night time
Increasing Complexity
Control System #2
• Closed-loop system
• Takes into consideration PV power and EV charging load
• Rate of discharge determined by number of charging EVs (linear function)
• Charging occurs during the night time
Control System #3
• Similar to control system #2
• Uses a sigmoid function to determine the rate of discharge
• Charging occurs at night and times during the day where PV generation is greater than EV charging load

Technical Accomplishments and Progress - Peak Shaving Algorithms
17
• The most shaving occurred for control systems #2 and #3.
• Control #2 has slightly better results for a workplace setting.
• Control #3 has the best results for a public setting.
Actual Load Shaved/Potential Load Shaved
Control System ORNL Knoxville
1 33.99% 0.37% 2 60.61% 74.74% 3 59.03% 76.62%
Battery Use Efficiency
Control System ORNL Knoxville
1 17.97% 0.17% 2 100% 100% 3 100% 100%

Collaborations/Partnerships
18
• Nissan North America – Installed 30 solar-assisted charging stations at a cost of more than $1.7 million
• Tennessee Valley Authority with EPRI – Installed 36 solar-assisted charging stations at a cost of more than $2.75 million
• State of Tennessee – Provided vehicle incentives in excess of $1.8 million and infrastructure commitment of $2.5 million
• Eight site hosts including the State of Tennessee, Nashville Metro Government, University of Tennessee, Vanderbilt University, City of Knoxville, City of Chattanooga, Shelby County in Memphis, and Tennessee Valley Authority (TVA)

Future Work
19
• Potential partnership (CRADA) with Car Charging to continue analyzing data in Tennessee to: • Improve utilization of all Blink stations across Tennessee • Enhance DOE’s ‘return on investment’ by growing the use of the stations • Enable improved planning for future infrastructure • Continue grid impact/peak shaving analysis to better understand ways to
mitigate EV charging impacts to the grid
• Complete the State of Tennessee funded project for additional infrastructure • Interstate 40 corridor for fast charging stations • Additional Level 2 charging • Selected metro sites for fast chargers
• Implement post-project plan for employee use of stations at
ORNL
• Continue with the Tennessee Electric Vehicle Advisory Council
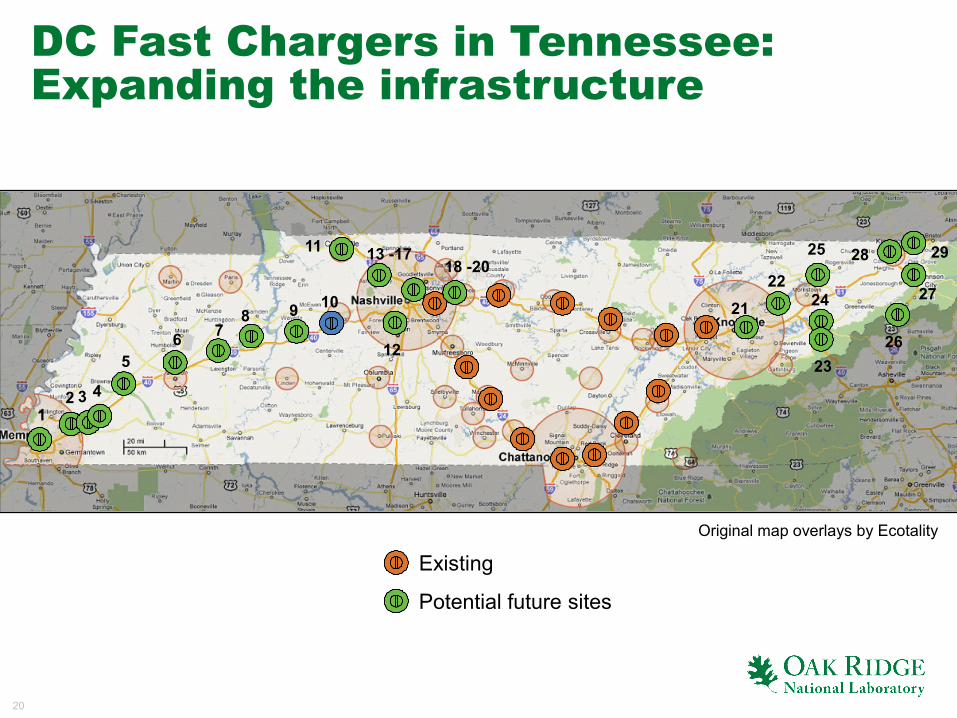
DC Fast Chargers in Tennessee: Expanding the infrastructure
20
Existing
Potential future sites
1 2 4
7 8 9
13 -17
10 21 22
24
28 29
27
5 12
3
6
18 -20
23
Original map overlays by Ecotality
11 25
26

Summary Slide
21
• Objectives Have Been Met • Planned charging stations are installed and functioning • Cost share dollars have been spent or are being spent • Peak shaving algorithm has been developed and deployed • Key partnerships are in place across Tennessee • Data is being collected, summarized, and used • The final report is in preparation and will be submitted by 9/30/14 • Stayed within budget and met all deliverables
• Future actions offer excellent potential
• Project was not reviewed last year