eutrophication of lakes cannot be controlled by reducing ... · phorus (p) (2, 5–7). schindler...
TRANSCRIPT

Eutrophication of lakes cannot be controlled byreducing nitrogen input: Results of a 37-yearwhole-ecosystem experimentDavid W. Schindler*†, R. E. Hecky‡, D. L. Findlay§, M. P. Stainton§, B. R. Parker*, M. J. Paterson§, K. G. Beaty§, M. Lyng§,and S. E. M. Kasian§
*Department of Biological Sciences, University of Alberta, Edmonton, AB, Canada T6G 2E9; ‡Department of Biology, University of Minnesota,Duluth, MN 55812; and §Freshwater Institute, Canadian Department of Fisheries and Oceans, Winnipeg, MB, Canada R3T 2N6
Contributed by David W. Schindler, May 28, 2008 (sent for review March 25, 2008)
Lake 227, a small lake in the Precambrian Shield at the ExperimentalLakes Area (ELA), has been fertilized for 37 years with constantannual inputs of phosphorus and decreasing inputs of nitrogen totest the theory that controlling nitrogen inputs can control eu-trophication. For the final 16 years (1990–2005), the lake wasfertilized with phosphorus alone. Reducing nitrogen inputs in-creasingly favored nitrogen-fixing cyanobacteria as a response bythe phytoplankton community to extreme seasonal nitrogen lim-itation. Nitrogen fixation was sufficient to allow biomass to con-tinue to be produced in proportion to phosphorus, and the lakeremained highly eutrophic, despite showing indications of extremenitrogen limitation seasonally. To reduce eutrophication, the focusof management must be on decreasing inputs of phosphorus.
cyanobacteria blooms � Experimental Lakes � nutrient limitation �phosphorus
Eutrophication is the general term used by aquatic scientiststo describe the suite of symptoms that a lake exhibits in
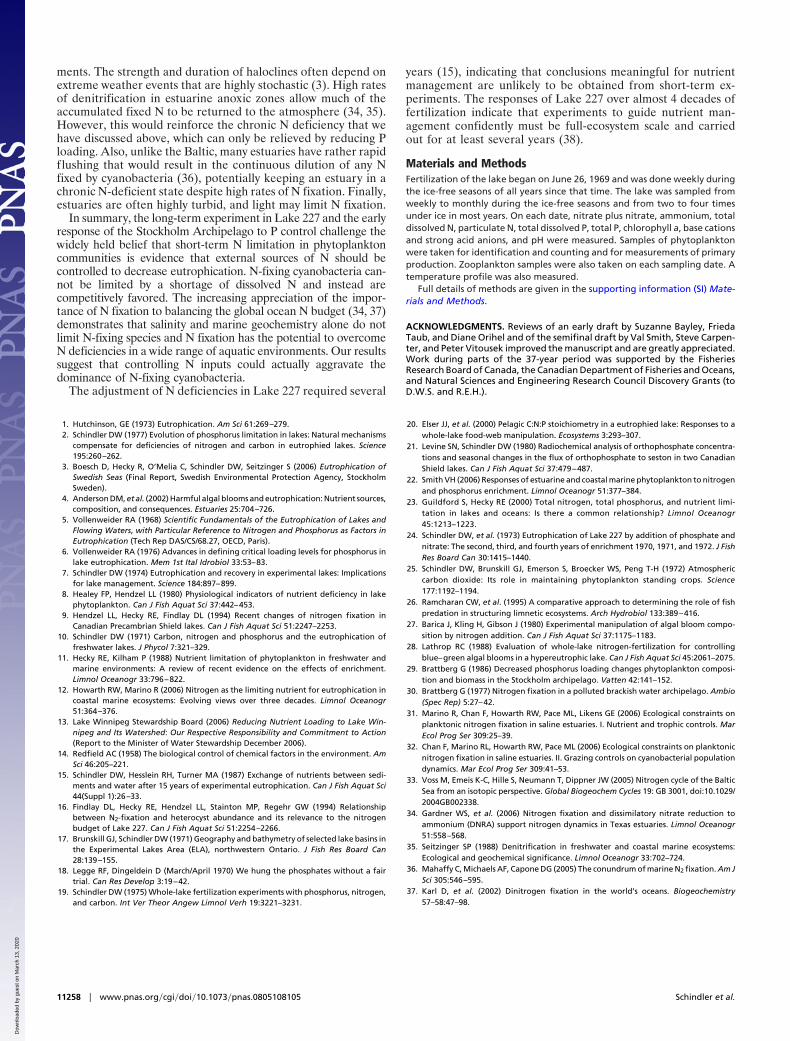
response to fertilization with nutrients (1). Common symptomsinclude dense algal blooms causing high turbidity and increasinganoxia in the deeper parts of lakes from the decay of sedimentingplant material. The anoxia can in turn cause fish kills inmidsummer. One of the most objectionable symptoms of eu-trophication has been the appearance of floating algal ‘‘blooms’’(Fig. 1). In freshwaters, these surface blooms are often ofnitrogen (N)-fixing cyanobacteria (known popularly as blue–green algae) (2). Similar forms are also common in manyeutrophied estuaries (3) although other types of nuisance algalblooms are also common (4).
The emphasis on controlling eutrophication in freshwaterlakes has been focused heavily on decreasing inputs of phos-phorus (P) (2, 5–7). Schindler (2, 7) noted that many lakesrendered eutrophic by the addition of P contained phytoplank-ton communities that showed signs of extreme N limitation inshort-term bioassays such as N debt (8, 9) or nutrient additionbioassays (10), He concluded that N limitation was a symptomof overfertilization with P and proposed that short-term Nlimitation was not necessarily a reliable indication that N mustbe controlled to reverse eutrophication. Hecky and Kilham (11)also warned that short-term measures of N deficiency were notreliable indicators of ecosystem responses to N enrichment orremoval. Despite these early warnings, many studies in lakes andestuaries still conclude that N must be controlled as well as, orinstead of, P to reduce eutrophication (for review, see ref. 12).The subject is hotly debated with respect to reducing eutrophi-cation in the Baltic Sea (3). Recently, there has been renewedadvocacy of N control to mitigate eutrophication of both lakesand estuaries. N and P control is being proposed to halt the rapidincrease in eutrophication in Lake Winnipeg (13) and the BalticSea (3). This is troubling because proponents of controlling N inlakes and estuaries are relying on the same bioassays or corre-lations with nutrient concentrations that we (2, 7, 11) found to
lead to the erroneous conclusion that N inputs must be con-trolled to reduce eutrophication. These bioassays and the relatedassumptions have led to very expensive mitigation programs inseveral countries.
Aquatic scientists have often relied on the Redfield ratio togauge whether nutrient supplies are sufficient. Redfield (14)observed that the ratio of carbon:nitrogen:phosphorus in marinephytoplankton was quite constant, with mean ratios by weight of�40:7:1. The Redfield ratio has subsequently been accepted asa general indicator for balanced growth with potential for nearoptimum growth rates (8). In the Experimental Lakes Area(ELA), lakes rendered eutrophic by experimental additions of Nand P at N:P ratios less than Redfield ratio (7:1 weight ratio)have had N concentrations increase to above Redfield ratios asthe result of N fixation by diazotrophic heterocystous cyanobac-teria (2, 9, 15, 16). Algal biomass and chlorophyll a haveremained proportional to P inputs regardless of the ratio of N:Padded as fertilizer. Here, we describe a deliberate and extremelong-term experiment to test the effectiveness of controlling Non eutrophication.
The Lake and Its Experimental Treatments. Lake 227 in the ELA ofnorthwestern Ontario, Canada, has a surface area of 5.0 ha, amean depth of 4.4 m, and a maximum depth of 10.0 m (17). InJune 1969, fertilization of the lake began with P and N to test thehypothesis then popular in North America that C could limiteutrophication of lakes (18). For the first five years (1969–1974),the ratio of N to P in fertilizer was added at 12: 1 by weight, wellabove the Redfield ratio, to ensure that phytoplankton hadadequate N and P supplies during the period when we weretesting the C limitation hypothesis. Lake 227 became highlyeutrophic, producing phytoplankton blooms in proportion to Psupplies, despite phytoplankton showing symptoms of extreme Climitation for most of the summer months. C deficiency reduceddaily rates of photosynthesis, but phytoplankton biomass in-creased until limited by P (19). In a second experiment in nearbyLake 226, we deliberately tested the effects of N limitation, byadding N and C to two isolated basins, but phosphorus only toone basin (North). N:P ratios in North Basin fertilizer were 4.6
Author contributions: D.W.S., R.E.H., and M.J.P. designed research; K.G.B. and M.L. per-formed research; D.L.F., M.P.S., B.R.P., and S.E.M.K. analyzed data; D.L.F. identified andquantified the phytoplankton; M.P.S. performed or supervised the chemical analyses; B.R.P.constructed the figures; K.G.B. and M.L. performed hydrological and meteorologicalmeasurements; and D.W.S. and R.E.H. wrote the paper.
The authors declare no conflict of interest.
Freely available online through the PNAS open access option.
See Commentary on page 11039.
†To whom correspondence should be addressed. E-mail: [email protected].
This article contains supporting information online at www.pnas.org/cgi/content/full/0805108105/DCSupplemental.
© 2008 by The National Academy of Sciences of the USA
11254–11258 � PNAS � August 12, 2008 � vol. 105 � no. 32 www.pnas.org�cgi�doi�10.1073�pnas.0805108105
Dow
nloa
ded
by g
uest
on
Mar
ch 1
3, 2
020

to 5.5:1 by weight, well below the Redfield ratio. Large algalblooms were again in proportion to P additions, but the respond-ing species were primarily N-fixing cyanobacteria (2, 7). To testfurther the hypothesis that low N:P favored N-fixing species, theratio of N to P in fertilizer added to Lake 227 was decreased to4:1 beginning in 1975. The hypothesis was supported, and Nfixation was high in subsequent years (2, 15, 16). Lake 227continued to be fertilized at this N:P ratio through 1989. By thattime there were signs that the lake was becoming both C- andN-sufficient because of slowly increasing concentrations of theseelements as the result of several years of atmospheric invasionand net fixation and retention of N2 and CO2 (15). As nutrientbalance was approached, the domination of phytoplankton byN-fixing cyanobacteria was decreasing (16), and short-term Nlimitation was less pronounced (9). From 1990 onward, no Nfertilizer has been added to the lake. P continues to be added,and P inputs have remained relatively constant throughout the37 years of fertilization (Table 1).
Superimposed on the nutrient fertilization was a short-term(4-year) food web manipulation (20). In 1993–1994, pike Esoxlucius were added to the lake, which had contained only largenumbers of forage fish, including fathead minnows (Pimephalespromelas) and several species of dace (Semotilus margarita,Phoxinus eos, and Phoxinus neogaeus). By 1996, predation by pikehad extirpated all forage fish. They have remained absent, andthe lake fishless after all pike were removed in 1996 (ref. 20 andK. Mills, unpublished observation).
Nutrient Concentrations and Ratios. Concentrations of total phos-phorus (TP) in the epilimnion during ice-free season in all years
of fertilization averaged 42 �g/liter (Fig. 2A). Concentrations oftotal dissolved phosphorus (TDP) averaged 11 �g/liter (Fig. 2B).There was no significant long-term trend in either form. Solublereactive P was not routinely measured, but it was generally wellbelow the limit of detection except by radioactive P bioassays,i.e., in the nanogram per liter range (21).
Fig. 1. Photograph of Grand Beach on the southern basin of Lake Winnipeg,August 2006. Photo by Lori Volkart.
Table 1. Summary of annual fertilizer additions to Lake 227,1969–2005
YearN, kg
per yearP, kg
per yearN:P byweight
1969 249 20.7 12.11970–1974 308 24.8 12.41975–1982 110 23.6 4.661983 110 19.8 5.541984–1989 110 23.6 4.661990–1997 0 23.6 01998 0 31.9 01999–2005 0 24.5 0
A
B
C
D
E
F
Fig. 2. Mean annual epilimnetic nutrient concentrations and ratios in Lake 227,1969–2005. Periods separated by vertical dashed lines represent: I, the period offertilization at high N:P (12:1 by weight) 1969–1974; II, the period of fertilizationwith low N:P (4:1), 1975–1989; III–V, the period when no N fertilizer was added tothe lake. IV, theyears (1993–1996) thatpikewerepresent inthe lake.The lakewasfishless after 1996. (A) Total P. (B) Total dissolved P. (C) Total N. (D) Total inorganicnitrogen (�NH4 �NO2 �NO3). (E) Ratio by weight of total N to total P in the lake.(F) Ratio by weight of TIN to TDP.
Schindler et al. PNAS � August 12, 2008 � vol. 105 � no. 32 � 11255
ENV
IRO
NM
ENTA
LSC
IEN
CES
SEE
COM
MEN
TARY
Dow
nloa
ded
by g
uest
on
Mar
ch 1
3, 2
020

Total nitrogen (TN) in Lake 227 averaged 825 �g of N per literin 1969–1974, the period when high N fertilizer was added (Fig.2C). It stayed constant for several years after N fertilizer wasdecreased, then increased in 1978, staying at �1,200 �g/literthrough 1989. After termination of N fertilization in 1990, itdecreased very slowly to �800 �g of N per liter after 1999.Dissolved inorganic N, the sum of nitrate, nitrite, and ammo-nium (TIN) was highest in the 1969–1974 period, when high Nfertilizer was applied (Fig. 2D). It averaged 128 �g of N per liter.After 1975, there was no significant long-term trend. Meanvalues for 1975–1989, when N fertilizer was added, and 1990–2004, when no N was added were almost identical, 77 and 76�g/liter, respectively. Concentrations of TIN were high in winterand spring but decreased to low concentrations in early summerwhen the phytoplankton exhibited strong N deficiency that wassubsequently relieved as N-fixing cyanobacteria increased tohigh midsummer biomasses (9). An analysis of the data through1984 revealed that the lake had attained steady-state with inputsof both N and C by that time (15).
Ratios of TN:TP in the lake were usually much higher thanRedfield ratios (7:1 by weight; Fig. 2E). Average values for1969–1974, 1975–1989, and after 1990 were 22–28 by weight,above the value of 20:1 where N limitation is usually inferred infreshwater or marine systems (22, 23). It is noteworthy thataverage TIN:TDP ratios were occasionally below Redfield ratiosafter 1975 (Fig. 2F). However, average TIN:TDP ratios equaledor exceeded Redfield ratios in all three fertilization periods, at14, 7, and 10 by weight. The N:P in fertilizer was zero after 1989,so these mean ratios were maintained entirely by N fixation andnitrogen recycled within the lake.
Response of the Phytoplankton and N Fixation. From 1969–1974, allgroups of phytoplankton increased as the result of fertilizationwith high N:P (Fig. 3). The algal assemblage was dominated bysmall unicellular desmids with large populations of Limnothrixredekei occurring from late June until early September. N-fixingcyanobacteria were not detected (24) as N was being added inexcess of algal demand and TIN:TDP ratios were high (Fig. 2F).C necessary for algal biomass was supplied by invasion of CO2to the lake from the atmosphere (25). Short-term bioassaysindicated that C-limited photosynthesis and algal growth and did
not predict the continued growth of algal biomass in proportionto P.
N-fixing cyanobacteria first appeared in significant numbers in1975, within weeks of reducing the N:P ratio in loading (ref. 2 andFig. 3). Aphanizomenon schindlerii appeared first, and by theearly 1980s it dominated the summer assemblage. The averageannual importance of N fixers varied considerably from 1975through 1989. They were always the dominant part of thephytoplankton biomass in July and August. Annual Aphanizom-enon biomass diminished slowly and became more variableduring the late 1980s. After N fertilization ceased in 1990, Nfixers (primarily A. schindlerii) always formed �50% of the totalphytoplankton biomass, except in 1996, the terminal year of thefood web manipulation (20). From 1996 when the lake becamefishless to the present, the algal community became more diversewith increased representation by chrysophytes, diatoms, cryp-tophytes, and dinoflagellates. Nonfixing cyanobacteria, mostnotably L. redekei, remained prominent throughout the experi-ment but tended to increase after midsummer blooms of N-fixingcyanobacteria, suggesting a competitive advantage over the Nfixers when recycled fixed N became available.
Phytoplankton biomass averaged 9,306 mg m�3. There wereno significant differences in annual average biomass among theperiods when different N:P ratios were applied. Variability inphytoplankton biomass was high, ranging from 1,502 mg m�3 in1996 to 39,000 mg m�3 in 1982.
Chlorophyll a is frequently used as a measure of phytoplank-ton biomass especially in short-term bioassays. Annual averagesduring the term of the experiment ranged from 17 to 59 �gliter�1, with higher values occurring when the N:P ratio infertilizer was high (Fig. 4A). Interannual variation in chlorophyllwas higher during the periods when N fertilizer was added thanafter 1990. The chlorophyll a:biomass ratio was also less variable
Fig. 3. Phytoplankton biomass in the epilimnion by algal group, 1969–2005.Vertical dashed lines were as in Fig. 2. In the Legend, ‘‘cyanobacteria’’ refersto cyanobacteria species that are not known to fix nitrogen. ‘‘Nitrogen fixers’’refers to N-fixing species of cyanobacteria.
A
B
C
D
Fig. 4. Other measures of phytoplankton and nitrogen fixation, 1969–2005.(A) Chlorophyll a. (B) Ratio of chlorophyll a:phytoplankton biomass (�g/mm3).(C) Nitrogen fixation calculated from heterocyst counts. (D) Heterocyst counts.Vertical dashed lines are as in Fig. 2.
11256 � www.pnas.org�cgi�doi�10.1073�pnas.0805108105 Schindler et al.
Dow
nloa
ded
by g
uest
on
Mar
ch 1
3, 2
020

when no N fertilizer was added (Fig. 4B). It f luctuated in anarrow range, except for high values in 1980 and 1996. In those2 years, N-fixing cyanobacteria populations were low, and othertaxa dominated the phytoplankton. Average chlorophyll a:bio-mass in the first several years of the experiment was somewhathigher than in the last 20 years. These results demonstrate thatchlorophyll a per unit of biomass is higher when N is in excessof algal requirements. Conversely, if the algal community ismade more N-deficient, chlorophyll per unit biomass declines.Consequently, nutrient enrichment experiments that rely only onchlorophyll a as a measure of phytoplankton abundance may givemisleading results about changes in biomass.
N fixation was negligible before 1975, when fertilizer N:Pratios were high (Fig. 4C). From 1975 onward, fixation by thelake varied from 0.2 to 2.1 g m�2 year�1 with the exception of1996, when no fixation occurred after food chain manipulation.By the late 1980s when indicators of N limitation were weakening(9), N fixation had stabilized at 0.5–0.6 g of N m�2 year�1,approximately half of the highest values in earlier years. Afterfertilization with N was terminated in 1990, fixation increasedagain for several years. It decreased to zero in 1996, after whichfixation returned to �1 g of N m�2 year�1 then increased againin 2004–2005 to �2 g of N m�2 year�1, the highest valuesrecorded in the 37-year dataset.
Changes Caused by the ‘‘Trophic Cascade’’: 1996. The response ofphytoplankton in 1996, after fish were extirpated, stands out. Inthat year, the zooplankton consisted primarily of large Daphniapulicaria, as the result of decreased zooplanktivory by fish.Addition of pike in 1993–1994 and prior minnow trapping hadextirpated populations of forage fish, as described earlier. Pikewere removed in late 1995 and early 1996, rendering Lake 227fishless. During that year, TIN and chlorophyll a:biomass werehigh and comparable with values observed before 1975, whenratios of added N:P were high. However, chlorophyll a andphytoplankton biomass were very low in 1996. N-fixing cya-nobacteria and N fixation were unmeasurable. Increased sedi-mentation of P and excretion of TIN as the result of high grazingby Daphnia appeared to be responsible for the high TIN (20). Nfixers returned to dominance in 1997 and in subsequent years asDaphnia populations returned to low abundances. Invertebratepredators such as Chaoborus have increased after fish removaland may now be the dominant predator on Daphnia and otherzooplankton. Before 1996, predation by fish likely limited theabundance of invertebrate predators (26).
Interpretation. Although there was no increase in the abundanceof N-fixing cyanobacteria after N fertilization ceased in 1990,heterocyst numbers and subsequent N fixation increased greatly(Fig. 3 C and D). Despite the reduction of N fertilizer to zero,P additions kept the lake eutrophic, with no substantial changesin biomass of phytoplankton. We suggest that in most freshwaterlakes, attempts to manage N inputs will be equally futile. Indeed,addition of N to a hypereutrophic lake caused N-fixing cya-nobacteria to be suppressed, allowing other species to thrive(27). In another case study, N addition was futile because it wasrapidly denitrified. Water quality improved, but this was attrib-uted to a fish kill and subsequent expansion of macrophyte cover(28). Unless N concentrations are of concern for human health,funds for eutrophication control are better spent on morecomplete removal of P sources. This work also demonstrates thenecessity of using studies at whole-ecosystem scales for managingecosystems. Bottle bioassays or mesocosm studies cannot prop-erly account for important long-term processes such as atmo-spheric exchange, colonization by N-fixing cyanobacteria,changes in the grazer community, and increases in N as the resultof N fixation and return from sediments that determine thelong-term fate of eutrophied ecosystems.
Are Our Findings Applicable to Estuaries? It is generally believedthat coastal marine waters are N-limited and that N must becontrolled to reduce algal abundance (for review, see 12).However, these conclusions are largely based on bioassayssimilar to those that we have found to give spurious results forfreshwaters. In low-salinity estuaries such as the Baltic Sea, Nfixers are abundant, and rates of N fixation are high (3, 29). Instratified eutrophic lakes and estuaries, both P and N aregenerally plentiful in spring, before stratification develops. Oncewarming allows thermoclines to become established, initialconcentrations of N are depleted, and N-fixing species ofphytoplankton are favored. N fixation allows phytoplanktonstanding crops to develop that are proportional to P, as indicatedby the constant ratios for suspended N:P and total N:P in Lake227 (Fig. 1). On a long-term basis, if annual N fixation does notexceed sedimentation plus denitrification, chronic N deficienciesfavor N-fixing cyanobacteria every summer.
In at least one well documented case of an estuarine recoveryfrom eutrophication (29), chlorophyll a in the Stockholm Ar-chipelago estuary decreased from 30 �g/liter to �16 �g/liter inthe early 1970s, after the control of P alone from Swedish sewagetreatment plants. TP decreased from 75–90 to �30 �g/liter in 3years. As in Lake 227, at the time, the waters of the Archipelagowere dominated by N-fixing cyanobacteria species in summerand showed signs of extreme N limitation (3, 30). N fixation[measured in 1972 (30)] was 2.25 g/m2 per year, higher than anyyear in Lake 227. P and phytoplankton in the Archipelagodeclined, initially rapidly with the imposition of P removal inwaste treatments then more slowly since the mid-1970s (3)., Therecent removal of N at waste treatment plants beginning in themid-1990s has also led to somewhat lower chlorophyll concen-trations. However, the improved waste treatment also removedmore P and reduced biological oxygen demand (BOD fromammonia loading) (3). The reduction in BOD is importantbecause it has decreased the intensity and duration of anoxia atthe sediment surface. Preliminary data suggest that P releasefrom sediments is beginning to decrease in response to increas-ing oxygen (3). Overall, it is difficult to tell whether the slightimprovements in recent years are the result of reduced inputs ofN, P, BOD, or all three. However, we suggest that as in Lake 227,N fixation and short-term indicators of N deficiency such as lowTIN:TDP ratios or sensitivity to N enrichment bioassays are asign of overfertilization with P and not necessarily evidence thatN control will cause decreased eutrophication.
As we found in the 227 trophic cascade experiment describedabove, in large mesocosm experiments using near full-strengthseawater from Narragansett Bay, RI, nitrogen fixers prospered,and nitrogen fixation occurred as long as the abundance ofgrazing zooplankton was low (31, 32). Normal concentrations ofzooplankton were able to suppress cyanobacteria populations bygrazing, keeping colonies too small to form heterocysts. Theseobservations appear to be comparable with Lake 227 in 1996,when high-grazer populations after decreased zooplanktivoryprevented N-fixing cyanobacteria from dominating despite lowN:P inputs in fertilizer. These results suggest that under the rightconditions, grazers may be able to prevent cyanobacteria blooms,in both freshwaters and estuaries.
There is, however, still need for caution when extrapolatingour results to estuaries. It is conceivable that molybdenum, ironor other trace nutrients might limit the rate of colony growth byN fixers (31, 32), although the rates of fixation observed (29, 33,34) are as high as we have observed in freshwaters. In someestuaries, such as the Baltic Sea, haloclines isolate productiveepilimnions from deepwater nutrient sources even more stronglythan during the temperature-driven summer stratification ofmost lakes. Persistent haloclines can restrict oxygen circulationto deeper waters and return of nutrients to the euphotic zone.Haloclines also promote hypoxia and release of P from sedi-
Schindler et al. PNAS � August 12, 2008 � vol. 105 � no. 32 � 11257
ENV
IRO
NM
ENTA
LSC
IEN
CES
SEE
COM
MEN
TARY
Dow
nloa
ded
by g
uest
on
Mar
ch 1
3, 2
020
ments. The strength and duration of haloclines often depend onextreme weather events that are highly stochastic (3). High ratesof denitrification in estuarine anoxic zones allow much of theaccumulated fixed N to be returned to the atmosphere (34, 35).However, this would reinforce the chronic N deficiency that wehave discussed above, which can only be relieved by reducing Ploading. Also, unlike the Baltic, many estuaries have rather rapidflushing that would result in the continuous dilution of any Nfixed by cyanobacteria (36), potentially keeping an estuary in achronic N-deficient state despite high rates of N fixation. Finally,estuaries are often highly turbid, and light may limit N fixation.
In summary, the long-term experiment in Lake 227 and the earlyresponse of the Stockholm Archipelago to P control challenge thewidely held belief that short-term N limitation in phytoplanktoncommunities is evidence that external sources of N should becontrolled to decrease eutrophication. N-fixing cyanobacteria can-not be limited by a shortage of dissolved N and instead arecompetitively favored. The increasing appreciation of the impor-tance of N fixation to balancing the global ocean N budget (34, 37)demonstrates that salinity and marine geochemistry alone do notlimit N-fixing species and N fixation has the potential to overcomeN deficiencies in a wide range of aquatic environments. Our resultssuggest that controlling N inputs could actually aggravate thedominance of N-fixing cyanobacteria.
The adjustment of N deficiencies in Lake 227 required several
years (15), indicating that conclusions meaningful for nutrientmanagement are unlikely to be obtained from short-term ex-periments. The responses of Lake 227 over almost 4 decades offertilization indicate that experiments to guide nutrient man-agement confidently must be full-ecosystem scale and carriedout for at least several years (38).
Materials and MethodsFertilization of the lake began on June 26, 1969 and was done weekly duringthe ice-free seasons of all years since that time. The lake was sampled fromweekly to monthly during the ice-free seasons and from two to four timesunder ice in most years. On each date, nitrate plus nitrate, ammonium, totaldissolved N, particulate N, total dissolved P, total P, chlorophyll a, base cationsand strong acid anions, and pH were measured. Samples of phytoplanktonwere taken for identification and counting and for measurements of primaryproduction. Zooplankton samples were also taken on each sampling date. Atemperature profile was also measured.
Full details of methods are given in the supporting information (SI) Mate-rials and Methods.
ACKNOWLEDGMENTS. Reviews of an early draft by Suzanne Bayley, FriedaTaub, and Diane Orihel and of the semifinal draft by Val Smith, Steve Carpen-ter, and Peter Vitousek improved the manuscript and are greatly appreciated.Work during parts of the 37-year period was supported by the FisheriesResearch Board of Canada, the Canadian Department of Fisheries and Oceans,and Natural Sciences and Engineering Research Council Discovery Grants (toD.W.S. and R.E.H.).
1. Hutchinson, GE (1973) Eutrophication. Am Sci 61:269–279.2. Schindler DW (1977) Evolution of phosphorus limitation in lakes: Natural mechanisms
compensate for deficiencies of nitrogen and carbon in eutrophied lakes. Science195:260–262.
3. Boesch D, Hecky R, O’Melia C, Schindler DW, Seitzinger S (2006) Eutrophication ofSwedish Seas (Final Report, Swedish Environmental Protection Agency, StockholmSweden).
4. Anderson DM, et al. (2002) Harmful algal blooms and eutrophication: Nutrient sources,composition, and consequences. Estuaries 25:704–726.
5. Vollenweider RA (1968) Scientific Fundamentals of the Eutrophication of Lakes andFlowing Waters, with Particular Reference to Nitrogen and Phosphorus as Factors inEutrophication (Tech Rep DAS/CS/68.27, OECD, Paris).
6. Vollenweider RA (1976) Advances in defining critical loading levels for phosphorus inlake eutrophication. Mem 1st Ital Idrobiol 33:53–83.
7. Schindler DW (1974) Eutrophication and recovery in experimental lakes: Implicationsfor lake management. Science 184:897–899.
8. Healey FP, Hendzel LL (1980) Physiological indicators of nutrient deficiency in lakephytoplankton. Can J Fish Aquat Sci 37:442–453.
9. Hendzel LL, Hecky RE, Findlay DL (1994) Recent changes of nitrogen fixation inCanadian Precambrian Shield lakes. Can J Fish Aquat Sci 51:2247–2253.
10. Schindler DW (1971) Carbon, nitrogen and phosphorus and the eutrophication offreshwater lakes. J Phycol 7:321–329.
11. Hecky RE, Kilham P (1988) Nutrient limitation of phytoplankton in freshwater andmarine environments: A review of recent evidence on the effects of enrichment.Limnol Oceanogr 33:796–822.
12. Howarth RW, Marino R (2006) Nitrogen as the limiting nutrient for eutrophication incoastal marine ecosystems: Evolving views over three decades. Limnol Oceanogr51:364–376.
13. Lake Winnipeg Stewardship Board (2006) Reducing Nutrient Loading to Lake Win-nipeg and Its Watershed: Our Respective Responsibility and Commitment to Action(Report to the Minister of Water Stewardship December 2006).
14. Redfield AC (1958) The biological control of chemical factors in the environment. AmSci 46:205–221.
15. Schindler DW, Hesslein RH, Turner MA (1987) Exchange of nutrients between sedi-ments and water after 15 years of experimental eutrophication. Can J Fish Aquat Sci44(Suppl 1):26–33.
16. Findlay DL, Hecky RE, Hendzel LL, Stainton MP, Regehr GW (1994) Relationshipbetween N2-fixation and heterocyst abundance and its relevance to the nitrogenbudget of Lake 227. Can J Fish Aquat Sci 51:2254–2266.
17. Brunskill GJ, Schindler DW (1971) Geography and bathymetry of selected lake basins inthe Experimental Lakes Area (ELA), northwestern Ontario. J Fish Res Board Can28:139–155.
18. Legge RF, Dingeldein D (March/April 1970) We hung the phosphates without a fairtrial. Can Res Develop 3:19–42.
19. Schindler DW (1975) Whole-lake fertilization experiments with phosphorus, nitrogen,and carbon. Int Ver Theor Angew Limnol Verh 19:3221–3231.
20. Elser JJ, et al. (2000) Pelagic C:N:P stoichiometry in a eutrophied lake: Responses to awhole-lake food-web manipulation. Ecosystems 3:293–307.
21. Levine SN, Schindler DW (1980) Radiochemical analysis of orthophosphate concentra-tions and seasonal changes in the flux of orthophosphate to seston in two CanadianShield lakes. Can J Fish Aquat Sci 37:479–487.
22. Smith VH (2006) Responses of estuarine and coastal marine phytoplankton to nitrogenand phosphorus enrichment. Limnol Oceanogr 51:377–384.
23. Guildford S, Hecky RE (2000) Total nitrogen, total phosphorus, and nutrient limi-tation in lakes and oceans: Is there a common relationship? Limnol Oceanogr45:1213–1223.
24. Schindler DW, et al. (1973) Eutrophication of Lake 227 by addition of phosphate andnitrate: The second, third, and fourth years of enrichment 1970, 1971, and 1972. J FishRes Board Can 30:1415–1440.
25. Schindler DW, Brunskill GJ, Emerson S, Broecker WS, Peng T-H (1972) Atmosphericcarbon dioxide: Its role in maintaining phytoplankton standing crops. Science177:1192–1194.
26. Ramcharan CW, et al. (1995) A comparative approach to determining the role of fishpredation in structuring limnetic ecosystems. Arch Hydrobiol 133:389–416.
27. Barica J, Kling H, Gibson J (1980) Experimental manipulation of algal bloom compo-sition by nitrogen addition. Can J Fish Aquat Sci 37:1175–1183.
28. Lathrop RC (1988) Evaluation of whole-lake nitrogen-fertilization for controllingblue–green algal blooms in a hypereutrophic lake. Can J Fish Aquat Sci 45:2061–2075.
29. Brattberg G (1986) Decreased phosphorus loading changes phytoplankton composi-tion and biomass in the Stockholm archipelago. Vatten 42:141–152.
30. Brattberg G (1977) Nitrogen fixation in a polluted brackish water archipelago. Ambio(Spec Rep) 5:27–42.
31. Marino R, Chan F, Howarth RW, Pace ML, Likens GE (2006) Ecological constraints onplanktonic nitrogen fixation in saline estuaries. I. Nutrient and trophic controls. MarEcol Prog Ser 309:25–39.
32. Chan F, Marino RL, Howarth RW, Pace ML (2006) Ecological constraints on planktonicnitrogen fixation in saline estuaries. II. Grazing controls on cyanobacterial populationdynamics. Mar Ecol Prog Ser 309:41–53.
33. Voss M, Emeis K-C, Hille S, Neumann T, Dippner JW (2005) Nitrogen cycle of the BalticSea from an isotopic perspective. Global Biogeochem Cycles 19: GB 3001, doi:10.1029/2004GB002338.
34. Gardner WS, et al. (2006) Nitrogen fixation and dissimilatory nitrate reduction toammonium (DNRA) support nitrogen dynamics in Texas estuaries. Limnol Oceanogr51:558–568.
35. Seitzinger SP (1988) Denitrification in freshwater and coastal marine ecosystems:Ecological and geochemical significance. Limnol Oceanogr 33:702–724.
36. Mahaffy C, Michaels AF, Capone DG (2005) The conundrum of marine N2 fixation. Am JSci 305:546–595.
37. Karl D, et al. (2002) Dinitrogen fixation in the world’s oceans. Biogeochemistry57–58:47–98.
11258 � www.pnas.org�cgi�doi�10.1073�pnas.0805108105 Schindler et al.
Dow
nloa
ded
by g
uest
on
Mar
ch 1
3, 2
020