eutrophication from agricultural sources: field- and
TRANSCRIPT

Environmental RTDI Programme 2000-2006
EUTROPHICATION FROM
AGRICULTURAL SOURCES: Field- and
Catchment-scale Risk Assessment
(2000 LS 2.2.1)
FINAL REPORT
Prepared for the Environmental Protection Agency
by
University College Dublin
School of Architecture, Landscape and Civil Engineering
Authors:
Dr. W. L. Magette, Dr. R. Hallissey, Ms. K. Hughes, Ms. E. Cosgrove
ENVIRONMENTAL PROTECTION AGENCY
An Ghníomhaireacht um Chaomhú Comhshaoil
PO Box 3000, Johnstown Castle Estate, County Wexford, Ireland
Telephone: +353-53-60600 Fax: +353-53-60699
Email: [email protected] Website: http//www.epa.ie/

ii
© Environmental Protection Agency, 2007
DISCLAIMER
Although every effort has been made to ensure the accuracy of the material contain in this
publication, complete accuracy cannot be guaranteed. Neither the Environmental
Protection Agency nor the authors accept any responsibility whatsoever for loss or
damage occasioned or claimed to have been occasioned, in part or in full, as a
consequence of any person acting, or refraining from acting, as a result of a matter
contained in this publication. All or part of this publication may be reproduced without
further permission, provided the source is acknowledged.
WATER QUALITY
The Water Quality Section of the Environmental RTDI Programme addresses the need for
research in Ireland to inform policymakers and other stakeholders on a range of questions
in the area. The reports in this series are intended as contributions to the necessary debate
on water quality and the environment.
ENVIRONMENTAL RRTDI PROGRAMME 2000-2006
Published by the Environmental Protection Agency, Ireland
PRINTED ON RECYCLED PAPER
ISBN: 1-84095-
Price: €

iii
ACKNOWLEDGEMENTS
This report has been prepared as part of the Environmental Monitoring Research
Technological Development and Innovation (ERTDI) Programme under the Productive
Sector Operational Programme 2000-2006. The programme is financed by the Irish
Government under the National Development Plan 2000-2006. It is administered on
behalf of the Department of the Environment and Local Government by the
Environmental Protection Agency, which has the statutory function of co-ordinating and
promoting environmental research. The project served as the basis for two postgraduate
degrees from University College Dublin: Kristen Hughes (MEngSc, 2004) and Ronan
Hallissey (PhD, 2007). A third postgraduate, Emer Cosgrove, made a contribution
through her MEngSc research, which is ongoing. Their research results are the
foundation for this report. The authors gratefully acknowledge all help received during
this project, particularly from scientists that generously allowed the use of their research
data for this research: Dr. Isabelle Kurz (formerly of Teagasc, Johnstown Castle Research
Centre, Wexford, Ireland), Dr. Catherine Watson (Agriculture, Food and Environmental
Science Division of the Agri-Food and Biosciences Institute, Belfast, N. Ireland), and Dr.
Pamela Bartley (Bartley & O'Suilleabhain Environmental Engineering, Galway, Ireland).
Dr. Karl Richards (Teagasc, Johnstown Castle Research Centre, Wexford, Ireland) also
made data available for use. The authors also appreciate the input from members of the
Scientific Advisory Committee, and from the staff of the Environmental Protection
Agency, in particular the project officer, Dr. Alice Wemaere, and the internal technical
reviewer, Dr. Paul Toner. The authors are indebted to Drs. Karen Daly and Owen Carton
and Ms. Eleanor Spillane (Teagasc, Johnstown Castle Research Centre, Wexford, Ireland)
for their efforts in project co-ordination (Daly, Carton) and financial record-keeping
(Spillane). The authors also express their gratitude to the anonymous external scientific
reviewers who examined the technical content of this report and made helpful suggestions
for its improvement.

iv
Details of Project Partners
William L. Magette
School of Architecture, Landscape and Civil Engineering
University College Dublin
Richview, Belfield
Dublin 4
Tel: +353-1-716-3214
Email: [email protected]
Ronan Hallissey
Environmental Consultant
Mott MacDonald Pettit
Rockfield, Dundrum
Dublin 16
Tel: + 353-1-299-3339
Email: [email protected]
Kristen Hughes
Virginia Staff Scientist
Chesapeake Bay Foundation
Capitol Place
1108 E. Main Street, Suite 1600
Richmond, Virginia 23219
USA
Tel: +1-804-780-1392 ext. 304
Email: [email protected]
Emer Cosgrove
School of Architecture, Landscape and Civil Engineering
University College Dublin
Richview, Belfield
Dublin 4
Tel: +353-1-716-3214

Table of Contents
Disclaimer ii
Acknowledgements iii
Details of Project Partners iv
Executive Summary vii
1. BACKGROUND AND INTRODUCTION 1
2. METHODOLOGY OF THE PROJECT 19
3. RESULTS 58
4. CONCLUSIONS 110
5. RECOMMENDATIONS 115
6. REFERENCES 116
7. APPENDICES 123

ii
Executive Summary
Ambient monitoring of Ireland’s water resources has identified an increase in the numbers of rivers and lakes
considered to be slightly or moderately polluted. The contamination of surface waters by diffuse pollution is
particularly insidious. In its recent assessment of environmental quality, the Environmental Protection
Agency (EPA) determined that phosphorus (P) from agricultural sources accounts for over 70% of the total
anthropogenic load to freshwaters in Ireland (EPA, 2004). As over-fertilisation of grassland is common in the
Republic (EPA, 2004), this and other evidence suggests that a large proportion of the P loss to waters
arising from agriculture is contributed by diffuse sources.
The European Union’s Water Framework Directive (WFD) (2000/60/EC) mandates a comprehensive
approach to water management. Yet, diffuse nutrient pollution from the landscape is particularly difficult to
identify, and even more difficult to control (Magette, 1998). Irvine et al (2005a) observed that risk
assessment was a fundamental element of the WFD. Hand-in-hand with risk assessment is identification of
those situations likely to produce environmental hazards. It is broadly accepted that strategies to address
diffuse pollution will be most effective when they are targeted towards sensitive “source areas” of nutrients in
the landscape (Sharpley et al, 1993). It follows that a procedure is needed with which to identify these
sensitive areas within catchments. Magette (1998) sought to develop such a procedure, specifically for
grassland areas in Ireland, which make up approximately 90% of the utilisable agricultural area in the
country.
This research was commissioned to further test, and modify as appropriate, the risk ranking procedure
proposed by Magette (1998). The primary focus of the research was to be on field scale assessments of
factors that, in combination, would suggest that an area posed a particular risk of losing nutrients (especially
P) that would subsequently be transported to receiving waters. The project was further intended to
complement other “large scale” research (the technical specifications for which are included in Appendix A)
being conducted under a comprehensive research programme funded by the Environmental Protection
Agency and co-ordinated by Teagasc as detailed in Eutrophication from Agricultural Sources LS-2.2 Models
and Risk Assessment Schemes for Predicting Phosphorus Loss to Water (Daly, 2006).
Magette’s (1998) original “ranking” procedure formed the starting point for this research and the overall study
plan was to first critically analyse and test the procedure more intensively than previously had been possible,
and then to modify the procedure to address any deficiencies identified during the critical analysis and
testing phase. In practice, testing and modification were iterative processes. Because this project was not
funded to collect data, the research was dependent on the supply of appropriate data from other sources.
Most of the effort was placed on developing a procedure for assessing the potential risk (meaning the
relative likelihood) of losing P from areas within a landscape, and the subsequent likelihood of that P being
transported to adjacent water bodies. Ideally, these sources would have been field-sized areas, but due to
the limited number of data sets available at this scale in Ireland (and indeed N. Ireland and Britain), research
was also conducted at the “small” catchment scale, for which considerably more data were available. The
use of catchment scale data also facilitated the examination of factors affect the transport of nutrients from
sources to the adjacent water bodies.

iii
The output from this research is complementary to that from other “nutrient loss modelling” projects funded
by EPA through the ERTDI Programme 2000-2006, each of which sought to develop a methodology that
could be used to assess the potential losses of P from the landscape to water (Daly, 2006; Nasr and Bruen,
2006). On the continuum from simple to complex assessment methods, the research reported herein
represents a relatively simple procedure that can be readily used by catchment managers responsible for
water quality protection and, indeed, by agricultural advisors responsible for promoting best agricultural
practice with regards to nutrient management. Several distinct procedures have been developed:
• a screening tool by which catchments can be examined and areas highlighted for their propensities
to transport P to water;
• a modified phosphorus ranking scheme (mPRS) and a modified nitrogen ranking scheme (mNRS)
to assess the comparative potential for P and N, respectively, to be lost from landscape areas and
subsequently transported to receiving waters;
• a procedure by which to qualitatively assess Irish farmyards for their potential to contribute to
nutrients to water resources.

iv

1
1 Background to the Project and Introduction
1.1 Introduction
The latest Environmental Protection Agency (EPA) water quality assessment (Toner et al., 2005) for Irish
rivers and streams shows that 69% of river/stream length is categorised as “un-polluted”, 18% of streams are
categorised as “slightly polluted” and 12% of river channel is classified as “moderately polluted”, with a
further 0.6 % categorised as “seriously polluted”. The EPA has reported that water quality in Irish rivers and
streams has deteriorated since a national monitoring recording program began in 1971, when the proportion
of river length classified as “un-polluted” was 84 %. This has been mainly due to an increase in slight and
moderate pollution. In contrast, a reduction in seriously polluted surface water has been achieved through
control of point source discharges, enabled by a significant expenditure on improved wastewater treatment
facilities and the introduction of effluent licensing. Since a baseline of 13200 km of assessed channel length
was established in 1987, unpolluted channel length increased from 67 to around 70 per cent in that period.
Nevertheless, while there is evidence of an improvement in recent years, a significant water quality problem
still exists in Irish rivers and streams.
These water quality problems extend to Irish lakes, approximately 18% of which were classified as eutrophic
or hypertrophic and exhibited varying signs of pollution together with the potential impairment of their
beneficial uses in the 2001-2003 period (Toner et al., 2005).
Eutrophication is the most important type of pollution associated with Irish rivers and lakes (Toner et al.,
2005), and phosphorus (P) has been identified as the main limiting nutrient involved in the eutrophication
process in surface waters (McGarrigle, 2001). Nitrogen (N) is an important contributory nutrient in
eutrophication and also has implications for human health when present in high concentrations in surface or
groundwaters used as sources of supply. The Department of the Environment and Local Government
identified 13 groundwater sources in counties Carlow, Cork, Kerry, Louth and Waterford that were polluted or
susceptible to pollution by nitrate from agricultural sources. The European Union’s (EU) Nitrates Directive
(91/676/EEC) has just recently been implemented in Ireland to address surface and groundwater
contamination by this nutrient.
McGarrigle and Champ (1999) stated that there is an urgent need for effective catchment management
strategies that can reduce the P load to rivers. McGarrigle and Champ’s (1999) observation is especially
relevant in the context of the EU’s Water Framework Directive, 2000/60/EC (Council of the European
Communities, 2000), which mandates a comprehensive approach to water management and designates
large catchment areas (e.g., major river basins) as the fundamental unit of management.
The emergence of diffuse sources as the primary origin of nutrients causing eutrophication poses many
difficulties to catchment managers, to relevant authorities and to farmers. Fundamentally, diffuse sources
are not easily identified, and consequently management strategies have to be adopted that will address the
disparate nature of the nutrient sources and the many factors responsible for both the loss and transport of
nutrients from land to water (Table 1). In addition, “end-of-pipe” control techniques cannot be applied to
diffuse pollution sources, emphasising the need for on-site strategies designed to prevent, or at least
minimise, losses.

2
Table 1: Factors influencing nutrient losses from agriculture and the landscape (Magette, 1998).
Uncontrollable Factors Affecting Losses of Pollutants from Agricultural Systems
Weather
Type and history of geologic materials
Topography
Depth to groundwater
Soil type
Somewhat Controllable Factors
Soil physical characteristics (e.g. drainage, soil loosening, cultivation)
Very Controllable Factors
Soil chemical characteristics (pH, nutrient levels, etc.)
Vegetation
Timing and method of agricultural operations
‘Pollutant’ characteristics (chemical formulations, etc.)
Fortunately, studies elsewhere have shown that most (as much as 90%) of P exported from catchments on
an annual basis occurs from discrete areas within catchments (as little as 5% of the total area) and during
one or two storm events (Sharpley and Rekolainen, 1997; Pionke et al., 1997). While it is impossible to
predict the occurrence of these events, strategies to remediate water quality problems arising from diffuse
sources will therefore be most efficient if they are targeted to sensitive “source” areas within a catchment,
rather than implemented as general strategies over a broad area (Sharpley et al., 1993). Beegle (1999)
identified the most important phosphorus source areas within a catchment to be those where “P sources”
and “P transport mechanisms” overlapped, and termed these intersections “Critical Source Areas” (CSA).
The identification of such areas, which are those most vulnerable to P loss, is fundamental to effectively
managing losses of this element to water (Gburek et al., 2000).
Losses of N to receiving waters are more widely distributed spatially than those of P, due to the numerous
chemical forms in which this element exists and pathways by which it can move. Whereas P is generally
transported in overland flow, N (especially as nitrate) can be transported both in overland flow and by water
infiltrating downward through the soil profile. Nevertheless, some areas within catchments are more
susceptible to N losses than others, and thus the CSA concept can also be applied to managing this nutrient.
As with the control of eutrophication resulting from P loss to water, the first step in controlling N losses is
identifying the sources of such losses (Nolan et al., 1997).
Tools for identifying critical source areas within catchments vary from highly sophisticated deterministic
models requiring a large amount of input data to relatively simple models in which most of the nutrient loss
and transport processes are relegated to a “black box”. Irvine et al. (2005b) reviewed a large number of
models of varying complexities for their suitability as decision support tools for the WFD, and concluded that
no single integrated model existed that could be applied universally throughout a catchment to meet all the
needs of the WFD . The authors also noted that simple models are more likely to be used and understood
than complex models, but that great care must be exercised to avoid the misuse of the simple models.

3
The P Index (PI) system first published by Lemunyon and Gilbert (1993), and indices similar to it, are toward
the less complex end of the modelling continuum, and are ideally suited for use by catchment managers,
agricultural advisors and farmers themselves. The premise underpinning these indices is that they can
effectively determine the relative risk posed by agricultural areas to water quality, whilst being relatively easy
to use and requiring only datasets which, in the main, are readily available. Generally, such indices do not
attempt to make quantitative estimates of nutrient loss and transport. (N.B. Risk in the context of this report
means the propensity or relative likelihood of an area on the landscape to contribute nutrients to water.)
Irvine et al. (2005a) observed that risk assessment was a fundamental element of the EU’s Water
Framework Directive. Djodjic et al. (2002) determined that the Phosphorus Index represented “an
opportunity to identify sensitive areas within a catchment”. The P Index approach is now widely used in the
USA (Sharpley et al., 2003) and has been applied to a limited extent in Europe (Magette, 1998; Bechmann et
al, 2005), Canada and Australia (Melland et al., 2004).
The original P Index (Lemunyon and Gilbert, 1993) was developed with a caveat that it would require
additional research as well as modification to account for regional variations in agricultural management
practices, climate, topography, hydrology and surface water characteristics. Most P Indices in current use
are modified versions of the Lemunyon and Gilbert (1993) index and reflect local conditions in the area
where the P Indices are being used. In Ireland, Magette (1998) developed a phosphorus index (referred to
hereafter as a phosphorus ranking scheme, PRS) for Irish conditions. The PRS aimed to provide catchment
managers and other relevant persons with an objective and transparent methodology by which to determine
the relative likelihood of P loss from grassland and the subsequent transport of this element to water. Unlike
the Lemunyon and Gilbert (1993) PI system, the PRS developed by Magette (1998) used both field and
catchment scale factors, and also introduced a factor to address the sensitivity of receiving waters to P.
Uniquely, the PRS also included a factor to capture the effect of farmyards as potential sources of P to
water. Magette (1998) also developed an N Index (i.e., a nitrogen ranking scheme, NRS) for Ireland based
on the same concepts as for the P Index, but accounting for the very different processes affecting N
movement from agricultural land.
1.2 Study Objectives This project was commissioned by EPA as part of a large scale research programme devised to study the
eutrophication of water by agricultural sources (Appendix A). Within this programme, this project was part an
integrated package of three research projects (RTDI/EPA 2000-LS-2.2 M2) titled “Eutrophication from
Agricultural Sources: LS-2.2 Models and Risk Assessment Schemes for Predicting Phosphorus Loss to
Water”. Collectively, these projects examined three different techniques of varying complexities for
assessing the loss of P from agricultural systems and its transport to water. The techniques, described by
Daly (2006), were stochastic modelling, deterministic modelling, and multi-criteria analysis, of which the latter
was examined in the research reported herein.
The objectives of the project reported herein were to:
• Provide a validated risk assessment scheme that uses a limited number of criteria to evaluate the
potential losses of P and N from field-sized areas to water resources;

4
• Provide a validated risk assessment scheme that uses a limited number of criteria to evaluate the
potential losses of P and N from farmyards; and
• Provide a “scanning tool” by which catchment scale data could be used to identify catchments
most likely to lose P to water.
1.3 Project Structure Research was undertaken in distinct work packages that more or less corresponded to the three objectives.
Due to the focus of the integrated project on phosphorus, most of the effort in the project reported herein was
expended on developing and testing P ranking schemes.
Work Package 1: Initial assessment of the Magette (1998) PRS at both field scale and catchment scale and
the introduction of some modifications.
Work Package 2: Development of a modified PRS (mPRS) at field scale including factors for farmyard
impact and detailed testing of the mPRS both at field scale and at sub-catchment scale using field scale
data.
Work Package 3: Development of a modified NRS (mNRS) at field scale and testing of the mNRS at field
scale using field scale data.
Work Package 4: Assessment of catchment scale factors and development of a “scanning tool” for use to
quickly identify catchments exhibiting a high potential to lose P to water.
Work Package 5: Assessment of farmyards as nutrient sources to water.
1.4 Empirical Schemes (P Indices) for Assessing Phosphorus Losses from
Agricultural Systems Losses of P from agricultural systems occur in response to either P accumulation in soils or to freshly added
applications of inorganic fertiliser or organic P, such as animal manure (Hart et al., 2004). Thus, the
presence of P in an agricultural system is the obvious pre-requisite for the occurrence of P loss. However,
the nature and rate of P transfer and the subsequent concentrations of P in runoff are governed by chemical,
biological, physical and hydrological factors (Dougherty et al., 2004).
Empirical schemes to assess the influence of these interacting factors on P losses from agricultural systems
were first conceived in 1990, when a coalition of scientists from universities in the United States (US) and the
US Department of Agriculture (USDA) began meeting for the purpose of developing a field scale method of
identifying agricultural sites that were at a high risk of causing P-induced eutrophication of nearby surface
waters. The resultant “P Index” system, first published by Lemunyon and Gilbert (1993), was developed to
identify the relative vulnerability of agricultural fields to P loss. The original P Index (hereafter referred to as
LGPI) consisted of an 8-by-5 matrix (Table 2) of readily accessible field data as input. Both source and (on-
site) transport factors were used in the LGPI and the factors chosen were selected because they were both
readily obtainable and known to affect P availability, retention, management, movement and crop uptake.
Three transport factors represented the potential for P transport to the edge of a site: (1) soil erosion, (2)
irrigation erosion, and (3) runoff class. Five factors characterised the source availability of P on the site: (1)

5
soil test P, (2) P fertiliser application rate, (3) P fertiliser application method, (4) organic P application rate,
and (5) organic P application method. Each factor was given a weighting, assigned using professional
judgement and based on the assumption that different factors have differing degrees of impact on the loss of
P. Likewise the severity of impact of a factor was assigned a value, based on the magnitude of the
measurement used to quantify the factor. A final score for the LGPI was calculated by multiplying each
factor weighting by the corresponding factor value, followed by summation of the resulting products for all the
factors. While the authors recognized that additional factors, such as total soil P levels, clay mineralogy, soil
texture, pH, cation exchange capacity, P adsorption capacity, particle size distribution, and soil erodibility
would also be expected to affect P loss and transport, they chose not to include these in the index as their
contributions were not fully understood, nor easily related at the time (Lemunyon and Gilbert, 1993).
Sharpley (1995) used the LGPI to assess 30 fields in the Southern Plains region (Oklahoma and Texas) of
the US. The fields varied in terms of site characteristics and management and included sites that were
unfertilised and P-fertilised, cropped and grassed. Surface runoff was collected for each runoff event and
analysed for total P. Results indicated that there was a close relationship between P index score and total P
loss to the edge of the sites. Sharpley (1995) concluded that the LGPI could give reliable estimates of
vulnerability to P loss in runoff from catchments of widely differing management. However, Gburek et al.
(2000) found that when the LGPI was applied to a larger catchment in Pennsylvania, which had dynamic and
variable source areas of runoff, field rankings produced by the LGPI did not reflect the catchment areas
where high soil P levels combined with areas of high runoff potential. Gburek et al. (2000) also postulated
that the additive approach, whereby sub-scores for each factor are added together could be improved on by
multiplying source factors by transport factors to generate a P Index score. These observations, together
with the inclusion of other factors mainly relating to local conditions, have led to modifications of the LGPI.
1.4.1 Modifications to the LGPI
Since the publication of the original LGPI, most (47 out of 50) states in the US have developed variations of
this index that account for regional land use, climate and soils. Three main modifications have been
implemented (Sharpley et al., 2003):
1. Transport and source factors are related by multiplication rather than just a simple additive
approach.
2. A distance from nearest water body or other hydrological factor that considers the possibility of P
loss occurring in response to hydrological events has been added.
3. The numerical scoring scales for assigning qualitative risk descriptions (i.e., “low”, “medium” and
“high” ) have been left open-ended.
In addition, considerable changes in the calculation methodologies have been introduced in a number of
cases.
1.4.1.1 Multiplication of Source Factors and Transport Factors
Gburek et al. (2000) proposed that the transport factors and source factors of the LGPI should be
determined separately and then integrated by multiplication instead of addition. Gburek et al. (2000)
reasoned that in order for a site to pose a high P-loss risk to water, the site must have both a high potential
for P loss and a high P transport potential. Either one of these alone will not result in a high P loss.
Multiplication of transport factors by source factors assures that a high score in one category may be
moderated by a low score in the other, and thus give a more realistic assessment of whether P may be lost

6
and transported from a site under investigation. The Maryland P Index (Coale et al, 2002) is an example of a
P Index whereby the transport factors and the source factors are combined by a multiplicative approach.
Table 2. P Index system of Lemunyon and Gilbert (1993).
Phosphorus loss rating (Value) Site
Characteristic
(Weight)
None
(0)
Low
(1)
Medium
(2)
High
(4)
Very High
(8)
Soil erosion
(1.5)
Not
applicable
< 5 tons/acre* 5-10 tons/acre 10-15
tons/acre
> 15
tons/acre
Irrigation erosion
(1.5)
Not
applicable
Tailwater
recovery or
QS** < 6 for
very erodible
soils or QS <
10 for other
soils
QS > 10 for
erosion
resistant soils
QS > 10 for
erodible soils
QS > 6 for
very
erodible
soils
Runoff class
(0.5)
Negligible Very low or
Low
Medium High Very high
Soil P test
(1.0)
Not
applicable
Low Medium High Excessive
P fertiliser
application rate
(0.75)
None
applied
1-30 P2O5
lb/acre*
31-90 P2O5
lb/acre
91-150 P2O5
lb/acre
> 150 P2O5
lb/acre
P fertiliser
application
method
(0.5)
None
applied
Planted with
planter deeper
than 2 in.
Incorporated
immediately
before crop
Incorporated
> 3 months
before crop
or surface
applied < 3
months
before crop
Surface
applied > 3
months
before crop
Organic P source
application rate
(1.0)
None
applied
1-30 P2O5
lb/acre
31-60 P2O5
lb/acre
61-90 P2O5
lb/acre
> 90 P2O5
lb/acre
Organic P source
application
method
(1.0)
None Injected
deeper than 2
in.
Incorporated
immediately
before crop
Incorporated
> 3 months
before crop
or surface
applied < 3
months
before crop
Surface
applied to
pasture, or >
3 months
before crop
*The LGPI was developed using Imperial units of measure.
**QS is an empirical measurement of irrigation flow (Q, gallons per minute) in a furrow multiplied by the slope
of furrow (S, percent).

7
This approach has been widely adopted in the US (17 out of 50 states). The USDA Natural Resources
Conservation Service now proposes a two part multiplicative matrix, in which the first part of the index
considers the amount of P on site or being added to the site (P source potential) while the second
component considers factors that affect P movement and potential of transport. A Norwegian P Index
(Bechmann et al., 2005) has also adopted this approach.
1.4.1.2 Connectivity to a Water Body
Pionke et al. (1996) found that the loading of dissolved phosphorus (DP) exported from a catchment could
be apportioned among stormflow (70%), elevated baseflow (20%) and normal baseflow (10%) for small
agricultural catchment in the Chesapeake Bay area of the eastern US. He also found that 90% of the algal
available P was exported during the seven largest storms of the year. In the same catchment, Zollweg et al.
(1996) found that most of the P exported during storms arose from areas within 30m of the river channel.
These findings highlight the variability both temporally and spatially in the loss of P in runoff from agricultural
catchments. In order to address in the P indices the fact that areas close to river channels supply most of
the P in runoff, a distance factor has been introduced in a number of indices. The Pennsylvania Phosphorus
Index (Weld et al., 2003) contained a ‘Contributing Distance” factor which divided fields into 5 categories
depending on the distance from the river channel. These distances ranged from <150ft (45.72m) to >500ft
(152.4m). The Norwegian P Index (Bechmann et al., 2005) also used a “contributing distance” factor with
similar categorisations (as the Norwegian P Index was loosely based on the Pennsylvania P Index). The
New York State P Index (Cyzmmek et al., 2003) uses a slightly more complex approach whereby streams
are classified as either “Perennial streams” or “Intermittent streams”, depending on whether they flow all year
or not. The score generated for the “distance” factor is dependent on which of these two classifications fits
the stream. Gburek et al. (2000) modified the approach of using a simple “distance from stream” factor by
incorporating the hydrologic return period concept to quantify the probability of runoff arising from a field to
surface water. The return period represents the probability of a rainfall or a flood of a given magnitude
occurring and is expressed in terms of years. The return period concept was incorporated in the P Index by
relating the return period to distance from the stream and could be applied to both large and small
catchments.
1.4.1.3 Open-ended Scaling
Another major alteration to the original LGPI has been the introduction of continuous open-ended parameter
scaling for erosion, soil test P, and P application rate. This modification allows for better representation of
very high application rates or soil P levels and can be observed in the Pennsylvania P Index (Weld et al.,
2003).
1.4.1.4 Other Modifications
A number of other alterations have been introduced to different P Indices:
• One of these changes is the replacement of fixed weightings for each factor with variable
weightings. In the Pennsylvania P Index (Weld et al., 2003) descriptive factors were given
weightings ranging from 0.2 – 1 depending on the perceived risk of P loss associated with a factor.
For example, the weighting given to “fertilizer application” is varies depending on the application
methodology used.
• In some indices the use of fixed weightings remains as in the LGPI; however, the values of the
weightings have been adjusted by local testing and assessment (e.g., Birr and Mulla, 2001).

8
• The original LGPI addressed potential losses of P via surface runoff processes and had no ability to
address the loss of phosphorus occurring through leaching to shallow groundwater or subsurface
drainage (Coale et al., 2002). A number of P indices have been modified to account for leaching.
For example, the Virginia P Index (Wolfe et al., 2005) is divided into three parts: one for calculating
the erosion risk factor, one for the subsurface runoff factor and one for the surface runoff factor.
The New York P Index (Cyzmmek et al., 2003) has also taken account of the different processes
involved in P loss under different cropping systems and includes two separate calculation
procedures: one to determine a Dissolved P Index and one to determine a Particulate P Index.
• A screening tool with decision criteria for soil P concentrations and proximity of sites to streams has
been introduced for the Pennsylvania P Index (Weld et al., 2003) to determine whether a field
requires further assessment (i.e., use of the full P index). The screening tool saves time and effort
that otherwise would be used in calculating index ratings for “low risk fields” (Sharpley et al., 2001).
• Sub-models have been incorporated in the architecture of P Indices by some developers. In the
North Carolina Phosphorus Loss Assessment Tool (PLAT) the Revised Universal Soil Loss
Equation (RUSLE) is used to calculate soil erosion; further either the Runoff Curve Number (USDA-
SCS, 1986) or DRAINMOD (Skaggs et al., 1982) can be used to calculate runoff. In the Iowa
Phosphorus Index the RUSLE model is used to estimate sediment loss (Mallarino et al., 2002) and
a Sediment Delivery Ratio (SDR) is applied to estimate the efficiency of sediment delivery from
fields to streams. The Iowa P Index also uses the runoff curve number to estimate runoff.
• The development of P indices for specific agricultural practices has been undertaken by a number
of authors. Magette (1998) and De Laune et al. (2004) have developed a P Index specifically for
pasture-based agriculture. The Iowa P Index was developed specifically to account for phosphorus
losses coming from cropland (Mallarino et al., 2002).
• Daniel et al. (2002) reported that according to some P index architects, a third element should be
introduced to account for the application of specific Best Management Practices (BMP’s), such as
by De Laune et al. (2004).
The modifications outlined above have been based on research as well as professional experience and
judgment (Sharpley et al., 2003), and have been widely incorporated into indices used in the US. Many
more minor modifications have been introduced to account for local conditions. Based on a review of 19 US
P Indices, Figures 1 and 2 illustrate the frequency with which a variety of source and transport factors,
respectively, appear in these indices. Elaborate modifications such as sub-models to estimate soil erosion
and runoff tend to make the P indices more deterministic, but also more complicated to use.
1.4.2 Testing of P Indices
Evaluation of P indices is necessary to provide the basis for modifications and thus for improvement of their
usefulness as P management tools (Harmel et al., 2005). While considerable testing has been carried out
on the different factors contained within the P indices reviewed in Section 1.4.1, site evaluations of the
various P Indices has been limited (Sharpley et al., 2001) until rather recently.

9
Figure 1. Frequency of source factor occurrence in a review of 19 P site indices (Hughes, 2004).
Figure 2. Frequency of transport factor occurrence in a review of 19 P site indices (Hughes, 2004).
While it is now generally accepted that both source and (off-site) transport factors must be included in an
effective P index, testing of indices has been undertaken at primarily at field scale, with very little work done
at the catchment scale (Harmel et al., 2005). Field and plot scale testing precludes the assessment of
factors associated with the off-site transport of P. Nevertheless, testing of the P Index at the plot/field scale
has shown some very positive results. Using the Pennsylvania P Index, Sharpley et al. (2001) accurately
predicted the potential for dissolved P loss (R2=0.79) and total P loss (R
2=0.83) from 57 manured plots
(2m2). Eghball and Gilley (2001) tested the original LGPI and a modified P index in three rainfall simulation
studies at the plot scale on cropped agricultural systems. The modified LGPI improved the correlation from
0.52 to 0.74 between site score and edge-of-field P losses.
DeLaune et al. (2004) used a rainfall simulator to generate runoff while assessing the LGPI on 12 small plots
treated with poultry litter. The effectiveness of the P Index was compared to the use of soil test phosphorus
(STP) as a P management tool. At the plot scale the P Index was significantly correlated with P
0 5 10 15 20
Soil Test P
P Application Rate
P Aplication Method
Receiving Waters
Soluble P in Manure
Fa
ctor
Frequency
0 5 10 15 20
So il Ero s io n
Ru n o ff Ris k
Dis tan ce to Stream
Su bs u rface Dra in ag e
Flo o d in g Frequ en cy
Leach ing Po ten tia l
Precip itatio n
Co ncen trated Flow
Hy d ro log ic Retu rn Perio d
Fa
ctor
Fre que ncy
10
concentrations in edge-of-field runoff (R2=0.59) and was adjudged to be a far more effective indicator than
STP. Harmel et al. (2005) tested the Texas P Index, the Iowa P Index and the Arkansas P Index on 10 field
sites in Texas. The various P Index scores were compared to the total annual P loads in edge-of-field runoff.
The Texas P Index (which uses an additive approach to determine a site score) was significantly correlated
to the annual P load; however, the authors suggested that the performance of this index could be improved
by restructuring it to use the multiplicative approach. The Arkansas P Index did not perform well in general,
but when tested on pastures performed better. The Iowa P Index showed a significant linear relationship
with annual P loads.
Testing of the P Index, or its modifications, at the catchment scale has been limited until recent years when
more work has been done to assess the effectiveness of the various Indices at this scale. DeLaune et al.,
(2004) tested a modified P Index for pasture on two small catchments, which were fertilised with poultry litter.
A very significant correlation between the P Index results and measured annual P losses (1994-2000) were
found (R2=0.84). In Norway, Bechmann et al. (2005) tested the Norwegian P Index at catchment scale,
subcatchment scale and at field scale (2 fields). This index, which is based on the Pennsylvania P Index,
was assessed on six agricultural catchments (ranging in size from 168-8700ha) and successfully ranked the
potential for P transfer to water (R2=0.79). At the subcatchment/field scale (for 9 subcatchments and 2
fields) it correctly ranked catchments in terms of potential P transfer (R2=0.66). Testing at an even larger
scale was undertaken by Birr and Mulla (2001) who tested the Minnesota P Index at the “regional scale”,
comprising of 60 catchments. They concluded that the modified version of the Minnesota P Index accurately
depicts regional scale trends in P loss and thus enables managers to identify areas that require the
implementation of management strategies. A regression analysis between P Index scores and measured in-
stream data showed a close correspondence (R2=0.70).
While originally the P Index and the modified P Indices were primarily based on local expert knowledge, a
trend has developed whereby the P indices are informed by field testing, particularly at the field/plot scale.
Testing has in the main involved individual P Index factors; however, more testing of the effectiveness of P
Indices as a P management tool at both the field and catchment scale has been undertaken more in recent
years, as documented above. Testing of the various P indices has shown that there is great promise in the
use of this approach; however more testing is required particularly at the catchment scale.
1.4.3 Phosphorus Ranking Scheme for Ireland
Using the Lemunyon and Gilbert (1993) P Index (LGPI) as a guide, Magette (1998) developed a P ranking
scheme (PRS) specifically for grassland systems in Ireland. The PRS was designed to classify areas within
a catchment based on their relative propensity for contributing P to surface waters (Tables 3, 4 and 5).
However, by considering catchment scale factors and water quality conditions, the PRS was designed to
facilitate comparisons of area located in different, yet nearby, catchments or, indeed, among sub-
catchments. The incorporation of water quality in the PRS was intended to create scores that would have
identified areas within catchments having poor water quality as being relatively risky. The PRS thus differed
from the LGPI in four important ways, as it contained factors to address:
• farmyards as P sources;
• catchment conditions as well as site conditions;
• off-site transport of P to receiving waters; and
• the susceptibility of receiving waters to P pollution.

11
As with the LGPI, factors in the PRS were given weightings and values, which were multiplied together and
the products summed to give a final site score and designation (Table 5). At the time of its development, the
PRS was based on theory, published research on nutrient loss and transport, and professional judgement.
Table 3. Phosphorus ranking scheme (PRS) for Ireland1 (Magette, 1998).
Phosphorus Loss and/or Transport Risk (Value) Catchment or Field Factor
Weight for Factor Low (1) Medium (2) High (4)
P usage in catchment
0.5 0-5 kg P ha-1
5-10 kg P ha-1
>10 kg P ha-1
Condition of receiving waters
0.5 Saline waters, non-impounded waters, free flowing rivers and streams without nutrient problems
Oligotrophic and Mesotrophic lakes
Eutrophic and Hypertrophic lakes, other special designation waters
Ratio of land to water
0.75 Ratio < 36:1 36:1 < Ratio < 44:1 Ratio > 44:1
Farmyard conditions
0.8 (0 if no animals)
See supplement (Table 4), below
P usage rate on site
1.0 0-5 kg P ha-1
5-10 kg P ha-1
>10 kg P ha-1
P application time
0.9 Spring or just prior to crop needs
Late Summer or Early Fall
All other times
Soil test P (based on Morgan’s test)
0.8 0-6 mg P l-1
6.1-15 mg P l-1
>15 mg P l-1
Overland flow distance
0.75 Further than catchment average
Catchment average Less than catchment average
Runoff risk 1.0 Soil groups2: 6a, 6b,
6c; 7a, 7b; 8 but excluding peats
Soil groups: 4; 5 but excluding peats
Soil groups: 1;2;3a, 3b, 3c, but excluding peats
1Final score equals the sum of all factor risk * factor weight products.
2As defined by the National Soil Survey of Ireland (Gardiner and Radford, 1980)
The farmyard ranking scheme (Table 4) was a common-sense approach to evaluating farmyards based on good agricultural practice advice being given at the time (e.g., slurry storage capacity, silage effluent storage capacity, etc.). Table 4. Supplemental scoring system for farmyards
1 (Magette, 1998).
Factor Excellent (3 points each)
Good (2 points each)
Poor (1 point each)
Manure/slurry storage* > 24 weeks 20-24 weeks <20 weeks Dirty water storage ≥12 weeks 12 weeks>x>2 weeks <2 weeks Silage effluent storage greater than 3 days 3 days <3 days “Dirty areas”** 100% covered 50% covered <50% covered Managerial Level*** Top 5% of producers 5%<x<50% <50%
“Fatal Flaw”**** No Yes
* Applicable to operations with animals only; allocate 3 points if no animals present; storage periods may require regional adjustment to take account of the shorter winter in southern compared to northern areas
** Implies that roofed areas are fitted with gutters that divert all clean water. *** Characteristics of exceptional managers would be attention to detail in terms of environmental as
well as production issues, e.g. active use of nutrient management planning, well maintained equipment and facilities (e.g. non-leaking waterers), etc.
**** A “fatal flaw” is a situation that poses an imminent pollution threat (such as a cracked slurry store, a stream running through a farmyard, or a ‘clean’ water drain very near a pollutant source) and is cause to assign the farmyard an overall high pollution potential, regardless of other factors.
1Scoring - Add points. 13 or more = low ranking; 8-12 = medium ranking; less than 8 = high risk.

12
Table 5. PRS site scores and qualitative risk assignment (Magette, 1998).
Site Score Qualitative Risk
<10.8 Low
10.8-21.6 Medium
>21.6 High
1.4.3.1 Testing of the PRS
The PRS was first tested at catchment scale by Hubbard et al. (2001) using data provided from the Lough
Derg and Lough Ree Catchment Monitoring and Management System (Kirk, McClure Morton, 2001). The
PRS was applied on two sub-catchments (Omard and Ballina), both in the north eastern portion of the River
Shannon catchment. Subsequently a more extensive application of the PRS to more sub-catchments within
the Lough Derg and Lough Ree catchments was undertaken (Magette, 2002). Data used in this evaluation
were collected over a three-year period (July 1997 to July 2000) and included water quality parameters and
land management information (Kirk McClure Morton, 2001).
Judged by measured water quality, the Magette PRS was relatively accurate in predicting the rank order of P
export for each sub-catchment. However, the evaluations of Hubbard et al. (2001) and Magette (2002) both
indicated that applying the PRS was not straightforward, due to problems accessing the necessary data to
represent the factors used in the scheme. In addition, it was suggested that the use of both field and
catchment scale measures for factors such a P usage amounted to ‘double counting’, which distorted the
importance of these factors (Hubbard et al., 2001). These shortcomings, and subsequent recommendations
for improvement, as well as the recent availability of additional catchment and field data, provided the
impetus for re-evaluating and modifying the PRS.
1.5 Empirical Schemes for Assessing Nitrogen Losses from Agricultural Systems
Considerably less effort has been expended on development of empirical schemes to assess N losses than
has been devoted to P Indices.
As for phosphorus, procedures used to estimate the potential for nitrogen loss vary from simple screening
models to complex deterministic simulation models (Pierce et al., 1991). There have been many models
developed to assess N leaching, such as RZWQM (Root Zone Water Quality Model) (Ahuju et al., 2000),
Century (Parton et al., 1992), GLEAMS (Leonard et al., 1987), SoilN (Johnsson et al., 1987) and SUNDIAL
(Bradbury et al., 1993); these are rather detailed deterministic, process based models.
The “nitrogen index” is at the simpler end of the continuum of simple to complex models used to assess the
behaviour of N in agricultural systems. Like the LGPI and PRS, an N Index assesses a few factors in order
to provide a relative measure of the likelihood of N losses from an agricultural system, generally by leaching
as this is the predominant pathway for N losses from most agricultural systems. In the US, the development
of nitrogen leaching indices has been limited, in contrast to the PI.
A number of authors have developed simple “factor” based methodologies to assess the potential for
nitrogen loss to both groundwater and surface water. One such model is DRASTIC (Aller et al., 1987).

13
Though not a Nitrogen Index in the strictest sense, it is a widely used methodology for evaluating
groundwater pollution potential because the inputs required for its application are generally available or easy
to obtain. The DRASTIC model is based on seven factors, as reflected in the acronym DRASTIC:
Depth to water;
Net Recharge;
Aquifer media;
Soil media;
Topography;
Impact of the vadose zone; and
Hydraulic Conductivity.
For an area under investigation, each of the factors is mapped and assigned a subjective rating between 1
and 10 based on its perceived severity in promoting N leaching. Weightings are assigned for each factor to
balance and enhance its importance in the leaching process. This model has been used and updated by a
number of authors such as Fritch et al. (2000), Navuler and Engel (1998) and others in order to better
determine the risk of nitrate leaching to groundwater.
Williams and Kissel (1991) developed a simple model to indicate nitrogen leaching potential, which takes
account of a number of important factors such as hydrologic soil group, seasonal rainfall distribution and
annual precipitation. Each of these factors is combined to estimate the percolation rates at a site and
consequently the risk of N loss via leaching.
Pierce et al. (1991) also developed a simple leaching Index (LI) which they described as a “simple hand
calculator” to estimate the potential for NO3-N leaching on an annual basis. This methodology combined the
simple leaching index of Williams and Kissel (1991) with an estimate of the NO3-N available for leaching to
give an overall leaching risk classification.
A more complex approach than indexing methods, yet simpler that most deterministic models, was the
NLEAP model (Nitrogen Leaching and Economic Analysis Package) (Shaffer et al., 1991). This was
developed as a field-scale computer model to provide a quick and efficient method of determining potential
nitrate leaching associated with agricultural practices. It uses basic information concerning on-farm
management practices, soils, and climate to project N budgets from which nitrate leaching indices are
derived. The processes considered include movement of water and nitrate, crop uptake, denitrification,
ammonia volatilization, mineralization of soil organic matter, nitrification, and mineralization-immobilization
associated with crop residue, manure, and other organic wastes. While this model may not be strictly
considered as a nitrate leaching index tool, due to its relative complexity, it was developed for use by farmers
and agricultural advisors alike to identify the potential for N leaching (Shaffer et al., 1991).
Poiani et al. (1996) were concerned with the potential damage to wetlands in central New York (US) caused
by nitrogen leaching. In order to determine the potential from nitrogen losses to the wetlands, they
developed a simple nitrogen leaching index. The index was combined with GIS technology to develop maps
of N loss potential for wetland catchments in New York state. This index also combined a leaching index
input with a “nitrogen available for leaching” input. This resulted in a “Nitrogen leached from the root zone”
factor. The “Nitrogen leached from the root zone” was then adjusted to account for denitrification that might

14
occur during transport of the NO3-N with groundwater. The extent of the denitrification is determined by the
travel time down through the flow path and the denitrification rate.
Nolan et al., (1997) developed a shallow groundwater risk map for the US whereby 4 levels of contamination
risk were categorised based on the aquifer vulnerability and the nitrogen input. The 4 categories are as
follows:
(1) Low nitrogen input and low aquifer vulnerability
(2) Low nitrogen input and high aquifer vulnerability
(3) High nitrogen input and low aquifer vulnerability
(4) High nitrogen input and high aquifer vulnerability
Nolan et al. (1997) found that high-risk areas generally had high nitrogen input, well-drained soils, and less
extensive land use devoted to forestry than to crops. Their procedure was successful in identifying areas
where “high” nitrogen levels existed in groundwater; however, their projections were made at very large
scales. Magette (1998) developed a nitrogen ranking scheme for use in Ireland to compare the relative
likelihood of losing nitrogen from grassland systems. This technique is discussed more thoroughly in Section
1.6 below.
In Ireland, considerable effort was expended to develop a nationally applicable Groundwater Protection
Scheme (Anonymous, 1999). This Scheme is not specifically designed to assess the leaching potential of N,
but it can be used for this purpose due to its generic applicability of the “Source – Pathway – Target” model
to all potential groundwater contaminants and geologic settings. The susceptibility of an aquifer to
contamination depends on the following factors
• Length of the Flow Path: The thickness and characteristics of the unsaturated zone determines the
length of the flow path from the source of contamination to and aquifer and also what kind of
attenuating conditions the contaminant may encounter.
• Pollutant Characteristics: Some contaminants, such as nitrate, may move freely through the soil
profile. Others may be readily adsorbed to soil particles.
The risk of contamination to groundwater depends primarily on two elements
• The potential hazard resulting from the polluting activity: the presence of potential pollutants in
sufficient quantities to cause significant contamination.
• The vulnerability of groundwater to contamination: The existence of pollutants in itself is not a clear
indication that pollution of groundwater may occur. Nitrogen is water soluble and moves with
percolating water down through the soil profile. The extent of the percolation depends of the
permeability, pore size distribution and soil depth to a restrictive layer.
The Groundwater Protection Scheme (Anonymous, 1999) also considers the consequences that
contamination of groundwater might trigger by incorporating a score for the value of the aquifer as a
resource.
A similar assessment approach was used in evaluating the risk of groundwater contamination in Ireland, as
mandated by the Water Framework Directive (Working Group on Groundwater, 2005). This methodology
assessed “pathway susceptibility” (a measure of attenuation of nitrate leaching by soil and geologic material)
and “impact potential” (integrating susceptibility and the magnitude of contaminant “pressures”) to develop a

15
risk category for aquifers. Risk designations were then confirmed or adjusted using measured data. In
contrast to the Groundwater Protection Scheme (Anonymous, 1999), the risk assessment of groundwater
resources as required under the Water Framework Directive did not consider the value of an aquifer to water
supply.
Czymmek et al. (2003) developed an N leaching index for application across New York state and named it
the New York Nitrate Leaching Index (NYNLI). It is described as an indicator of the potential for nitrate to
reach groundwater. The leaching index (LI) is calculated as follows
LI = Percolation Index * Seasonal Index.
The Percolation Index is a function of the soil group as outlined in Table 6. The Percolation Index is based
on the premise that nitrate is water-soluble and moves downward as water percolates through the soil. The
extent of percolation is dependent on soil permeability, pore size distribution, soil depth to a restrictive layer,
artificial drainage and precipitation amounts.
Table 6. Soil hydrologic groups for use in NYNLI (Czymmek et al., 2003).
Soil Hydrologic Group
Soil Type Infiltration Capacity
Leaching Potential
Runoff Potential
A Deep Well Drained Sands and Gravels High High Low B Moderately drained moderately fine to
fine texture Moderate Moderate Moderate
C Impeding Layer or moderately fine to fine
Low Low High
D Clay soils. Soils with a high water table Very Low Very Low Very High
The Seasonal Index is based on the annual precipitation and the sum of the winter and autumn precipitation.
This has the effect of increasing the rating of areas in high rainfall areas. The NYNLI effectively determines
the risk of N loss via leaching to groundwater. The index also focuses only on the loss occurring from the
root zone and does not consider the issues of transport through subsoil layers, i.e. it assumes that there is
no NO3-N attenuation below the root zone.
In Ohio a Nitrogen Leaching Index was developed by the Ohio office of the USDA-Natural Resources
Conservation Service (NRCS) (Anonymous, 2001). This index classifies soils into High, Medium and Low
leaching potential by combining data from a soil’s “hydrologic soil grouping” with the local (county) rainfall.
In Canada a Nitrogen Index was developed (OMAFRA, 2003) for the Ministry of Agriculture and Food in
Ontario. The Nitrogen Index is used to determine the “leaching risk” of the soil, based on hydrological
characteristics. Each soil series in Ontario is given a leaching risk (AA, A, B, C, D) based on its hydrologic
soil grouping. A soil N balance is calculated for each field, based on the applied nitrogen and the nitrogen
requirements of the crop. The leaching risk is then combined with the nitrogen excess to calculate the
“Nitrogen Leaching Risk”
Shaffer and Delgado (2002) produced a set of guidelines for the development of a “nitrogen leaching tool”.
They proposed that the approach should have three tiers of complexity, with Tier 1 effectively being a
“screening’ tool allowing for the generation of a list of the top third of sites, in terms of the highest risk of
nitrogen losses. Tier 2 would facilitate a more comprehensive examination of the nitrate leaching potential,
by using databases or application of models. Tier 3 would be used where detailed assessments are

16
warranted and would involve the use of very detailed deterministic models, field data, interpretation and
normalisation.
Delgado et al. (2006) further developed their previous Nitrogen Index (Shaffer and Delgado, 2002). This
index would be categorised as a “Tier 1” index as outlined above. This index was developed so that it can
be used in parallel with the modified P indices widely used in the USA.
Provolo and Riva (2003) and Provolo (2005) developed a GIS-based tool for assessing various threats to
water quality in the Lombardy region of northern Italy. A Nitrogen Risk Index was calculated using N
additions at farm scale versus crop requirements. No attempt was made to partition N losses between
leaching and surface losses, but the technique was effective in identifying areas within the region that were
more likely to experience N losses than others.
Ceplecha et al. (2004) developed both a field- and a state-level aquifer risk tool. At the larger scale the tool
was intended as a screening procedure with which resources could be focused on “high risk” areas. The
field scale tool was constructed much like the more common P index tools, with field scale factors rated on
their perceived contribution to the loss of nitrate.
The foregoing review shows that the N “indexing” procedure is generally perceived as a screening tool in
order to identify areas within catchments for which there is an elevated risk of nitrogen loss (usually, but not
exclusively, through leaching). In these tools losses of nitrogen from the root zone are generally determined
by a combination of rainfall (particularly during autumn and winter periods) and a hydrological classification
for the soil type. In some cases the use of a nitrogen application (or excess application) factor is also used.
The transport and impact of nitrogen leaching from the root zone was addressed with in a number of the
indices with the introduction of the “aquifer vulnerability” factor.
1.6 Nitrogen Ranking Scheme for Ireland
The nitrogen ranking scheme (NRS) developed by Magette (1998) was intended as a tool for identifying the
relative likelihood that N would be lost from the landscape, specifically grassland agricultural systems, and
transported to water in Ireland. The NRS was not intended to “quantify” the losses of N, but rather to serve
as an approach whereby comparisons could be made between different sites based on measurable
characteristics. The NRS was developed in parallel with a phosphorus ranking scheme (PRS), as described
in Section 1.4.3, and shares many of the same factors and the same basic structure (Table 7). However, as
the processes influencing the transport of N and P from agricultural sources to water differ, the Magette
(1998) NRS and PRS differ in the number and type of factors they include. There are three basic
assumptions made for the NRS:
• N is lost primarily from agricultural systems by leaching to groundwater and subsequent delivery to
surface water via groundwater discharge;
• N for leaching is derived from N contained in the soil profile in excess of crop needs; and
• Losses of N in surface runoff are negligible, and essentially equal to inputs from rainfall (an
assumption that has been challenged by more recent research).
Although Magette (1998) highlights the fact that overland flow has a minimal influence on N losses from
diffuse agricultural sources, he does state that surface waters can be impacted by the N losses, particularly

17
through the presence of subsurface drainage, which intercepts the movement of N from the root zone. The
issue of groundwater recharge to surface water is also an important issue in some areas. As with the PRS,
the NRS included a factor to address the susceptibility of a water resource to contamination; it utilised
designations from the Groundwater Protection Scheme for Ireland (Anonymous, 1999), which was then
under development.
Table 7: Nitrogen Ranking Scheme for Ireland (Magette, 1998). Catchment or
Weight for
Nitrogen Loss and/or Transport Risk (Value)
Field Factor
Factor
Low (1)
Medium (2)
High (4)
N usage in catchment
0.5
Average N use @ REPS* level
Average N use @ REPS X 1.25
Average N use > REPS X 1.25
Condition of receiving waters
For ground water: 0.5
NO3
—N < 6.0 mg l
-1
6.0 < NO3
--N > 11.0
mg l-1
NO3
--N > 11.0 mg l
-1
For surface water: 0.5
Non-sensitive waters
Free-flowing waters sensitive to N
Impounded waters sensitive to N
Ratio of land to water
0.75
Ratio < 36:1
36:1 < Ratio < 44:1
Ratio > 44:1
Farmyard conditions
0.8 (or 0 if animals not utilised)
See section 9.1
See section 9.1
See section 9.1
N usage rate
1.0
Average N use @ REPS level
Average N use @ REPS X 1.25
Average N use > REPS X 1.25
N application time
1.0
Just prior to crop needs
Early spring
All other times
Subsurface drainage
For assessing ground water: 0.9
Well designed & operating drains
Drains in need of improvement
No drainage or drains failing
For assessing surface water: 0.9
No drainage or drains failing
Drains in need of improvement
Well designed & operating drains
Vulnerability of groundwater
1.0
Low rating by GS** of Ireland
Moderate rating by GS of Ireland
High or extreme rating by GS of Ireland
Native riparian vegetation
For areas without sub-surface drainage: 0.5
Natural stream side vegetation intercepts most groundwater discharge
Natural stream side vegetation intercepts 50% of groundwater discharge
No natural stream side vegetation or discharge bypasses
For areas with sub-surface drainage: 0.0
Subsurface drains present
Subsurface drains present
Subsurface drains present
*REPS = Rural Environment Protection Scheme **GS = Geological Survey (of Ireland)
The final score using the NRS is obtained by multiplying the weight of each factor by the corresponding
value associated with the factor, and summing all of the resulting products. The final sum provides a
numerical expression for the relative likelihood that N will be lost and transported from an area under
investigation.

18
Magette (1998) warned about the limitations of the NRS, highlighting the gross-over simplification it makes of
very complex processes. In addition, the weightings assigned to each individual factor and the definition of
what constitutes a ‘low’, ‘medium’ or ‘high’ nutrient loss value for each factor, were based on professional
judgement, and were not validated by field studies. For these reasons Magette (1998) recommended that
further research should be conducted into the use of this system to verify the validity of the procedures.

19
2 Methodology of the Project
As this project was not funded to undertake field experimentation and data collection, considerable effort was
expended in searching for, and then assessing, available data that could be used to meet the project
objectives. Due to the focus of the project on developing P and N loss and transport tools for Ireland, it was
considered that only data sets originating in Ireland or the United Kingdom would be applicable. Limited data
sets were found that were usable at the field scale; considerably more usable data sets at small catchment
scale were obtained from previously conducted “Catchment Monitoring and Management Strategy Studies”
(Kirk McClure Morton, 2001; MCOS, 2002).
Once data had been assembled, research progressed through the five work packages identified in Section
1.3. As mentioned in Section 1.3, most of the effort expended in this project was devoted to Work Packages
1 and 2, which concerned the development and testing of phosphorus “ranking” tools to discriminate
between areas within catchments based on their propensity to lose P that would be subsequently
transported to receiving waters. Due to the considerable effort devoted to these two work packages, a
schematic flow chart outlining elements of the research is given in Figure 3.
2.1 Description of Data Sets Used in the Project
Three “field scale” datasets were kindly contributed for use in this project by Irish researchers (Dr. Isabelle
Kurz, formerly of Teagasc Johnstown Castle Research Centre, Wexford, Ireland; Dr. Catherine Watson,
Agriculture, Food and Environmental Science Division of the Agri-Food and Biosciences Institute, Belfast, N.
Ireland; and Dr. Pamela Bartley, Bartley & O'Suilleabhain Environmental Engineering, Galway, Ireland). The
datasets are described more fully later, but consisted of the following:
• Data for the Cowlands and Warren fields at Johnstown Castle, Co. Wexford. (Kurz, 2000) and data
from the “Beef Unit” and the “Dairy Farm” located at Johnstown Castle, Co. Wexford (Kurz, 2002).
• Data for five experimental plots at Agri-Food and Biosciences Institute at Hillsborough (Watson et
al., 2000, 2007).
• Data on nitrogen use and borehole water quality Co. Cork (Bartley, 2003).
Catchment scale data used in this project originated from a number of published sources. These datasets
are described more fully later, but consisted of the following:
• Information on the Clarianna, Bellsgrove and Grange Rahara catchments, which are located in the
River Shannon system, was collected and provided by the Derg/Ree Catchment Monitoring and
Management System project (Kirk McClure Morton, 2001).
• The Three Rivers Project (TRP) (MCOS, 2002) provided information on the Clonshanbo catchment
of the River Liffy, the Yellow River and Annesbrook catchments and subcatchments of the Boyne
River system, as well as the Clonmore, Dawn (Ballyshannock) and Ara catchments in the Suir River
system.
• Data on the Dripsey “D1” and “D2” catchments in the Southeast of Ireland (County Cork) were
reported by Morgan et al. (2000).

20
Figure 3: Outline of methodology used to accomplish work packages 1 and 2.
Field Scale
Assessment
Catchment Scale
Assessment
Field PRS Catchment PRS
Recommend
Modification
mPRS
Field Scale
Testing
Catchment Scale
Testing
Final
mPRS
Recommendations
Magette PRS (1998)

21
2.2 Work Package 1: Initial Assessment of The PRS (Magette, 1998) at Field and
Catchment Scales with the Introduction of Some Modifications
2.2.1 Field Scale Testing
Testing of the PRS developed for Ireland by Magette (1998) was carried out at the field scale for three fields
at Johnstown Castle, Wexford, Ireland (described by Kurz, 2000). In addition to the direct application of the
PRS to the three fields, various hypothesised scenarios for the placement of the fields in the landscape as
well as catchment characteristics and the condition of the receiving waters were investigated. Factors of the
PRS pertinent only to edge-of-field P losses were evaluated against measured edge-of-field P exports.
Although the preferred approach would have been to evaluate the PRS by comparing PRS scores for P loss
and transport risk against measured in-stream water quality data, the only P loss data available for these
fields were the “edge-of-field P export rates”. There was no information available on whether or not P
exported from the fields was actually transported to receiving waters. This meant that the factors relating to
the off-site transport of P from a field to the nearest stream/river could only be assessed using the
hypothetical scenarios.
Three levels of assessment were undertaken:
• Magette PRS evaluation;
• Edge-of Field (FFO (Field Factor Only) PRS) Magette PRS factor evaluation;
• Evaluation of the FFO PRS while varying factor weights.
2.2.1.1 Level 1 Field-scale Evaluation of Original PRS
The original PRS (Magette, 1998) was applied to all three sites used in the Kurz (2000) study. Justifications
for individual factor risk assignments are described below.
• Catchment P Use for all three fields was assigned a risk value of 'high', as the catchment is in an
area largely dominated by agriculture. This risk value was however an assumption, as specific
information on catchment P use was not available.
• Condition of Receiving Waters was assigned a risk value of 'low', as the catchment discharges into
a free flowing, freshwater stream. This characterisation was not intended to condone the discharge
of P into free, flowing waters, but rather to indicate that, compared to impounded waters already in
a eutrophic condition, a discharge of P into unimpaired free flowing waters probably represented a
less risky situation. (As pointed out previously, the inclusion of a “condition of receiving waters”
factor in the PRS was somewhat controversial.)
• Ratio of Land to Water was assigned a 'medium' risk value. This risk assignment was based on the
fact that, while the field soils are gleyed (Kurz, 2000) and most likely have high water tables, there
did not appear to be areas of standing water.
• Farmyard Conditions was assigned a risk of 'low'. While the fields assessed are associated with
the Beef Unit at Johnstown Castle, and are grazed, the farmyard is not located within this specific
subcatchment. However, depending on the scale used to define the extent of a 'catchment', it may
be appropriate for it to be included; but, if so, the assigned risk would most likely have been 'low'
due to the high quality of the facilities and management (Kurz, 2002).
• Site P Usage Rate was assigned a risk based on the monitoring period from January to December
of 1997, the year when data from all three sites were available. During this period, Warren 1

22
received no P additions (low risk), while Warren 2 and the Cowlands site received slurry (at the rate
of 26 kg P ha-1
) and super-phosphate (30 kg P ha-1
), respectively (high risk).
• P Application Time for the Warren 1, Warren 2 and Cowlands sites was assigned a risk value of
'low' for all three sites. No P was applied to the Warren 1 site, and both the Warren 2 site and the
Cowlands site received P application in the month of March.
• Soil Test Phosphorus values for the three sites are 'low', 'medium' and 'high' risk for the Warren 1,
Warren 2 and Cowlands sites, respectively.
• Overland Flow Distance in the Magette PRS (1998) was based on the 'catchment average' distance
from the field to the stream. The Warren 1, Warren 2 and Cowlands fields are 100, 75 and 250 m
from the relevant stream or drainage ditch, respectively. Because the catchment boundaries were
not clearly delineated for these fields, the average distance from the field to the stream or ditch was
not available. As research has show significant P reductions in runoff flowing through 30 m of
vegetated area (Magette et al., 1989), a risk value of 'medium' was assigned to the Warren 1 and 2
sites and 'low' risk was assigned for the Cowlands site.
• Runoff Risk was assigned a risk value of 'high' for all three sites due to gleyed soils (Kurz, 2000).
Two other hypothetical scenarios were examined while holding field factors (STP, P usage rate and
application time, and runoff risk) constant:
• Worst case scenario, in which “high” risk values were assigned for catchment P use, ratio of land to
water, overland flow distance, condition of receiving waters and farmyard conditions.
• Best case scenario, in which “low” risk values were assigned for catchment P use, ratio of land to
water, overland flow distance, condition of receiving waters and farmyard conditions.
2.2.1.2 Level 2 Field-Scale Edge-of Field PRS Factor Evaluation
To compare edge-of-field related factors of the PRS with measured edge-of-field P losses, a truncated
version of the PRS (termed the “field-factor-only PRS” or FFO PRS) was evaluated. Factors in the PRS
directly related to edge-of-field P losses are soil test P, P application rate and time, and runoff risk. The FFO
PRS is presented in Table 8. The FFO PRS was applied to all three sites in the Kurz (2000) study. Derivation
of categories for delineating 'low', 'medium' and 'high' risk for P loss based on rank score was determined
according to methods given in Magette (1998). The farmyard conditions factor was excluded for the reason
outlined in Section 2.2.1.1.
Table 8. Magette PRS edge-of-field factors (FFO PRS) (adapted from Magette, 1998).
Phosphorus Loss and/or Transport Risk (Value) Field Factor Factor Weight Low (1) Medium (2) High (4)
P usage rate 1.0 <5 kg P ha-1
5-10 kg P ha-1
>10 kg P ha-1
P application time
0.9 Spring or just prior to crop needs
Late Summer or Early Fall
All other times
Soil test P (Morgan’s test)
0.8 0-6 mg P l-1
6.1-15 mg P l-1
>15 mg P l-1
Runoff risk 1.0 Soil groups: 6a, 6b, 6c; 7a, 7b; 8 but excluding peats
Soil groups: 4; 5 but excluding peats
Soil groups: 1;2;3a, 3b, 3c, but excluding peats

23
Due to the fact that only edge-of-field P loss factors of the PRS are used in the FFO PRS, its evaluation was
based on whether the final risk scores corresponded directly to measured edge-of-field P losses. The
criterion for concluding that a PRS version was successful was whether or not the final numerical risk scores
for the three sites were in the same rank order as measured P losses (i.e., Warren 1 < Warren 2 <
Cowlands).
2.2.1.3 Level 3 Field Scale FFO PRS Weight Variation
In the derivation of P Indices in the US as well as the PRS developed by Magette (1998), ‘professional
judgment’ has been relied on for the initial assignment of individual factor weights. Factor weights depict the
relative importance of each factor in the overall P loss and transport process. Kurz's (2002) thorough
evaluation of the field characteristics and edge-of-field P loss for the Warren 1, Warren 2 and Cowlands sites
provided an opportunity to examine more closely the weightings for the edge-of-field related factors in the
Magette PRS. To accomplish this evaluation, the FFO PRS, with individual factor weights ranging from 0 to
4, was applied to hypothetical fields representing ‘absolute best', 'average' and 'worst' case scenarios for all
field factors and to the three fields described in Kurz (2002). Hypothetical fields were those for which, all
factors were ranked as either ‘low’ risk, ‘medium’ risk, or ‘high’ risk, giving “pure” scores for the three risk
ratings. Only one factor weight was varied at a time, while the other three were held constant at values
assigned in the original PRS.
2.2.2 Field Scale Modifications and Testing
Based on results from the field-scale evaluation of the PRS (Magette, 1998) and the PRS edge-of-field
factors only (FFO PRS) presented above, and previous research by Hubbard et al. (2001) and Magette
(2002), a modified version of the PRS was proposed and evaluated using the same three fields described in
Kurz (2000).
This modified PRS was entitled the “Field PRS” (Table 9). The Field PRS is a 7 x 3 matrix with 6 field scale
factors and 1 catchment factor. Five of the Field PRS factors (P usage rate, P application time, soil test P
(STP), runoff risk, and condition of receiving waters) were adopted directly from the PRS developed by
Magette (1998). However, there were also a number of alterations to the original PRS, as follows:
• A risk value of '0' was allowed for P usage and application timing factors on fields where no P was
applied.
• The overland flow distance factor was also modified for field application, as suggested by Coale et
al. (2002), to consider measured distance from the field to receiving waters, as well as to include
vegetative buffer width to reflect the mitigating effect of vegetative buffers on P transport to surface
waters. Modification of the risk determination for this factor from 'catchment average' distance used
by Magette (1998) also eliminated the need for measuring the distances of all fields in a catchment
to the nearest streams. The distance from the field centre to the receiving water can be measured
directly in the field. However, this factor should be assigned a 'high' risk if there is evidence of
'short-circuiting', such as the presence of field or tile drains. Likewise, if a vegetative buffer exists,
but runoff from the field short-circuits the buffer area, it should not be included in the risk
assignment. If these guidelines are followed, P loss risk from leaching and subsurface drainage will
indirectly be considered in the Field PRS.

24
• The 'farmyard conditions' factor of the PRS was also included indirectly. If farmyard conditions rate
as 'high' risk, P usage rate and time factors were assigned a 'high' risk, assuming that improper
farmyard conditions (i.e. lack of adequate manure storage) are associated with high risk practices
for P application. Additionally, if the farmyard constitutes a direct P source, the condition of the
receiving waters would also be likely to be impacted.
• A factor for soil erosion was added to expand the applicability of the PRS to include fields under
tillage or that are poorly managed as pasture (i.e. overgrazed), where soil erosion would be
expected to contribute to P loss. This factor was assigned a weight of '0.5' to reflect the low intensity
of rainfall in Ireland (Keane, 1992).
Table 9. The Field PRS. Adapted from Magette (1998) for field scale application.
Phosphorus Loss and/or Transport Risk (Value) Catchment or Field Factor
Weight for Factor Low (1) Medium (2) High (4)
P usage rate*
1.0 (0 if no P applied)
0-5 kg P ha-1
5-10 kg P ha-1
>10 kg P ha-1
P application*
time 0.9 (0 if no P applied)
Spring or just prior to crop needs
Late Summer or Early Fall
All other times
Soil test P (based on Morgan’s test)
0.8 0-6 mg P l-1
6.1-15 mg P l-1
>15 mg P l-1
Runoff risk 1.0 Soil groups: 6a, 6b, 6c; 7a, 7b; 8 but excluding peats
Soil groups: 4; 5 but excluding peats
Soil groups: 1;2;3a, 3b, 3c, but excluding peats
Overland flow distance
0.75 > 30 m, or <30 m but with > 15m of vegetated buffer
<30 m , but with > 8 m of vegetated buffer
< 30 m and < 8 m of vegetated buffer
Condition of receiving waters
0.5 Saline waters, non-impounded waters, free flowing rivers and streams w/o nutrient problems
Oligotrophic and Mesotrophic lakes
Eutrophic and Hypertrophic lakes, other special designation waters
Soil Erosion 0.5 Well-managed pastures
Poorly managed pastures with either overgrazing, direct access of animals to surface waters, or bare soil areas, or No-till crop systems
Row crops under tillage
*P application rate and time factors should be assigned a 'high' risk if farmyard conditions indicate a high risk farmyard. Final risk values are: <7.4 = 'low', 7.4-14.9 = 'medium' and >14.9 = 'high' risk of P loss from the site.
2.2.3 Catchment Scale Testing
A detailed assessment of the PRS to determine its effectiveness in identifying the risk of P loss to surface
water was carried out at the catchment scale by using the available catchment scale data to assign values to
the factors used in the PRS. Following this initial assessment a number of modifications were introduced to
the Magette PRS in an attempt to improve its functionality and usability at the catchment scale. A further
objective of this catchment scale evaluation was to extend the areal coverage of previous assessments by
Hubbard et al. (2001) and Magette (2002).
The PRS was applied to a number of catchments in addition to the six Bellsgrove sub-catchments (and
entire Bellsgrove catchment) investigated by Hubbard et al. (2001) and Magette (2002). The purpose of this

25
investigation was to determine whether the P loss and transport score produced by the PRS correlated with
in-stream P concentrations.
The PRS was, in three cases, applied to sub-catchments as well as their “parent” catchments. These were:
• The Bellsgrove catchment was assessed together with 6 individual sub-catchments within the
Bellsgrove system (using datasets from Kirk McClure Morton, 2001).
• Yellow River catchment and 12 sub-catchments within it (using datasets from MCOS, 2002).
• The Dripsey catchment, D1 is a sub-catchment of D2 (using datasets from Morgan et al., 2000).
When detailed information regarding the risk assignment for a given factor was not available, an estimate
was made based on available data. However, this investigation differed from the Magette (2002) approach
with respect to the assignment of values for “P application time” risk when no information was available.
Magette (2002) assumed that best management practices were being followed on all farms in lieu of actual
application time data. On reviewing data from the additional catchments, this seemed to be rarely the case.
Aside from the farms associated with Teagasc Johnstown Castle Research Centre (i.e., the Beef Farm and
Dairy Unit catchments), many catchments contained a significant number of farms with inadequate manure
storage. It was assumed that inadequate manure storage would necessitate spreading of manure during the
late summer, fall and winter seasons. In an attempt to neither underestimate nor overestimate risk
associated with the timing of manure application, when no data were available for P application time, a risk
value of 'medium' was assigned for this factor.
Water quality was assigned an ‘acceptable’ or ‘unacceptable’ rating based on median molybdate reactive P
(MRP) levels, as streams with annual median MRP levels > 30 µg L-1
generally show signs of eutrophication
(Bowman et al., 1996).
2.2.4 Modification of the PRS and Evaluation for Catchment Scale Application
A modified version of the original PRS (Magette, 1998) was assembled to incorporate findings from both
field- and catchment-scale evaluations of the PRS to improve its practical application. The modified PRS is
referred to as the Catchment PRS (Table 10) and consists of a 6 x 3 matrix with 6 factors related to
catchment characteristics and 3 possible risk levels associated with each factor. The final rank score as well
as delineation of categories with respect to rank (Table 11) were calculated according to procedures
described in Magette (1998).
The modifications to the Magette (1998) PRS that were included in the Catchment PRS were:
• The ‘farmyard conditions’ factor was modified in the Catchment PRS as follows: if detailed
information is available, the Magette (1998) farmyard conditions assessment should be used in
conjunction with farmyard density, according to the risk values assigned by Magette (2002). If no
specific farmyard conditions information is available, farmyard density alone should be used.
• Previously, in the PRS devised by Magette (1998) catchment P usage was assigned a weighting of
0.5 and the field P use was assigned a weighting of 1. As this could be interpreted as double
counting the importance of P usage, “field P usage” was excluded from Catchment PRS; instead
only a “P usage in catchment” factor was used, and given a weighting of 1.

26
• The ‘overland flow distance’ factor was eliminated from the PRS of Magette (1998) and instead,
only the “ratio of land to water” factor was included in Catchment PRS (with a weighting of ‘0.75’.
• Due to the fact that very little data were available in Ireland with which to determine P application
times, the “P application time” factor was omitted from the Catchment PRS.
• ‘Soil erosion’, a factor that was proposed as a component of the field-scale Magette PRS, was not
included in the Catchment PRS, mainly because most (ca. 90%) of Irish agricultural land is pasture
based with very little tillage or row cropping.
Regression analysis and Spearman's Rank correlation were use to measure the association between the
total Catchment PRS value and median in-stream MRP (SAS, 1985).
Table 10. Catchment PRS (adapted from Magette, 1998) for catchment-scale evaluation of P loss risk.
Phosphorus Loss and/or Transport Risk (Value) Factor Weight for Factor Low (1) Medium (2) High (4)
P usage in catchment
1.0 (0 if no P applied)
0-5 kg P ha-1
5-10 kg P ha-1
>10 kg P ha-1
Condition of receiving waters
0.5
Saline waters, non-impounded waters, free flowing rivers and streams w/o nutrient problems
Oligotrophic and Mesotrophic lakes
Eutrophic and Hypertrophic lakes, other special designation waters
Ratio of land to water
0.75 Ratio < 36:1 36:1 < Ratio < 44:1 Ratio > 44:1
Farmyard conditions/ density
0.8 (0 if no animals)
> 1 yard / 30 ha and/or as assigned by the Magette PRS
1 yard / 15-30 ha and/or as assigned by the Magette PRS
< 1 yard / 15 ha and/or as assigned by the Magette PRS
Average catchment Soil test P (based on Morgan’s test)
0.8
0-6 mg P l
-1
6.1-15 mg P l
-1
>15 mg P l
-1
Runoff risk 1.0 Soil groups1: 6a, 6b,
6c; 7a, 7b; 8 but excluding peats
Soil groups: 4; 5 but excluding peats
Soil groups: 1;2;3a, 3b, 3c, but excluding peats
1As defined by the National Soil Survey of Ireland (Gardiner and Radford, 1980)
Table 11. Interpretation of the Catchment PRS final rank as well as overall risk assessment for catchment scale P loss risk (adapted from Magette, 1998).
Final Risk
Overall Risk Assessment
< 7.3 LOW potential for P movement from this catchment given current management practices and catchment characteristics. There is a low probability of an adverse impact to surface waters from P losses from this catchment.
7.3 to 14.6 MEDIUM potential for P movement from this catchment given current management practices and catchment characteristics.
> 14.6 HIGH potential for P movement from this catchment given current management practices and catchment characteristics.

27
2.3 Work Package 2: Development and Testing of a Modified PRS (mPRS) at Field
Scale
Difficulties identified with the original PRS (Magette, 1998) during the conduct of Work Package 1 (Section
2.2) and in previous analyses (Hubbard et al., 2001; Magette, 2002) were addressed by further assessment
of the procedure with the intention of developing a radically modified PRS (mPRS).
2.3.1. Development and Description of mPRS
Following an exhaustive review of the scientific literature to assess international best practice in regard to P
indices (Section 1.4) a radically altered and more compartmentalized index was developed and called
modified PRS (mPRS). Compared to the original PRS (Magette, 1998), the main features of mPRS were:
• Restructuring into source and transport factors: The most significant alteration to the original
PRS was restructuring it into a “Process driven” format. This is a simplistic representation of the two
primary processes (loss and transport) by which P movement from grassland to surface water
occurs.
• Adoption of a multiplicative approach for site scoring: As with P indices used elsewhere (e.g.,
Sharpley et al., 2003), a multiplicative approach was adopted to combine source factors and
transport factors. However, unlike other P Indices, within the mPRS both addition and multiplication
are used in order to generate a site score.
• Inclusion of “distance from stream”. While distance from a watercourse was included in the
original PRS (Magette, 1998), the fields were not categorised by actual distance from the stream,
but rather by their relative distances from the stream as defined by the catchment average distance
of all fields from watercourses (an indirect measure of drainage density). In the mPRS a field is
evaluated based on its actual distance from the stream.
• Open-ended categorisation: The original PRS (and most other PRSs in use) categorise sites as
“high risk”, “medium risk” or “low risk” depending on where within a fixed numerical range the final
PRS score falls. However for the mPRS, categorisation was not rigidly defined; instead, it was
based on segmenting into 3 equal groupings the range in scores resulting from assessing all fields.
Rather than assign a qualitative risk definition to some predetermined range of numerical scores,
this approach make individual site scores relative to each other within the area being examined.
This method was adopted so that the mPRS can be used in situations where datasets required for
each factor in the mPRS are unavailable. Unfortunately, in Ireland it is often the case that data for
one or more mPRS factors are unavailable. When data are missing for one or more factors needed
for mPRS, a “partial” mPRS score can be developed that is valid on a relative basis against other
sites assessed using the same set of factors.
• Optimised Weightings: Optimisation analysis was undertaken to test the weightings used in the
mPRS. The starting point for this evaluation was the set of weightings assigned in the original PRS
(Magette, 1998); however the mPRS was then tested using the weightings determined from the
optimisation procedures. Testing of the individual factors in the mPRS using measured field-scale
data allowed development of weightings based on the best fit for the individual factors for the fields
tested.
In its simplified representation of the major processes involved in the movement of phosphorus from a field
to surface water, the modified PRS (mPRS) uses ranking factors divided into P “source factors” (S) and P
“transport factors” (T) (Tables 12-14).

28
2.3.1.1 Description and Justification of mPRS Source Factors
In order for phosphorus from diffuse sources to arrive at a water body there must be both a P source area
and a P transport mechanism by which P is transported from land to water (Magette, 1998). Areas within a
catchment may have a high potential for contributing P to surface waters because high levels of phosphorus
are available for transport from these areas. The potential of an area to be a “source area” is governed by
the following factors.
Table 12. Modified PRS (mPRS).
Factor Description Weighting Low Risk (1) Medium Risk (2) High Risk (4)
S1 P Usage Rate 1 Teagasc P Index
1 or 2, or 0-5 kg P ha
-1 added
Teagasc P Index 3, or 5-10 kg P ha
-1
added
Teagasc P Index 4, or >10 kg P ha
-1
added
P Application Timing
0.9 See Table 13 See Table 13 See Table 13
S2 Soil P (by Morgan’s test)
0.8 0 – 6 mg P l-1
6.1-10 mg P l-1
>10 mg P l-1
Desorption Risk 1 Low Moderate High
S3 Farmyard Risk 0.8 Good Moderate Poor
T1 Transport Distance
0.75 >500m 200 – 500m 0 – 200m
T2 Connectivity,
See also
Table 14
0.75 Low risk due to Subsurface drainage, or Surface Drainage.
Moderate risk due to Subsurface drainage, or Surface Drainage.
High risk due to Subsurface drainage, or Surface Drainage.
Calculations S1 (Risk of P Loss from P Applications) = P applications x P application timing
S2 (Risk of P Loss due to Soil P Concentration) = Soil Test P x Desorption Risk
mPRS Source Sub-Score = (S1) + (S2) + (S3), where S3 is Farmyard Risk
mPRS Transport Sub-Score = T1 X T2
Site Score = Source Sub-Score X Transport Sub-Score
Soil P levels. Kurz et al. (2005) established that excessive soil test phosphorus (STP) concentrations were
linked to P losses in overland flow from grasslands in Ireland. Sharpley and Rekolainen (1997) found that as
soil P concentrations increase, the potential for soluble phosphorus (SP) transport increases accordingly,
while Sharpley et al., (2001) found that the dissolved P in runoff was strongly correlated to the soil test
phosphorus (STP) if the soils have not received recent additions of fertilizer and/or manure. A direct link
between soil test phosphorus and higher phosphorus concentration in drainage water has also been
demonstrated by Heckrath (1995), who also identified a soil P threshold of 60 mg kg-1
Olsens P for an arable
soil, above which soils tended to release higher levels of phosphorus from soils to land drains. While the use

29
of STP alone as an indicator of phosphorus loss is inadequate, the inclusion of a factor for soil P is an
essential element of the mPRS as excessive soil P levels are a key driver behind P loss from Irish
grasslands to surface waters.
Table 13. Assessment of Risk (i.e. Value) for P Application Factor in mPRS.
P Application Timing Factor Value
P Application Timing Hydrologically Low Risk Soils Hydrologically Moderate Risk Soils
Hydrologically High Risk Soils
App between May 1 and Sept 1 1 1 2
App between Jan 15 and May 1 1 2 4
App at other times 1 4 4
Table 14. Assignment of mPRS T2 Factor Values Relative to Field Drainage.
Drainage System Low risk (1) Medium Risk (2) High Risk (4)
Subsurface Drainage
No Subsurface Drainage
Subsurface Drainage, but no direct link to river channel
Subsurface Drainage with a direct link to river channel
Field Drains No Field Drains Field drains but no direct link to river channel
Field drains present with a direct link to river channel
The “soil P” factor in mPRS is assigned a low, medium or high risk value depending on the Soil P Index (as
determined by Morgan’s P test) based on current Teagasc guidelines for nutrient use. These guidelines
assign a “P Index” to soils based on the concentration of P they contain. Soils with a P Index value of 1 or 2
contain up to 3 or 6 mg P l-1
, respectively, and are categorised as “low risk” with a factor value of 1. Soils
with a P Index value of 3 contain from 6 to 10 mg P l-1
, and are scored with a soil P factor value of “2”. Soils
with soil P Index values in category “4” contain more than 10 mg P l-1
, and are assigned a “high risk” in terms
of the soil P factor and given a value of “4”; such soils contain so much P already that crops would be
unlikely to show response to added P. (However, it is becoming more evident that setting soil P categories
such as these across all soil types may not be accurate and it is recommended that, as soon as soil type
specific guidelines are introduced, these be used as an input to the mPRS.)
P Desorption Risk: Daly and Styles (2005) found that under Irish conditions the soil type should be
considered in all studies where P losses to water are under investigation, as the desorption potential of
different soil types has an impact on the relationship between STP concentrations and the loss of P in runoff
water. The pH of the soil affects the desorption capacity with calcareous soils in particular showing a low
desorption capacity (Daly and Styles, 2005). High levels of organic matter (OM) also result in an elevated
risk of phosphorus loss due to the low desorption capacity of organic (e.g., peaty) soils. However, for
desorption of P to proceed, a source of water is necessary to receive and remove the desorbed P. Thus, in
terms of desorption risk, there is an interaction between intrinsic chemical and hydrologic properties.

30
For the mPRS, soil types depicted on the “general soil map of Ireland” (Gardiner and Radford, 1980) were
classified in terms of “high risk”, “moderate risk” or “low risk” based on their P desorption characteristics as
described by Daly (2000), who developed four desorption classes for Irish soils ranging from a low to a high
desorption rating. Use of this national soil map for assigning desorption risk to discrete sites is not a very
accurate spatially, due to its large scale nature. However, as a problem would also be encountered if using
more detailed county soil maps, since these are only available for a limited number of counties, it was
decided to use a national (though inferior) dataset for the mPRS. (It is hoped that national datasets with a
better resolution and more specific data on soil properties such as P desorption/adsorption will become
available. If this happens, or if a full set of county soil maps are produced, these should be utilised when
determining the P desorption risk of a site.)
Because the soil P and P desorption risk factors interact in generating a risk of P loss due to soil P
concentrations, they are multiplied together to give an overall S2 score for the mPRS (Table 12).
P applications and P application timing: Inappropriate applications of phosphorus to a field can lead to a
risk of P loss from that field, aside from the loss that occurs due to elevated soil P. The former refers to the
loss of P that occurs due to the application of P as inorganic fertilizer or manure to soils for which there is a
risk of P loss because of hydrological factors. The risk posed is a function of:
• The quantity of P added and the form in which it is added;
• The timing of the application of the P relative to plant growth and the hydrological status of the site.
Two factors are used in the mPRS in order to account for these processes: P applications and P
application timing. P applications refer to the quantity of P applied to a field. The approach adopted in the
mPRS categorises the P applications based on whether or not the applications are in excess of that required
in agronomic terms as defined by Teagasc recommendations.
Two methodologies were assessed for calculating the P applications factor for the mPRS. The preferred
methodology is to first calculate whether P applications are in excess of what is necessary for an effective
agronomic response, as defined by Teagasc. Teagasc’s nutrient use guidelines relate P recommendations
to soil P Indices, which in turn are linked to soil test P concentrations, as outlined previously In the mPRS, if
the Teagasc soil P index at the site being assessed is 1 or 2 (indicating a low soil P concentration), the P
application factor is assigned a value of 1. If the soil P Index is “3” then a moderate P application risk is
assumed, and the P application factor is given a value of 2. Finally if the soil P index is 4, it is assumed that
the soil laden with P such that the application of additional P would lead to P losses, a value of “4” is
assigned to the P application factor. This methodology assumes that P applications will conform to Teagasc
advice.
The second methodology assessed for the field scale P application factor followed the methodology used in
the original PRS (Magette, 1998). Risk arising from “P applications” was assigned based on the absolute
quantity of P applied.
The timing of P applications is an important factor in determining whether there is a risk of high P loss due to
the applications of P to a field. This is because the hydrological connectivity of the field, which varies
throughout the year depending on the existing hydrological conditions, will determine whether any loss of P
can occur in response to excess P applications. In the mPRS, sites are classified into “high risk”, “moderate

31
risk” and “low risk” in terms of their “hydrological connectivity”, as described in MCOS (2002) and reproduced
here in Appendix B. This assessment technique requires that soil cores be taken to a depth of 60 cm below
the soil surface and visually inspected for evidence of soil saturation. Evidence would include the presence
of “mottling” within the 60 cm depth, which would suggest a water table at that depth at least for part of the
year. The closer to the soil surface this evidence exists, the higher the “hydrological risk”. Other indicators
in the hydrological risk assessment include the presence of reeds, which indicate the existence of
waterlogging conditions. Once the hydrological risk of an area is determined, then the “P application timing”
risk can be assigned to the site by combining information for the actual timing of P applications and the
hydrological risk category (Table 13).
Because these factors interact in generating a risk of P loss due to the application of P they are multiplied
together to give an overall S1. An alternative combination of the S1 factor was also tested. This was done
by combining the factors by way of addition, i.e., "Soil P applications" + "Soil P application timing" to
generate S1var1. This assessment was undertaken because it is widely accepted that heavy applications of
P during the summer period can lead to significant P losses if followed by heavy rainfall events. However the
multiplicative approach of generating the S1 score would have given a relatively low value as the low P
application timing score would offset the high P application score.
Farmyard Risk: Strictly speaking, farmyard risk cannot be considered a field level factor; however, it is felt
that the inclusion of this factor is important when describing the impact of phosphorus arising from grassland
agriculture on surface water resources in Ireland. A number of major catchment studies in Ireland have
identified farmyards as making important contributions to reduced water quality in catchments dominated by
grassland agriculture (MCOS, 2002; Kirk McClure Morton, 2001). Morgan et al. (2000) indicated that a
farmyard in a small study area in the Dripsey catchment, Co. Cork, supplied 27 % of the P load from the sub-
catchment in question. However it was also noted that there was a considerable temporal variation in the
importance of the farmyard as a source of phosphorus ranging from 5% to 90% of the total load for any one
“rainfall event”, with the farmyard being a relatively more important phosphorus source during the summer
period. The loss of P from farmyards arises due to a number of factors:
• Insufficient slurry/FYM storage.
• Leakage from silage storage facilities
• Poor farmyard management, with particular reference to “dirty yards”
• Insufficient control of dirty water.
In mPRS, farmyards are categorised as either “good”, “moderate” or “poor” in terms of their perceived risk,
based on criteria in the original PRS (Magette, 1998) (Table 4 above). The farmyard factor was not included
in the assessment of the mPRS at “field scale” because the water quality samples collected from these fields
measured direct runoff occurring from the fields, and so no farmyard impact could be assumed. At the sub-
catchment scale results from farmyard surveys undertaken were used to assign a value to this factor. The
farmyard factor data were only available for the Clonmore and Ara catchments and, even in these
catchments, exact farmyard location information was not available. For this reason, the farmyard risk factor
was combined with the “field scale” data by assigning it to all fields within a farm boundary.
2.3.1.2 Description and Justification of mPRS Transport Factors
Distance: Many authors have identified the fact that most of the P exported from agricultural catchments
comes from a small area of the catchment during a few storms each year (e.g., Sharpley et al, 2003).

32
Excessive P loss originates from the areas in the landscape where hydrological activity coincides with high
soil P levels or where high levels of P have been recently applied as fertiliser or manure.
The “distance from surface water” factor is based on the simple (but incomplete) idea that the closer a “P
source” is to a watercourse, the greater the likelihood of P transport from that area to the waterbody. While it
is accepted that this is a relatively crude factor and does not account for variability in the hydrologically active
areas (Variable Source Areas), it is an easily determined parameter, particularly through the use of GIS
technology.
Connectivity accounts for the likelihood of movement of P to a stream through “preferential pathways” such
as surface drainage channels and underground tile drainage. This factor is multiplied by T1 to give an
overall “transport score”. Due to the fact that relevant information was not available for the sub-catchment
scale data, this factor was not used in the analysis. However, the presence of “connectivity” is a very
important factor and the existence of “field drainage” information should be used where available.
When both unfavourable P source and P transport factors occur together, the site so affected is identified as
a critical source area and poses a high risk for contributing P to surface waters. Heathwaite et al. (2000)
highlight the point, however, that if only one of these factors is unfavourable, a reasonable assumption would
be that, while the site has the potential to contribute P, it does not do so. Thus, in the mPRS the transport
factors are multiplied by the source factors in order to determine the overall mPRS score. The use of
multiplication means that in order for a high overall mPRS score to occur, both groups of factors need to
score highly.
2.3.2 Calculation of an mPRS Site Score
The determination of a site “score” using mPRS is accomplished by a combination of adding and multiplying
the various source and transport factors. Specifically:
S1 (Risk of P Loss from P Applications) = P applications x P application timing
S2 (Risk of P Loss due to Soil P Concentration) = Soil Test P x Desorption Risk
mPRS Source Sub-Score = (S1) + (S2) + (S3), where S3 is Farmyard Risk
mPRS Transport Sub-Score = T1 X T2
Site Score = Source Sub-Score X Transport Sub-Score
2.3.3 Assessment of mPRS
Scale is an important issue in relation to P loss and transport as different processes are operational at the
catchment scale than at the plot or field scale (Haygarth et al., 2005). The mPRS was assessed at the field
and catchment scales with two different sets of data. Firstly, the analysis was undertaken using field level
data available with concurrent water quality data. Secondly, multiple-field scale data were combined up to
the sub-catchment scale in order to determine the functionality of the mPRS at this scale and to better
assess its ability to represent the importance of off-site transport processes. The data sets used in the
assessment of mPRS were:
• Field Scale: 11 fields were scored using the mPRS and the resultant mPRS score was then
compared to edge-of-field water quality. Data for this analysis originated from Johnstown Castle
(Kurz, 2000) and Agri-Food and Biosciences Institute at Hillsborough in Northern Ireland (Watson et
al., 2000, 2007).

33
• Sub-catchment scale: Field scale data for a variety of small sub-catchments in the Clonmore and
Ara catchments in south central Ireland (Table 15) were compiled and scored using mPRS and the
scorings compared to water quality data for the most downstream point of each sub-catchment.
These catchments were chosen for analysis due to the fact that all the data needed for factors in
the mPRS were available (Table 16) for a large proportion of the catchment areas.
Table 15. Description of data sources and data available for sub-catchment analysis of mPRS. Catchment Source of Data Number of Sub-
catchments
Factors Available
Clonmore Three Rivers Project
(MCOS, 2002)
8
Ara Three Rivers Project
(MCOS, 2002)
13
Soil P, Runoff Risk, P
application rate, P application
timing, Farmyard Quality,
Distance from Stream
Table 16. Sub-catchments with concurrent water quality and field data used in the catchment-scale analysis of mPRS.
Subcatchment
ID
Availability of
MRP
Concentration
Data
Availability of MRP
Loading Data
Availability of
Concurrent “Field Data”
% of Catchment
Represented by
Available “Field
Data”
Clonmore 1 � � � 45
Clonmore 2 � � � 61
Clonmore 3 � � � 62
Clonmore 4 � � � 72
Clonmore 5 � � � 38
Clonmore 6 � � � 50
Clonmore 7 � � � 60
Clonmore 8 � � � 39
Ara 1* � � � -
Ara 2 � � � 29
Ara 3 � � � 36
Ara 4 � � � 60
Ara 5 � � � 26
Ara 6 � � � 59
Ara 7 � � � 26
Ara 8 � � � 19
Ara 9 � � � 26
Ara 10 � � � 30
Ara 11 � � � 63
Ara 12 � � � 47
Ara 13 � � � 41
* There were not sufficient field data for Ara 1 for analysis.

34
2.3.3.1 Analysis with Field Scale Data Only
To determine whether the mPRS was more effective in assessing P loss and transport risks than the original
PRS developed by Magette (1998), a regression analysis was undertaken to compare the PRS, the field
PRS (as described in Work Package 1, Section 2.2)) and the mPRS. Further analysis also assessed the
weightings in the mPRS. One of the main criticisms of the PRS, and indeed most P indices, is that the
weightings are derived in a subjective manner based on the experience of the developers. In this research,
different weightings for the mPRS factors, S1 and S2, were assessed in order to determine which of the
weightings resulted in the “best fit” between site scores using mPRS and both DRP concentration and DRP
loading. A detailed regression analysis was also undertaken in order to assess the individual mPRS factors,
and to determine which factors were best correlated with the water quality data available.
Assessment of the mPRS with the field scale data available did not allow assessment of the transport factors
in the mPRS, because only edge-of-field water quality data were available and, thus, “distance to the nearest
stream” is not a relevant factor. In addition, it was not believe relevant to reassess hypothetical scenarios as
had been done in Work Package 1 (Section 2.2.). The S3 factor (Farmyard risk) was not assigned a value
because there were no farmyard impacts on these sites. Regression analysis was carried out for the
Johnstown Castle data and the Hillsborough data independently, before the two sets of data were combined.
2.3.3.2 Analysis with Field / Sub-catchment Scale Data
Both the Clonmore and Ara catchments are located in the Suir catchment, primarily in Co. Tipperary, which
is in the south-central part of the Republic of Ireland (approximately 52o30’N). The analysis in this Work
Package was considerably different from that carried out in the Work Package 1 in that field scale data only
were used (i.e., catchment scale factors were excluded) and combined using GIS techniques in order to
determine a single, average mPRS score for each sub-catchment. These scores were then regressed
against measured in-stream water quality data to assess the validity of the mPRS.
2.3.3.2.1 Clonmore Catchment Description
The Clonmore catchment is located at the north eastern edge of the Suir catchment, in Co. Tipperary,
bordering Co. Kilkenny. The catchment occupies an area of 2,807 ha and is drained by two streams: the
Clonmore and the Templetouhy.
The Templetouhy discharges into the Clonmore just upstream of the Clonmore’s confluence with the River
Suir main channel. The Clonmore catchment (including the Templetouhy stream) is located in a rural area,
consisting primarily (74%) of grassland based agriculture. A large proportion of the catchment area is
categorised as semi-natural land use. This area consists primarily of peatland with some woodland. The
north east of the catchment is dominated by peatland, with some of this land used for grazing purposes,
having been reclaimed for agricultural use and forestry. Catchment boundaries and land uses in the
catchment are presented in Figure 4.
Agricultural Practices: The Three Rivers Project (MCOS, 2002) surveyed and developed farm
management plans for 82% of the farms, occupying 86% of the agricultural land, in the catchment. It was
from this survey that field data for assessing the mPRS were obtained.
The average farm in the catchment is 30.32 ha in area with an average stocking rate of 1.82 lu ha-1
.
However, the median area of a farm in the catchment is only 15.06 ha, indicating that there are a large

35
number of small farms (and partial farm areas within catchment), with a small number of large farms. Farms
consisting of holdings dedicated to mixed farming, with a mixture of dairy and drystock grazing covering 55%
of the catchment area. Dairy farms represent only 13% of the agricultural land in the catchment. The dairy
farms within the catchment tend to be larger with higher stocking rates and greater intensity of production
than other farm types in the catchment. A further 27% of the catchment area is occupied by drystock
farming. There are at last 52 farmyards in the catchment, most of which do not have dedicated slurry
storage facilities, relying instead on dung heaps for farmyard manure (FYM) storage. Yet, "manure storage
deficit" (defined as the difference between actual and required manure / slurry storage capacity) is not
considered a problem, due to the generally low intensity of agriculture.
Soils and Soil P: The soils of the Clonmore catchment consist of a mixture of grey brown podzols, gleys,
peats and some complexes with a small area of Rendzina. The grey brown podzols are well drained soils
and are generally suited to agricultural uses and can be highly productive under good management. The
gleys in the catchment are of limited use in terms of agriculture. The peat soils dominate the northeast of the
catchment and are poor soils for agricultural production; however, drainage and reclamation with heavy
nutrient applications can make them somewhat productive. Peat soils, when used for agricultural purposes,
have an elevated risk of phosphorus loss. The Rendzina soil occurs over a very limited area in the north of
the catchment. This soil is associated with rock outcrops, which make it unsuitable for agriculture.
Soil P concentrations (Morgan’s P) are relatively high with 77% of soil samples having soil P values greater
than 6 mg l-1
. This figure masks the fact that there are both a number of areas with low P (11% of samples
<3 mg l-1
) and a considerable area with elevated soil P levels (29% of samples >20mg l-1
). This problem of
high soil P is exacerbated by the fact that the hydrological conditions of the catchments are unfavourable to
P applications during wet periods.
Water quality: Water quality data used in this research were collected (grab samples) from eight sites in the
Clonmore catchment (MCOS, 2002). Results of the monitoring program indicated some water quality
problems, with median MRP values above 0.03 mg l-1
for all but one of the sampling sites in the catchment.
Both of the furthest upstream sites in the Clonmore and Templetouhy sub-catchments had elevated
concentrations of MRP. There is a possibility that these two stations may have be affected by low flow,
particularly during the summer period (MCOS, 2002). The MRP concentrations did not vary widely
throughout the year; however, there were peaks in the median concentration during December and January,
perhaps indicating inappropriate applications of slurry or farmyard manure during the winter period. MRP
loadings for the catchment showed that there was an average discharge of 599 kg P ha-1
yr-1
from the
catchment, with definite peaks during the autumn period.
For the research reported herein, a dataset consisting of exactly one year of data was used (January 2000 to
December 2000). A number of different parameters were measured during the water quality assessment;
however, only Molybdate Reactive Phosphorus (MRP) was used in this research.

36
Figure 4. Clonmore Catchment indicating the location of eight sub-catchments and land uses. 2.3.3.2.2 Ara Catchment
The Ara catchment is located to the west of Tipperary town and occupies an area of 2,806 ha. The
catchment is comprised of two tributaries, which are the Ara and the Shroughnagowneen (Figure 5), draining
13 sub-catchments. The landscape is described as flat to undulating grassland, with an upland area to the
south of the catchment.

37
Agricultural Practices: The catchment comprises of agricultural grasslands covering 99% of the catchment
with forestry and peat bog occupying the remaining 1% of area (Figure 5). The Three Rivers Project
surveyed 67 farms during the project, covering 71.4% of the catchment area. The farms mainly comprise of
mixed en terprises of drystock and dairy (81% of farmers) with a small number of drystock only and dairy
only farms. Manure storage deficit on farms was identified as problematic for the Ara catchment (MCOS,
2002). Although most farms in the catchment did not have a problem, a small number (18% of farms)
(particularly in areas drained by the Shroughnagowneen) were identified as having very significant manure
storage deficits. This problem was exacerbated by the fact that a large number of farmyards in the
catchment were defined as being of “poor” quality, in terms of management of the risk of nutrient losses
(MCOS, 2002).
Figure 5. Ara Catchment indicating the location of eight sub-catchments and land uses.

38
Soils and Soil P: The soils in the Ara catchment are primarily grey brown podzols, which are agriculturally
productive soils under good management. There are some areas of gleys, surrounding the river channel.
Elevated soil P levels were also problematic on a limited area of this catchment (13% of farms > 10mg l-1
Morgan’s P). The majority of the catchment did not have a problem with soil P levels, with 66% of the
farmers in the catchment having low soil P levels that were less than 6mg l-1
Morgan’s P. The favourable
hydrological conditions suggest that diffuse P runoff is not a major problem in this catchment, as 82% of the
catchment was assessed as having low hydrological risk (MCOS, 2002).
Water Quality: Water quality monitoring (by grab sampling) in the Ara catchment commenced in January
2000 (MCOS, 2002) at 13 points in the catchment. The duration over which these monitoring locations were
monitored varied, and a full datset was not available for all of the monitoring locations for the period January
2000 to December 2000. There was a distinct difference between the MRP concentrations found in sub-
catchments drained by the Ara and in those drained by the Shroughnagowneen (sub-catchments 2, 6, 10
and 12, Figure 5. The median MRP concentrations ranged between 0.03 and 0.06 mg l-1
for the Ara sub-
catchments, and between 0.12 and 0.17 mg l-1
for the Shroughnagowneen catchments.
This research reported herein used only those monitoring locations for which MRP concentration data were
available for the full one year period (January 2000 to December 2000, corresponding to the Clonmore
analyses).
2.3.3.3 Data Preparation, Reduction and Analysis
Detailed field level data such as soil P levels, P application rates and other information necessary to assign
values to factors in the mPRS were available as described in Table 15; however, these data were not
complemented with contemporary water quality data for the streams or drains nearest to individual fields.
Rather, water quality data were available only at the outlet of sub-catchments within which fields were
contained. A technique had to be devised to efficiently utilise the data at these two scales.
Data Preparation: A considerable amount of data manipulation was required in order to reduce the large
amount of field level data into inputs for the mPRS. A number of ESRI desktop GIS applications were used
in this project. Most data preparation and analysis was undertaken in ArcGIS 8.2®, while ArcGIS 9.1® and
Arcview 3.1® were also used.
Firstly, data resulting from the Three Rivers Project (MCOS, 2002) in MapInfo© formats had to be converted
to formats compatible with ArcGIS®, and this was accomplished using the FME Suite® software developed
by Safe Software®.
Once all data were in ArcGIS© compatible formats a data preparation process was undertaken for each of
the catchments used in the analysis, whereby each “factor” in the mPRS was represented by a layer in the
desktop GIS.
GIS layers representing each mPRS factor were combined by way of a “spatial join” to form a single layer
representing all the factors. This layer was very detailed, as the spatial joining procedure produced a myriad
of “unique polygons” in which each factor was represented at the sub-field scale. A “cleaning” process was
then applied to all polygons, whereby “slivers” and “overlaps” created during the combining process were
removed. This was carried out using the Arc4 You Poly Clean® software as an extension to Arcview 3.1®.

39
The combined layer for each catchment representing all the mPRS factors was then split into each of the
sub-catchment areas, resulting in 8 sub-catchments for the Clonmore catchment and 13 sub-catchments for
the Ara catchment.
Data Reduction: On completion of the GIS manipulation, the data were imported into MS Excel, where they
were further manipulated to produce a single mean factor score for each of the sub-catchments. Field data
were first used to assign mPRS factor values for individual field areas and then these values were combined
by simple arithmetic averaging within each catchment/sub-catchment area to determine a mean value for
factors in each of the sub-catchments. The mean factor values were then combined, as defined by the
mPRS, resulting in a single mPRS score for each of the sub-catchments.
Data Analysis: Mean sub-catchment mPRS scores were then compared with the water quality data at the
furthest downstream point for each catchment/sub-catchment by way of regression analysis. In Work
Package 1 (Section 2.2), phosphorus concentration alone was used as a representative of the “risk of
phosphorus loss and transport”; in Work Package 2, both molybdate reactive phosphorus (MRP)
concentration and MRP loading were used as the objective measures against which to compare the mPRS
scores.
Unfortunately, not all catchments could be used in the analyses due to a lack of concurrent field and water
quality data. For the Clonmore catchment concurrent MRP concentration data and field data for mPRS were
available for 7 subcatchments (catchments 2 – 8, Figure 4), while for the Ara this situation existed for 8
subcatchments (catchments 3, 4, 5, 7, 8, 9, 10 and 13, Figure 5). Concurrent MRP loading data and field
data for mPRS were available for 7 Ara subcatchments (catchments 4, 6 – 10, 13, Figure 5) and 5 Clonmore
subcatchments (catchments 2 – 4, 7, 8, Figure 4). For each of these subcatchments, mPRS scores (and
individual factor scores) were generated using the field scale data.
During this assessment of the mPRS analyses were performed:
• To determine the effectiveness of the mPRS at determining the risk of P loss, as described above.
• To assess the different mPRS factors via regression analysis with water quality data.
• To vary the mPRS factors, where necessary and re-test, i.e. The S1 factor was altered by
combining the P application factor and the P application time factor by way of addition to give
S1var1.
• To determine the most effective weightings for the factors, using optimisation and testing the new
resultant mPRS.
• To account for “catchment scale” factors that may be influencing the loss of P to catchments.
• To account for the “quality” of data available. This was accomplished on sub-catchments where at
least 30% of the catchment area was accounted for by the available data.
• To assess the impact of scale on P transport from source to receiving waters (i.e., “distance to
receiving waters” in the original Magette PRS). This was undertaken by considering composite
mPRS values generated from fields that were located within 50m and 200m, respectively of the
stream channel.

40
The first step in this process was the creation of a number of “shapefile” “coverages” (i.e. data layers)
corresponding to each source and transport factor in mPRS (Table 12), as described below:
S1 Factor (Risk of P Loss Arising from P Applications)
P application data were available for fields within the Clonmore and Ara catchments. The data in question
were the P application rates (kg ha-1
), P application timing and the hydrological risk data and each of these
datasets was available on a field-by-field basis. An mPRS S1 factor sub-score was assigned to each field
area based on the P application rate (Table 12) and this sub-score was entered into the GIS coverage
representing all the fields in each catchment. The P application timing sub-factor required information on the
timing of the P application and on the hydrological risk. This information was available for each individual
field, and these two pieces of information were assessed in tandem so that a sub-score could be generated
for each field (from Table 13). The two sub-factor scores for each field were then included in the field-by-
field S1 factor GIS layer.
S2 Factor (Risk of P Loss due to Soil P Concentration)
The S2 Factor required data on Soil Test Phosphorus (STP, as Morgan’s P) and on soil P desorption risk.
STP data were available at field scale and were used to generate a sub-score factor using Table 12. The
Desorption Risk sub-score was generated from the county soil survey maps for the catchments in question
based on soil associations; these were not directly available at the field scale.
S3 Factor (Farmyard Risk)
Using Table 4, each farmyard in the catchment was assigned a mPRS S3 Factor score. Unfortunately, exact
farmyard locations are not available (due to privacy regulations), so the S3 Factor scores were assigned to
all fields within the farm boundaries. Thus, all fields within a given farm having a farmyard were assigned the
same mPRS S3 Factor score representing the farmyard risk.
T Factors (Transport Factors)
Regrettably, data with which to assess the connectivity between fields and receiving waters were not
available for either the Clonmore or Ara catchment, and as a result, the T2 factor (Tables 12 and 14) could
not be included in this analysis.
The transport distance factor (T1, Table 12) was generated using the “Buffer” tool in ArcGIS, whereby a
coverage representing the distance from the stream, as prescribed in Table 12, was created.
Linear regression analysis was carried out between the mPRS scores for each subcatchment and both the
annual average MRP concentration and the average annual MRP loading (expressed on a per hectare
basis). As these regressions were being prepared, it became obvious that shortcomings in the original
datasets from which the average mPRS scores were calculated would probably interfere with the
regressions. One of these shortcomings consisted of subcatchments in which the area for which field level
data were available was quite low. The other shortcoming arose from the rather large differences in the
areal extent of several subcatchments. Due to the method of calculation used in this analysis, i.e. the use of
a single “average mPRS” score to represent each subcatchment, the average mPRS score may be similar
for two subcatchments of vastly different scales. It was considered that this scenario could distort the
analyses, with a larger catchment having a greater potential to supply phosphorus than a smaller catchment

41
(with a similar average mRPS score), yet being ranked similarly to the smaller catchment. This issue
highlights the primary difficulty, with using field scale data to represent catchment scale processes.
The following adjustments were made to the average mPRS scores for each subcatchment. Firstly, in an
attempt to remove the inevitable error that would be introduced by “missing data”, subcatchments in which
data were available for less than 30% of the subcatchment area were removed from the analysis. Secondly,
the subcatchment mPRS scores were scaled according to the area of their respective catchments. This
involved simply multiplying each average mPRS score by its respective subcatchment area.
An additional modification was applied to the S1 factor. Results of this analysis (detailed in results section)
suggested that the S1 factor could be calculated by way of addition rather than multiplication (i.e., S1 = P
application rate + P application timing). It is considered that this alternative way of calculating S1 factor
scores could make sense, due to the fact that by multiplying the two sub-factors together (P application rate
and P application timing), there is the possibility that risk arising from the application of high rates of nutrients
during the “low risk “periods may be somewhat underestimated because such a scenario would produce a
low score due to the fact that “application timing” scores low. Although the majority of P applications in
Ireland are believed to occur in the “low risk” or “moderate risk” periods, it was believed to be prudent to test
an alternative means of calculating the S1 factor. The S1 factor calculated by addition was noted as S1var1.
Testing of S1var1 and S1 was undertaken in tandem in order to determine which was better correlated to
water quality data.
Optimisation of mPRS factor weightings and validation of mPRS
In order to determine the most effective weightings for factors in the mPRS an optimisation process was
undertaken using the Solver © Add-on (MS Excel). The optimisation was designed to identify the best set of
factor “weightings”, i.e. those that would generate the lowest possible sum of squares (minimum Σ(MRP-
mPRS)2 ) and, therefore, the best possible correlation between mPRS site scores and measured annual
average in-stream MRP concentrations.
Three different optimisation approaches were examined, as follows:
Optimisation of weightings without any constraints being applied;
Optimisation of weightings with all weightings held greater than 0;
Optimisation of weightings with all weightings constrained between 0 and 1.
The unconstrained optimisation procedure allowed for the generation of negative weightings, which would be
viewed as a failure of the “factor” in terms of data quality. All of the optimisation tests were carried out from a
starting point consisting of the original weightings from the Magette P Index (Magette, 1998). The
optimisation process was undertaken using data from the Ara catchment only.
The optimisation analysis was undertaken on the Ara dataset. (The field scale datasets from Hillsborough
and Johnstown Castle were not included in the optimisation analysis because they did not permit evaluation
of the transport factor in mPRS.) Then, to critically examine the validity of the mPRS complete with
optimised weightings, mPRS scores arising from using the optimised weightings were tested on the
Clonmore catchment data. Linear regression analysis was utilised to evaluate the correlation between
mPRS site scores and in-steam, annual average MRP concentrations.

42
2.4 Work Package 3: Development and Testing of a Nitrogen Ranking Scheme
The aims of this Work Package were to develop a modified Nitrogen Ranking Scheme (mNRS), based on
the N Index conceived by Magette (1998), and to determine the effectiveness of the mNRS by testing it with
field data.
To this end a mNRS was prepared (Tables 17 and 18) based on the following principles:
• The processes of nitrogen losses occurring via overland flow and via leaching are not the same,
and the conditions that result in high losses occurring in overland flow generally result in reduced
nitrogen losses occurring via leaching. The existence of subsurface transport pathways in a field
will result in water with nitrogen moving down through those pathways, rather than in overland flow,
resulting in an increased risk to groundwater, but reduction of the risk to surface water. For this
reason, it was deemed necessary to divide the mNRS into two different sections, one describing the
potential losses to groundwater (via sub-surface flow pathways) and one to surface water (via
overland flow).
• As with the mPRS, it was deemed appropriate for the “source factors” and “transport factors” to be
calculated separately and then combined by multiplication to generate a site score. It was
reasoned that in order for N to be lost, a site must have a high potential for N loss and a high
transport potential. Multiplication of transport factors by source factors means that a high score for
one may be moderated by a low score for the other.
• The “Vulnerability of Aquifer” classification contained within the original NRS (Magette, 1998) is a
very important factor in terms of determining the potential for damage to the groundwater
environment resulting from leaching of N. Unfortunately in Ireland this classification has been
completed only for about half of the country. Thus, it was deemed necessary to develop a
“substitute” measure for the aquifer vulnerability in areas for which a formal aquifer classification
was not available. If subsoil classification data are available for a site in the absence of aquifer
vulnerability data, these data can be used in the mNRS to complete the calculation as outlined in
Tables 17 and 18. Where neither aquifer vulnerability classification nor subsoil data are available
for a site, a hydrological loss classification similar to that used in the mPRS is recommended. (That
methodology is described in detail in Section 2.3.1.1. and is reproduced in Appendix B.)
• A cropping system factor was introduced to the mNRS, due to impact that crops can have in
controlling nitrogen losses. Losses of N to groundwater will be exacerbated by the absence of
crops in a field, so if the land is not planted for periods of the year, it increases the losses of
nitrogen occurring to groundwater from that site, whilst a year round grass covering will
considerably reduce this risk.
• The application of “dirty water” to a field, which has been highlighted as an important source of
nitrogen for leaching by a number of authors (Bartley, 2003; Richards et al., 1998), has been
represented by a factor in the mNRS.
• An important area of ongoing work is the analysis of nitrate losses occurring due to the excretions
from grazing animals. A number of authors (Bartley, 2003; McGeechan and Topp, 2004) have
highlighted the importance of this source of nitrate to leaching, particularly from deposition of urea,
and particularly when these depositions occur in a period when a high risk of leaching exists. A

43
factor to account for this N source has been included in the mNRS and the importance of grazing
has been incorporated.
2.4.1 Description of the mNRS
The mNRS comprises of two tables, one describing the risk of N loss to groundwater (Table 17) and one
describing the risk of N loss to surface water (Table 18). Both tables consist of “source factors” and
“transport factors”, which are combined via multiplication to yield a site score.
Table 17. The mNRS for Assessing the Potential for Nitrate Losses to Groundwater.
Factor Description Nitrogen Loss and / or Transport Risk (Value)
High (4) Moderate (2) Low (1)
A Nutrient Application
Application Rate NA > 1.25 times crop
requirements
≤ 1.25 times crop
requirements
< crop requirements
Application Timing NT Outside growing season During growing season Just prior to growing
season
Dirty Water
Applications DW
Made outside of growing
season
Made during growing
season only
Reduced applications
during growing season
but reduced due to
farmyard management
C Cropping System Arable, or grassland
grazed all year
Grassland grazed during
growing season only
Grassland, no grazing
FY Farmyard Risk Poor farmyard
management
Good farmyard
management
Excellent farmyard
management
AV Aquifer
Vulnerability (where
classification is
available)
High or Extreme Moderate Low
T Transport Pathways
Subsoil Type SS Sand / Gravel Sandy clay Clayey / Silty
Hydrological Risk
(Runoff Risk) HR
Low Moderate High
Preferential Flow Paths
(including subsurface
drains)
Present and functioning Present, but not
functioning well
Not present
Calculations
A = (NA * NT) + DW
(1) If AV is available, mNRS Site Score = (A + C + FY) * AV
(2) If AV is not available, mNRS Site Score = (A + C + FY) * T, where T = SS * PP, or if SS is unavailable T
= HR * PP

44
2.4.1.1 Description of mNRS factors for Groundwater Risk (Table 17)
The nutrient application factor (A) is comprised of three sub-factors. The first two factors, nitrogen
application rate (NA) and nitrogen application timing (NT) are combined by way of multiplication. The third
factor Dirty Water Applications (DW) is added to the product of the NA and NT, as follows:
A = (NA*NT) + DW
When quantitative information is available on the N content of dirty water applications, this quantity of N
should be included in the nutrient application rate factor (NA). The nitrogen application rate describes the
quantity of nitrogen being added to a field as either artificial fertiliser or as slurry. This factor is determined
by assessing the nitrogen added to a field in terms of the crop requirements as determined by Teagasc. The
DW factor accounts for the added impetus given to N leaching by the liquid loading associated with dirty
water applications; thus the impact of this factor can be reduced through the implementation of good
farmyard management practices that minimise the amount of dirty water that must be managed.
Table 18. mNRS for Assessing Potential for Nitrate Losses to Surface Water. Factor Description Nitrogen Loss and / or Transport Risk (Value)
High (4) Moderate (2) Low (1)
A Nutrient Application
Application Rate NA > 1.25 times crop
requirements
≤ 1.25 times crop
requirements
< crop requirements
Application Timing NT Outside growing season During growing season Just prior to growing
season
Dirty Water
Applications DW
Made outside of growing
season
Made during growing
season only
Reduced applications
during growing season
but reduced due to
farmyard management
FY Farmyard Risk Poor farmyard
management
Good farmyard
management
Excellent farmyard
management
T Transport Pathways
Hydrological Risk
(Runoff Risk) HR
High Moderate Low
Preferential Flow Paths
(including subsurface
drains)
Not present Present, but not
functioning well
Present and functioning
Calculations
A = (NA * NT) + DW
mNRS Site Score = (A + FY) * T, where T = HR * PP
Nitrogen applied to soil is easily converted to the mobile form of NO3-N. Thus, applications of N outside of
periods when it will be readily utilised by growing plants increase the potential for loss of N compared to
applications that are timed according to plant needs (Magette, 1998). The timing of nitrogen applications is
critical in terms of reducing the risk of nitrogen loss by leaching. Applications of nitrogen during the winter or
autumn period should be avoided due to the dramatically increased chance of nitrogen losses. This fact is

45
reflected in the mNRS, where applications of N outside the growing season are rated has “high risk”. The
ideal situation is the application of N to a crop “just prior to the crop’s need”, as it reduces the chances of N
leaching.
The Cropping System (C) factor accounts for the presence of a crop cover on a field to reduce the risk of N
loss due to leaching. It also incorporates the impact of grazing of grassland.
The Farmyard Risk (FY) factor is based on the same premise contained within the mPRS and in the PRS
and NRS (Magette, 1998), viz. a poorly managed farmyard will result in a dramatically increased risk of
nutrient loss to water. This is particularly pertinent in the case of nitrates, due to increased risk resulting from
the land-spreading of “dirty water”. A poorly managed farmyard will generally produce more dirty water due
to poor control of runoff water from roofs and other surfaces.
The Aquifer Vulnerability (AV) factor encompasses a variety of soil, vadose zone, and aquifer
characteristics that define the relative susceptibility of groundwater to contamination by land based activities.
The Geological Survey of Ireland has developed a ranking procedure (Anonymous, 1999) to assess and
classify groundwater vulnerability. Where these classifications are available such classifications should be
used in mNRS (Table 17). A similar procedure has been developed to implement the Water Framework
Directive (Working Group on Groundwater, 2005) and could be used to assign a value for the AV factor.
However, in the absence of these classifications, subsoil type (SS) or soil hydrological risk (HR) can be used
to determine the Transport factor (T). SS is reflective of how easily water (and dissolved contaminants such
as nitrate) can move through the soil profile to groundwater. HR reflects the hydrological status of the soil
(as described in Section 2.3.1.1), and is an indirect indicator of how easily water may leach to groundwater.
In such instances SS or HR will be used in association with (multiplied by) the presence of preferential flow
paths sub-factor, which accounts for presence of sub-surface or field drains (PP).
The factors are combined as follows:
mNRS Score = (A + C + FY) * AV
or, when aquifer vulnerability classifications are not available
mNRS Score = (A + C + FY) * T
where T = (SS * PP). In the absence of the subsoil type (SS) sub-factor, then the hydrological risk (HR)
factor is used in the calculation: T = (HR*PP).
2.4.1.2 Description of mNRS Factors for Surface Water Risk (Table 18)
When using mNRS to assess surface water risk, the source factors, Nutrient Application (A) and Farmyard
Risk (FY) are the same as discussed above in Section 2.4.1.1 (and Table 17). However the Transport factor
(T) differs, due to the processes of overland flow, vis-à-vis leaching processes.
The Transport factor for surface water risk (T) comprises of two sub-factors, hydrological risk (HR) and
preferential flow paths (PP). HR reflects the hydrological status of the soil (as described in Section 2.3.1.1),

46
and indicates the likelihood of surface overland flow occurring. PP reflects the connectivity of the field to any
water resources, i.e., the presence of subsurface or field drains, which would result in the rapid movement of
water (and N) towards surface water resources. Both of these sub-factors are included in the mNRS for
Groundwater Risk (Table 17), but importantly the risk ascribed to each factor is reversed when assessing
Surface Water Risk, i.e., a site with a high hydrological risk scores high (4) on the surface water risk (Table
18) but low (1) on the groundwater risk (Table 17).
The factors in Table 18 are combined as follows to yield a site score:
mNRS Score = (A + FY) * T
in which A and FY are calculated as for the mNRS for Groundwater Risk (Table 17).
2.4.2 Site Description
The data used in the assessment of the mNRS arose from Teagasc’s Moorepark Research and
Development Centre (Curtin’s Farm) in Fermoy, Co. Cork. These data were kindly supplied by Dr Pamela
Bartley and were generated in her work leading to a PhD entitled “Nitrate Responses in Groundwater under
Grassland Dairy Agriculture” (Bartley, 2003), under sponsorship by the EPA through the ERTDI research
programme 2000-2006.
2.4.2.1 Curtin’s Farm (Figure 6)
A detailed description of this site is given by Bartley (2003), of which a summary is presented here. The
farm occupies an area of 50 ha, which comprises primarily of a relatively intensive grassland based dairy
farm with an average farm stocking rate of 2.34 LU per ha. The farm is divided into specific areas that are
dedicated to grazing, dirty water application, one-cut silage and two-cut silage.
The farm is located on a plateau, 50 m above sea level and is located near two rivers: the river Funshion,
1.5 km to the northeast, and the river Blackwater, 2 km to the south. The landscape is well drained and
gently undulating, and underlain by limestone, with some higher areas underlain by sandstone. However,
steep inclines characterise the approaches to Curtin’s Farm.
The soil is free draining sandstone till, which forms the subsoil overlying a karstified limestone bedrock
aquifer. The subsoil comprises a mixture of coarse and fine grained material with limestone fragments
tending to dominate, which varies from silty sand with quantities of gravels to angular sandy gravels with
clay. The subsoils are generally very free draining and this fact, combined with the presence of underlying
aquifer, results in a vulnerable groundwater environment. The infiltration rate was measured at one field at
Curtin’s farm and the results showed a high infiltration rate at 250 mm d-1
(Bartley, 2003).

47
Figure 6. Outline and land use characteristics of the Curtin’s Farm (Bartley, 2003). Colours indicate different management zones within fields.
Groundwater flows in a north easterly direction, towards the river Funshion; however localised flows also
occurred within the farm, most notably away from the elevated site surrounding BHC7 (Figure 6).
2.4.3 Testing the mNRS
Testing of the mNRS was only undertaken for the groundwater mNRS , as this was adjudged to be by far the
most important problem in regard to nitrogen loss at Curtin’s Farm.
Groundwater quality data collected by Bartley (2003) from nine boreholes (BHC1 – BHC10 excluding BHC6)
on Curtin’s farm were used to generate average NO3 concentrations for two yearly periods, 2002 and 2003.
Field scale data were available for all 19 fields (1-19) at the farm as were detailed data on nutrient
applications to each field and on the agricultural activity undertaken on each field.. Nitrate quantities applied
as slurry, artificial fertiliser, dirty water and animal depositions were also available for 2002 and 2003. The
timing of all such applications was also available. These data were used to assign values to factors in the
mNRS, as were other data such as subsoil characteristics and aquifer vulnerability. A mNRS score was
generated for each field within the farm (1-19), and these scores were compared to measured borehole
water quality by regression analysis.
Unfortunately, uncertainty arose when trying to relating the mNRS scores to the groundwater quality data
because it was not possible to assess which field or fields might be affecting a specific borehole. This is a
common problem when tracers are not used to identify the source and target of water moving through the
soil profile. To overcome this difficulty, two scenarios, consisting of alternate combinations of field scale
data, were used to generate mPRS scores for each borehole. Scenario (A) assumed that a borehole was
impacted by the field in which it was located. Scenario (B) combined the mNRS scores (by averaging) from
Groundwater Flow Direction

48
the fields which were up-gradient from a borehole, in terms of groundwater flow direction. Table 19
illustrates the manner in which the field mNRS scores were compared to the groundwater quality in the
boreholes.
Table 19. Fields Related to Boreholes Used in Assessing mPRS for Two Scenarios.
Scenarios for Combining mNRS Scores
Borehole No.
A B
BHC1 15 15,16
BHC2 17 17
BHC3 9 9,12,16,18
BHC4 11 9,11,12
BHC5 9 9,10,11
BHC7 12 12,18
BHC8 18 12,18
BHC9 3 2,3
BHC10 5 5,6
2.5 Work Package 4: Development and Testing of a Catchment Scale Screening
Tool
The aim of this work package, which was undertaken during a no-cost extension of the research project, was
to assess factors that might be used in a catchment-scale tool for quickly identifying those catchments that
were likely to have a high propensity for losing P to surface water.
2.5.1 Study Area
This research was conducted using data from two catchments in western Ireland, the Lough Conn catchment
and the Lough Mask catchment.
2.5.1.1 Lough Conn Catchment
The main inflowing rivers to Lough Conn are the Atteyappleton, Addergoole, Castlehill and the Deel rivers
(Figure 7). There is also a considerable flow of water entering Lough Conn from the Keesaun River (not
shown on map), which is a spring fed river. It is considered that the water lost to groundwater from the Deel
river returns to the surface in the Keesaun. Lough Conn is joined to a neighbouring lake (Lough Cullin) by a
short interlake channel. Lough Conn normally drains to Lough Cullin, which in turn drains to the river Moy.
However, in situations where the water levels in the river Moy are higher than those in Lough Cullin,
backflow can result from the Moy into Lough Cullin and subsequently into Lough Conn.
Lough Conn has an area of 52.2km2, a maximum length of 13km and an average depth of 7m. The lake
comprises of two basins. The northern basin occupies 45% of the lake area and is relatively shallow with an
average depth of 4m. The southern basin occupies 65% of the lake area and is deeper than the northern
basin with an average depth of 10m.

49
Topographical Description: The north of the lake is dominated by the Deel catchment, which is flat to
undulating and mainly comprises of agricultural grassland, areas of basin peat and occasional areas of
woodland. The west of the lake is dominated by Nephin Mòr (806m). Further high ground to the south of
Lough Conn stretches along the west coast of the lake as far as the Addergoole where undulating grassland
becomes dominant. On the east of the lake there is a narrow swath of flat to undulating grassland bordered
on the east by the Moy River.
Geology: Most of the Lough Conn catchment lies on Carboniferous limestone bedrock, with the exception
of the upper reaches of the Deel River, which lies on Lower avonian shales and sandstones, carboniferous
slate series and calciferous sandstone series. To the southwest of the catchment the geology becomes
more complex with gneiss and schists being interrupted by areas of quartzite. Bordering the gneiss and
schist areas are bands of old red sandstone and lower avonian shales and sandstone’s running in a north-
easterly direction. The area surrounding Pontoon [not shown on map] is underlain by a granite formation
which surrounds Lough Cullin to the south.
Soils: The soils to the north of the catchment contain the most fertile land consisting of wet podzolic soils
intermingled with areas of basin peat. Further west, blanket peat dominates with the basin of the Deel River
containing alluvial soils. To the west and south-west of the lake the soils are primarily blanket peat with small
patches of wet and dry podzols and some gleys. Iron pan podzols can be found on the slopes of Nephin to
the west.
Figure 7. Location of Lough Conn catchments, major rivers and sampling points (AS: automatic sampling; GS: grab sampling).

50
Land uses: The Lough Conn catchment is principally occupied by agricultural, forestry, and peat harvesting
land uses, with large areas of the western side of the catchment being occupied by “natural” land cover.
There is very little urban development in the catchment; the only “urban” area in the catchment is
Crossmolina (not shown on map) with a population of 1500. Agriculture is dominated by small fragmented
farms. Most agriculture is relatively extensive due to the above factors, and the prominence of poor quality
soil in the catchment. The most intensive agriculture is carried out in the north east of the catchment and is
dominated by cattle grazing. The mountainous west of the catchment is dominated by extensive agriculture,
primarily sheep farming. Forestry in the catchment is mainly confined to these western areas.
2.5.1.2 Lough Mask Catchment
Lough Mask is located in south Co. Mayo. It is contained within the Corrib River catchment, which drains
into Galway bay through Galway City. The Lough Mask sub-catchment contains Lough Carra and Lough
Naffooey along with Lough Mask (Figure 8). The main inflowing streams into Lough Mask are the Robe
River, which flows into the lake on its east side, and the Aile River, which flows into the lake on its north side.
Figure 8. Location of Lough Mask catchments, major rivers and sampling points (AS: automatic sampling; GS: grab sampling).
Water from Lough Mask flows into Lough Corrib via a small lake between Lough Mask and Lough Corrib
called Castle Lake. The water from this lake flows either via underground channels or via Cong Canal to
Lough Corrib. There is a land bridge about 3 km in width separating Lough Corrib from Lough Mask. The
Cong Canal runs through this land bridge. However, the land bridge also contains a number of caves and
potholes. This means that the Cong Canal rarely flows except during times of high water levels, when these
underlying caves are full of water. At other times movement of water is via underground channels. The total

51
area of the Corrib River catchment is 3140 km2 and of this, the Lough Mask catchment comprises 860 km
2.
The area of the lake is 87 km2 leaving a land area of 773 km
2 for the Lough Mask catchment.
Topographical Description: The large eastern area of the catchment, dominated by the river Robe is all
lowland, below 200m. The northern area of the catchment which includes parts of the Aile catchment is also
flat undulating lowland. To the south and west, the topography of the catchment rises to a maximum height
of approximately 700 m.
Geology: Most of Lough Mask is underlain by a large lowland area of carboniferous limestone, which
dominates the east of the catchment. There are also small areas of lower avonian shales in the eastern
lowland part of the catchment. Towards the upland areas in the west of the catchment, avonian shales
become more dominant with a large area of ordovician shales in the west of the catchment. These areas are
intermingled with swaths of rhyolites, shist and gneiss. There is an area of pre cainozoic basalts on the
southern shores of Lough Nafooey.
Soils The west of the catchment is dominated by highland peat. The north western part of the catchment
contains a mixture of blanket peat soils and bouldery complexes. The western area of the catchment shows
a complex mix of Gleys, dry podzols, other soil complexes and areas of blanket peat. Two soil associations
occupy the eastern half of the catchment, well drained brown earths interspersed with areas of basin peat,
and degraded brown podzols with some basin peat.
Land uses: The western part of the catchment, west of Lough Mask, is dominated by unexploited peat-
lands, with areas of agricultural grasslands along the river valleys, particularly along the southern part of the
Aile river. The north western part of the catchment is dominated by peatland intermingled with areas of
agricultural grassland. Towards the east, the land improves to a mostly moderate to good grassland area,
with areas of forestry. There is a large area of heath cover on the eastern shore of the catchment, around
where the river Robe enters the lake. There is very little urban development in the catchment, with
Claremorris and Ballinrobe (not shown on map) being the only urban areas of significance.
2.5.2 Datasets
A number of catchment scale (or larger) datasets were used to examine relationships between the
catchment characteristics and water quality for the Lough Conn and Lough Mask catchments and are
described below.
2.5.2.1 Land Use
Land use data were derived from the CORINE (Co-ORdination of INformation on the Environment) dataset.
This land cover dataset was derived from LANDSAT images taken in 1989-1999 and identifies 44 land cover
types. The dataset was updated in 2000 by the EPA under a programme managed by the European
Environment Agency (EEA). This update included some new higher resolution categorisations for grassland
and wetland areas. For the research reported here, the 44 land cover types were divided into four risk
categories (Table 20) that reflected the presumed likelihood that P would be lost and transported from these
areas; this presumption was based on the intensity of the land use.

52
Table 20. Assigned classes for CORINE land cover dataset.
Code Land Use Description Presumed Risk for
P Loss
Assigned Class
Number
1.1.1 Continuous urban fabric Very high 1
1.1.2 Discontinuous urban fabric Very high 1
1.2.1 Industrial or commercial units Very high !
1.2.2 Road and rail networks, associated lands Very high 1
1.2.3 Port areas Very high 1
1.2.4 Airports Very high 1
1.3.2 Dump sites Very high 1
1.3.3 Construction sites Very high 1
1.3.1 Mineral extraction sites High 2
1.4.1 Green urban areas High 2
1.4.2 Sport and leisure facilities High 2
2.1.1 Non-irrigated arable land High 2
2.1.2 Permanently irrigated arable land High 2
2.3.11 Improved pasture High 2
2.4.1 Annual crops associated with permanent crops High 2
2.3.12 Unimproved pasture Moderate 3
2.3.13 Mixed pastures Moderate 3
2.4.2 Complex cultivation patterns Moderate 3
2.4.3 Land principally used by agriculture with significant
areas of natural vegetation
Low 4
2.4.4 Agri-forestry areas Low 4
3.1.1 Broad leaved forest Low 4
3.1.2 Coniferous forest Low 4
3.1.3 Mixed forest Low 4
3.2.1 Natural grasslands Low 4
3.2.2 Moors and heathland Low 4
3.2.3 Sclerophyllous vegetation Low 4
3.2.4 Transitional woodland / scrub Low 4
3.3.2 Bare rocks Low 4
3.3.3 Sparsely vegetated areas Low 4
3.3.4 Burnt areas Low 4
4.1.1 Inland marshes Low 4
4.1.2.1 Intact bogs Low 4
4.1.2.2 Cutaway bogs Low 4
4.1.2 Peat bogs Low 4
4.2.1 Salt marshes Low 4
4.2.2 Salines Low 4
4.2.3 Intertidal flats Low 4

53
2.5.2.2 Soil Phosphorus Concentration
The soil test phosphorus (STP) dataset used in this study was provided by Teagasc. The dataset gives an
average STP concentration for 10km2 grids across the country, resulting from soil analyses done by Teagasc
of samples submitted from its client base. The STP test used in Ireland is Morgan’s P, and it is the
recognised national testing procedure for soil phosphorus on agricultural land. The STP dataset is divided
into four categories, as shown in Table 21.
2.5.2.3 Phosphorus Desorption
A dataset describing phosphorus desorption potential was generated by combining the soil characterisations
in the General Soil Map of Ireland (Gardiner and Radford, 1980) with soil P desorption categories devised by
Daly (2000). For the research reported here, four desorption categories were used: Des1 – Des4. Des 1
represents soils with a very low P desorption rate, whilst Des 4 represents those soils with a high desorption
rate.
2.5.2.4 Soil Drainage
A soil drainage database was created using the General Map of Ireland (Gardiner and Radford, 1980) to
categorize the soil drainage in the two catchments. Soil drainage was divided into five categories:
excessive drainage, good drainage, moderate drainage, imperfect drainage and poor drainage.
Table 21. Teagasc P indices for Soil Test Phosphorus.
P Index Soil Test P
Morgans P (mg l-1
)
1 0-3
2 3-6
3 6-10
4 >10
2.5.2.5 Water Quality Data
Lough Conn: Weekly monitoring of selected streams feeding Lough Conn began at the end of 1994 and
continued up to the end of 1999. In the research reported herein, data were used from a period of sampling
between January 1995 and December 1999. A grab water sample was taken once weekly from all of the
water quality monitoring sites (described in Table 22 and illustrated in Figure 7). In addition, an automatic
sampler was used at Knockadangan Bridge on the Deel River to collect composite daily samples during the
assessment period. All samples were analysed for Total Phosphorus (TP) using standard methods.
Table 22. Lough Conn catchment sampling locations and schedule of sampling.
Sampling Site Catchment Sampling Frequency
Knockadangan Bridge Deel Daily
Ballyneaty Bridge Slieveclaur Weekly
Rathnamagh Bridge Rathnamagh Weekly
Tooreen Bridge Tooreen Weekly
Castlehill Castlehill Weekly
Addergoole Addergoole Weekly
Attyapleton Attyapleton Weekly

54
Lough Mask: Weekly monitoring of streams feeding Lough Mask commenced in December 1995 and was
continued to the end of 1999. The period considered in this study is that from January 1996 to December
1999. The locations of Lough Mask sampling points are given in Table 23 and illustrated in Figure 8.
The water quality monitoring program consisted of a once weekly “sampling run” in which grab samples were
collected from most of the inflowing streams to Lough Mask. In addition, automatic samplers were located at
a site referred to as “North of Curragh”, which was on the Robe catchment, upstream of where the Robe
River enters Lough Mask (Figure 8) and on the Owenbrin River to the west of Lough Mask. All samples
were analysed for Total P.
2.5.3 Water Quality Determination
While in Work Packages 1and 2 Molybdate Reactive Phosphorus (MRP) was the water quality parameter
against which the performance of the various P risk schemes was compared, Total P was used as the
objective measure in this work package. Total P has been used for water quality assessment in Loughs
Conn and Mask for decades, as it was the key parameter used in the OECD international study of
eutrophication in the 1970s, being used to ensure all parties were measuring P by the same parameter.
Whereas MRP may be a more appropriate measure of P available for use by macrophytes or algae for
rivers, i.e. as a measure of bio-available P, it is considered that due to the very long retention time for P in
lakes, all fractions of P may at some point become available for use by algae or macrophytes.
2.5.4 Data Preparation
As in Work Package 2, due to the spatial nature of the datasets a considerable amount of preparation and
reduction was required in order to organise the data for analysis. The data preparation was primarily
accomplished using MS Excel ®. Arcview 3.1®, and ArcGIS 9.2 ®.
Table 23. Lough Mask catchment sampling locations and schedule of sampling.
Sampling Site Catchment Sampling Frequency
North Of Curragh Robe Daily
Foxhill Bridge Robe Weekly
Christinas Bridge Robe Weekly
Derrycananna Aile Weekly
Claureen Bridge Aile Weekly
Cartron Bower Aile Weekly
Cloon Bridge Cloon (Aile) Weekly
Srah Srah Weekly
Glensaul Glensaul Weekly
Srahnalong Srahnalong Weekly
Finny Finny Weekly
Owenbrin Owenbrin Daily

55
2.5.4.1 Water Quality Data
The data were first collated using MS Excel for the time period used and an average TP concentration was
calculated for the entire sampling period for each sub-catchment, as well as for each year.
Because temporal variability in P movement occurring from agricultural land to water is a very significant
issue, it was also considered necessary to investigate the relationship between the catchment scale factors
and the TP concentrations over different temporal periods. To this end mean TP concentrations were also
calculated for each of three periods within the year:
May 1 – August 30 (summer);
September 1 - January 31 (winter);
February 1 – April 30 (spring).
2.5.4.2 Spatial Dataset Manipulation
A map-based dataset was created in a GIS using the categories devised for each of the factors, as detailed
above. This was accomplished by electronically integrating the general maps for each factor with a table
outlining the categorisation (in Dbf format) using the “join” function in ArcGIS 9.2® to produce mapped
categories for each of the factors. These maps were then electronically “clipped” to give a categorised map
for each factor for each of the 16 sub-catchments. The resultant classification tables for each factor for each
sub-catchment were subsequently imported into MS Excel © in Dbf format, where the areal percentages of
each sub-catchment falling into each category of each factor were calculated.
2.5.4.3 Data Analysis
The areal percentages for each factor (STP, CORINE land cover, soil desorption, soil drainage) in each
catchment were regressed against the in-stream TP concentrations calculated as annual and seasonal
averages, as well as a 5-year average for Lough Conn and 4-year average for Lough Mask. The structure of
the analysis is outlined in Figure 9. This regression analysis was carried out for all the Lough Conn and
Lough Mask catchments together (n=16). The analysis between individual factors and TP concentrations
made it possible to identify those factor characteristics which were correlated with the TP concentration
across the catchments.
To investigate the importance of Critical Source Areas (CSA) in the transfer of P from diffuse agricultural
sources, an analysis was undertaken in which instead of using entire catchment areas to determine the
various factors, only those areas within 100m, 200m and 500m of the main stream channel were used.
These factors were then regressed against the TP concentrations for each catchment as described above.

56
Figure 9. Datasets used for the regression analysis and schematic of electronic overlaying procedure used in GIS for regressions against water quality data (TP concentration).
2.6 Work Package 5: Development of a Farmyard Assessment Procedure The aim of this work package was to develop and validate a farmyard assessment scheme that could
evaluate the “risk” of P and N losses from farmyards to water. Initially, a separate project focused only on P
was intended to be funded for this work (Appendix A, Reference LS 2.1.5-M2). Instead, an analysis without
data collection was included as part of this “field by field” assessment of P and N loss from agricultural
sources.
2.6.1 Conceptualisation of the Problem
As with diffuse pollutant losses from the landscape, pollutant losses from readily identifiable point sources
such as farmyards require a supply of contaminants in a form(s) that can be transported, a transporting
agent, and a transport pathway by which the pollutants can be delivered to ground or surface waters.
For this research, a fundamental assumption was that the “risk” (i.e., the likelihood) of P and N transport from
farmyards to water is directly proportional to the mass of pollutants at the source that are available for
transport, and inversely proportional to the distance between a farmyard and the water resource.
2.6.2 Analysis of Information Sources
As this project was not funded to collect / generate new data, the scientific literature served as a fundamental
resource to guide development of the rating procedure. In addition, an ad hoc expert panel was established
to serve as a technical resource. The panel consisted of four research scientists from Teagasc, one from the
CORINE Land
Use
Soil Desorption
Soil Drainage
Soil Test
Phosphorus
TP Concentration

57
Environmental Protection Agency, one from University College Dublin, and a research / advisory scientist
from ADAS in the UK.
As well, limited access was gained to a survey of farm facilities that was conducted by Teagasc. The survey
was intended to provide a comprehensive description of the farmyards and other aspects of bovine
enterprises that were in place in calendar year 2003. A random sample of 640 farms was selected by
Teagasc to be nationally representative of the over 129,000 specialist dairying, dairying mixed with other
enterprises, suckler and cattle rearing farms. A section of the survey addressed manure management and
other pollution control facilities; all farms were required to complete this section as it records their land base,
land use management, animal number, animal type and animal housing facility, farmyard facilities, manure
management, fertiliser management, general attitudes and indication of required on farm investment. It was
hoped that important relationships about pollution potential might be discovered by an analysis of data
resulting from the survey. The type of questions asked in the survey guided the development of the risk
rating system.
Due to access to the Teagasc farm facilities survey, and sensitivities among the farming community about
farm visits by non-Teagasc personnel, studies of individual farms originally proposed as part of this research
were not conducted. On the other hand, analyses of the importance of farmyards in the performance of a
modified phosphorus ranking scheme (mPRS), which was not foreseen at the time this research was
proposed, was undertaken (Work Package 2, Section 2.3).

58
3 Results
3.1 Initial PRS Evaluation
Results from application of the PRS developed by Magette (1998) to the Johnstown Castle field (Kurz, 2000)
are given in Table 24.
The PRS assessed the P loss and transport risk for all three sites as 'medium'. Final scores were 13.0, 16.8,
and 17.7 for the Warren 1, Warren 2 and Cowlands sites, respectively. The PRS numeric score rank thus
corresponded directly to the rank according of measured edge-of-field P loss over the period of monitoring.
However, the final PRS categorisation of 'medium' P loss risk for all sites indicated that the PRS did not
distinguish between sites, despite the difference in edge-of-field P export rates and STP values. This may
have been due to the mathematical procedure used to translate numerical scores into qualitative risk
descriptions, or to a more serious deficiency in the PRS itself. For example, comparing Warren 1 to Warren
2 results, the PRS scores differed in magnitude by 29% whereas the normalised edge-of-field P losses
differed by 22%. However, comparing Warren 2 to Cowlands results, the percentage differences in PRS
scores and normalised P loss were 5% and 452%.
Table 24. Phosphorus ranking scheme (Magette, 1998) applied to Johnstown Castle field sites (Kurz, 2000).
Factor Value: Low = 1;, Medium = 2; High =4 Catchment or Field Factor
Weight for Factor Warren 1 Warren 2 Cowlands
P usage in catchment
0.5 4 4 4
Condition of receiving waters
0.5 1 1 1
Ratio of land to water
0.75 2 2 2
Farmyard conditions
0.8 (0 if no animals)
1 1 1
P usage rate 1.0 1 4 4 P application time
0.9 1 1 1
Soil test P (based on Morgan’s test)
0.8 1 2 4
Overland flow distance
0.75 2 2 1
Runoff risk 1.0 4 4 4
13.0 16.8 17.7 MEDIUM MEDIUM MEDIUM
Final Score*
Qualitative Risk Assignment**
Measured Field P Loss***
778 g ha-1
(16-months)
300 g ha-1
(5-months)
5,300 g ha-1
(16-months)
Normalised P Loss (g ha-1
mo-1
)
49 60 331
*Final score equals the sum of all (factor risk * factor weight) (Magette, 1998).
**Final Rank was categorised as high, medium, or low based on the procedure used in Magette (1998).
***From Kurz (2000).
Results from the PRS applied to the three fields under various scenarios are detailed in Table 25. The
Warren 1 site scored a final rank and risk category of 'low' only for the 'best case' scenario. The Warren 2
field was categorised as 'medium' risk for P loss even under the 'best case' (with respect to transport and
catchment factors) scenario. The only scenario for which the Cowlands site was categorised as 'high' risk for
P loss was the 'worst case' (with respect to P transport and catchment factors) scenario. The PRS ranked

59
this site in the overall 'medium' risk category for actual field conditions (i.e., 'low' risk associated with
overland flow distance).
Table 25. Final scores and assigned risk definition from PRS (Magette, 1998) applied to Johnstown Castle field sites (Kurz, (2000) under various scenarios.
PRS Scores and Assigned Risk Definition Scenario
Warren 1 Warren 2 Cowlands
Magette PRS with all factors assigned risk based on as-is risk
* 13.0 MEDIUM
16.8 MEDIUM
17.7 MEDIUM
Best Case: 'low' risk for all factors except as-is risk for edge-of-field related factors
10.0 LOW
13.8 MEDIUM
15.4 MEDIUM
Worst Case: 'high' risk for all factors except as-is risk for edge-of-field related factors
19.9 MEDIUM
23.7 HIGH
25.3 HIGH
'Low' overland flow distance risk, all other factors as-is
12.3 MEDIUM
16.1 MEDIUM
17.7 MEDIUM
'Medium' overland flow distance risk, all other factors as-is
13.0 MEDIUM
16.8 MEDIUM
18.4 MEDIUM
'High' overland flow distance risk, all other factors as-is
14.5 MEDIUM
18.3 MEDIUM
19.9 MEDIUM
*’As-is risk’ refers to risk assigned by the Magette PRS to the fields according to actual measured field characteristics. Based on the evaluation of the PRS on the three fields under actual conditions and with various hypothetical
scenarios, the PRS scores did not distinguish between sites with low measured P loss (Warren 1) and high
measured loss (Cowlands). The main reasons for this apparent inability of the PRS to classify the fields
correctly are as follows:
• Four of the nine factors in the PRS (catchment P usage rate, condition of receiving waters, ratio of
land to water and farmyard conditions) were assigned the same values for all three fields. Due to
their relatively large contribution to the final PRS score, these factors masked differences in factors
such as STP and field P usage;
• The risk assigned for both the P application time and rate factors to a field that receives no P
additions was the same value ('low') as for a field that receives 0-5 kg P ha-1
applied in the spring or
just prior to crop needs;
• Lack of data precluded the full application of the PRS.
3.2 Edge-of Field (FFO PRS) PRS Factor Evaluation.
The results from the assessment using only the edge of field factors from the PRS (Magette, 1998) showed
more promise in differentiating between sites based on edge-of-field P losses, with the final scores for the
Warren 1, Warren 2 and Cowlands fields being 6.7, 10.5, and 12.1, respectively (Table 26). The Cowlands
site, with high P losses, was ranked as 'high' risk for P loss. Both the Warren 1 and Warren 2 sites were
ranked 'medium' risk. As with the original PRS, the FFO PRS does not distinguish between situations where
no P is applied and where P is applied at the recommended time, requiring a 'low' P application time risk for
both scenarios. Thus, P usage rate for the Warren 1 site constitutes 15% of the final score even though no
P was applied to this site.

60
Table 26. FFO PRS (based on Magette, 1998) applied to the Kurz (2000) field sites.
Factor Risk: Low = 1;, Medium = 2; High =4 Catchment or
Field Factor
Weight for
Factor Warren 1 Warren 2 Cowlands
P usage rate 1.0 1 4 4
P application
time
0.9 1 1 1
Soil test P
(based on
Morgan’s test)
0.8 1 2 4
Runoff risk 1.0 4 4 4
6.7 10.5 12.1
MEDIUM MEDIUM HIGH
Final Score*
Final Rank**
Measured Field P Loss***
778 g ha_1
(16-months)
300 g ha_1
(5-months)
5,300 g ha_1
(16-months)
Normalised P Loss (g ha-1
mo-1
)
49 60 331
*Final score equals the sum of all (factor risk * factor weight) (Magette, 1998).
**Final Rank was categorised as high, medium, or low based on the procedure used in Magette (1998) and
are categorised as follows: <5.5 = ‘low’, 5.5-11.1 = ‘medium’ and >11.1 = ‘high’ risk of P loss from the site.
***From Kurz (2000).
3.3 Evaluation of the FFO PRS While Varying Factor Weights
As described in Section 2.2.1.3, factor weightings were systematically varied to explore their influence on the
FFO PRS site score. The relative contribution of each factor, depending on its assumed weighting, is shown
in Figure 9. From this figure, it is evident that, assuming “pure scores” (e.g., assignment of the same risk for
all factors), the relationship between factor weight and percent of the total score contributed by each factor is
a non-linear, convex function. This relationship increases at a decreasing rate due to the fact that as the
varied factor weight becomes large, the sum of the factors with constant weighting becomes relatively
insignificant. It was also noted that by using ‘pure scores’, the percent of the total score represented by the
values of the factor resulting from different weightings remained constant for all risk levels. For example, if
the weighting of the runoff risk factor is 0.5, the individual scores for this factor constitute 15% of the total
score for low, medium, and high risk fields. This relationship would not be observed in most fields, where
individual factor risks vary.
The effect of varying individual edge-of-field factor weights on the overall P loss risk categorisation for the
Kurz (2000) fields is shown in Table 27. As with the ‘pure score’ analysis, individual factor weights were
varied from 0 to 4, while the other weights were held constant at values given in the PRS (Magette, 1998).
Results indicated that the PRS was relatively robust with respect to variations in edge-of-field factor weights
such that there was a range of values for an individual factor weight that correctly assessed the risk level of
the three fields. All factor weights assigned in the original PRS (Magette, 1998) fall within this range. It is
possible that data from a greater number of field sites would refine the weightings used. However, from this
analysis, there is no evidence to suggest that the edge-of-field factor weights assigned in the original PRS
(Magette, 1998) should be changed.

61
Figure 9. The effect of varying individual factor weight on the percentage that the value of a factor contributes to the value of the final risk score. Individual factors weights were varied while those of the remaining three were as designated in the PRS (Magette, 1998) (“Pure Score” analysis).
Table 27. Final risk assessment categorisation (FFO PRS) results for the Kurz (2000) fields when one individual factor weight is varied from 0 to 4 while the others are held constant.
Site (monitoring period)
STP Weight Variation
P Usage Weight Variation
Application Time Weight Variation
Runoff Risk Weight Variation
Warren 1 (5-month)
LOW (all values)
0.55 = MEDIUM > 0.55 = LOW
<0.45 = MEDIUM 0.45 = LOW
< 1.3 = LOW 1.3 = MEDIUM
Warren 2 (5-month)
MEDIUM (all values)
MEDIUM (all values)
<0.35 = HIGH 0.35 = MEDIUM
< 2.5 = MEDIUM 2.5 = HIGH
Cowlands (5-month)
HIGH (all values)
< 0.5 = MEDIUM 0.5 = HIGH
<1.35 = HIGH 1.35 = MEDIUM
< 0.1 = MEDIUM 0.1 = HIGH
Warren 1 (16-month)
LOW (all values)
0.55 = MEDIUM > 0.55 = LOW
< 0.45 = MEDIUM
0.45 = LOW
< 1.3 = LOW 1.3 = MEDIUM
Cowlands (16-month)
< 0.2 = MEDIUM
> 0.2 = HIGH
< 0.1 = MEDIUM 0.1 = HIGH
<1.25 = HIGH 1.25 = MEDIUM
< 0.35 = MEDIUM
0.35 = HIGH
Acceptable Range
* 0.2 0.55 ≥ 0.45 and <1.25 ≥ 0.35 and < 1.3
Current Weight**
0.8 1.0 0.9 1.0
*’Acceptable range’ is based on values for which Warren 1 ranks as ‘LOW’, Warren 2 as ‘MEDIUM’ and Cowlands as “HIGH’ for edge-of-field P loss risk categorisation as assessed by the Field Factor Only (FFO) PRS. **Weightings used in the PRS (Magette, 1998).
The factor weight assessment also highlighted a nuance in the way final numerical scores are translated to
qualitative descriptions of risk in the PRS. As suggested by Magette (1998), the range in “pure scores” (i.e.,
site scores resulting from sequentially assigning low, medium and high scores for all factors) for any
combination of factor weight X factor score matrix should be divided equally into thirds, each of which is
assigned one of the qualitative terms “low”, “medium” or “high”. Thus, a different factor weighting
0
10
20
30
40
50
60
70
0 0.5 1 1.5 2 2.5 3 3.5 4 4.5
Individual Factor Weight
Soil Test P P Usage Rate P Application Time Runoff Risk

62
assignment results in a new “range” of pure scores. This creates the possibility of designating the same site
with two different risk ranks, solely on the basis of the distribution of factor weightings used, as illustrated by
a comparison of results in Tables 26 and 27, and seemingly incongruous relationships between factor scores
and site risk, as illustrated in Table 27.
3.4 Assessment of Field PRS
Results from applying Field PRS to the Kurz (2000) fields are given in Table 28. Both the Cowlands and
Warren 2 fields were categorised as 'medium' risk, while the Warren 1 field was 'low' risk for P loss.
Table 28. Field PRS applied to Kurz's (2000) field sites.
Factor Risk: Low = 1;, Medium = 2; High =4 Catchment or Field Factor
Weight for Factor Warren 1 Warren 2 Cowlands
P usage rate*
1.0 (0 if no P applied)
1 (with 0 weight as no P applied)
4 4
P application*
time 0.9
(0 if no P applied)
1 (with 0 weight as no P applied)
1 1
Soil test P (based on Morgan’s test)
0.8 1 2 4
Runoff risk 1.0 4 4 4 Overland flow distance
0.75 1 1 1
Condition of receiving waters
0.5 1 1 1
6.05 11.75 13.35 LOW MEDIUM MEDIUM
Final Score*
Final Rank**
Measured Field P Loss***
778 g ha_1
(16-months)
300 g ha_1
(5-months)
5,300 g ha_1
(16-months)
Normalised P Loss (g ha-1
mo-1
) 49 60 331 *Final score equals the sum of all (factor risk * factor weight) (Magette, 1998).
**Final Rank was categorised as high, medium, or low based on the procedure used in Magette (1998). Final
risk values are: <7.4 = ‘low’, 7.4-14.9 = ‘medium’ and >14.9 = ‘high’ risk of P loss from the site. ***
From Kurz (2000).
In order to assess the impact of the modified overland flow distance factor, further testing was carried out
whereby hypothetical ‘high’ risk scores were assigned to the 'overland flow distance' factor. The results of
this analysis are given in Table 29. The Field PRS categorised the Cowlands field as 'high' risk for P loss
under scenarios of 'high' risk associated with overland flow distance. The Warren 1 site was ranked as 'low'
risk for P loss if the overland flow distance factor was ‘low’ or ‘medium’, but ‘medium’ risk for P loss if the
overland flow distance factor was ‘high’ risk. The Warren 2 site was ranked as 'medium' risk under all three
overland flow distance scenarios.
Table 28. Final risk scores and categorisations from the Field PRS applied to Kurz's (2000) field sites under various hypothetical overland flow distance risk scenarios. Overland Flow Distance Risk
Warren 1 Warren 2 Cowlands
LOW* 6.05 LOW
11.75 MEDIUM
13.35 MEDIUM
MEDIUM 6.8 LOW
12.5 MEDIUM
14.1 MEDIUM
HIGH 8.3 MEDIUM
14.0 MEDIUM
15.6 HIGH
*This was judged to be the actual overland flow distance risk for all three field sites.

63
A similar evaluation of Field PRS was conducted in which the overland flow weighting was systematically
altered. Results (Table 30) indicate that overland flow factor weights of 0.75 (as assigned in the original
PRS) and 0.8 resulted in appropriately categorising the Warren 1 and Warren 2 sites under hypothesised low
and medium overland flow risk conditions, but underestimated the risk of the Cowlands site except under
hypothesised high risk overland flow conditions. Weightings of 0.9, 1.0 and 1.1 categorised the Warren 2
site as 'high' risk and the Warren 1 site as 'medium' risk under hypothesised ‘high’ overland flow distance
risks, whereas these weightings correctly assigned a 'high' risk to the Cowlands site under medium and high
hypothesised overland flow distance risk scenarios.
Table 30. Final rank scores and qualitative rating from the Field PRS applied to Kurz's (2000) field sites for various hypothesised overland flow risks and using various overland flow distance factor weights.
Overland Flow Factor Weight Hypothe-sised Overland Flow Risk
Field ID
0.75* 0.8 0.9 1.0 1.1
Low Warren 1 6.55 LOW
6.6 LOW
6.7 LOW
6.8 LOW
6.9 LOW
Warren 2 12.25 MEDIUM
12.3 MEDIUM
12.4 MEDIUM
12.5 MEDIUM
12.6 MEDIUM
Cowlands 13.85 MEDIUM
13.9 MEDIUM
14.0 MEDIUM
14.1 MEDIUM
14.2 MEDIUM
Medium Warren 1 7.3 LOW
7.4 LOW
7.6 MEDIUM
7.8 MEDIUM
8.0 MEDIUM
Warren 2 13.00 MEDIUM
13.1 MEDIUM
13.3 MEDIUM
13.5 MEDIUM
13.7 MEDIUM
Cowlands 14.6 MEDIUM
14.7 MEDIUM
14.9 HIGH
15.1 HIGH
15.3 HIGH
High Warren 1 8.8 MEDIUM
9 MEDIUM
9.4 MEDIUM
9.8 MEDIUM
10.2 MEDIUM
Warren 2 14.5 MEDIUM
14.7 MEDIUM
15.1 HIGH
15.5 HIGH
15.9 HIGH
Cowlands 16.1 HIGH
16.3 HIGH
16.7 HIGH
17.1 HIGH
17.5 HIGH
*This weighting was assigned in the original PRS (Magette, 1998), and previously shown in Table 3.
3.5 Assessment of PRS (Magette, 1998) using Catchment Scale Data
Overall PRS scores and corresponding water quality are given in Table 31. Figure 10 illustrates the
relationship between PRS rank scores and in-stream median MRP.
Of the 31 catchments analysed, 2 ranked ‘high’, none ranked low, and 29 ranked ‘medium’ for overall risk.
Average median MRP for ‘high’ and ‘medium’ risk subcatchments were 66 and 39 µg L-1
, respectively. Both
catchments in the 'high' risk categorisation had correspondingly unacceptable in-stream median MPR
concentrations according to the MRP criterion of Bowman et al. (1996). For the ‘medium’ risk catchments,
45% of the corresponding water quality rankings were unacceptable, while 55% were acceptable.
Because most of the catchments were qualitatively categorised as ‘medium’ risk for P loss, comparisons
between catchments with respect to P loss risk are best illustrated by comparing total numerical scores. If
the numerical scores of the ‘medium’ risk categorisations are divided into three categories according to
numerical rank from highest to lowest, 70% of the top 10, 64% of the middle 11, and 10% of the lowest 10
had unacceptable in-stream median MRP values. This demonstrates a clear trend with respect to PRS

64
numerical rank and median in-stream MRP concentrations. Results from the Spearman's Rank correlation
analysis indicated a significant and positive monotonic relationship between PRS rank value and in-stream
median MRP (R = 0.52, P < 0.05).
Table 31. Summary of final PRS catchment rank orders and risk categorisations as compared to median MRP concentration and water quality rating.
Subcatchment or Catchment
Magette PRS Total
Numerical Score
Magette PRS Risk
Categorisation*
Measured Water Quality Median MRP
(µg L-1
)
Water Quality Rating
**
Dripsey – D2 22.9 HIGH 91 Unacceptable Annesbrook 22.6 HIGH 40 Unacceptable Dripsey-D1 20.5 MEDIUM 26 Acceptable
Beef Unit 19.8 MEDIUM 50 Unacceptable Clonmore 19.6 MEDIUM 56 Unacceptable
Lossetkillew 19.2 MEDIUM 58 Unacceptable Dawn 18.9 MEDIUM 18 Acceptable Omard 18.5 MEDIUM 68 Unacceptable
Clonshanbo 18.1 MEDIUM 18 Acceptable Ballyheelan 17.3 MEDIUM 35 Unacceptable
Yellow-D 17.2 MEDIUM 50 Unacceptable Yellow-K 17.2 MEDIUM 40 Unacceptable
Yellow-G 16.7 MEDIUM 30 Acceptable Yellow-H 16.7 MEDIUM 50 Unacceptable Ara 16.3 MEDIUM 60 Unacceptable
Yellow-B 16.2 MEDIUM 130 Unacceptable Bellsgrove 16.2 MEDIUM 35 Unacceptable
Dairy Farm 15.3 MEDIUM 50 Unacceptable Yellow-A 15.2 MEDIUM 30 Acceptable Yellow-L 15.2 MEDIUM 30 Acceptable
Yellow-I 15.2 MEDIUM 30 Acceptable Yellow-C 14.7 MEDIUM 60 Unacceptable
Yellow (entire) 14.5 MEDIUM 30 Acceptable Yellow-E 14.2 MEDIUM 10 Acceptable Yellow-M 14.0 MEDIUM 20 Acceptable
Clarianna 14.0 MEDIUM 16 Acceptable Yellow-F 13.2 MEDIUM 30 Acceptable
Drumnavrick 13.0 MEDIUM 18 Acceptable Ballina 12.7 MEDIUM 29 Acceptable
Grange Rahara 11.0 MEDIUM 5 Acceptable The Cottage 10.7 MEDIUM 29 Acceptable * Interpretation of the final scores is as follows: <10.5 = low risk, 10.5-21.0 = medium risk, and >21.0 = high risk. N.B. These score ranges are different than presented in Table 5; see Section 3.3 for explanation. **Water quality rating was determined by median MRP levels as suggested by Bowman et al. (1996) who stated that streams with median MRP levels > 30 µg L
-1 show symptoms of eutrophication.
Evaluation of the results from the 31 catchments highlights both strengths and limitations of the PRS.
Overall for the 31 catchments, the PRS rank score was positively correlated with in-stream median MRP,
despite several anomalous catchments where the final rank score was not closely correlated with in-stream
P. There are a number of possible reasons for the anomalies with respect to PRS rank and in-stream
median MRP.
• The use of only one parameter (such as median MRP) as the benchmark against which to compare
PRS performance may be inadequate. For example, P loading may have been a better measure of
the P losses from the landscape as hydrological differences between streams can cause major
anomalies between the actual P loadings carried in a stream, even though the MRP concentrations
in the streams may be very similar.

65
• The water quality rank used in this analysis of the PRS was based on discharge median MRP and
did not account for inflow P. Water quality in “downstream” catchments is most certainly impacted
by inflow water quality, but this influence could not be accommodated in the PRS.
• The PRS does not account for point source phosphorus loading (with the exception of that arising
from farmyards). Although the catchments were rural and primarily agricultural, there could have
been P contributions from “point” sources such as failing onsite wastewater treatment systems.
• Another problem observed in evaluating the PRS at the catchment scale was related to the P
application timing factor. Except for the Dripsey catchments in Co. Cork, and the Beef Unit and
Dairy Farm catchments at Johnstown Castle in Co. Wexford, information by which to assess the P
application timing factor was not available. Thus, assumptions had to be made to assign scores for
this factor in most of the catchments examined.
• Also, the relative lack of synchronous land use and water quality data (i.e., water quality data
collected simultaneously to when significant land management operations, such as slurry and
fertiliser spreading, were occurring) prevented a more comprehensive evaluation of PRS over a
wider geographic area.
0
20
40
60
80
100
120
140
5 10 15 20 25 30
Magette PRS Rank Value
Figure 10. Magette PRS rank value compared to in-stream median molybdate reactive phosphorus
(MRP) in µµµµg L-1
.
3.6 Assessment of Catchment PRS
Catchment PRS rank score, risk category, corresponding water quality and water quality rating are given in
Table 32. Of the 31 catchments analysed, 3 ranked ‘high’, 2 ranked ‘low’ and 26 ranked ‘medium’, for overall
risk of P loss. Average median MRP for ‘high’, ‘medium’ and ‘low’ risk subcatchments were 60, 40 and 17 µg
L-1
, respectively. All corresponding water quality ratings for ‘high’ and ‘low’ risk subcatchments were
‘unacceptable’ and ‘acceptable’, respectively.

66
For the ‘medium’ risk catchments, 46% of the corresponding water quality rankings were ‘unacceptable’, and
54% were ‘acceptable’. As with the PRS, most of the catchments were categorised as ‘medium’ overall P
risk, hence comparisons between these ‘medium’ risk catchments are best illustrated by the overall rank
score. Dividing the ‘medium’ risk category catchments into three classes based on their rank order (highest
9, middle 8, and lowest 9), 89% of the top 9, 75% of the middle 8, and 44% of the lowest 9 had
'unacceptable' in-stream median MRP values. Correlation analysis concluded that there was a significant
positive correlation between the Catchment PRS and median MRP (r = 0.51, P <0.05). Spearman's Rank
correlation also indicated a positive relationship between Catchment PRS rank order and in-stream median
MRP (R = 0.61, P < 0.05).
Table 32. Summary of final Catchment PRS rank orders and risk categorisations as compared to median in-stream MRP and water quality rating.
Subcatchment or Catchment
Catchment PRS Total Numerical
Score
Catchment PRS Risk
Categorisation*
Measured Water Quality Median MRP
(µg L-1
)
Water Quality Rating**
Dripsey – D2 15.8 HIGH 91 Unacceptable Annesbrook 15.5 HIGH 40 Unacceptable
Beef Unit 15.4 HIGH 50 Unacceptable Lossetkillew 13.9 MEDIUM 58 Unacceptable
Dripsey-D1 13.4 MEDIUM 26 Acceptable Omard 13.2 MEDIUM 68 Unacceptable Clonmore 12.0 MEDIUM 56 Unacceptable
Ballyheelan 12.0 MEDIUM 35 Unacceptable Bellsgrove 11.9 MEDIUM 35 Unacceptable
Yellow-K 11.9 MEDIUM 40 Unacceptable Yellow-B 11.9 MEDIUM 130 Unacceptable Yellow-D 11.9 MEDIUM 50 Unacceptable
Dawn 11.8 MEDIUM 18 Acceptable Yellow-G 11.4 MEDIUM 30 Acceptable
Yellow-H 11.4 MEDIUM 50 Unacceptable Dairy Farm 10.9 MEDIUM 50 Unacceptable Clonshanbo 10.2 MEDIUM 18 Acceptable
Yellow-A 9.9 MEDIUM 30 Acceptable Yellow-L 9.9 MEDIUM 30 Acceptable
Yellow-I 9.9 MEDIUM 30 Acceptable Yellow-C 9.4 MEDIUM 60 Unacceptable
Ara 9.2 MEDIUM 60 Unacceptable Yellow-F 8.9 MEDIUM 30 Acceptable Yellow-E 8.9 MEDIUM 10 Acceptable
Drumnavrick 8.7 MEDIUM 18 Acceptable Clarianna 8.7 MEDIUM 16 Acceptable
Yellow-M 8.7 MEDIUM 20 Acceptable Yellow (entire) 8.4 MEDIUM 30 Acceptable Ballina 7.9 MEDIUM 29 Acceptable
Grange Rahara 6.7 LOW 5 Acceptable The Cottage 6.4 LOW 29 Acceptable
*Catchment PRS risk categorization was based on the following delineations: <7.3 = ‘low’, 7.3-14.6 = ‘medium’, and >14.6 = ‘high’ overall risk of P loss from the catchment. N.B. These scores are different than presented in Table 5; see Section 3.3 for explanation. **Water quality rating was determined by median MRP levels as suggested by Bowman et al. (1996) who stated that streams with median MRP levels > 30 µg L
-1 show symptoms of eutrophication.
Results indicated that the performance of Catchment PRS was similar to that of the PRS with respect to both
predictive capability and limitations. The use of a single parameter (median MRP concentration) for ranking
of P status in streams, as well as basing this rank on outflow water quality irrespective of inflow water quality,
limited the precision of the comparisons between assessed P loss risk and measured in-stream water

67
quality, as discussed in the Section 3.5. The relative lack of synchronous land use and water quality data
prevented a more comprehensive evaluation of both PRS and Catchment PRS over a wider geographic
area. As in the catchment scale analysis of PRS, it is possible that an unidentified point source resulted in
an inaccurate Catchment PRS rank for some catchments.
3.7 Assessment of mPRS with Field / Plot Scale Data
Data from eight fields were used for this analysis, viz. from three fields at Johnstown Castle (Kurz, 2000) and
five fields at the Agri-food and Biosciences Institute at Hillsborough in Northern Ireland (Watson, 2007).
These datasets allowed analysis of two of the three “source factors” of the mPRS (S3, Farmyard Risk, could
not be assessed), but neither of the transport factors. So, for this assessment the mPRS used is described
as a “partial mPRS”.
3.7.1 Analysis of Greenmount Data
Table 33 displays measured edge-of-field water quality at the 5 Hillsborough plots. These data were the
“benchmarks” against which the partial mPRS scores were compared.
The linear regression of partial mPRS scores against the mean MRP concentrations in runoff from the five
plots was highly significant (R2=0.90, p=0.013, n=5) as shown in Figure 11. Note that figures portraying
regression results include both the 95% “confidence interval” and the 95% “prediction interval”. (The
confidence interval defines the space in which the resulting regression line will reside with the stated level of
confidence; the prediction interval defines the space in which the stated percentage of data points would be
expected to reside.) There was also a similarly strong relationship (not shown) between MRP loads and
partial mPRS scores.
Table 33. “Edge-of-field “ water quality from Hillsborough sites (Watson, 2007).
Parameter Green-
mount 1 Green-
mount 3 Green-
mount 4 Green-
mount 5 Green-
mount 6
Mean DRP in runoff, mg l-1
0.536 0.463 0.287 0.341 2.383
Annual Load DRP in runoff, kg ha-1
yr-1
0.098 0.085 0.053 0.062 0.436
Mean TP in runoff mg l-1
0.936 0.836 0.507 0.623 2.905
Annual Load TP in runoff 0.171 0.153 0.093 0.114 0.532
The regression was even more impressive when total phosphorus (TP) concentration was regressed against
the partial mPRS (R2=0.93, p=0.008), as shown in Figure 12. For TP loading in runoff water v partial mPRS
the regression was also very good (R2=0.93, p=0.025), indicating that the partial mPRS can effectively
estimate the risk of P loss occurring from these plots (as defined by the measured edge-of-field water
quality).
However, it is important to note that for a number of factors within the partial mPRS there was no difference
in value between the different fields, i.e. each of the fields had the same “runoff risk” as they are all
categorised as the same soil type. Thus, whilst this testing showed the partial mPRS to be a promising
means of assessing sites for their potential to loss P, further testing would be desirable on a range of
different sites that have much more variability in their inherent physical and chemical characteristics.

68
Figure 11. Regression of mean DRP concentration (mg l
-1) in runoff v partial mPRS scores for
Hillsborough sites (n=5) (95% Confidence Interval, 95% Prediction Interval).
Figure 12. Regression of Mean TP concentration in runoff (mg l
-1) v mPRS scores for Hillsborough
sites (n=5) (95% Confidence Interval, 95% Prediction Interval).
Categorisation of the partial mPRS scores into qualitative risks of “low”, “medium” and “high” was made by
simply separating the range of scores for the datasets into three groups: the bottom third representing low
risk fields, the middle third representing the moderate risk fields and the top third representing the high risk
fields. As can be seen from Table 34, the rank order of the partial mPRS scores matched measured water
quality both in terms of phosphorus concentration and phosphorus loading.
95% Prediction Interval
95% Confidence Interval
R2 = 0.9023
-1.5
-0.5
0.5
1.5
2.5
3.5
10 20 30 40 50
mPRS Score
Me
an
DR
P in
ru
no
ff
R
2 = 0.9324
-1
0
1
2
3
4
10 20 30 40 50
mPRS score
Me
an
TP
in
ru
no
ff

69
Table 34. Classification of Hillsborough site using partial mPRS scores benchmarked against measured edge-of-field water quality.
Risk Group
Plot No.
STP Morgans P* mg l
-1
P application rates kg P ha
-1
Partial mPRS Score
Mean MRP in runoff mg l
-1
Mean TP in runoff mg l
-1
Annual Load MRP in runoff kg P ha
-1
Annual Load TP in runoff kg P ha
-1
Low 4 3.47 0 12 0.287 0.507 0.0525 0.0929 Low 5 3.99 10 12 0.341 0.623 0.0624 0.114 Mod 1 8.08 40 24 0.536 0.936 0.0981 0.1714
Mod 3 6.15 20 24 0.4633 0.836 0.0848 0.1531 High 6 14.47 80 48 2.383 2.905 0.4363 0.5318
* Derived from Olsen’s P using (Coulter and Tunney, 1996)
3.7.2 Analysis of Johnstown Castle Data
In like fashion to those at Hillsborough, the three sites at Johnstown Castle were assessed to examine
relationships between the partial mPRS scores and the measured edge-of-field water quality. Dissolved
reactive phosphorus (DRP) loading and total dissolved phosphorus (TDP) loading were each linearly
regressed against the partial mPRS scores. The 144-day MRP and TDP exports were arithmetically
extrapolated to represent annualised loads. The regression analysis showed very good agreement between
the partial mPRS scores and the actual phosphorus lost via overland flow as defined by measured edge-of-
field water quality (Table 35); however, the confidence intervals in the regressions were low, reflecting the
small size of the dataset. The rank order of the partial mPRS scores also matched the rank order of the
edge-of-field P loads. Unfortunately, both the Hillsborough and Johnstown Castle datasets were extremely
small; nevertheless, these results give confidence in the ability of the mPRS to give an indication of the
relative scale (and impacts) of P loss on water quality.
Table 35. Coefficients of correlations for linear regressions of partial mPRS score v MRP and TDP loads, for three Johnstown Castle fields. Parameter R
2 p (n=3)
144-day MRP export-extrapolated to 1 year
0.94 0.15
144-day TDP export-extrapolated to year
0.90 0.2
3.7.3 Comparison of mPRS, PRS (Magette, 1998) and Field PRS (Hughes, 2004)
Using data from five sites at Hillsborough, a comparison was conducted using the original PRS (Magette,
1998), its evolved form represented by FieldPRS (Hughes, 2004), and the significantly modified form
represented by Partial mPRS to determine which might be most effective at ascribing the risk of losing P in
runoff from the fields.
Scores from each PRS were assessed using linear regression against both mean MRP concentration and
annual MRP loading measured in runoff at the edges of the fields. The analysis showed that each PRS gave
a good fit between PRS score and edge-of-field water quality; however, the mPRS provided the best fit for
both MRP concentration and MRP loading (Table 36).

70
Table 36. Coefficients of linear correlation between scores from three different PRS v edge-of-field mean MRP concentration (mg l
-1 P) and annual MRP load (kg ha
-1), Greenmount Agricultural College
Fields (n=5).
PRS version MRP Concentration MRP Load
PRS (Magette, 1998) 0.81 0.82
Field PRS (Hughes, 2004) 0.77 0.80 Partial mPRS (this research) 0.90 0.90
3.7.4 Examination of Weightings for Factors in Partial mPRS
In order to provide a measurable justification for weightings used for each factor in the partial mPRS (rather
than ascribe them using professional judgement as in the original PRS and most others in use), three sets of
weightings were developed (Table 37). Within each set, each factor weighting was systematically varied
while the weightings for the remaining factors were held constant. Using the Hillsborough data set as a
benchmark, regression analyses were then carried out between the resultant mPRS scores obtained at each
step and the measured edge-of-field water quality, i.e., MRP concentration and MRP load. The sets of
weightings that produced the highest linear correlations with edge-of-field water quality are shown in Table
38. The best-fit set of weightings was quite different depending on what water quality measure was used as
the benchmark. To determine whether these weightings are more effective than those developed by
Magette (1998) would require testing on a larger dataset than is currently available in Ireland.
Table 37: Different sets of weightings examined in the partial mPRS.
Soil P Runoff Risk P application P application timing
Weighting1 0.5 0.5 0.5 0.5 Weighting 2 0.9 1 1 0.9 Weighting 3 2 2 2 2
Table 38. “Best Fit” weightings for source factors of the partial mPRS.
Partial mPRS Factors Water Quality Measure Soil P Runoff Risk P Usage P application
timing
MRP Concentration
0.5 0.5 2 2
MRP Load 2 2 0.5 0.5
3.7.5 Analysis of mPRS Factors
A detailed analysis using data from the Hillsborough sites was carried out whereby each of the partial mPRS
source factors was regressed against MRP concentration and MRP loading in order to determine the
relationship between these factors and edge-of-field water quality. The S1 source factor showed good
correlations (R2 = 0.9) with both mean DRP concentration and annual DRP loading. The regression for DRP
concentration is shown in Figure 13.

71
y = 0.7663x - 0.5773
R2 = 0.9023
-1.5
-0.5
0.5
1.5
2.5
3.5
0.5 1.5 2.5 3.5
Factor: S1
Me
an
SR
P in
ru
no
ff
Figure 13. Regression of S1 Factor of the partial mPRS on mean MRP edge-of-field concentration (mg l
-1) from 5 Hillsborough sites (95% Confidence Interval, 95% Prediction Interval).
There were equally good correlations between S2 and both MRP concentration (R2=0.9) and MRP loading
(R2=0.9). Undoubtedly, these regressions were limited by the small size of the Hillsborough dataset (n=5).
When the Johnstown Castle dataset were analysed jointly with the Hillsborough data, the correlation
between S1 and edge of field water quality (MRP concentration) was much lower, as shown in Figure 14.
(N.B. In this analysis, one extreme outlying data point in the Johnstown Castle data set was eliminated.)
Figure 14. Regression of S1 factor on MRP concentration (mg l-1
) in edge-of-field runoff (95% Confidence Interval, 95% Prediction Interval) for 5 Hillsborough and 2 Johnstown Castle sites.
R2 = 0.3421
-2
-1
0
1
2
3
4
5
-1 1 3 5 7
S1
MR
P C
on
c

72
Despite the small dataset represented by the Hillsborough and Johnstown Castle data, these regression
results indicate that there are good relationships between the mPRs source factors and edge-of-field water
quality, i.e. that the source factors used in mPRS are important.
3.8 Testing of mPRS Using Field Data at Catchment Scale
Testing of mPRS at the subcatchment scale was undertaken to supplement the examination of mPRS at
field scale. This analysis at the larger scale allowed for the assessment of the mRPS using more varied
datasets than those available at the field scale. Importantly, analysis at the subcatchment scale allowed
examination of the “transport” component of mPRS, a feature that could not be tested at field scale. Lastly,
this analysis had the added advantage of assessing the effectiveness of the mPRS at the catchment/sub-
catchment scale through a process in which “field scale” data were combined to generate mPRS scores for
catchments.
3.8.1. Ara Catchment Analysis
Initial testing of the mPRS indicated that there were poor correlations between the mPRS site scores and the
annual average in-stream MRP concentration (R2=0.05) (Figure 15). Introduction of an altered S1 factor
(S1var1), resulted in a slightly improved correlation between the mPRS and MRP concentration (R2=0.13)
(Figure 16); however, this regression was still poor.
y = 0.001x + 0.0314
R2=0.05
-0.1
-0.05
0
0.05
0.1
0.15
0.2
4 9 14 19
mPRS
MR
P C
on
ce
ntr
ati
on
(m
g/l)
Figure 15. Linear regression of average annual MRP concentration (mg l-1
) v mPRS score for 8 Ara subcatchments (95% Confidence Interval, 95% Prediction Interval).

73
y = 0.0016x + 0.0235
R2=0.13
-0.1
-0.05
0
0.05
0.1
0.15
0.2
4 9 14
mPRS
MR
P C
on
ce
ntr
ati
on
(m
g/l)
Figure 16. Linear regression of average annual MRP concentration (mg l-1
) v mPRS score for 8 Ara subcatchments, using a modified calculation for S1 (S1var1) (95% Confidence Interval, 95% Prediction Interval).
Due to large variations in the areas encompassed by subcatchments, the mPRS score for each
subcatchment was multiplied by the subcatchment area in order to make the resultant mPRS scores “area
relative”. The resultant regressions were not promising however, and actually had lower coefficients of
correlation than those generated with the basic mPRS scores (mPRS v MRP Concentration: R2 =0.01). The
slightly modified mPRS (with S1var1) also showed a very poor regression (R2=0.00). This analysis suggests
that for the Ara catchment the mPRS is not sensitive to scale.
In an attempt to address the variability in the availability of data among subcatchments, only those
subcatchments having greater than 30% of the subcatchment area represented in the dataset were used
(i.e., subcatchments 3, 4, 10 and 13). The resultant correlation between mPRS scores and in-stream water
quality (average annual MRP concentration) was considerably improved (R2=0.73) (Figure 17). The
correlation between the MRP concentration and the mPRS score generated when the modified S1 factor
(S1var1) was used also improved significantly (R2=0.83) (Figure 18). When considering the improved
correlations it is necessary to consider that there were only four data points for this regression analysis.
However, it is felt that the data included in this small dataset is truly representative of the Ara subcatchments
as it only included those subcatchments having a significant area described by measured data.
The mPRS also was tested using in-stream MRP loads. The correlation between the mPRS score and the
annual MRP loading (kg ha-1
) was poor (R2=0.03). The correlation between the MRP loading and the mPRS
score resulting from the use of S1var1 was an improvement on the mPRS score (R2=0.15), but still poor.
For the four subcatchments in which more than 30% of the catchment area was covered by measured field
data, the linear correlation between the mPRS score and the MRP loading (kg ha-1
) was good (R2=0.45), as
was the correlation between the mPRS score calculated using S1var1 and MRP loading (R2=0.33).

74
y = 0.0054x - 0.0077
R2=0.73
-0.1
-0.05
0
0.05
0.1
0.15
0.2
6 8 10 12 14
mPRS
MR
P C
on
ce
ntr
ati
on
(m
g/l)
Figure 17. Linear regression of annual average MRP concentration (mg l-1
) v mPRS score for 4 Ara subcatchments having greater than 30% catchment coverage with field data (95% Confidence Interval, 95% Prediction Interval).
y = 0.0047x - 0.0026
R2=0.83
-0.1
-0.05
0
0.05
0.1
0.15
0.2
5 7 9 11 13 15
mPRS (S1var1)
MR
P C
on
ce
ntr
ati
on
(m
g/l)
Figure 18. Linear regression of annual average MRP concentration (mg l-1
) v mPRS score using S1var1 for 4 Ara subcatchments having greater than 30% catchment coverage with field data (95% Confidence Interval, 95% Prediction Interval).
3.8.1.1 Analysis of Individual mPRS Factors
The linear correlations between individual mPRS factors and annual average MRP concentration were not
particularly strong, and both the S1 factor (R2=0.10) and the S1var1 factor (R
2=0.05) were poorly correlated
with the in-stream MRP concentration. Both the S3 factor (R2=0.20) and the S2 factor (R
2=0.23, Figure 19)
were somewhat better correlated to annual average MRP concentration than were S1 and S1var1.

75
y = 0.0246x + 0.0099
R2 = 0.2306
-0.1
-0.05
0
0.05
0.1
0.15
0.2
0.6 1.1 1.6
S2
MR
P
Figure 19. Linear regression of average annual MRP concentration (mg l-1
) v S2 mPRS factor for 8 Ara subcatchments (95% Confidence Interval, 95% Prediction Interval).
As in the field scale analyses, the S2 factor was the mPRS source factor that was most strongly correlated
with MRP concentrations, suggesting that, of the source factors used in the mPRS, this factor best depicts
the loss of P in the Ara catchments.
Considering that a fundamental assumption underlying the development of the mPRS was that P loss from
land to water could be best described by a combination of source and transport factors, a linear regression
analysis between the individual mPRS source factors multiplied by the “distance” factor was undertaken. It
was assumed that the distance between a P source and receiving water is an important factor influencing P
transport. However, there were poor correlations between each of S1*Distance, S1var1*Distance,
S3*Distance and annual average MRP concentration (with R2=0.02, R
2=0.01, R
2=0.13, respectively). A
good correlation (R2 = 0.52) was found between S2*Distance and MRP concentration (Figure 20), probably
reflecting the effectiveness of the S2 factor (Figure 19).
Results from the analysis of the mPRS for the Ara catchment was generally disappointing, however some
interesting relationships were noted. The first of these is the importance of the S2 factor (Soil P* Desorption
factor) in the mPRS. Of all the mPRS factors tested, S2 is the one most strongly correlated with annual
average in-stream MRP concentration. This relationship was also true in the field scale analyses. The
second important result from the analysis of Ara subcatchments was the need for good quality “field” data
representing a good proportion (at least 30%) of a catchment. When subcatchments having less than 30%
of catchment coverage were excluded from the analyses, all correlations (between the mPRS as well as its
factors and measured water quality) improved considerably.

76
y = 0.0167x + 0.0072
R2=0.52
-0.1
-0.05
0
0.05
0.1
0.15
0.2
0.5 1.5 2.5 3.5
S2*t
MR
P C
on
ce
ntr
ati
on
(m
g/l)
Figure 20. Linear regression of annual average MRP concentration (mg l-1
) v “S2*T1” score for 8 Ara subcatchments (95% Confidence Interval, 95% Prediction Interval).
3.8.2 Clonmore Catchment Analysis
As in the Ara catchment, the mPRS was tested in the Clonmore catchment against annual average MRP
concentration (initially, 8 subcatchments) and against annual average MRP loading (4 subcatchments). In
the case of the Clonmore catchment there were no subcatchments in which less than 30% of the
subcatchments area was accounted for by field data.
The initial regression between the mean mPRS scores and the annual average in-stream MRP concentration
(mg l-1
) indicated poor correlation (R2=0.08). The usage of the alternative S1 factor (S1var1), which proved
to be an improvement on the S1 factor for the Ara catchment, was ineffective in the Clonmore catchment.
This analysis identified an “outlier” (subcatchment 7) in the mPRS scores for the Clonmore. In subcatchment
7 the elevated MRP concentration relative to the mPRS score, may have been indicative of the position of
this subcatchment at the furthest upstream point of the Clonmore catchment (Figure 4). For such a
headwater catchment, very low flows, particularly during the summer months, may have been the cause of
elevated in-stream MRP concentrations. A more likely explanation may have been that a significant length
of the stream channel in this subcatchment is bordered by both complex tillage and transitional forest scrub
lands, for which the mPRS was not designed. Hughes (2004) reported problems with the PRS (Magette,
1998) in catchments with large areas of tillage, such as many of the Yellow River subcatchments (Section
3.5, Table 30.) When this outlier subcatchment was removed from the analysis the regression between
mPRS scores and annual average MRP concentration improved considerably (R2=0.25, Figure 21).
Consequently, only seven of the Clonmore subcatchments were used in the analyses reported below.
Scaling (multiplying) the mean subcatchment mPRS scores by the respective subcatchment areas
marginally improved the correlation between the scores and annual average MRP concentration (R2= 0.29,

77
Figure 22). This was in contrast to the results in the Ara catchment, for which this modification had no effect.
In retrospect, different scaling techniques (e.g., weighted areas) may have produced better results, but time
did not allow such analyses.
y = 0.0005x + 0.0259
R2 = 0.2483
0.01
0.02
0.03
0.04
0.05
0.06
0.07
10 15 20 25 30 35
mPRS
mrp
(m
g/l)
Figure 21. Linear regression of annual average MRP concentration (mg l-1
) v mPRS score for 7 Clonmore subcatchments (95% Confidence Interval, 95% Prediction Interval).
y = 1E-10x + 0.0308
R2=0.29
0.01
0.02
0.03
0.04
0.05
0.06
0.07
0 20000000 40000000 60000000 80000000
mPRS*area
MR
P C
on
ce
ntr
ati
on
Figure 22. Linear regression of annual average MRP (mg l-1
) v scaled mPRS scores (mPRS*Area) for 7 Clonmore subcatchments (95% Confidence Interval, 95% Prediction Interval).

78
Average annual in-stream phosphorus loads (kg MRP ha-1
yr-1
) were available for 4 Clonmore
subcatchments (subcatchments 2, 3, 4, and 8, Figure 4) and were used as an alternative benchmark against
which to test the mPRS. This analysis resulted in poor correlations of mPRS scores with MRP loads
(R2=0.07, Figure 23).
y = -0.0172x + 0.8004
R2=0.07
-4
-3
-2
-1
0
1
2
3
4
5
10 15 20 25 30 35
mPRS
MR
P L
oa
din
g (
Kg
/ha
)
Figure 23. Linear regression of annual average MRP load (kg P ha-1
yr-1
) v mPRS scores for 4 Clonmore subcatchments 95% Confidence Interval, 95% Prediction Interval).
3.8.2.1. Analysis of Individual mPRS Factors
The correlations between individual mPRS factors and annual average MRP concentration were of mixed
quality, as was the case in the Ara catchment (Section 3.8.1.1). Both the S1 factor (R2=0.07) and the S3
factor (R2=0.02) were poorly correlated with the annual average in-stream MRP concentration. However, as
was the case with the Ara catchment (and in field scale testing), the S2 factor (Soil P Concentration X
Desorption Risk) was strongly correlated with the MRP concentration (R2=0.60, Figure 24).
In the case of the Clonmore catchments, the multiplication of the individual mPRS (source) factors by the
distance factor did not improve the correlations with MRP concentration. In the case of both S1 factor and
the S3 factor, poor linear correlations resulted when they were multiplied by the distance factor. The S2
factor (when multiplied by distance, T1), was well correlated with the MRP concentration (R2=0.48, Figure
25), however the strength of the correlation was lower than that of the S2 factor alone (R2=0.60, Figure 24).
As with the analysis of mPRS in the Ara catchment a number of observations were important from the
analysis of subcatchments in the Clonmore catchment. The primary result highlights the strong correlation of
the S2 factor (Soil P factor * Desorption Risk) with annual average MRP concentration, a relationship that
was shown also in the Ara catchment and in field scale testing. In fact, the correlation was stronger than for
the mPRS itself. The analysis of the Clonmore subcatchments also revealed the poor correlation of mPRS

79
scores with MRP load, an observation also made in the analysis of the Ara subcatchments. Lastly, the
scaling techniques used to adjust mPRS scores based on subcatchment size were ineffective in improving
correlations between mPRS scores and annual average MRP concentration.
Figure 24. Linear regression between annual average MRP concentration (mg l
-1) and mPRS S2
factor for 7 Clonmore subcatchments (95% Confidence Interval, 95% Prediction Interval).
y = 0.0011x + 0.0271
(R2=0.48)
0.01
0.015
0.02
0.025
0.03
0.035
0.04
0.045
0.05
0.055
0.06
2 7 12
S2*t
MR
p C
on
ce
ntr
ati
on
(m
g/l)
Figure 25. Linear regression of annual average MRP (mg l-1
) v “S2*T1” for 7 Clonmore subcatchments (95% Confidence Interval, 95% Prediction Interval).
3.8.3. Optimisation of mPRS Weightings
The optimisation process was very successful at generating weightings which greatly improved the positive
correlations between mPRS scores and average annual in-stream MRP concentrations measured in the Ara
y = 0.0022x + 0.0231 R2 = 0.5965
0.01
0.015
0.02
0.025
0.03
0.035
0.04
0.045
0.05
0.055
0.06
2 4 6 8
S2
mrp

80
subcatchments. For the mPRS, the “best fit” set of weightings (Table 39) for mPRS factors was generated
using an optimisation procedure with no constraints (R2=0.76). These unconstrained weightings varied quite
widely, between –11.23 and 16.24. Interestingly, the presence of the negative weightings for the P
application factor (S1 sub-factor) and the Farmyard Risk factor (S3) indicate that these two factors did not
effectively represent the contribution of P applications and farmyard risk, respectively, to the description of
(i.e., correlation with) annual average MRP concentrations in the Ara subcatchments. This finding
corroborated the results of examining the correlations between individual factor scores and annual average
MRP concentrations (Sections 3.8.1.1 and 3.8.2.1). In those analyses (both for the field scale data and the
Ara and Clonmore data) only the S2 factor appeared to be well correlated to in-stream MRP concentrations.
It is considered that the effectiveness of the farmyard factor (S3) could have been compromised by the fact
that the factor risk is to all fields within a farm boundary, rather than attributed to a specific point for the
farmyard location. Although this factor was applied to all fields associated with a farm, it was possible that
not all fields may have received manure, and thus been affected by whether a farmyard might have been in
good or bad condition.
Table 39. Optimised mPRS factor weightings resulting from unconstrained optimisation using data from 8 Ara subcatchments.
Factor Optimised
weighting)
P Usage rate 8.01
P application
timing
S1 -7.14
Soil P 16.54
Desorption
Risk
S2 15.61
Farmyard
Risk
S3 -11.23
Transport
Distance
T1 0.75
It is also considered that the P application timing factor may have been compromised, because the data that
was used to calculate this factor arose from a farmer survey about their normal manure and fertiliser
application timing, rather than to information on such applications during the period of the water sampling.
Use of the optimised weightings in the mPRS applied to the Clonmore dataset showed that the weightings
improved the correlation between the mPRS scores and annual average MRP concentration (R2=0.63 v R
2 =
0.25, Figure 21). MRP concentrations from the seven Clonmore subcatchments and mPRS scores resulting
from the use of optimised weightings are compared in Figure 26.

81
Figure 26. Annual average in-stream MRP concentration in 7 Clonmore subcatchments (mg l-1
) v mPRS scores resulting from optimised factor weightings developed for 8 Ara subcatchments
3.9 Assessment of mNRS
Analyses to assess the performance of mNRS were undertaken separately for year 2002 and for year 2003.
As part of these analyses a number of variations on the Nitrogen Application (NA) and Nitrogen Application
Timing (NT) sub-factors (Tables 17 and 18) were also assessed. These variations were tested to decide the
best way to represent each of these factors. The Nitrogen Application sub-factor may consist only of the
application of N in slurry and artificial fertiliser, or the factor may also include the applications of N in dirty
water. It was also considered that the N deposited by grazing animals may be an important input to include
in the NA sub-factor. To account for these possibilities, three separate variations on the Nitrogen Application
factor were examined.
1. Nitrogen applications including dirty water applications;
2. Slurry and fertiliser nitrogen applications only;
3. All nitrogen applications including N deposited by grazing animals.
It was necessary to assign a risk score to the Nutrient Application sub-factor differently for the 3rd variation
above, due to the fact that Teagasc recommendations (as used to score the Nutrient Application sub-factor
in mNRS, Tables 17 and 18) do not clearly address the application of nitrogen due to grazing animals alone.
As the dataset for the Curtin’s Farm included information on all forms of N additions (including direct animal
deposition) to the test sites, it was decided to apportion the numerical range between the highest and the
lowest N quantities applied per field on the farm into three equal categories (of N applied) representing High
Risk (with a score of 4), Moderate Risk (score of 2) and Low Risk (score of 1). Thus, using the 3rd
variation
for scoring the Nitrogen Application sub-factor, N applications in the range of the lowest quantities on N
applied would be given a score of 1. Although this approach to scoring for use with the 3rd
variation for the
Nitrogen Application sub-factor is considered inferior to using the science-based Teagasc guidelines, it was
deemed the only reasonable approach in the absence of such guidelines.
0.000
0.050
0.100
0.150
0.200
1 2 3 4 5 6 8
Subcatchments
mPRS score
0.000
0.010
0.020
0.030
0.040
0.050
MRP (mg/l)
mPRS
MRP

82
Each of the three alternative calculations (1), (2) and (3) for the Nutrient Application sub-factor was then
combined with the remaining mNRS factors to generate three separate mNRS scores, referred to as mNRS1,
mNRS2 and mNRS3. Each of these scores were generated for the mNRS(A) and mNRS(B) scenarios
(described in Section 2.4.3). Thus, for mNRS (A), three mNRS scores were generated: mNRS1(A),
mNRS2(A) and mNRS3(A). Likewise for mNRS (B), three scores were generated: mNRS1(B), mNRS2(B)
and mNRS3(B).
The importance of individual “source factors” by way of their correlation with groundwater quality was
assessed by linear regression. However, no individual assessment was carried out for the aquifer
vulnerability factor or the transport factors due to the fact that those factors were effectively the same across
the entire test site (Curtin’s Farm, Figure 6).
3.9.1 Results for 2002
Analysis of the mNRS for the 2002 dataset from Curtin’s Farm identified the difficulty in relating field based
parameters (and resultant scores) to groundwater quality data. The regression analysis resulted in generally
poor correlations between all mNRS scores and the average measured N03-N concentrations for each of the
boreholes. For mNRS2, which accounted for the application of N via artificial fertiliser and slurry only, the
correlations were very poor, indicating that the resultant mNRS score did not effectively estimate the risk of
nitrogen losses to groundwater (as measured by N03-N concentration). The regression between the mNRS2
(A) score and average annual N03-N concentration indicated no correlation whatsoever (Figure 27). A
similar result was the case for the regression of mNRS2 (B) against borehole N03-N concentrations (Figure
28).
y = -0.0042x + 14.724
R2=0.00
-5
0
5
10
15
20
25
30
35
20 30 40 50 60 70
mNRS2 (A) Score
Av
era
ge
N0 3
-N C
on
c (
20
02
)
Figure 27. Linear regression of mNRS2 (A) score v mean borehole N03-N concentration (2002) (95% Confidence Interval, 95% Prediction Interval).

83
y = -0.0284x + 16.208
(R2=0.01)
-5
0
5
10
15
20
25
30
35
30 40 50 60 70 80
mNRS2 (B) Score
Av
era
ge
N0 3
-N C
on
c (
20
02
)
Figure 28. Linear regression of mNRS2 (B) score v mean borehole N03-N concentration (2002) (95% Confidence Interval, 95% Prediction Interval). The correlations between mNRS scores and borehole N03-N concentration were similarly poor when the
Nitrogen Application sub-factor included of “dirty water” applications: mNRS1(A) v N03-N (R2=0.03) and
mNRS1(B) v N03-N (R2=0.04). By comparison, correlations between mNRS3 (mNRS score generated using
all nitrogen applications in the Nitrogen Application sub-factor, including nitrogen deposited by livestock) and
borehole N03-N concentration were much improved (Figures 29 and 30).
y = 0.1117x + 8.9203
(R2=0.36)
-5
0
5
10
15
20
25
30
35
10 30 50 70 90
mNRS3 (B) Score
Av
era
ge
N0
3-N
Co
nc
(2
00
2)
Figure 29. Linear regression of mNRS3 (A) score v mean borehole N03-N concentration (2002) (95% Confidence Interval, 95% Prediction Interval).

84
y = 0.1317x + 7.045
(R2=0.38)
-5
0
5
10
15
20
25
30
35
20 40 60 80
mNRS3 (B) Score
Av
era
ge
N0
3-N
Co
nc
(2
00
2)
Figure 30. Linear regression of mNRS3 (B) score v mean borehole N03-N concentration (2002) (95% Confidence Interval, 95% Prediction Interval).
The regression analysis undertaken for the 2002 dataset indicates that the mNRS does not effectively
estimate the “risk” of nitrogen losses to groundwater arising from the fields on Curtin’s farm for the
hydrological year 2001-2002. However, by including applications of N directly deposited by livestock in the
scoring of the Nitrogen Applications (NA) factor, the mNRS (mNRS3) was fairly correlated to average
borehole N03-N concentrations. While the correlation is not strong, this result does indicate the importance
of including all nitrogen applications, not just the applications of fertiliser and slurry, when attempting to
determine the risk of nitrogen losses to groundwater.
3.9.2 Results for 2003
As with the 2002 dataset, there was no correlation between either the mNRS2 (A) or mNRS2 (B) score and
the average 2003 borehole N03-N concentrations. These scores considered fertiliser and manure to be the
only N sources.
However, by including additional sources of N in the Nitrogen Application sub-factor (i.e., mNRS1 and
mNRS3), correlations between mNRS scores and average borehole N03-N concentration were generally
good. Correlations between mNRS1 and the average N03-N concentration in the boreholes were very good
for both scenarios mNRS1A (R2=0.51) and mNRS1B (R
2= 0.56) (Figures 31 and 32). Reasonable
correlations also existed between mNRS3 scores and average borehole N03-N concentrations: mNRS3 (A) v
N03-N (R2=0.40) and mNRS3 (B) v N03-N (R
2=0.44) (Figures 33 and 34). These results (and those for 2002)
highlight the importance of including all sources of nitrogen in the scoring of the Nitrogen Application sub-
factor in the mNRS.
3.9.3 Combined Results for 2002 / 2003 and Summary
Of the two scenarios for testing the mNRS against borehole water quality, Scenario B (Table 19) generally
yielded the stronger correlations to both 2002 and 2003 data. Likewise, the inclusion of N from dirty water
applications, manure and fertiliser in the scoring of the Nitrogen Application sub-factor (Alternative 1),
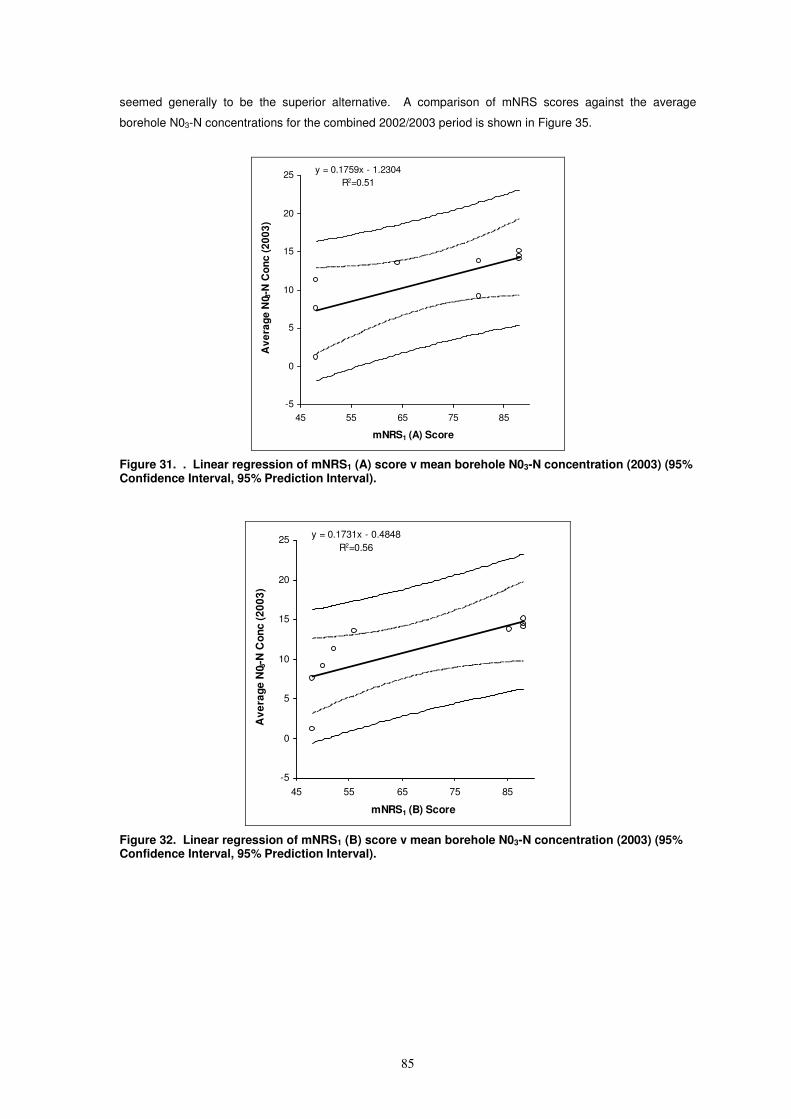
85
seemed generally to be the superior alternative. A comparison of mNRS scores against the average
borehole N03-N concentrations for the combined 2002/2003 period is shown in Figure 35.
y = 0.1759x - 1.2304
R2=0.51
-5
0
5
10
15
20
25
45 55 65 75 85
mNRS1 (A) Score
Av
era
ge
N0 3
-N C
on
c (
20
03
)
Figure 31. . Linear regression of mNRS1 (A) score v mean borehole N03-N concentration (2003) (95% Confidence Interval, 95% Prediction Interval).
y = 0.1731x - 0.4848
R2=0.56
-5
0
5
10
15
20
25
45 55 65 75 85
mNRS1 (B) Score
Av
era
ge
N0 3
-N C
on
c (
20
03
)
Figure 32. Linear regression of mNRS1 (B) score v mean borehole N03-N concentration (2003) (95% Confidence Interval, 95% Prediction Interval).

86
y = 0.1072x + 5.3058
(R2=0.40)
-5
0
5
10
15
20
25
20 40 60 80
mNRS3 (A) Score
Av
era
ge
N0
3-N
Co
nc
(2
00
3)
Figure 33. Linear regression of mNRS3 (A) score v mean borehole N03-N concentration (2003) (95% Confidence Interval, 95% Prediction Interval).
y = 0.1078x + 5.1
(R2=0.44)
-5
0
5
10
15
20
25
20 40 60 80
mNRS3 (B) Score
Av
era
ge
N0
3-N
Co
nc
(2
00
3)
Figure 34. Linear regression of mNRS3 (B) score v mean borehole N03-N concentration (2003) (95% Confidence Interval, 95% Prediction Interval).

87
Figure 35. mNRS scores v mean borehole N03-N concentration (mg/L) for 2002/2003 for Scenario B with dirty applications included in the scoring of the Nitrogen Application sub-factor (Alternative 1).
The correlations between mNRS scores and mean borehole N03-N concentrations for the 2002 dataset were
generally inferior to those for the 2003 dataset. The reasons for the poorer correlations can be only
hypothesised. The N applications between the two years varied somewhat over the study site, but there
were no obvious trends. Nevertheless, the mean nitrate concentrations at all but two of the boreholes were
higher in 2002 than in 2003. Particularly elevated nitrate concentrations in 2002 are obvious over 2003 for
BHC7 and BHC 8 (Figure 36). Bartley (2003) surmised that these differences are due to a combination of
agricultural practices and meteorological factors. It is probably the case that meteorological factors, e.g.
increased rainfall, contributed significantly to the general increase in nitrate concentrations between 2002
and 2003. In general, the datasets used in this analysis indicate the variance that can occur from year to
year in terms of the losses of nutrients occurring to groundwater, as governed by metrological, and
management conditions. However, the ability of the mNRS to deal with this variance is limited, possibly due
to the lack of a factor related to “meteorological variability”.
For both the 2002 and 2003 datasets the mNRS (B) score tended to be better correlated with the average
N03-N concentrations than the mNRS (A) score. This indicates that the land area of influence is generally
extended beyond the area of just one field (of the sizes in this study). The area of influence around a
borehole is dependent on a number of hydrological factors and most certainly varies among sites; however,
for this farm areas up-gradient from boreholes by at least 100m seem to affect borehole N03-N
concentrations. This need not affect the general application of mNRS, however.
Lastly, the stronger correlations between mNRS scores and borehole N03-N concentrations that resulted
when N sources in addition to manure and fertiliser were included in the scoring of the Nitrogen Application
sub-factor of mNRS (Tables 17 and 18) cannot be overlooked.
0
20
40
60
80
100
120
1 2 3 4 5 7 8 9 10
Boreholes
Nitrate (mg/l)
0
5
10
15
20
25
mNRS score
mNRS
Measured

88
Figure 36. Mean nitrate concentrations (mg l-1
) in boreholes, 2002 v 2003.
3.10 Catchment Screening Tool
Results described below, using data for the Lough Conn and Lough Mask catchments, showed that
catchment scale datasets can be good indicators of water quality, particularly as measured by mean
concentrations of TP, and therefore serve as useful screening tools by which to assess catchments for their
propensities to lose P to surface water. The results also highlighted a number of problematic issues in
regard to the spatial and temporal losses of phosphorus occurring from the catchments analysed in this
study.
3.10.1 Phosphorus Desorption Properties of Soils
Des1 (Desorption category 1) was not related to the TP concentration in the 16 catchments, as indicated by
a very poor correlation coefficient (R2=0.01). This desorption category includes very poor soils such as peat
soils on which agriculture would not be practiced, but on which natural land uses would dominate. These
soils are at the “extreme” end of the desorption scale established by Daly (2000), and generally are present
over only minor areas of each catchment. Given these reasons, it is perhaps not surprising why the areas
categorised as Des1 have very minimal impact on the TP concentration in the rivers.
Des 2 (Desorption category 2) had a much stronger relationship with the TP concentration in rivers (Figure
37), with a linear correlation coefficient between the two factors of R2 =0.41. The regression equation is
negative showing that the more of a catchment covered in Des 2 soils, the lower was the TP concentration
recorded in catchment waters. The Des2 category represents soils with low sorption capacity.
0.00
5.00
10.00
15.00
20.00
25.00
BHC1 BHC2 BHC3 BHC4 BHC5 BHC7
BHC8 BHC9 BHC10
Boreholes
Nitrate (mg/l)
2002_mean
2003_mean

89
Figure 37. Linear egression between percentage of catchment area occupied by Desorption Category 2 soils and annual average in-stream TP concentration (µg l
-1), 16 catchments (95%
Confidence Interval, 95% Prediction Interval).
Des3 category soils showed no significant linear correlations with the in-stream TP concentration. This is
primarily because soil of this quality is very scarce within these catchments, and so is likely to have very little
influence. The only catchment with any significant quantity of this soil type is the Robe catchment.
As with Des2 category soils, those in the Des4 category exhibited a reasonable linear correlation with TP
concentration (R2=0.53). This category includes soil types with a relatively high desorption capacity that are
generally well drained and suitable for productive agriculture. This regression is positive (Figure 38),
indicating that TP concentration within these catchments increases with increasing area of Des4 land.
3.10.1.1 Whole catchment v partial catchment relationships
An analysis was undertaken to assess whether the impact of the catchment scale factors is better
represented by considering the coverage of the factors over the whole catchment or over selected areas of
the catchment. To this end each category of the P desorption coverage was calculated over the whole
catchment as well as over areas that were limited to 500m, 200m and 100m from the river channel.
There were no correlations apparent between Des1 or Des3 soils and mean in-stream TP. The results for
the Des2 category showed little variation between the regressions (Table 40) generated using the whole
catchment coverage, 500m coverage, 200m coverage or 100m coverage. However, for the Des4 category
there were considerable variations in the correlations, with the whole catchment coverage resulting in the
best linear correlation with average TP concentration (R2=0.53) (Table 40).
These results indicate that the desorption factor is a more effective indicator of water quality when
considered over the entire catchment, rather than only over areas nearer to the streams. This result is
somewhat surprising, as the importance of P transfer from riparian zones as been highlighted throughout the
literature, with particular reference to the Critical Source Areas (CSA) theories and the Variable Source
y = -0.3769x + 33.687
R 2 = 0.4164
-40
-20
0
20
40
60
-10 10 30 50 70 90
% catchment in Des2 category
TP (ug/l)

90
Areas (VSA) theories. It may be the case, however, that these results are influenced by the scale (and
therefore sensitivity) of the dataset.
y = 0.4143x + 10.47
R 2 = 0.5325
-20
-10
0
10
20
30
40
50
60
70
80
-10 10 30 50 70 90
% catchment with Des4 category soils
TP (µg/l)
Figure 38. Regression between percentages of catchment occupied by Desorption Category 4 soils and annual average in-stream TP concentration (µg l
-1), 16 catchments (95% Confidence Interval, 95%
Prediction Interval).
Table 40. Linear correlation coefficients for between annual average in-stream TP concentration (µg l-1
) in 16 catchments and soils in Des2 and Des4 categories over the full catchment and over partial catchment areas (adjacent to streams).
Whole Catchment 500m 200m 100m
Des 2 0.42 0.42 0.40 0.40
Des 4 0.53 0.29 0.4 0.39
3.10.1.2 Temporal Variation
An analysis also focussed on the temporal variation that occurs in the TP concentration in rivers during the
year, and between years. Regression analyses were undertaken between the various desorption categories
(on a whole-catchment basis) and the average TP concentrations for each of three different periods
(summer, winter, spring) during each of the years in the dataset (5 years for Lough Conn and 4 years for
Lough Mask).
The strongest correlations between the in-stream TP concentrations and all desorption categories occurred
during the winter period, when most TP would be expected to be lost in runoff. For this time period the
regression between the TP concentration and the Des4 factor showed an improved correlation (R2=0.58,
Figure 39) over that exhibited when the whole year data were used.
On an annual basis, quite different results (not presented) were obvious for each year, with the best
correlations for desorption categories versus the TP concentration for 1998 and the worst for 1995. Annual

91
rainfall in 1995 was considerably lower than in the other years, creating drought conditions. Although the
distribution of rainfall during the year was not examined, the low annual total may have resulted in reduced
phosphorus losses occurring during that year. Whatever the explanation, these results highlight that, as with
all predictive methods (stochastic, deterministic, empirical), cause-and-effect relationships tend to be more
accurate over long periods of record that encompass temporal variations.
Figure 39. Linear regression between percentage of catchment occupied by Desorption Category 4 soils and the winter seasonal average in-stream TP concentration (µg l
-1), 16 catchments (95%
Confidence Interval, 95% Prediction Interval).
3.10.2 Drainage
As was the case with desorption, coverage by the less dominant soil drainage categories did not exhibit
strong correlations with the annual mean in-stream TP concentrations.
The coverage of soils in the excessive drainage category was somewhat negatively correlated to the annual
mean TP concentration (R2=0.36, Figure 40). The regression equation is negative, indicating that the more
land within the catchments which is excessively well drained, the lower the TP concentrations in the rivers.
This is to be expected due to the fact that excessively drained soils allow for the rapid infiltration of rainfall
(and possible movement of P to subsurface transport pathways). This situation creates an elevated risk of
groundwater contamination (especially by nitrate nitrogen) and possibly lowers the quantities of P being
available for movement via overland flow. It would be expected, too, that catchments with large proportions
of excessively drained soils would produce less overland flow, and therefore transport less P to surface
water.
y = 0.4811x + 11.534
R2 = 0.5798
-20
0
20
40
60
80
-10 10 30 50 70 90
%Catchment with Des4 category soils
TP (ug/l) Winter average

92
Figure 40. Linear regression between percentage of catchment occupied by the “Excessive Drainage” Category soils and annual average in-stream TP concentrations (µg l
-1), 16 catchments
(95% Confidence Interval, 95% Prediction Interval).
The percentage of soils exhibiting good drainage within the catchments was positively, and even more
strongly, correlated with the TP concentrations (R2=0.47, Figure 41) than was the coverage by excessively
drained soils. This positive relationship is probably due to the fact that these soils facilitate more intensive
agricultural practices to be undertaken than would excessively drained soils, with the associated increased
rates of the P applications associated with intensive agricultural production.
This correlation between mean annual TP concentration and soil drainage is further improved (R2 = 0.5193,
Figure 42) when the coverage of good drainage soils are combined with the coverage of moderately drained
soils. This finding effectively strengthens the previous assertion that higher proportions of soils with
satisfactory drainage in catchments encourage more intensive agriculture, and hence greater quantities of P
applied than in poorly drained catchments, resulting in greater potential for P losses. This interpretation is
further strengthened by the fact that when the drainage categories which impede agricultural production are
combined and regressed against in-stream TP concentration, the resultant negative regression is also
stronger (R2=0.52, Figure 43) than when the coverage of one of these three categories is regressed alone.
y = -0.3508x + 32.852
R2 = 0.3648
-40
-20
0
20
40
60
-10 10 30 50 70 90
% catchment with soils in excessive drainage category
TP (ug/l)

93
Figure 41. Linear regression between percentage of catchment occupied by soils classified as having good drainage and annual average in-stream TP concentration (µg l
-1), 16 catchments (95%
Confidence Interval, 95% Prediction Interval).
Figure 42. Linear regression between percentage of catchment occupied by the soils in “good” and “moderate” categories combined and annual average in-stream TP concentration (µg l
-1), 16
catchments (95% Confidence Interval, 95% Prediction Interval).
y = 0.3773x + 14.079
R2 = 0.4701
-20
-10
0
10
20
30
40
50
60
70
-10 10 30 50 70 90
% of catchment in “good” drainage soils
TP (ug/l)
y = 0.411x + 10.675
R2 = 0.5193
-20
-10
0
10
20
30
40
50
60
70
-10 10 30 50 70 90
% catchment in good+moderate drainage soils
TP(ug/l)

94
Figure 43. Linear regression between percentage of catchment occupied by soils in the “excessive”, “poor” and “imperfect” categories combined and annual average in-stream TP concentration (µg l
-1),
16 catchments (95% Confidence Interval, 95% Prediction Interval).
3.10.2.1 Whole catchment v partial catchment
Assessment of whether the whole catchment coverage or partial catchment coverages are better correlated
with the water quality data showed, as with the desorption factor, that there were only minor differences
among the correlations for a given soil drainage category (Table 41). However, for the “good” soil drainage
category, the percentage coverage in the area of catchments within 500m from the river channel was best
correlated (R2=0.45, Figure 44) with the mean annual TP concentration measured in the streams.
For the “excessive” drainage category, the regression for percentage coverage in the area within 500m of
the river channel, deteriorated slightly (R2=0.32) from that for the whole catchment coverage, as was the
case for the combined categories of soil with “good” and “moderate” drainage (R2=0.47, Figure 45) and for
the combined “excessively drained”, “poorly drained” and “imperfectly drained” categories (R2=0.47).
Table 41. Linear regression correlation coefficients between annual average in-stream TP concentrations (µg l
-1) and soil drainage categories over the full catchment and over partial
catchment areas (adjacent to streams). Drainage
Class
Whole Catchment 500m 200m 100m
Excessive 0.36 0.32 0.31 0.31
Good 0.44 0.45 0.39 0.34
Poor 0.019 0.005 0.00002 0.0007
Imperfect 0.006 0.005 0.005 0.005
Moderate 0.0005 0.004 0.005 0.005
y = -0.4028x + 50.599
R2 = 0.517
-20
-10
0
10
20
30
40
50
60
70
80
10 30 50 70 90 110
% of catchment with excessive+poor+imperfect drainage
TP(ug/l)

95
Fiugre 44. Linear regression between percentage of the partial catchment area (500m from stream) occupied by soils in the “good drainage category and the annual average in-stream TP concentration (µg l
-1), 16 catchments (95% Confidence Interval, 95% Prediction Interval).
Figure 45. Linear regression between percentage of the partial catchment area (500m from stream) occupied by the soils in the “good” and “moderate” drainage categories combined and the annual average in-stream TP concentration (µg l
-1), 16 catchments (95% Confidence Interval, 95% Prediction
Interval).
y = 0.3924x + 13.193
R2 = 0.4539
-20
-10
0
10
20
30
40
50
60
70
80
-10 10 30 50 70 90
% of partial area with soils in “good” drainage category
TP (ug/l)
y = 0.4263x + 10.377
R2 = 0.4744
-20
-10
0
10
20
30
40
50
60
70
80
-10 10 30 50 70 90
% of partial area with soils in good &moderate drainage categories
TP (ug/l)

96
The correlations between the 200m and the 100m coverages with mean annual TP concentrations were not
as good as those for the whole catchment or 500m coverage. As with the P desorption coverage, it is
speculated that this result is due to the spatial resolution of this dataset, preventing a detailed classification
of the small areas of the catchments bordering the streams.
3.10.2.2 Temporal Variation
The mean TP concentrations for the winter period, from September through January, were marginally better
correlated to the coverages of most of the soil drainage categories than were the other seasonal averages
(Table 42). The “poor”, “imperfect” and “moderate” soil drainage categories were not correlated to the
seasonal TP concentrations.
Table 42. Linear regression correlation coefficients between soil drainage categories and both
annual average and seasonal average TP concentrations. Soil
Drainage
Class
Annual Average TP
Concentration
Winter (September
through January)
Average TP
Concentration
Spring
(February
through April)
Average TP
Concentration
Summer (May
through August)
Average TP
Concentration
Excessive 0.36 0.37 0.32 0.37
Good 0.44 0.46 0.42 0.36
The small differences in correlation coefficients for seasonal and annual periods (within a given soil drainage
category) indicate that this catchment parameter is equally effective as a predictor of in-stream TP on both a
seasonal and annual basis.
As for the regressions of soil P desorption category against average TP concentration for each year, the best
correlation of the “good” soil drainage category was with average TP concentrations for 1998 (R2=0.54,
Figure 46) and the poorest correlation was for 1995 (R2=0.07).
3.10.3 Soil Test Phosphorus (STP)
The dataset for this analysis comprised a national map prepared by Teagasc showing average soil P levels
in four categories (determined by Morgan’s P test, Table 21) on a 10 km2
grid. None of these soil test P
(STP) categories (or combinations of categories) was strongly correlated to mean annual in-stream TP
(Table 43). Correlations between annual average in-stream TP concentration and STP categories within
selected distances from the river channel were also weak (Table 44).
Table 43. Linear regression correlation coefficients between Soil Test Phosphorus categories and
both annual average and winter seasonal average in-stream TP concentrations. P1 P2 P3 P4
Annual average TP
concentration
0.03 0.02 0.018 0.15
Winter (September through
January) average TP
concentration
0.04 0.02 0.02 0.13

97
Figure 46. Linear regression between percentage of the catchment area occupied by soils in the “good” drainage category and the annual average TP concentration (µg l
-1) for 1998, 16 catchments
(95% Confidence Interval, 95% Prediction Interval).
Table 44. Linear regression correlation coefficients between annual average in-stream TP concentration and the areal percentage of STP categories found within 500m and 100m of the
stream. P1 P2 P3 P4
% area with 500m of the
stream occupied by STP
category
0.05 0.06 0.07 0.25
% area with 100m of the
stream occupied by STP
category
0.06 0.06 0.05 0.26
The results from this analysis are somewhat surprising, as STP has been cited widely in the literature as one
of the most significant indicator factors for P loss from agriculture. However, as a single indicator of water
quality, STP does not appear from this research to be effective, a point emphasised by Magette (1998) as
justification for development of a multi-factor assessment tool for P loss and transport.
Although the STP dataset used in this research is the only one available on a national scale, it is considered
that this dataset is not truly representative of the STP concentrations in soil due to the fact that (1) a small
number of samples cover a considerable spatial area and (2) the sample collection procedure is biased. The
spatial resolution of the dataset is poor as well. The limitations of the dataset may, therefore, have masked
relationships between STP and in-stream TP. Thus, when a better national database becomes available for
Ireland, STP should be re-examined for inclusion in any future catchment scale screening tool.
y = 0.4486x + 14.707
R2 = 0.5374
-20
0
20
40
60
80
-10 10 30 50 70 90
% catchment with soils in “good” drainage category
TP (ug/l)

98
3.10.4 CORINE Land Use
The CORINE land use dataset was used to assess whether any relationships could be determined between
the land use in the Lough Conn and Lough Mask catchments and the water quality as measured by TP
concentrations.
The class “CORINE 2” (high risk), which includes land uses ranging from mineral extraction to arable crop
production, exhibited a very strong correlation with the annual average TP concentration (R2=0.75, Figure
47). This was the best correlation of any of the factors examined against mean TP concentration. The
correlation is positive which indicates as the percentage coverage of this class of land use increases within a
catchment, so does the mean in-stream TP concentration. The CORINE 2 class represents the more
intensive agricultural land uses in the catchment, such as the “improved pasture” category and arable land
uses; these were the dominant categories in the Class 2 areas in the Conn and Mask catchments. This
result agreed with results presented by others in the literature, i.e., the more land within a catchment
occupied by relatively intensive agriculture, the greater will be the losses of TP to water.
Figure 47. Linear regression between percentage of the catchment area occupied by the “CORINE 2” class and the annual average in-stream TP concentration (µg l
-1), 16 catchments (95% Confidence
Interval, 95% Prediction Interval).
The land use class CORINE 4 (low risk) exhibited a negative correlation with average annual in-stream TP
concentration indicating that the greater the proportion of a catchment represented by this type of land use,
the lower the TP concentration observed. While the regression (Figure 48) is relatively poor (R2=0.27), its
negative character is as expected, due to the fact that this class of land use represents semi-natural and
natural land covers, such as natural grasslands and peat bogs. When the percentages of catchment area
covered by CORINE 4 and CORINE 3 land use classes (low intensity agricultural production) are combined,
y = 0.8335x + 13.44
R2 = 0.7484
-10
0
10
20
30
40
50
60
70
80
-10 10 30 50
% catchment in CORINE 2 class
TP (ug/l)

99
the correlation between land use and average annual in-stream TP concentration is considerably stronger
(R2=0.51, Figure 49).
Figure 48. Linear regression between percentage of the catchment area occupied by the CORINE 4 land use class and the annual average in-stream TP concentration (µg l
-1), 16 catchments (95%
Confidence Interval, 95% Prediction Interval).
y = -0.6115x + 78.741
R 2 = 0.5078
-20
0
20
40
60
80
100
40 60 80 100 120
% catchment in CORINE 3 and CORINE 4 classes
TP (ug/l)
Figure 49. Linear regression between percentage of the catchment area occupied by the CORINE 4 and CORINE 3 classes combined and the annual average in-stream TP concentration (µg l
-1), 16
catchments (95% Confidence Interval, 95% Prediction Interval).
y = -0.3025x + 47.805
R2 = 0.269
-20
0
20
40
60
80
0 20 40 60 80 100
% catchment in CORINE 4 class
TP (ug/l)

100
There were no significant correlations between mean in-stream TP concentration and either the CORINE 1
or the CORINE 3 classes, considered individually. The areal extent of these classes in the catchments was,
however, small.
3.10.4.1 Whole catchment v partial catchment
The use of the “partial catchment” areas did not improve the strength of correlations between mean TP
concentrations and CORINE class compared to the use of “whole catchment” coverage. In fact the resultant
regressions were, in most cases, considerably poorer than those generated from the whole catchment
analysis. For the CORINE 2 class, the partial catchment area located 100m from the stream channel
exhibited the best fit (R2=0.71) (Figure 50) and was nearly as good as that for the relationship with CORINE
2 over the whole catchment (Figure 47). However, this contrasted with a poorer regression for the partial
catchment area 500m from the stream channel (R2=0.6).
When considering the CORINE 4 class, the partial catchment area 500m from the stream channel resulted in
the best correlation (R2=0.35) (Figure 51), which is a considerable improvement of the regression resulting
from the full catchment analysis (Figure 48).
Figure 50. Linear regression between percentage of the partial catchment area (100m from stream) occupied by the “CORINE 2” class and the annual average in-stream TP concentration (µg l
-1), 16
catchments (95% Confidence Interval, 95% Prediction Interval).
y = 1.0383x + 15.538
R2 = 0.7119
-10
0
10
20
30
40
50
60
70
80
-5 5 15 25 35
%area 100m from stream channel in CORINE 2 class
TP (ug/l)

101
Figure 51. Linear regression between percentage of the partial catchment area (500m from stream) occupied by the “CORINE 4” class and the annual average in-stream TP concentration (µg l
-1), 16
catchments (95% Confidence Interval, 95% Prediction Interval).
3.10.4.2 Temporal Variation
Temporal variations were observed in the correlations between the CORINE land use classes and mean in-
stream TP concentration. As with soil P desorption, STP and soil drainage, water quality data from 1995
were least correlated with CORINE class, and this is assumed to be the result of unusually low rainfall during
this year. For the CORINE 2 class, the best correlation was with the mean TP concentrations in 1998
(R2=0.77). In common with the other factors assessed, the best-fit period was the winter for all years. The
regression of winter seasonal average TP concentration against CORINE 2 class was slightly better
(R2=0.81, Figure 52) than that for the regression with the annual average TP concentration (R
2=0.76).
For the CORINE 4 class, the best correlation (Figure 53) with annual TP concentrations resulted for the 1996
dataset (R2=0.33). However, the seasonal period for which there was a best fit varied between years. When
considering the entire dataset, the “Spring” seasonal average TP concentration was best correlated to
CORINE 4 (R2=0.33); yet, for 1998 (Figure 54) the “winter” seasonal average TP concentration provided the
strongest correlation (R2=0.38)
3.10.5 Combination of Factors
In an attempt to produce a simple screening tool at the catchment scale, those factors best correlated with
in-stream TP concentration for the catchments of Lough Conn and Mask were combined by taking the
arithmetic average of the proportions of the catchment areas assigned to the category or class considered
for each of the factors.
y = -0.364x + 52.491
R2 = 0.3479
-20
0
20
40
60
80
10 30 50 70 90 110
% area 500m from stream channel in CORINE 4 class
TP (ug/l)

102
Figure 52. Linear regression between percentage of the catchment area occupied by the “CORINE 2” class and the winter 1998 seasonal average in-stream TP concentration (µg l
-1), 16 catchments (95%
Confidence Interval, 95% Prediction Interval).
Figure 53. Linear regression between percentage of the catchment area occupied by the “CORINE 4” class and the average 1996 in-stream TP concentration (µg l
-1) for, 16 catchments (95% Confidence
Interval, 95% Prediction Interval).
The analyses described in Sections 3.10.1 through 3.10.4 revealed that, in general, the “Whole catchment”
datasets are best correlated to in-stream TP concentrations, and therefore to the risk of P loss occurring to
water. The regression analysis indicated that in most cases the partial catchment data did not correlate as
y = 1.2383x + 18.497
R2 = 0.8112
-20
0
20
40
60
80
100
-10 10 30 50
%catchment in CORINE 2 class
TP (ug/l) Winter ‘98
y = -0.2829x + 42.019
R2 = 0.3344
-20
-10
0
10
20
30
40
50
60
0 20 40 60 80 100
%catchment in CORINE 4 class
Average TP (ug/l) 1996

103
strongly to TP concentration as did the whole catchment datasets. This may be contrary to findings
elsewhere, where the importance of limited sub-catchment areas known as Critical Source Areas have been
identified (Poinke et al, 2000). However, it is considered that the main reason for the findings here is the fact
that the datasets used are at such a large scale that the data cannot differentiate between variations in factor
categories/classes over small areas and that this may have led to some bias in the proportioning of these
categories/classes over the total catchments.
y = -0.5104x + 73.701 R 2 = 0.376
-40
-20
0
20
40
60
80
100
0 20 40 60 80 100
%catchment in CORINE 4 class
averageTP (ug/l) Winter 1998
Figure 54. Linear regression between percentage of the catchment area occupied by the “CORINE 4” class and the winter 1998 seasonal average TP concentration (µg l
-1), 16 catchments (95%
Confidence Interval, 95% Prediction Interval).
Three of the four factors analysed exhibited fair to good correlations with TP concentrations. Soil test
phosphorus (STP) showed no significant correlations with TP concentrations, thus it was not included in the
screening tool. (The absence of this factor from the screening tool does not imply that STP is not an
important factor in the transfer of P from the landscape to water.)
The screening tool was comprised of the following factors:
Corine Class 2 (called C2);
Good and Moderate Drainage, combined (called GMD);
Desorption Classes 4 and 5, combined (called D45).
When regressed against TP concentrations, the combined factors were fairly well correlated (R2=0.61)
(Figure 55); however it must be noted that the regression is poorer than that for the CORINE 2 category on
its own.

104
Figure 55. Linear regression between the combination of best fit factors C2, GMD and D45 (arithmetic average of percentages of each factor in catchments) and the annual average in-stream TP concentration (µg l
-1), 16 catchments (95% Confidence Interval, 95% Prediction Interval).
Multiple linear regression was undertaken to develop a single equation containing the three factors C2, GMD
and D45 against TP concentration. The resulting equation
y = 12.7735+(C2*0.7822)+(GMD*-0.1261)+(D45*0.1577)
in which y is predicted TP concentration, produced excellent correlations with average annual in-stream TP
concentration (R2 = 0.75) and indicated that the CORINE 2 factor is easily the most significant factor
(p=0.0051). The GMD factor has a negative coefficient which suggests an inverse relationship with TP
concentration. However, neither the GMD (p=0.8) nor the D45 factor (p=0.79) are significant in the
correlation with TP concentration. These results suggest, therefore, that the percentage of a catchment
occupied by the CORINE 2 class is by far the single most significant predictor of TP concentration in these
catchments. The use of this single factor as a screening tool is superior to the use of a “combined factor”
approach and so it is deemed preferable to use it as a “screening tool” for the risk of losses of P from diffuse
agricultural sources at catchment level.
3.11 Farmyard Risk Assessment Scheme
The data collected in the Teagasc farmyard survey influenced the content and structure of the farmyard risk
assessment scheme (FRAS, Tables 45 - 49). Good agricultural practice and the scientific literature also
guided the questions that form the FRAS, as did the Expert Panel. The Teagasc survey of farmyard facilities
was limited to bovine production enterprises and thus FRAS is also. Until the Nitrates Directive was
y = 0.5299x + 9.8092
R2 = 0.6144
-20
-10
0
10
20
30
40
50
60
70
80
-10 10 30 50 70
average % (C2 + GMD + D45)
TP

105
implemented in Ireland, bovine facilities not enrolled in the Rural Environmental Protection Scheme (REPS)
were the main animal production category without a formal scheme to expressly address the control of
farmyard pollutants.
The FRAS is comprised of five sections, each of which addresses a significant potential source of water
pollutants (Tables 45 – 49), viz. storage facilities for slurry, dungstead manure, farmyard manure, silage
effluent and dirty water. As illustrated in Table 45, a section contains several elements that contribute to the
overall integrity of the given storage facility, and the importance of each element is assigned an “intra-
section” weighting according to its relative contribution to overall risk of the storage facility. Each element is
assigned a risk score depending on its status. An “inter-section” weighting reflects the relative contribution of
a given section to the risk of the entire farmyard.
Table 45. Section A of Farmyard Risk Assessment Scheme (FRAS) addressing risks associated with slurry storage facilities.
Section A: Slurry Storage Facility
Inter-Section Weighting Multiplier
2
Intra-Section Weighting Multiplier
Risk Score
2 What Type of slurry storage?
Underground Concrete/Steel
0
Overground Concrete/Steel
0
Lined Earthen 40
Unlined Earthen 100
1 Is it Covered? Yes 0
No 100
4 What is the slurry storage condition?
Good 0
Average 20
Poor 100
Inter-sectional and intra-sectional weightings, as well as risk scores, were developed considering more than
just the risk of P and N losses to water. While these elements were the focus of the overall research, it was
recognised that the risk posed by farmyards to water resources arises from pollutants other than just P and
N. This is especially the case in terms of episodic pollution events that result in fish kills due to the delivery
to water of excessive oxygen demanding materials (BOD) or toxic contaminants. The availability of a
material to be transported to water is also incorporated into the inter-section weightings, with those facilities
storing liquid materials assumed to pose a greater potential risk (and therefore a higher inter-section rating)
than those facilities storing solid materials.
The assignment of inter-sectional and intra-sectional weightings, as well as risk scores for elements within
each section, was developed by consensus with the Expert Panel.

106
Table 46. Section B of Farmyard Risk Assessment Scheme (FRAS) addressing risks associated with dungstead storage facilities.
Section B: Dungstead Storage Facility
Weighting multiplier between sections
1.7
Weighting multiplier within the
section
Risk Score
1 What Condition are the Dungstead Stores?
Good 0
Average 20
Poor 100
3 What condition is the seepage storage condition?
Good 0
Average 20
Poor 75
None Present 100
Table 47. Section C of Farmyard Risk Assessment Scheme (FRAS) addressing risks associated with farmyard manure (FYM, dry manure) storage facilities.
Section C: FYM Storage Facility Weighting multiplier between sections
1.5
Weighting multiplier within the
section
Risk Score
1 What Condition are the FYM Stores?
Good 0
Average 20
Poor 100
3 What condition is the seepage storage condition?
Good 0
Average 20
Poor 75
None Present 100
The following algorithm is used to calculate the overall risk score for a farmyard:
(WMSA/(∑WM)) * [((WSAQ1/(∑IWMSA))*SAQ1RISKSCORE) + ((WSAQ2/(∑IWMSA))*SAQ2RISKSCORE) +
((WSAQ3/(∑IWMSA))*SAQ3RISKSCORE)] + (WMSB/(∑WM)) * [((WSBQ1/(∑IWMSB))*SBQ1RISKSCORE) +
((WSBQ2/((∑IWMSB))*SBQ2RISKSCORE)] + (WMSC/(∑WM)) * [((WSCQ1/((∑IWMSC))*SCQ1RISKSCORE) +
((WSCQ2/(∑IWMSC))*SCQ2RISKSCORE)] + (WMSD/(∑WM)) * [((WSDQ1/(∑IWMSD))*SDQ1RISKSCORE) +
((WSDQ2/(∑IWMSD))*SDQ2RISKSCORE) + ((WSDQ3/(∑IWMSD))*SDQ3RISKSCORE) +
((WSDQ4/(∑IWMSD))*SDQ4RISKSCORE) + ((WSDQ5/(∑IWMSD))*SDQ5RISKSCORE) +
((WSDQ6/(∑IWMSD))*SDQ6RISKSCORE) + ((WSDQ7/(∑IWMSD))*SDQ7RISKSCORE)] + (WMSE/(∑WM)) *
[((WSEQ1/(∑IWMSE))*SEQ1RISKSCORE) + ((WSEQ2/(∑IWMSE))*SEQ2RISKSCORE) +

107
((WSEQ3/(∑IWMSE))*SEQ3RISKSCORE) + ((WSEQ4/(∑IWMSE))*SEQ4RISKSCORE) +
((WSEQ5/(∑IWMSE))*SEQ5RISKSCORE) + ((WSEQ6/(∑IWMSE))*SEQ6RISKSCORE)]
Where ∑WM = The sum of Inter-Section Weighting Multipliers.
And WMSA = Inter-Section A Weighting Multiplier.
And WMSB = Inter-Section B Weighting Multiplier.
And WMSC = Inter-Section C Weighting Multiplier.
And WMSD = Inter-Section D Weighting Multiplier.
And WMSE = Inter-Section E Weighting Multiplier.
Table 48. Section D of Farmyard Risk Assessment Scheme (FRAS) addressing risks associated with silage storage facilities.
Section D: Silage Storage Facility
Weighting multiplier between sections
2
Weighting multiplier within the
section
Risk Score
2 Does the pit have a concrete base?
Yes 5
No 100
1 Does the pit have a sealed concrete base?
Yes 0
No 100
1 Is the silage pit roofed? Yes 0
No 100
3 What is the overall condition of the silage pit?
Good 0
Average 20
Poor 100
4 What is the condition of the effluent collection system?
Good 0
Average 20
Poor 75
None Present 100
1 Are there silage bales on the farmyard?
Yes 100
No 0
1 Are the silage bales made from wilted grass
Yes 0
No 100

108
Where ∑IWMSA = The sum of Section A Intra-Section Weighting Multipliers.
And ∑IWMSB = The sum of Section B Intra-Section Weighting Multipliers.
And ∑IWMSC = The sum of Section C Intra-Section Weighting Multipliers.
And ∑IWMSD = The sum of Section D Intra-Section Weighting Multipliers.
And ∑IWMSE = The sum of Section E Intra-Section Weighting Multipliers.
Table 49. Section E of Farmyard Risk Assessment Scheme (FRAS) addressing risks associated with dirty water storage facilities.
Section E: Dirty Water Storage Facility
Weighting multiplier between sections
3
Risk Score
3 What is the condition of the parlour washings and collecting yard dirty water storage?
Good 0
Average 20
Poor 75
None Present 100
2 What is the condition of the dirty yard water storage?
Good 0
Average 20
Poor 75
None Present 100
4 What is the condition of the complete dirty water storage? (includes Parlour & Collecting Yard & Dirty Yard Water)
Good 0
Average 20
Poor 75
None Present 100
1 How is clean water managed?
Diverted to watercourse/drain
0
Diverted to storage tank 20
Diverted to a Soak Pit. 0
Not diverted or stored 100
1 What is the condition of the guttering and drainage?
Good 0
Average 20
Poor 75
None Present 100

109
In the farmyard ranking scheme proposed by Magette (1998) a condition termed a “fatal flaw” was used to
highlight farmyards exhibiting a serious deficiency that would surely result in losses of pollutants (e.g., a
leaking manure storage tank). In the FRAS, a similar “failsafe” mechanism has been incorporated to assure
that farmyards with inadequate manure storage capacity are identified as high risk. This is done by
automatically adding a high risk score to the above calculation for any farm without adequate manure
storage capacity.
As with the farmyard ranking scheme proposed by Magette (1998) the FRAS requires qualitative judgements
to be made by an evaluator assessing each farmyard. For example in Table 49, which concerns the dirty
water management element of a farmyard, an evaluator must decide whether the storage facility itself is
“good”, “average”, “poor” or “non-existent”. Of the four possible ratings, perhaps only the last is clear cut.
Magette (1998) urged, therefore, that farmyard assessments should only be conducted by trained personnel
who were familiar with both farm management and environmental protection. Sound as it is, even this
advice may be inadequate, according to some of the returns from the Teagasc farm facilities survey. The
survey had several internal checks for consistency of answers and unfortunately, the inconsistencies among
several key answers were rather large. This may have been an indication that the survey was poorly worded
and confusing, that evaluators had not received enough training in what to look for on farms, or that data and
measurements were not provided by farmers or did not exist. Whatever the reason, however, the number of
incorrect / inconsistent answers in the survey limited its usefulness for this research on the one hand, and on
the other hand highlighted how difficult it may be for trained evaluators to rate the pollution risks posed by
farmyards.
Thus, while the FRAS described by Tables 45 through 49 was designed to be logical, simple, straightforward
and intuitive, the absence of measured data on nutrient losses from farmyards made it impossible to actually
verify the scheme. There were no data available to the research team concerning the measured losses of P
and N leaving farmyards relative to the various elements included in the FRAS. Nor was it possible to
extrapolate what effect the surveyed farmyards might have had on nearby in-stream water quality because
the physical locations of the surveyed farms were not revealed in the survey due to data protection
constraints. In short, there were no benchmarks against which to compare risk scores arising from
application of the FRAS, and the validity of the scheme remains untested.
Given such difficulties as those just described with FRAS (and similar farmyard assessment strategies), an
even simpler evaluation tool may be worth considering, at least as a screening procedure. For such a tool, it
is considered that the single measure of manure storage capacity relative to manure production would be an
easy and unequivocal assessment that requires no qualitative judgements. Indeed, this simple measure has
been used elsewhere as a means to prioritise assistance for pollution control. While the capacity of manure
storage does not encompass the many pollution sources around a farmyard, as FRAS does, it would lend
significant insight into the fundamental polluting potential of farmyards.

110
4 CONCLUSIONS
This project successfully accomplished all of its objectives, save for the validation of a farmyard ranking
system. Although it may sound like the classic scientist’s lament to say that a lack of appropriate data
severely constrained the conduct of this research, it is in fact true that the dearth of small-scale data on
water quality and land / farm management precluded more rigorous analyses in this research. Nevertheless,
the results of this research support the following conclusions.
4.1 Field PRS Evaluation
Results from this evaluation indicated that the Field PRS has the potential to identify critical source areas for
P loss in catchments, although the data available for evaluation were very limited. Features incorporated
into the Field PRS improved on the assessment capability of the original PRS proposed by Magette (1998)
for field scale application. Data for assigning risk levels to individual factors in the Field PRS should be
readily available from farm records and/or field site evaluations. However, as more data become available,
further modifications of the Field PRS could potentially improve the assessment capability of this ranking
scheme.
4.2 Performance of PRS at Catchment Scale
Although it is important to acknowledge problems (in terms of data availability) with the PRS proposed by
Magette (1998), the PRS rank scores from this scheme were positively correlated with median in-stream
MRP associated with 31 catchments in Ireland. Unfortunately, the PRS did not discriminate well among sites
scored as having a “medium” propensity for losing and transporting P. This suggests that the scale used in
the PRS for assigning qualitative indicators needs additional modification.
4.3 Catchment PRS
In the modification of the PRS called “Catchment PRS”, elimination of the overland flow distance, P
application time and field P usage rate did not diminish (relative to PRS) the accuracy of assessed P loss
based on comparisons with measured in-stream MRP, but improved the practical application of this ranking
scheme. As more data on Irish catchments become available with respect to land and nutrient use
characteristics and in-stream P, modification of the Catchment PRS (or the original PRS) may improve the
overall ability of these ranking schemes to predict P loss risk.
The use of other parameters for water quality (not just in-stream MRP) as benchmarks may also improve the
performance of risk ranking schemes. Magette (2002) used median in-stream MRP concentration as well as
mass P export rates to evaluate the original PRS on the Bellsgrove catchments. As for the Dripsey-D1
catchment, Magette (2002) found that risk rankings benchmarked against these two water quality
parameters did not always correspond. If more detailed stream P status data were available, further
evaluations of the Catchment PRS using additional measures of P loss and water quality would be valuable.
4.4 The modified PRS (mPRS)
Using measured edge-of-field P losses as the benchmark, the mPRS was very successful in assessing the
risk of P loss to water from the study sites in Hillsborough, NI. However, it is important to note that for a

111
number of factors there was no difference in value between the different plots, i.e., each of the plots had the
same “runoff risk” as they are all categorised as the same soil type. Thus, whilst this testing confirmed
mPRS to be a successful site assessment tool, further testing will be required at a range of different sites
which have much more variability in their characteristics.
In general, this research indicated that the mPRS is an effective tool in assessing the risk posed at field level
to surface waters, but it also indicated that there may be issues relating to varying hydrology at different sites
that are not being represented by the mRPS. It is true to say that the number of fields available for
assessment in Ireland is very low, and as a result it is necessary for further field testing to occur over a larger
number of fields representing varying soil types, P management regimes, hydrological conditions and
meteorological conditions in order to fully assess the usefulness of the mPRS.
Other conclusions related to the modified PRS (mPRS) are:
• Detailed testing of the mPRS at the catchment scale has identified that it is a useful tool for
identifying elevated risk of P loss occurring, particularly when combined with “catchment scale”
factors including, catchment area and CORINE land cover data.
• The use of optimised factor weightings improved the performance of the mPRS across two
catchments.
• From the datasets available for testing, it appears that the correlation of mPRS rank scores with in-
stream water quality data is inversely proportional to the distance of fields from a stream,
emphasising the importance of the riparian zone in influencing surface water quality (Sections
3.8.1.1 and 3.8.2.1).
• Further field testing of mPRS over a larger number of fields representing varying soil types, P
management regimes, hydrological conditions and meteorological conditions would improve the
confidence level in the use of the mPRS.
• Even in catchments where intensive data collection was undertaken in previous studies, there are
considerable gaps in data needed to calculate the mPRS (as well as the PRS, Field PRS, and
Catchment PRS). This fact makes it imperative that datasets be rectified if the PRS is to be
successfully implemented in Ireland.
• Due to the need for spatially based data in implementing a PRS, there would be great advantages
in the use of GIS for this purpose. As shown in the development of mPRS, GIS technology allows
for effective organising input data for mPRS as well as for presentation of the results of the mPRS
assessment. This is particularly true when considering catchment areas. GIS is also a very useful
tool for applying the factor ratings and the development of a PRS score to field areas across a
catchment area.
• Compared to other countries in which PRS are being developed (e.g., USA, Australia) the amount
of field-scale land management data coupled with contemporaneous edge-of-field water quality, or
even in-stream water quality data, is minimal. The lack of these data was an impediment to the
development of all the PRS in this research.
In summary, the results from this part of the research project provide a valid method by which to assess, a
priori, the relative risk, or potential, for P to be lost from field sized areas of grassland in Ireland and
transported to receiving waters. Through the use of the methodology developed in this research, areas
within catchments that pose particularly high risks in terms of P loss and transport can be identified and
targeted with focused intervention efforts. Likewise, agricultural advisers can use the technique to identify

112
specific fields to which particular attention in terms of nutrient management planning should be given. Both
uses of these research results will ultimately lead to better environmental quality by reducing the loss of P
from the landscape to surface water.
4.5 Conclusions Regarding the Modified Nitrogen Ranking Scheme, mNRS
The mNRS was assessed using a limited dataset. However, the very detailed nature and high quality of the
dataset allowed a reasonable assessment of many aspects of the mNRS, such as the nature of nitrogen
applications to the fields (as slurry, artificial fertiliser, dirty water and animal deposited applications) and to
attempt to assess which applications are important in terms of applying the mNRS. Another important
aspect of this dataset is that it spanned a two-year period and as such allowed for the temporal variation in
nitrate concentrations to be observed, thereby providing a further opportunity to test the ability of the mNRS
to identify the risk of nitrate loss to groundwater.
Considering the very complex set of interactions that govern the loss of nitrates to groundwater from
agricultural sources it is considered that the mNRS functioned well. However, temporal variations in ground
water quality, supposedly due to differences in annual rainfall, existed that the mNRS was not be able to
consider. This is an issue for all simplified ranking procedures and can only addressed through the use of
long term contemporaneous databases of water quality (including ground water) and land management for
development and testing. Unfortunately, these databases do not exist in Ireland.
The testing of the mNRS also highlights the importance of considering all N applications, and not just the
fertiliser applications, when assessing the risk of nitrate leaching. Dirty water applications seem to be
particularly important, for when they are removed from the mNRS, the correlation between mNRS scores
and groundwater quality becomes much weaker.
Finally, it is also important to consider the land area which impacts on groundwater quality when assessing
correlations between land management and groundwater quality. At Curtin’s Farm a mNRS score (Scenario
B) representing agricultural fields within 100m of a borehole were better correlated to groundwater quality
than were scores from fields in which the boreholes were located. A wider assessment of the mNRS over a
range of hydrogeological conditions would be required to fully ascertain if this relationship holds for other
areas.
4.6 Conclusions Regarding Development and Testing of Catchment Scale Screening
Tool
It is usually problematic and inefficient to introduce other than the most basic nutrient management
strategies over large catchments, such as those of Loughs Conn and Mask. If catchment scale (or larger)
datasets could be used to identify “hotspots” within large catchment areas, or indeed to discriminate among
sub-catchments in regard to the risk of nutrient loss, then the use of mPRS in these key areas would
facilitate the identification of problems at a finer scale, thus leading to more effective management of such
losses.
Three of the four datasets used in this research showed potential to identify phosphorus “hotspots” as
evidenced by the correlation between them and in-stream TP concentrations. The CORINE land use

113
dataset, Soil P Desorption dataset, and Soil Drainage Characteristics datasets were well correlated with
average annual in-stream TP concentrations in the 16 catchment areas assessed in this study. While no
effective correlations were evident between the Soil Test Phosphorus dataset and in-stream TP
concentrations, this is believed to reflect the lack of spatial detail in the dataset rather than the absence of a
relationship between the two parameters.
Among the four factors evaluated, the CORINE 2 land class factor, encompassing, inter alia, the proportion
of a catchment devoted to more intensive farming, was the factor most strongly correlated with the TP
concentrations occurring in the catchment streams (R2=0.75). When the three best fit factors (CORINE land
use, Soil P Desorption and Soil Drainage) were combined into an algorithm that might serve as a “screening
tool” by which to identify areas based on their potential to lose and transport P to surface water, the resultant
correlations with in-stream TP concentrations were also good (R2=0.61). However, it is considered that the
use of the “CORINE 2’ factor alone would be the most effective method of screening catchments for the
identification of phosphorus loss “hotspots”.
In addition to the identification of factors which can be effective in “screening” large scale catchments for risk
to water from phosphorus loss, the research undertaken here highlighted the importance of “temporal
variation” in terms of phosphorus losses, with the period from September – March being identified as the
most significant period in terms of phosphorus loss risk. It has also been shown that at scale of catchments
examined in this study, the whole catchment approach to identifying risk of phosphorus loss is more effective
than using “partial catchment” areas in close proximity to the riparian zone.
4.7 Conclusions Regarding the Identification of Farmyard Pollution Potential
As with diffuse pollution sources, the potential for point sources such as farmyards to contribute polluting
materials to water is controlled by a variety of interacting factors. Among these are the structural integrity
and capacity of storage structures and the associated appurtenances that convey polluting materials, the
proximity of farmyards to water resources, and the managerial expertise of farm managers. Through this
research a comprehensive farmyard risk assessment scheme (FRAS) was developed that can integrate the
various factors affecting the polluting potential of farmyards and yield a single score with which relative
comparisons among a variety of farmyards can be made. While the FRAS encompasses the best
professional judgement of practitioners in the fields of agricultural and environmental management, a lack of
measured data concerning, inter alia, P and N transport from a variety of farmyards prevented the validity of
FRAS to be tested.
4.8 General Conclusions About Simplified Approaches to Pollution Risk
Identification This research formed an important element of a comprehensive study of mechanisms by which to assess, a
priori, the transport of P (and for this project, N) from land to water (see 2000-LS-2.2-M2, Appendix A).
Although the alternative strategies investigated as part of 2000-LS-2.2-M2 share a similar purpose, it would
be erroneous to compare them by the same criteria and to expect all to produce similar guidance. The
techniques investigated in the research reported herein are at the less complex end of the continuum from
simple to complex pollution assessment approaches. It is important to emphasise that these simplified
techniques, which are essentially multi-criteria ranking procedures, are not intended to yield quantifiable
predictions of P or N loss and transport. Instead, these procedures endeavour to simplify what are in reality
very complex interrelationships about the natural environment in an attempt to facilitate managerial

114
decisions. Such decisions may take a variety of forms (such as where to target specialist environmental
management programmes or what nutrient management strategies to undertake), but all are facilitated by a
rational mechanism that can facilitate relative comparisons. Fundamentally, this is the intended use of the
techniques investigated in this research.
As rational methods by which to make relative comparisons, the principal outputs from this research (Field
PRS, Catchment PRS, mPRS, mNRS and the catchment screening tool) have each been tested against the
best sets of measured data that are available in Ireland and have been shown to provide valid decision
criteria. While not validated, it is believed that the farmyard risk assessment scheme, FRAS, also can
produce defensible comparisons of farmyard pollution potential.

115
5 RECOMMENDATIONS
1. As the development, testing and validation of predictive risk assessment techniques (even relatively
simple approaches investigated in this research) is constrained by the quality of appropriate
datasets, an integrated programme of land use activity monitoring, edge-of-field water quality
monitoring, and simultaneous in-stream water quality monitoring should be implemented on as
widespread a scale as possible, but at least to allow coverage in Ireland’s major agri-hydrological
regions. Such an environmental monitoring approach would facilitate the development of
procedures such as mPRS, mNRS and FRAS and enhance the confidence in implementing same.
The need for monitoring of farmyards for pollutant losses is particularly acute.
2. Because land use (including farmyards) monitoring involves issues of privacy associated with
private property, mechanisms need to be enacted by Government / Local Authorities to (a)
indemnify participating landowners from prosecution for environmental offences (if, indeed any are
identified) and / or (b) reimburse landowners financially or use other incentives to encourage them
to participate in the data collection programmes that would be necessary for a simultaneous land
use and water quality monitoring programme to be successful.
3. The mPRS and catchment screening procedures should be implemented, perhaps on a trial basis
and possibly via a GIS, in a selected number of river basin districts as a tool to assist in catchment
water quality management planning .Despite the prudence of further testing of the mPRS and
mNRS (and FRAS) with more extensive datasets, these procedures should be implemented in their
present formats where datasets are available to provide rational, relative measures of the likelihood
that N and P will be lost from the landscape and transported to receiving waters.
4. A concerted research programme should be undertaken, possibly using rainfall simulation, to
develop appropriate field-scale management strategies to correspond with particular mPRS, mNRS
and FRAS rank scores.

116
6 REFERENCES
Ahuja, L.R., Hanson, J.D., Rojas, K.W., and Shaffer, M.J., 2000. Model overview. In: L.R. Ahuja, K.W.
Rojas, J.D. Hanson, M.J. Shafer, and L. Ma (eds.) Root Zone Water Quality Model: Modeling Management
Effects on Water Quality and Crop Production. Water Resources. Publications, LLC, Highlands Ranch,
Colorado, USA. pp1-12.
Aller, L., Bennet, T., Lehr, J.H. and Petty, R.J., 1987. DRASTIC: A Standardized System for Evaluating
Groundwater Pollution Potential Using Hydrogeologic Settings. U.S. EPA Report 600/2-85/018,
Environmental Protection Agency, Washington, DC, USA.
Anonymous, 1999. Ground Water Protection Scheme for Ireland. Geological Survey of Ireland, Dublin,
Ireland.
Anonymous. 2001. Nitrogen and Phosphorus Risk Assessment Procedures. IN: Field Office Technical
Guide. USDA-Natural Resources Conservation Service, Akron, Ohio, USA. 10 pp.
Bartley, P., 2003. Nitrate Responses in Groundwater under Grassland Dairy Agriculture. PhD Thesis,
Department of Civil Structural and Environmental Engineering, University of Dublin, Trinity College Dublin,
Dublin 2, Ireland.
Bechmann, M. E., Krogstad, T. and Sharpley, A.N., 2005. A phosphorus index for Norway, Acta Agriculturae
Scandinavica, Section Soil and Plant Sci. 55(3): 205-213.
Beegle, D.B., 1999. Soil Fertility Management. In: Serotkin, N. and Tibbetts, S. (eds) The Agronomy Guide
1999–2000, Pennsylvania State University, Publications Distribution Centre, University Park,
Pennsylvania, USA. pp. 19–46.
Birr, A.S. and Mulla, D.J., 2001. Evaluation of the Phosphorus Index in watersheds at the catchment scale. J.
Environ. Qual. 30(6): 2018-2025.
Bowman, J., Clabby, K., Lucey, J., McGarrigle, M., and Toner, P., 1996. Water Quality in Ireland: 1991-
1994. Environmental Protection Agency, Wexford, Ireland.
Bradbury, N.J., Whitmore, A.P., and Hart, P.B.S., 1993. Modelling the fate of nitrogen in crop and soil in the
years following application of 15
N-labelled fertilizer to winter wheat. J. Agr. Sci. 121: 363–379.
Ceplecha, Z.L., Waskom, R.M., Bauder, T.A., Sharkoff, J.L. And Khosla, R., 2004. Vulnerability
Assessments of Colorado Ground Water to Nitrate Contamination. Water Air Soil Poll. 159(1): 373-394.
Coale, F.J., Sims, J.T. and Layton, A.B., 2002. Accelerated Deployment of an Agricultural Nutrient
Management Tool; The Maryland Phosphorus Site Index. J. Environ. Qual. 31:1471-1476.

117
Council of the European Communities, 2000. Directive 2000/60/EC of October 2000, establishing a
framework for community action in the field of water policy. Official Journal of the European
Communities L327/1 2000.
Czymmek, K.J., Ketterings, Q.M., Geohring, L.D. and Albrecht, G L., 2003. The New York Phosphorus
Runoff Index. Cornell University, Ithaca, NY 14853, New York.
Daly, K., 2000. Phosphorus desorption from Irish Soils. In: Quantification of Phosphorus Loss from Soil to
Water: Final Report and Literature Review. Environmental Protection Agency. Johnstown Castle, Co.
Wexford, Ireland.
Daly, K. and Styles, D., 2005. Eutrophication from Agricultural Sources: Phosphorus Chemistry of Mineral
and Peat Soils in Ireland (2000-LS2.1.1b-M2) Final Report. Environmental Protection Agency,
Johnstown Castle, Co. Wexford, Ireland.
Daly, K., 2006. Eutrophication from Agricultural Sources: Models and Risk Assessment Schemes for
Predicting Phosphorus Loss to Water (2000-LS2.2.2-M2) Final Report. Environmental Protection
Agency, Johnstown Castle, Co. Wexford, Ireland.
Daniel, T. C., Joleka, W. E., Moore, Jr., P. A., Sharpley, A. N., and Gburek, W. J., 2002. The Phosphorus
Index: Background and Status. National Center for Animal Manure Management, North Carolina
State University, Raleigh, North Carolina, USA.
DeLaune, P.B., Moore, P.A, Carman, D.E, Sharpley, A.N, Haggard, B.E. and Daniel, T.C., 2004. Evaluation
of the phosphorus source component in the phosphorus index for pastures. J. Environ. Qual. 33:
2192-2200.
Delgado, J.A., Khosla, R., Bausch, W.C., Westfll, D., Inman, D., 2006. Nitrogen fertilizer management based
on site-specific management zones reduce potential for NO3-n leaching. J. Soil and Water Cons.
Soc. 60:402-410
Djodjic, F., Montas, H., Shirmohammadi, A., Bergström, L., and Ulén, B., 2002. A decision support system
for phosphorus management at a watershed scale. J. Environ. Qual. 31; 937-945.
Dougherty, W J., Flemming, N K., Cox, J W., Chittleborough, D J., 2004. Phosphorus transfer in surface
runoff from intensive pasture systems at various scales: A Review. J. Environ Qual. 33: 1973-1988.
Eghball, B., and Gilley, J.E., 2001. Phosphorus Risk Assessment Index Evaluation using Runoff
Measurements. J. Soil Water Conserv. 56(3) 202-206.
EPA. 2004. Ireland’s Environment 2004. Environmental Protection Agency, Wexford, Ireland.
Fritch, T.G., McKnight, C.L., Yelderman, J.C., Arnold, J.G., 2000. Environmental Auditing: An aquifer
Vulnerability Assessment of the Paluxy Aquifer, Central Texas, USA, using GIS and a Modified DRASTIC
Approach. J. Environ. Manage. 25(3): 337-345.

118
Gardiner, M. and Radford, T., 1980. Soil Associations of Ireland and Their Land Use Potential. National Soil
Survey of Ireland, An Foras Taluntais, Dublin, Ireland.
Gburek, W. J, Sharpley, A.N., Heathwaite, L.and Folmar, G.J., 2000. Phosphorus Management at the
Watershed Scale: A Modification of the Phosphorus Index., J. Environ Qual. 29(1): 130-144.
Harmel, R.D., Torbert, H.A., De Laune, P.B., Haggard, B.E. and Haney, R.L., 2005. Field Evaluation of the
Three Phosphorus Iindices on New Application Sites in Texas. J. Soil Water conserv. 60(1): 29-41.
Hart, M.R., Quinn, B.F. and Nguyen, M.L., 2004. Phosphorus Runoff from Agricultural Land and Direct
Fertilizer Effects: A Review. J. Environ. Qual. 33: 1954-1972.
Haygarth, P.M, Wood F.L., Heathwaite, A.L. and Butler, P. J., 2005. Phosphorus Dynamics Observed
Through Increasing Scales in a Nested Headwater-to-River Channel Study. Sci. Total Environ. 344:
83-106.
Heathwaite, L., Sharpley, A. and Gburek W., 2000. A Conceptual Model for Integrating Phosphorus and
Nitrogen Management at Watershed Scales. J. Environ. Qual. 29: 158-166.
Heckrath, G., 1995. Phosphorus Leaching from Soils Containing Different Phosphorus Concentrations in the
Broadbalk Experiment. J. Environ. Qual. 24: 904-910.
Hubbard, R.K., Magette, W.L, and Sheridan J.M., 2001. Application of a Watershed Scale Ranking Scheme
for Evaluating Impacts of AFOs on Water Quality. In: Proceedings of the 2001 Georgia Water
Resources Conference, March 26-27, 2001, University of Georgia, Athens, Georgia, USA. pp 682-
685.
Hughes, K. 2004. Evaluation of the Magette Phosphorus Ranking Scheme: a Risk Assessment Tool for
Ireland. MEngSc Thesis, Department of Biosystems Engineering, University College Dublin, Dublin,
Ireland. 184 pp.
Irvine, K., Boelens, R., Fitzsimmons, J., Kemp, A. and Johnston, P., 2005a. Review of Monitoring and
Research to Meet the Needs of the Water Framework Directive (2000-DS-5-M1). Environmental
Protection Agency, Johnstown Castle, Co. Wexford, Ireland.
Irvine, K., Mills, P., Bruen, M., Walley, W., Hartnett, M., Black, A., Tynan, S., Duck, R., Bragg, O., Rowan, J.,
Wilson, J., Johnston, P., and O’Toole, C. 2005b. Water Framework Directive: An Assessment of
Mathematical Modelling in its Implementation in Ireland (2002-W-DS-11). Environmental Protection
Agency, Johnstown Castle, Co. Wexford, Ireland.
Johnsson, H., Bergstrom, L., Jansson, P.E., & Paustian, K., 1987. Simulation of Nitrogen Dynamics and
Losses in a Layered Agricultural Soil. Agriculture, Ecosystems & Environment 18: 333–356.

119
Keane, T., 1992. Irish Farming, Weather and Environment. Joint Working Group on Applied Agricultural
Meterology, MetEireann, Dublin, Ireland.
Kirk McClure Morton., 2001. Lough Derg and Lough Ree Catchment Monitoring and Management System:
Final Report. Elmwood House, 74 Boucher Road. Belfast, BT12 6RZ, UK, 223 pp.
Kurz, I., 2000. Phosphorus Exports from Agricultural Grassland with Overland Flow and Drainage Water
(Johnstown Castle). In: Quantification of Phosphorus Loss from Soil to Water: Final Report and
Literature Review. Environmental Protection Agency, Johnstown Castle, Co. Wexford, Ireland.
Kurz, I., 2002. Phosphorus Export from Agricultural Grassland with Overland Flow and Surface Drainage
Water. Ph.D. Thesis, Trinity College Dublin, Ireland.
Kurz, I., Coxon, C., Tunney, H. and Ryan, D., 2005. Effects of Grassland Management Practices and
Environmental Conditions on Nutrient Concentrations in Overland Flow. J. Hydrol. 304: 35-50.
Lemunyon, J.L. and Gilbert R.L., 1993. The Concept and Need for a Phosphorus Assessment Tool. J. Prod.
Agric. 6: 483-486.
Leonard, R.A., Knisel, W.G., and Still, D.A., 1987. GLEAMS: Groundwater Loading Effects of Agricultural
Management Systems. T. ASAE, 30(5):1403-1418.
Magette, W.L., R.B. Brinsfield, R.E. Palmer, and J.D. Wood. 1989. Nutrient and sediment removal by
vegetated filter strips. Trans. ASAE 32:663–667.
Magette, W., Weismiller, R., Lessley, B., Wood, J. and Miller, C., 1990. Demonstration of agricultural best
management practice implementation and impacts on a commercial farm. Applied Engineering in Agriculture
6(1):45-52.
Magette, W.L., 1998. Factors affecting losses of nutrients from agricultural systems and delivery to water
resources. In: O.T. Carton (ed.) Draft Guidelines for Nutrient Use in Intensive Agricultural Enterprises,
Teagasc, Johnstown Castle Research and Development Centre, Wexford, Ireland, pp. 6-31.
Magette, W.L. 2002. Identifying Diffuse Pollution Sources using Multicriteria Analysis. In: Proceedings of the
2002 ASAE Annual International Meeting. Paper Number: 022210. Chicago, Illinois, July 28-31, 2002.
Mallarino, A.P., Stewart, J.L., Baker, J.D., Downing, J.D. and Sawyer, J.E., 2002. Phosphorus Indexing for
Cropland: Overview and Basic Concepts of the Iowa Phosphorus Index. J. Soil Water Conserv,
57(6): 440-447.
McGarrigle, M L., and Champ, W S T., 1999. Keeping pristine lakes clean, Loughs Conn and Mask, Western
Ireland. Hydrobiologia, 395/396: 455-469.
McGarrigle, M.I., 2001. Eutrophication of Irish Waters-From Science to Legislation and Management. Went
Memorial lecture, Occasional papers in Irish science & Technology, 24: 1-18.

120
McGeechan, M.B., Topp, C.F.E., 2004. Modelling Environmental Iimpacts of Deposition of Excreted Nitrogen
by Grazing Dairy Cows. Agriculture Ecosystems & Environment 103(1): 149-164.
MCOS, 2002. Three Rivers Project: Final Report. M.C. O’Sullivan Consulting Engineers, Dun Laoghaire, Co.
Dublin, Ireland. (Now part of RPS Ireland)
Melland, A.R., Gourley, C.J.P., Smith, A.P., Tarbotton, I.S.and Peverill, K.I., 2004. Developing a Farm
Nutrient Loss Index for Grazed Pastures in Australia. Supersoil 2004, 3rd
Australian New Zealand
Soils Conference, 5-9 December 2004, University of Sydney, NSW, Australia.
Morgan, G., Xie, Q, and Devins, M., 2000. Small Catchments – NMP (Dripsey)-Water Quality Aspects. In:
Quantification of Phosphorus Loss from Soil to Water: Final Report and Literature Review.
Environmental Protection Agency. Johnstown Castle, Co. Wexford, Ireland.
Nasr, A. E. and Bruen, M. 2005. Eutrophication from Agricultural Sources: A Comparison of SWAT, HSPF
and SHETRAN/GOPC Phosphorus Models for Three Irish Catchments. (2000-LS2.2.2-M2) Final
Report. Environmental Protection Agency, Johnstown Castle, Co. Wexford, Ireland.
Navuler, K. and Engel, B., 1998. Predicting Spatial Distributions of Vulnerability of Indiana State Aquifer
Systems to Nitrate Leaching using a GIS. Agricultural and Biological Engineering Department,
Perdue University, West Lafayette, Indiana, USA.
Nolan, B.T., Ruddy, B.C., Hitt, K.J., and Helsel, D.R., 1997. Risk of Nitrate in Groundwaters of the United
States—A National Perspective. Environmental Science and Technology. 31: 2229-2236.
OMAFRA, 2003. Nutrient Management Workbook, Section 15: Nitrogen Index. Available at:
http://www.omafra.gov.on.ca/english/nm/ar/workbook/workbk3o.htm (accessed January 2007).
Parton, W.J., McKeown, B., Kirchner, V., and Ojima, D.S., 1992. CENTURY Users Manual. Colorado State
University, NREL Publication, Fort Collins, Colorado, USA.
Pierce, F.J., Shaffer, M.J., and Halvorson, A.D., Screening Procedure for Estimating Potentially Leachable
Nitrate-Nitrogen Below the Root Zone, 1991., In Managing Nitrogen For Groundwater Quality and Farm
Profitability. Follet, R.F., Keeney, D.R., Cruse, R.M. (Eds:) Soil Science of America, Inc. Madison,
Wisconsin, USA.
Pionke, H.B., Gburek, W.J., Sharpley, A.N. and Schnabel, R.R., 1996. Flow and Nutrient Export Patterns for
an Agricultural Hinterland Watershed. Water Resour. Res., 32 (6): 1795-1804.
Pionke, H.B., Gburek, W.J., Sharpley, A.N, and Zollweg, J.A.., 1997. Hydrological and Chemical Controls on
a Phosphorus Loss from Catchments. In: Phosphorus Loss from Soil to Water. H. Tunney, et al.
(eds), Center for Agriculture and Biosciences International, Oxon, England. pp 225-242.

121
Pionke, H.B, Gburek, W.J, Sharply, A.N., 2000. Critical Source Area Controls on Water Quality in an
Agriculture Watershed Located in the Chesapeake Basin. Ecol Eng, 14: 325-335.
Poiani, K.A., Bedford, B.L., and Merrill, M.D., 1996. A GIS-Based Index for Relating Landscape
Characteristics to Potential Nitrogen Leaching to Wetlands. Landscape Ecol. 11 (4): 237-255.
Provolo, G. and Riva, E., 2003. Agricultural Diffuse Pollution Management Strategies in Lombardy (Italy). In:
M. Bruen (ed), Proceedings 2003 IAWS Diffuse Pollution Conference, University College Dublin, Dublin,
!reland.
Provolo, G., 2005. Manure Management Practices in Lombardy (Italy). Bioresource Technol. 96:145-152.
Richards, K., Ryan, M. and Coxon, C., 1998. Leaching of N Compounds from Swards Used for Dairying that
are N-Based and Irrigated with Dirty Water/Slurry. Johnstown Castle Research Centre, Co. Wexford.
SAS (Statistical Analysis System), 1985. SAS User’s Guide: Statistics 5th
Ed. SAS Institute, Cary, North
Carolina, USA.
Shaffer, M.J., Halvorson, A.D., and Pierce, F.J., 1991. Nitrate Leaching and Economic Analysis Package
(NLEAP): Model Description and Application. In. Follett, R.F., (ed.) Managing Nitrogen for Groundwater
Quality and Farm Profitability. SSSA, Madison, WI, USA. pp. 285–322.
Shaffer, M.J., and Delgado, J.A., 2002. Essentials of a National Nitrate Leaching Index. J. Soil Water
Conserv. 57 (6). 327-335
Sharpley, A. N., T.C. Daniel and D.R. Edwards. 1993. Phosphorus movement in the landscape. J. Prod.
Agric., 6(4): 492-500.
Sharpley, A. N., 1995. Identifying Sites Vulnerable to Phosphorus Loss in Agricultural Runoff. J. Environ.
Qual. 24: 947-951.
Sharpley, A.N. and Rekolainen, S., 1997. Phosphorus in Agriculture and its Environmental Implications. In:
H. Tunney, et al. (eds.) Phosphorus Loss from Soil to Water, Center for Agriculture and Biosciences
International, Oxon, England, pp 1-54.
Sharpley, A.N., McDowell, R., Weld, J. and Kleinman, P., 2001. Assessing Site Vulnerability to Phosphorus
Loss in an Agricultural Watershed. J. Environ. Qual. 30: 2026-2036.
Sharpley, A.N., J.L. Weld, D.B. Beegle, P.J. A. Kleinman, W.L. Gburek, P.A. Moore, Jr., and G. Mullins,
2003. Development of phosphorus indices for nutrient management planning strategies in the U.S. J.
Soil Water Conserv., 58:137-152.
Skaggs, R. W., Hardjoamidjojo, S. Wiser, E. H. and Hiler, E. A., 1982. Simulation of crop response to surface
and subsurface drainage systems. Transactions of the ASAE. Vol. 25(6): 1673-1678.

122
Toner, P. F., Clabby, K.J., Bowman, J.J., McGarrigle, M.I., 1986. Water Quality in Ireland, the Current
Postion Part One: General Assessment. An Foras Forbartha. Water Resources Division, Dublin,
Ireland.
Toner, P., Bowman, J., Clabby, K., Lucey, J., McGarrigle, M., Concannon, C., Cleneghan, C., Cunningham,
P., Delaney, J., O Boyle, S., McCarthaigh, M., Craig, M., and Quinn, R., 2005. Water Quality in Ireland,
2001-2003. Environmental Protection Agency, Johnstown Castle, Co. Wexford, Ireland.
USDA-SCS (U.S. Soil Conservation Service), 1986. Technical Release 55: Urban Hydrology for Small
Watersheds. USDA (U.S. Department of Agriculture), Washington, DC, USA.
Watson, C. J., C. Jordan, S. D. Lennox, R. V. Smith and R. W. J. Steen, 2000. Nitrogen in Drainage Water
from Grazed Grassland in Northern Ireland. J. Environmental Quality 29:225-232.
Watson, C.J., R. V. Smith, and D.I. Mathews, 2007. Increase in Phosphorus Losses from Grassland in
Response to Olsen-P Accumulation. J. Environmental Quality (in press).
Weld, J.L., Beegle, D.E., Gburek, W.L, Kleinman, P.J.A, and Sharpley, A.N., 2003. The Pennsylvania
Phosphorus Index: Version 1. Publications Distribution Centre, Pennsylvania State University,
University Park. PA, USA.
Williams, J. R., and Kissell, D.E., 1991. Water Percolation - An Indicator of N Leaching Potential. In: Follet,
R.F., Keeney, D.R., Cruse, R.M. (Eds) Managing Nitrogen For Groundwater Quality and Farm Profitability.
Soil Science of America, Inc. Madison, Wisconsin, USA.
Wolfe, M.L., Pease, J., Zelazny, L., Daniels, L. and Mullins, G., 2005. Virginia Phosphorus Index Version 2.0,
Technical Guide. Department of Biological Systems Engineering, Virginia Polytechnic Institute and
State University, Blacksburg, Virginia, USA.
Working Group on Groundwater, 2005. Verifying the Predictive Risk Assessment Methodology for Mobile
Diffuse Inorganic Pollutants (NO3): Guidance Document No. GW10. Department of Environment,
Heritage and Local Government, Dublin, Ireland.
Zollweg, J.A., Gburek, W.J., Steenhuis, T.S., 1996. SMoRMoD – A GIS Integrated Rainfall-Runoff Model
applied to a Small Northeast U.S. Watershed. Trans. ASAE, 39(4): 1299-1307.

123
APPENDIX A
Specification Document for Large Scale (LS) Projects on Eutrophication
from Agricultural Sources (Nitrogen and Phosphorus)
(Source: Environmental Protection Agency)

124
Environmental RTDI Programme 2000-2006
LARGE-SCALE INTEGRATED PROJECT
Scoping Document
Project Title
Eutrophication from Agriculture Sources
(2000-LS-2-M2)
Introduction
The Environmental RTDI sub-Measure of the Operational Programme for the Productive Sector
(2000-2006) has been allocated indicative funding of £20m by the National Development Plan.
Phase I of the Environmental research programme commenced in the first half of 2000 with a call
for large scale and medium sized projects as well as desk studies and fellowships/bursaries for
postgraduate placements. The aims of the sub-programme are to:
• Contribute to a better environment by delivering applicable and relevant RTDI data
and information based on high quality science and technology.
• Generate data, information and knowledge for improved management of the
environment
• Develop new techniques, methods and systems for measuring, recording and
predicting the quality of the environment.
• Develop practical methods for the integration of environmental considerations into
policies and programmes of the main economic sectors.
RTDI projects supported by this programme must contribute to one or more of the above
objectives. Projects must also contribute to the general objectives of the National
Development Plan (2000-2005).
Background
Successive biological water quality surveys over the last three decades in Ireland have
shown that the percentage of river length classified as unpolluted has dropped
systematically with each survey (1, 2, 3, 4, 5, 6, 7). There has been a corresponding
percentage increase of water classified as slightly or moderately polluted. This pollution
is due to eutrophication or over enrichment with phosphorus (P) and to a lesser extent
nitrogen (N). These nutrients allow growth of algae and weeds thus limiting beneficial
uses of the waters for fisheries, boating, recreation, industry and drinking.
Lake water quality is also generally deteriorating. In the 1995-1997 survey of 120 lakes,
it was found that 35% of the lake area surveyed was eutrophic (7).

125
In all recent surveys, water quality indices (Q values) have been found to be inversely
related to the concentration of soluble P in the water (5, 6, 7). In recognition of this
finding, the Department of the Environment and Local Government published water
quality standards for phosphorus in 1998 (S.I. No. 258 of 1998) and set targets for Local
Authorities to protect waters where existing quality is satisfactory, and to achieve an
improvement of quality where the current condition of the water is unsatisfactory.
This study should supply factual scientific data and recommend appropriate actions
which might be used in the implementation of national policy for reducing nutrient (N and
P) losses from agricultural sources to waterbodies, thus preventing further deterioration
of water quality in Ireland.
Sources of P
EPA and other water quality surveys have attempted to apportion the causes of eutrophic
sites to either sewage treatment works, industrial discharges or agriculture. Agriculture is
regarded as being responsible for almost half of all eutrophic sites, with sewage treatment
works contributing a further 20%. There are remedial measures in progress to reduce the
P discharges from sewage treatment plants in many catchments while the introduction of
Integrated Pollution Control (IPC) Licensing of industries has already reduced P
discharges from this source. It remains that significant improvements should be made in
reducing P inputs from agriculture. While much could be achieved by farmers paying
closer attention to Codes of Good Practice, there is also a need for a better understanding
of the exact sources of agricultural P which reach water and the pathways involved.
Sources of Agricultural P Reaching Water
There is a complicated matrix of possibilities for potential loss of P from agricultural
sources to water at catchment level.
a) In the first instance, “leaky” farmyards may have inadequate storage capacity for
slurry produced during the housing season or alternatively they may have adequate
capacity which is poorly managed (as for example tanks not emptied before the
animals are housed or tanks with excessive rainwater ingress).
b) There can also be discharges from unroofed yard areas where animals excrete wastes
such as at the face of silage clamps. Improper handling of dirty water produced on
dairy farms and silage effluent are also potential P sources. A recent study in the
Dripsey catchment has estimated farmyard P losses at about 30% of all losses from
the studied farm (8). Information is needed on losses from other farms so that accurate
methods of estimating losses from any farm yard can be developed.
c) When slurry has been collected and stored, there is further potential for P loss if it is
spread in advance of heavy rainfall which causes surface runoff. It may also be
spread at rates which are in excess of crop needs or without having regard to the
existing soil P status or on unsuitable lands.
d) Fertiliser spreading presents further potential for P loss especially if it is spread in
advance of heavy rainfall which causes runoff.

126
The relative contributions of all of these potential sources need to be quantified to enable
decisions about suitable remedial actions. These actions may be of a physical or
legislative/regulatory nature.
P Losses from Soils with High Extractable P Content
Up to about 10 years ago it was believed that leakage of P from soils was minimal and
unlikely to be a threat to water quality. There was evidence that P applied in fertilisers
was either taken up by plants or immobilised in soils by sorption on clay minerals or
sesquioxides with little effect on water quality (9). In the late 1980s phosphorus budgets,
which were prepared to compare P inputs and outputs in farming, highlighted the gross
overuse of P fertiliser which had taken place for the previous 20 years with a resultant
build-up of extractable soil P (10). There is now a growing body of evidence that there is
considerable leakage of soil P which is further contributing to eutrophication (11, 12, 13,
14). Recent ERDF funded studies (8) have supported this view but it is generally
accepted that further information is needed especially in relation to P losses from a
number of different soil types, in order to accurately define the relative contribution of P
from this source. Information is also lacking on potential accumulation of P on different
soil types and how this might be affected by both hydrology and soil type.
Route by which P reaches water
There is incomplete information on whether diffuse P reaches water in overland flow, by
subsurface flow or through drains and the relative importance of each route. A thorough
understanding of the hydrology of each experimental site or catchment is necessary in
order to fully interpret the movement of nutrients through soils and in overland flow. It
has been noted in studies in the US that 90% of the annual soluble P export from some
watersheds comes from only 10% of the land during a few relatively heavy storms (15).
This means some areas are particularly susceptible to runoff and it would greatly enhance
catchment management plans if these susceptible areas could be identified.
Soil P Test
In Ireland, soil samples for agronomic fertiliser recommendations, including the
application of phosphorus, are currently taken from a depth of 0-10 cm on grassland.
From an environmental perspective, sampling at shallower depths may need to be
considered so that soil test results more accurately reflect the concentrations of available
P in the uppermost soil layer, the layer from which P loss via overland flow is most likely
to occur. Analytical procedures and soil extractants, developed primarily for agronomic
purposes, may also need to be reviewed to evaluate their relative usefulness for estimating
pollution risk.
Phosphorus Indexing – Risk Assessment
Systems for evaluating the vulnerability of soils to P overland flow have been developed
in the US and have been used with some success (16, 17). The P index ranks transport
and source factors controlling P losses in surface runoff at sites where the risk of P
movement is expected to be higher than that of others. More recently the P indexing
system has been adapted for Irish conditions and shows promise for identifying high-risk

127
situations (18). This risk indexing system needs to be tested at farm and catchment level
to ascertain its effectiveness.
Modelling of P loss from soils
The ultimate tool for catchment managers is to have a model which reliably predicts P
losses in relation to weather, land use, soil type and soil P status. A recent ERDF funded
study (8) used GIS techniques to make a first attempt at developing such a model and was
moderately successful in predicting P losses from 35 sub catchments. Further progress is
needed towards refining this technique so that it can be used reliably for predictive
purposes at national level.
There are three groups of projects in this integrated project, categorised as follows:
1)
Reference Project Title
2000-LS-2.1-M2 Group 2.1 Pathways for Nutrient Loss to Water
with Emphasis on Phosphorous Losses
2000-LS-2.1.1-M2 Project
2.1.1
Soil and Phosphorus
2000-LS-2.1.2-M2 Project 2.1.2 Grazed pastures
2000-LS-2.1.3-M2 Project 2.1.3 Slurry spreading
2000-LS-2.1.4-M2 Project 2.1.4 Fertiliser spreading
2000-LS-2.1.5-M2 Project 2.1.5 Farmyards
2000-LS-2.1.6-M2 Project 2.1.6 Environmental soil P test
2000-LS-2.1.7-M2 Project 2.1.7 Relative eutrophic effects on waterbodies

128
2)
Reference Project Title
2000-LS-2.2-M2 Group 2.2 Models and Risk Assessment Schemes
for Predicting P Loss to Water
2000-LS-2.2.1-M2 Project 2.2.1 Field by field assessment
2000-LS-2.2.2-M2 Project 2.2.2 Modelling P losses from soils
3)
Reference Project Title
2000-LS-2.3-M2 Group 2.3 Effects of Agricultural Practices on
Nitrate Leaching
2000-LS-2.3.1-M2 Project 2.3.1 Effects of agricultural practices on nitrate
leaching
Resources required to carry out the Project
The resources, staff, equipment, facilities, etc. required to carry out the project must be
itemised in the submission. Personnel responsible for management and execution of each
part of the project shall be clearly identified. A project co-ordinator will be appointed to
ensure that there is a constant exchange of information between groups so that all
participants in the project are aware of progress towards the overall aims.
All data gathered during the course of the project shall be compiled either in Excel
spreadsheets or Access databases and submitted to the Agency upon completion of the
project and/or during the project as requested.
Tendering
Proposals are sought for either the complete integrated project or any of its component
groups or projects as listed above. Those applying for the complete package of projects
must be in a position to carry out all of the research and co-ordinate all the elements of
the work. Those applying for elements within the package must be prepared to co-
operate with others working in the rest of the integrated project and with the project
manager.
Proposals may be submitted by single entities or groups of applicants in partnership.
Applications should be made using the Application Form and Guide for Applicants.
Submissions shall include a full description of the project and an outline of the work
programme with milestones and/or significant decision points. Details must be given of
the personnel involved (qualifications and experience) and the outputs for each phase
should be indicated.

129
An estimate of the cost involved in respect of the project description and outputs is
required. Costs should be itemised using headings as provided in the Application Form
(document A1/2000) and following the Guide for Applicants (document A2/2000).
The choice of successful tender will be based on the overall value for money, quality of the
proposal, the balance of expertise in relation to the project tasks, as well as the likely ability of the
proposers to deliver on the objectives of the project.
Meetings Liaison with the EPA and others responsible for the project will be required throughout
the project. Progress meetings will be held on at regular (e.g. 3 monthly intervals) and
may include several project teams. A steering committee will be established for each
group of projects.
Freedom of Information Act
Information supplied to the Environmental Protection Agency may be disclosed in
response to a request under the Freedom of Information Act, 1997. If you consider that
any such information is either confidential or commercially sensitive, you should identify
this information when submitting your tender and specify the reasons for its sensitivity.
The Environmental Protection Agency will consult you about this information before
making a decision on any Freedom of Information request received.
Enquiries
Enquiries regarding the technical content of this scoping document should be addressed to:
Dr Vera Power
Environmental Protection Agency
PO Box 3000
Johnstown Castle Estate
Co. Wexford
Telephone: 053 60600
Fax: 053 60699
Email: [email protected]
Or

130
Mr Martin McGarrigle
Environmental Protection Agency
Regional Inspectorate
Pool Road
Castlebar
Co Mayo
Telephone: 094 21588
Fax: 094 21934
Email: [email protected]
Enquiries concerning the programme and tendering procedure should be addressed to:
Ms Loraine Fegan
Environmental Protection Agency
Regional Inspectorate
St Martins House
Waterloo Road
Dublin 4
Telephone: 01 667 4474
Fax: 01 660 5848
Email: [email protected]

131
Reference Project Title
2000-LS-2.1-M2 Group 2.1 Pathways for Nutrient Loss to Water
with Emphasis on Phosphorous Losses
Objectives
The objective of this investigation is to measure or to estimate in cases where existing
information allows, the absolute and relative losses of phosphorus from
• soil,
• grazed pastures,
• slurry spreading,
• fertiliser spreading and
• farmyards.
The research should clarify the question of magnitude of P losses in different farm
situations and to provide an interpretation of the relative contribution of each source of
agricultural P to waters in Ireland. The overall aim is to provide policy makers with a
ranking of sources to enable them to introduce the most cost-effective measures to reduce
or eliminate agriculture-induced eutrophication.
The pathway which each P load takes to the nearest important waterbody (ca 3m width)
should also be investigated. This information should be assembled for catchments with
different soil types and should build on the information derived from all recent studies.
The project must build on recent studies carried out on eutrophication of inland water
from agricultural sources. A large body of data has been generated by on-going and
recent studies funded by the Department of the Environment and Local Government
(DELG) and in particular in the catchment management projects in progress in Lough
Derg/Lough Ree (19), the Three Rivers (20) and Lough Leane (21) Projects. Results
from other studies at Lough Conn (22), Bellsgrove (23) and the Dripsey Catchment (24)
should also be reviewed. An in-depth analysis of the data from these projects should be
carried out prior to embarking on any new fieldwork to avoid duplication of effort. It is
essential that as far as possible, work described in this scoping document should be
carried out in these well categorised catchments where information already exists on
water flow data, soil types, land cover, farm practices and where point sources of
pollution from all sources have been categorised and quantified.

132
Reference Project Title
2000-LS-2.1.1-M2 Project
2.1.1
Soil and Phosphorus
Tasks
It is envisaged that work on the losses of P from soil will be carried out at laboratory,
small plot, field and ultimately catchment level. Critical questions including why the
concentration of P in surface water increases with flow rather than the expected dilution
effect must be addressed. It is expected that this will involve studies of P dynamics in soil
and the effects of soil P status (including degree of saturation) soil type, organic matter
content, pH, oxidation status and possible interactions with other cations/anions added in
fertiliser or slurry.
Vertical soil P profiles may also be of importance if subsurface movement of P is an
important source of loss. Building on the recent work carried out in Teagasc, Johnstown
Castle and the Dripsey catchment, mini catchment studies on P losses from soils should
be carried out on a number of soil types using soils with differing soil P status.
Whenever large plots, field or catchment studies are carried out, the hydrology of the area
must be investigated to enable interpretation of results. In important studies this might
involve setting up permanent structures/equipment to give year on year data on water
flows, surface runoff, sub surface runoff and their response to varying weather conditions.
Water samples could be continuously collected from these permanent facilities, as
required, for qualitative analysis.
The expertise of hydrologists will be required to interpret the flow of discharges from
fields and farmyards to affected waterbodies and to define pathways from edge of field to
main water channel including transport to and through ditches and drains. Attenuation
and sedimentation of P en route will also need to be investigated. Water and P fluxes in
the riparian zone should receive special attention with a view to effecting remedial
measures at a later stage in the project.
While the components described above should concentrate on phosphorus, all discharges
and receiving waters should be analysed for both oxidised and ammoniacal nitrogen,
potassium and in some instances BOD also.
Ratios of chemical cations/anions should be examined to see if there is a possibility of
using the chemical composition to decipher if e.g. the effluent originated from yard
discharge, field discharge or soil effluent. The recent ERDF Dripsey study (8) showed
some potential for this approach.
Experience may dictate that other cations/anions may give vital information as to nutrient
origin and this information should be conveyed to other relevant researchers through the
co-ordinator. For example, where soil anoxic conditions are considered to be an
important factor, increases of iron and manganese in soil solution might be measured as
indicators.

133
Outputs
1. The report from this study should describe all the research findings and should discuss
the factors which influence the desorption of P to surface water from a number of soil
types. This report should include details of the following:
(i) The range of potential P losses associated with all the major variables in a
catchment situation should be discussed.
(ii) The hydrology of the study area should be described together with the results
of studies to interpret the pathways of nutrients from edge of field to main
water channel.
(iii) The use of indicators to determine the source of P.
(iv) Recommendations regarding possible remedial actions giving projected costs
of these actions.
2. All data gathered during the course of the project shall be compiled either in Excel
spreadsheets or Access databases and submitted to the Agency upon completion of the
project and/or during the project as requested.
3. The final report and a synopsis report will be required for publication.
Timeframe
It is estimated that this project could take three years to complete. The work on the use
of indicators will be reviewed after 12 months and may be discontinued if this part of the
project is considered to be unsuccessful.
Meetings
Researchers will be expected to maintain close contact with the scientific officers in the
EPA responsible for the project. It is proposed that progress meetings will be held at
regular intervals between the nominated officers and the full project team involved in the
project. Alterations to the work programme and timeframe may be made depending on
the progress of the work. A steering committee may be set up to advise on the project.

134
Reference Project Title
2000-LS-2.1.2-M2 Project 2.1.2 Grazed pastures
Tasks
The loss of P and N from grazed pastures should be measured on different soil types. The
P cycle within grazed pastures should be described and quantified, drawing on published
studies where possible to give a simple model of P pools and fluxes.
The contribution of P exports from dung and urine excreted by the animals at pasture
should be estimated. Hydrological and nutrient indicator aspects should be addressed as
described in Project 1.1 above.
Outputs
1. The report from this study should describe all the research findings and should discuss the
influence of the grazing animal on P losses from pastures to water bodies. In particular this
report should include the following:
(i) The range of P and N (both oxidised and ammoniacal) losses associated with all the
major variables in a catchment situation should be discussed.
(ii) The hydrology of the study area should be described together with the results
of studies to interpret the pathways of nutrients from edge of field to main
water channel.
(iii) Attempts to use indicators to determine the source of P should be reported.
(iv) A model of P pools and fluxes within grazed pastures should be prepared.
(v) Recommendations should be made regarding possible remedial actions giving
projected costs.
2. All data gathered during the course of the project shall be compiled either in Excel
spreadsheets or Access databases and submitted to the Agency upon completion of the project
and/or during the project as requested.
3. The final report and a synopsis report will be required for publication.
Timeframe
It is estimated that this project could take three years to complete. There will be a
review of the use indicators within 12 months of starting the project. This part of the
work may be discontinued if considered to be unsuccessful. The report on the model of P
pools and fluxes within grazed pastures should be completed within 12 months.

135
Meetings
Researchers will be expected to maintain close contact with the scientific officers in the
EPA responsible for the project. It is proposed that progress meetings will be held at
regular intervals between the nominated officers and the full project team involved in the
project. Alterations to the work programme and timeframe may be made depending on
the progress of the work. A steering committee may be set up to advise on the project.

136
Reference Project Title
2000-LS-2.1.3-M2 Project 2.1.3 Slurry spreading
Tasks
The following are the main tasks to be carried out:
The first step should involve a review of the literature for the purpose of carrying out a
detailed assessment of the potential for P and N loss following slurry spreading.
Then existing data from both Irish and international sources should be examined to allow
a weighting factor to be applied for potential losses of P and N from this source.
Seasonality of spreading and the effects of soil type should be addressed as variables.
Opportunities for spreading should be identified on a regional and where possible, on a
catchment basis, integrating soil and meteorological information.
Outputs
1. The report of this study should describe all the research findings and in particular address the
following:
(i) the range of potential P and N losses following slurry spreading should be described
depending on soil type, hydrology and weather conditions.
(ii) identification of opportunities for slurry spreading integrating soil and
meteorological information.
2. All data gathered during the course of the project shall be compiled either in Excel
spreadsheets or Access databases and submitted to the Agency upon completion of the project
and/or during the project as requested.
Timeframe
This project should be completed within 12 months of the start date.
Meetings
Researchers will be expected to maintain close contact with the scientific officers in the EPA
responsible for the project. It is proposed that progress meetings will be held at regular intervals
between the nominated officers and the full project team involved in the project. Alterations to
the work programme and timeframe may be made depending on the progress of the work. A
steering committee may be set up to advise on the project.
Reference Project Title

137
2000-LS-2.1.4-M2 Project 2.1.4 Fertiliser spreading
Tasks
A review of the literature should be carried out to determine the state of the art regarding
the potential for losses following spreading of fertiliser. Seasonality of spreading and
chemical forms of P in fertiliser as well as effects of soil type and meteorological
conditions should be addressed as variables.
Information regarding on-farm practice should be obtained to establish rates of excess
usage.
Outputs
The report of this study should describe all the research findings and in particular address the
range of potential P and N losses following fertiliser spreading should be described depending on
soil type, hydrology and weather conditions. All data gathered during the course of the project
shall be compiled either in Excel spreadsheets or Access databases and submitted to the Agency
upon completion of the project and/or during the project as requested.
Timeframe
This project should be completed within 12 months of the start date.
Meetings
Researchers will be expected to maintain close contact with the scientific officers in the
EPA responsible for the project. It is proposed that progress meetings will be held at
regular intervals between the nominated officers and the full project team involved in the
project. Alterations to the work programme and timeframe may be made depending on
the progress of the work. A steering committee may be set up to advise on the project.

138
Reference Project Title
2000-LS-2.1.5-M2 Project 2.1.5 Farmyards
P loss from farmyards is probably the most variable category and is likely to vary from
virtually zero in a well managed farmyard with adequate slurry and dirty water storage
facilities to high P export rates from poorly managed farmyards with inadequate storage.
Tasks
The main task of this project is to establish factors for P loss from farmyards using a
range of farmyard scenarios.
The influence of facilities and management on losses is most likely to be derived through
the risk assessment approach described in Project 2.1 below.
Outputs
1. The report of this study should describe all the research findings.
2. All data gathered during the course of the project shall be compiled either in Excel
spreadsheets or Access databases and submitted to the Agency upon completion of the project
and/or during the project as requested.
Timeframe
This project should be completed within 12 months of the start date.
Meetings
Researchers will be expected to maintain close contact with the scientific officers in the
EPA responsible for the project. It is proposed that progress meetings will be held at
regular intervals between the nominated officers and the full project team involved in the
project. Alterations to the work programme and timeframe may be made depending on
the progress of the work. A steering committee may be set up to advise on the project.

139
Final Report of all of the Work on the Phosphorus Pathways Projects
The Project Co-ordinator shall be responsible for ensuring that a report is prepared of all
of the work carried out in projects 1.1 to 1.5 (inclusive), so that the ranges and relative
contributions of each source of agricultural P are documented. This final report should
also consider how these losses can be most effectively controlled and should discuss the
relative merits of the following:
• Education in relation to slurry and fertiliser use and management of farmyard
facilities
• Increased soil testing and use of Teagasc fertiliser recommendations
• Improved containment and storage facilities
• Increased regulation in terms of farmyard inspections, and introduction of nutrient
management planning on a statutory basis, measures under the phosphorus
regulations, bye-laws
• Introduction of new abatement measures – riparian strips, reed bed systems, to
minimise losses, alternative management practices or spreading technology.
A synopsis report of the findings should also be provided in a form that is suitable for
general readership.

140
Reference Project Title
2000-LS-2.1.6-M2 Project 2.1.6 Environmental Soil P Test
The current practice of using a soil test which was designed to predict the availability of P
for agronomic purposes to predict environmental impacts is frequently criticised by soil
scientists.
Tasks
Existing methodologies should be reviewed including developments in the EU COST 832
Programme (25) and if necessary research should be carried out to determine if a more
appropriate extractant should be used. The relationships with agronomic extractants
should be shown.
Attention should also be paid to the influence of sampling depth on soil P test results as it
is well established that P may accumulate in the top few centimetres of soil. The
researchers should consider options for estimating the risk of pollution associated with P
in soils and recommend an approach to be taken.
Outputs
1. A final report and a synopsis report will be required for publication.
2. The final report shall consider the options for using soil P tests to estimate the risk of
pollution and make recommendations regarding a suitable environmental soil P test.
Timeframe
This project should be completed within 12 months of the start date.
Meetings
Researchers will be expected to maintain close contact with the scientific officers in the
EPA responsible for the project. It is proposed that progress meetings will be held at
regular intervals between the nominated officers and the full project team involved in the
project. Alterations to the work programme and timeframe may be made depending on
the progress of the work. A steering committee may be set up to advise on the project.

141
Reference Project Title
2000-LS-2.1.7-M2 Project 2.1.7 Relative eutrophic effects of seasonal
discharges of phosphate to water bodies
In the Lough Derg study of 1993 (26), it was concluded that summer inputs of pollutants
to lakes had a particularly detrimental effect.
Tasks
A literature survey should be conducted to ascertain the effects of seasonal P and other
nutrient discharges to water bodies on algal growth. Light, temperature and nutrient
availability should be addressed as variables. Recommendations should be made as to
future studies which should be carried out.
Outputs
1. The report of this study should include the following:
(i) A report of the literature on information on the effects of seasonal inputs of
nutrients to surface waters.
(ii) Recommendations should be made as to which studies are needed in future to
fill information gaps.
2. All data gathered during the course of the project shall be compiled either in Excel
spreadsheets or Access databases and submitted to the Agency upon completion of the
project and/or during the project as requested.
3. A final report and a synopsis report will be required for publication
Timeframe
This project should be completed within 6 months of the start date.
Meetings
Researchers will be expected to maintain close contact with the scientific officers in the
EPA responsible for the project. It is proposed that progress meetings will be held at
regular intervals between the nominated officers and the full project team involved in the
project. Alterations to the work programme and timeframe may be made depending on
the progress of the work. A steering committee may be set up to advise on the project.

142
Reference Project Title
2000-LS-2.2-M2 Group 2.2 Models and Risk Assessment Schemes
for Predicting P Loss to Water
2000-LS-2.2.1-M2 Project 2.2.1 Field by field assessment
2000-LS-2.2.2-M2 Project 2.2.2 Modelling P losses from soils
Information regarding each of the projects listed in group 2.2 above are as follows:
2000-LS-2.2.1-M2 Project 2.2.1 Field by field assessment
Objectives
The first objective of this project is to provide a validated risk assessment scheme which
will predict nutrient (P and N) losses to water from individual fields based on a limited
number of observed management factors, site specific factors (such as proximity to water
courses) and soil physical and chemical properties.
Uses for the field-by-field risk assessment scheme will include assessment of lands for
suitability for spreading sewage sludge, industrial sludges and slurries and manures from
intensive agricultural enterprises.
The project is clearly linked to the projects in group1 described above. Initially the risk
factors will be chosen by the proposer based on US experience with such schemes, but as
information becomes available from group1 projects, further factors may be incorporated
into the risk assessment scheme. The scheme should be validated in some of the mini
catchments in group1 projects where the more sophisticated model described in Project
2.2 will be validated.
The risk assessment approach will also be developed to predict the range of P and N
exports from farmyards, based on facilities and management factors. Predictions should
be validated by field measurements.
Outputs
The report of this study should describe all the research findings and in particular address
the following:
An estimate of the ranges of potential P and N losses from farmyards will be prepared, in
relation to facilities and management factors. Suggested remedial measures and
estimated costs will also be given.
A ranking system for evaluating potential P and N losses from both farmyards and fields
will be prepared.

143
The ranking system will be validated in field and catchment studies.
All data gathered during the course of the project shall be compiled either in Excel
spreadsheets or Access databases and submitted to the Agency upon completion of the
project and/or during the project as requested.
A final report and a synopsis report will be required for publication
Timeframe
It is estimated that this project will take 2 years to complete.
Meetings
Researchers will be expected to maintain close contact with the scientific officers in the
EPA responsible for the project. It is proposed that progress meetings will be held at
regular intervals between the nominated officers and the full project team involved in the
project. Alterations to the work programme and timeframe may be made depending on
the progress of the work. A steering committee may be set up to advise on the project.

144
2000-LS-2.2.2-M2 Project 2.2.2 Modelling P losses from soils
Tasks
The main task is to carry out modelling studies to enable predictions to be made of the
losses of P from different soil types. This project should build on the experience gained in
the ERDF funded project (8) using a GIS approach and utilising datasets of soil, terrain,
land use information and hydrology to predict P exports from well defined catchments
which have good data resolution such as the Derg/Ree (19) and Three Rivers (20) studies.
The model should also be used to identify critical source areas or catchment “hotspots”.
Outputs
1. A model(s) to predict flow weighted P concentrations in river catchments shall be
prepared using such variables as soil P levels, soil desorption characteristics, land use,
fertiliser use and organic manure use.
2. The model shall be validated in catchment situations.
3. A final report and a synopsis report will be required for publication
All data gathered during the course of the project shall be compiled either in Excel
spreadsheets or Access databases and submitted to the Agency upon completion of the
project and/or during the project as requested.
Timeframe
It is estimated that this project will take 2 years to complete.
Meetings
Researchers will be expected to maintain close contact with the scientific officers in the
EPA responsible for the project. It is proposed that progress meetings will be held at
regular intervals between the nominated officers and the full project team involved in the
project. Alterations to the work programme and timeframe may be made depending on
the progress of the work. A steering committee may be set up to advise on the project.
Selected Bibliography for projects in Groups 2.1 and 2.2
1. Flanagan, P.J. and P.F. Toner, 1972. Survey of Irish Rivers. A Report on Water
Quality. An Foras Forbartha, Dublin.
2. Flanagan, P.J. 1974. The National Survey of Irish Rivers. A Second Report on
Water Quality, An Foras Forbartha, Dublin.

145
3. Lennox, L.J. and Toner, P.F. 1980. The National Survey of Irish Rivers. A Third
Report on Water Quality, An Foras Forbartha, Dublin.
4. Toner, P.F., K.J. Clabby, J.J. Bowman and M.L. McGarrigle. 1986. Water
Quality in Ireland. The Current Position: Part One: General Assessment, An
Foras Forbartha, Dublin.
5. Clabby, K.J., J.J. Bowman, J. Lucey, M.L. McGarrigle and P.F. Toner. 1992.
Water Quality in Ireland 1987 –1990. Environmental Research Unit, Dublin.
6. Bowman, J.J., K.J. Clabby, J. Lucey, M.L. McGarrigle and P.F. Toner, 1996.
Water Quality in Ireland 1991-1994. Environmental Protection Agency, Wexford.
7. Lucey, J, J.J. Bowman, K.J. Clabby, P. Cunningham, M. Lehane, M.
MacCarthaigh, M.L. McGarrigle and P. Toner, 1999. Water Quality in Ireland
1995-1997. Environmental Protection Agency, Wexford.
8. Quantification of Phosphorus Loss from Soil to Water: 2000. A report on
research part funded by the ERDF through the Operational Programme on
Environmental Services 1994-1999. EPA, Wexford.
9. Cooke, G.W. 1976. A review of the effects of agriculture on the chemical
composition and quality of surface and underground waters. In Agriculture and
Water Quality, MAFF Technical Bulletin 32, HMSO, London.
10. Tunney, H. 1988. A note on a balance sheet approach to estimating the
phosphorus fertiliser needs of agriculture. Irish J. Agric. Res. 29: 149-154.
11. Sharpley, A.N., S.C. Chapra, R. Wedepohl, J.T. Sims, T.C. Daniel and K.R.
Reddy, 1994. Managing agricultural phosphorus for protection of surface waters:
issues and options. J. Environ. Qual. 23: 437-451.
12. Smith, R.V., S.D. Lennox, C. Jordan, R.H. Foy and E. McHale, 1995. Increase in
soluble phosphorus transported in drainflow from a grassland catchment in
response to soil phosphorus accumulation. Soil Use and Management, 11: 204-
209.
13. Heckrath, G., P.C. Brookes, P.R. Poulton and K.W.T. Goulding, 1995.
Phosphorus leaching from soils containing different concentrations in the
Broadbalk experiment. J. Environ. Qual. 24: 904-910.
14. Jordan, C., S.O. McGuckin and R.V. Smith. Increased predicted losses of
phosphorus to surface waters from soils with high Olsen-P concentrations. In
Press.
15. Pionke, H.B., W.J. Gburek, A.N. Sharpley and R.R. Schnabel, 1996. Flow
and nutrient export patterns for an agricultural hill-land watershed. Water Resour. Res.
32: 1795-1804.

146
16. Lemunyon, J.L. and R.R. Gilbert. 1993. Concept and need for phosphorus
assessment tool. J. Prod. Agric. 6: 483-486.
17. Gburek, W.J., A.N. Sharpley and H.B. Pionke, 1996. Identification of Critical
Source Areas for Phosphorus Export from Agricultural Catchments in, Advances
in Hillslope Processes, Vol. 1., John Wiley and Sons Ltd, England.
18. Magette, W.L. 1998. Factors affecting losses of nutrients from agricultural
systems and delivering to watercourses. Pp 6-31. In O.T. Carton (ed.) Draft
Guidelines for Nutrient Use in Intensive Agricultural Enterprises. Teagasc,
Johnstown Castle Res. And Dev. Centre, Wexford. Ireland.
19. Lough Derg and Lough Ree Catchment Monitoring and Management System. Co-funded
by the European Union Cohesion Fund and the DELG. (ongoing).
20. The Three Rivers Project Water Quality Monitoring and Management. Co-funded by the
European Union Cohesion Fund and the DELG. (ongoing).
21. Lough Leane Catchment Monitoring and Management System. Funded by the DELG.
(ongoing).
22. Lough Conn Task Force Studies, Castlebar. Funded by ERDF and DELG. (ongoing).
23. Humphreys, J., H. Tunney, P. Duggan, 1999. Soil Analysis and Comparison of Soil P
Tests for the Bellsgrove Catchment, Cavan. Teagasc End of Project Report No. 4366,
March 1999, 49 pages. ISBN No. 1-84170-22-9.
24. STRIDE Study – Lee Valley Report, RPS/CAIRNS. Cork and DoE, Dublin (1995).
25. Quantifying the agricultural contribution to eutrophication. EU DG XII. COST
programme: Action No. 832.
26. Bowman, J.J., M.L. McGarrigle and K.J. Clabby, 1993. Lough Derg – An
investigation of eutrophication and its causes, Part 1, Water Quality Assessment, Nutrient
Sources, Conclusions and Recommendations. A Report to the Lough Derg Working
Party, Environmental Research Unit, Dublin.

147
Reference Project Title
2000-LS-2.3-M2 Group 2.3 Effects of Agricultural Practices on
Nitrate Leaching
2000-LS-2.3.1-M2 Project 2.3.1 Effects of agricultural practices on nitrate
leaching
Background
EU Directives set limits for pollutants in surface, drinking and ground waters (European
Communities 1978, 1980 and 1991). Due to health risks associated with excess nitrate
(NO3-N) intake, water for human consumption should not contain more than the
maximum admissible concentration (MAC) of 11.3 mg l-1
and ideally less than the guide
level (GL) of 5.65 mg l-1
NO3-N. Much of the drinking water in Ireland is surface-
abstracted, with NO3-N levels not generally exceeding the MAC (EPA, 1996a).
However surface water samples, particularly from the south-east, show increasing levels
of NO3-N, with some exceeding the GL (EPA, 1996b). Some groundwater samples
regularly exceed the MAC, an example being those collected at Teagasc Ballyderowan
(Sherwood et al, 1992; Richards et al, 1998). A limited number of such sites have been
noted (EPA, 1999) and some areas may be designated as Nitrate Vulnerable Zones (NVZ)
under the Nitrate Directive (EC 1991).
The reduction of nutrient losses from agriculture to water has been addressed by a
combination of advice (DAFF, 1992; DoELG & DAFF, 1996; Teagasc, 1994) , the REPS
scheme (DAFF, 1996), legislation (DoELG, 1998; S.I. No 258, 1998; Cork County
Council, 1999) and licensing (EPA, 1996c). The Cork bye-laws place a limit of 210 kg
organic N ha-1
yr-1
on lands within the catchment areas where groundwater NO3 exceeds
20 mg l-1
and define organic N as including farm animal excreta, sewage sludge,
industrial wastes and fish farm wastes.
Other lands within the catchment may receive up to 250 kg organic N ha-1
yr-1
and all N
applications must comply with current Teagasc recommendations. These
recommendations (DoELG & DAFF, 1996) are derived from soil N index (based on
cropping history) and current N requirement. On grassland a maximum of 487.5 kg N ha-
1 is recommended at a stocking rate of 3.0 livestock units ha
-1 on recently reseeded land.
The highest N recommendation for tillage is 250 kg N ha.-1
Large variations in soil
mineralisation and plant N uptake in different soils and years have precluded
development of a reliable soil or plant test to determine crop N requirements. Thus N
recommendations are based on numerous agronomic field trials encompassing a range of
soil and climatic conditions.
With most of the fertiliser N applied to soil not recovered (Jenkinson, 1990), much
research has concentrated on improving the efficiency of N use and reducing losses to
water and air (Jenkinson and Smith, 1988). It is undisputed that significant runoff of N
may follow inappropriate rates and timing of fertiliser and/or organic N applications
(Brogan, 1981).

148
Leaching of NO3-N has been extensively studied (Germon, 1989) and is mainly attributed
to:
i) loss of mineral N from tillage soils, particularly when these soils are
fallow,
ii) late applications of fertiliser or organic N on both pasture and tillage soils
leading to high soil mineral N in the critical autumn-winter period, and
iii) to animal N excretions on grassland in intensive livestock systems
(Kolenbrander, 1981).
Since NO3-N leaching studies are influenced by soil and climatic parameters, results
generated elsewhere are not directly applicable to Irish conditions. It has been necessary
therefore to directly measure NO3-N losses from Irish soils. Studies have been ongoing
at Teagasc, Johnstown Castle where permanent lysimeters have been used to measure
NO3-N in drainage water from a variety of soils in tillage and pasture. An overview of
these studies is given below.
Lysimeter studies at Teagasc, Johnstown Castle, Wexford.
Beginning in 1985, lysimeter studies on one soil type (90cm, backfilled) examined the
effects of fertiliser N (0 and 120 kg ha-1
yr-1
) on NO3-N leaching from fallow and barley
treatments over several years (Sherwood, 1990). Levels of NO3-N in drainage water
frequently exceeded the MAC in the early years. In subsequent work (Ryan and Fanning,
1999) mean NO3-N in leachate from fallow lysimeters was reported as 15.6, 11.9 and
15.5 mg l -1
for the years 1993-4, 94-5 and 95-6 respectively (i.e.. exceeding MAC).
Lysimeters receiving 60, 120 and 180 kg N ha-1
on barley and 150 and 200 kg N ha-1
on
winter wheat were also studied. The authors concluded that this soil, which was in
continuous tillage since 1985, could receive the Teagasc recommended fertiliser N
without permanently breaching the MAC.
The results for grassed lysimeters showed little NO3-N leached except in one year when
delayed reseeding led to 200-246 kg N ha-1
being removed in drainage water, illustrating
the dramatic effect of a relatively short summer fallow period. Similarly, where barley
was poorly established 170-219 kg N ha-1
was removed in drainage water.
A second series of lysimeters, consisting of 5 soils collected as monoliths (100cm deep),
were grassed and various N and slurry treatments imposed. This work showed higher
NO3-N in drainage water following November/December as opposed to February slurry
applications (Ryan and Fanning, 1996), where a total of 300 kg ha-1
fertiliser N and 120
kg ha-1
slurry N were applied. Soil effects were significant with lower NO3-N in leachate
from Castlecomer soil (containing 76% silt + clay 0-90 cm), presumably due to
denitrification which was not measured. Drainage water NO3-N levels from the Oakpark
soil (73% sand 0-45 cm) fluctuated more than the other 4 soils, exceeding the MAC even
before slurry was applied. A subsequent study on these lysimeters showed that
applications of 200 kg fertiliser N ha-1
and 50 kg slurry N ha-1
did not result in excessive
NO3-N leaching on any of the five soils. However, reseeding and cultivation of the

149
lysimeters prior to this second study provided another example of the large amount of
NO3-N leached (184-855 kg N ha-1
) following a relatively short fallow period (June to
September). It is clear from both lysimeter studies that allowing soils to remain fallow
for even a relatively short period (as may occur while green cover is established on set-
aside) can lead to very high NO3-N losses to water.
Grazing study at Teagasc, Johnstown Castle
The greatest knowledge gap exists in the area of NO3-N leaching from grazed grassland,
this being particularly significant in a country where over 90% of soils are in permanent
pasture. Leaching measurements were conducted at one site on which treatments of 0 and
328 kg N ha-1
yr-1
were imposed on replicated plots of 0.5 ha. Dairy cows were used to
mob graze the plots and leachate collected by ceramic probes (12 per replicate) installed
at 50 and 100 cm. Mean losses (2 year average) of 1.5 and 4.35 kg N ha-1
yr-1
were
recorded from the 0 and 328 kg N ha-1
treatments respectively (Ryan, 1998). These
results were extremely low, particularly for the fertilised treatment.
Very low NO3-N losses were also measured from grassed lysimeters at the same site (see
above). Both of these results suggest that fertiliser N applications up to 328 kg N ha-1
yr-1
are unlikely to contribute significantly to NO3-N levels in groundwater. However,
preliminary studies on the same soil (Ryan, 1998) showed evidence of preferential flow,
indicating that ceramic probes were of limited value in leaching measurements on this 18
year old well managed pasture (with good soil structure). The issue of preferential flow
through soil macropores has been noted elsewhere (Jarvis, 1992a; Simard et al, 1998).
Furthermore, the spatial variability of animal urinations renders the use of ceramic probes
inappropriate in grazed grassland. Grazing animals can produce urine patches with spot
application rates of 400 to 2000 kg N ha-1
(Jarvis et al, 1997) and various authors have
suggested that these patches were the main source of NO3-N leached from grassland
(Jarvis, 1992b; Macduff et al, 1990; Tyson, 1990; Scholefield et al, 1993). The potential
for NO3-N leaching from animal urinations in the latter half of the grazing season has
been identified on Irish soils (Sherwood and Ryan, 1990 and references therein).
Information Gaps
From the above it is apparent that further study of intensive grassland systems is required
to provide appropriate guidelines for minimising NO3-N leaching to groundwater in NVZ
in Ireland. (Research on NO3-N leaching in other EU countries has generated much
information on appropriate agricultural practices for tillage areas). While many studies
have examined grazing and landspreading of animal wastes independently, there is little
information on NO3-N losses from grazed grassland where fertiliser and animal wastes
are used in tandem (as occurs on-farm).

150
Thus, the project should involve the application of both fertiliser and animal wastes
(slurry and dirty water) to a soil type typical of a NVZ. The methodology employed
could be similar to that in a recent (Watson et al, 2000) 9 year study on one grazed site in
Northern Ireland, in which mean NO3-N levels in drainage water did not exceed the
MAC where < 300 kg N ha-1
fertiliser N was applied. That study was conducted on
small (0.2 ha) plots which were hydrologically isolated and artificially drained to V-notch
weirs with flow-proportional sampling of drainage water. In this way the effects of
preferential flow and spatial variability of animal excretions were diminished.
Objective
The main aim of the project is to measure nitrate leaching from an intensively managed
dairy farm on a soil type, which is typical of a Nitrate Vulnerable Zone. The
methodology used should overcome or at least take account of the problems of spatial
variability and soil micropore preferential flow as outlined above. It should preferably be
carried out on hydrologically isolated plots which might be similar to those used in the
UK or Northern Ireland (Scholefield et al, 1993; Parkes et al, 1997; Catt et al, 1998;
Watson et al, 2000).
More than one fertiliser N rate should be used. The top rate should correspond with that
recommended for a stocking rate of 3 livestock units per hectare. The experiment should
also take account of the effect of the following practices on nitrate leaching:
• Extended grazing season
• Dirty water spreading
• Slurry spreading
The N and P content of the feedstuffs, dung, urine, slurry and dirty water of the dairy
cows should be measured. Ammoniacal nitrogen and potassium should also be measured
in all these components and in the leachate/drainage water.
The research will measure plant uptake of both fertiliser and organic N at each fertiliser
rate and the extent to which denitrification in surface and sub surface (if significant) soil
layers may reduce nitrate leaching losses will also be examined at this site.
At all times, management of the cows will be appropriate to good commercial practice.
Outputs
1. The research will provide detailed data of nitrate and phosphate leaching from an
intensively managed dairy farm.
2. It will also provide the components for modelling nitrogen fluxes in a grazing
situation and will report on the effects of extended grazing, dirty water and slurry
spreading on nitrate leaching.

151
3. The results from this research will be used to define a fertiliser N rate that can be used
in Nitrate Vulnerable Zones to optimise farm output but without causing unacceptably
high levels of nitrate in groundwater.
4. A final report and a synopsis report will be required for publication
All data gathered during the course of the project shall be compiled either in Excel
spreadsheets or Access databases and submitted to the Agency upon completion of the
project and/or during the project as requested.
Timeframe
It is considered that at least three years measurements and field work will be needed in
order to produce a reasonable data set on which to base an assessment of agricultural
practices on nitrate leaching.
Meetings
Researchers will be expected to maintain close contact with the scientific officers in the
EPA responsible for the project. It is proposed that progress meetings will be held at
regular intervals between the nominated officers and the full project team involved in the
project. Alterations to the work programme and timeframe may be made depending on
the progress of the work. A steering committee may be set up to advise on the project.

152
Selected Bibliography for project in Group 2.3
Brogan. J.C. ed. (1981). Nitrogen losses and surface run-off from landspreading of
manures. Martinus Nijhoff / Dr. W Junk, The Hague.
Catt, J. A., Howsw, K.R., Christian, D.G. Lane, P.W., Harris, G.L. and Goss, M.J.
(1998). Strategies to decrease nitrate leaching in the Brimstone Farm
experiment, Oxfordshire, UK, 1988-1993: The effects of winter cover crops
and unfertilised grass leys. Plant and Soil 203 pp 57-69.
Cork County Council. 1999. Regulation of agricultural practice in the catchments of
the river Lee, the river Gradogue and the river Funshion bye-laws 1999. Cork
County Council, Ireland.
DAFF. 1992. The control of farm pollution. Department of Agriculture, Food and
Forestry, Ireland.
DAFF. 1996. Rural environment protection scheme : agri-environmental specifications.
Department of Agriculture, Food and Forestry, Ireland.
DoELG. 1998. Protecting our freshwaters nutrient management planning guidelines
for local authorities. Department of Environment and Local Government. Ireland.
DoELG & DAFF. 1996. Code of good agricultural practice to protect waters from
pollution by nitrates. Department of Environment and Local Government and
Department of Agriculture, Food and Forestry, Ireland.
EPA. 1996a. The quality of drinking water in Ireland. EPA, Ireland.
EPA. 1996b. State of the environment in Ireland. p.118-120. EPA, Ireland.
EPA. 1996c. Integrated pollution control licensing guide to implementation and
enforcement in Ireland. EPA, Ireland.
EPA. 1999. Water quality in Ireland 1995-1997. p 96-99. EPA, Ireland.
European Communities. 1978. Council directive on the quality of fresh waters
needing protection or improvement in order to support fish life. EC 78/659.
Off. J. Eur. Commun. L222:1-9.
European Communities. 1980. Council directive relating to the quality of water for
human consumption. EC 80/778. Off. J. Eur. Commun. L229:11-29.
European Communities. 1991. Council directive concerning the protection of
waters against pollution caused by nitrates from agricultural sources. EC 91/676.
Off. J. Eur. Commun. L375:1-8.
Germon, J.C. ed. (1989). Management systems to reduce impact of nitrates. Elsevier
Applied Science, London.

153
Jarvis, S.C. 1992a. Nitrogen flows and transfers in grassland. In Francois, E, Pithan,
K and Bartiaux-Thill, N (eds.) Nitrogen cycling and leaching in cool and wet
regions of Europe. EC COST 814 Workshop, Belgium.
[IS1]Jarvis, S.C. 1992b. Grazed grassland management and nitrogen losses: an
overview.
Aspects of Applied Biology 30 pp. 207-214.
Jenkinson, D.S. 1990. An introduction to the global nitrogen cycle. Soil Use and
Management, 6(2), pp 56-63.
Jenkinson, D.S. and Smith, K.A. eds. (1988). Nitrogen efficiency in agricultural soils.
Elsevier, London.
Kolenbrander, G.J. (1981). Leaching of nitrogen in agriculture. p. 199-216. In J.C.
Brogan (ed.) Nitrogen losses and surface runoff from landspreading of
manures. Martinus Nijhoff / Dr. W Junk, The Hague.
Macduff, J.H., Jarvis, S.C. and Roberts, D.H. (1990). Nitrates: leaching from grazed
grassland systems. In R. Calvet (ed.) Nitrate, Agriculture, Eau. pp. 405-410.
INRA Paris.
Neill, M. (1989). Nitrate concentrations in river waters in the South-East of Ireland
and their relationship with agricultural practice. Water Research 23(11) 1339-
1355.
Parkes, M.E., Cambell, J. and Vinten, A.J.A. 1997. Practice to avoid contamination of
drainflow and runoff from slurry spreading in spring. Soil Use and Management
13:36-42.
Richards, K., Ryan, M. and Coxon, C. 1998. Leaching of N compounds from swards
used for dairying that are N-based and irrigated with dirty water/slurry.
Teagasc, Dublin, Ireland.
Ryan, M. (1998). Water movement in a structures soil in the southeast of Ireland:
preliminary evidence for preferential flow. Irish Geography 31(2), pp 124-
137.
Ryan, M. and Fanning, A. (1996). Effects of fertiliser N and slurry on nitrate leaching -
lysimeter studies on 5 soils. Irish Geography 29(2), pp 126-136.
Ryan, M. and Fanning, A. (1999). Leaching studies in lysimeter units. Teagasc, Dublin,
Ireland.
Scholefield, D., Tyson, K.C., Garwood, E.A., Armstrong, A.C., Hawkins, J. and Stone,
A.C. 1993. Nitrate leaching from grazed grassland lysimeters: Effects of fertiliser
input, field drainage, age of sward and patterns of weather. J. Soil Sci. 44 pp 601-613.

154
Sherwood, M. 1990. Management of wastes to prevent leaching of nitrates. p. 87- 101.
In: Seminar on environmental impact of landspreading of wastes. Teagasc, Johnstown
Castle, Wexford.
Sherwood, M. and Ryan, M. (1990). Nitrate leaching under pasture. In Nitrates,
agriculture, eau. pp 323-333. INRA, Paris.
Sherwood, M., Daly, D., Kiely, J., Feeney, P. and Scott, J.P. 1992. Leaching of nitrate
to groundwater on a dairy farm. In: Teagasc Johnstown Castle Research Report
1991-1992. Teagasc, Dublin, Ireland.
Simard, R.R., Haygarth, P.M. and Beauchemin, S. (1998). Potential for preferential
pathways for phosphorus transport. In Foy, R.H. and Dils, R. (eds.), Practical
and innovative measures for the control of agricultural phosphorus losses to
water. OECD sponsored workshop, Greenmount College, Northern Ireland.
S.I. No. 258. 1998. Local Government (Water Pollution) Act, 1977 (Water Quality
Standards for Phosphorus) Regulations, 1998. Government Supplies Agency, Ireland.
Teagasc. 1994. Soil analysis and fertiliser, lime, animal manure and trace element
recommendations (amended). Teagasc Johnstown Castle, Wexford, Ireland.
Tyson, K.C. (1990). Report on AFRC-ADAS drainage experiment 1982-1989. IGER,
North Wyke, England.
Watson, C.J., Jordan, C., Lennox, S.D., Smith, R.V. and Steen, R.W.J. (2000).
Inorganic nitrogen in drainage water from grazed grassland in Northern Ireland.
J. Environ. Qual. 29; 225-232.

155
Appendix B
Procedure for Assessing the Hydrologic Activity of Soils in Ireland
(Source: MCOS, 2002)

156
Description of the Hydrological Risk Assessment used in the mPRS
This is a methodology for field-by-field assessment of the risk of rapid nutrient loss to watercourses. It has
been developed by the Three Rivers Project in association with the Research and Advisory section of
Teagasc to augment the Code of Good Agricultural Practice to Protect Waters from Pollution by Nitrates
by advising on the appropriate timing of manure and fertiliser applications according to hydrological
criteria and incorporates a procedure for minimising the impact of out-of-season manure applications.
T he hydrological risk assessment process involves defining the “drainage class” of the predominant soil
in each field. Drainage information is available as part of the Soil Survey of Ireland. Detailed county based
soil survey maps are available for a number of counties. Those completed include Wexford, Carlow,
Kildare, Laois, Meath, Westmeath, Clare, Limerick, Leitrim, Donegal and Tipperary (NR). Others which
are partially complete include: Cork (West Cork complete only), West Mayo (mapped/no report), Offaly
(surveyed/not published) and Waterford (surveyed/not published). There are six drainage classes and
they are Excessive, Well, Moderate, Imperfect, Poor and Very Poor. These can be ranked as having low,
medium or high risk of overland flow as defined in Table A1.
Table A1. Relationship between “Drainage Class” and the “Hydrological Risk Assessment”
classes.
Hydrological Risk Drainage Class
Green (Low) Well, Moderate
Yellow (Moderate) Imperfect
Red (High) Poor, Very Poor, Excessive
There are a number of steps in defining the “Classification” of a field (or management unit).
1. Obtain a farm map and identify the soil type and drainage class for each field on the farm. Exclusion
zones [around wells, streams, etc.] are delineated and colour coded white.
2. Identify wet or waterlogged areas using a visual survey (e.g. position on the landscape
or the presence of water tolerant vegetation) and discussion with the farmer. These areas are
coloured red (high risk).
3. All other fields are colour coded according to their drainage class (from soil survey map) as
either green, yellow or red, as identified in Table 1.
4. Where doubt exists in regard to drainage class, and where considered necessary (e.g. good
hydrological connection of field to watercourse), then an onsite examination of the soil
by augering to a depth of 60cm should by carried out. Any mottling (a mixture of grey and
reddish colours in the profile) of the soil above 50 cm indicates recent water table fluctuations in
this layer and a risk of overland flow. Mottling between 25 and 50cm indicates a medium risk
(yellow). Mottling above 25 cm indicates high risk (red)

157
An assessment of “hydrological connection” should also be carried out where all surface drains and
streams/rivers are mapped. It is also necessary to ascertain whether there are any sub –surface
drains by asking the farmer. The three hydrological risk classes are further defined as follows:
High Risk (Red):
These soils can be divided into two groups.
Wet waterlogged fields. These areas are waterlogged for most of the year. They generally have water
tolerant vegetation present such as rushes. They have very poor drainage and are classified as high
risk in terms of potential for overland flow
Excessively drained soils. These are areas that are excessively well drained and they are
considered to be high risk in terms of potential for rapid sub surface flow.
Manures and fertilisers should only be applied to these areas between May1st and September 30
th.
Moderate Risk (Yellow):
These soils have imperfect drainage. They are described as having a medium risk of overland flow and
nutrient losses to water. Manure applications to these areas should only occur within the period May to
the end of September; however, where extended periods of dry weather allows, one application may be
spread in April.
Low Risk (Green):
These soils are described as moderately or well-drained soils. They are classed as having a low risk of
overland flow and therefore this land is the most suitable for spreading and should be spread on first. The
recommended period of application on these areas is Jan 15 to end Sept, allowing for restrictions within
the code. There may be a number of different areas of differing hydrological risk in one field. If the
areas of differing of hydrological risk are significant in size, then it may be necessary to divide the field
into a number of management units, each management unit representing a different hydrological risk area.
However, if there are small areas of different hydrological risk, i.e., the corner of a field, then it is not
practical to divide the field into different management units.

[IS1][IS1]Page: 153
[IS1]