eurostat – unit d5 key indicators for european policies european conference on quality in official...
TRANSCRIPT

Eurostat – Unit D5 Key indicators for European policies
European Conference on Quality in Official Statistics, Q2010
Helsinki, 4-6 May 2010Helsinki, 4-6 May 2010

Eurostat – Unit D5 Key indicators for European policies
European Conference on Quality in Official Statistics, Q2010
Back-calculation of European aggregates: some general considerations
By Gian Luigi Mazzi, Filippo Moauro,
Rosa Ruggeri Cannata
Helsinki, 4-6 May 2010

Eurostat – Unit D5 Key indicators for European policies
Outline
Background Limits of the exercise Outline of a Eurostat strategy
– Main requirements of a Eurostat strategy – Characteristics of the developed methodology– Ongoing activities
An empirical example: the euro area IPI Future actions Conclusions

Eurostat – Unit D5 Key indicators for European policies
Background (1)
Long time-series are requested by main users Several reconstructed long series available Relevant for macroeconomic studies, BC analysis Impossible to maintain official long time-series: missing past
values, revisions of definitions/classifications, ecc.. Replication back into the past for a short period only A simpler way use of statistical and econometric methods PEEIs one of Eurostat's priorities

Eurostat – Unit D5 Key indicators for European policies
Background (2)
Rationalisation among practices is in line with the principle of the Commission "Communication on the production method of EU statistics: a vision for the next decade", aiming to define generic methods applicable across domains
Availability of long time-series for euro area and EU will represent for Eurostat a great contribution to the use of PEEIs.
It will increase the quality of flash-estimates and SA data In the Eurostat quality framework, improvement of the
coverage dimension The definition of a plan will meet users' requirements … raising Eurostat's visibility, credibility and reputation.

Eurostat – Unit D5 Key indicators for European policies
Scope of the exercise
The exercise does not imply a micro-level back-calculation Mainly targeted to main aggregates with a limited breakdown. Its aim is not to change the past pattern of the series … but to keep it unchanged (turning points, cyclical shape) Preserve the historical characteristics of the series We don’t want to "rewrite" the history This exercise homogenisation of existing, partially
overlapping segments of time series eliminating breaks and inconsistencies.
This is in line with users' expectations involved in BC analysis and econometric modelling

Eurostat – Unit D5 Key indicators for European policies
Main requirements of the Eurostat strategy
Use of maximum possible observational content The method statistically sound-documented-easily
understandable and publicly available Specific metadata attached to the results Replicable methodology … applicable both to non SA and SA data Method easy to maintain Reconstructed long series distinguished from official versions Avoid questionable results (e.g. calculation of EU-27 back to '70s) Target: back to 1970; euro area 12 and EU 15 aggregates

Several alternative methods explored Linear dynamic models could conduct towards
explosive results Non-invertibility of most macro-economic series Simple regression models is a guarantee of quality
in the results• complemented by benchmarking
• preservation of growth rates
Eurostat – Unit D5 Key indicators for European policies
Statistical approach

Eurostat – Unit D5 Key indicators for European policies
Characteristics of the developed methodology
Simple and robust method based on linear regression models Hypothesis overlap between the target series and a proxy A similar approach is also adopted for annual national
accounts. Overlapping sub-periods all the information at national level Temporal and sectoral, linear and non linear aggregation
constraints are taken into account SA data consistency with the approach currently used in
Eurostat

Eurostat – Unit D5 Key indicators for European policies
Outline of the Eurostat strategy:list of experimental back-calculated series
Indicator name BreakdownStarting
date
Industrial Production (IPI) NACE divisions and MIGs 1970
Producers Prices (PPI) NACE divisions and MIGs 1970
Turnover index NACE divisions and MIGs 1974
Retail Trade Food, Non food 1970
Unemployment Male, Female, under and over 25 1970
Employment Employees, self-employees NACE A6 1970
Building permits Total 1970
Nights spent in Hotels Resident/Not resident 1990
Wages and salaries NACE A6 1971
National Accounts main aggregates NACE A6 1970

Eurostat – Unit D5 Key indicators for European policies
Validation of results
Complex exercise involving several iterative steps Our effort development of a comprehensive validation
strategy The quality checks similarity of the pattern between the
official series and back-calculated ones absence of unjustified breaks or outliers sufficient degree of smoothness ability to reproduce past turning points reliability of results compared to alternative methods attentive graphical analysis.

Eurostat – Unit D5 Key indicators for European policies
Ongoing activities
So far, statistical validation IPI, PPI, Turnover index, Unemployment, Employment, Building permits, Nights spent in Hotels and National Accounts
results in line with desired quality standards Back-calculation of NACE Rev 2 data already
implemented for short term business statistics
Eurostat – Unit D5 Key indicators for European policies
An example of back-calculation:the euro area Industrial Production Index (IPI)
Target series: (denoted new series)
- total industry (excluding construction)
- country series and euro area 12 aggregate (EA12)
- Monthly WDA index 2005=100 from January ‘96
- under the new NACE Rev.2 Related indicators: (denoted old series)
- historical indexes by country
- extracted from Eurostat, OECD and NSIs
- available from January ’70 (Ireland from ’76)
Eurostat – Unit D5 Key indicators for European policies
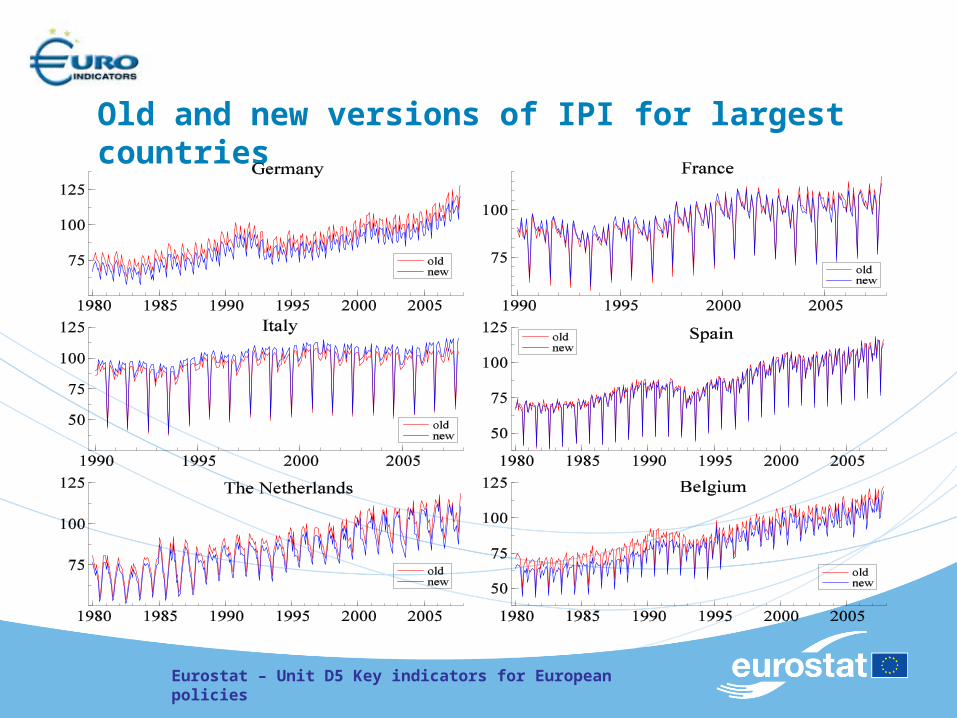
Old and new versions of IPI for largest countries
Eurostat – Unit D5 Key indicators for European policies
The back-calculation procedure of IPI
Fit a linear regression to the new IPI for each country
Specification: log-differences Set of regressors: old IPI + detrministic variables Sample: overlapping period General to specific approach Computation of the euro area EA12 aggregate

Eurostat – Unit D5 Key indicators for European policies
The resulting EA12 series:comparison with main related indicators
Eurostat – Unit D5 Key indicators for European policies
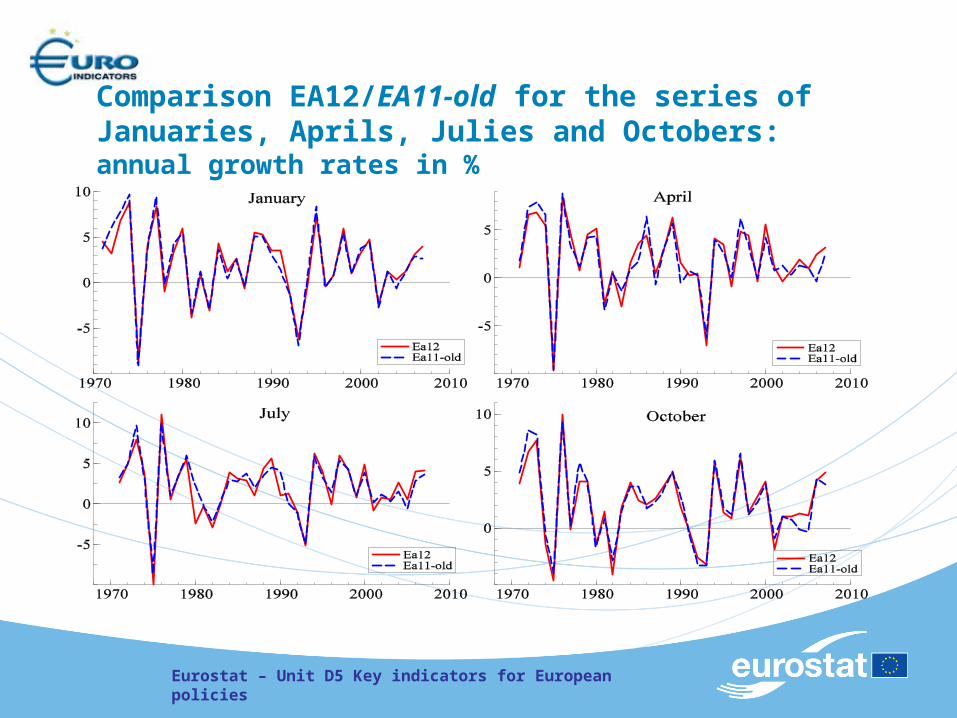
Comparison EA12/EA11-old for the series of Januaries, Aprils, Julies and Octobers: annual growth rates in %

Eurostat – Unit D5 Key indicators for European policies
Conclusions and future actions
Sound methodology Based on static linear regression modelling approach Easy to maintain and to replicate Easily applicable by Member States too A common back-calculation approach will increase:
1) the comparability of back-calculated series;
2) the reliability of European aggregates