european wind services study find out which way the wind blows
TRANSCRIPT

European Wind Services StudyFind out which way the wind blows


European Wind Services StudyFind out which way the wind blows

Contents
2
3 Introduction
4 Executive Summary
6 Part I: European wind services – market size, market growth and competitive structure
11 Part II: European wind services market – opportunities, threats and challenges
17 Part III: Investment in wind services
22 Research Design and Methodology

European Wind Services Study 3
Wind energy is certainly one of the most fascinating
types of power generation among alternative energies:
zero costs and emissions as far as its origination is
concerned, high power generation in steady wind
regions and cost competiveness with traditional energy
sources in an increasing number of regions. No surprise:
the wind energy sector has been one of the fastest-
growing and most dynamic industries in Germany and
Europe over the past decade. So far, key stakeholders
such as wind turbine manufacturers (OEMs), project
financiers, investors, wind park developers and operators
have focused on the development and installation of
on- and increasingly off-shore wind parks – size and
volume matters. The long term, stable cash flows of
wind parks are proving attractive in volatile markets with
low government bond returns.
With installed capacities steadily increasing, the demand
for service and maintenance has also constantly risen.
The European wind services market is expected to reach
€4.5 billion in 2020 from €2.3 billion in 2011. These
solid growth prospects, a fragmented field of service
providers, and international growth prospects should
present interesting buy-and-build strategies for financial
investors. It is anticipated that by 2020, turnovers and
margins in the maintenance business are expected to be
more attractive than the construction of onshore and
offshore wind farms. With increasing numbers of wind
turbines coming out of their warranty periods over the
coming years the market will open up to a large number
of new participants. Shifts in value chains and market
models are likely to contribute to significant new market
opportunities also in new geographies.
Taylor Wessing together with Deloitte undertook
an expert survey of European wind services market
participants in the spring/summer of 2012 as well as
commissioning primary market research. The key market
trends and outlook are summarised in our study. This
should be an interesting read for anyone concerned
with wind energy – especially investors and funders.
David Krüger (Deloitte)
Carsten Bartholl (Taylor Wessing)
Introduction
David Krüger
Partner Deloitte
Leiter Cleantech
+49 (0)89 29036 8827
Carsten Bartholl
Rechtsanwalt
Partner Taylor Wessing
Industry Group Head
Energy & Environment
Tel +49 (0)40 3 68 03 108

4
ISPs and OEMs in the European wind services
market
The European wind services market has historically been
dominated by OEMs with a market share of 63% in
2011. Major regional OEMs include Enercon, Gamesa,
Nordex, Repower and Siemens. As an increasing number
of wind turbines come out of their initial OEM warranty
maintenance contracts, increasing opportunities are
being presented for ISPs to gain market share. This
increasing number of post-warranty maintenance
contracts in the market and possible advantages of ISPs
in respect of cost efficiency, local market knowledge
and accessibility is likely to drive an increase in their
European market share from the 25% experienced in
2011.
Historically, OEMs have typically signed O&M contracts
covering two to five years. To help retain market
share, OEMs are increasingly seeking to sign long-
term warranty contracts / full service agreements
(including performance guarantees for the WTG) of
– in some cases – up to twenty years for existing and
new customers. The trend to longer terms contracts
is also supported by project financiers who are
increasingly demanding long-term service contracts
to lower cash flow volatility and wind farm owners
seeking performance guarantees and predictable
maintenance costs. OEMs see the wind services market
as an opportunity to diversify their business and secure
an additional source of revenues in an increasingly
competitive WTG market.
Our study included an assessment of leading European
ISPs and OEMs from the perspective of their business
coverage (onshore/offshore), functional/service scope,
competitive outlook and industry challenges. The
following eleven key findings summarise the outcomes
of our study:
1. The €2.3 billion European wind services market has
strong growth prospects driven by ageing wind parks
and an increasing installed base
2. While Germany, Spain and the UK are the largest
wind services markets, geographic shifts will require
new service delivery footprints
3. The current market is largely onshore and OEM
dominated but significant changes are expected
to 2020. The ongoing dominance of OEMs in the
offshore segment would not preclude new entrants
engaging as subcontractors
4. Offshore has the highest profitability expectations
and the greatest scope for efficiency improvements
5. O&M cost reductions are likely be realised through
technological improvements and reductions in
offshore transport and logistics
6. The most important requirements for successful
services companies are price, quality and
responsiveness
7. European firms are expected to be well positioned to
counter international market entrants
8. The largest industry challenges will be the availability
of infrastructure and qualified personnel
9. Wind services are viewed favourably compared to
other renewable sectors. Growth prospects and
international expansion are particularly attractive
10. Service wind - Central-Europe the place to invest
(now) on a mid term basis
11. Midsize and full service maintenance – the perfect
target company
Executive Summary

European Wind Services Study 5
Table 1 – Market Characteristics Onshore/Offshore
Onshore Offshore
Investment cost rather low
high, in particular for planning, construc-
tion, infrastructure, and grid connection
Power generation
structures decentralized centralized
Power yield
lower as compared to offshore, due to
stronger fluctuation
constantly high, owing to more
favourable wind conditions (approx.
double the amount of full-load hours as
compared to onshore)
Technology mature technology
higher technological requirements due
to heavier stress; considerable saving
potential in the cost of energy is to be
expected only in the years to come
Infrastructure more than 20 years lead in experience
high demands on maritime logistics etc.
and substructure/foundations as water
levels rise
Risks calculable and insurable
high, both under the technological and
financial aspect, currently hard to insure
Feed-in compensation lower after Renew. Energy Sources Act
higher after Renewable Energy Sources
Act
Public perception
basically positive, civic participation
possible, but increasing protests against
new wind energy plant projects positive, but sluggish development
Development potential
low, as good locations have already
been occupied and technological effects
largely exploited
high, since development has only just
started and offers huge potential
Funding requirement relatively low
very high, bank loans problematic due to
financial crisis
Grid extension
less relevant, since grid connection
usually exists
prerequisite, grid connection yet to be
realized at enormous cost
Market and players many investors, rather diversified
highly-capitalized international investors,
major utility companies
Service requirements lower, since easy to reach
complex, due to distance and weather
conditions, high downtime costs
6
I.1: Finding 1
The €2.3 billion European wind services market has
strong growth prospects driven by ageing wind
parks and an increasing installed base
The global wind services market is expected to grow
from €4.6 billion to reach €10.8 billion in 2020 with a
Compound Annual Growth Rate (CAGR) of 10% (figure
1). This compares with a historical CAGR of 18% from
2005-2011. The European market comprised 51% of
the global market in 2011 and while the most significant
region its CAGR of 11% over 2005 to 2011 lagged the
global rate. Similarly, the European CAGR to 2020 of
7% is somewhat less than the 10% projected globally.
Similarly, the European CAGR to 2020 of 7%, reaching
4,5 billion in 2020, is somewhat less than the 10%
projected globally.
The slower growth in Europe (s. figure 2) largely reflects
the relative maturity of the European wind market. It
is the oldest and largest operations and maintenance
(O&M) market.
Historically, European wind services were most strongly
driven by:
by well established feed-in tariffs and other forms of
government incentives or tax rebates;
associated maintenance; and
also age related.
These drivers are expected persist to 2020 and new
growth is in particular expected from the offshore
segment. The age of the installed wind capacity is a
critical revenue driver as O&M costs for newer turbines
are estimated at only 10% of the annual cost of power
generation rising to as high as 35% by the end of a
turbine’s life. As Figure 1 illustrates, the global offshore
wind services market was historically a European one,
and reached ca. €210 million in 2011. Europe will
continue to dominate offshore in terms of size and
growth, with a CAGR of 19% from 2012 to 2020.
This sharply contrasts with the more mature European
onshore market. The European market share in the
global onshore O&M market is expected to reduce from
49% in 2011 to 34% in 2020 reflecting stronger growth
rates in installed capacity outside of Europe in particular
in the Asian and North American markets.
I.2: Finding 2
While Germany, Spain and the UK are the largest
wind services markets, geographic shifts will require
new service delivery footprints
The European wind power industry has benefited
historically from well established Government financial
support and incentives reflecting, inter alia, the
European Union’s “20-20-20” plans to reduce CO2
emissions by 20% and include 20% renewable energy
based generation in its total energy mix by 2020. As
illustrated in figure 3, the European wind services
market is dominated by the well developed and mature
German, Spanish and UK markets which have both
significant installed capacity and a larger proportion of
older turbines requiring regular maintenance. In 2011
Germany accounted for the greatest share of wind
services revenues with €1.0 billion (44%), followed by
Spain (28%) and the UK (13%).
It is worth noting that Spain, in contrast to other
European markets, is expected to see its annual O&M
revenues decrease over the years to come (s. figure 3).
Part I: European wind services – market
size, market growth and competitive
structure

European Wind Services Study 7
Source: GBI Research
€m
Market size global – Onshore Market size global – Offshore
Market size Europe – Onshore Market size Europe – Offshore
0
2.000
4.000
6.000
8.000
10.000
2020201920182017201620152014201320122011201020092008200720062005
Fig. 1 – Global and European wind services market revenues
Source: EWEA/GBI Research
€m GW
Market size global – Onshore (€m)
Market size global – Offshore (€m)
Cumulative wind capacity – Onshore (GW)
Cumulative wind capacity Europe – Offshore (GW)
0
500
1.000
1.500
2.000
2.500
3.000
2020201920182017201620152014201320122011201020092008200720062005
0
50
100
150
200
Fig. 2 – European wind services market size and wind power capacity
Source: GBI Research
UK OtherSpain Germany
0
2020201920182017201620152014201320122011201020092008200720062005
€m
5.000
4.000
3.000
1.000
1.000
Fig. 3 – European wind services revenues by country
8
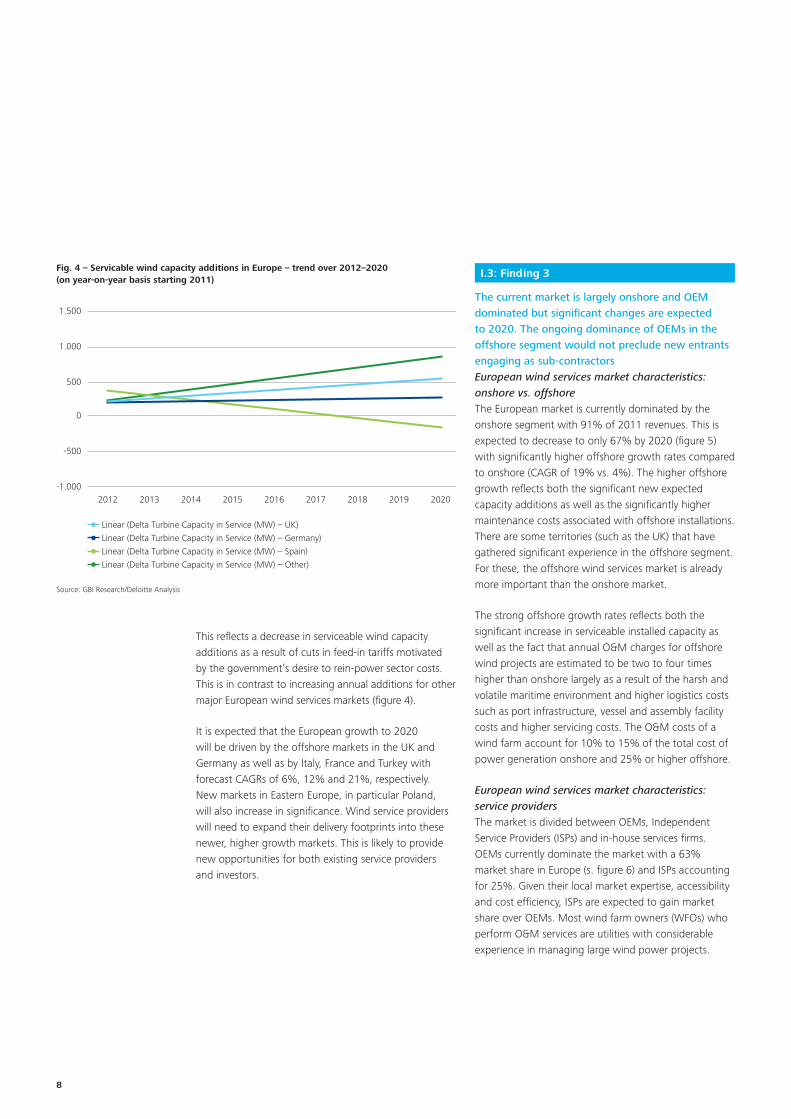
This reflects a decrease in serviceable wind capacity
additions as a result of cuts in feed-in tariffs motivated
by the government’s desire to rein-power sector costs.
This is in contrast to increasing annual additions for other
major European wind services markets (figure 4).
It is expected that the European growth to 2020
will be driven by the offshore markets in the UK and
Germany as well as by Italy, France and Turkey with
forecast CAGRs of 6%, 12% and 21%, respectively.
New markets in Eastern Europe, in particular Poland,
will also increase in significance. Wind service providers
will need to expand their delivery footprints into these
newer, higher growth markets. This is likely to provide
new opportunities for both existing service providers
and investors.
I.3: Finding 3
The current market is largely onshore and OEM
dominated but significant changes are expected
to 2020. The ongoing dominance of OEMs in the
offshore segment would not preclude new entrants
engaging as sub-contractors
European wind services market characteristics:
onshore vs. offshore
The European market is currently dominated by the
onshore segment with 91% of 2011 revenues. This is
expected to decrease to only 67% by 2020 (figure 5)
with significantly higher offshore growth rates compared
to onshore (CAGR of 19% vs. 4%). The higher offshore
growth reflects both the significant new expected
capacity additions as well as the significantly higher
maintenance costs associated with offshore installations.
There are some territories (such as the UK) that have
gathered significant experience in the offshore segment.
For these, the offshore wind services market is already
more important than the onshore market.
The strong offshore growth rates reflects both the
significant increase in serviceable installed capacity as
well as the fact that annual O&M charges for offshore
wind projects are estimated to be two to four times
higher than onshore largely as a result of the harsh and
volatile maritime environment and higher logistics costs
such as port infrastructure, vessel and assembly facility
costs and higher servicing costs. The O&M costs of a
wind farm account for 10% to 15% of the total cost of
power generation onshore and 25% or higher offshore.
European wind services market characteristics:
service providers
The market is divided between OEMs, Independent
Service Providers (ISPs) and in-house services firms.
OEMs currently dominate the market with a 63%
market share in Europe (s. figure 6) and ISPs accounting
for 25%. Given their local market expertise, accessibility
and cost efficiency, ISPs are expected to gain market
share over OEMs. Most wind farm owners (WFOs) who
perform O&M services are utilities with considerable
experience in managing large wind power projects.
Source: GBI Research/Deloitte Analysis
Linear (Delta Turbine Capacity in Service (MW) – UK)
Linear (Delta Turbine Capacity in Service (MW) – Germany)
Linear (Delta Turbine Capacity in Service (MW) – Spain)
Linear (Delta Turbine Capacity in Service (MW) – Other)
-1.000
-500
0
500
1.000
1.500
202020192018201720162015201420132012
Fig. 4 – Servicable wind capacity additions in Europe – trend over 2012–2020
(on year-on-year basis starting 2011)

European Wind Services Study 9
As illustrated in figure 6, a significant variation in market
segmentation is evident across Europe. In the UK and
Spain, wind services are more strongly dominated by
OEMs. The higher proportion of offshore wind farms
in the UK where OEMs are more strongly positioned is
a key explanation. ISPs have a market share of 33% in
Germany versus 25% in the whole of Europe. This is
primarily because of the market maturity and a larger
proportion of the installed capacity has been “off
warranty” allowing a more developed ISP market.
Source: GBI Research
Onshore Wind O&M Market
Offshore Wind O&M Market
91%
9%
67%
33%
Fig. 5 – European wind energy operations and maintenance market in 2011 and 2020
Source: GBI Research
OEM
ISP
WFO (In-house)
12%
20%
68%
12%
33%56%
10%
30%
60%
12%
25%
63%
Fig. 6 – European wind services market shares by segment and
country in 2011

10
Competitive outlook
Wind services competition is set to intensify in the near
term. An increasing number of European wind turbines
are completing their initial OEM warranty service
contracts with a significant increase in post-warranty
maintenance contracts. This is a key driver of medium
term wind service revenues and will strongly influence
competitive behavior between OEMs and ISPs as wind
farm operators seek to sign new O&M contracts. In
addition, the increased demand for the refurbishment
of components will also provide attractive entry points
for ISPs. Generators and gearboxes typically need
refurbishment twice in a wind turbine generator’s life
and the significant number of turbines installed in 2004
to 2005 will need refurbishment in the short term.
European ISPs have recognised the significant
opportunity to gain market share in the post-warranty
market and gain access to new markets such as in
Italy, France and Poland as well as to enter the offshore
market. A number of European ISPs have also taken the
step of expanding internationally to the North American
market.
To maintain their market share and to lock out ISPs,
OEMs are increasingly signing long-term contracts
ranging from five years to 20 years for both new
and existing customers. This compares with contract
durations of only two to five years in the recent past.
This shift to long-term contracts
by OEMs is not only a defensive strategy to protect
against ISP market share gains but is also in response to
project financiers who are increasingly demanding long-
term service contracts to lower cash flow volatility, and
wind farm owners that are also seeking performance
guarantees and stability.
The decrease in OEM market share is also supported by
our survey respondents with 46% expecting a strong
to heavy decoupling of the services business from the
OEMs in their onshore home markets over the next five
years. This reduces to 26% for the offshore market,
possibly reflecting the higher barriers to entry, capital
intensity and risk profile (figure 7).
In-house market share gains are likely to be from energy
companies with a strong track record and scale in
managing large wind parks.
The increasing growth opportunities for ISPs both in
existing markets and new territories as well as the higher
capital intensity required in servicing the offshore market
are likely to present attractive investment opportunities
for both strategic and private equity investors.
Increase Strong increaseEqualDecrease
0%
10%
20%
30%
40%
50%
60%
In-houseISPsOEM
20,6%24,2%
12,1%
9,1%
30,3%
52,9%
2,9%
2,9%5,7%
18,6%
5,7%
51,4%
Source: Deloitte/Taylor Wessing – European Wind Services Study
Percentage of respondents
Fig. 7 – Offshore: How will market share change over the next five years?

European Wind Services Study 11
Part II: European wind services market –
opportunities, threats and challenges
II.1: Finding 4
Offshore has the highest profitability expectations
and the greatest scope for efficiency improvements
Profitability and efficiency improvements
Survey respondents have strongly differentiated
between the future profitability trends in onshore and
offshore. In the onshore segment, either constant or
declining margins are expected by a significant majority
(figure 8). This is likely to reflect a more mature industry,
lower barriers to entry and increasing competition
relative to offshore.
The offshore O&M market is largely expected to
demonstrate either constant or rising margins. This
is likely to reflect the higher barriers to entry, supplier
concentration, and strong cost reduction potential with
associated scope for margin capture.
Source: Deloitte/Taylor Wessing – European Wind Services Study
OffshoreOnshore
0%
10%
20%
30%
40%
50%
Strongly risingRisingConstantDecliningStrongly declining
37,0%34,8%
17,4%
47,8%
10,9%
41,3%
0% 2,2%4,4% 4,4%
Percentage of respondents
Fig. 8 – What expected changes to EBIT margins in the future?

12
As presented in figure 9, survey respondents were
optimistic as to the scope for efficiency improvements
with the most significant potential being offshore. 31%
and 61% of respondents see strong to heavy scope
for efficiency improvements in onshore and offshore
respectively. The offshore market is likely to benefit
from significant ongoing scale economies, technology
improvements and learning curve benefits. O&M cost
reduction is critical also for the future competitiveness of
offshore wind versus other generation sources, however
the level of cost reductions that can be achieved still
has a high uncertainty. This is likely to dampen the
enthusiasism of new entrants. However, the strong
growth prospects, scope for margin improvement and
scope for technological and work flow differentiation
make offshore a lucrative segment.
Source: Deloitte/Taylor Wessing – European Wind Services Study
Barely Moderate Strongly Heavily
Onshore Offshore
69%
17%14% 11% 9%
30%
50%
Fig. 9 – What potential for margin improvement through efficiency improvements?
European Wind Services Study 13
II.2: Finding 5
Significant O&M cost reductions are likely be
realised through technological improvements and
reductions in offshore transport and logistics
Cost reduction potential
In our survey, 45% of respondents report that turbine
technology offers the highest potential for onshore
O&M cost reduction followed by spare part/materials
and transportation/logistics (figure 10).
Offshore cost reduction potential is assessed as
highest in the areas of transportation and logistics and
technology. Logistics savings in the offshore segment
are expected to come from improved specification,
maintenance vessel availability and more effectively
planned maintenance.
Technology cost savings will be most strongly driven by
the switch to direct drive turbine technologies which
offer a high potential for cost savings by eliminating the
gearbox, which is one of the major causes of repairs
and also reducing parts by up to 50%. A large number
of leading turbine manufacturers are moving towards
gearless turbines after certain highly publicised gearbox
failures in the last four years. The gearbox is one of
the main causes of breakdowns, requiring regular
repairs in a turbine. This need is eliminated by the DDT
technology. This is particularly attractive for the larger
turbines in the offshore segment. While offering scope
for cost reduction DDT at the same time poses a services
revenue threat due to lower maintenance requirements.
The increased use of condition monitoring systems by
wind farm operators improve spare part ordering, work
scheduling and the planning of refurbishment activities.
This gives wind farm operators significant control over
the timings of repair and services and improves plant
availability. The need for plant visits by technical crews
is also reduced as minor repairs can be addressed
remotely.
Other technologies such as tension control
measurement technology can also pose a revenue
threat for wind services. It is a technology for bolted
joints on turbines and maintains tension across the
bolted joint. This prevents up to 90% of bolted joint
failures that arise from insufficient bolt tension in wind
turbine installations and can save 50% of bolted joint
maintenance.
II.3: Finding 6
The most important requirements for successful
services companies are price, quality and
responsiveness
Success factors
The key success factors have a high uniformity between
onshore and offshore: quality and the speed of service
are paramount as these are crucial for ensuring high
turbine availability (figure 11).
OffshoreOnshore
Percentage of respondents
0%
10%
20%
30%
40%
50%
60%
70%
80%
Personnel feesData monitoring/
SCADA/IT-costs
Transportation
and logistic costs
Spare parts/
material costs
Technology
improvements
of the turbines
28,9%
48,9%
29,8%
44,7%
12,8% 4,4%
6,7%
6,4%
8,9%
2,1%
Fig. 10 – What offers the highest potential for service cost redection?
Strongly (Offshore) Heavily (Offshore)Heavily (Onshore)Strongly (Onshore)
Source: Deloitte/Taylor Wessing – European Wind Services Study
0%
20%
40%
60%
80%
100%
Duration of contactPricing and
price adjustment
Service scopeServicequality
and speed of reaction
60,0%67,4%
23,9%
37,5%
46,3%26,1%
58,7%
41,5%
17,5%13,0%
69,6%67,5%12,5%
8,9%
46,7%50,0%
Percentage of respondents
Fig. 11 – What are the most important service company requirements?

14
Both OEMs and ISPs will give close consideration to
how to effectively manage logistic costs but at the same
time improve reaction times. Some OEMs have chosen
to significantly build out their geographic technician
footprint to lower onshore logistic costs. Large OEMs
will also look to partner with local ISPs to offset
logistics costs and maintain more efficient and flexible
manpower structures.
As noted earlier, both wind park project financiers and
operators are increasingly demanding longer contract
durations to manage risk to cash flows and OEMs in
particular are responding with contract durations of up
to twenty years. However, a lot of additional potential
for ISPs lies in the provision of technical management
services which in most cases are not offered by OEMs
(but are also often provided in house by larger WFOs).
It is likely that a number of wind farm operators will
increasingly seek to more discretely define the service
scope provided by OEMs and ISPs with an increasing trend
towards in-sourcing in particular in respect of condition
monitoring activities. In-sourcing of condition monitoring
will allow operators to more actively steer maintenance
programs and still allow service delivery flexibility.
All these arrangements unavoidably increase the
demand for effective supply chain management and
also the management of interfaces between OEMs, ISPs
and in-house WFOs. This demand is more complex in
the offshore segment in particular in respect of vessel
availability, port infrastructure and engineering services.
II.4: Finding 7
European firms are expected to be well positioned
to counter international market entrants
International players
92% of the survey participants see European firms
as very well positioned to comparably positioned to
foreign entrants (figure 12). This can be explained by
the local market advantages in delivering against the
success factors outlined on the prior page. Compared
to non-European competitors, the service providers in
Europe have a much stronger local logistics network and
delivery footprint, understand local market conditions
and are more responsive to market requirements and
developments. The long operating history in the mature
European wind services market is also likely to give the
local European service providers deeper experience
and competence and underpin service quality and cost
performance.
The Asian competitors are likely to be OEMs gaining
medium term market share principally in Eastern Europe
and in the onshore segment. The Asian wind services
market is most strongly dominated by OEMs with an
87% market share in 2011 (versus 63% in Europe)
(figure 13).
II.5: Finding 8
The largest industry challenges will be the
availability of infrastructure and qualified personnel
Industry challenges
The survey respondents identified industry challenges
that are not atypical to fast growing sectors (figure 14).
These challenges include:
engineering and logistic backgrounds;
infrastructure (e.g., maritime vessels) and
and scope
Very badly positioned
Badly positioned
Comparable positioned
Well postitoned
Very well positioned
13%7%
37%
2%
41%
Fig. 12 – How do you rate the competitiveness of your home
country's service companies in comparsion to foreign firms?

European Wind Services Study 15
Strongly (Offshore) Heavily (Offshore)Heavily (Onshore)Strongly (Onshore)
Source: Deloitte/Taylor Wessing – European Wind Services Study
Percentage of respondents
0%
20%
40%
60%
80%
100%
Economies of
scale/scope
Liability/riskAccess to know-
how (e.g. technology)
Growth & related
infrastructure
Qualified employees
42,2%
44,4%
38,5%
53,8%
68,9%
11,1%
55,3%
15,8%
45,5%
29,6%
52,6%
31,6%
54,6%
18,2%
55,3%
34,2%
46,5%
20,9%
55,3%
21,1%
Fig. 14 – What are the most important industry challenges?
1 No responses in respect of Latin America, Africa, Australia, and UAE.
Source: Deloitte/Taylor Wessing – European Wind Services Study
Percentage of respondents
0%
10%
20%
30%
40%
50%
North AmericaAsiaEastern EuropeCentral Europe
31,3%
12,5%
31,3%
43,8%
Fig. 13 – In your opinion, where will your home market's strongest competitors come from
in the next five years1?

16
The lack of qualified technicians to undertake wind park
O&M activities is one of the biggest challenges in the
wind services business globally. The technicians must
be able to manage around the physically challenging
environment, working at great heights and understand
the relevant serviceable technologies such as hydraulics,
mechanics and IT. The training period to acquire the
required skills is lengthy and market demand has
significantly outpaced the availability of new technicians.
Many wind OEMs, ISPs and WFOs are planning to
double or triple their workforce in the next three to four
years underlining the size of the manpower challenge.
Managing around the strong growth in wind services
and right sizing the required infrastructure is viewed
as a significant challenge both onshore and offshore.
This includes having appropriate systems and
processes in place, building up Supervisory Control
and Data Acquisition (SCADA) infrastructure as well as
appropriately managing logistics infrastructure versus
alternate models such as outsourcing.
For the offshore segment in particular, the operating
environment issues and immaturity of the market
heighten the importance of access to the right know-
how and technologies and ensuring that the risk/return
parameters are commercially managed.
Financing, the availability of spare parts, wages, or
technical standards are not viewed as challenges for
either onshore or offshore.
The wind services market dynamics will significantly
depend on how the industry players view and deal with
the above challenges. There is a need to strike a difficult
balancing act, between capturing market growth
opportunities and ensuring the right level of delivery
capability and risk parameters. Certainly the financial
strength, most likely to be associated with larger OEMs,
will be increasingly important in being able to absorb
certain risks and scale the business in particular in
looking at offshore and committing to longer contract
durations. ISPs or smaller players might need to secure
additional growth capital or consider merger or joint
venture opportunities to both fully realise economies of
scale and manage risk.

European Wind Services Study 17
Part III: Investment in wind services
III.1: Finding 9
Wind services are viewed favourably compared to
other renewable sectors. Growth prospects and
internationalization expansion are particularly
attractive
Investors’ views on the industry
More than 50% of respondents view wind services as
more attractive compared to other renewable energy
investments such as solar, biomass or geothermal
energy.
The onshore and offshore segments are differentiated
as to the specific elements making them interesting for
investors. The offshore segment is viewed attractive
as a result of its high growth potential and potential
for realising scale economies (figure 15). The onshore
segment’s secure cash flows and risk return profile are
particularly attractive.
Criteria which matter most in evaluating wind services
targets are:
When it comes to specific investor value creation
strategies, 61% of the respondents would focus on
buy and build activities while 31% would focus on
international expansion (figure 16). This is likely to
include leveraging capabilities developed in the more
mature wind markets into Eastern Europe as well as
taking offshore wind expertise into new jurisdictions.
Source: Deloitte/Taylor Wessing – European Wind Services Study
Buy and build
Consolidation
International expansion
61%
31%
8%
Fig. 16 – Which value creation strategy are you pursuing for a
wind services acquisition?
Source: Deloitte/Taylor Wessing – European Wind Services Study
Interesting (Offshore) Very interesting (Offshore)
Very interesting (Onshore)Interesting (Onshore)
0%
20%
40%
60%
80%
100%
Risk-earnings ratioSecure cashflowGrowth perspectiveScaling/
consolidation effects
15,4%
7,1%
85,7%
61,5%
38,5%
92,3%
46,2%
8,3%
23,1%
61,5%58,3%
15,4%
64,3%
38,5%
Percentage of respondents
Fig. 15 – Which elements of the sector make it interesting to you as an investor?

18
III.2: Finding 10
Service wind – Central-Europe the place to invest
(now) on a mid term basis
Investment in wind services companies appears to be
resilient to the vagaries of the European economy. Only
14% of the respondents said that the economic down
turn in Europe strongly influenced their decisions.
Based on the currently installed capacity in Central
Europe and given market potential for wind services it
is not surprising that 60% of the respondents (onshore)
and 45% (offshore) see Central Europe as the most likely
region to offer financing in the following 5 years (Figure
17). Europe evidently is the place where at this point
in time the expertise, the manpower and the market
demand for wind energy services is strongest. But this
may well change over the next years (see Finding 2) –
with an initial investment in a service provider in Europe
now, an investor will be best positioned to then expand
into future growth markets such as Eastern Europe
(10%), Asia (10%) and North America (17%).
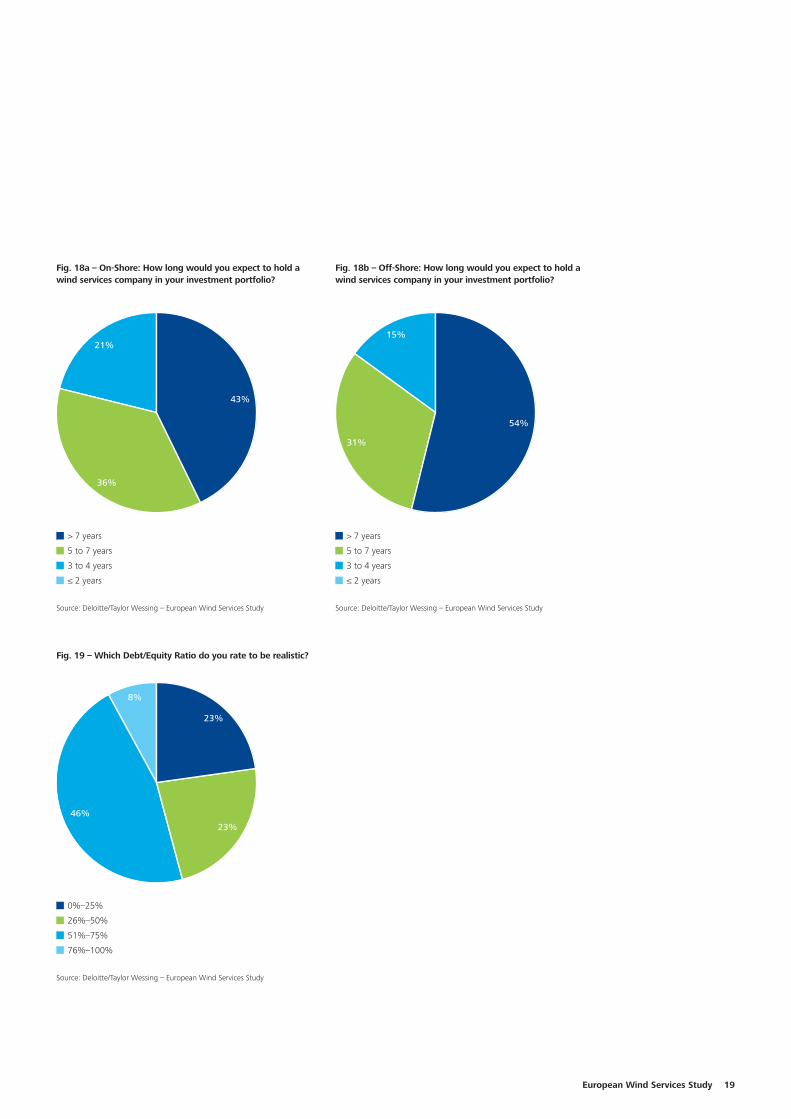
An investment in a wind services company is viewed
as a medium term investment. When it comes to the
question how long an investor would keep a wind
services company in the investment portfolio 57%
(onshore) and 46% (offshore) of respondends viewed
a hold period of less than seven years as appropriate
(figure 18a and 18b). This is consistent with Finding 1
where the expected market growth and geographic
expansion opportunities and associated buy and build
strategies lend themselves well to realising better exit
opportunities over the medium term. Respondents
viewed offshore wind as having a slightly longer
investment horizon perhaps reflecting the earlier stage
of maturity of the sector.
In addition, 54% of participants of the study consider a
debt/equity ratio in the range of 51%–100% as realistic,
which suggests a stable risk return profile and broadly
in-line with the typical 67% rule-of-thumb applied for
non-financial services industries (figure 19).
Source: Deloitte/Taylor Wessing – European Wind Services Study
Percentage of respondents
OffshoreOnshore
0%
10%
20%
30%
40%
50%
60%
70%
UAEAustraliaAfricaLatin Amer.AsiaEast. EuropeNorth Amer.Cent. Europe
47,1
%
0%0%0%0%0%0%0%
64,7
%
17,7
% 11,8
%
11,8
% 5,9% 5,9%
Fig. 17 – In which regions are you likely to offer financing to the wind service sector in the following five years?
European Wind Services Study 19
Source: Deloitte/Taylor Wessing – European Wind Services Study
> 7 years
5 to 7 years
3 to 4 years
≤ 2 years
21%
36%
43%
Fig. 18a – On-Shore: How long would you expect to hold a
wind services company in your investment portfolio?
Source: Deloitte/Taylor Wessing – European Wind Services Study
> 7 years
5 to 7 years
3 to 4 years
≤ 2 years
15%
31%
54%
Fig. 18b – Off-Shore: How long would you expect to hold a
wind services company in your investment portfolio?
Source: Deloitte/Taylor Wessing – European Wind Services Study
0%–25%
26%–50%
51%–75%
76%–100%
8%
46%
23%
23%
Fig. 19 – Which Debt/Equity Ratio do you rate to be realistic?

20
III.5: Finding 11
Midsize and full service maintenance – the perfect
target company
We asked investors what would be the perfect target:
42% of the surveyed experts would prefer a midsize
company with a turnover from €10 to 20 m. For
another 25% the perfect target would be either less
than €10 m or between €20 to 200 m (s. figure 20).
In the view of the respondents these companies should
provide full maintenance (50%), preventive maintenance
(10%) or individual services (10%) (figure 20).
Source: Deloitte/Taylor Wessing – European Wind Services Study
Turnover ≤ 10 Mio €
Turnover 10 to 20 Mio €
Turnover 20 to 200 Mio €
Turnover > 200 Mio €
8%
25%
25%
42%
Fig. 20 – What would be the preferred size of a target
company?

European Wind Services Study 21
When considering which aspects are important to
evaluate whether a target is attractive, experience
and successful management (i.e. know-how and a
highly skilled workforce) is by far the most important
factor (ranked by 60% of the respondents with very
important). Other important factors are – as always
in the renewable energy business – clear and reliable
government guidelines for incentives such as a
predictible feed-in tariff regime and lower market risks
(figure 21). The relatively high ranking for certifications
seems to reflect the need for quality and well
established processes behind the service. Highly ranked
is also the availability of other sources of financing
which reflects possible concerns around current debt
markets and the availability of funds.
Source: Deloitte/Taylor Wessing – European Wind Services Study
Important Very importantLess importantUnimportant
Percentage of respondents
0%
10%
20%
30%
40%
50%
60%
70%
80%
No exaggerated Due Dilligance requests
(incl. timetable for the deal)
Existing costumer relations
High barriers of entry
Low market risk
Little availability of com
petitive technology
Experienced and successful management
Availability of other financial sources to strenghten
the growth plans for the target com
pany
Certifications
Service Level Agreements
Risks are insurable
Low technology risk
Clear guidelines for
incentives and support
Fig. 21 – Which aspects – from experience – matter most to your company when considering investing in the wind service sector?

22
Research Design and Methodology
Deloitte and Taylor Wessing commissioned GBI Research
to undertake primary and secondary research on the
Global and European wind services markets. In addition,
an online survey was undertaken of the onshore and
offshore wind services segments with a focus on:
175 respondents across all sector stakeholders
participated in the survey, covering financiers, product/
component producers, wind farm operators/owners,
energy suppliers, wind service providers (OEMs
and ISPs). Other respondents included a number of
specialists from other firms and research/technology
institutes. The country responses follow the relative
importance of the wind services in the respective
country/regions of Europe.
We thank the participants for the time taken to
complete the survey.
Project Team
David Krüger and Michaela Bichler (Deloitte), Carsten
Bartholl, Peter Hellich and Christian Knote (Taylor
Wessing)


10719 Berlin
Kurfürstendamm 23
Tel: +49 (0)30 25468 01
01097 Dresden
Theresienstraße 29
Tel: +49 (0)351 81101 0
40476 Düsseldorf
Schwannstraße 6
Tel: +49 (0)211 8772 01
99084 Erfurt
Anger 81
Tel: +49 (0)361 65496 0
60486 Frankfurt am Main
Franklinstraße 50
Tel: +49 (0)69 75695 01
Consulting:
Franklinstraße 46–48
Tel: +49 (0)69 97137 0
06108 Halle (Saale)
Bornknechtstraße 5
Tel: +49 (0)345 2199 6
20355 Hamburg
Hanse-Forum
Axel-Springer-Platz 3
Tel: +49 (0)40 32080 0
30159 Hannover
Georgstraße 52
Tel: +49 (0)511 3023 0
Consulting:
Theaterstraße 15
Tel: +49 (0)511 93636 0
50672 Köln
Magnusstraße 11
Tel: +49 (0)221 97324 0
04317 Leipzig
Seemannstraße 8
Tel: +49 (0)341 992 7000
39104 Magdeburg
Hasselbachplatz 3
Tel: +49 (0)391 56873 0
68165 Mannheim
Reichskanzler-Müller-Straße 25
Tel: +49 (0)621 15901 0
81669 München
Rosenheimer Platz 4
Tel: +49 (0)89 29036 0
90482 Nürnberg
Business Tower
Ostendstraße 100
Tel: +49 (0)911 23074 0
70597 Stuttgart
Löffelstraße 42
Tel: +49 (0)711 16554 01
69190 Walldorf
Altrottstraße 31
Tel: +49 (0)6227 7332 60
Our of�ces
Your contacts
For more information please visit our website at www.deloitte.com/de
David Krüger
Deloitte
Partner & Leiter Cleantech
Rosenheimer Platz 4
81669 München
Tel: +49 (0)89 29036 8827
Carsten Bartholl
Partner Taylor Wessing | Industry
Group Head Energy & Environment
Hanseatic Trade Center
Am Sandtorkai 41
20457 Hamburg
Tel: +49 (0)40 3 68 03
Deloitte & Touche GmbH Wirtschaftsprüfungsgesellschaft as the responsible entity with respect to the German Data Protection Act and, to the
extent legally permitted, its affiliated companies use your data for individual contractual relationships as well as for own marketing purposes.
You may object to the use of your data for marketing purposes at any time by sending a notice to Deloitte, Business Development, Kurfürsten-
damm 23, 10719 Berlin or [email protected]. This will incur no additional costs beyond the usual tariffs.
This client information exclusively contains general information not suitable for addressing the particular circumstances of any individual case.
Its purpose is not to be used as a basis for commercial decisions or decisions of any other kind. This client information does neither constitute
any advice nor any legally binding information or offer and shall not be deemed suitable for substituting personal advice under any circum-
stances. Should you base decisions of any kind on the contents of this client information or extracts therefrom, you act solely at your own risk.
Deloitte & Touche GmbH Wirtschaftsprüfungsgesellschaft will not assume any guarantee nor warranty and will not be liable in any other form
for the content of this client information. Therefore, we always recommend to obtain personal advice.
Deloitte provides audit, tax, consulting, and financial advisory services to public and private clients spanning multiple industries. With a globally
connected network of member firms in more than 150 countries, Deloitte brings world-class capabilities and deep local expertise to help clients
succeed wherever they operate. Deloitte‘s more than 195,000 professionals are committed to becoming the standard of excellence.
Deloitte refers to one or more of Deloitte Touche Tohmatsu Limited, a UK private company limited by guarantee, and its network of member
firms, each of which is a legally separate and independent entity. Please see www.deloitte.com/about or www.deloitte.com/de/UeberUns for a
detailed description of the legal structure of Deloitte Touche Tohmatsu Limited and its member firms.
© 2012 Deloitte & Touche GmbH Wirtschaftsprüfungsgesellschaft
Issued 08/2012