european summer update - harris williams
TRANSCRIPT

www.harriswilliams.com
www.harriswilliams.de
European Summer
Update August 2013
63 Brook Street
London W1K 4HS
United Kingdom
Phone: +44 20 7518 8900
Red Norrie
Managing Director
Julien Darmon
Managing Director
Thierry Monjauze
Managing Director
Francois Morin
Director
Jeffery Perkins
Managing Director
An der Welle 4
60322 Frankfurt am Main
Germany
Phone: +49 69 7593 7166

Quarterly Quick Read
European
Economic
Environment1
European M&A
Deal Volume
Activity9
GDP2 Manufacturing
Confidence3 Consumer Confidence3
+25.0%
Inbound
M&A Deal Volume
to Europe9
Consumer Prices3
(0.7%)
M&A
Environment
• European M&A activity declined across nearly all sectors in Q2 2013, falling 7% compared to Q2 2012. However, the pace of
decline has slowed compared with the three previous quarters, amid early signs of improved economic conditions
• UK & Eire accounted for 37% of overall European activity by volume compared to 33% in Q1 2013. M&A activity in the
Benelux region increased by 10% in volume compared to Q1 2013
1
European Equity
Market8
TMT
• Vodafone acquired Kabel Deutschland, Germany’s biggest cable operator, in a €7.7 billion deal and plans on completing the
transaction in the next quarter
• Springer Science+Business Media, the academic and business publisher, was acquired by BC Partners for €3.3bn in the
largest private equity deal in Germany for seven years
Consumer
• EU Consumer Confidence index is on the rise increasing by 4.1 points to reach (17.5). Consumer confidence has improved
for seven consecutive months in EU
• UK retail is gaining momentum with sales volume in Q2 2013 up by 0.9% over Q1 2013 and by 1.8% over Q2 2012,
positively affected by the non-food segment and product discounts
ADG
• 50th International Paris Air Show in June resulted in $150 billion of signed contracts and demonstrated the continuing battle
between Boeing and Airbus, which booked 570 and 327 jet orders in Q2 2013, respectively
• The global airline sector continued to expand at a solid rate in Q2 2013 – the global air travel market expanded by 4.3% in
2013 May YTD compared to the same period in 2012, driven by recovering European market and growth in emerging regions
Healthcare & Life
Sciences
• Senior health officials warned the NHS is facing a potential £30 billion funding gap by 2020
• Thermo Fisher, the US laboratory equipment manufacturer, acquired Life Technologies, the producer of testing equipment
used in DNA analysis, for $13.6 billion
Energy & Power
• The trend of divestures of non-core assets by leading power utility companies such as Dong Energy, Total, Enel, Iberdrola,
E.ON, RWE, and GDF Suez continued in Q2 2013
• International major Oil & Gas companies continue to seek exposure to the European oilfield service and equipment market as
demonstrated by the acquisition of Blohm+Voss Oil Tools by Forum Energy as well as the announced acquisition of Fred
Olsen Production by Yinson
• The IMF estimated a 3.3% increase in global GDP during 2013, down 20 bps from its January 2013 outlook but modestly
above 2012 growth of 3.2%
• Invensys, the UK engineering group, received a takeover approach from Schneider Electric, the French power equipment
group, valuing the company at €3.1 billion. The deal would provide Schneider access to key electro-intensive segments as
well as energy management
Diversified
Industrials
Business Services
• In its recent report, the CBI highlighted the UK’s clear competitive advantage in Business Services and estimates there to be
£30 billion worth of export opportunities in the sector by 2020
• The Big Four accountancy groups appear primed for further expansion in the consulting market, with PwC, Deloitte and E&Y
all linked with potential bids for Roland Berger, the strategy consultant
Notes: For the purposes of this Quarterly Update, Europe is defined as: United Kingdom, Eire, France, DACH (Germany, Austria, Switzerland), Spain, Italy, Benelux
(Belgium, The Netherlands, Luxembourg) and Scandinavia (Denmark, Norway, Sweden and Finland); Evolution calculation based on the quarter finishing 30 June, 2013
(1) For the countries based in the EU27; (2) Year-on-year GDP growth for Q1 2013; (3) PMI, CCI and CPI quarterly growth shown for March 2013- June 2013;
(4) Aerospace, Defence & Government Services; (5) Also includes Building Products and Paper & Packaging; (6) Telecom, Media & Technology; (7) Also includes Speciality
Distribution; (8) For all listed companies based in the countries mentioned above and with a market cap greater than €50m; (9) Change from Q1 2013 to Q2 2013
(6.4%) (1.1%)
TMT6 Consumer Diversified
Industrials5
Transport &
Logistics7 ADG4 Business
Services
Healthcare &
Life Sciences
Energy &
Power
Transport &
Logistics
• Talks have opened between the European Union and the US aimed at removing trade and investment barriers through creating
the world's largest free trade zone
• IATA upgraded global outlook for the airline industry in 2013, forecasting $711 billion of revenues and $12.7 billion profit,
higher than projection in March ($671 billion and $10.6 billion, respectively)
(16.7%)
(0.1%)
0.0%
Sources: Eurostat, Bloomberg, Markit Economics, S&P Capital IQ
(4.2%) (5.9%) 300.0%
(66.7%) (5.9%) 41.7%
4.9%
Last Quarter 2.2% (2.6%) (1.4%) (2.3%) (5.6%) (1.0%) (0.9%) 2.0%
Last Year 29.8% 21.1% 15.6% 15.9% (1.2%) 19.0% 15.1% 20.8%
Last 3 Years 51.4% 23.8% 24.1% 18.6% (8.0%) (1.0%) 25.6% 10.9%
(35.3%) (28.6%)
NM 0.0% (14.3%) (13.5%)
Key Countries % Y-o-Y Growth
Q1 14E Q1 13A
(20%)
(15%)
(10%)
(5%)
0%
5%
10%
(40)
(30)
(20)
(10)
0
10
20
Jun-09 Jun-10 Jun-11 Jun-12 Jun-13
Co
nsu
mer
Pri
ce I
nd
ex (
%)
Co
nsu
mer
Co
nfi
den
ce I
nd
ica
tor
CCI CPI Y-o-Y %
40
45
50
55
60
(10%)
(5%)
0%
5%
10%
Jun-12 Sep-12 Dec-12 Mar-13 Jun-13
PM
I In
dex
Va
lue
Ch
an
ge in
PM
I (M
-o-M
)
Change (M-o-M %) Eurozone PMI
(6%)
(4%)
(2%)
0%
2%
4%
6%
Q4 08 Q2 09 Q4 09 Q2 10 Q4 10 Q2 11 Q4 11 Q2 12 Q4 12 Q2 13E Q4 13E Q2 14E Q4 14E Q2 15E Q4 15E
European Economic Climate
Source: Eurostat, latest available data as of July 19th, 2013
Sources: Bloomberg, Markit Economics, S&P Capital IQ
Notes: (1) Purchasing Managers’ Index – A figure above 50 indicates economic growth, and below 50 indicates decline; (2) European Commission Consumer
Confidence Index Eurozone; (3) Consumer Price Index
Quarterly Real GDP Growth (% Y-o-Y for EU-27)
European Manufacturing Confidence European Consumer Confidence
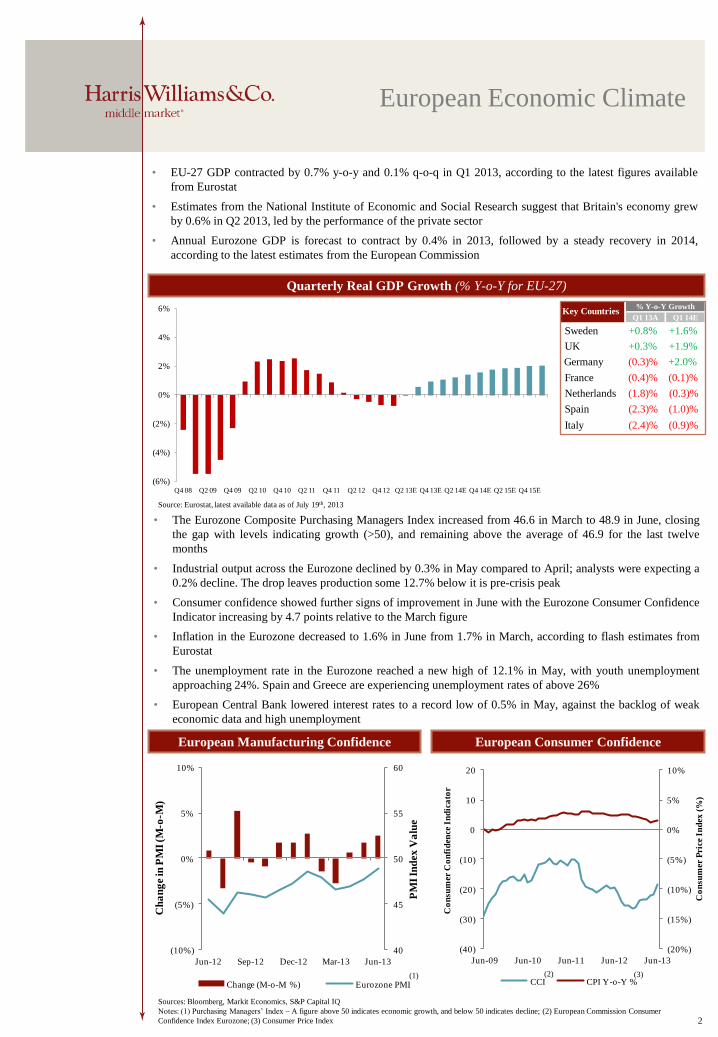
• EU-27 GDP contracted by 0.7% y-o-y and 0.1% q-o-q in Q1 2013, according to the latest figures available
from Eurostat
• Estimates from the National Institute of Economic and Social Research suggest that Britain's economy grew
by 0.6% in Q2 2013, led by the performance of the private sector
• Annual Eurozone GDP is forecast to contract by 0.4% in 2013, followed by a steady recovery in 2014,
according to the latest estimates from the European Commission
• The Eurozone Composite Purchasing Managers Index increased from 46.6 in March to 48.9 in June, closing
the gap with levels indicating growth (>50), and remaining above the average of 46.9 for the last twelve
months
• Industrial output across the Eurozone declined by 0.3% in May compared to April; analysts were expecting a
0.2% decline. The drop leaves production some 12.7% below it is pre-crisis peak
• Consumer confidence showed further signs of improvement in June with the Eurozone Consumer Confidence
Indicator increasing by 4.7 points relative to the March figure
• Inflation in the Eurozone decreased to 1.6% in June from 1.7% in March, according to flash estimates from
Eurostat
• The unemployment rate in the Eurozone reached a new high of 12.1% in May, with youth unemployment
approaching 24%. Spain and Greece are experiencing unemployment rates of above 26%
• European Central Bank lowered interest rates to a record low of 0.5% in May, against the backlog of weak
economic data and high unemployment
(1) (2) (3)
2
UK +0.3% +1.9%
Germany (0.3)% +2.0%
France (0.4)% (0.1)%
Spain (2.3)% (1.0)%
Italy (2.4)% (0.9)%
Netherlands (1.8)% (0.3)%
Sweden +0.8% +1.6%
87%
13%
Strategics Financials
European M&A Environment
Market Observations
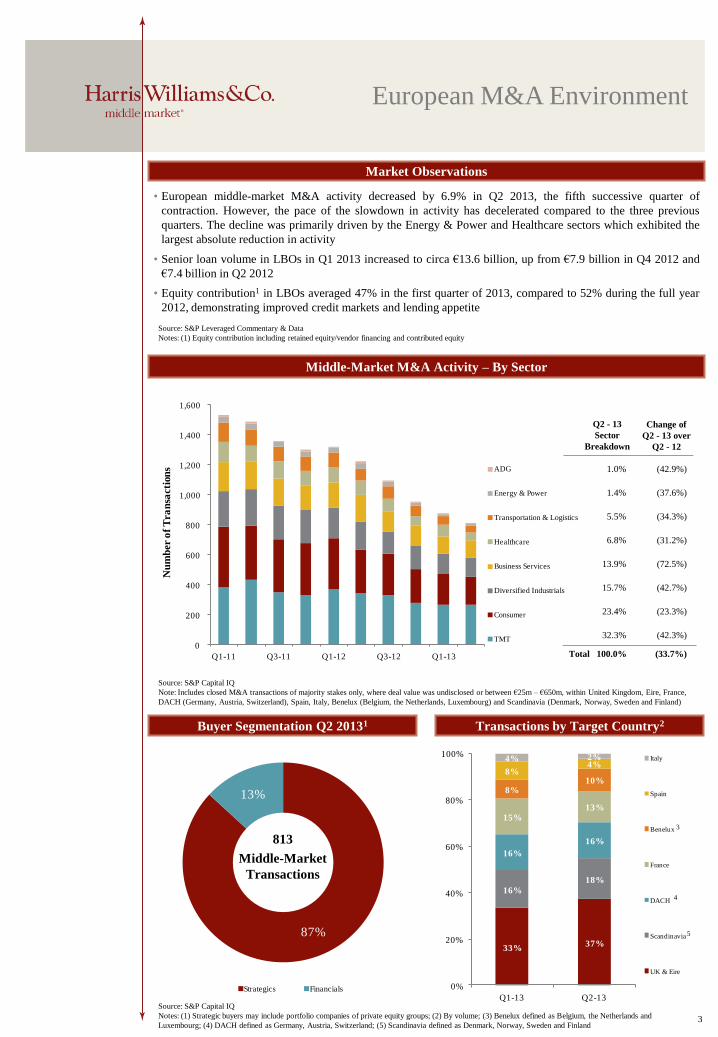
• European middle-market M&A activity decreased by 6.9% in Q2 2013, the fifth successive quarter of
contraction. However, the pace of the slowdown in activity has decelerated compared to the three previous
quarters. The decline was primarily driven by the Energy & Power and Healthcare sectors which exhibited the
largest absolute reduction in activity
• Senior loan volume in LBOs in Q1 2013 increased to circa €13.6 billion, up from €7.9 billion in Q4 2012 and
€7.4 billion in Q2 2012
• Equity contribution1 in LBOs averaged 47% in the first quarter of 2013, compared to 52% during the full year
2012, demonstrating improved credit markets and lending appetite
Transactions by Target Country2 Buyer Segmentation Q2 20131
813
Middle-Market
Transactions
Source: S&P Capital IQ
Notes: (1) Strategic buyers may include portfolio companies of private equity groups; (2) By volume; (3) Benelux defined as Belgium, the Netherlands and
Luxembourg; (4) DACH defined as Germany, Austria, Switzerland; (5) Scandinavia defined as Denmark, Norway, Sweden and Finland
Source: S&P Capital IQ
Note: Includes closed M&A transactions of majority stakes only, where deal value was undisclosed or between €25m – €650m, within United Kingdom, Eire, France,
DACH (Germany, Austria, Switzerland), Spain, Italy, Benelux (Belgium, the Netherlands, Luxembourg) and Scandinavia (Denmark, Norway, Sweden and Finland)
Q2 - 13
Sector
Breakdown
1.0%
1.4%
5.5%
6.8%
13.9%
15.7%
Change of
Q2 - 13 over
Q2 - 12
23.4%
Middle-Market M&A Activity – By Sector
3
33%37%
16%
18%
16%
16%
15%
13%
8%10%
8%4%
4% 2%
0%
20%
40%
60%
80%
100%
Q1-13 Q2-13
Italy
Spain
Benelux
France
DACH
Scandinavia
UK & Eire
32.3%
100.0% Total
Source: S&P Leveraged Commentary & Data
Notes: (1) Equity contribution including retained equity/vendor financing and contributed equity
4
3
5
0
200
400
600
800
1,000
1,200
1,400
1,600
Q1-11 Q3-11 Q1-12 Q3-12 Q1-13
Nu
mb
er o
f T
ra
nsa
cti
on
s ADG
Energy & Power
Transportation & Logistics
Healthcare
Business Services
Diversified Industrials
Consumer
TMT
(42.9%)
(37.6%)
(34.3%)
(31.2%)
(42.7%)
(23.3%)
(72.5%)
(42.3%)
(33.7%)
% of Total Deal Volume Q 2-11 Q3-11 Q4-11 Q 1-12 Q2-12 Q 3-12 Q 4-12 Q 1-13 Q2-13
ADG 17% 14% 23% 0% 29% 25% 67% 50% 13%
Business Services 5% 10% 9% 10% 8% 5% 10% 10% 15%
Consumer 6% 8% 8% 9% 9% 6% 8% 8% 8%
Diversified Industrials 8% 10% 10% 8% 11% 10% 9% 11% 12%
Energy & Power 13% 18% 23% 19% 8% 7% 13% 18% 9%
Healthcare 9% 18% 9% 15% 16% 14% 6% 9% 11%
TMT 14% 20% 17% 16% 18% 21% 18% 20% 17%
Transportation & Logistics 6% 7% 7% 5% 5% 10% 3% 0% 9%
0
2,000
4,000
6,000
8,000
10,000
0
50
100
150
200
Q2-11 Q3-11 Q4-11 Q1-12 Q2-12 Q3-12 Q4-12 Q1-13 Q2-13
Dea
l V
alu
e (
€m
)
Nu
mb
er o
f T
ra
nsa
cti
on
s
International Activity by Number International Activity by Value
North America84%
South America3%
China1%
India2%
Asia (excl. China & India)7%
Africa & Middle East4%
European
Inbound M&A Environment
Acquisitions by Non-European Buyers1,2
Non-European Buyers by Country Q2 131,2
Non-European Buyers as a Percentage of Sector Deal Volume1,2,3
4
Market Observations
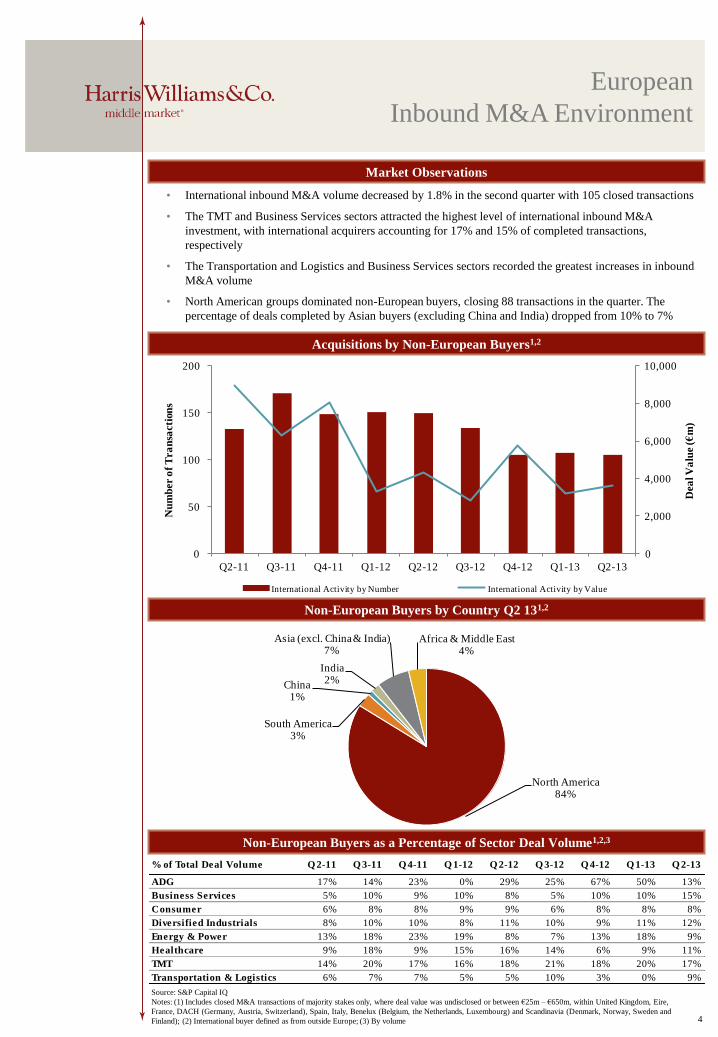
• International inbound M&A volume decreased by 1.8% in the second quarter with 105 closed transactions
• The TMT and Business Services sectors attracted the highest level of international inbound M&A
investment, with international acquirers accounting for 17% and 15% of completed transactions,
respectively
• The Transportation and Logistics and Business Services sectors recorded the greatest increases in inbound
M&A volume
• North American groups dominated non-European buyers, closing 88 transactions in the quarter. The
percentage of deals completed by Asian buyers (excluding China and India) dropped from 10% to 7%
Source: S&P Capital IQ
Notes: (1) Includes closed M&A transactions of majority stakes only, where deal value was undisclosed or between €25m – €650m, within United Kingdom, Eire,
France, DACH (Germany, Austria, Switzerland), Spain, Italy, Benelux (Belgium, the Netherlands, Luxembourg) and Scandinavia (Denmark, Norway, Sweden and
Finland); (2) International buyer defined as from outside Europe; (3) By volume
0
1
2
3
4
5
Q2-11 Q4-11 Q2-12 Q4-12 Q2-13
Nu
mb
er o
f T
ran
sact
ion
s
North America Asia (excl. China & India) China
India South America Africa & Middle East
0
2
4
6
8
10
12
14
16
Q2-11 Q4-11 Q2-12 Q4-12 Q2-13
Nu
mb
er o
f T
ran
sact
ion
s
UK & Eire Scandinavia DACH France Benelux Spain Italy
Aerospace, Defence & Government
Services
5
European ADG Equity Markets1
European ADG Middle-Market M&A Activity
Source: S&P CapitalIQ
Notes: (1) Based on HW&Co. indices including the most relevant Aerospace, Defence, & Government Services companies for each country; (2) Includes transactions
with a deal value between €25m and €650m and all non disclosed value deals with target based in the UK, Eire, France, DACH (Germany, Austria, Switzerland),
Spain, Italy, Benelux (Belgium, The Netherlands, Luxembourg) and Scandinavia (Denmark, Norway, Sweden and Finland); (3) Resignation or appointment of CEO,
CFO or Chairman
M&A Deals by Country of Target2 Acquisitions by Non-European Buyers2
Selected European ADG M&A
Market Observations
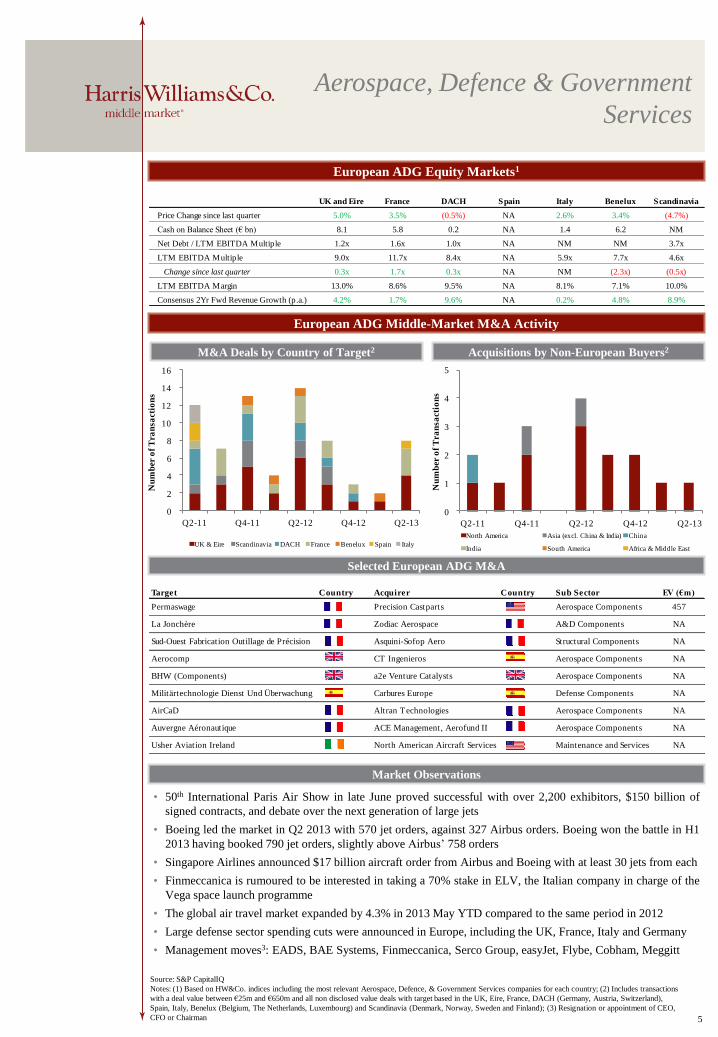
• 50th International Paris Air Show in late June proved successful with over 2,200 exhibitors, $150 billion of
signed contracts, and debate over the next generation of large jets
• Boeing led the market in Q2 2013 with 570 jet orders, against 327 Airbus orders. Boeing won the battle in H1
2013 having booked 790 jet orders, slightly above Airbus’ 758 orders
• Singapore Airlines announced $17 billion aircraft order from Airbus and Boeing with at least 30 jets from each
• Finmeccanica is rumoured to be interested in taking a 70% stake in ELV, the Italian company in charge of the
Vega space launch programme
• The global air travel market expanded by 4.3% in 2013 May YTD compared to the same period in 2012
• Large defense sector spending cuts were announced in Europe, including the UK, France, Italy and Germany
• Management moves3: EADS, BAE Systems, Finmeccanica, Serco Group, easyJet, Flybe, Cobham, Meggitt
Target Country Acquirer Country Sub Sector EV (€m)
Permaswage Precision Castparts Aerospace Components 457
La Jonchère Zodiac Aerospace A&D Components NA
Sud-Ouest Fabrication Outillage de Précision Asquini-Sofop Aero Structural Components NA
Aerocomp CT Ingenieros Aerospace Components NA
BHW (Components) a2e Venture Catalysts Aerospace Components NA
Militärtechnologie Dienst Und Überwachung Carbures Europe Defense Components NA
AirCaD Altran Technologies Aerospace Components NA
Auvergne Aéronautique ACE Management, Aerofund II Aerospace Components NA
Usher Aviation Ireland North American Aircraft Services Maintenance and Services NA
UK and Eire France DACH Spain Italy Benelux Scandinavia
Price Change since last quarter 5.0% 3.5% (0.5%) NA 2.6% 3.4% (4.7%)
Cash on Balance Sheet (€ bn) 8.1 5.8 0.2 NA 1.4 6.2 NM
Net Debt / LTM EBITDA Multiple 1.2x 1.6x 1.0x NA NM NM 3.7x
LTM EBITDA Multiple 9.0x 11.7x 8.4x NA 5.9x 7.7x 4.6x
Change since last quarter 0.3x 1.7x 0.3x NA NM (2.3x) (0.5x)
LTM EBITDA Margin 13.0% 8.6% 9.5% NA 8.1% 7.1% 10.0%
Consensus 2Yr Fwd Revenue Growth (p.a.) 4.2% 1.7% 9.6% NA 0.2% 4.8% 8.9%

0
5
10
15
20
Q2-11 Q4-11 Q2-12 Q4-12 Q2-13
Nu
mb
er o
f T
ran
sact
ion
s
North America Asia (excl. China & India)China IndiaSouth America Africa & Middle East
0
50
100
150
200
250
Q2-11 Q4-11 Q2-12 Q4-12 Q2-13
Nu
mb
er o
f T
ran
sact
ion
s
UK & Eire Scandinavia DACH France Benelux Spain Italy
Business Services
6
European Business Services Equity Markets1
European Business Services Middle-Market M&A Activity
M&A Deals by Country of Target2 Acquisitions by Non-European Buyers2
Selected European Business Services M&A
Market Observations
• The CBI released a new report on the importance of the Business and Professional Services sector to the UK
economy, highlighting the UK’s clear competitive advantage and estimating £30 billion of export opportunities
by 2020. The UK has the highest trade surplus in the Business Services sector amongst the OECD countries
• The Big Four accountancy groups appear primed for further expansion in the consulting market, with PwC,
Deloitte and E&Y all linked with potential bids for Roland Berger, the strategy consultant. The Big Four are
looking for ways to increase their higher margin consulting businesses, as their core audit operations come
under regulatory pressure
• Management moves3: Capita, G4S, Serco, Hays, Caverion Corporation, Impellam Group, Harvey Nash Group
Source: S&P CapitalIQ
Notes: (1) Based on HW&Co. indices including the most relevant Business Services companies for each country; (2) Includes transactions with a deal value between
€25m and €650m and all non disclosed value deals with target based in the UK, Eire, France, DACH (Germany, Austria, Switzerland), Spain, Italy, Benelux (Belgium,
The Netherlands, Luxembourg) and Scandinavia (Denmark, Norway, Sweden and Finland); (3) Resignation or appointment of CEO, CFO or Chairman
Target Country Acquirer Country Sub Sector EV (€m)
Gazeley UK Brookfield Property Partners Distribution 353
Portfolio of Logistics Properties Apollo Global Management Distribution 145
Nimbus Park Tritax Securities Distribution 43
KnowledgePool Group Capita Education Services 28
CMFT Groupe Climater Maintenance Services NA
Protección y Seguridad del Noroeste Segur Ibérica Security Services NA
MPB France S.A.-Matières Plastique Paprec Waste Management NA
Blue Sky Performance Improvement Capita Education Services NA
Sony Mobile Communications Lab Tech Mahindra Testing Services NA
LVQ-WP Werkstoffprufung Bureau Veritas Testing Services NA
UK and Eire France DACH Spain Italy Benelux Scandinavia
Price Change since last quarter (0.2%) (4.9%) (2.7%) (1.6%) -% (4.9%) (4.4%)
Cash on Balance Sheet (€ bn) 4.8 9.8 3.9 152.7 33.8 0.8 NM
Net Debt / LTM EBITDA Multiple 1.4x 1.5x 1.0x 8.8x 4.8x 2.7x 2.6x
LTM EBITDA Multiple 10.0x 6.7x 8.7x 12.6x 13.8x 8.9x 9.2x
Change since last quarter 1.2x (0.3x) (0.1x) 1.9x 3.9x (0.7x) (0.6x)
LTM EBITDA Margin 9.3% 10.2% 5.9% 7.4% 5.2% 4.1% 8.5%
Consensus 2Yr Fwd Revenue Growth (p.a.) 6.1% 3.8% 3.5% 0.4% 3.3% 4.4% 2.5%
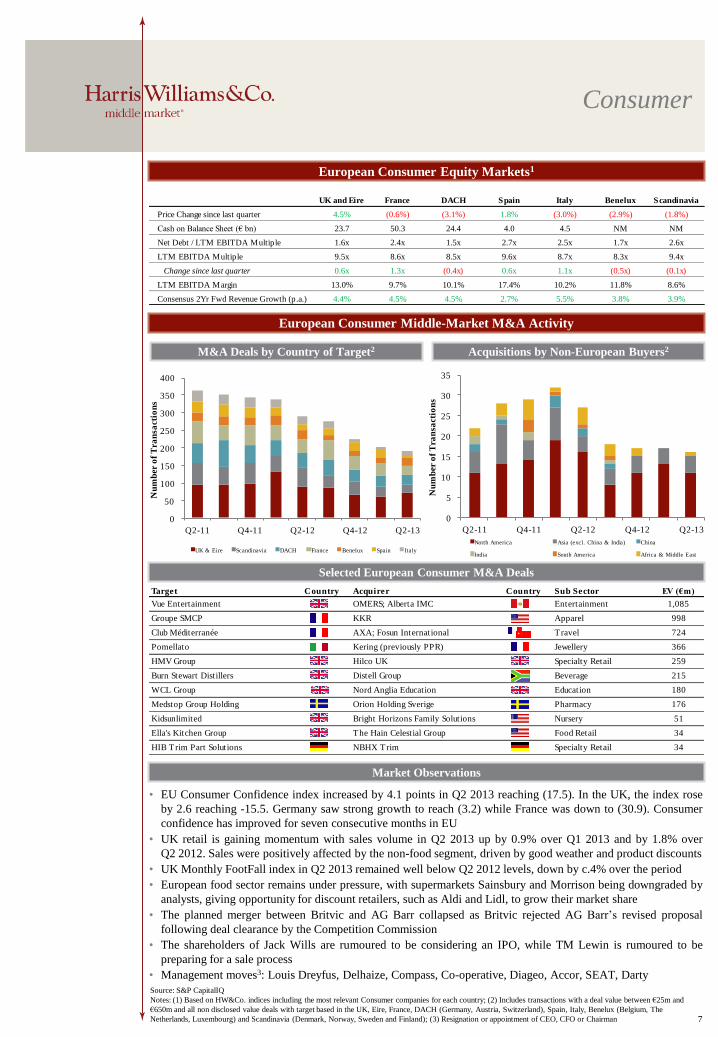
Target Country Acquirer Country Sub Sector EV (€m)
Vue Entertainment OMERS; Alberta IMC Entertainment 1,085
Groupe SMCP KKR Apparel 998
Club Méditerranée AXA; Fosun International Travel 724
Pomellato Kering (previously PPR) Jewellery 366
HMV Group Hilco UK Specialty Retail 259
Burn Stewart Distillers Distell Group Beverage 215
WCL Group Nord Anglia Education Education 180
Medstop Group Holding Orion Holding Sverige Pharmacy 176
Kidsunlimited Bright Horizons Family Solutions Nursery 51
Ella's Kitchen Group The Hain Celestial Group Food Retail 34
HIB Trim Part Solutions NBHX Trim Specialty Retail 34
0
5
10
15
20
25
30
35
Q2-11 Q4-11 Q2-12 Q4-12 Q2-13
Nu
mb
er o
f T
ran
sact
ion
s
North America Asia (excl. China & India) China
India South America Africa & Middle East
0
50
100
150
200
250
300
350
400
Q2-11 Q4-11 Q2-12 Q4-12 Q2-13
Nu
mb
er o
f T
ran
sact
ion
s
UK & Eire Scandinavia DACH France Benelux Spain Italy
Consumer
European Consumer Equity Markets1
European Consumer Middle-Market M&A Activity
M&A Deals by Country of Target2 Acquisitions by Non-European Buyers2
Source: S&P CapitalIQ
Notes: (1) Based on HW&Co. indices including the most relevant Consumer companies for each country; (2) Includes transactions with a deal value between €25m and
€650m and all non disclosed value deals with target based in the UK, Eire, France, DACH (Germany, Austria, Switzerland), Spain, Italy, Benelux (Belgium, The
Netherlands, Luxembourg) and Scandinavia (Denmark, Norway, Sweden and Finland); (3) Resignation or appointment of CEO, CFO or Chairman
Selected European Consumer M&A Deals
• EU Consumer Confidence index increased by 4.1 points in Q2 2013 reaching (17.5). In the UK, the index rose
by 2.6 reaching -15.5. Germany saw strong growth to reach (3.2) while France was down to (30.9). Consumer
confidence has improved for seven consecutive months in EU
• UK retail is gaining momentum with sales volume in Q2 2013 up by 0.9% over Q1 2013 and by 1.8% over
Q2 2012. Sales were positively affected by the non-food segment, driven by good weather and product discounts
• UK Monthly FootFall index in Q2 2013 remained well below Q2 2012 levels, down by c.4% over the period
• European food sector remains under pressure, with supermarkets Sainsbury and Morrison being downgraded by
analysts, giving opportunity for discount retailers, such as Aldi and Lidl, to grow their market share
• The planned merger between Britvic and AG Barr collapsed as Britvic rejected AG Barr’s revised proposal
following deal clearance by the Competition Commission
• The shareholders of Jack Wills are rumoured to be considering an IPO, while TM Lewin is rumoured to be
preparing for a sale process
• Management moves3: Louis Dreyfus, Delhaize, Compass, Co-operative, Diageo, Accor, SEAT, Darty
Market Observations
UK and Eire France DACH Spain Italy Benelux Scandinavia
Price Change since last quarter 4.5% (0.6%) (3.1%) 1.8% (3.0%) (2.9%) (1.8%)
Cash on Balance Sheet (€ bn) 23.7 50.3 24.4 4.0 4.5 NM NM
Net Debt / LTM EBITDA Multiple 1.6x 2.4x 1.5x 2.7x 2.5x 1.7x 2.6x
LTM EBITDA Multiple 9.5x 8.6x 8.5x 9.6x 8.7x 8.3x 9.4x
Change since last quarter 0.6x 1.3x (0.4x) 0.6x 1.1x (0.5x) (0.1x)
LTM EBITDA Margin 13.0% 9.7% 10.1% 17.4% 10.2% 11.8% 8.6%
Consensus 2Yr Fwd Revenue Growth (p.a.) 4.4% 4.5% 4.5% 2.7% 5.5% 3.8% 3.9%
7

Diversified Industrials
European Diversified Industrials Equity Markets1
European Diversified Industrials Middle-Market M&A Activity
M&A Deals by Country of Target2 Acquisitions by Non-European Buyers2
Selected European Diversified Industrials M&A
Market Observations
• The IMF estimated a 3.3% increase in global GDP during 2013, down 20 bps from its January 2013 outlook
but modestly above 2012 growth of 3.2%
• At 50.6 in June, unchanged from May, the global PMI index indicated an expansion of the global
manufacturing sector for the sixth month running, signaling further increase in output and new orders
• Several large European industrial manufacturers have recently announced planned divestitures, including
GEA’s announcement to divest its €1.3 billion Heat Exchanger business and Siemens’ announcement to divest
its €1 billion Water Technologies business
• An acquisition of Invensys by Schneider would provide cost synergies between the two companies and provide
Schneider access to key electro-intensive segments as well as energy management offerings and the fast-
growing software business for industrial operational efficiency
• Management moves3: ABB, WashTec, SKF, Sensata Technologies, FLSmidth & Co.
Source: S&P CapitalIQ
Notes: (1) Based on HW&Co. indices including the most relevant Diversified Industrials companies for each country; (2) Includes transactions with a deal value
between €25m and €650m and all non disclosed value deals with target based in the UK, Eire, France, DACH (Germany, Austria, Switzerland), Spain, Italy, Benelux
(Belgium, The Netherlands, Luxembourg) and Scandinavia (Denmark, Norway, Sweden and Finland); (3) Resignation or appointment of CEO, CFO or Chairman
Target Country Acquirer Country Sub Sector EV (€m)
0
50
100
150
200
250
Q2-11 Q4-11 Q2-12 Q4-12 Q2-13
Nu
mb
er o
f T
ra
nsa
cti
on
s
UK & Eire Scandinavia DACH France Benelux Spain Italy
0
5
10
15
20
25
Q2-11 Q4-11 Q2-12 Q4-12 Q2-13
Nu
mb
er o
f T
ra
nsa
cti
on
s
North America Asia (excl. China & India) China
India South America Africa & Middle East
UK and Eire France DACH Spain Italy Benelux Scandinavia
Price Change since last quarter 1.5% (2.2%) (2.9%) (1.7%) (2.3%) (3.0%) (5.2%)
Cash on Balance Sheet (€ bn) 7.5 29.8 33.8 10.9 10.0 8.0 NM
Net Debt / LTM EBITDA Multiple 1.3x 1.8x 1.6x 5.2x 3.4x 2.0x 2.1x
LTM EBITDA Multiple 8.4x 7.0x 8.2x 7.7x 8.3x 8.4x 9.5x
Change since last quarter (0.3x) 0.0x (0.2x) (0.2x) 0.9x 0.0x 0.1x
LTM EBITDA Margin 10.7% 10.1% 9.4% 10.1% 10.9% 10.4% 9.5%
Consensus 2Yr Fwd Revenue Growth (p.a.) 4.4% 3.3% 4.6% 1.8% 3.8% 4.0% 3.1%
8
ista International CVC Capital Partners Utility Metering 4,079
Invensys Schneider Electric Capital Equipment 3,054
CeramTec Cinven Construction Materials 1,490
Schmolz + Bickenbach Renova Industries Steel 1,210
Armacell Charterhouse Capital Partners Chemicals 500
The Flexitallic Group Bridgepoint Advisers Automotive 450
Marelli Motori The Carlyle Group Heavy Electrical Equipment 212

European Energy & Power Equity Markets1
European Energy & Power Middle-Market M&A Activity
Energy & Power
M&A Deals by Country of Target2 Acquisitions by Non-European Buyers2
Selected European Energy & Power M&A3
Market Observations
• In Q2 2013, the trend of divestures of non-core assets by leading power utility companies continued. DONG
Energy exited several onshore wind power as well as hydropower assets and E.ON announced the sale of the
regional utility E.ON Westfalen Weser
• Generalist Private Equity Groups as well as specialized E&P and Infrastructure investors are increasingly
taking the opportunity to benefit from legislative changes and challenging dynamics for large utilities by e.g.
acquiring mothballed gas power plants and betting on a medium-term market turnaround
• International major Oil & Gas companies continue to seek exposure to the European oilfield service and
equipment market. Key transactions in Q2 include the acquisition of Blohm+Voss Oil Tools by Forum Energy
as well as the announced acquisition of Fred Olsen Production by Yinson
• Management moves4: Vestas, Iofina, Norwegian Energy, Faroe Petroleum, Bergen Group, Gulfsands Petroleum
9
Source: S&P CapitalIQ
Notes: (1) Based on HW&Co. indices including the most relevant Energy & Power companies for each country
(2) Includes transactions with a deal value between €25m and €650m and all non disclosed value deals with target based in the UK, Eire, France, DACH (Germany,
Austria, Switzerland), Spain, Italy, Benelux (Belgium, The Netherlands, Luxembourg) and Scandinavia (Denmark, Norway, Sweden and Finland); (3) Includes
acquisitions of majority stakes only (4) Resignation or appointment of CEO or CFO
0
5
10
15
20
25
30
35
40
45
Q2-11 Q4-11 Q2-12 Q4-12 Q2-13
Nu
mb
er
of
Tra
nsa
ctio
ns
UK & Eire Scandinavia DACH France Benelux Spain Italy
0
1
2
3
4
5
6
7
8
Q2-11 Q4-11 Q2-12 Q4-12 Q2-13
Nu
mb
er o
f T
ra
nsa
cti
on
s
North America Asia (excl. China & India) China
India South America Africa & Middle East
UK and Eire France DACH Spain Italy Benelux Scandinavia
Price Change since last quarter (13.8%) (1.5%) (4.4%) 8.8% (1.1%) (2.2%) (5.7%)
Cash on Balance Sheet (€ bn) 32.6 34.0 11.5 19.0 23.0 14.8 14.4
Net Debt / LTM EBITDA Multiple 0.6x 1.9x 1.6x 3.3x 2.9x 4.4x 2.4x
LTM EBITDA Multiple 6.3x 5.3x 7.8x 7.7x 5.7x 10.3x 8.1x
Change since last quarter (0.5x) 0.4x 0.5x 0.6x (0.5x) (0.4x) 1.1x
LTM EBITDA Margin 16.4% 19.8% 15.7% 21.6% 13.7% 33.9% 34.1%
Consensus 2Yr Fwd Revenue Growth (p.a.) 18.6% 8.9% (0.3%) 0.5% (1.3%) 2.7% 6.5%
Target Country Acquirer Country Sub Sector EV (€m)
E.ON Westfalen Weser 48 German municipalities Utility 360
Fred. Olsen Production Yinson Offshore Services 235
Vestas' Gebeleisis & Hrabrovo Projects Lukerg Renew Renewables 127
DONG Energy's Onshore Wind Business PFA Renewables 101
South Staffordshire KKR Water Utility NA
Deep Sea Mooring Hitech Vision Oilfield Services NA
Blohm + Voss Oil Tools Forum Energy Technologies Oilfield Equipment NA
Marwin ABM Group AS Oilfield Equipment NA

Healthcare & Life Sciences
10
European Healthcare & Life Sciences Equity Markets1
European Healthcare & Life Sciences Mid-Market M&A Activity
M&A Deals by Country of Target2 Acquisitions by Non-European Buyers2
Selected European Healthcare & Life Sciences M&A
Market Observations
• Senior health service officials have warned that the NHS is facing serious cash shortages and a £30 billion
funding gap by 2020, which will likely lead to closure of local hospitals across the country
• Thermo Fischer acquired Life Technologies for $13.6 billion in April, creating a powerhouse in bio-pharma,
lab instrumentation and supplies with combined revenues of $16.3 billion
• Onyx Pharmaceuticals launched an auction for the company, following the board’s rejection of an offer of
$120 per share from Amgen in late June which values Onyx at nearly $10 billion
• The FTC has asked for more information on the $8.5 billion buyout of Warner Chilcott by Actavis, extending
the waiting period to completion of the deal, which was originally announced in May
• Valeant announced the acquisition of global healthcare company Bausch & Lomb in May for $8.1 billion.
Valeant raised over $7.0 billion of debt to fund the deal
• Management moves3: Mediclin, Novartis, Silence Therapeutics, Stallergenes, Vectura Group, United Drug
0
20
40
60
80
100
120
140
Q2-11 Q4-11 Q2-12 Q4-12 Q2-13
Nu
mb
er o
f T
ran
sact
ion
s
UK & Eire Scandinavia DACH France Benelux Spain Italy
0
5
10
15
20
25
Q2-11 Q4-11 Q2-12 Q4-12 Q2-13
Nu
mb
er o
f T
ran
sact
ion
s
North America Asia (excl. China & India) China
India South America Africa & Middle East
Source: S&P CapitalIQ
Notes: (1) Based on HW&Co. indices including the most relevant Healthcare & Life Sciences companies for each country; (2) Includes transactions with a deal value
between €25m and €650m and all non disclosed value deals with target based in the UK, Eire, France, DACH (Germany, Austria, Switzerland), Spain, Italy, Benelux
(Belgium, The Netherlands, Luxembourg) and Scandinavia (Denmark, Norway, Sweden and Finland); (3) Resignation or appointment of CEO, CFO or Chairman
Target Country Acquirer Country Sub Sector EV (€m)
Xellia Pharmaceuticals Novo Pharmaceuticals 535
Heraeus Kulzer Mitsui Chemicals Healthcare Equipment 450
Tertianum Swiss Prime Site Healthcare Facilities 400
Doc Generici Charterhouse Capital Partners Pharmaceuticals 296
Okairos GlaxoSmithKline Pharmaceuticals 250
ProFibrix The Medicines Company Biotechnology 183
Bionostics Holdings Research And Diagnostic Systems Healthcare Equipment 79
Neurelec William Demant Holding Healthcare Equipment 58
Vets4Pets Pets At Home Group Healthcare Services 46
UK and Eire France DACH Spain Italy Benelux Scandinavia
Price Change since last quarter (0.8%) (2.8%) 1.1% 5.0% 7.8% (7.2%) (4.3%)
Cash on Balance Sheet (€ bn) 14.8 2.5 15.5 0.5 0.3 1.1 NM
Net Debt / LTM EBITDA Multiple 1.8x 1.6x 1.7x 1.5x 1.0x 2.3x 1.1x
LTM EBITDA Multiple 10.1x 9.2x 10.7x 13.5x 9.2x 12.7x 13.8x
Change since last quarter (0.4x) 0.6x 0.3x 0.0x 0.8x 1.3x 2.4x
LTM EBITDA Margin 16.8% 12.5% 13.9% 17.1% 12.3% 8.9% 14.7%
Consensus 2Yr Fwd Revenue Growth (p.a.) 7.7% 8.5% 5.7% 5.7% 8.4% 5.2% 7.8%

Technology, Media & Telecom
11
European Technology, Media & Telecom Equity Markets1
European Technology, Media & Telecom Mid-Market M&A Activity
M&A Deals by Country of Target2 Acquisitions by Non-European Buyers2
Selected European Technology, Media & Telecom M&A
Market Observations
• Kabel Deutschland’s Board has agreed to the €7.7bn (€87.00 a share) takeover offer from Vodafone, which
was €2.00 a share higher than Liberty Media’s, and is aiming to complete the acquisition by October
• French government has blocked Yahoo!’s acquisition of Dailymotion citing that it is not in French interests
• BMC Software was taken private by a group led by Bain Capital and Golden Gate Capital for c.$6.9 billion
• BC Partners acquired Springer Science+Business Media to for approximately €3.3bn
• Spending on mobile advertising in 2013 in Western Europe is expected to exceed $2.9 billion
• Management moves3: BT Group, Deutsche Telekom, Thomson Reuters, TeliaSonera, Sage, Virgin Media
0
50
100
150
200
250
300
350
400
450
500
Q2-11 Q4-11 Q2-12 Q4-12 Q2-13
Nu
mb
er o
f T
ran
sact
ion
s
UK & Eire Scandinavia DACH France Benelux Spain Italy
0
10
20
30
40
50
60
70
80
Q2-11 Q4-11 Q2-12 Q4-12 Q2-13
Nu
mb
er o
f T
ran
sact
ion
s
North America Asia (excl. China & India) China
India South America Africa & Middle East
Source: S&P CapitalIQ
Notes: (1) Based on HW&Co. indices including the most relevant Technology, Media & Telecom companies for each country; (2) Includes transactions with a deal value
between €25m and €650m and all non disclosed value deals with target based in the UK, Eire, France, DACH (Germany, Austria, Switzerland), Spain, Italy, Benelux
(Belgium, The Netherlands, Luxembourg) and Scandinavia (Denmark, Norway, Sweden and Finland); (3) Resignation or appointment of CEO, CFO or Chairman
UK and Eire France DACH Spain Italy Benelux Scandinavia
Price Change since last quarter (1.1%) 0.8% (0.9%) (3.1%) (3.5%) (0.5%) (3.7%)
Cash on Balance Sheet (€ bn) 23.1 28.2 18.7 7.0 7.5 13.1 NM
Net Debt / LTM EBITDA Multiple 1.4x 1.3x 1.3x 5.5x 2.2x 1.8x 1.1x
LTM EBITDA Multiple 9.9x 6.9x 8.7x 12.8x 7.3x 9.0x 8.3x
Change since last quarter (0.3x) 0.2x 0.2x 0.3x (0.2x) 0.2x 0.7x
LTM EBITDA Margin 17.8% 11.6% 10.6% 7.2% 9.5% 18.7% 11.0%
Consensus 2Yr Fwd Revenue Growth (p.a.) 5.9% 4.9% 5.2% 3.7% 5.9% 4.7% 4.4%
Target Country Acquirer Country Sub Sector EV (€m)
Civica OMERS Private Equity Outsourcing 452
Stonesoft McAfee Software 287
Ubiquisys Cisco Systems Hardware 237
Osiatis SA (55% stake) Econocom Group IT services 155
Energy Micro Silicon Laboratories International Semiconductors 130
Hostelbookers.com Web Reservations International Online Travel 100
Axell Wireless Cobham Communications 99
Oslo Kino Nordisk Film Entertainment 80
Alfacam Group Videohouse Broadcast Studio 79
Alti Tata Consultancy Services IT services 75
CliniSys Solutions Montagu Private Equity Healthcare IT NA

Transportation & Logistics
European Transportation & Logistics Equity Markets1
European Transportation & Logistics Middle-Market M&A Activity
M&A Deals by Country of Target2 Acquisitions by Non-European Buyers2
Selected European Transportation & Logistics M&A
Market Observations
• Talks have opened between the European Union and the US aimed at removing trade and investment barriers
through creating the world's largest free trade zone
• The European Commission has unveiled plans to simplify customs formalities for ships that will contribute to
the reduction of bureaucracy and delays in ports as well as to increase the competitiveness of the sector
• Investor Dietz AG announced that the new cargo center on the site of Berlin Brandenburg Airport (BER) in
Schönefeld will begin operation on August 1st
• Turkish low-cost carrier Pegasus Airlines has floated 34.5% of its share capital on the Istanbul stock exchange,
completing its long-awaited initial public offering. The share price has risen by over 40% since the IPO in
April
• Management moves3: PostNord, Lufthansa (CO Group Airlines and Logistics), Panalpina
Source: S&P CapitalIQ
Notes: (1) Based on HW&Co. indices including the most relevant Transportation & Logistics companies for each country; (2) Includes transactions with a deal value
between €25m and €650m and all non disclosed value deals with target based in the UK, Eire, France, DACH (Germany, Austria, Switzerland), Spain, Italy, Benelux
(Belgium, The Netherlands, Luxembourg) and Scandinavia (Denmark, Norway, Sweden and Finland); (3) Resignation or appointment of CEO, CFO or Chairman 12
0
1
2
3
4
5
6
7
8
9
10
Q2-11 Q4-11 Q2-12 Q4-12 Q2-13
Nu
mb
er o
f T
ran
sact
ion
s
North America Asia (excl. China & India) China
India South America Africa & Middle East
0
20
40
60
80
100
120
Q2-11 Q4-11 Q2-12 Q4-12 Q2-13
Nu
mb
er o
f T
ran
sact
ion
s
UK & Eire Scandinavia DACH France Benelux Spain Italy
UK and Eire France DACH Spain Italy Benelux Scandinavia
Price Change since last quarter 9.1% 5.1% 2.4% (0.2%) 0.6% (1.4%) (0.1%)
Cash on Balance Sheet (€ bn) 5.0 26.8 58.8 5.8 22.9 1.6 NM
Net Debt / LTM EBITDA Multiple 2.7x 2.9x 3.1x 5.9x 3.1x 3.6x 2.9x
LTM EBITDA Multiple 8.0x 9.2x 7.9x 10.9x 9.2x 10.3x 8.6x
Change since last quarter 0.0x 0.8x 0.0x (0.7x) 0.3x 0.3x 0.1x
LTM EBITDA Margin 10.1% 6.9% 14.5% 12.1% 18.9% 7.1% 10.8%
Consensus 2Yr Fwd Revenue Growth (p.a.) 3.6% 3.8% 3.2% 7.7% 5.2% 1.6% 3.5%
Target Country Acquirer Country Sub Sector EV (€m)
Hochtief Airport Pension Investment Board Airport Management 1,500
Unifeeder Nordic Capital Logistics 400
Troms Offshore Tidewater Inc. Shipping 277
WiderøesFjord 1, Nordland
Fylkeskommune, TorghattenAirline 250
Fiege Logistik (Italy, Spain, Portugal) Norbert Dentressangle Logistics 129
GE Equipment Services Europe HNA Group Ltd. Trailor Leasing NA
ERS Railways Freightliner Group Rail Freight Operator NA
ITG LGI Logistics Freight Forwarding NA
Exeter International Airport Patriot Aerospace Group Airport Operator NA
Finnair (Engine Service Business) GA Telesis Engine Services Airline Services NA
Cemelog United Parcel Service Warehousing NA

0
50
100
150
200
Q1-10 Q2-10 Q3-10 Q4-10 Q1-11 Q2-11 Q3-11 Q4-11 Q1-12 Q2-12 Q3-12 Q4-12 Q1-13
Eurozone GDP Performance Germany GDP Performance
Featured Theme
Harris Williams & Co. International Expansion
German Market Observations
• The opening of the new HW&Co. German office is strategically positioned to take advantage of the strong
German economy that continues to surpass overall Eurozone economic performance
• The German economic improvement continues to outpace the Eurozone in every major indicator:
− The German Economic Sentiment Indicator (ESI) improved to 99.8, while the Eurozone ESI
reached 92.6
− The German Industrial Confidence Indicator (ICI) increased by 3.4 points, a 41% improvement,
whereas the Eurozone ICI rose by 1.8 points reflecting a 16% improvement
− The Production Expectations Index (PEI) in Germany increased from (2.6) to 2.8 points, an
improvement greater than 200%, while the Eurozone PEI increased 137% to 0.7 points
− Order Books (OB) in Germany improved by 4.7 points, a 24% improvement, whereas the Eurozone
OB rose by 2.5 points reflecting a 9% improvement
− Stocks of Finished Products (SFP) in Germany remained flat at 8.2, whereas the Eurozone SFP
decreased from 6.1 to 5.9
•
GDP at Market Prices
Indexed at 2010 Q1
Germany and Eurozone GDP Performance
Eurozone 3-year GDP Growth Rate: 5.3%
Germany 3-year GDP Growth Rate: 10.1%
Source: Eurostat as of 30 June 2013
Source: Eurostat
A new report from McKinsey predicts that between
now and 2025 German exports will rise by 80%,
pushing their share in the economy from 50% to
68% of GDP
The economic outlook for Germany is brightening, its
central bank said, as improved trade and rising industrial
output suggested Europe's biggest economy is slowly
leaving recent weakness behind it.
"The outlook for the German economy has become
brighter again following the slowdown towards the end
of 2012," the Bundesbank wrote in its June monthly
report
Germany's top 30 Blue Chip [DAX] companies has
created 36,909 new jobs so far in 2013, according to
calculations made by German financial
daily Handelsblatt, based on an analysis of their company
reports. This represents a "considerable increase"
compared with the previous year, the paper notes.
Source: McKinsey, Handelsblatt, Bundesbank
German Economic News Headlines
13

€0
€2,000
€4,000
€6,000
€8,000
€10,000
0
50
100
150
200
250
Q1-10 Q2-10 Q3-10 Q4-10 Q1-11 Q2-11 Q3-11 Q4-11 Q1-12 Q2-12 Q3-12 Q4-12 Q1-13 Q2-13
To
tal T
ra
nsa
cti
on
Va
lue
Nu
mb
er o
f T
ra
nsa
cti
on
s
Number of Transactions Total Transaction Value
Featured Theme
Germany as a Buyer in Global M&A
German Targets in Global Cross-Border M&A Activity
Note: Companies above represent select experience of Harris Williams & Co. professionals
70%
4%
3%
3%
3%
2%
2%2%
2%
9% Germany
France
United Kingdom
United States
Switzerland
Austria
Sweden
Italy
Australia
Other (17 Countries)
Q2 2013 Targets by Geography
Representative Experience in Germany
• The German M&A market is currently in a “lull” despite
all relevant factors pointing in the right direction
− Financing is readily available for transactions and
interest rates are low
− Corporate debt levels in relation to EBITDA have
significantly improved since the beginning of the year
− Due to a rather flat development of the overall
economy, most growth scenarios are being based on
external initiatives
• H1 2013 M&A activity in Germany was down despite a
number of large transactions being completed for German
targets
• Private equity sell-side activity remained calm during H1
2013 and is expected to pick up during Q3 and Q4. On the
buy-side, the market is flooded with liquidity and
characterized by strong investment pressure for PEGs that
should drive interest for quality assets coming up for sale
German M&A Activity and Sentiment Recent M&A Activity of German Targets
For the Period CY 2012 – 2013 YTD
Date Target Buyers/Investors TEV (€m)
06/13 Kabel Deutschland Holding Vodafone € 11,136
06/13 Springer Science+Business Media BC Capital € 3,300
05/12 Open Grid Europe BC Investment Management € 3,200
01/12 Inoxum Outokumpu Oyj € 3,122
04/13 ista International CVC Capital Partners Limited € 3,100
06/12 Elster Group Melrose Industries € 2,272
06/12 BSN Medical EQT Partners € 1,820
10/12 Douglas Holding Advent International € 1,685
05/13 HOCHTIEF AirPort Public Sector Investment Board € 1,500
06/13 CeramTec Cinven Limited € 1,490
11/12 Real's Eastern Europe Business Groupe Auchan € 1,100
02/12 Borkum Riffgrund Kirkbi; William Demant Invest € 632
05/12 Tele Columbus Kabel Deutschland Holding € 618
07/12 Nordenia International Mondi Group € 614
01/12 Air Products, Homecare Business Linde Aktiengesellschaft € 590
09/12 KraussMaffei Technologies Onex Corporation € 568
04/13 Armacell Charterhouse Capital Partners € 500
08/12 Aenova Holding BC Partners € 500
12/12 trivago Tron NewCo GmbH € 476
04/13 Heraeus Kulzer Mitsui Chemicals € 450
05/12 Schuler Andritz € 415
10/12 Coperion Hillenbrand € 408
14
Source: CapitalIQ
Note: Refers to deals across all sectors
Sources: CapitalIQ, Analyst Reports, Market Research
Source: CapitalIQ
Note: Refers to deals across all sectors
335311
351
423444
428456
376
430
344
408
446
403
345
0
50
100
150
200
250
300
350
400
450
500
Q1-10 Q3-10 Q1-11 Q3-11 Q1-12 Q3-12 Q1-13
Nu
mb
er o
f T
ran
sact
ion
s
Target Client Description
Advised AXA Private Equity on selling Phönix Armaturen to Curtiss Wright
Advised STAR Capital on selling Blohm + Voss Industries (carve out) to SKF
Advised DBAG on selling coperion to Hillenbrand, Inc. in exclusive process
Advised Stargate Capital on selling Gehring Technologies to Penta Investments
Advised Plansee, Austrian family owned business, on selling PMG to VVG, German family office
Contacts and Disclosures
Thierry Monjauze
Managing Director
63 Brook Street
London W1K 4HS
United Kingdom
Phone: +44 20 7518 8901
Julien Darmon
Managing Director
63 Brook Street
London W1K 4HS
United Kingdom
Phone: +44 20 7518 8905
Red Norrie
Managing Director
63 Brook Street
London W1K 4HS
United Kingdom
Phone: +44 20 7518 8906
Francois Morin
Director
63 Brook Street
London W1K 4HS
United Kingdom
Phone: +44 20 7518 8907
Jeffery Perkins
Managing Director
An der Welle 4
60322 Frankfurt am Main
Germany
Phone: +49 69 7593 7166
www.harriswilliams.com
www.harriswilliams.de
Harris Williams & Co. is a preeminent middle market investment bank focused on the advisory needs of clients worldwide. The firm has deep
industry knowledge, global transaction expertise, and an unwavering commitment to excellence. Harris Williams & Co. provides sell-side
and acquisition advisory, restructuring advisory, board advisory, private placements, and capital markets advisory services.
Harris Williams & Co. Ltd is a private limited company incorporated under English law having its registered office at 5th Floor, 6 St.
Andrew Street, London EC4A 3AE, UK, registered with the Registrar of Companies for England and Wales under company number
7078852. Directors: Mr. Christopher Williams, Mr. Ned Valentine, Mr. Paul Poggi and Mr. Thierry Monjauze, authorised and regulated by
the Financial Conduct Authority.
Harris Williams & Co. Ltd Niederlassung Frankfurt (German branch) is registered in the Commercial Register (Handelsregister) of the
Local Court (Amtsgericht) of Frankfurt am Main, Germany, under registration number HRB 96687, having its business address at An der
Welle 4, 60322 Frankfurt am Main, Germany. Permanent Representative (Ständiger Vertreter) of the Branch Niederlassung: Mr. Jeffery H.
Perkins.
THIS REPORT MAY CONTAIN REFERENCES TO REGISTERED TRADEMARKS, SERVICE MARKS AND COPYRIGHTS
OWNED BY THIRD-PARTY INFORMATION PROVIDERS. NONE OF THE THIRD PARTY INFORMATION PROVIDERS IS
ENDORSING THE OFFERING OF, AND SHALL NOT IN ANY WAY BE DEEMED AN ISSUER OR UNDERWRITER OF, THE
SECURITIES, FINANCIAL INSTRUMENTS OR OTHER INVESTMENTS DISCUSSED IN THIS REPORT AND SHALL NOT
HAVE ANY LIABILITY OR RESPONSIBILITY FOR ANY STATEMENTS MADE IN THE REPORT OR FOR ANY FINANCIAL
STATEMENTS, FINANCIAL PROJECTIONS OR OTHER FINANCIAL INFORMATION CONTAINED OR ATTACHED AS AN
EXHIBIT TO THE REPORT. FOR MORE INFORMATION ABOUT THE MATERIALS PROVIDED BY SUCH THIRD PARTIES,
PLEASE CONTACT US AT +44 (0) 20 7518 8900.
The information and views contained in this report were prepared by Harris Williams & Co. Ltd (“Harris Williams”). It is not a research
report, as such term is defined by applicable law and regulations, and is provided for informational purposes only. It is not to be construed
as an offer to buy or sell or a solicitation of an offer to buy or sell any financial instruments or to participate in any particular trading
strategy. The information contained herein is believed by Harris Williams to be reliable but Harris Williams makes no representation as to
the accuracy or completeness of such information.
Harris Williams and/or its affiliates may be market makers or specialists in, act as advisers or lenders to, have positions in and effect
transactions in securities of companies mentioned herein and also may provide, may have provided, or may seek to provide investment
banking services for those companies. In addition, Harris Williams and/or its affiliates or their respective officers, directors and employees
may hold long or short positions in the securities, options thereon or other related financial products of companies discussed herein.
Opinions, estimates and projections in this report constitute Harris Williams’ judgment and are subject to change without notice. The
financial instruments discussed in this report may not be suitable for all investors and investors must make their own investment decisions
using their own independent advisors as they believe necessary and based upon their specific financial situations and investment objectives.
Also, past performance is not necessarily indicative of future results. No part of this material may be copied or duplicated in any form or by
any means, or redistributed, without Harris Williams’ prior written consent.
Copyright © 2013 Harris Williams & Co., all rights reserved.