european journal of radiology - elastixelastix.isi.uu.nl/marius/downloads/2015_j_ejr.pdf ·...
TRANSCRIPT

Lo
MMMa
b
c
d
a
ARRA
KSILC
1
siaet(
MT
h0
European Journal of Radiology 84 (2015) 975–979
Contents lists available at ScienceDirect
European Journal of Radiology
journa l homepage: www.e lsev ier .com/ locate /e j rad
ung structure and function relation in systemic sclerosis: Applicationf lung densitometry
aarten K. Ninabera,∗, Jan Stolka, Jasper Smita, Ernest J. Le Roya, Lucia J.M. Kroftb,. Els Bakkerc, Jeska K. de Vries Bouwstrad, Anne A. Schouffoerd,arius Staringc, Berend C. Stoel c
Department of Pulmonology, Leiden University Medical Center, Albinusdreef 2, 2333ZA Leiden, The NetherlandsDepartment of Radiology, Leiden University Medical Center, Albinusdreef 2, 2333ZA Leiden, The NetherlandsDivision of Image Processing, Radiology, Leiden University Medical Center, Albinusdreef 2, 2333ZA Leiden, The NetherlandsDepartment of Rheumatology, Leiden University Medical Center, Albinusdreef 2, 2333ZA Leiden, The Netherlands
r t i c l e i n f o
rticle history:eceived 28 October 2014eceived in revised form 3 January 2015ccepted 13 January 2015
eywords:ystemic sclerosisnterstitial lung diseaseung densitometryhest CT imaging
a b s t r a c t
Introduction: Interstitial lung disease occurs frequently in patients with systemic sclerosis (SSc). Quan-titative computed tomography (CT) densitometry using the percentile density method may provide asensitive assessment of lung structure for monitoring parenchymal damage. Therefore, we aimed toevaluate the optimal percentile density score in SSc by quantitative CT densitometry, against pulmonaryfunction.Material and methods: We investigated 41 SSc patients by chest CT scan, spirometry and gas transfer tests.Lung volumes and the nth percentile density (between 1 and 99%) of the entire lungs were calculatedfrom CT histograms. The nth percentile density is defined as the threshold value of densities expressedin Hounsfield units. A prerequisite for an optimal percentage was its correlation with baseline DLCO%predicted. Two patients showed distinct changes in lung function 2 years after baseline. We obtainedCT scans from these patients and performed progression analysis.Results: Regression analysis for the relation between DLCO %predicted and the nth percentile densitywas optimal at 85% (Perc85). There was significant agreement between Perc85 and DLCO %predicted
(R = −0.49, P = 0.001) and FVC %predicted (R = −0.64, P < 0.001). Two patients showed a marked change inPerc85 over a 2 year period, but the localization of change differed clearly.Conclusions: We identified Perc85 as optimal lung density parameter, which correlated significantly withDLCO and FVC, confirming a lung parenchymal structure–function relation in SSc. This provides supportfor future studies to determine whether structural changes do precede lung function decline.© 2015 Elsevier Ireland Ltd. All rights reserved.
. Introduction
Clinical risk assessment of organ manifestations in systemicclerosis (SSc) has revealed that interstitial lung disease (ILD)s present in 53% of cases with diffuse cutaneous SSc (dcSSC)nd in 35% of cases with limited cutaneous SSc (lcSSc) [1]. For
valuating the response to treatment of ILD, pulmonary functionests (PFTs) such as the diffusion capacity for carbon monoxideDLCO) and forced vital capacity (FVC) are key outcome measures.∗ Corresponding author at: Department of Pulmonology (C3), Leiden Universityedical Center, PO Box 9600, 2300 RC Leiden, The Netherlands.
el.: +31 071 526 2950; fax: +31 071 526 6927.E-mail address: [email protected] (M.K. Ninaber).
ttp://dx.doi.org/10.1016/j.ejrad.2015.01.012720-048X/© 2015 Elsevier Ireland Ltd. All rights reserved.
However, these measures are affected by pulmonary vascularchanges and chest wall skin stiffening, respectively [1]. Therefore,more specific measures of lung parenchymal involvement of ILDmay provide additional structural information.
Currently, chest high-resolution computed tomography (HRCT)is considered the most accurate noninvasive imaging methodfor ILD assessment. Both severity and extent of ILD are usuallyestimated by semi-quantitative scoring of a limited number ofcross-sectional slices through the lungs [2,3]. However, visual sco-ring has limited reproducibility, because of its subjective nature,and is time-consuming, thereby constraining the number of slices
that can be assessed. HRCT data provide a means to quantitativelyanalyze the structure of the whole lung, since inflammation, groundglass opacities and fibrosis can be quantified by lung densitometry.Therefore, objective quantitative techniques by CT densitometry
9 urnal
mbtnio
hmapiwsstc[tblutif
2
2
shwtnttpFa
2
scD[
2
tMufmcsni
76 M.K. Ninaber et al. / European Jo
ay provide a more sensitive measurement, similar to what haseen proven in assessing progression of pulmonary emphysema byhe percentile density method [4]. Since these quantitative tech-iques are automated, it is feasible to quantify the entire lungs
nstead of only a limited number of slices, with a smaller chancef missing pathological changes.
Previously, Camiciotolli et al. [5] reported that lung densityistogram parameters are more reproducible than visual assess-ent of HRCT and are more closely related to functional, exercise
nd quality-of-life impairment in SSc. In their evaluation of eachatient, they calculated the average global density of the lung and
ncluded kurtosis and skewness of the density histogram of thehole lung. However, this analysis did not provide a single overall
core for the structure of the lungs and, more importantly, lung den-ity values were not corrected for lung volume. In a recent report,he same investigators clearly demonstrated the need for volumeorrection of density parameters [6]. By a so-called sponge model7], in which the lungs are considered mass preserving (i.e. theotal lung mass is constant during breathing), density values cane corrected in a relatively simple calculation. Volume-corrected
ung density parameters calculated by specific software may beseful outcome measures in evaluating the progression of ILD andhe response to treatment. Therefore, the aim of this study was todentify the optimal volume correction and percentage thresholdor the percentile density method in SSc.
. Material and methods
.1. Patients
We investigated 41 patients with SSc who were referred con-ecutively to our tertiary outpatient targeted multidisciplinaryealthcare program. As part of this program, all patients under-ent, among other tests, PFTs and an HRCT scan of the thorax;
hey were instructed to take their usual medication before scan-ing. Included patients were classified as lcSSc or dcSSc accordingo LeRoy et al. [8]. The local Medical Ethical Committee approvedhe protocol. Written informed consent was obtained from eachatient prior to enrolment. In two individual patients PFTs (bothVC and DLCO) significantly changed during clinical follow-up. Tonalyze this we performed additional CT scans.
.2. Pulmonary function testing
All SSc patients had lung volume, spirometry and gas transfertudies. These PFTs included inspiratory vital capacity, total lungapacity, FVC, forced expiratory volume in 1 s and single-breathLCO. Results are expressed as a percentage of the predicted value
9,10].
.3. Computed tomography
All patients were scanned during full inspiration without con-rast enhancement by the same CT scanner (Aquilion 64, Toshiba
edical Systems, Otawara, Japan), calibrated according to the man-facturer’s guidelines. The standardized protocol comprised theollowing: tube voltage = 120 kVp; tube current = 140 mA without
odulation; rotation time = 0.4 s; collimation = 64 × 0.5 mm; heli-
al beam pitch = 0.8. Axial slices were reconstructed for visual ILDcoring with 0.5 mm slices with 0.4 mm increment and lung ker-el (FC30), and for densitometry with 5 mm thick slices with anncrement of 2.5 mm and smooth kernel (FC03).
of Radiology 84 (2015) 975–979
2.4. Image analysis
Images were processed by Pulmo-CMS software (version 2.1,Medis medical imaging systems BV, Leiden, the Netherlands)[11]. The CT scans were first recalibrated on the basis of densi-ties measured in extrathoracic air and blood in the descendingaorta [12]. After automated lung contour detection with usercorrection options was complete, lung volumes and the nth per-centile density of the entire lungs were calculated. The nthpercentile density is defined as the threshold value of densi-ties expressed in Hounsfield units (HU), below which n% ofall lung voxels in the CT images are distributed (as schemati-cally illustrated in Fig. 1). In order to optimize the percentilemethod, we calculated all percentile densities by using percent-ages between 5% and 95% (Perc5–Perc95) with increments of5%.
Subclinical parenchymal lung disease was previously defined ashigh attenuation areas (%HAAs) within the lung fields having a CTattenuation value between −600 and −260 HU [13]. For compar-ison, we therefore performed a similar analysis in our data set oflung densities. Finally, an experienced chest radiologist (LK) scoredall CT scans visually according to the Kazerooni scoring system [3].
2.5. Statistical analysis
Optimization of the percentile density method was based onthe correlation between nth percentile density and DLCO, whichshould be as high as possible. This was investigated by regres-sion analysis, with DLCO as the dependent variable and one ofthe nth percentile densities as the independent variable. Lungvolume was entered as a covariate to correct for different lungsizes. The partial correlation coefficient was then plotted againstthe percentage n. The statistical analysis was performed by usingSPSS version 20.0.2, with a programmability extension for pythonscripting. The relation between the percentile and the correla-tion coefficient was automatically plotted by using Matplotlib[14].
Using the optimal percentage for the percentile density method,we investigated the cross-sectional correlations with the remaininglung function parameters. In addition, we studied the correlationof %HAA with the cross-sectional DLCO %predicted and FVC %pre-dicted.
2.6. Progression map analysis
We noticed distinct changes in the FVC %predicted and DLCO%predicted during clinical follow-up of our patient population.Therefore we obtained CT scans from these patients and per-formed a recently published progression analysis between baselineand follow-up CT scans [15]. Local changes in lung density werecomputed by progression analysis [15]. Corresponding locationsin the CT scans between baseline and follow-up were obtainedby non-rigid intensity-based image registration using elastix [16].After we corrected for lung volume differences with the spongemodel, local changes in lung density were calculated and displayed[15].
3. Results
The clinical characteristics of the 41 SSc patients (lcSSc: n = 15)in this prospective cross-sectional study are shown in Table 1.
3.1. Determination of the optimal percentage
From the regression analysis (with CT-derived lung volume asa covariate), we found that the relation between the gas transfer
M.K. Ninaber et al. / European Journal of Radiology 84 (2015) 975–979 977
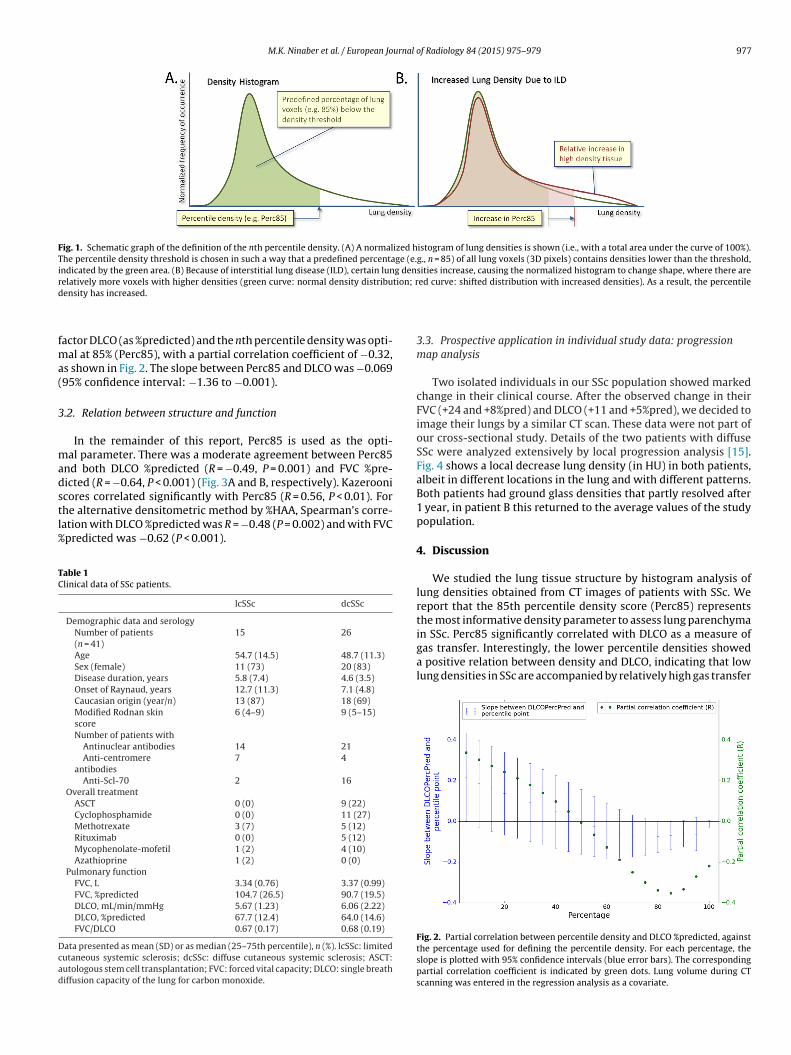
Fig. 1. Schematic graph of the definition of the nth percentile density. (A) A normalized histogram of lung densities is shown (i.e., with a total area under the curve of 100%).The percentile density threshold is chosen in such a way that a predefined percentage (e.g., n = 85) of all lung voxels (3D pixels) contains densities lower than the threshold,indicated by the green area. (B) Because of interstitial lung disease (ILD), certain lung densities increase, causing the normalized histogram to change shape, where there arer tion; rd
fma(
3
madstl%
TC
Dcad
elatively more voxels with higher densities (green curve: normal density distribuensity has increased.
actor DLCO (as %predicted) and the nth percentile density was opti-al at 85% (Perc85), with a partial correlation coefficient of −0.32,
s shown in Fig. 2. The slope between Perc85 and DLCO was −0.06995% confidence interval: −1.36 to −0.001).
.2. Relation between structure and function
In the remainder of this report, Perc85 is used as the opti-al parameter. There was a moderate agreement between Perc85
nd both DLCO %predicted (R = −0.49, P = 0.001) and FVC %pre-icted (R = −0.64, P < 0.001) (Fig. 3A and B, respectively). Kazerooni
cores correlated significantly with Perc85 (R = 0.56, P < 0.01). Forhe alternative densitometric method by %HAA, Spearman’s corre-ation with DLCO %predicted was R = −0.48 (P = 0.002) and with FVCpredicted was −0.62 (P < 0.001).able 1linical data of SSc patients.
lcSSc dcSSc
Demographic data and serologyNumber of patients(n = 41)
15 26
Age 54.7 (14.5) 48.7 (11.3)Sex (female) 11 (73) 20 (83)Disease duration, years 5.8 (7.4) 4.6 (3.5)Onset of Raynaud, years 12.7 (11.3) 7.1 (4.8)Caucasian origin (year/n) 13 (87) 18 (69)Modified Rodnan skinscore
6 (4–9) 9 (5–15)
Number of patients withAntinuclear antibodies 14 21Anti-centromere
antibodies7 4
Anti-Scl-70 2 16Overall treatment
ASCT 0 (0) 9 (22)Cyclophosphamide 0 (0) 11 (27)Methotrexate 3 (7) 5 (12)Rituximab 0 (0) 5 (12)Mycophenolate-mofetil 1 (2) 4 (10)Azathioprine 1 (2) 0 (0)
Pulmonary functionFVC, L 3.34 (0.76) 3.37 (0.99)FVC, %predicted 104.7 (26.5) 90.7 (19.5)DLCO, mL/min/mmHg 5.67 (1.23) 6.06 (2.22)DLCO, %predicted 67.7 (12.4) 64.0 (14.6)FVC/DLCO 0.67 (0.17) 0.68 (0.19)
ata presented as mean (SD) or as median (25–75th percentile), n (%). lcSSc: limitedutaneous systemic sclerosis; dcSSc: diffuse cutaneous systemic sclerosis; ASCT:utologous stem cell transplantation; FVC: forced vital capacity; DLCO: single breathiffusion capacity of the lung for carbon monoxide.
ed curve: shifted distribution with increased densities). As a result, the percentile
3.3. Prospective application in individual study data: progressionmap analysis
Two isolated individuals in our SSc population showed markedchange in their clinical course. After the observed change in theirFVC (+24 and +8%pred) and DLCO (+11 and +5%pred), we decided toimage their lungs by a similar CT scan. These data were not part ofour cross-sectional study. Details of the two patients with diffuseSSc were analyzed extensively by local progression analysis [15].Fig. 4 shows a local decrease lung density (in HU) in both patients,albeit in different locations in the lung and with different patterns.Both patients had ground glass densities that partly resolved after1 year, in patient B this returned to the average values of the studypopulation.
4. Discussion
We studied the lung tissue structure by histogram analysis oflung densities obtained from CT images of patients with SSc. Wereport that the 85th percentile density score (Perc85) representsthe most informative density parameter to assess lung parenchyma
in SSc. Perc85 significantly correlated with DLCO as a measure ofgas transfer. Interestingly, the lower percentile densities showeda positive relation between density and DLCO, indicating that lowlung densities in SSc are accompanied by relatively high gas transferFig. 2. Partial correlation between percentile density and DLCO %predicted, againstthe percentage used for defining the percentile density. For each percentage, theslope is plotted with 95% confidence intervals (blue error bars). The correspondingpartial correlation coefficient is indicated by green dots. Lung volume during CTscanning was entered in the regression analysis as a covariate.

978 M.K. Ninaber et al. / European Journal of Radiology 84 (2015) 975–979
F olume( capac
vlseIr
pp
Fcroc
ig. 3. Correlation between lung structure and function. (A) Correlation between vB) Correlation between volume-corrected 85th percentile density and forced vital
alues. Higher percentile densities showed the opposite, i.e., higherung densities are associated with a relatively low gas transfer. Thisuggests that changes in lung density correlate with clinically rel-vant functional changes in patients with various severities of SSc.ndeed, two cases with marked improvement in FVC and DLCO
elated to a marked decline in Perc85.The analysis of lung structure by densitometry of CT imagesrovides a rapid and operator-independent assessment of lungathology in SSc. Percentile density analysis of the histogram of
ig. 4. Local progression analysis for two patients with marked change in their clinical couolumn, the baseline CT scans are shown; in the second column, the CT scans at follow-uegistration; the third column shows the local difference in density after volume correctf the green overlay corresponds to the size of the density change). At the bottom, the hhange indicates a density increase and a negative change a density decrease. Both patien
-corrected 85th percentile density and CO diffusion capacity (R = −0.49, P = 0.001).ity (R = −0.64, P < 0.001).
tissue densities for both lungs is new in the analysis of ILD.The Perc85 point contains all densities present in the histogrambetween the density of air (−1000 HU) and the Hounsfield unit atwhich 85% of the densities in the histogram is captured. We con-sidered DLCO rather than FVC as the most appropriate functional
parameter for determining the optimal percentile density, althoughFVC is the most frequently reported outcome parameter in SSc foranalysis of ILD [17,18]. By using FVC only for the ultimate eval-uation of the optimized parameter, we avoided introducing bias.rse. For each patient, the axial sagittal and coronal CT images are shown: in the firstp are shown and are elastically transformed to match the baseline scans, by imageion. The green areas indicate significant changes in local densities (the brightnessistograms of the local density changes for each voxel are shown, where a positivets show a clear decrease in densities, but with clearly different local patterns.

urnal o
Toerf
awtiagFafid
ffbipbspelnowa
5
cuctFt
C
[
[
[
[
[
[
[
[
[
[
M.K. Ninaber et al. / European Jo
herefore, we calculated the correlation between DLCO %predictedf our SSc patients and all percentiles of the density histogram ofach CT scan, which were corrected for lung volume. Again, thisesulted in the 85th percentile density as the optimum lung densityor analysis of lung structure.
Interestingly, two patients had a substantial change in both FVCnd Perc85. By application of recently developed software [15],e demonstrated that areas with a decrease in lung density over
ime can be identified in the lungs, suggesting an improvementn the quality of lung tissue, and that these were accompanied byn increase in FVC and DLCO. Data from these two patients sug-est that small changes in lung density do precede changes in theirVC and DLCO. However, assessment of a larger number of patientsnd a longer time interval are needed in future studies to con-rm this observation and to evaluate the clinical benefit of lungensitometry.
The present study has some limitations. The range of lungunction restriction was rather limited. A wider range of lungunction restriction is needed to elucidate whether Perc85 wille able to detect changes in lung density over the entire sever-
ty spectrum of SSc. Validation of lung density against quantitativeathology scores of SSc-affected lung tissue is almost impossi-le. Unlike in pulmonary emphysema, no quantitative pathologycore is available that can be used in the analysis of lobectomy orneumonectomy tissue specimens from SSc patients [19]. How-ver, some studies have used qualitative pathology scores on openung biopsy specimens from ILD patients, and these related sig-ificantly to lung HRCT scores [3,20]. Furthermore, we found thatne such score, published by Kazerooni [3], correlated significantlyith Perc85. The latter may suggest a possible correlation betweenpathology score and our Perc85 score for lung tissue structure.
. Conclusions
We identified an optimal lung density parameter, Perc85, whichorrelated significantly with gas transfer in the lung and may besed to assess clinically relevant changes in lung structure thatoincide with changes in lung function. Future studies are neededo determine whether a change in Perc85 will precede changes inVC and gas transfer to support clinical decision making on earlyreatment intervention in SSc patients.
ontribution
Contribution Authors
Study concepts MK Ninaber, J Stolk, ME Bakker, BC StoelStudy design MK Ninaber, J Stolk, ME Bakker, M Staring, BC
StoelData acquisition MK Ninaber, J Smit, E Le Roy, AA Schouffoer, L
Kroft, J de Vries-Bouwstra, ME BakkerQuality control of data
and algorithmsMK Ninaber, J Stolk, ME Bakker, BC Stoel, MStaring
Data analysis andinterpretation
MK Ninaber, J Stolk, ME Bakker, BC Stoel, MStaring
Statistical analysis MK Ninaber, J Stolk, ME Bakker, BC Stoel, MStaring
Manuscriptpreparation
MK Ninaber, J Stolk, ME Bakker, BC Stoel, MStaring
Manuscript editing MK Ninaber, J Stolk, J Smit, E Le Roy, L Kroft, AA
Schouffoer, J de Vries-Bouwstra, ME Bakker, MStaring, BC StoelManuscript review MK Ninaber, J Stolk, J Smit, E Le Roy, L Kroft, AASchouffoer, J de Vries-Bouwstra, ME Bakker, MStaring, BC Stoel
[
f Radiology 84 (2015) 975–979 979
Funding
None.
Conflict of interest
All authors declare no conflict of interest.
References
[1] Walker UA, Tyndall A, Czirjak L, Denton C, Farge-Bancel D, Kowal-Bielecka O,et al. Clinical risk assessment of organ manifestations in systemic sclerosis: areport from the EULAR Scleroderma Trials And Research group database. AnnRheum Dis 2007;66:754–63.
[2] Goh NS, Desai SR, Veeraraghavan S, Hansell DM, Copley SJ, Maher TM, et al.Interstitial lung disease in systemic sclerosis: a simple staging system. Am JRespir Crit Care Med 2008;177:1248–54.
[3] Kazerooni EA, Martinez FJ, Flint A, Jamadar DA, Gross BH, Spizarny DL, et al.Thin-section CT obtained at 10-mm increments versus limited three-levelthin-section CT for idiopathic pulmonary fibrosis: correlation with pathologicscoring. Am J Roentgenol 1997;169:977–83.
[4] Parr DG, Stoel BC, Stolk J, Stockley RA. Validation of computed tomographic lungdensitometry for monitoring emphysema in alpha1-antitrypsin deficiency.Thorax 2006;61:485–90.
[5] Camiciottoli G, Orlandi I, Bartolucci M, Meoni E, Nacci F, Diciotti S, et al. LungCT densitometry in systemic sclerosis: correlation with lung function, exercisetesting, and quality of life. Chest 2007;131:672–81.
[6] Camiciottoli G, Diciotti S, Bartolucci M, Orlandi I, Bigazzi F, Matucci-CerinicM, et al. Whole-lung volume and density in spirometrically-gated inspira-tory and expiratory CT in systemic sclerosis: correlation with static volumesat pulmonary function tests. Sarcoidosis Vasc Diffuse Lung Dis 2013;30:17–27.
[7] Stoel BC, Putter H, Bakker ME, Dirksen A, Stockley RA, Piitulainen E,et al. Volume correction in computed tomography densitometry for follow-up studies on pulmonary emphysema. Proc Am Thorac Soc 2008;5:919–24.
[8] LeRoy EC, Medsger Jr TA. Criteria for the classification of early systemic sclerosis.J Rheumatol 2001;28:1573–6.
[9] Macintyre N, Crapo RO, Viegi G, Johnson DC, van der Grinten CP, Brusasco V,et al. Standardisation of the single-breath determination of carbon monoxideuptake in the lung. Eur Respir J 2005;26:720–35.
10] Miller MR, Hankinson J, Brusasco V, Burgos F, Casaburi R, CoatesA, et al. Standardisation of spirometry. Eur Respir J 2005;26:319–38.
11] Stoel BC, Stolk J. Optimization and standardization of lung densitome-try in the assessment of pulmonary emphysema. Invest Radiol 2004;39:681–8.
12] Parr DG, Stoel BC, Stolk J, Nightingale PG, Stockley RA. Influenceof calibration on densitometric studies of emphysema progressionusing computed tomography. Am J Respir Crit Care Med 2004;170:883–90.
13] Lederer DJ, Enright PL, Kawut SM, Hoffman EA, Hunninghake G, van Beek EJ,et al. Cigarette smoking is associated with subclinical parenchymal lung dis-ease: the Multi-Ethnic Study of Atherosclerosis (MESA)-lung study. Am J RespirCrit Care Med 2009;180:407–14.
14] Matplotlib: a 2D graphics environment. In: Hunter J, editor. Computing in sci-ence and engineering, vol. 9; 2007. p. 90–5.
15] Staring M, Bakker ME, Stolk J, Shamonin DP, Reiber JH, Stoel BC. Towardslocal progression estimation of pulmonary emphysema using CT. Med Phys2014;41:021905.
16] Klein S, Staring M, Murphy K, Viergever MA, Pluim JP. elastix: a toolboxfor intensity-based medical image registration. IEEE Trans Med Imaging2010;29:196–205.
17] Tashkin DP, Elashoff R, Clements PJ, Goldin J, Roth MD, Furst DE, et al.Cyclophosphamide versus placebo in scleroderma lung disease. N Engl J Med2006;354:2655–66.
18] Solomon JJ, Olson AL, Fischer A, Bull T, Brown KK, Raghu G. Scleroderma lungdisease. Eur Respir Rev 2013;22:6–19.
19] Gould GA, MacNee W, McLean A, Warren PM, Redpath A, Best JJ, et al. CTmeasurements of lung density in life can quantitate distal airspace enlarge-ment – an essential defining feature of human emphysema. Am Rev Respir Dis
1988;137:380–92.20] Sahin H, Brown KK, Curran-Everett D, Hale V, Cool CD, VourlekisJS, et al. Chronic hypersensitivity pneumonitis: CT features comparisonwith pathologic evidence of fibrosis and survival. Radiology 2007;244:591–8.