european government bond markets: transparency, liquidity ...faculty.london.edu/rportes/tt...
TRANSCRIPT
European GovernmentBond Markets:
transparency, liquidity,efficiency
May 2006
Eu
rop
ea
n G
ov
ern
me
nt B
on
d M
ark
ets
: tran
sp
are
ncy, liq
uid
ity, e
fficie
ncy
May 2
006
European GovernmentBond Markets:
transparency, liquidity, efficiency
May 2006
Peter Dunne, Queen's University of BelfastMichael Moore, Queen's University of Belfast
Richard Portes, London Business School and CEPR
Centre for Economic Policy Research90-98 Goswell Road
London EC1V 7RRTel: +44(0) 20 787 2900
www.cepr.org

European Government Bond Markets: transparency, liquidity, efficiency is published by the City of London. The authors of this report are Peter Dunne, Michael Moore and Richard Portes. The project was commissioned from the Centre for Economic Policy Research. This report is intended as a basis for discussion only. Whilst every effort has been made to ensure the accuracy and completeness of the material in this report, the authors, the Centre for Economic Policy Research, the Association of British Insurers, the European Primary Dealers Association, the International Capital Market Association, the Investment Management Association, the London Investment Banking Association, and the City of London, give no warranty in that regard and accept no liability for any loss or damage incurred through the use of, or reliance upon, this report or the information contained herein. May 2006 © Association of British Insurers, European Primary Dealers Association, International Capital Market Association, Investment Management Association, London Investment Banking Association, and the City of London City of London PO Box 270, Guildhall London EC2P 2EJ www.cityoflondon.gov.uk/economicresearch
ii
Table of Contents
1. Introduction and summary.........................................................................4
2. Transparency: its meaning and its relevance ..........................................7 2.1 Aspects of transparency...........................................................................................7 2.2 Electronic markets and transparency .......................................................................8 2.3 Restraints on transparency ......................................................................................9 2.4 Voice communication and repetitive trading relationships .....................................11 2.5 The optimal level of transparency ..........................................................................13
3. Previous work on securities market transparency, liquidity and efficiency ...........................................................................................................15 3.1 Introduction.............................................................................................................15 3.2 Special features of government bond markets.......................................................15 3.3 Theoretical literature on transparency....................................................................17 3.4 Evidence from experimental markets on transparency changes............................18 3.5 Empirical analysis of liquidity, costs of trading and price efficiency in relation to
transparency...........................................................................................................20 3.6 What the literature tells us......................................................................................21
4. Bond market transparency, liquidity and efficiency: a new theoretical model .................................................................................................................23 4.1 Structure of existing fragmented European national government bond markets ...23 4.2 Provision of ‘benefits’ and extraction of rents from end-customer..........................23 4.3 Theoretical framework............................................................................................23 4.4 Game between dealers and issuers when markets are opaque ............................24 4.5 Game between dealers and issuers when markets are completely transparent....26
5. The structure and operations of EU public debt markets, with comparisons to the US Treasury market ........................................................28 5.1 MTS and EuroMTS.................................................................................................28 5.2 UK Gilt Market ........................................................................................................28 5.3 The US Treasury Market ........................................................................................30 5.4 Developments in the EU since monetary union .....................................................30 5.5 The commitment of capital by primary dealers and market segmentation .............31 5.6 Comparisons of euro area public debt markets with the United States..................32 5.7 Differences within and across MTS and US markets and platforms ......................34 5.8 Implications for the empirical analysis....................................................................34
6. Empirical analysis.....................................................................................38 6.1 Datasets .................................................................................................................39 6.2 Empirical results .....................................................................................................40
7. Transparency, liquidity, efficiency: what the markets say....................56
8. Policy implications ...................................................................................59

iii
References.........................................................................................................60
Appendix 1.........................................................................................................64
Appendix 2.........................................................................................................84 Institutions interviewed....................................................................................................84
Appendix 3.........................................................................................................85 Commissioning bodies ....................................................................................................85
4
1. Introduction and summary1
This research was commissioned to answer a range of questions relevant to a comprehensive regulatory review of market transparency, liquidity and efficiency in the European government bond markets, including:
• Do government bond markets in the European Union (EU) deliver efficient market outcomes?
• To the extent that outcomes are not efficient, could improved pre- and/or post-trade transparency improve bond market efficiency?
• To what extent will increased transparency occur as part of the natural evolution of bond markets?
• To what extent can market participants be encouraged to develop their own solutions and what can only be achieved by direct regulatory intervention?2
We cannot claim to have answered these questions fully, but we do believe we have brought new evidence to bear upon them. We have carried out the research in close consultation with the commissioning organisations, who have given us invaluable access to market participants and help in obtaining data. In strict accordance with the policies of the Centre for Economic Policy Research, however, our work has been totally independent, and our arguments and conclusions are solely our own. We have indeed departed significantly from the initial intention, insofar as we have not focused explicitly on the ‘market failure burden of proof’ for regulatory intervention. That, for example, is the approach of the FSA (2005). This is one way of structuring an analysis from first principles, and it certainly informs our research. But this approach has already been developed extensively, and we judged it unlikely that we could contribute much by pushing it further. Instead, we have sought to go more deeply than previous work into the meaning of transparency for securities markets. Seeking to exhibit the implications of transparency is at the centre of our theoretical and empirical research here, both of which we believe to be novel in their approach and results. This then leads to relatively straightforward, though not detailed policy implications. Section 2 sets out the issues and goes into the key differences between electronic and voice markets, with their implications for transparency and for market outcomes. Markets are not merely theoretical constructs, nor do they typically function according to simple textbook rules. They are complex institutions that have histories and that evolve over time, partly under the influence of external forces like regulation and partly endogenously. We observe this process and its current outcomes in the European government bond markets. We stress the problems posed by the winner’s curse for dealers and the position risks they take on. Transparency may reduce liquidity, so there may be a tradeoff between the benefits of transparency and those of opacity. The
1 We are very grateful for the help we have received throughout this project from those who have guided it on behalf of the commissioning organisations: Samantha Barrass, Jane Lowe, Richard Britton, and Gordon Midgley have been especially helpful and generous with their excellent comments on our work and their assistance in obtaining access for us to those we have interviewed. We also appreciate very much the time and thought that our interviewees gave us; we would be pleased to credit them all by name, but that is precluded by our assurance of confidentiality to them. Anil Shamdasani of CEPR put the manuscript in shape for publication, and Viv Davies of CEPR oversaw the administration of the project. The Kdb software that we used was provided by KX Systems, Palo Alto, CA. 2 From the press release issued by the Association of British Insurers (ABI), the Corporation of London, the International Capital Market Association (ICMA), the Investment Management Association (IMA), and the London Investment Banking Association (LIBA), 26 July 2005.
5
discussion here suggests how difficult it will be to identify what level of transparency is optimal. Section 3 reviews major contributions to an extensive existing literature on securities market transparency, liquidity and efficiency. There is theoretical modelling, empirical work, and experimental research. But some of the theoretical propositions are conflicting, and some of the evidence in the empirical work is contradictory. Very little of the latter deals with government bond markets. The evidence does suggest, however, that infrequently traded stocks benefit from some degree of opacity, and that a very transparent B2B limit-order book does not have benign effects on execution quality. In Section 4, we take a game-theoretic approach to modelling the interaction between issuers, dealers, and customers. The framework has an incentive structure that represents, we believe, the institutional structure of the auction and syndicate issuance systems used for European government bonds and the interplay between them. We find that the introduction of full transparency in this context can drain liquidity from the government bond market abruptly and completely. Section 5 discusses the structure and operations of the EU public debt markets. We point out how countries differ in their issuance techniques and the obligations they impose on primary dealers. This, we suggest, will have direct implications for the degree of transparency in the secondary market. The heterogeneity is not just the result of historical accident, and imposing uniform transparency requirements could have widely different consequences across countries. We also compare the EU government bond markets with the US Treasuries market, and we find very different roles of cash and derivatives markets in price discovery on the two sides of the Atlantic. Greater transparency in the EU cash markets might affect that balance, if it were to drive activity and liquidity from the over-the-counter (OTC) markets to the electronic markets. The discussion in this section also suggests some hypotheses for our empirical work. We have done highly detailed empirical analysis of extensive, high-quality data from the inter-dealer (B2B) market provided by the leading electronic exchange in Europe (MTS) and inter-dealer brokers in the United States (eSpeed, GovPX, and BrokerTec). (We were unable to obtain data of equivalent quality or quantity from the dealer-investor (B2C) markets.) This work is presented in Section 6. The results are surprisingly coherent, and they are consistent with our theoretical analysis:
• Across the MTS markets, countries that rely more on syndicate issuance and the placing of secondary market obligations on primary dealers have higher percentages of turnover on the (transparent) MTS.
• Where there is little or no reliance on the primary dealer system nor on syndicated issuance, there is relatively little activity in the transparent secondary market (MTS).
• Examination of five liquidity-related variables is also revealing. Where transparency is high, trade size tends to be low. Where primary dealer obligations are greatest or where syndication is used heavily, we see better liquidity provision on MTS and low spreads. Effective spreads in the US are generally smaller than on MTS, except for the long benchmark.
• A detailed study of execution quality again shows it is closely related to the size of the issuer, the issuance techniques, and the obligations imposed on primary dealers. In the markets where obligations on primary dealers are greatest, execution quality for large trades suffers. This is seen in greater steepness of the order book in these markets.
6
• We find evidence of a winner’s curse problem in both Europe and the US. These appear to be more prevalent in markets that are more transparent and less fragmented.
• We examine a ‘transparency event’ that occurred in June 2003 on the US Treasury market. The data suggest that a discrete increase in transparency on eSpeed brought an increase in effective spreads.
We conclude that the microstructure matters greatly. Dealers prefer to operate in more opaque markets. Greater transparency is associated with lower trade size and possibly with higher spreads. Some degree of opacity seems necessary to induce dealers to supply both liquidity and pre-trade information. Section 7 summarises the results of almost 30 interviews we conducted with market participants. We learned a great deal about the markets from our interlocutors, and much of this is incorporated in the rest of the text. In this section, however, we focus on their views on transparency. It is clear that the major banks (primary dealers) are strongly opposed to greater mandatory transparency. The larger buy-side institutions see no need for it and may benefit from the current degree of opacity and the existing market structure, taken in the large (that is, considering the wide range of relationships between the big banks and national Treasuries). Some smaller buy-side institutions are in favour of greater transparency, in particular post-trade. The smaller issuers are concerned about the possible effects, while the larger ones seem not especially worried and suggest that some of the primary dealers’ arguments are self-serving. Both financial institutions and issuers had little to say about whether greater transparency would matter to retail investors. We conclude in Section 8 that great caution is warranted in considering any mandatory imposition of transparency requirements on government bond markets along the lines of those in MiFID for equity markets. Both in Europe and in the United States, market structures have evolved – in very different ways, as within the EU itself – to give the present coexistence of electronic and OTC markets, offering different environments that seem suited to different types of transactions. These markets do not function ideally – which do? – and we have found evidence of significant problems, such as the winner’s curse. But in this case as in others, it is not clear that mandatory transparency could ‘fix’ them. There is also a version of the classic ‘second-best’ problem here. The auction-syndicate system, or even just issuers’ use of auction ‘performance’ as a criterion for awarding incentives, creates market distortions. Given those distortions, we cannot easily predict the welfare consequences of mitigating some market imperfections by improving public information flows in the name of greater transparency. Again, that suggests regulators should be cautious in intervening in these markets. It may be wiser to let them evolve further, at least for some time, under the influences of rapid technical change and changes in the market structures themselves (e.g., consolidation of the European banking system). It is clear that we have not given conclusive answers to the questions that were posed in our remit. This paper reports research motivated by those questions, whose results we believe are relevant to them. But ‘evidence-based policy’ – which must be based on theory as well – does not require that the evidence dictate the policy. We offer here substantial new evidence, we interpret it, and we offer it to policy-makers to inform their decisions.

7
2. Transparency: its meaning and its relevance
2.1 Aspects of transparency Transparency is a key attribute of a typical financial market. Asymmetries in the information available to market participants are the centre of our understanding of market imperfections. Transparency refers to the absence or elimination of such asymmetries. In a fully transparent market, all relevant market information is common knowledge for all participants. Transparency has greater importance and significance for some participants than others. It also interacts with other market attributes. It is to a great extent endogenously determined by interacting among participants in the framework of market institutions. The very existence of most financial markets depends on striking a balance between transparency, thought to promote competition, fairness and investor protection, and opacity, in the interest of encouraging ongoing participation of both end-customers and liquidity providers. If the various participants do not obtain adequate fairness, protection, and incentives, they will not participate in sufficient numbers and the market will not function properly. This study examines how to achieve a market with an optimal amount of transparency. Similar issues have already arisen in the finance literature and debates dealing with the advantages and disadvantages of different types of trading arrangements. We focus on government bond markets and the special circumstances associated with government bond issuance and trading. The introductory discussion in this section is intended to set out the framework in which we see the problem of finding the optimal degree of transparency. We also offer some examples to illustrate the complexity of the problem. We distinguish between two broad types of transparency. The first relates to the release of general information about recent performance of sell-side participants. Examples are the reporting of activity by sell-side participants to regulators and issuers and the SEC Rule 11Ac1-5. The second type of transparency is of a more immediate kind. This involves the release of market information that could affect the behaviour of participants at or around the time of the release of the information. While the first type of transparency is not the main focus of the EU Markets in Financial Instruments Directive (MiFID), it may be a substitute for the more immediate type, so it is worth considering how the two types of transparency interact. Recent research shows that some of the perceived benefits of market transparency can be obtained by simply reporting on the performance of participants in a public forum. In particular, Zhao and Chung (2006) investigate the effect of SEC Rule 11Ac1-5 on trading costs. The Rule requires equity market centres in the US to make monthly public disclosure of execution quality. It was introduced to achieve a more competitive and efficient national market system simply by increasing the visibility of execution quality. Zhao and Chung find that execution quality improved as a result of the introduction of this rule. This approach to transparency is similar to that which is now commonplace on internet trading sites to help sellers build reputation and buyers acquire confidence.3 With increasingly anonymous electronic trading, the provision of a public forum for the establishment of reputation substitutes for the build-up of trust between dealers and clients who have traditionally developed reputations in repeated bilateral voice-communicated trading. Since the information is presented in an aggregate way and with delay this type of market transparency can have noticeable effects on competitive pressures without compromising the operation of the market. One problem with this rule, however, is that it focuses on purely price-related execution quality. Many sell-side 3 For a recent study analyzing this type of mechanism in internet trading see Bolton, Katok and Ocenfels (2004).

8
participants argue that the quality of the service they provide is multidimensional and cannot be well represented in these limited quantitative terms. The delayed transparency associated with Rule 11Ac1-5 is of very recent vintage and is likely to have been a response to the increasing fragmentation of the US equity market in recent years. A similar kind of delayed transparency (perhaps considered a substitute) has been a feature of the government bond markets for a long time. Both regulators and government issuers in the US and Europe have required primary dealers to report on their activity, usually on an end-of-day basis. In the US and UK some of this information is displayed for public scrutiny at lower than daily frequency. Part of our study explores the reasons for this and its effects. Broadly speaking, this has been used as a way to encourage full and competitive participation by primary dealers. It seems to have become more widely used in Europe in recent years, particularly for the smaller issuers. We analyze its effectiveness as a substitute for other forms of transparency. The benefits arising from this type of transparency depend on the extent to which the issuer’s objectives are compatible with the objectives of other market participants. We provide a theoretical model that examines how optimising behaviour of issuers and dealers lead to outcomes that are measurable in terms of execution quality. Our empirical analysis also provides support for our theoretical findings. MiFID goes much further than requiring transparency to regulators. The MiFID transparency provisions, if extended to government debt markets, would require Regulated Markets (RMs) and Multilateral Trading Facilities (MTFs) to make public the bid and offer prices that are advertised through their systems by their members and to publish the price, volume and time of transactions as close to real-time as possible.4 Similar requirements would apply to dealers in OTC markets. Thus, part of our study takes ‘market transparency’ to mean the public availability of more immediate pre- and post-trade information. We include amounts bid and offered at different levels of an order book as also relevant. The value of this more immediate and detailed information depends on how widely it is disseminated, how quickly, and at what cost. Immediate pre- and post-trade information of this type is useful for ex-post best-execution audit. It is often of more interest to market participants, however, if it contains information about the identities of traders or at least about the likely type of trade that is imminent. A market would be considered very transparent if this kind of information were either directly observable or inferable from observable data. We know from recent empirical work by Aitken et al. (2006) that too much of this kind of transparency can be damaging to market quality.5 2.2 Electronic markets and transparency While electronic markets can be designed to protect actual identities (e.g., the introduction of anonymity of quotes on the Italian MTS analyzed by Scalia and Vacca, 1997), they also tend to provide information more quickly and in a more user friendly form to a wider number of participants than other types of trading mechanism. Sophisticated real-time statistical analysis of copious amounts of readily available data from a completely transparent market could enable market participants to infer impending trader-type and size. Such analysis could make it possible to deduce whether a trader is about to embark on a series of trades of the same type due to an unwanted inventory position, and this would impede the ability of the trading venues to provide quality liquidity services. Even if this does not help participants to decipher 4 Delayed publication may be allowed for transactions of a certain size or type. 5 Aitken et al. (2006) show that revelation of the limit-order book beyond the inter-dealer context (i.e., to investors) has negative effects on a range of market quality attributes in the case of all seven of the world’s largest equity markets that they studied.

9
impending trade type, it could potentially affect the equilibrium amount of information reaching the market in the first place. Government bond markets are usually segregated into inter-dealer (B2B) and dealer to customer (B2C) segments with potentially many competing venues in each segment. Both of these segments have been becoming more automated and transparent, and this matters for the effects of regulatory changes. Underlying our analysis is the possibility that information from electronic trading platforms could flow with such speed and efficiency that it would potentially damage market quality. First, the details of client transactions with dealers in the B2C segment might become too quickly and too widely distributed in the B2B segment. Second, there might be too much visibility in the investor community of the inter-dealer or B2B limit-order book. In the first case, excessive transparency of the B2C activity could reduce the quality of the inter-dealer market, because no dealer would be able to conduct business with a client without the market knowing about it instantly, and this would militate against obtaining a good price in the inter-dealer market. This has not been extensively analyzed in the literature, and we provide an analysis later in this study. In the second case, excessive transparency of the B2B limit-order book might reduce the frequency with which clients request quotes from dealers, and this would starve dealers of one of their main information sources. There would be less information in the B2B limit-order book regarding buy-side participants’ actual and potential liquidity demands. This has been touched upon in the empirical work of Aitken et al. (2006), but we also provide an analysis of this for the case of increased transparency of the eSpeed limit-order book of the US Treasury market. This is the background and motivation for our detailed theoretical and empirical analyses. We shall assess how transparency interacts with other aspects of market quality, but we need also to assess the speed with which transparency initiatives can safely be put into effect. Much of what we have discovered in the course of our fact-finding and ancillary research is also relevant to the MiFID debate. Understanding what produced the current state of the market is critical to assessing how regulatory changes may affect it in the near future. 2.3 Restraints on transparency On the basis of theory, empirical work and analysis of the market institutions, we conclude that instantly and completely transparent electronic trading arrangements should not be the only mechanism available for the trading of inherently illiquid financial assets. This explains why transparency restraints are a feature of most markets. One obvious restraint is to keep transaction information from the market or to delay its release. Many electronic markets provide less than full transaction information. For example, many information providers give only the price of a recent trade and not the quantity, and there are many examples of electronic markets where information about large trades is significantly delayed. In the B2C segment, most request-for-quote (RFQ) systems do not inform all quoting participants how far their quote was from the winning one and restrict the number of dealers from which requests for quotes can be made simultaneously. This ensures some degree of opacity and helps to mitigate a ‘winner’s curse’ (see Box 1) occurring in the B2B space immediately after electronically held B2C request-for-quote auctions. Also, government bond B2B trading platforms such as the MTS platform in Europe and the BrokerTec platform in the US do not make the full extent of the B2B limit-order book available to all participants outside the B2B space. Even within the B2B space, they permit hidden order quantity alongside the displayed amounts on the limit-order book.

10
Box 1: The winner’s curse The Winner’s Curse is an idea from the theory of auctions which argues that the highest bidder has probably bid too much. If the highest bidder wants to resell the product immediately after the auction, the best price he will obtain is the underbidder’s price. Because of incomplete information or subjective factors, bidders will form a range of estimates of the item’s ‘intrinsic value’. As a result, the largest overestimation of an item's value ends up winning the auction. With perfect information and fully rational participants skilled in valuation, no overpayments should occur. Consider the structure of the secondary bond market. In the B2C market, the seller makes a request for quotes on an electronic platform such as Tradeweb. A number of dealers submit quotes, and the highest-bidding dealer secures the bonds. Typically, the successful dealer enters the B2B market to hedge his risk. The underbidders are aware of this and can benefit by taking up contrarian positions in the B2B market, thereby making it difficult for the successful bidder to share his position. The more transparent the B2C market, the more difficult it is for the successful bidder to hedge his risk in the B2B market. Consequently, an increase in market transparency makes dealers more cautious about participating.
These arrangements and others like them are transparency restraints that are motivated by a desire to serve market participants in some way and to ensure that other aspects of market quality, in particular liquidity, are not impaired. In large part they evolved over a protracted period through competition with other alternative arrangements (although some systems were favoured by national regulators or issuers, and this allowed them to thrive). What is apparent from this process, however, is that it has not led to total transparency in any significant sense for any of the major government bond markets. This is despite recent attempts to influence the markets in this direction. For example, despite the calls for increased transparency in the US Treasury market in the early 1990s, the market currently consists of no less than three major platforms with varying degrees of transparency for the trading of benchmark US Treasuries. When taken together, these do not represent a completely or homogenously transparent market. Notably, a significant proportion of trade in off-the-run US Treasuries still takes place over the counter (OTC). Box 2: On-the-run and off-the-run government bonds The term ‘on-the-run’ generally refers to the most recently issued bond in a maturity bracket. The on-the-run period is a period within which there is higher than normal trading activity due to the fact that the newly issued bonds are not yet held in inactive portfolios. This term is virtually synonymous with the term ‘benchmark’ in the context of the US Treasury market. In the context of the MTS platform the term ‘benchmark’ is a wider concept, and it can include the three most recently issued bonds in a maturity bracket for a particular country not all of which are actively on-the-run.
We do not wish to overstate the inadequacies of instantly transparent electronic trading arrangements. Participants respond to changes in their environment, and this is particularly true if developments threaten anonymity. The high transparency of electronic trading venues has led to participants engaging in game playing. This helps to hide positions and the likely pattern of planned trades. But game playing requires time and thought, and this is expensive. In response to this cost some brokers in the US Treasury market now provide their buy-side clients with direct algorithmic electronic trading facilities that can time trades and ‘work’ them so that the trading pattern is harder
11
to decipher. Such developments are an example of how markets have evolved in response to available facilities, technology and rules. Thus, trader type-identity is easier to protect if a lot of activity is going on and if this activity is sufficiently complex. But a prerequisite for establishing this level of complexity is a minimum fundamental level of trading activity. Thus many electronic markets, especially those with high turnover, have remained de facto opaque in the sense that type-identity is still unpredictable and liquidity providers still face a small enough risk of suffering a ‘winners’ curse’ immediately after they trade. While this response by participants widens the universe of assets that can be made amenable to transparent electronic trading, we caution that participants require time to respond to such changes and that the transition to new arrangements can be precarious and volatile. Recently, transparency developments have, according to our interviewees, reduced per-trade profits available from trading and supplying liquidity, but at the same time information technology improvements have reduced the costs associated with retaining a presence in the marketplace. Thus markets have developed ways of responding to more transparency. It is not clear whether they can continue to do so in the future. It is likely, however, that sudden large changes would be more disruptive than naturally occurring gradual ones. We are aware that a number of initiatives aimed at linking the increasingly electronic trading arrangements of the B2C US Treasury market directly with the B2B segment have been tried and failed.6 2.4 Voice communication and repetitive trading relationships Even if transparent electronic trading arrangements with some restraints were viable, we should consider the positive aspects of what would be replaced. Game playing and timing of order placement are ways to make electronic mechanisms emulate human interaction, but the possibilities for such emulation are limited. Direct human communication has advantages over and above timing and game-playing. In voice communication, the possibilities for nuance and deep understanding of customer (and liquidity provider) needs is much greater. This issue has been explored in the context of the US Treasury market by Barclay, Hendershott and Kotz (2004), who examine the role of voice-brokered trades for Treasuries going off-the-run. Their findings explain in a more general context why voice communication has remained a feature of many markets despite the availability of electronic means of trading the same securities. Voice communication (in repetitive trading situations) allows for the development of trust between the trading parties7. In the conduct of large transactions among game players there are many risks. If an agent could trade as if it were a ‘single-shot’ game, no one would wish to be the trading partner, because the risks of making a loss would be perceived as very high. Essentially, there would be a lack of trust. This is to be expected unless there is some repetition of the trading situation and therefore some future loss that can be expected to outweigh any current perceived gains from cheating. Even then repetition of a trading game without human interaction may lead some participant eventually to regard the benefits of a ‘once-off’ end-game play as irresistible. The Citigroup trades of 2 August 2004 in the European government bond markets are a case in point. Here, the anonymity of the trading environment may have fostered an approach to trading that did not properly assess the costs that could arise from violating the trust of other market participants and issuers.
6 For the details of one such attempt see L. Tabb (2004) available at www.wallstreetandtech.com/showArticle.jhtml?articleID=18901634 7 Barclay et al. (2004), also mention the importance of repetition in trading relations but do not test specific hypotheses relating to this discussion.
12
Anonymity is not always a disadvantage. In fact, in the case of voice communicated trading some anonymity is often introduced (e.g., in the form of inter-dealer brokers) to ensure that this kind of trading mechanism can reach a better outcome. This suggests that some mix of anonymity and transparency is optimal. The disadvantages of anonymous electronic trading explain why many of the earliest electronic platforms (including the MTS) revealed the identities of the participants providing each quote. These early trading arrangements can be viewed as attempts to emulate what were considered to be positive attributes and salient features of the pre-electronic trading environment. Unfortunately, identifying limit-order setters also identified the parties to any trades, and this in turn made inventory sharing difficult or impossible. This is an example where transparency was excessive from the point of view of market quality. Introducing quote-setter anonymity reduced the risks of suffering a winner’s curse, but it also eradicated some of the positive qualities arising from the development of relations between trading partners. These relations are still a feature of the OTC segment of the market, where trading of larger than normal lots in less liquid bonds occurs. They are also still a feature of the UK Gilt market, where there is a hybrid trading arrangement. Thus there are mechanisms that suit some segments of the market better than others and also cases where a hybrid system, incorporating the qualities of both voice and electronic trading, may be the best arrangement. For fundamentally liquid (and naturally opaque) markets where traders’ choice of trade size and frequency is stable, electronic trading has many advantages over virtually any other method of trading just because of the ease and speed with which trades can be conducted. The increasing robustness of electronic trading systems has brought electronic venues to flourish in nearly all financial markets. They have cut trading costs and increased trading volume.8 But there remains a significant amount of trading that does not naturally gravitate to such venues. This is particularly true for fundamentally illiquid financial assets or those for which frequency and size of trade is naturally variable. Although government bonds are very standardized and therefore very amenable to electronic trading, there are times when there is great variability in issuance, redemptions and in the configuration of client demands. These are defining characteristics of the government bond markets; they arise due to the finite life of bonds and their limited period of liquidity (the on-the-run period, see Gravelle, 2003). These conditions might explain why voice-brokered interaction or some combination of voice and electronic trading remain a feature of government bond markets. Voice-brokered trading mechanisms may provide yet other benefits that must be weighed against their opaque nature. One relates to how efficiently the visible recent transaction prices reflect information. Electronic platforms are usually described as transparent and voice communication as opaque, but which of these trading mechanisms will provide the most efficient pricing will depend on circumstances. It could be argued that a voice-brokered market can be more price efficient than an electronic market because it allows a more sophisticated response to trades that are in fact uninformative. In an anonymous electronic market, price responds to all trades to reflect the likelihood, rather than actuality, that each one is informed. In a sense, an electronic market provides us with a price which is only on-average reflective of the information in trades. The nature and extent of the information in the market place could potentially be more accurately communicated by human-aided interaction among participants who have an ongoing mutual interest in being truthful with each other. Thus, transparency of a less efficient price from an electronic setting may not be as desirable as a somewhat less transparent but more efficient price from a voice-brokered market.
8 The fall in trading cost is primarily accounted for by the reduction in cost of time associated with human intervention in non-electronic trading systems, particularly voice-brokered trading.

13
This highlights one of the many trade-offs that is relevant to the discussion of an optimal level of transparency. This is particularly relevant for the B2C segment of the market. A customer with a large position to trade may be better off communicating this to a single liquidity provider, sparing him both the likelihood of experiencing a winner’s curse and the fear that there is an impending adverse information event. The expected length of time that an inventory position acquired as the result of an uninformed trade is willingly held will be increased if it is internalized, since this raises the probability of conducting a profitable off-setting trade without an overall price-impact. Even ‘informed trade’ could be conducted this way with benefits accruing to all participants, because the information in the trade can be priced independently of the winner’s curse. And since government bond markets are not likely to be characterized by informed trading, as it is usually defined, the winner’s curse is the main problem that faces liquidity providers. This will certainly be mitigated by single dealer to customer trading so long as that remains private to the trading partners for a sufficient length of time. Liquidity providers can prolong the opacity of OTC trades and increase the benefits if they can pass on the position to another buy-side participant without going through an inter-dealer broker (IDB). And the existence of a repetitive trading relation dictates that this trade will not be of the informed type (if it were informed, then passing it on at a price that did not reflect the information would entail some loss of reputation). Alternatively, in a market with voice communication in the B2C segment, informed trades can be routed by the receiving dealer through the IDB and these will tend to have price-impact relating to the proportion of IDB trades that are informed. This logic suggests that dedicated client-dealer interaction mitigates the winner’s curse problem even if the trade is informed. An added advantage of human communication in the B2C segment of the secondary government bond market (not as relevant for equity markets) is that a distribution network can be built up and used during the primary issuance stage. While ensuring that clients have a reason to trust dealers, the providers of liquidity can acquire information about the timing of the liquidity needs of their clients and build inventory positions to match these. The value to both the issuer and the end-customer of this role played by liquidity providers depends on how structured and standard is the primary issuance process and how complicated is the timing of liquidity changes in clients’ portfolios. If the issuance is non-standard, as for example in the recent very long-dated issues in the UK and France, then the distribution services of dealers will be more valuable for issuers and buy-side participants. If such issues are going to be a regular feature of issuance style, then a secondary market relationship between dealers and their distribution network, built upon direct human interaction, is likely to be important for the maintenance of a value-adding primary liquidity service. 2.5 The optimal level of transparency The discussion above suggests how difficult it will be to identify what level of transparency is optimal. We see merit in moving progressively towards increased transparency for the fundamentally more liquid issues at a speed that would allow for behavioural responses that could accommodate (and enhance the outcomes obtainable from) the changes. From our own empirical analysis we note that market quality is already quite high in the case of European government markets, perhaps because performance is already monitored by issuers. The objectives of issuers are sufficiently compatible with those of buy-side participants that this monitoring represents a good alternative to other possibly damaging kinds of transparency. We believe that the positive externalities associated with a well functioning government bond market are

14
high. We would therefore recommend caution where transparency changes can be expected to (i) threaten anonymity, (ii) aggravate the winner’s curse faced by dealers in the B2B market, (iii) reduce the flow of information from buy-side participants because of reduced information seeking, and (iv) excessively weaken the level of trust that exists in relationships that have been developed over time between dealers and clients.

15
3. Previous work on securities market transparency, liquidity and efficiency
3.1 Introduction Most theoretical and empirical work on the effects of transparency has been on equity markets and more recently on corporate/municipal bond markets. These markets differ in many ways from the government bond market (see Gravelle, 2000, and Martinez-Resano, 2005, for more detailed discussions of these differences). Equity markets operate in the context of significant asymmetry in information regarding the actual cash flows arising from operations. Bonds have fixed and known cash flows, a finite life, and are more likely to be held for the long run. The size of government issues is often very large. The pattern of issuance, redemption and bonds acquiring and losing on-the-run status implies that there are often significant temporary mismatches between supply and demand for these assets. The consequent risk positions taken by dealers providing liquidity are usually greater than in equity markets.
Both the theoretical and the empirical literature to date have mixed conclusions on the benefits or otherwise of transparency. The main theme is that infrequent large traders would prefer (or would obtain better execution quality on) opaque settings and more standard sized trades would obtain better service from markets arranged around transparent limit-order books. The degree of asymmetry in information regarding the actual cash flows of asset being traded significantly favours more transparency. Transparency can also raise the risks borne by dealers in markets where large, infrequent trades are the norm and where noise trades are not present in enough numbers. But less transparent ‘competitive dealership markets’ may benefit participants of any type when there is significant competition for order flow (Naik, et al., 1999). With this background, we consider a very select literature. Martínez-Resano (2005) goes into much detail drawing from an extensive array of mainly equity market research. He shows that the style of transparency regulation common to equity markets would not be entirely appropriate for government debt markets. We differ from his analysis and conclusions in some respects, but his work reflects so well the recent equity market research on transparency and sets out so comprehensively its applicability to government bond markets that we chose not to retrace the same ground.9 Instead, we outline the main points from this work that influenced what we chose to analyse in our own empirical and theoretical contributions. We follow this with some detailed analysis of particularly important parts of the literature. 3.2 Special features of government bond markets Martínez-Resano (2005) discusses the peculiarities of government bond markets in general and of the specific European context more specifically and provides a rationale for special regulatory treatment. His discussion of the microstructure of government markets leads him to conclude that ‘government debt markets truly possess specific challenges that account for their distinctive regulation.’ The author argues for regulatory involvement relying on ‘competition, integrative infrastructure and basic systemic protections’. The paper identifies basic economic constraints faced by issuers and regulators and argues that ‘the limits to concentrated trading of government debt and the informational constraints faced by fragmented venues defines a playing field to which regulators should accommodate’. Applying MiFID-type transparency regulation would not be accommodative in this sense. 9 For completeness and convenience, our list of references includes many relevant papers that we do not discuss in the text.
16
European government bond issuers are described as monopsonistic demanders of liquidity services. Government issuers depend on primary dealers to take up large risky positions in primary auctions and require them to maintain a strong presence in a secondary market which is often illiquid. Their obligations are quite diffuse across hundreds of bonds with very similar characteristics. Primary dealers comply with this arrangement in return for privileges such as access to recently issued stock at preferential prices and lead managership in syndications (and at a further remove, preferential consideration for privatisation mandates, etc.). Martínez-Resano argues that ‘the nature of information symmetries and matching costs in government debt markets determines a bias towards a fragmented microstructure at odds both with exchange-like arrangements and with ordinary regulatory approaches.’ He outlines the risks from transposing regulation directly from an equity-market perspective to the government bond market case. The paper criticises the ‘pure limit-order book plus affirmative quoting obligation’ arrangement faced by European primary dealers. It discusses repo and short-selling regulation in government bond markets as well as the political economy issues arising in implementation of transparency, disclosure and retail investor protection in selected country cases. Martínez-Resano points out that public intervention is warranted only by some type of market failure when the costs of privately solving the problem are high. Regulation typically addresses efficiency and fairness issues for financial markets whose behaviour exhibits a marked sensitivity to a range of informational asymmetries. Its practical emphasis is on the transaction costs that information imperfections impose on the different stages of market processes. The paper argues that the nature and intensity of transaction costs in government debt markets significantly differ from those in markets for private securities. This leads to the view that ‘an un-pondered application of high-level regulatory principles does not necessarily lead to efficient outcomes. In particular, this conclusion somewhat downplays the decisiveness of market transparency in government debt markets.’ The bulk of the work by Martínez-Resano is devoted to the economics of transaction costs in government debt markets arising mainly from a consideration of market structure and costs related to the information asymmetries, search costs and execution requirements that this structure imposes. The absence of informational asymmetries regarding cash flows on the investment in government debt render much of the analysis of equity market regulation inapplicable to government markets. The paper concentrates instead on the specific role played by informational asymmetries relating to both ‘order flows’ and the ‘distribution of holdings’. ‘Upward segments’ of the market, i.e., trading venues separated from the focal one, are deemed necessary because of the presence of sizable lots that have a time-decaying liquidity profile and are not subject to cash-flow asymmetry information effects. Short-selling and repos are also highlighted as special features that distinguish the government bond market from the equity market and imply a need for different regulation. The economic analysis of transaction costs relevant to government debt markets leads Martínez-Resano to argue for segmentation of markets. He maintains that the higher echelons of this market would be largely incompatible with implementation based on pure limit-order book matching. And, with reference to the work of Viswanathan and Wang (2002), he argues that trade size explains to some extent why the B2C segment of government bond markets is not generally based on a limit-order book approach. The economics of transaction costs thus seem to make anonymity and fragmentation a natural environment for government debt trading. He recognizes that the OTC structure of government debt markets is an obstacle to regulation and he therefore suggests some ways to improve disclosure, transparency and the integrity of the whole market at no
17
significant cost. This is related to discussions of the measures introduced in Spain relating to post-trade information and the GovPX experience in the US. He also discusses initiatives to protect small investors, to stabilize the market and to facilitate the enforcement of private agreements. 3.3 Theoretical literature on transparency Early analyses of the theoretical issues surrounding transparency and market design are by O’Hara (1995), Biais (1993) and Pagano and Roell (1996). Pagano and Roell do not clearly separate transparency between pre-trade and post-trade, but they find that uninformed investors benefit from pre-trade transparency. Seppi (1997) examines the case of a competitive limit-order book with and without a specialist market maker and finds that smaller and larger investors prefer the presence of the specialist. Biais, Foucault and Salanié (1998) consider limit-order markets combined with floor markets and dealership markets and find that the limit-order market possesses better execution quality and more efficient risk sharing. Similarly, Bagliano, Brandolini and Dalmazzo (2000) find that small trades will be able to obtain better execution quality on limit-order markets and that large traders will seek to trade with dealers. Viswanathan and Wang (2002) analyze the influence of trade size on market structure. They consider investor welfare under three types of trading: dealership, pure limit-order book and a hybrid design. They conclude that more risk-averse customers prefer the hybrid market structure while risk-neutral customers prefer a market structure based on a limit-order book. More recently, Madhavan, Porter and Weaver (2000) and Baruch (2003) construct theoretical models to examine how order book revelation affects market quality. Models of this type generally find that dealership markets have larger bid-ask spreads, because the risk exposure of the dealer is greater when quoting a price at which more quantity is usually tradable than at the marginal quote in a limit-order book arrangement. Thus execution quality is not just about the size of the spread. Baruch (2003) studies how a change in the amount of the limit-order book that is visible to the market as a whole affects the distribution of orders across limit-order prices as well as execution risk. This model assumes that traders wanting to trade large orders will expect a less favourable average price in the non-transparent case because of the information revelation that occurs when trades are broken up to elicit hidden limit-orders. The difference in expected prices between the transparent and opaque settings is the premium for transparency. In this model, the premium is directly accounted for by reference to the smaller volume that is available at each limit price under transparency. Transparency would be expected to cause a shift in limit-orders away from the best price. The model would not necessarily predict a widening of spreads. It does, however, predict that the frequency of order size exceeding the volume available at the best prices would rise with transparency, because traders placing market orders are no longer uncertain about the prices they can expect to obtain. This is an interesting approach, because limit-order quantity remains partially hidden in the B2B segments of the European government bond market and the US Treasury market. This could represent a level of transparency that is closer to the optimum than full revelation of limit-order depth. As discussed by Naik, et al. (1999), competition for order flow is an important factor affecting execution quality in competitive dealership arrangements. Parlour and Seppi (2003) present a model of competition for order flow between a pure limit-order market and a hybrid market (where there is a specialist in combination with a limit-order book as in the NYSE). They find that there are various possible equilibria in which different market structures would dominate. These are dependent on the usual factors
18
determining investor characteristics and trade size. An interesting contribution by Back and Baruch (2004) shows that there is a direct relationship between the execution costs of markets employing the open limit-order book arrangement and those arranged as floor exchanges. This requires some simplifying assumptions, but assuming optimization by traders they find that the two markets are equivalent in transaction cost terms when different optimal execution strategies are employed. 3.4 Evidence from experimental markets on transparency changes The experimental approach to financial markets has produced interesting insights into a number of issues relating to the effects of imposing different microstructures. It has also produced some disagreement. Flood et al. (1999) and Bloomfield and O’Hara (1999) both find positive benefits of post-trade transparency. But whereas Bloomfield and O’Hara (2000) find that pre-trade transparency is good for both liquidity and price efficiency, Flood et al. (1999) find a trade-off between liquidity and efficiency as pre-trade transparency increases. In a more recent contribution Flood et al. (2002) consider similar issues in the context of differentially informed dealers. This situation arises in a market that allows delayed reporting of large trades (such as is the current practice in the London stock Exchange, also suggested in recent MiFID proposals to protect liquidity providers and give them time to work off large inventory positions). Flood et al. (2002) vary both pre-trade and post-trade information independently as well as the way in which information is disseminated. Of particular interest to the current bond market environment, they allow dealers themselves to have differential access to information rather than assuming that inside information is the preserve of the public trader. In the experimental setting, they are able to look at different measures according to the type of trader. This provides insights not normally available from analysis of natural experiments in the real markets. They find that informed dealer profits are greatest when price efficiency is lowest and that price efficiency is increased by post-trade transparency and reduced by pre-trade transparency. They find that liquidity is improved by pre-trade transparency and reduced by post-trade transparency. These findings apply only to very clear sets of experimental circumstances. More realistic settings can complicate the likely outcomes, and this partly explains some of the differences in conclusions that can be drawn from the work of different authors. Bloomfield and O’Hara (2000) allow dealers to operate in both opaque and transparent settings simultaneously, and this gives rise to very different conclusions. Where these are brokered trades, there is less transparency for the market in general but typically more information revelation between the trading partners themselves. According to Benviste, Marcus and Wilhelm (1992) and Madhavan and Cheng (1997), such situations can be Pareto-dominant equilibria in which dealers face lower adverse-selection risks, public traders obtain price improvement and prices are more informative. The reality of most market settings is the simultaneous existence of different trading structures, and this is not fully represented by the experimental approaches discussed here. In their earlier work Flood et al. (1999) investigate, for a multiple dealer experimental setting, the differences in price discovery and other aspects of market quality (spreads and volume) under opaque and fully transparent (pre-trade) regimes.10 They allow inter-dealer trading. This produces more efficient price discovery in the opaque setting but at the cost of less liquidity (and volume). In the transparent setting, dealer prices are less 10 This experimental market is not directly comparable with the trading arrangements in Europe where there is a hybrid situation in which an opaque OTC market coexists with the inter-dealer and request for quote markets. The hybrid situation is better understood by reference to an experimental study by Bloomfield and O’Hara (1999) also discussed above.
19
responsive to new information, and pricing errors decline less rapidly over time. They attribute this outcome to higher search costs that induce more aggressive pricing strategies. This contrasts with the usual assumption that price-transparent microstructures better allow traders to extract information from outstanding quotes. It also contrasts with the findings of Madhavan (1995) that ‘quote-driven’ markets are more price efficient than ‘order-driven’ markets. Flood et al. (1999) test three hypotheses concerning the effects of quote disclosure on market performance. Their first hypothesis is that dealers narrow spreads to attract informed trade. This is tested by examining the spread dynamics after dealer engagement with informed trade. They find strong support for the hypothesis. The second hypothesis tested is that dealer spreads are wider in the opaque setting. A comparison of average spreads across the participants in each 10 seconds of the experiment indicates lower spreads in the transparent setting. The third hypothesis is that transparency enhances price discovery. This is tested by examining pricing errors. Pricing errors decline over the time-span of the experiment in both settings but more rapidly in the opaque case. The results can be summarised as follows. Pre-trade transparency reduces search costs, reduces uncertainty and improves liquidity. In this case dealers learn about the underlying true price both by trading and by observation. By trading early at quotes that are tight they can get some informational advantages. This information, along with the observable quotes of other dealers, enables informed dealers to avoid being picked off in a trade on the wrong side of the market and to keep their price competitive on the right side. This leads to less aggressive price adjustments in the transparent market. Hence there appears to be a trade-off between liquidity and efficiency when transparency is increased. Bloomfield and O’Hara (1999) provide evidence based on experimental methods to suggest that trade disclosure significantly improves the informational efficiency of the markets but widens bid-ask spreads. These experiments assume no transparency differences across different venues at the same time, and this might be relevant for a post-MiFID environment where opaque venues would not be permitted. The increased efficiency is in terms of the speed of convergence of mid-quote values to true values. This is consistent with results due to Madhavan (1995) and Pagano and Roell (1996). They also find that spreads widen in more transparent circumstances because of a reduced need to compete for order flow. Significantly, they also find differential effects from quote, as opposed to trade, transparency. Trade transparency has significant effects while quote transparency on its own does not. This may arise in their setting because of the lack of inter-dealer trading. With inter-dealer trading, Flood et al. (1997) find significant effects arising from quote transparency. The question asked in Bloomfield and O’Hara (2000) is whether transparent markets would thrive in an environment of competing differentially transparent venues. The type of transparency considered by these authors is post-trade transparency. Motivated by a game-theoretic model of trader behaviour in an uneven environment of transparency, they use experimental methods to address the question. Lower spreads are offered by the less transparent dealers in their first experiment. This is to capture order flow. This allows some narrowing of the spread in the transparent trades and profitable use of informational advantages gained. Traders who are not allowed to hide their trades make losses. This experiment shows that concerns regarding transparency differences between markets trading the same assets are well-founded. ‘Transparent markets do not thrive in competition with less transparent venues.’ Participants in their second experiment are allowed to choose their level of transparency, and in this case they show that dealers will endogenously gravitate toward the less transparent venue. Simaan, Weaver and Whitcomb (2003), discussed below, provides empirical support for this experimental work (but the latter paper deals with pre-trade quote anonymity).
20
3.5 Empirical analysis of liquidity, costs of trading and price efficiency in relation to transparency
There are two veins of the microstructure empirical literature that are relevant to this study. One considers the evidence for differential market quality based on data from different types of market for the same types of assets. Most of this literature supports the theoretical propositions discussed above. The other literature considers the effects of specific transparency events in a single market context. A number of studies comparing execution cost across different types of market employ samples of equities that are cross-listed in different markets. An example of this is Degryse (1997), in which the execution cost differences for Belgian stocks is compared against their cross-listed venue (SEAQ-I, a specialist with limit-order book arrangement). In general it is found that trading cost is lower for larger trades made in London and higher for smaller trades. Other studies in this vein use matched pairs of different stocks across exchanges. This widens the sample available and also increases the number of different venues (with different combinations of characteristics) that can be compared. There is a lot of literature focusing entirely on the comparison of the NYSE and NASDAQ. The most recent of these by Boehmer (2004) finds that overall execution costs are higher on NASDAQ and execution times are generally faster. For large trades the NYSE is faster and more expensive. In the evidence comparing non-US exchanges there are some interesting results regarding the effects of mandatory quoting by dealers. In particular Booth et al. (1999) measure execution costs for 30 matched pairs of German and NASDAQ stocks. The German market considered is described as an ‘agency auction market’ not involving the quoting obligations that are imposed on dealers who participate in NASDAQ. They find that execution costs differ only for the largest stocks, where they are higher on NASDAQ. They attribute this to the mandatory quoting. More recently, Swan and Westerholm (2004) and Aitken et al. (2006) both consider the execution quality of different international equity markets in a multivariate regression approach. The latter authors used a matched pair methodology and consider fewer exchanges but more comprehensive coverage of thinly traded stocks, with more diverse explanatory variables. In particular they use various market attributes, including transparency within the B2B segment of the market and between the B2B and the B2C, as explanatory variables. They find that full transparency of the limit-order book within the B2B space reduces effective spreads, but transparency beyond this, to include the B2C segment, or to all investors, is associated with larger effective spreads. This is an interesting finding considering that our empirical work (below) also finds that a transparency increase to all investors in the eSpeed case leads to higher spreads (at least for a significant period of time). While Aitken et al. find that the presence of a market maker (or specialist) raises the effective spread, it reduces price impact for thinly traded stocks. Other studies that consider the effect of market design differences on execution costs with special consideration for thinly traded stocks are by Muscarella and Piwowar (2001) and Nimalendran and Petrella (2003). The first paper finds that the liquidity of infrequently traded stocks suffers from a move from periodic call to continuous trading. The second paper finds that a move to market making reduced execution costs on the Italian Stock Exchange. Lai (2004) also found that execution costs rose for stocks on the LSE Mid-250 when there was a change from a pure dealer market to a hybrid arrangement involving a limit-order book and specialist.
21
Several recent empirical studies examine transparency changes in actual markets. These changes provide ‘natural experiments’ that are in many ways real-life analogues to the experimental studies of Flood et al. and Bloomfield and O’Hara, among others. Bortoli, et al. (2005) is a good example of this literature. They examine a transparency event that occurred in the Sydney Futures exchange in January 2001. These authors also provide a simple theoretical model that generates a number of testable hypotheses. Their study is interesting in the context of the MiFID proposals, because it involves an increase in transparency regarding the limit-order book. Specifically, they study the effects of making the three best prices on each side of the order book transparent to all B2B participants. This change occurred on the Sydney Futures Exchange on 22nd January 2001. Two of the four instruments they examine are bond-related. Their theoretical model predicts (i) a shift in limit-orders away from the best price; (ii) not necessarily a widening of spreads; (iii) a rise with transparency in the frequency with which order size exceeds the volume available at the best prices, because traders placing market orders are no longer uncertain about the prices they can expect to obtain. The authors state three empirical hypotheses associated with these predictions and test them by comparing pre- and post-change subsamples. They allow a period for learning following the event. They measure depth and spreads at 20-minute intervals throughout the pre- and post-change periods. They apply simple t-tests of the difference in the spreads and depths over the two periods. In addition, they employ a regression modelling approach due to Harris (1996) to explain depth in the two periods while accounting for possible confounding effects such as volume and volatility. To assess the effects of the transparency change on execution risk, they test for the difference in the proportions of limit-orders that exceed the available volume at the best price. The results confirm the expected effects arising from the model. For example, average depth declines by 32.6% and 21.3% respectively for the futures contracts on the three- and ten-year bonds. Controlling for confounding effects using the Harris (1994) regression approach, transparency gives rise to declining depth. The average bid-ask spread is also found to rise significantly for the ten-year bond contract but not for the three-year one. Finally, there is also a significant rise in the proportion of trades that use up volume at the best quote. This confirms the hypothesis of reduced execution risk. As opposed to most of the evidence, this suggests moving to more transparency might attract larger orders away from more opaque settings. Boehmer, Saar and Yu (2005) study the effects of increased pre-trade transparency by looking at the introduction of NYSE’s OpenBook service that provides limit-order book information to traders off the exchange floor. They find that traders submit smaller orders post-OpenBook introduction and that they cancel orders faster. The price impact of orders declines, and this can be interpreted as an increase in liquidity. They also find some improvement in the informational efficiency of prices. Although they regard the effects of the transparency change as benign, they show that this is not true for all participants. Madhavan, Porter and Weaver (2004) also examine a transparency event, the introduction of public display of the limit-order book on the Toronto Stock Exchange, and they find that execution costs increase. 3.6 What the literature tells us Overall, there is still contradictory evidence and some conflicting theoretical propositions regarding the effects of different types of transparency. But some of the common features from this literature imply that infrequently traded stocks benefit from some degree of opacity. There is also a reasonable amount of evidence showing that a very transparent B2B limit-order book does not have benign effects on execution quality. And a careful reading of the contribution by Martínez-Resano suggests that for the special case of government bond markets this finding is likely to be more secure. It is perhaps

22
not surprising, then, that our own analysis of a transparency event in a government bond market context finds evidence of such an outcome. In our analysis of this issue later we go beyond the narrower focus of existing theoretical models to suggest a novel reason why this outcome is so likely.
23
4. Bond market transparency, liquidity and efficiency: a new theoretical model
4.1 Structure of existing fragmented European national government bond markets
Most national government bond markets in Europe are very small in scale. They were developed when there were many European currencies. Government bonds were demanded by private agents to provide benchmark returns across the yield curve. They also provided risk-free assets for optimal portfolio management. Within the eurozone, it is no longer obvious that we need government bonds from every member state to discharge these functions. The benchmark return is determined by French and German bonds at different points on the curve. The wonder is that national governments for the smaller countries within the eurozone attract any liquidity at all. It is clear that the small country issuers must be providing some form of incentive to secure participation in their otherwise marginal bond markets. Even before the creation of the euro, DMOs across Europe had guaranteed liquidity in their government bonds by deploying the ingenious auction-syndicate structure. This is a two-stage procedure. Dealers are incentivised to enter the market by the carrot of being invited at a later stage to participate in profitable syndicates. Unless the dealer bids at the auction, she will not be invited to participate in a subsequent syndication. Indeed, in most countries, bidding at auction is only a necessary condition for being allowed to join the syndicate at the later stage. Dealers are ranked by ‘performance’ using various criteria which serve the DMO’s perceived interest. Only the best ‘performing’ dealers proceed to syndication. Part of the reward for participating in the syndicate is that the issuer provides ‘benefits’ to the participating dealers. Well designed auction-syndicates lead to situations where dealers actually make losses at the auction stage spurred on by supernormal syndicate profits in the second stage. 4.2 Provision of ‘benefits’ and extraction of rents from end-customer The objective of the debt management office is to maximise the return to the Treasury. The dealers also maximise return. It is the end-customer that ultimately holds the bonds. As a monopoly issuer, the DMO can extract rents from the ultimate customer. These can be shared with the dealer but only to the extent that they serve the interest of the DMO in maximising its own return. The DMO does not offer ‘benefits’ to the dealers unless they can also be ultimately extracted from the end-customer. Part of the way in which the DMO extracts rents from the end customer is by controlling the degree of transparency in the dealer-customer market. An opaque market is one in which the asymmetric information problem is acute. This means that the spread is higher than in a transparent market. The additional spread is distributed between both dealer and issuer profitability to an extent that is determined by the market structure. The issuer controls the latter by introducing institutions such as the Auction-Syndicate system. The more transparent is the dealer-customer segment of the market, the less pronounced is the asymmetric information problem and the lower the additional spread that arises in trading. However, this also reduces the potential of the DMO to extract rents from the end-customer for the issuer’s benefit as well as that of the dealers. 4.3 Theoretical framework We propose to illustrate the above ideas using the analytical technique of game theory. This is particularly effective in analysing market structures where there are supernormal profits to be earned and where agents are competing for these rents. There are two

24
games. In the first, we try to characterise the current situation, pre-MiFID, where the market is opaque. We analyse the optimal outcomes for dealers and issuers and show the rents which are extracted from end-customers. In the second, the opacity is removed (or equivalently transparency is introduced), post-MiFID. We again show the outcomes for the three types of participants: issuers, dealers and end-customers. The type of game that we introduce is relatively simple. It has no dynamic aspect.11 Each issue of bonds is discrete, with no connection to the past nor future. The equilibrium is of the Nash (non-cooperative) variety: each agent with strategic power optimises independently on the assumption that every other agent with strategic power is also optimising. The issuers and dealers are strategic while the end-customers are passive and have no market power. The strategic players share a common knowledge framework, while the end-customers can only see the price charged by dealers. One of the problems with games which are solved using the Nash equilibrium concept is that there are often many equilibria. This makes it difficult to carry out the very kind of analysis that we propose. Ordinarily, we could simply list the set of equilibria under opacity and again describe the different set of equilibria under transparency. This would be interesting but hardly a very focussed guide for policy. We overcome this problem by defining the game in such a way that the outcome is at least unique along the dimensions that are important for policy. We also make the game under transparency a special case of the game under opacity. This enables us to compare the opaque and transparent equilibria using the tools of ‘comparative statics’. 4.4 Game between dealers and issuers when markets are opaque (1) The players are
• A single issuer
• 2 identical dealers
• A continuum of end-customers. We describe each player in turn. The issuer The issuer wishes to sell a tranche of debt. For simplicity we normalise the amount of debt to 1 unit. Since there are no intertemporal aspects, we are silent on the maturity composition of the issue. The auction-syndicate structure has already been imposed by the issuer, and the degree of opacity is given. The issuer sets a parameter k before the issue which determines the extent of ‘benefits’ that accrue to the dealers during the syndicate stage. Crucially k takes the form of a multiple of the degree of opacity of the dealer-customer market. Given this, the only decision which the issuer has to make is to maximise the price P which he obtains for the bonds. The dealers There are two identical dealers. In fact, the model can easily be generalised, without any additional insight, to many identical dealers so long as the dealers are not so many in number that they have no strategic power at all. They buy the bonds from the issuer partly through auction and partly through syndication. They have an order processing cost α per unit of bonds. They make their profits from the spread which they extract from selling the bonds to the end-customers at a price PL (meaning low price, see below) plus the spread. If the issuer succeeds in extracting a higher price PH from the dealers
11 In reality, this is a repeated game. Performance at auction (see below) is a long term criterion.

25
at the auction stage, then the loss H LP P− is offset against the profit made from the selling on of the bonds to the end-customers. The end-customers There are an arbitrarily large number of end-customers, none of whom has any strategic power. They are price takers and their demand for bonds is infinitely elastic (2) The game The essential idea here is that the primary issuer structures the game so that she obtains the maximum possible price. This is achieved by incentivising the primary dealers. In effect the primary issuer and dealer share a rent which is paid ultimately by the end-customer. The end-customer obtains liquidity in return. There are two rounds to the game within a single period.12 In the first round, the issuer announces the tap and the auction is held. Only two prices can be bid,13 a high price PH and a low price PL Only three quantities can be bid for: a large amount HQ , a small
amount LQ or nothing at all. To fix ideas, we let 34HQ = and 1
4LQ = . Since the
dealers are identical, they both follow the same strategy. If the dealers do not bid, the auction fails. But then the issuer does not permit the dealers to proceed to syndication because of poor performance. In effect, liquidity in the market dries up. If they both bid HQ , the issue is immediately oversubscribed by 50%. The issuer
responds by rationing the two dealers so that each is allocated 12 . The issuer could
privilege the dealer that offered the higher price, but the symmetry of the problem rules out different price bids by the two dealers. If this occurs, the game in the primary market is finished and there is no government paper left for syndication. The dealers then sell the bonds to the end customer. We assume that they obtain the price LP α+ from the end customers whereα is the spread. If the dealers had bid the low price at the auction, their profit is precisely zero. If they had bid the high price, they make a loss equalling
H LP P− . If they both bid LQ , then half of the stock is sold to the dealers who immediately sell the paper on to the end-customer at price LP α+ . The issuer is still left with half the tap and then proceeds to syndication. Recall that the issuer ensures that this is where the attractive profits can be made. But the terms of syndication strictly depend on the performance of the dealers in the primary auction. If the dealers bid the low price, LP , participants in the syndicate are assured of obtaining the additional spread π from the end customers. We interpret π as the asymmetric information component of the spread arising from the opacity in the market. By contrast, if the dealers bid the high, they are rewarded by the additional spread , 1k kπ > where k is the multiple of ‘benefits’ which are conferred on the syndicate participants.
13 This is a simplification. We are making the point that primary dealers may be prepared to pay above the market rate in order to obtain the benefits of participating in the syndicate.
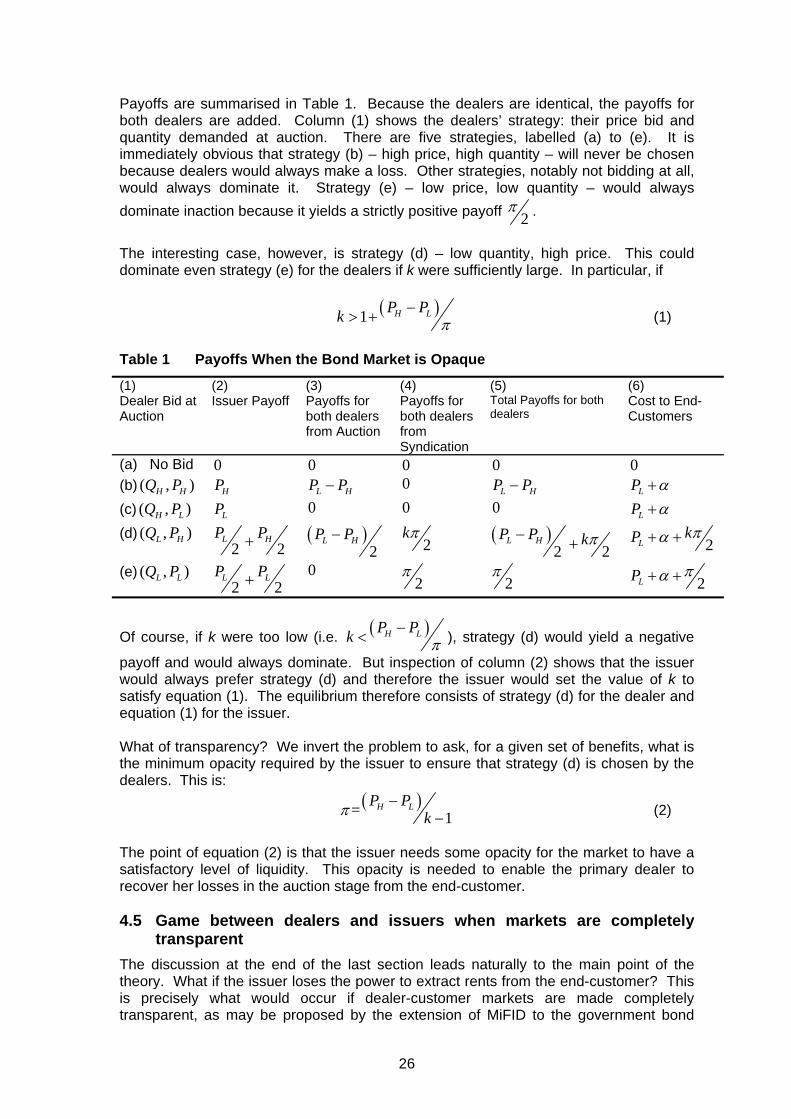
26
Payoffs are summarised in Table 1. Because the dealers are identical, the payoffs for both dealers are added. Column (1) shows the dealers’ strategy: their price bid and quantity demanded at auction. There are five strategies, labelled (a) to (e). It is immediately obvious that strategy (b) – high price, high quantity – will never be chosen because dealers would always make a loss. Other strategies, notably not bidding at all, would always dominate it. Strategy (e) – low price, low quantity – would always dominate inaction because it yields a strictly positive payoff 2
π .
The interesting case, however, is strategy (d) – low quantity, high price. This could dominate even strategy (e) for the dealers if k were sufficiently large. In particular, if
( )1 H LP Pk π−> + (1)
Table 1 Payoffs When the Bond Market is Opaque
(1) Dealer Bid at Auction
(2) Issuer Payoff
(3) Payoffs for both dealers from Auction
(4) Payoffs for both dealers from Syndication
(5) Total Payoffs for both dealers
(6) Cost to End-Customers
(a) No Bid 0 0 0 0 0 (b) ( , )H HQ P HP L HP P− 0 L HP P− LP α+ (c) ( , )H LQ P LP 0 0 0 LP α+ (d) ( , )L HQ P
2 2L HP P+ ( )
2L HP P−
2kπ ( )
2 2L HP P kπ− + 2L
kP πα+ +
(e) ( , )L LQ P 2 2
L LP P+ 0 2
π 2π 2LP πα+ +
Of course, if k were too low (i.e. ( )H LP Pk π−< ), strategy (d) would yield a negative
payoff and would always dominate. But inspection of column (2) shows that the issuer would always prefer strategy (d) and therefore the issuer would set the value of k to satisfy equation (1). The equilibrium therefore consists of strategy (d) for the dealer and equation (1) for the issuer. What of transparency? We invert the problem to ask, for a given set of benefits, what is the minimum opacity required by the issuer to ensure that strategy (d) is chosen by the dealers. This is:
( )= 1H LP P
kπ −− (2)
The point of equation (2) is that the issuer needs some opacity for the market to have a satisfactory level of liquidity. This opacity is needed to enable the primary dealer to recover her losses in the auction stage from the end-customer. 4.5 Game between dealers and issuers when markets are completely
transparent The discussion at the end of the last section leads naturally to the main point of the theory. What if the issuer loses the power to extract rents from the end-customer? This is precisely what would occur if dealer-customer markets are made completely transparent, as may be proposed by the extension of MiFID to the government bond
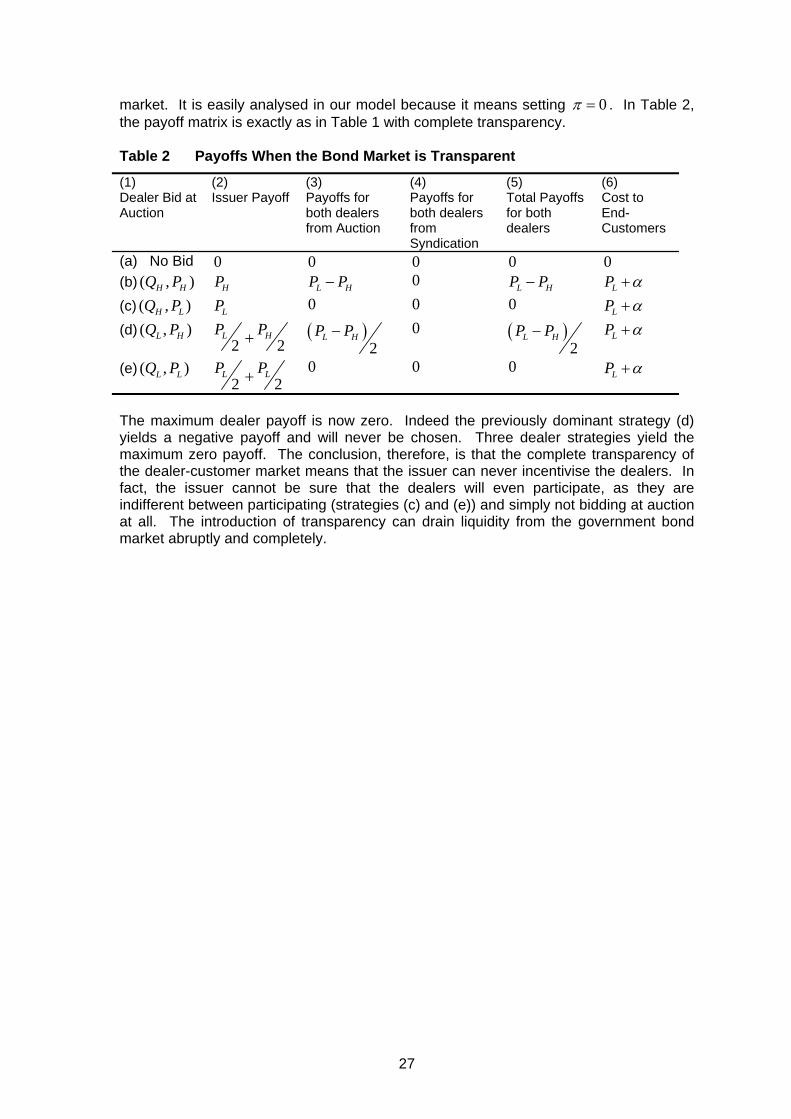
27
market. It is easily analysed in our model because it means setting 0π = . In Table 2, the payoff matrix is exactly as in Table 1 with complete transparency.
Table 2 Payoffs When the Bond Market is Transparent
(1) Dealer Bid at Auction
(2) Issuer Payoff
(3) Payoffs for both dealers from Auction
(4) Payoffs for both dealers from Syndication
(5) Total Payoffs for both dealers
(6) Cost to End-Customers
(a) No Bid 0 0 0 0 0 (b) ( , )H HQ P HP L HP P− 0 L HP P− LP α+ (c) ( , )H LQ P LP 0 0 0 LP α+ (d) ( , )L HQ P
2 2L HP P+ ( )
2L HP P−
0 ( )2
L HP P− LP α+
(e) ( , )L LQ P 2 2
L LP P+ 0 0 0 LP α+
The maximum dealer payoff is now zero. Indeed the previously dominant strategy (d) yields a negative payoff and will never be chosen. Three dealer strategies yield the maximum zero payoff. The conclusion, therefore, is that the complete transparency of the dealer-customer market means that the issuer can never incentivise the dealers. In fact, the issuer cannot be sure that the dealers will even participate, as they are indifferent between participating (strategies (c) and (e)) and simply not bidding at auction at all. The introduction of transparency can drain liquidity from the government bond market abruptly and completely.

28
5. The structure and operations of EU public debt markets, with comparisons to the US Treasury market14
5.1 MTS and EuroMTS The Euro MTS trading platform is the venue for trading benchmark euro-dominated government bonds. It has been adopted by many of the smaller European issuers as the preferred location for the monitoring of the trading obligations of their primary dealers. This has had a number of consequences, including the concentration of issuance on fewer maturities and increased pre- and post-trade transparency in trading of the smaller issues. It has allowed the smaller issuers to issue at very favourable rates, as primary dealers attempt to maintain performance by taking up larger proportions of issues in primary markets (at prices that squeeze out the participation of retail size) and posting relatively tight spreads in the secondary market. Other euro-denominated government bonds are traded on country-specific MTS electronic platforms that are completely integrated with the benchmark platform. Thus the countries outside the eurozone share some of the characteristics of eurozone members, and those intending to join often consciously follow eurozone practice (Hungary, for example, has MMTS). They of course do some of their issuance in euros. Mostly standard sized trades are on MTS, with OTC trading of larger sized trades. Most issuers monitor primary dealers’ secondary market activity on the MTS platform and elswhere. The MTS system is highly transparent: quotes and transactions data go directly to Bloomberg and Reuters and are available immediately (at a cost) to any market participants. The data, on cash and repo, give the first five levels of the order book depth in real time (large block quantities are hidden if they are to be ‘dripped’ in smaller amounts). But participants’ identities are not revealed. Post-trade, the last traded price (but not quantity) is shown; if a central counterparty (CCP) is used, counterparties will not know identities; if the trade is settled bilaterally, only the counterparties will know identities. The data permit examination of depth, effective cost of trading, amount of hidden quantity in the order book and the incidence of the trade size exceeding the displayed part of depth at the best limit-prices. These measures can give some indication of the efficiency of this market and how this may be related to its structure and transparency. 5.2 UK Gilt Market The UK gilts market has specificities due to its long history as well as the UK decision not to join the euro. It is said to be significantly less liquid than the euro markets. Trading in UK Gilts is predominantly carried out in a hybrid voice/electronic trading environment. There is a B2B space which involves five inter-dealer brokers providing screen-based executable anonymous quote input from the 15 or so primary dealer participants, the gilt-edged market makers (GEMMS). Voice communication between primary dealers and buy-side participants is often chosen for its subtlety. A large proportion of very large trades (or awkward small trades that are relatively costly to process) remain entirely negotiated by voice communication. The more standard voice orders that are negotiable often end up being put in as electronic quotes that are designed to attract trading interest. This produces the hybrid nature of the market. The B2C space is mostly characterised by voice requests for quotes from individual dealers or electronic request-for-quotes from several dealers. The single dealer to client network 14 Much of the material in this section is based on extensive discussions with market participants (see the list of interviews in Appendix 2). Casey and Lannoo (2005) give a broader picture of European bond markets.
29
seems to remain popular in this market. The main B2C platforms are TradeWeb and Bloomberg’s BBT system, the latter platform being more transparent. Retail quantities are often done through Bondscape, and this is a source of pre-trade transparency for the retail customer. There is also some post-trade transparency derived from the public information produced by the London Stock Exchange (LSE) where a significant proportion of gilt trades must be reported. Gilt market makers are not required to post quotes on the LSE, so there is no pre-trade transparency here. Trading activity in UK gilts is not heavily monitored by the UK Debt Management Office (DMO) or FSA. A consultation process conducted by the DMO and market participants in the late 1990s gave rise to the current separation of the B2B and B2C parts of the market. Holland (2000) describes the consultation process and its outcome. Although primary dealers were to have obligations to quote on the B2B market, as is currently the case on the MTS system for most European countries, these obligations were not eventually enforced in the UK case. Anecdotal evidence suggests that this was partly due to the fact that the spreads imposed were made progressively obsolete by the increasingly competitive trading environment, until they became meaningless. There was also little effort made to monitor obligations, and primary dealers had little to lose from reneging on their obligations. Since UK primary issuance was almost entirely conducted by auction (with post-auction positions protected by anonymity), there was little ancillary business to allocate to primary dealers who performed well in regard to their obligations. Since the market appeared to be functioning extremely well without these obligations, they soon fell by the wayside. What remains is a segmented market. Each segment appears to be well suited for the type of trading conducted in it and also seems to be competitive and efficient, if somewhat less transparent than the euro-denominated or US government markets. The UK gilt market is not large by international standards. This in itself implies that the market is less complex for participants to monitor and makes it de facto more transparent than markets with more activity. Any large trading interest is usually known by a significant portion of the market quite soon after it has been expressed. This increases the risks of supplying constant liquidity and makes it difficult to off-load inventory positions without large price-impact. The evidence based on the proportion of volume conducted by GEMMs with other GEMMs relative to their trading volume with the buy-side supports this view. It seems that GEMMs prefer to forego the benefits of using IDBs in favour of searching for other clients to take the opposite side of their customer deals. The effective cost of trading would be expected to be low if the gilt market were truly opaque. This is potentially due to the attempts by GEMMs to compete for order flow which has some value in an opaque setting. This is the prediction by Naik and Yadav, and there is some empirical support from the work of Hansch and Saporta (2004). If the market is not truly opaque (i.e., if it is easy to trace positions of competitors), however, then order-flow itself is not useful unless it can be distributed without too much price-impact. In this case an alternative view mentioned by Martinez-Resano (2005) may provide another explanation. He suggests that primary dealers engage in competition for a client base within which to match-off trades. In this case clients develop a long-term relationship of trust with a particular dealer. This allows the dealer to provide better prices because he knows that he is the only dealer informed of the trading intention. As of yet, it has not been possible to assess fully the validity of this argument, but the anecdotal evidence from interviews and consultation with the buy-side and the evidence from the B2B volume relative to the B2C would support it. There is also some evidence based on the distribution of B2C turnover across the GEMMs from the UK DMO website that implies some concentration which would be consistent with this view. We can also

30
assess this argument by an examination of the impact of order flow which should be less than that of a similar market without clientele building. The transitory deviations from underlying fair value should also be smaller on average in such a market because of the reduced temporary impact of order flow. Finally, one would expect to find primary dealers more often engaged in larger trades with buy-side participants and taking on more inventory risk. Effective costs of trading might also be explained by the regularity with which participants improve on posted prices by negotiation. The primary issuance activity does not appear to distort prices around auctions as is often the case for smaller issuers in the euro-denominated government bond market. While retail-sized trade in the secondary market is a small proportion (5%) of turnover, retail interest remains in existence in the primary auction market. This is an indication of fair-value pricing at issuance and the absence of overbidding there. By most accounts price discovery in UK Gilts is mostly centred on the cash market rather than on the Liffe/Eurex futures or swaps, and in this respect the gilt market differs from most other European government bond markets. The UK DMO seldom engages in syndicated issues, although a recent exception was the issuance of an index-linked 50-year gilt. 5.3 The US Treasury Market eSpeed is an electronic B2B platform dedicated to trading of on-the-run benchmarks at each of the main maturities. There is a great deal of transparency built into this platform, with visualization of the order-book stacks at the 5 best quotes. Participants given execution rights can easily and instantaneously effect trades and submit limit-orders. There is no hidden quantity at the various levels, and orders that use up the quantity at the best price simply work up through the order book until filled. Cantor Market Data makes the order book available to a wider market than those with execution rights through both Bloomberg and Reuters. BrokerTec is also an electronic platform mainly designed for trading of on-the-run benchmarks. This is not as widely visible to the external market place as eSpeed. There is also hidden and displayed order volume at each of the limit-order prices. The choice of what amount to display is not mandated. When a transaction exceeds the limit-order quantity there is a chance that hidden quantity will be available to fill the order at the same price. GovPX was created as a response to calls for greater transparency in treasury markets in the late 1980s. For the first decade or so of its existence, GovPX consisted of data from six IDBs including ICAP, Hilliard Faber and Tullet and Tokyo Liberty but not from Cantor. The idea behind GovPX was to consolidate the quotes of dealers and to transmit the best of these ‘firm quotes’ and ‘sizes’ to other dealers in real-time. The data was also made available to the market more generally within a relatively short space of time through on-line vendors such as Bloomberg. The data lost some of their relevance for the on-the-run market when eSpeed and BrokerTec began to attract an ever larger proportion of this type of trading around the turn of the millennium. ICAP bought GovPX in mid-2004, and this also affected the usefulness of the data. GovPX data can give insights into what happens when a market becomes increasingly electronic/transparent. It is also useful because it remains the main source of information about trading of off-the-run Treasuries and of trading that is not exclusively electronically mediated. There is also an interesting work-up facility recording process that is unique to the GovPX data set. 5.4 Developments in the EU since monetary union
• Eurozone countries now compete for investor interest. But these issuers are not homogeneous. They differ in fundamentals (and hence credit ratings) as well as
31
size of markets. They use different mixes of auction and syndication in the primary markets, with different criteria for awarding syndication mandates and different obligations on dealers in the secondary markets. Secondary market liquidity is important for the ‘name’ of government credits. The criteria typically are some mix of indicators of ‘performance’ in the primary and secondary markets plus additional ‘qualitative’ factors. The smaller or ‘peripheral’ countries (issuers) are said to put a higher weight on primary market performance.
• Recent years have seen the development of more sophisticated Debt
Management Office (DMO) agencies associated with national treasuries to manage public borrowing. In some cases, their mandate is highly technical: to minimize the cost of servicing the national debt. In others, perhaps those with closer Treasury involvement, there are wider objectives too, such as the health of the retail market, transparency, and appropriate behaviour on the part of market participants.
• 'Primary dealer' structures are a key feature of the markets. The new European
Primary Dealers Association has 21 'executive members' (dealing in Germany and at least three other Euro countries one of which has to be either France or Italy). The remaining approximately 55 primary dealers in the eurozone are eligible for regular membership. The primary dealers can be put in several categories:
o The big US investment banks o A few 'global' European banks who want to be present in all markets o Regional European banks - not 'global', but not simply domestic o The domestic banks that want to protect their home market share
This configuration leads inexorably to market distortion, in the form of overbidding at auctions, partly because issuers rate ‘performance’ on the quantity bid. Auction prices are normally higher than post-auction market prices. This is clearly a market distortion. Some but not all of the purchases are for clients, so typically both the dealer and clients are at risk. Dealers can of course hedge by going short before the auction. One market participant asserted that the market is ‘overbanked’, with very high liquidity. He suggested that the likely further consolidation of European banks would lead to more concentration in the dealership system, and smaller (‘niche’) players would be forced out.
• In all government bond markets, price information is much more readily available
and price formation is much more centralised than in the corporate bond markets. There are perhaps 100 times as many corporate bonds outstanding as there are government bonds.
5.5 The commitment of capital by primary dealers and market
segmentation
• The key to the analysis of government debt markets is the commitment of capital by primary dealers. They take risk by making markets to other dealers and wholesale market players. The nature of the asset class – in particular, the size of government bond issues, requires that they apply significant capital. The direct return is low and may even be negative in auctions. So acting as a primary dealer is usually regarded as a loss-leader. The corresponding benefits arise from other activities for which primary dealer status confers an advantage: advisory fees, arranging syndications, securitisations, and privatisations. (In

32
contrast, there are no US syndications, no privatisations, no ‘domestic’ banks fighting to retain market share). Major banks also generally feel that they cannot afford to be absent from the government bond markets, which are so politically and economically important. Overall, few banks make significant profits in either the primary markets or the secondary markets (one of our interviewees estimated that the primary dealers lost an aggregate of €600 million on their primary market trading activities in 2005). The situation may be different in the UK gilt markets, where a recent study asserts that market making generates significant positive margins (Hansch and Saporta, 2005), although the gilt-edge market makers (GEMMs) are highly competitive.
• Auctions are typically cheaper for issuers than syndications. But the latter tend
to give wider distribution and raise the issuer’s profile (road shows, etc.). And smaller issuers might not be able to sell a large issue fully at auction.
• The B2B (interdealer) market was historically a brokered, intermediated market,
partly because anonymity lowers the risk involved. Recently it has become increasingly focused on electronic trading platforms. The B2C (‘institutional buy-side’) space was typically not intermediated. It is now shared between the request-for-quote (RFQ) model in intermediation systems (Trade Web, Bond Vision, Bloomberg) and direct client relationships. Distribution to institutional investors is often also a commitment required of primary dealers. The RFQ systems appear to have driven bid-offer spreads down – B2C spreads are now lower than B2B. There is consequently some effort to maintain market segmentation, but there is also some blurring of the B2B/B2C line: some platforms offer ‘all-to-all’, and smaller banks might be primary dealers in their local markets but clients sending RFQs in their non-core markets. Regarding transparency, Trade Web’s post-trade reporting depends on trade size: for trades less than € 10 million, data are shown in 15 minutes, larger trades in 60 minutes, all anonymous. Reports to regulators are end-of-day and aggregated.
5.6 Comparisons of euro area public debt markets with the United States Cash bonds The cost of government borrowing should in principle represent the benchmark cost of borrowing in the currency, so the rate yield represents interest rates. But with the fragmentation across issuers, different credit profiles, and different borrowing policies, interest rates are in fact dictated by other market curves. Liquidity is actually therefore less in the underlying physical market than in the exchange-traded futures and OTC swaps markets. Daily secondary market size is estimated at €30-35 billion, of which perhaps two-thirds is on electronic platforms and one-third is voice brokered. This compares with US Treasury B2B volumes of approximately $200 billion (€160 billion) daily – although eurozone outstanding public debt is somewhat greater than that of the US federal government. The dominant set of electronic platforms in the B2B space is the MTS Group, with well over 50% of the electronic market, although there are others with substantial activity (BrokerTec, eSpeed, the German Eurex Bonds, the Spanish Senaf, and the Greek HDAT). Recently, majority ownership of MTS has passed to a partnership between Euronext and Borsa Italiana. MTS has a special role, since the DMOs in several member states effectively sub-contract the task of setting and monitoring trading spreads to the relevant MTS platform. Dealers on those platforms are required to make

33
markets within set time and price parameters in order to retain membership and their primary dealer status. This MTS ‘Liquidity Pact’ is often regarded as ‘forced liquidity’, and some say that it exaggerates the true liquidity in the market. It should be noted, however, that when Citigroup placed many simultaneous sell orders on the MTS (and HDAT and Senaf) platforms on 2 August 2004, they found that they had substantially underestimated liquidity. Moreover, the MTS market also showed surprising resilience, insofar as quoting and prices reverted to ‘normal’ rather quickly after the shock. The voice-brokered market intermediates about half the volume of the electronic markets. The main market participants include: ICAP/Garban, Cantor Fitzgerald (now trading as BGC), Tradition Group (including Financor and Viel), and Tullet Prebon Group (part of Collins Stewart Tullet). One interviewee suggested that regulators prefer to see trading on exchanges, but that the OTC market is the source of innovation, so killing it off would be costly. Another said the OTC market is used by investors who need advice from dealers, with whom they develop relationships. Often, an investor reveals to a dealer the position it wishes to trade, and the dealer will then book the order. But the information eventually gets out – meanwhile, the OTC market provides a period during which a large position can be handled. Government bond futures The Eurex German government curve has become the benchmark against which dealers hedge their physical exposures, and price movements on the Eurex futures and corresponding MTS cash markets are highly correlated. The secondary market size in the wholesale futures segment is larger than that for the underlying. Since the contracts are euro-denominated, they can be used to hedge interest rates and exposures to any eurozone public debt. Total secondary market size is about €150 billion daily all-to-all (about €90 billion in the B2B space). By comparison, US Treasury futures volume averages $190 billion all-to-all. Interest rate swaps It is the euro interest rate swaps (IRS) market yield curve, however, that is the most accurate benchmark for euro interest rates. Secondary market size in the B2B space is around €130 billion daily, even larger than that in the futures market. By comparison, USD interest rate swaps trading amounts to only approximately $85 billion daily. Thus the eurozone and US markets show very different shares of cash and futures/swaps activity: €35 billion cash, €280 billion futures plus IRS; $200 billion cash, $275 billion futures plus IRS. This is because US Treasury yields represent a coherent underlying cost of borrowing and therefore USD interest rates. Euro interest rates are conversely generated in the B2B arena by the swap yield curve, perhaps partly because of the distortions introduced by the cash market obligations on dealers (and possibly by the ECB’s repo market policies, which tend to compress cross-country spreads [Buiter and Sibert, 2005]). The nearest comparison to GovPX is the relevant Reuters/Bloomberg euro swap page. This is a key point for the interpretation of pre-trade transparency. Transparency – in particular, the role of price data – has a clear, more limited meaning in terms of interest rates. In the euro government bond cash markets, however, the implication for the risk carried by the dealers is very different, since the prices of the physical bonds are affected by interest rates but not immediately and totally reflective of them. Price may fluctuate for a variety of reasons unrelated to fundamentals, increasing the vulnerability of all those showing a price. Pre-trade transparency in the US Treasury market is high, but it does not matter – trading is just based on the US interest rate curve.
34
Germany and the UK The systems in these countries are organised differently, with no obligations on primary dealers. Despite their loose primary dealer structures, no (or very wide) quoting requirements, and no official endorsement of an MTS platform, they show relatively large secondary market volumes. These two countries do of course each have special characteristics that help to explain their high turnover ratios. France is in some respects an intermediate case between these two and other euro-area countries. 5.7 Differences within and across MTS and US markets and platforms In general terms, all of the markets we analyze have become increasingly transparent in recent years, due to the increasing use of electronic trading platforms for B2B business and, to a lesser extent, the automation of request-for-quote trading in the B2C space. In the euro-denominated government bond market the increase in transparency has largely arisen as a result of the implementation of primary dealer systems and DMOs’ use of the MTS platform to monitor the primary dealers’ adherence to their obligations. As a result the platform has flourished, and liquidity for normal sized trades has been improved. According to our interviews with primary dealers, much of this improvement has been at the expense of the primary dealers, who have not always found the privileges bestowed by issuers to be profitable. As noted above, the MTS platform makes pre- and post-trade information available outside of the B2B space in real-time. MTS provides real-time quotes and the last transaction price in all of the benchmark bonds on the platform via Bloomberg and Reuters. In November 2004 the entire range of MTS data was made available in real-time through Traderforce©.15 Although MTS data are comprehensive and widely available at low incremental cost for professional investors, their availability does not imply that all parts of the euro-denominated markets are perfectly (or similarly) pre- and post-trade transparent. This is mainly due to the fact that the primary dealer system is not uniformly applied across the various countries. In its fullest form the primary dealer system involves privileges as well as obligations. The privileges are usually in the form of preferential access to primary auctions and managership of syndicated issues. Obligations apply in the form of maximum trading spreads and participation rates measured in terms of turnover percentages. Breuer (1999) provides an early analysis of the benefits of the primary dealer system incorporating both privileges and obligations. The increasing transparency of the MTS market may have improved some aspects of liquidity but may also have come at some cost. For countries that have fully adopted a primary dealer system that entails rewards for primary dealer performance, there has been a tendency for primary dealers to over-bid at primary auctions. This has been good for issuers in terms of lower yields but it has distorted yields around auction dates and has reduced participation in these auctions by non-rewarded participants. Secondary market obligations have at times also forced primary dealers to place large amounts of capital at risk in order to ensure adherence to their liquidity obligations. And for end-customers the cost of trading for larger than average sized trades may have been adversely affected by the introduction of the primary dealer system. 5.8 Implications for the empirical analysis This institutional background has implications for what we expect to find in the data. Our analysis below gives some indication of the dependence of issuers on the primary dealer system. We show that there is substantial variability across countries with regard to the amount of activity that takes place on MTS. Most of it, if not all, can be explained with
15 See the press release at www.mtsgroup.org/newcontent/news/d_new/2004_11_02.shtml
35
reference to the issuance techniques of the various issuers and their reliance on primary dealer obligations that extend to the secondary market. Where secondary market obligations are not imposed on primary dealers, we find much less activity on the transparent MTS market. Without secondary market obligations, our priors tell us that activity would drift to opaque trading venues. This is usually viewed negatively, because it fragments the market place, reduces the liquidity available in any one venue and of course reduces the transparency of the market for those not directly involved. It does have the advantage, however, that it allows for the build-up of trust between trading partners in their regular and repeated dealings. This reduces information asymmetry as well as mitigating the winner’s curse problem that is a feature of the coexistence of electronic request-for-quote B2C arrangement and a transparent B2B dealer platform with firm quotes. To be more specific about our priors, we now outline how the countries on MTS differ with respect to their issuance techniques and the secondary market obligations they impose. We regard Italy, Portugal, Austria, Belgium and Finland as extreme in their use of either syndicated issuance and/or the imposition of secondary market obligations on primary dealers. We regard France and Germany as outliers on the other end of the issuance spectrum. Germany is the most extreme, as it never issues by syndication and imposes no obligations on primary dealers. German spot market trading is also more likely to be conducted on the Eurex Bond trading platform where there is the possibility to trade simultaneously the related futures contract on the Eurex Exchange. Spain and Greece are special cases, because they do not impose secondary market obligations that are specific to the MTS platforms. The Dutch market is somewhere between the two ends of the issuance spectrum, since they do not often provide large benefits to primary dealers by way of syndicated issuance and do not impose secondary market obligations. In the Dutch case the lead runner in syndicated issues is often the debt management office itself (this has been referred to as Dutch Direct Auctions). These facts appear to explain many of our empirical findings for the European case. Additional insights come from an analysis of the US Treasury market. Here issuance is by auction, and while there is a primary dealer system, this does not extend to the imposition of secondary market obligations. In this sense it is much more like the German bond market, although it is far greater in size. Especially interesting in the US Treasury market is how the various alternative trading platforms compare and whether the comparisons can be related to differential transparency. The US Treasury market has already responded to transparency initiatives. The response has affected only the already very liquid part of that market, the on-the-run16 segment. The initial response to SEC and Treasury calls for more transparency in the late 1980s and early 1990s led to the GovPX initiative. Up until its steady decline, which began in 2000, this transparency initiative provided consolidated best bid and offer prices and quantity as well as latest transaction quantity, price and type from both OTC and individual inter-dealer broker trading platforms. All but one of the inter-dealer brokers took part at its inception. But more recently the number of contributing brokers declined until ICAP acquired the system in mid-2004 and became the sole contributor.
16 The term ‘on-the-run’ generally refers to the most recently issued bond in a maturity bracket. The on-the-run period is a period within which there is higher than normal trading activity due to the fact that the newly issued bonds are not yet held in inactive portfolios. This term is virtually synonymous with the term ‘benchmark’ in the context of the US Treasury market. In the context of the MTS platform the term ‘benchmark’ is a wider concept and it can include the three most recently issued bonds in a maturity bracket for a particular country not all of which are actively on-the-run.
36
Electronic trading was not a feature of the GovPX system, so it became largely redundant as an indicator for the on-the-run market over recent years, as eSpeed and BrokerTec have dominated the on-the-run space. It is difficult to gauge how much the GovPX initiative improved transparency because there is little information available regarding how well disseminated the information was across participants (or how timely was its distribution). We doubt that it ever achieved the level of transparency of either of the more recently developed platforms or MTS. We therefore expect to find transparency-related effects, such as a tendency for larger trades to be conducted on GovPX. We regard the eSpeed platform as the most transparent of the three US Treasury trading platforms. Its data are much more readily available to market participants and are in a much more user-friendly form than data from the other platforms. In September 2002, Cantor Market Data began to distribute a real-time data product that featured views of limit orders, trading stacks and last traded price for each of the five on-the-run UST Benchmarks. It also revealed whether bids and offers were made up from multiple buyers and sellers, single or multiple substantial orders or multiple small orders. Although this information was initially supplied only to Cantor customers, the coverage was extended in June 2003 to Reuters and in August of the following year to Bloomberg. The quality of presentation of the data has improved over time, and it is now combined with easy-to-interpret visual effects and related information from the futures markets. As discussed below, eSpeed provides good quality execution for standard sized trades, and this has attracted substantial buy-side participation via program-algorithmic trading. Although this market is very transparent, there is high level of activity. It could therefore be argued that this provides a ‘natural-veil’ effect that would counteract the liquidity reducing effects of transparency. An alternative view is that sophisticated participants now have the computing power and means to process the larger amounts of high quality information emitted from this busy platform on a real-time basis and that the transparency of the market is fully utilized. We expect that participants respond to the high level of transparency of this market by reducing trade size and increasing its frequency and randomness. The BrokerTec platform is not as transparent as eSpeed, but it has other qualities that attract activity. Its main advantage lies in providing trading integration with the relevant futures markets. It also allows for some negotiation regarding trade quantity (the ‘work-ups’). This means that larger trades can be done at potentially better prices and quicker than on eSpeed. The orderbook information is not as user friendly or as widely available as the eSpeed book information. We expect that the relative opacity of the BrokerTec platform will affect characteristics of the market such as activity relating to limit-order book changes in the seconds before buyer- or seller-initiated trades. BrokerTec and eSpeed provide markets for the on-the-run segment. The off-the-run segment is still largely OTC and quite opaque by most accounts, and we expect this to be reflected in the analysis of GovPX spreads and other execution quality characteristics. Given the size of issuance and the concentration of activity, we do not expect to find that the on-the-run US Treasury market suffers from as many of the transparency- related distortions as are evident in the MTS case. Although transparency has been increasing and the ability of market participants to analyze real-time data has increased, we do not expect to find major effects in response to the transparency event that we study. This market is so active and deep that the risk of obtaining bad execution is naturally low. In fact, however, we do find some evidence to suggest that execution quality can be threatened by the interaction between the B2B and the B2C markets. This is where the winner’s curse problem is evident, and it applies as much to MTS as it does to the US Treasury market. The winner’s curse arises because there are two rounds of trading
37
involving roughly the same participants. In the first round in the B2C segment of the market, buy-side customers request quotes from a number of dealers and pick the best quote. The second round involves only the dealers in the B2B segment. The dealer who won the first round tries to share the newly acquired inventory position with other dealers and finds it difficult because other dealers who were involved in the first round, have already responded with changes in limit-orders or market orders in an attempt to pre-empt the predictable action of the first round winner. Since the two US platforms for on-the-run issues differ in terms of their transparency we expect better execution quality for larger trades on the less transparent market (BrokerTec). GovPX should also be capable of providing opacity to larger trades in the on-the-run market. In off-the-run segment, GovPX has the advantage of both liquidity and opacity, and it should therefore provide better execution for larger trades there (the trading on this platform can still be regarded as being of the OTC/hybrid variety). However, since the ‘effective opacity’ of the US Treasury market could be due to network externalities (or the natural veil effect), we are open to the possibility that execution quality will be damaged by the lack of such externalities arising from the smaller amount of activity taking place in the off-the-run segment.

38
6. Empirical analysis
We investigate here the effects of cross-country differences and changes over time in the level of transparency in government bond markets. This empirical work is informed by our theoretical analysis, our assessment of the literature and many interviews with market participants. Few studies have tried to assess empirically the possible consequences for government bond markets of the level of transparency, the effects of primary dealer obligations and the issuance techniques chosen by government issuers. As we saw in our review of previous work, most theoretical and empirical work on the effects of transparency has been on equity markets and corporate/municipal bond markets. These markets differ in many ways from the government bond market. Gravelle (2000) and Martinez-Rezano (2005) identify some of the most obvious differences. For example, equity markets operate in the context of significant asymmetry in information regarding the actual cash flows arising from operations. This is not true of government bond markets. Another major difference is the fact that bonds have a finite life and are more likely to be held for the long run. The size of government issues also marks them out as different, and the consequent risk positions taken by dealers providing liquidity are usually greater than in equity markets. There is a significant difference that is not addressed by Gravelle and is particularly relevant to the European government market. It arises due to the relationship between the primary issuers and the primary dealers, who provide most of the liquidity in the secondary market (as well as distribution services in the primary market). Government bond issuers are monopsonistic demanders of liquidity services due to their very large issues and the frequency with which they roll over debt. Government issuers depend on primary dealers to take up large risky positions in primary auctions and require them to maintain a strong presence in a secondary market which is often illiquid. The dealers’ obligations are quite diffuse, sometimes across hundreds of bonds with very similar characteristics. Moreover, spreads in the secondary market are sufficiently tight that it is not very profitable, if at all. As we have noted, primary dealers accept these obligations in return for privileges such as access to recently issued stock at preferential prices, lead managership in syndications and even preferential status in the award of privatisation mandates. Changes in transparency in this market could have profound effects on the risks borne by dealers, and this in turn may adversely affect the complex relationship between government issuers and primary dealers. An insight into the fragility of this relationship is revealed by the delicate process of consultation that was undertaken by the UK Debt Management Office in 2000 in regard to fears of fragmentation in the UK gilt markets (Holland 2000, 2001). Theory also suggests that there can be an excessive degree of transparency: in the game-theoretic framework of Section 4 above, we find that complete transparency of the dealer-customer market makes the issuer unable to provide the required incentives to dealers, who may therefore simply withdraw from the market. Here we focus on the differences across issuers according to their management of issuance. There is an obvious difficulty in assessing the effects of regulatory initiatives that have not yet been put in place. As an alternative to experimental methods, our empirical analysis relies on statistical comparisons across existing government bond markets where differences in transparency, issuance techniques and other factors are well known. Our analysis covers most of the markets of the MTS inter-dealer space. We also rely on comparisons across maturities by benchmark status, and we compare the European experience with that of the US Treasury market, where recent
39
developments have led to the co-existence of three major competing trading platforms. To ensure the relevance of our analysis in a constantly changing environment, we have selected high quality data that are of very recent vintage for our cross-market, cross-sector and cross-benchmark-status analysis. We have supplemented our cross-sectional analyses with an analysis of developments over recent years and also with the examination of a ‘transparency event’ that took place in the US Treasury market in June 2003. This analysis assumes that MiFID, if applied to the bond markets, would bring about substantial homogeneity in the transparency of different trading networks that currently make up the market. We discuss the possible effects of the proposed increase of pre-trade transparency of order books to include the best three prices on either side of the book. We use the experience of the eSpeed transparency change in the US Treasury market to show that even small changes in the distribution of pre-trade information can have noticeable effects. We argue that this change could result in a reduction in pre-trade requests for quotes and therefore affect the information that dealers obtain from the B2C segment of the market. This raises the concern that implementation of MiFID in the government bond markets, while increasing the recycling of information between the B2B and B2C segments, could reduce the equilibrium amount of trading and limit-order provision in the market. In this case liquidity may decline and available best execution also. The alternative outcome is also possible, assuming transparency is not already at its optimal level. 6.1 Datasets The datasets that we have employed in this study are very large, and in some cases they possess very complex structures. We are fortunate to have access to detailed data for the limit-order book and transactions from the MTS trading platforms covering a number of years (we use selected months from 2003, 2004 and 2005) and almost all sectors of the euro-denominated government bond market. The ICMA Centre at Reading have been instrumental in compiling a very clean reconstruction of the time-stamped best three limit-order prices and quantities on an event change basis (except when this exceeds reasonable frequency and storage capacity in which case recording defaults to a second-by-second basis). Regardless of the dataset under consideration, we look only at the state of the orderbook immediately before each recorded transaction. Where we consider the pre-trade changes in the orderbook, these changes are usually in the few seconds before the trade. The transactions part of the MTS data provides time-stamped transactions records including price, quantity and a transaction initiation flag indicating whether the trade was aggressive on the buy or sell side of the market. The other datasets that we employ are from the US Treasury markets. The data we have obtained from Cantor Market Data contain only records relating to ‘on-the-run’ Treasuries. These eSpeed data come in two different forms. One form provides time-stamped records of transactions and covers an extended period starting in the late 1990s (we focus on the years from 2002 onwards). This also includes quantity traded and the identity of the aggressive side of each trade. We use this to provide an insight into trading costs, size of trade and volume over time. The second dataset from Cantor Market Data is an event-by-event dataset that contains the best six prices and quantities on each side of the eSpeed limit-orderbook at the times of all/any changes in market information. This is a more detailed dataset and is available only for selected months in the year starting October 2004. We use the first three prices and quantities on each side of the orderbook to compare with MTS and other data. We also use the period of overlap between the two Cantor datasets to check our conclusions based on the analysis of the transactions database alone (i.e., in the periods when the full orderbook data were unavailable).
40
The next dataset that we employ from the US Treasury market relates to the BrokerTec electronic platform for on-the-run US Treasuries. Only a small amount of these data was provided to us by the inter-dealer broking firm, ICAP. Specifically, we have event-by-event data from July 2003 and July 2004. We have used these data to reconstruct the state of the limit-order book immediately prior to about 60% of all trades that occurred on the platform in these two months. Once again we focus on the best three prices and quantities on each side of the limit-order book at each of the transaction times. We have been able to assess the overall incidence of trading and statistics on trade size, etc., based on all of the recorded transactions. We also acquired data from the GovPX trading information database that covers a significant proportion of inter-dealer trading activity in the ‘off-the-run’ category of the US Treasury market. As mentioned earlier, this dataset was developed in response to calls for increased transparency in the Treasury market in the early 1990s and has been in existence since mid-1992. A detailed description of this dataset as it was in the late 1990s and the first part of the year 2000 is provided by Fleming (2003). Until recently the GovPX dataset consolidated data from all of the main inter-dealer brokers except Cantor. Since mid-2004 it contains only information on ICAP quotes and trades, and this does not include ICAP’s BrokerTec business. As described by Fleming (2003), this dataset is not entirely reliable. The main problem is that it does not isolate different kinds of market events from each other in a clear enough manner (transactions, work-ups, changes to quotes, indicative prices and quantities and other events, some not shown on the database, all cause up-dating of the dataset, and this gives rise to an identification problem). Despite the presence of repetitions of records, we are confident that the measures we extract from the database are meaningful. Most important from our point of view is that this dataset reveals interesting information about the off-the-run and opaque parts of the US Treasury market. We employ this dataset only to obtain information about trading costs, transaction size and liquidity at the best bid and ask quotes (it does not give information about the limit-order book away from best prices). For these measures, the problem of the repetition of records is not serious, so long as such repetitions are evenly distributed. When we compare these measures with those of the other US Treasury markets they appear entirely plausible. 6.2 Empirical results In our empirical analysis we have opted to concentrate on simple (mainly non-parametric) descriptive statistics. As often as possible we present summary statistics in the form of Median, 1st and 3rd Quartiles. This ensures that our statistics are free from undue influence from extreme outliers and from the effects of obvious non-symmetry in the distributions of measures such as bid-ask spreads and the frequency or amounts of trade. We also use an analysis of the proportions of the joint occurrences of outlying observations/characteristics. This turns out to be particularly revealing in the analysis of ‘best-execution’. It is also useful in shedding light on the prevalence of a ‘winner’s curse’ problem in the B2B market, which we suggest may be worsening due to the increasing automation and transparency of B2C request-for-quote platforms. Similar results occur repeatedly across the different market characteristics, across the different ways we examine the issues, across the different countries, different market segments and different time periods that we analyse. We believe that the pattern of results carries more weight than any of the most significant individual results. We find a reassuring correspondence in our results with our priors and on what we have learnt from extensive interviews with market participants.
41
Our empirical evidence is presented and discussed below within five main categories. These are (1) an analysis of turnover relative to amounts issued, (2) an analysis of liquidity provision, (3) an analysis of execution quality, (4) an analysis of winner’s curse, and (5) an analysis of the transparency event on the eSpeed platform. The tables/figures associated with these categories are numbered from 1 to 5. In our discussions we provide an explanation of the empirical techniques used and an explanation of what they are designed to reveal. We also interpret the results and provide our conclusions. Turnover on MTS relative to outstanding issues The amounts outstanding of specific benchmark bonds by country together with the associated volume traded on MTS are presented in Tables A1.2 to A1.12. The amounts outstanding are taken from the MTS Handbook.17 Quite apart from the relative share of activity that takes place on electronic venues, transparency is likely to be a much more important factor when the overall size of the outstanding stock in active portfolios is small. In this respect Table A1.1 and the tables that follow also reveal that there is a very significant difference between the largest three issuers and all of the others in the euro-denominated government market. It is also the case that the largest of the euro-denominated government markets is much smaller than the US Treasury market in terms of both outstanding issues and turnover. We estimate that the monthly turnover of the 10-year US Treasury is about 18 times as great as the turnover in Italian benchmark bonds at the same maturity. In terms of trading frequency the difference is even greater, since US Treasury transaction sizes are on average much smaller (regardless of venue) than those on the MTS platform. In this respect we conclude that activity and the inventory positions of dealers are much easier to track in the European government market. We expect that the thinner ‘natural veil’ provided by the less crowded and less complex market place increases the sensitivity to transparency in the European context. Monthly volume traded on MTS for specific issues was derived from a summing up of all the relevant transactions recorded on the MTS database for the same month as the outstanding amounts were recorded. There is a wide variation in the percentage turnover on MTS, with the largest percentages occurring for Italy, Portugal, Belgium and Finland. The MTS turnover percentage is low for France and Germany, and the other countries are in the middle range. Greece is a special case since it has its own dedicated platform, HDAT, on which much of the remaining turnover occurs. Spanish volume is also divided between the MTS and Senaf platforms. Italy’s percentage is high. This is not surprising given that the MTS system originated from the efforts of the Italian Treasury to increase the liquidity of the Italian market. It is still the case that secondary market obligations of primary dealers in the Italian bond market are specific to the MTS platform and exceed most of those imposed elsewhere in Europe. The effects of the primary dealer obligations combine with the network externalities that stem from the large overall issuance of Italian government bonds to produce what is measurably the most liquid of the European government bond markets. We note from Table A1.13 that volume traded on MTS varies somewhat from month to month. For the benchmark Italian market the overall volume traded can vary to about 25% above its monthly average. The non-benchmark variability in volume traded is even greater with a maximal value of more than 40% above the annual monthly average. Even with this maximal amount of activity it is still a relatively small market when compared to the US Treasury market, and it is unlikely that this amount of activity provides a natural-veil effect to any great extent even occasionally.
17 MTS Group (2005), The European Government Bond Market: A Single Market with Unique Segments, Edition II.

42
Given its significant presence on the MTS system, we regard the Italian market as a close substitute for a natural experiment capable of revealing the effects of the MiFID proposals if OTC trading were forced onto transparent settings. Since Italian activity is generally concentrated on the MTS platform, it provides a special case from which to view this possibility. A post-MiFID environment would offer widely the high levels of pre- and post-trade transparency currently available in the Italian MTS.18 Consolidation might improve liquidity by way of a network externality. To assess whether this is a likely outcome from MiFID transparency requirements, we consider comparisons of the Italian turnover with that of the French and Portuguese. The outstanding amounts issued of individual Italian BTPs are roughly equal to the outstanding amounts issued of individual French BTANs and OATs. We estimate that MTS Trading volume in BTANs and OATs is roughly half the total trading volume associated with these issues. But even doubling the MTS trading volumes for any of the French issues given in Table A1.5 would still leave them much lower than trading volumes shown for Italian issues of similar size. This is tentative evidence implying that the ‘natural-veil’ effect raises liquidity in the Italian market more than proportionately. It should be stressed, however, that most of the MTS markets (excluding Germany, France and Spain) have individual issue sizes that are roughly half those of individual Italian issues, so they may never acquire significant network externalities. The Portuguese case is also interesting from this perspective. The secondary market obligations in Portugal are not very different from those in Italy, but Portuguese issues are much smaller than the Italian. Despite the small issue size the Portuguese turnover percentage is often much higher than the Italian (Table A1.11. shows this is true in two cases at the short maturity). It would be difficult to make a network externality argument that could explain this, and this therefore casts doubt on the conclusion in favour of the network externality drawn from the comparison between the French and Italian turnovers. The broad message that one can take from even a cursory view of the turnover percentages presented in Tables A1.1 to A1.12 is that these can be explained by the differential reliance on the imposition of secondary market obligations by certain issuers. Countries that rely more on syndicate issuance and the placing of secondary market obligations on primary dealers have higher turnover percentages on MTS. The variation in MTS turnover percentages cannot be explained by variation in the overall turnover percentages. We focus on just one example where the data are readily available and can be verified immediately. This is the case of France where the daily average turnover reported to AFT in the five most liquid OATs and the four most liquid BTANs was roughly 20 billion euro each (or 40 billion daily on average for liquid BTANs and OATs taken together).19 Table A1.5 shows the MTS trading volume for the month of June 2004 for the three most liquid OATs and the two most liquid BTANs. Assuming 20 trading days in the month, this implies an average daily turnover on MTS of about 4 billion euro. Although this is only a subset of the bonds for which total turnover is reported to AFT, it is still a very small fraction of that turnover. From this we tentatively assert that MTS turnover is likely to be less than half the total turnover in French governments. This leaves substantial opacity in the market and reduces the representativeness of the MTS prices and quotes relative to those available more
18 The Portuguese market is similar to the Italian in terms of the considerable obligations placed on the Primary Dealer to provide liquidity at both primary and secondary level, but it is much smaller in terms of issuance. In our empirical analysis, we use the characteristics of this market to gain additional insights. 19 See the monthly bulletin of the Agence France Trésor at www.aft.gouv.fr/IMG/pdf/169en.pdf

43
generally in the market place. It also reduces available liquidity on MTS, as we suggest below. Our theoretical model leads us to expect differences in market characteristics across euro-denominated government markets in relation to the extent to which smaller issuers rely on syndications of their issues and the degree to which they depend on primary dealers for provision of secondary market liquidity. While the Italian market has high turnover on MTS, other interesting cases in terms of MTS turnover are the Portuguese, Belgian and Finnish markets. Their main common feature is their high dependence on syndicated issuance (Portugal 40%, Belgium 40% and Finland no less than 90%).20 With relatively small issue sizes, these markets manage to attract a large proportion of total trading activity to the transparent MTS market, but much of this is related to the obligations placed upon primary dealers who are keen to participate in primary issuance. In the Portuguese case primary dealers must also be involved in at least 2% of the secondary market turnover in specific benchmark issues. Similarly, Finnish and Belgian issuers rely on a primary dealer system to ensure secondary market liquidity. Participation in the secondary market is a factor used in selection of lead distributors. In the case of Germany, there is no reliance on a primary dealer system and also no syndicated issues. As expected, this affects the willingness of dealers to participate in the transparent secondary market. This is reflected in the relatively small proportion of trade in German issues occurring on the MTS trading platform (Table A1.6). But much of the trading in German benchmarks takes place on the Eurex Bond trading platform which is just as transparent as the MTS. The average monthly volume in all German Government bonds on Eurex Bonds for 2004 is 8,048 million euro.21 The same average volume traded in the MTS case is presented in Table A1.13 Panel A. This shows a monthly average volume on the MTS for German Benchmarks as 11,506 million euro. Even if these two volumes are combined we estimate that they still only represent about 6% of the value of German benchmarks outstanding. Thus it is likely that a significant proportion of trading in German government bonds remains OTC. This is tentative evidence that Germany relies on an opaque secondary market to ensure that primary dealers are prepared to provide liquidity at auctions. It is plausible that MiFID transparency proposals if implemented would drive German issuance policy towards the type of approach taken by many of the smaller issuers. The same conclusion can be drawn for France, where there is very little syndication and where primary dealers are not required to participate in the secondary market. Here again, activity on MTS is very low (see Table A1.5). For markets in which syndication and secondary market obligation are prevalent, it appears that more transparency can be obtained only by distorting other market characteristics. The obligations placed on primary dealers act as a disciplining device that effectively substitutes for the benefits that primary dealers would normally obtain under less transparent settings (or in markets where sufficient activity provides ‘natural-veil’ type network externalities). The analysis of the share of turnover on MTS makes it clear that it relates directly to secondary market obligations or to the reliance of the relevant issuer on the syndication approach to issuance. When these factors are absent, as in the German case, MTS is not the chosen venue for activity, and the issuer has not opted to encourage a move of activity to the transparent venue. The benefits that accrue to the German issuer from allowing its bonds to be traded in a more opaque setting are obtained by way of a less 20 Source, Presentation by Lars Boman, Nov 2003, Swedish National Debt Office; www.oecd.org/dataoecd/59/4/29172097.pdf This presentation also highlights some of the disadvantages of the syndicated issuance approach. 21 The volume information from the Eurex Bond market can be found at; www.eurex-bonds.com/public/download/marketdata_20060403_1_en.pdf

44
distorted primary auction system. This in turn probably helps the German market to maintain a privileged position as a European benchmark. Although opacity may be associated with less liquidity and a liquidity premium, this does not appear to have affected German governments greatly. Much the same conclusions apply to the French case. These conclusions are broadly supported by the analysis of other market-quality related analysis, to which we now turn. An analysis of liquidity Tables A2.1 to A2.4 provide results from the analysis of five liquidity-related variables for the MTS and US trading platforms by maturity and benchmark status. The variables calculated are the effective spread, the steepness of the orderbook, the trade size, the liquidity available at the best bid and ask quotes and the liquidity available in the best three quotes. Details of exactly how these measures are derived are provided in the notes accompanying the tables. In each case the median is provided along with the 1st and 3rd quartiles. Another liquidity measure that is not calculated here is the speed with which limit order quantities are replenished. In the case of the MTS platform this is usually instantaneous because of the use of hidden ‘block-quantities’ that feed automatically into the visible ‘drip-quantity’ as soon as existing limit order is hit or taken. A slow speed of replenishment would be expected to show up in various ways in the other liquidity measures that we present, however, so we do not specifically consider this attribute separately. The effective spreads rise with term to maturity. Effective spreads are not necessarily higher for the non-benchmark issues at each maturity, as one might expect. This can be explained by the fact that off-the-run issues will have moved closer to their redemption date and will therefore have shorter terms to maturity, than those that have been recently issued. This is particularly relevant at the short maturity where the off-the-runs are quite close to redemption. For this reason, comparisons between benchmarks and their non-benchmark counterparts are not always valid. It is also advisable not to read too much into small differences in effective spreads even within benchmark categories as this could be explained by differences in term to maturity. Notwithstanding these reservations, there are some quite large differences that are unlikely to be explained by maturity differences. Consider the results for the short maturity benchmarks presented in Table A2.1. Panel A. It is interesting that all of the MTS country-related effective spreads are zero at the first quartile. For the Italian and Spanish markets there is a zero effective cost of trading for up to 50% of all trades at this maturity. The Netherlands, France and Germany all have slightly higher median effective spreads than other countries. This is broadly supportive of the view that these countries have less reliance on the MTS system and that best execution is regularly found on alternative trading venues. This view is further supported by the relatively small effective spread and plentiful liquidity found for the Finnish market in which issue size is seldom much greater than the minimum required. This can therefore be explained by the high dependence of Finland on the syndicated issuance approach and how this affects primary dealer participation on the transparent MTS. Recall that roughly 90% of issuance is through syndication in the Finnish case, and primary dealers who are eager to get a large proportion of this business are likely to be active participants of the secondary market so that they can obtain favourable treatment at primary issuance. There is little doubt that median effective spreads in the US Treasury market are significantly below those available on MTS. This can probably be explained by the relatively small size of issuance, the fragmented nature of the euro-denominated markets, and the fact that there are fewer primary dealers providing liquidity across a

45
larger number of issues in these fragmented markets. In addition, the ability to hedge inventory positions is easier in the US Treasury market due to the high correlation between the cash and futures products. In the European context, smaller issuers frequently experience variability in their yields relating to risk assessments, and this causes them to be less correlated with the related futures market product. Most small-country government bond inventory positions are hedged using the German futures contract or a very liquid Italian bond, and these are not perfect hedges. Under all these circumstances, it would be surprising if European government effective spreads were as low as those in the US Treasury market. There are interesting differences between the three US platforms. The most transparent and most liquid platform (eSpeed) has low effective spreads at the median and 1st quartile but not at the 3rd quartile. This is consistent with the view that a transparent setting will not provide small effective spreads for larger than usual trade size. By contrast, the BrokerTec platform provides a very stable effective spread which is roughly three quarters of a basis point for at least 75% of trades. Surprisingly, the GovPX effective spread is only marginally different from that which is available on the other two platforms (despite its minor share of the on-the-run market). At the short maturity the comparison of orderbook steepness in conjunction with the liquidity variables reveals some interesting facts. The Netherlands appears to have a book with lower than average median steepness but also less overall available liquidity. Steepness on the MTS compares very well with that on the very liquid eSpeed system in the US. But this should be viewed in the knowledge that the available liquidity in the slightly steeper eSpeed orderbook is usually more than twice as great as that on any individual MTS market. BrokerTec also provides a market in which the orderbook is less steep than on eSpeed but it also has about one-fifth the available liquidity. Smaller trades (5 million euro/US dollar) are more likely on the Italian market as well as on all of the US Treasury platforms. This is consistent with the increased splitting-up of large orders in more transparent and consolidated markets and also the use of algorithmic automated trade execution in the case of the US Treasury market. GovPX and eSpeed both have larger than average 3rd quartile trade size, but we note that the 3rd quartile effective spread is much greater on eSpeed than on GovPX or BrokerTec. It must be the case that eSpeed is sometimes the choice of venue for large trades when the impact of such trades is visible (i.e., the trader knows in advance how far up the orderbook the trade will go; this is likely to be when there is more visible depth and when there is uncertainty as to what price impact will occur on other venues). In the case of GovPX, the incidence of large trade size at the 3rd quartile can be explained by the frequency with which traders negotiate ‘work-ups’ and the fact that these work-ups are afforded a significant degree of opacity. It may be the case that this is occurring when visible depth is lower than average on eSpeed, but this is something we have not explored. Liquidity at the best quotes and the liquidity available in the best three quotes provide a broadly similar picture of the cross-country MTS landscape. Specifically, German, French and Dutch liquidity provision is lower than elsewhere and, at least in the cases of France and Germany, this reflects the lack of primary dealer obligations relating to secondary market participation on MTS. Liquidity on US Treasury markets is characterised by a significantly deeper situation on the eSpeed platform than on BrokerTec. Panel B of Table A2.1 contains similar measures for the non-benchmark segment of the short maturity market. These measures provide a picture similar to that just discussed for the benchmark segment. The most significant points of interest include (i) a relatively small trade size in the market for Italian issues (only 2.5 million euro for the entire interquartile range), (ii) the Spanish MTS market has a large effective spread that might

46
indicate that the Senaf is where best execution occurs, and (iii) the GovPX effective spread is significantly smaller than the equivalent spread in the benchmark segment of the same market. The smaller GovPX spread in the non-benchmark segment of the US Treasury market is unlikely to be due to term-to-maturity differences. It is also clear from the liquidity characteristics that the non-benchmark Treasury market is less liquid than the benchmark segment, so this is also not an explanation for the effective spread difference. The only plausible explanation is the relatively opaque nature of the GovPX market. The results just discussed for the short maturity are largely repeated for the other maturities. It is nevertheless worth mentioning the main findings from these maturities. The medium maturity benchmark case is given in Table A2.2, Panel A. We note that the effective spreads do not vary much across the MTS markets. The effective spreads available in the US Treasury market at this maturity are much lower than in the MTS market. The German and Dutch total liquidity provision is lower than elsewhere. The Finnish market once again has a surprisingly low effective spread and unusually good liquidity for a small issuer (we find later that this is not the case for larger trades). In the medium non-benchmark case shown in Table A2.2 Panel B, the effective spread and steepness of the order book are relatively high for Germany and France, and total liquidity is relatively low. Trade size is relatively small for Italy and for the US markets. The long maturity results in Table A2.3 give rise to a similar set of conclusions, but in this case the US-European comparison is of particular interest. For the long benchmarks in Panel A we observe a large median French effective spread, and total liquidity is reliably smaller for both the French and German cases when compared with other European countries. The Finnish and Italian markets have low effective spreads, and liquidity is unusually large for the Finnish case given its issuance size. It is plausible that the Finnish evidence is related to how far primary dealers go in competing to obtain syndication business. For Finland there is a large amount of this type of issuance so the pot is bigger, and this is likely to result in more aggressive competition among primary dealers in their secondary market liquidity provision. We find later that despite the liquidity (measured as quantity available on the order book), the Finnish market has a steep orderbook around large trades so that the price for accessing this liquidity is sometimes high. On the US Treasury market BrokerTec provides better effective spreads than the other two platforms and smaller median and 3rd quartile effective spreads than available on MTS. The eSpeed platform is surprisingly poor at this maturity and is generally not as high quality as the various MTS markets. The MTS platform also looks good in terms of orderbook steepness. The MTS country-specific orderbooks are flatter than both the eSpeed and BrokerTec orderbooks. Total liquidity provision is also better on MTS, but trade size might explain the need for this. Trade size is much smaller in the US Treasury market, which is likely to be related either to algorithmic trading or to the practice of breaking up large trades so as to hide positions in an excessively transparent market. The long maturity non-benchmark results are not comprehensive enough in their country coverage to permit definitive conclusions. It is worth mentioning, however, that Italian and US trade size are again smaller than elsewhere, which is what would be expected in transparent markets. The results for the very long maturity benchmarks in Panel A of Table 2.4 once again show that German and Dutch effective spreads are high. In this maturity bracket there is not as much support for earlier findings, but this is probably due to the overall illiquidity of this segment. Total liquidity provision is much smaller for all countries at this maturity. Trade size is generally smaller for the MTS platforms than at other maturities, but it is relatively high in terms of the liquidity available at best quotes. While the US Treasury
47
market is just as illiquid as the MTS platforms at this maturity, the effective spreads are much lower there. The non-benchmark measures presented in Panel B of the same table show relatively small effective spreads in the Italian market and otherwise provide no clear-cut conclusions. In summary, the analysis of effective spreads, trade size and liquidity provision above is broadly what would have been expected in the light of theory and the facts about issuance approaches and primary dealer obligations. We can summarise the findings as follows. Where transparency is very high, trade size tends to fall. We found this for Italy and the two electronic trading spaces in the US Treasury market. Where primary dealer obligations are greatest or where syndicated issuance is used heavily, we see better participation/liquidity provision on MTS and artificially small effective spreads. We found this for Finland and Italy. We found that MTS was not very liquid, however, for the Netherlands, Germany and France where issuance is seldom or never by syndication and where no obligations are imposed on primary dealers to participate in MTS. In the US effective spreads are generally smaller than on MTS, but the long benchmark case shows a surprisingly competitive MTS. Execution quality In Tables A3.1 to A3.3 we present an analysis of execution quality just for the benchmark issues at the short, medium and long maturities (primary dealer obligations usually apply to the benchmarks). This is an extended analysis of the liquidity conditions in the market surrounding trades that had poor execution quality as measured by the effective spread (specifically, transactions that were executed at prices that reflect an effective spread in the highest quartile by size are defined as having achieved poor execution quality).22 We analyze how trade size interacts with execution quality defined this way. We also examine what proportion of poorly executed trades coincide with low liquidity at the best quotes and with a steep orderbook. These proportions vary quite a lot across the different countries and trading platforms. Cross-market comparisons give insights into the effects of issuance technique, primary dealer obligations and other transparency considerations and confirm much of the evidence already discernible from the liquidity measures themselves. At the short maturity shown in Table A3.1, we note that poor execution quality measured by effective spread is not always strongly associated with large trade size when these attributes are defined in relation to their own country/platform distributions. To interpret the statistics presented in this table, it is necessary to recall the size of the 3rd quartiles for the effective spread associated with each country/platform and for the other attribute that is being considered. For example, the GovPX market has a very high proportion of trades that are defined as both poorly executed and large in size. But the effective spread at the 3rd quartile for this market was quite low and was the same as the median and 1st quartile (Table A2.1 shows it to be 0.79), so this result is not very surprising. In other words, what is defined as poor execution quality for this market may not be very different from the execution quality obtained at the median or even the 1st quartile, since the effective spread may be the same for each of these quartiles. Although this makes cross-country comparisons difficult, it is usually possible to compare each result with at least one other country or platform for which the liquidity conditions are similar. For example, the BrokerTec effective spread at the 3rd quartile is roughly equal to that of GovPX, yet it has far fewer large trades that obtain poor execution quality. Once again, however, caution is required, since the trade size quartiles are not equal. Table A2.1 shows that the 3rd quartile trade size on GovPX is 22 This is merely for expositional purposes and is a much narrower definition than is used in the MiFID debate where other factors such as the time taken to achieve the trade are included.
48
twice as large as that on BrokerTec. Trades defined as large on GovPX are therefore much larger than those defined as large on BrokerTec. If size and poor execution quality are related then the much larger trades on GovPX will naturally have a greater likelihood of obtaining poor execution quality and this would explain the high proportion of trades being classified in the poor-execution/high-size category for this platform relative to what is found on BrokerTec. This result is interesting because it implies that there are traders willing to accept poor execution quality for a significant proportion of their large trades on the GovPX platform despite the existence of alternative platforms in competition. This must imply that those alternative venues are deliberately not chosen for such trades. This is consistent with the view that these large trades are conducted on GovPX because of its opacity. Fortunately for most of the countries on MTS, the size, steepness and liquidity profiles are sufficiently similar that the analysis of the proportions of trades combining poor execution quality with either large size, low liquidity or high steepness are quite valid, so long as a little caution is exercised. As shown in Table A2.1, Panel A, the MTS markets all have reasonably similar 3rd quartile effective spreads (just below 2 basis points). Apart from Italy they also all have similar trade size attributes (10 million at both median and 3rd quartile). In Table A3.1, however, the proportion of trades combining large size and poor execution quality differs a lot across countries. Poor execution quality seems to be most severe for large trades in the cases of the smallest issuers (Finland and Austria). The Italian proportion is also quite high, given that large trade size is defined as trades greater than only 5 million euro (thus a relatively large proportion of quite small trades experience bad execution quality in the case of the Italian market). Thus despite the appearance of small effective spreads and plenty of liquidity, these markets do not provide good quality service for larger trade size. Another interpretation is that larger trades cannot easily be done elsewhere for these countries, and this gives rise to a larger proportion in this category. In the second column of Table A3.1, we analyse the coincidence of poor execution quality and low liquidity at the best quotes. The most common proportion of trades with both poor quality execution and low liquidity is roughly between 7 and 9 percent. The outliers are therefore Finland and Italy where the proportions are much lower. This is consistent with the argument that primary dealer obligations are binding on these markets. Dealers are quoting reasonable size, but the effective spread is not always matching the appearance of high liquidity. In the final column of the table the proportion of poor quality execution when the orderbook is steep is large for all of the usual suspects (Austria, Finland, Greece and Italy) and smallest for Germany, France and the Netherlands where primary dealer obligations are least binding and larger trades can be done by less transparent means. On the US Treasury market, the eSpeed platform appears to have a very low proportion of trades combining low quality execution with low liquidity on the order book. This is probably because the order book is so transparent on eSpeed. As mentioned earlier, this is to be expected where the liquidity available is visible. Traders will usually go to the less transparent venue to conduct larger trades when liquidity is visibly low on the transparent venue. This comment also applies to visible steepness. BrokerTec has no trades of low quality associated with the very steepest order book conditions. This probably just reflects the fact that traders can move to other platforms when conditions are bad for trading on BrokerTec. Similar conclusions arise from the results for the other maturities. At the medium maturity shown in Table A3.2, we note that poor execution quality for large trade size occurs more frequently in the Finnish, Spanish and Belgian markets. Although the Italian proportion is not as large as might have been expected, the French proportion is very low, and this is what one would have expected given earlier arguments. The GovPX result is very similar to what occurred in the short maturity results, and this is

49
already interpreted in the discussion of those results. The results on the joint occurrence of low execution quality and low liquidity at best do not give any clear-cut conclusions for this maturity. But the results for poor execution quality and high steepness generally confirm earlier results (apart from the German results, which are not what one would have expected). Specifically, there is a high proportion of trades experiencing low execution quality when the orderbook is unusually steep for Austria, Greece and Italy. The long maturity results are also a bit inconclusive, but we take some comfort from the fact that the largest outlier in column 1 of Table A3.3, is for Spain while the smallest proportion occurs for Germany. In the case of poor execution quality with low liquidity at best quotes (column two of Table A3.3), Austria, Finland and Portugal are all outliers with small proportions of trades in this category. Italy is also a severe outlier in the last column where poor execution quality and high steepness of the orderbook coincide for 16% of trades. We doubt whether such trades would have been conducted on this transparent venue if there had been less transparent venues available. The next largest proportions in the last column are for Finland and Greece respectively while France, Germany and the Netherlands are all on the other end of the scale. In summary, although there are some exceptions, the body of evidence compiled here gives a consistent and convincing picture of how market characteristics are distributed across markets. This distribution seems related to the size of the issuer, the issuance techniques and the obligations that are imposed on primary dealers. On the MTS platform poor execution quality for large trades is more prominent for countries that impose primary dealer obligations. While this system gives rise to good liquidity provision and execution quality for normal sized trades it does not do so well for larger trades. This seems to be explained by greater steepness in the orderbook for these countries around the occurrence of large trades. Thus while primary dealers must abide by maximum spread obligations they seem to combine this with the setting of far less favourable limit prices away from the best prices. This steepens the limit-order book and this sometimes affects the execution quality of large trades. The US Treasury market results can be explained by the differential design of the three platforms. Opacity (and immediacy) is sometimes chosen for the larger trades and a higher cost of trading is accepted. Recall from Table A2.3 that the 3rd quartile GovPX effective spread is nearly three times as great as the eSpeed spread and this is the largest effective spread across all the markets shown in the table. Thus execution quality is quite poor on this platform, yet it remains the choice of trading venue for the majority of the largest trades in the US Treasury market. We conclude that this is due to the relative opacity of GovPX. It is probable that, in the US case, poor execution quality as measured by the effective spread is chosen by agents who are seeking immediacy for large trades that they fear would cause too great a price-impact if they were executed on the more transparent settings over an extended period of time as a number of smaller trades. The winner’s curse Tables A4.1 to A4.3 show the relationship between seller- or buyer-initiated trading and the changes in the available liquidity on the limit-order book immediately prior to the trades. It is important to note that what is being examined here is the change in quantity available at the best quotes assuming no quote-price change in the few seconds before trades (not the liquidity change in the entire period since the last trade). We believe this activity has something to do with a ‘winner’s curse’ problem that arises when the inter-dealer participants are aware of large imminent or recent transactions in the B2C market. Specifically, when a number of dealers are involved in providing quotes to buy-side participants through a request-for-quote system, the winner is immediately at a

50
disadvantage because he knows that he gave the best quote, other dealers were not prepared to give such good quotes, and other dealers now know that some dealer has acquired a position that he will want to share in the inter-dealer market. If a dealer wants to pre-empt the effects of B2C activity, he may lodge a limit-order as soon as a request for quote is received on the B2C platform. This would be a good strategy whether or not he expects to win the B2B business. If he does win the buy-side business, then he has already begun a strategy to off-set the effects of the trade on his newly acquired inventory position. If he does not get the trade, then he is effectively pre-empting the trade that may occur as a result of the B2C activity. Alternatively, a dealer may regard a limit order quantity change as indicative of a desire to trade resulting from B2C activity and on the basis of this place a market order for immediate execution. If a dealer were providing a quote to a customer who was regarded as well-informed and if the dealer did not win the trade, he may want to place a market order to reflect the limit-order information. There are probably a dozen other ways to describe the possible responses of traders in the B2B space, relating to activity they observe in the B2C. All of these scenarios involve some pre-emptive action or immediate reaction in the B2B platform. It is this pre-emptive action and almost instant reaction that we are interested in discovering and analyzing in Tables A4.1-A4.3. Each table has two panels. Panel A refers to seller initiated trades while Panel B refers to buyer-initiated trades. We consider only benchmark issues at the short, medium and long maturities. We observe the imbalance in the proportions of rises in liquidity at the best quotes on each side of the market just prior to trades of different type. The second and third columns show the proportion of trades for which there are increases in quantity available at the best bid and offer. If dealers in the B2B segment do react to information arising from activity in the B2C segment, then we would expect to find more rises on the ask side than on the bid (and the opposite for buyer-initiated trades). For seller-initiated trades, the last two columns consider the possibility that increases in the ask quantity predict the return that follows (where returns are defined as transaction-to-transaction returns using mid-quote price changes). The same two columns for the buyer-initiated trades consider whether a rise in bid quantity is reflected in returns. We would expect to see more positive than negative returns following rises in bid quantity and the opposite for rises in ask quantity if limit-orders are informative. Broadly speaking, we find evidence that that some limit orders are informative. We also find evidence that there is a winner’s curse. This appears in some countries more than others. Consider the short maturity benchmark case for seller-initiated trades which is depicted in Table A4.1, Panel A. We begin with the last two columns and note that in the majority of cases, rises in ask-size (preceding a seller-initiated trade) precede negative returns more often than they precede positive returns. This implies the presence of information in the limit orders (and also information in the seller-initiated trades that followed these limit-order changes). Although this conclusion is based on a small percentage of trades in total, it is nevertheless consistent with priors and we find no instances where there is an imbalance in the other direction.23 Some countries have a large imbalance, but given the number of observations involved we are unable to find many examples where the cross-country differences are statistically significant.
23 The usual approach taken in the microstructure literature defines order-flow as the difference between buyer-initiated and seller-initiated trades aggregated over some fixed time-intervals. This variable is usually highly significant in explaining market movements as well as individual equity returns (see Dunne, Moore and Hau 2006 for a recent example at the equity market-wide level). Given trades of a particular initiation-type, we find evidence that the configuration of limit orders sometimes changes advantageously in advance of these trades implying some advance knowledge of trade type. We regard this as likely to be arising from the interaction between the B2B and B2C segments of the market. We did not find significant effects running from order-flow to yield changes more generally.

51
The evidence of a winner’s curse is provided in the second and third columns. We expected seller-initiated trades to have been preceded more often by a rise in the ask size than a rise in the bid size and this occurs in most cases (8 out of 12). In Panel B, the same analysis for buyer-initiated trades shows again that for a large majority of cases, positive returns are more likely after a rise in bid quantity. We expect a rise in bid size to be more prevalent before buyer-initiated trades, and this is also true (9 out of 12 cases, of which 6 are statistically significant). Table A4.2 substantially confirms these results for the medium maturity benchmarks. In most cases (8 out of 11), rises in ask size are followed by negative returns more often than by positive returns. Ask size is much more likely to rise than bid size before seller initiated trades (8 out of 11). Bid size, rather than ask size, is more likely to rise before buyer-initiated trades (7 out of 11). At the long maturity, Table A4.3 shows very little evidence of informed trading. Here the percentage of trades preceding return changes is very low, and there is very slight imbalance between the occurrences of returns of different sign. For seller-initiated trades we also do not find much evidence of a winner’s curse or pre-emptive positioning in the orderbook. For buyer-initiated trades, there is some more evidence that a rise in bid size is more prevalent before a buy transaction (7 out of 11, with 4 statistically significant differences). We therefore find some evidence of a winner’s curse problem in the government bond markets in both Europe and the US. This is not at all surprising, since the B2C market has been becoming more transparent over time and internalization of order flow has probably been declining. We do not have strong evidence to show that these problems are more apparent in some markets than others, but we would suspect that they are more prevalent in markets that are more transparent and less fragmented. The winner’s curse problem is likely to worsen over time if the B2B and B2C markets become more transparent and if trading is increasingly centralised on a single platform. A transparency event The transparency event that we now consider occurred on 13 June 2003 in the context of the US Treasury market. Detailed limit-order book information from Cantor Market Data became visible on Reuters to a much wider audience than previously at or soon after this date.24 Although this can be considered an increase in pre-trade transparency, it is an event that affected only the buy-side participants directly and may have had indirect effects on how dealers priced in the B2C segment. We believe that this transparency change is similar to one of the MiFID proposals regarding the visibility of the order book, and since it took place on a government bond market it is likely to give insights into what could happen on European government markets if the MiFID transparency initiative were to be applied there. Unfortunately we do not have the full limit-order book database covering this period (it is supplied only in an historical database covering a period starting in October 2004). We do however have detailed transactions data for this period, and we are able to calculate effective spreads, the incidence of transactions being conducted, and the sizes of these transactions. From this we can infer some of the effects of the transparency event. If order book data had been available it would have been possible to examine a number of important issues: whether transparency affects liquidity available at best, whether there is an increase in willingness to exceed trade size that remains equal to or below available best size, whether there is a reduction in execution risk, whether there is a rise in the cost of doing larger than average sized trades, and whether the quoted spread changes at the best prices. 24 The details of this event are available at www.espeed.com/articles/cmd20030613.html
52
Since we do not possess the data to assess this we refer the reader to recent findings for a similar event that took place in the Sydney Futures Exchange. This has been studied by Bortoli, Frino, Jarnecic and Johnstone (2006). The change that occurred there was a move from disclosure of liquidity available at the best quote prices to disclosure of depth at the best three quote prices on each side of the book. These authors provide a theoretical model based on execution risk to motivate their empirical approach, and they find that the transparency initiative caused a decline in liquidity at the best quotes, no significant change in the effective spread and a rise in the proportion of market orders exceeding depth at the best quotes. This amounted to a fall in execution risk because more liquidity was observable and its price was calculable pre-trade. However, the reduced execution risk was achieved at a cost. This arose because liquidity at best declined. The Bortoli et al. (2006) approach is more appropriate to a situation where transparency within the interdealer segment itself changes, so it is not entirely applicable to the transparency event considered here. In the case of the eSpeed initiative, the interdealer part of the market was already pre-trade transparent for the participants of that segment of the market. To analyze the effects of an increase in transparency that disseminates inter-dealer information to buy-side participants we must consider changes in behaviour on the buy-side of the market that will have some knock-on effect in the inter-dealer space. The main effect of this nature that is most likely to occur following an increase in transparency of inter-dealer limit order prices is that buy-side participants would request quotes from fewer dealers when preparing to trade than they did before the increase in transparency. This is simply because they possess more information about what the quotes should look like and can make trading decisions without actually requesting as much pre-trade information as before. This of course affects the amount of information available to dealers about possible buy-side trading wishes, and it also affects the ability to act on such information. Indeed it could reduce the winner’s curse problem. A reduction in the winner’s curse problem will likely lead to a greater preparedness by dealers to quote narrower spreads. Conversely, however, a reduction in the ability to make profits from buy-side order flow information would be expected to raise risks for dealers and also their trading profits and therefore also the bid-ask spreads that they are willing to quote (this of course depends on competition within the inter-dealer market). Despite the lack of detailed information about the orderbook and spreads we attempt an analysis of the eSpeed transparency event using transactions data alone. We estimate an effective spread based on the difference in prices obtained for buyer-initiated transactions and seller-initiated transactions that were in close proximity by time (specifically, we use the closest trades of either type so long as they are no more than one minute apart – most of these are fleeting moments apart). We examine the time profile of the third quartile of this effective spread measure. We also examined trade size, trading volume and frequency, but we did not find significant effects surrounding the event, and therefore we do not present any analysis of these variables in what follows.

53
Figure 1 eSpeed: 5 year UST Benchmark Effective Spread 3rd Quartile25
0
0.5
1
1.5
2
2.5
3
3.501
/04/
2002
01/0
6/20
02
01/0
8/20
02
01/1
0/20
02
01/1
2/20
02
01/0
2/20
03
01/0
4/20
03
01/0
6/20
03
01/0
8/20
03
01/1
0/20
03
01/1
2/20
03
01/0
2/20
04
01/0
4/20
04
01/0
6/20
04
01/0
8/20
04
01/1
0/20
04
01/1
2/20
04
01/0
2/20
05
01/0
4/20
05
01/0
6/20
05
01/0
8/20
05
Figure 2 eSpeed: 10 year UST Benchmark Effective Spread 3rd Quartile26
0
1
2
3
4
5
6
7
01/0
4/20
02
01/0
6/20
02
01/0
8/20
02
01/1
0/20
02
01/1
2/20
02
01/0
2/20
03
01/0
4/20
03
01/0
6/20
03
01/0
8/20
03
01/1
0/20
03
01/1
2/20
03
01/0
2/20
04
01/0
4/20
04
01/0
6/20
04
01/0
8/20
04
01/1
0/20
04
01/1
2/20
04
01/0
2/20
05
01/0
4/20
05
01/0
6/20
05
01/0
8/20
05
25 The 3rd quartile effective spread is based on transactions that are no more than one minute apart and usually only a few seconds apart. Pre-transaction quotes were not available so the last seller- and buyer-initiated transactions in each minute were used to estimate the effective spread. The daily 3rd quartile of this is plotted for each EST day between 9.00am and 5.30pm. All trading days for 2003 are included but for years 2002, 2004 and 2005 we only show the daily 3rd quartile within the months of April, June and August. The event of interest occurred on 13 June 2003 and it is noticeable that this is soon followed by a larger 3rd quartile spread. 26 The notes for figure 5.1 also apply to this table.

54
Figures 1 and 2 show the time profile of daily 3rd quartile effective spreads for the 5 and 10 year maturities for a period which starts in April 2002 and runs through to August 2005. Only the months of April, June and August are available for years other than 2003, where the full year was available. The transparency initiative took place in June 2003, but most buy-side participants would have needed some lead time to make proper use of the newly available data. We therefore do not expect the effects to be visible immediately. What we do observe is an increase in the 3rd quartile effective spread just following the transparency event (in August of 2003). The effect of the event is more acute for the 5-year benchmark. The rise in 3rd quartile spread lasts for roughly two months after which there is a return to the previous level. What is interesting in the case of the 5-year benchmark is that another period of somewhat larger spread can be observed for an interval in August 2002. This coincides with the initial launch of the data product among Cantor customers. The increase in the effective spread at the 3rd quartile is only one crude measure of the effects of a fairly mild transparency event. We find it to be surprisingly strong, given how liquid these markets are. MTS data are currently available through Reuters and Traderforce, but to our knowledge they are not as detailed, as widely distributed, as widely used or as user-friendly as the data produced and distributed by Cantor. In one important respect the MTS data are not quite as useful for buy-side participants as are Cantor’s because they are not from as liquid a market. Their distribution may be expected to have less impact on buy-side requests for quotes, and this in turn would lead to fewer knock-on effects for inter-dealer activity. If all limit-orders in the European context were to be consolidated and distributed in real-time to buy-side participants, then this might have more decisive effects. In essence, what buy-side participants gain from inter-dealer market information has much to do with the information that they themselves supply to dealers. If they receive more information, and this affects what they supply, then there is a circularity in this effect that could lead to very inefficient outcomes. Ultimately some degree of opacity is needed if dealers are to be encouraged to supply both liquidity services and pre-trade information. Conclusions from the empirical analysis We investigate the effects of cross-country differences and changes over time in the level of transparency in government bond markets. We take account of the specific microstructure characteristics of these markets, in particular the obligations on primary dealers and the issuance techniques chosen by government issuers. We conjecture that differences in transparency affect the risks borne by dealers, and this in turn affects the liquidity of the market. We use data from the MTS markets for euro-denominated bonds and from the US Treasury market. There are significant differences across the euro-area countries in issuance techniques and the secondary market obligations that issuers impose on dealers. The US treasury market is closest to the German market although far larger. There our data permit comparisons across alternative trading platforms with differing degrees of transparency. Our empirical analysis uses simple (mainly non-parametric) descriptive statistics. We find a consistent and convincing pattern of results that correspond largely to our priors, which are based on both theory and extensive interviews with market participants.
• Across the MTS markets, countries that rely more on syndicate issuance and the placing of secondary market obligations on primary dealers have higher percentages of turnover on the (transparent) MTS.

55
• Where there is little or no reliance on the primary dealer system nor on syndicated issuance, there is relatively little activity in the transparent secondary market (MTS).
• Examination of five liquidity-related variables is also revealing. Where transparency is high, trade size tends to be low. Where primary dealer obligations are greatest or where syndication is used heavily, we see better liquidity provision on MTS and low spreads. Effective spreads in the US are generally smaller than on MTS, except for the long benchmark.
• A detailed study of execution quality again shows it is closely related to the size of the issuer, the issuance techniques, and the obligations imposed on primary dealers. In the markets where obligations on primary dealers are greatest, execution quality for large trades suffers. This is seen in greater steepness of the order book in these markets.
• We find evidence of a winner’s curse problem in both Europe and the US. These appear to be more prevalent in markets that are more transparent and less fragmented.
• We examine a ‘transparency event’ that occurred in June 2003 on the US Treasury market. The data suggest that a discrete increase in transparency on eSpeed brought an increase in effective spreads.
We conclude that the microstructure matters greatly. Dealers prefer to operate on more opaque markets. Greater transparency is associated with lower trade size and possibly with higher spreads. Some degree of opacity seems necessary to induce dealers to supply both liquidity and pre-trade information.
56
7. Transparency, liquidity, efficiency: what the markets say
The primary dealers stressed two key points:
• ‘If you don’t have to pay for information, no one will want to be a market maker’.
• Taking positions requires risking capital, and if those positions are exposed to the market, the risk becomes so high that it would not be worthwhile, and capital would be withdrawn – that is, the primary dealers will not continue to play under such rules. That applies, we were told, both to primary issues (the outcomes of auctions and syndications) and the OTC secondary market. The reward for liquidity provision would become even lower than it currently is, and liquidity would dry up.
It follows from such arguments that ‘pre-trade transparency would kill the OTC markets – not just loss of anonymity, but even market knowledge of prices quoted. The number of issues traded and players would fall.’ ‘The market is not mature enough to make it more transparent – it needs the primary dealer system, which greater transparency could destroy.’ Post-trade data were thought to be less sensitive, but if the lag were only 15 minutes (say), there would be some such effects. In smaller and less liquid markets (e.g., some of the ‘peripheral’ countries), even 60 minutes would not be enough to allow traders to unwind positions. Aggregate data could indicate where the bid-offer is and thereby aid in price discovery, but it would be ‘dangerous’ to disclose individual transactions. That applies a fortiori to post-auction positions (although some dealers conceded that they could hedge before auctions, and in any case, a substantial part of their bids might be on behalf of clients – so they would be at risk, rather than the dealer). Moreover, communicating the data would be ‘a huge pain’ – very costly, in a market where even the big, most efficient banks are finding that costs are 80-90% of revenues. One primary dealer said that 60% of its trades were voice (the bigger trades), with physical tickets that would have to be inputted into an electronic system. And the main dealers say they have no need for greater transparency – they have access to the MTS data, and the inter-dealer market is in any case an institutional market, with large information flows. Big investors, too, have a lot of market information. The large buy-side institutions will have many dealers contacting them directly. Conversely, they value their relationships with dealers in the OTC setting. If they have a big position to switch, they normally don’t parcel it out but rather give it all to a single dealer to ‘work the order’. They find no problem with best execution. On the other hand, we were told that ‘the big institutions tolerate low transparency because they have more of it than others – and because that forces portfolio managers to go through them rather than directly to the market.’ One primary dealer interviewee said that the B2B market is a ‘grey area’, where there might be some reasons for greater transparency. And some institutional investors would find useful the end-of-day communication of aggregate mid-price. Still, this is not straightforward, since prices for the same security may differ with size of trade. Indeed, while many warned against more pre-trade transparency, some would be keen on more post-trade data, but most of these did not find it a high priority. Still, one buy-side participant argued forcefully for more post-trade transparency in B2C dealing. It was also maintained that ‘giving retail more transparency would stimulate competition’, and that post-trade transparency would be helpful in enforcing best execution at retail. More fundamentally, there might be a ‘virtuous circle’ – now, retail involvement is low and this is taken as a reason why greater transparency is unnecessary, whereas the
57
alternative hypothesis is that retail involvement is low because transparency is low, and more transparency would greatly expand the market. All that would be required is a continuous price stream, possibly on a multi-tier basis (different time lags for different classes of securities – longer lags for the less liquid issues). And even one dealer said that anonymous post-trade reporting would be useful to dealers, except for the biggest players. It was suggested that the dealers’ resistance was short-sighted: more transparency would lead to an increase in trading volumes, so that the better traders (those with more inventory and offering more liquidity) will make more money. Retail investors, too, by adding diversity to the market, would add significant liquidity. Some argued, however, that there is already considerable post-trade transparency, for those who care to exploit it. Not only are there the MTS data, but also one can infer cash trades from observing Eurex transactions, where they are hedged. Moreover, harmonised monthly reporting to the DMOs will begin next year, and that will further increase transparency. One of our interviewees suggested that in OTC markets, liquidity usually stimulates transparency, more than the conventional converse hypothesis (which may or may not be correct). The market is dynamic: the activity/maturity curve, the transient nature of trading through the life of the asset, the multiplicity of venues including the subjective protection offered by voice brokers, the complex OTC interest rate and credit market shape, the flexibility of trade structures - asset swaps, switches, basis, etc. He contrasted this with the equities market, where there is ever-changing single credit exposure, and derivative activity usually is motivated by fast exposure to the underlying asset or accounting and tax reasons. Volatility strongly influences trading and willingness to show prices in fixed income securities. In times of extremes of volatility, traders tend to revert to voice intermediation, away from electronic trading. It was suggested that if an increase in transparency were indeed to drive activity from the OTC market to MTS, this might reduce the distortion resulting from the liquidity obligations imposed by MTS – i.e., liquidity would rise endogenously. And this might help to restore the role of the cash market in yield curve discovery. One interviewee challenged the interpretation of studies of the effects of TRACE on the US corporate bond market, several of which show that TRACE has been followed by a fall in bid-offer spreads. These studies, he argued, ignored the concurrent changes in market conditions – the deleveraging of balance sheets and tightening of credit spreads after 2002, along with a rise in volumes, both of which tend to bring a fall in bid-offer spreads. Moreover, he said, the TRACE experience has backed up the contention that greater transparency would result in withdrawal of capital from the market – some big investment banks have cut back on providing liquidity to their clients (i.e., withdrawing capital from the primary market). On the other hand, one head of a DMO found the dealers’ resistance to greater transparency surprising, since (he maintained) the major investment banks appear to function without complaint under TRACE. He also argued that there would not be much increase in the burden of reporting, since the banks already have to report to their supervisors. He did acknowledge, however, that efforts to increase transparency might be seen as an attack on the OTC market. And DMOs are certainly conscious of their own position as monopolistic suppliers (or monopsonistic buyers of trading and liquidity services).

58
The DMO/Treasury views differed across countries. Some DMOs would be happy to see the OTC market shrink, with a transfer to electronic platforms. But smaller issuers might suffer if they could not impose obligations on primary dealers. Some – e.g., Hungary and Greece – might find post-trade transparency a problem: it would increase the dealers’ risk, raise spreads, force trading into the electronic markets, and the markets might not be liquid enough to sustain such transparency. Small issuers are especially dependent on the primary dealers to provide liquidity. They recognise the market risk for a known holder of a large position, and they therefore would prefer to preserve anonymity for the results of syndications and some degree of post-auction opacity, for as long as the primary dealers can maintain it. Others, typically the larger issuers, are more ‘relaxed’ about the possible effects on market structure. Greater transparency, they argue, would increase competition – whatever they say now, the big banks won’t want to pull out [at least from the major markets!]. The bond markets cannot be separated from the rest of the government-bank relationship. It is a repeated game, and the banks cannot choose what they want in the package. In any case, is it a big loss if some of the liquidity goes? Cui bono? Or at least, what do they think would be good for them? To sum up our interviews, it is clear that the major banks (primary dealers) are strongly opposed to greater mandatory transparency. The larger buy-side institutions see no need for it and may benefit from the current degree of opacity. Some smaller buy-side institutions are in favour of greater transparency, in particular post-trade. The smaller issuers are concerned about the possible effects, while the larger ones seem not especially worried and suggest that some of the primary dealers’ arguments are self-serving. We saw no one who could be said to ‘represent’ the views of retail customers, actual or potential. The European Central Bank might be affected operationally by new transparency regulations: the liquidity of securities serving as repo collateral might change; and greater post-trade transparency would be relevant to valuation of the pool of repo collateral
59
8. Policy implications
We conclude that great caution is warranted in considering any mandatory imposition of transparency requirements on government bond markets along the lines of those in MiFID for equity markets. Both in Europe and in the United States, market structures have evolved – in very different ways, as within the EU itself – to give the present coexistence of electronic and OTC markets, offering different environments that seem suited to different types of transactions. These markets do not function ideally – which do? – and we have found evidence of significant problems, such as the winner’s curse. But in this case as in others, it is not clear that mandatory transparency could ‘fix’ them. There is also a version of the classic ‘second-best’ problem here. The auction-syndicate system, or even just issuers’ use of auction ‘performance’ as a criterion for awarding incentives, creates market distortions. Given those distortions, we cannot easily predict the welfare consequences of mitigating some market imperfections by improving public information flows in the name of greater transparency. Again, that suggests regulators should be cautious in intervening in these markets. It may be wiser to let them evolve further, at least for some time, under the influences of rapid technical change and changes in the market structures themselves (e.g., consolidation of the European banking system).
60
References
Aitken M. J., R. M. Cook, F. H. deB. Harris and T. H. McInish (2006) ‘Market Design and Execution Cost for Matched Securities Across Seven Tier-One Markets.’ Mimeo available at wwwdocs.fce.unsw.edu.au/banking/seminar/2006/Rick_Harris.pdf Audet, N., T. Gravelle and J. Yang (2002) ‘Alternative Trading Systems: Does One Shoe Fit All?’ Bank of Canada Working Paper No. 2002-33. Back, K and S. Baruch (2004) ‘Limit-order Markets and Floor Exchanges: An Irrelevance Proposition’, Working Paper. Barclay, M. J., T. Hendershott and K. Kotz (2004), ‘Automation versus Intermediation: Evidence from Treasuries Going Off the Run’, University of Rochester, mimeo. Barth, M. J., E. M. Remolona and P. D. Wooldridge (2001) ‘Changes in Market Functioning and Central Bank Policy: An Overview of the Issues.’ BIS paper No. 12. Bagliano, F. C., A. Brandolini and A. Dalmazzo (2000) ‘Liquidity, Trading Size and the Co-existence of dealership and Auction Markets’, Economic Notes 29, pp 179-199. Baruch, S. (2005) ‘Who Benefits from an Open Limit-Order Book?’, The Journal of Business 4, pp 1267-1306. Benviste, L., A. Marcus and W. Wilhelm (1992) ‘What’s Special about the Specialist?’ Journal of Financial Economics, 32, pp 61-68. Bessembinder, H., W. Maxwell and K. Venkatamaran (2005) ‘Market Transparency, Liquidity Externalities and Institutional Trading Costs in Corporate Bonds.’ Journal of Financial Economics, forthcoming.Biais, B. (1993) ‘Price Formation and Equilibrium Liquidity in Fragmented and Centralized Markets,’ Journal of Finance, 48, pp 157-185. Biais, B., O. Glosten, and C. Spatt (2005) ‘Market Microstructure: A Survey of Microfoundations, Empirical Results and Policy Implications.’ Journal of Financial Markets 8, pp 617-264. Biais, B., T. Foucault and F. Salanie (1998) ‘Floors, Dealer Markets and Limit-order Markets’, Journal of Financial Markets 1, pp 253-284. Bloomfield, R. and M. O’Hara (1999) ‘Market Transparency: Who Wins and Who Loses?’, The Review of Financial Studies, 12:1 pp 5-35. Bloomfield, R. and M. O’Hara (2000) ‘Can Transparent Markets Survive?’ Journal of Financial Economics, 55:3 pp 425-459. Boehmer, E. (2004) ‘Dimentions of Execution Quality:Recent Evidence for US Equity Markets’, Working Paper. Boehmer, E., G. Saar and L. Yu (2005) ‘Lifting the Veil: An Analysis of Pre-trade Transparency at the NYSE’, The Journal of Finance, LX:2 pp 783-815. Bolton G. E., E. Katok and A. Ocenfels (2004) ‘Trust among Internet Traders: A Behavioural Economics Approach’, University of Cologne, Department of Economics W/P No.5. available at http://ockenfels.uni-koeln.de/RePEc/download/wp0005.pdf Booth, G. G., P. Iversen, S. K. Sakar, H.Schmidt and A. Young (1999) ‘Market Structure and Bid-Ask Spreads:IBIS vs NASDAQ’, European Journal of Finance 5, 51-71. Bortoli, L. A. Frino, E. Jarnecic and D Johnstone (2006) ‘Limit-order Book Transparency, Execution Risk and Market Depth,’ Working Paper, Finance Discipline, School of Business, Faculty of Economics and Business, University of Sydney, NSW.
61
Brandt, M.W. and K. A. Kajavecz (2003) ‘Price Discovery in the US Treasury Market: The Impact of Order Flow and Liquidity on the Yield Curve.’ NBER working paper #9529, February. Breuer, W. (1999) ‘The Relevance of Primary Dealers for Public Bond Issues’, CFS Working Paper No. 1999/11. Buiter, W., and A. Sibert (2005), ‘How the Eurosystem’s treatment of collateral in its open market operations weakens fiscal discipline in the eurozone’, CEPR Discussion Paper no. 5387. Casey, J.-P. and K. Lannoo (2005), Europe’s Hidden Capital Markets, Centre for European Policy Studies. Chordia,T.,A. Sarkar and A. Subrahmanyam (2003) ‘An Empirical Analysis of Stock and Bond Market Liquidity.’ Federal Reserve Bank of New York, Staff reports, #164, March. Cohen, B.H. and H.S. Shin (2003) ‘Positive Feedback Trading Under Stress: Evidence from the US Treasury Securities Market.’ London School of Economics, Manuscript, May. Committee on Global Financial System (1999) ‘A Review of Financial Market Events in Autumn 1998.’ Bank for International Settlements manuscript. Degryse, H. (1997) ‘The Total Cost of Trading Belgian Shares: Brussels versus London’, CEPR Discussion Paper no. 1581. Diamond, D. and P. Dybvig (1983) ‘Bank Runs, Deposit Insurance, and Liquidity.’ Journal of Political Economy, 91, 401-419. D’Souza, C., C. Gaa, and J. Yang, Bank of Canada (2003) ‘An Empirical Analysis of Liquidity and Order Flow in the Brokered Interdealer Market for Government of Canada Bonds.’ Working paper 2003-28, September. Dunne, P. G., M.J. Moore, and R. Portes (2005), ‘Price discovery in the European bond markets,’ at http://faculty.london.edu/rportes/ Dunne, P. G., M. J. Moore, and H. Hau (2006), ‘International Order Flows: Explaining Equity and Exchange Rate Returns’, available from the SSRN website. Edwards, A. K., L. E. Harris and M. S. Piwowar (2004) ‘Corporate Bond Market Transparency and Transaction Costs.’ Office of Economic Analysis US Security and Exchange Commission. Ehrman, M., M. Ellison and N. Valla (2003) ‘Regime-Dependent Impulse Response Functions in a Markov-Switching Vector Autoregression Model.’ Economics Letters, 78, 295-99. Fleming, M. J. (2003) ‘Measuring Treasury Market Liquidity.’ Federal Reserve Bank of New York, Economic Policy Review, September, 83-110. Flood, M. D., R. Huisman and R. J. Mahieu (1999) ‘Quote Disclosure and Price Discovery in Multiple-Dealer Financial Markets’, The Review of Financial Studies, 12:1 pp 37-59. Flood, M. D., K. G. Koedijk, M. A. van Dijk and I. W. van Leeuwen (2002) ‘Dividing the Pie: Asymmetrically Informed Dealers and Market Transparency,’ Erasmus Research Institute of Management (ERIM) Report Series reference number ERS-2002-101-FandA. FSA (2005) ‘Trading Transparency in the UK Secondary Bond Markets.’ UK Financial Services Authority, Discussion paper, 05/5, September.
62
Furfine, C. H. and E. M. Remolona (2005) ‘Price Discovery in a Market Under Stress: The US Treasury Market in Fall 1998.’ Federal Reserve Bank of Chicago Working Paper 2005-06. Galati, G. and K. Tsatsaronis (2001) ‘The Impact of the Euro on Europe’s Financial Markets.’ Working paper #100, Bank for International Settlements. Goldreich, D., B. Hanke and P. Nath (2005) ‘The Price of Future Liquidity: Time-Varying Liquidity in the U.S. Treasury Market’, Review of Finance, Volume 9:1, pp 1-32. Goldstein, M. A., Hotchkiss, E. and E. R. Sirri (2005) ‘Transparency and Liquidity: A Controlled Experiment on Corporate Bonds.’ Manuscript, Babson College, April. Gravelle, T. (2000) ‘The Market Microstructure of Dealership Equity and Government Securities Markets: How They Differ.’ Financial Markets Department, Bank of Canada Green. C. T. (2004) ‘Economic News and the Impact of Trading on Bond Prices’, Journal of Finance, 59:3 pp.1201-1233. Grossman, S. J. and M. H. Miller (1998) ‘Liquidity and Market Structure’, Journal of Finance, 43, 617-33. Hansch, O., and V. Saporta (2005), ‘Is order flow information valuable? Evidence from Government Bond Dealer Revenues’, mimeo. Harris, L. E. (1996) ‘Does a Large Minimum Price Variation Encourage Order Exposure?’ Unpublished Manuscript University of Southern California. Hasbrouck, J. (1993) ‘Assessing the Quality of a Security Market: A New Approach to Transaction Cost Measurement’, Review of Financial Studies, 6, pp 191-212. Hasbrouck, J. and G. Saar (2004) ‘Technology and Liquidity Provision: The Blurring of Traditional Definitions.’ Stern School of Business working paper, New York University. Hendershot, T. and C. M. Jones (2005) ‘Island Goes Dark: Transparency, Fragmentation and Regulation’, The Review of Financial Studies, 18:3 pp744-793. Holland, A. (2000) ‘The Academic Literature – A Brief Review.’ Annex in DMO Consultation Paper on Secondary Market for Gilts, January. Holland, A. (2001) ‘The Development of Alternative Trading Systems in the UK Gilt Market: Lessons and Implications.’ Paper prepared for the financial market structure and dynamics conference at the Bank of Canada, November. Krolzig, H-M. (1997) ‘Markov-Switching Vector Autoregressions’, Spinger. Lai, H. N. (2004) ‘The Market Quality of Moderately Liquid Securities in a Hybrid Market: The Evidence’, Working paper. Madhavan A. (1995) ‘Consolidation, Fragmentation and Disclosure of Trading Information,’ Review of Financial Studies, 8, pp 579-603. Madhavan, A. and M. Cheng (1997) ‘In Search of Liquidity: Block Trades in the Upstairs and Downstairs Markets’, Review of Financial Studies, 10:1, pp 175-203. Madhavan, A, D. Porter and D. Weaver (2005) ‘Should Securities Markets be Transparent?’ Journal of Financial Markets Vol. 8, Issue 3, 265-287 Martínez-Resano, J. R. (2005) ‘Size and Heterogeneity Matter: A Microstructure-Based Analysis of Regulation of Secondary Markets for Government Bonds.’ Banco de España, Occasional Paper No. 0501. Mizrach, B & C. J. Neely (2006), ‘The Transition to Electronic Trading in the Secondary Treasury Market’, Federal Reserve Bank of St Louis Working Paper 2006-012A. http://research.stlouisfed.org/wp/2006/2006-012.pdf
63
Muscarella C. J. and M. S. Piwowar (2001) ‘Market Microstructure and Securities Values:Evidence from the Paris Bourse’, Journal of Financial Markets 4, pp 209-229. Naik, N., A. Neuberger, and S. Viswanathan (1999) ‘Trade Disclosure Regulation in Markets with Negotiated Trades’, Review of Financial Studies, 12, 873-900. Nimalendran, M. and G Petrella (2003) ‘Do Thinly-Traded Stocks Benefit from Specialist Intervention?’ Journal of Banking and Finance 27, pp 1823-1854. O’Hara, M. (1995) ‘Microstructure Theory’ Basil Blackwell, Cambridge, Mass. Pagano, M. and A. Roell (1996) ‘Transparency and Liquidity: A Comparison of Auction and Dealer Markets with Informed Trading,’ Journal of Finance, 51:2, pp 579-611. Parlour C. A. and D. J. Seppi (2003) ‘Liquidity Based Competition for Order Flow’, Review of Financial Studies 16, pp 301-343. Remolona, E. M. (2002) ‘Micro and Macro Structures in Fixed Income Markets: The Issues at Stake in Europe.’ Bank for International Settlements paper presented at the ECB-CFS Research Network on Capital Markets and Financial Integration in Europe. Rust, J. and G. Hall (2001) ‘Middle Men Versus Market Makers: A Theory of Competitive Exchange.’ Cowles Foundation Discussion Paper No. 1299. Sar, A. and T. Lybek (2002) ‘Measuring Liquidity in Financial Markets.’ IMF Working Paper, No. 232, December. Scalia, A. and V. Vacca (1999) ‘Does Market Transparency Matter? A Case Study.’ Discussion Paper 359, Banca d’Italia. Schulte, W. and R. Violi (2000) ‘Interactions Between Cash and Derivative Bond Markets: Some Evidence for the euro Area.’ Bank for International Settlements. Paper No. 5. Seppi D. J. (1997) ‘Liquidity Provision with Limit-orders and Strategic Specialists’, The Review of Financial Studies 10, pp 103-150. Simaan, Y., D. G. Weaver and D. K. Whitcomb (2003) ‘Market Maker Quotation Behaviour and Pretrade Transparency’, Journal of Finance, 58:3, pp 1247-1267. Swan, P. L. and J. Westerholm (2005) ‘Transparency Generally Beats Opacity: How Transparency Choice Impacts Global Equity Market Performance.’ School of Banking and Finance Working Paper, University of New South Wales. Tabb, L. (2004) ‘A New Market Structure for Bonds?’ Wall Street and Technology, 15 April. http://www.wallstreetandtech.com/showArticle.jhtml?articleID=18901634 Viswanathan, S. and J. J. D. Wang (2002) ‘Market architecture:Limit-order Books versus Dealership Markets’, Journal of Financial Markets 5, pp 127-167. Warga, A. (2004) ‘An Overview of the Regulation of Bond Markets.’ Report to the U.S. Senate Banking Committee, June. Zhao X and K. H. Chung (2006) ‘Information Disclosure and Market Quality: The Effect of SEC Rule 11Ac1-5 on Trading Costs’ .

64
Appendix 1
Table A1.1 Outstanding Debt/Ratings (12/31/03)
Issuer Outstanding Long-Term Ratings (€,bln) Moodys S&P Fitch Austria 146.4 Aaa AAA AAA Belgium 263.0 Aa1 AA+ AA Finland 63.3 Aaa AAA AAA France 787.7 Aaa AAA AAA Germany 773.8 Aaa AAA AAA Greece 148.3 A1 A+ A+ Ireland 28.1 Aaa AAA AAA Italy 1157.1 Aa2 AA AA Netherlands 180.5 Aaa AAA AAA Portugal 78.4 Aa2 AA AA Spain 309.0 Aaa AA+ AAA
Note: This table is reproduced from the MTS Handbook 2005 and it supplies input for the benchmark/non-benchmark breakdown that is contained in the country specific tables that follow. Table A1.2 Austria, 8-Apr-05 (€, millions)
Security ISIN Outstanding MTS Volume Turnover %RAGB 15/07/06 5.875% AT0000383518 6,404.1 208.98 3.26 RAGB 20/10/07 5.50% AT0000384953 8,749.5 470.83 5.38 RAGB 15/01/08 5.00% AT0000384227 8,140.1 138.08 1.7 RAGB 15/07/09 4.00% AT0000384821 8,725.8 638.82 7.32 RAGB 15/01/10 5.50% AT0000384938 8,810.0 824.68 9.36 RAGB 04/01/11 5.25% AT0000385067 8,267.2 231.79 2.8 RAGB 20/10/13 3.80% AT0000385992 9,482.3 328.88 3.47 RAGB 15/07/14 4.30% AT0000386073 8,002.1 209.51 2.62 RAGB 15/01/18 4.65% AT0000385745 9,771.4 145.22 1.49 RAGB 15/07/20 3.90% AT0000386115 5,650.0 274.18 4.85 RAGB 15/07/27 6.25% AT0000383864 6,581.1 123.18 1.87 Benchmark 88,583.60 3594.15 4.06 Non-Bench 57,816.40 469.48 0.81 Total 146,400.00 4063.63 2.78
Note: This table, and all of the country-specific tables, is derived from the MTS Handbook and from the month’s volume that we calculated from MTS data on transactions. In the cases of the individual bonds we calculated the volume traded for the month for which the amount outstanding was given and this produced the turnover percentage as well as providing a total that we regarded as a benchmark total. The individual bond turnover percentage should be very accurate. For both the amount outstanding and the volume traded we compiled a benchmark total and turnover percentage. For amount outstanding, we also arrive at a non-benchmark total by subtracting the benchmark amount from the total given in table 1.1 (this total is also repeated at the bottom of the country-specific tables in millions of euro). The same was done for the volume traded where we extracted total volume traded from the MTS data, took the benchmark amount from this to produce the non-benchmark total and turnover. Although the benchmark/non-benchmark division is not necessarily consistent by country, the turnover percentage is accurate.
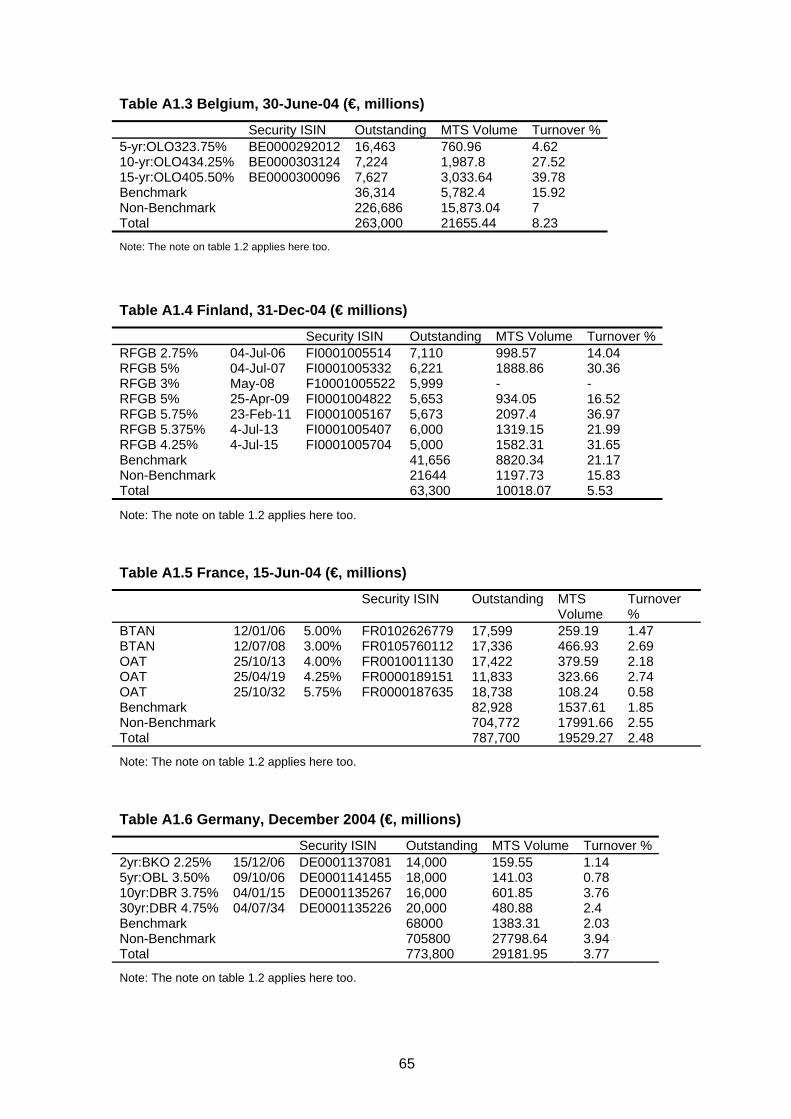
65
Table A1.3 Belgium, 30-June-04 (€, millions)
Security ISIN Outstanding MTS Volume Turnover % 5-yr:OLO323.75% BE0000292012 16,463 760.96 4.62 10-yr:OLO434.25% BE0000303124 7,224 1,987.8 27.52 15-yr:OLO405.50% BE0000300096 7,627 3,033.64 39.78 Benchmark 36,314 5,782.4 15.92 Non-Benchmark 226,686 15,873.04 7 Total 263,000 21655.44 8.23
Note: The note on table 1.2 applies here too.
Table A1.4 Finland, 31-Dec-04 (€ millions)
Security ISIN Outstanding MTS Volume Turnover %RFGB 2.75% 04-Jul-06 FI0001005514 7,110 998.57 14.04 RFGB 5% 04-Jul-07 FI0001005332 6,221 1888.86 30.36 RFGB 3% May-08 F10001005522 5,999 - - RFGB 5% 25-Apr-09 FI0001004822 5,653 934.05 16.52 RFGB 5.75% 23-Feb-11 FI0001005167 5,673 2097.4 36.97 RFGB 5.375% 4-Jul-13 FI0001005407 6,000 1319.15 21.99 RFGB 4.25% 4-Jul-15 FI0001005704 5,000 1582.31 31.65 Benchmark 41,656 8820.34 21.17 Non-Benchmark 21644 1197.73 15.83 Total 63,300 10018.07 5.53
Note: The note on table 1.2 applies here too. Table A1.5 France, 15-Jun-04 (€, millions)
Security ISIN Outstanding MTS Volume
Turnover %
BTAN 12/01/06 5.00% FR0102626779 17,599 259.19 1.47 BTAN 12/07/08 3.00% FR0105760112 17,336 466.93 2.69 OAT 25/10/13 4.00% FR0010011130 17,422 379.59 2.18 OAT 25/04/19 4.25% FR0000189151 11,833 323.66 2.74 OAT 25/10/32 5.75% FR0000187635 18,738 108.24 0.58 Benchmark 82,928 1537.61 1.85 Non-Benchmark 704,772 17991.66 2.55 Total 787,700 19529.27 2.48
Note: The note on table 1.2 applies here too. Table A1.6 Germany, December 2004 (€, millions)
Security ISIN Outstanding MTS Volume Turnover % 2yr:BKO 2.25% 15/12/06 DE0001137081 14,000 159.55 1.14 5yr:OBL 3.50% 09/10/06 DE0001141455 18,000 141.03 0.78 10yr:DBR 3.75% 04/01/15 DE0001135267 16,000 601.85 3.76 30yr:DBR 4.75% 04/07/34 DE0001135226 20,000 480.88 2.4 Benchmark 68000 1383.31 2.03 Non-Benchmark 705800 27798.64 3.94 Total 773,800 29181.95 3.77
Note: The note on table 1.2 applies here too.
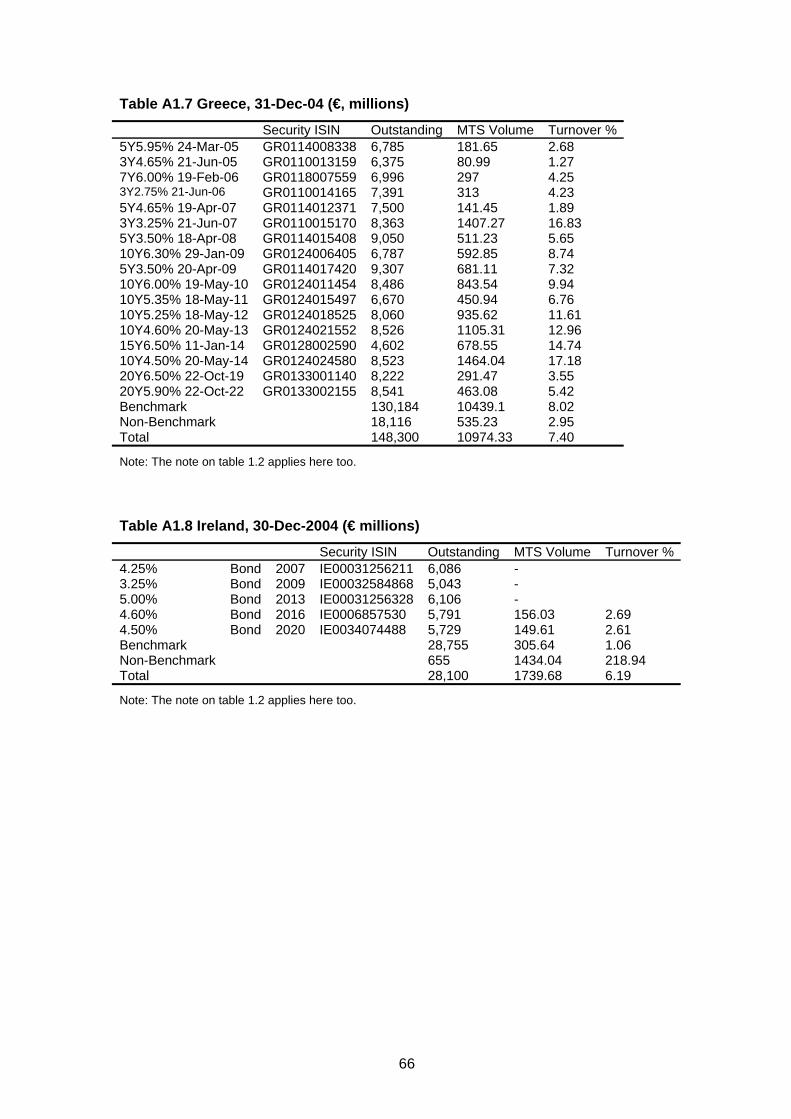
66
Table A1.7 Greece, 31-Dec-04 (€, millions)
Security ISIN Outstanding MTS Volume Turnover % 5Y5.95% 24-Mar-05 GR0114008338 6,785 181.65 2.68 3Y4.65% 21-Jun-05 GR0110013159 6,375 80.99 1.27 7Y6.00% 19-Feb-06 GR0118007559 6,996 297 4.25 3Y2.75% 21-Jun-06 GR0110014165 7,391 313 4.23 5Y4.65% 19-Apr-07 GR0114012371 7,500 141.45 1.89 3Y3.25% 21-Jun-07 GR0110015170 8,363 1407.27 16.83 5Y3.50% 18-Apr-08 GR0114015408 9,050 511.23 5.65 10Y6.30% 29-Jan-09 GR0124006405 6,787 592.85 8.74 5Y3.50% 20-Apr-09 GR0114017420 9,307 681.11 7.32 10Y6.00% 19-May-10 GR0124011454 8,486 843.54 9.94 10Y5.35% 18-May-11 GR0124015497 6,670 450.94 6.76 10Y5.25% 18-May-12 GR0124018525 8,060 935.62 11.61 10Y4.60% 20-May-13 GR0124021552 8,526 1105.31 12.96 15Y6.50% 11-Jan-14 GR0128002590 4,602 678.55 14.74 10Y4.50% 20-May-14 GR0124024580 8,523 1464.04 17.18 20Y6.50% 22-Oct-19 GR0133001140 8,222 291.47 3.55 20Y5.90% 22-Oct-22 GR0133002155 8,541 463.08 5.42 Benchmark 130,184 10439.1 8.02 Non-Benchmark 18,116 535.23 2.95 Total 148,300 10974.33 7.40
Note: The note on table 1.2 applies here too.
Table A1.8 Ireland, 30-Dec-2004 (€ millions)
Security ISIN Outstanding MTS Volume Turnover %4.25% Bond 2007 IE00031256211 6,086 - 3.25% Bond 2009 IE00032584868 5,043 - 5.00% Bond 2013 IE00031256328 6,106 - 4.60% Bond 2016 IE0006857530 5,791 156.03 2.69 4.50% Bond 2020 IE0034074488 5,729 149.61 2.61 Benchmark 28,755 305.64 1.06 Non-Benchmark 655 1434.04 218.94 Total 28,100 1739.68 6.19
Note: The note on table 1.2 applies here too.
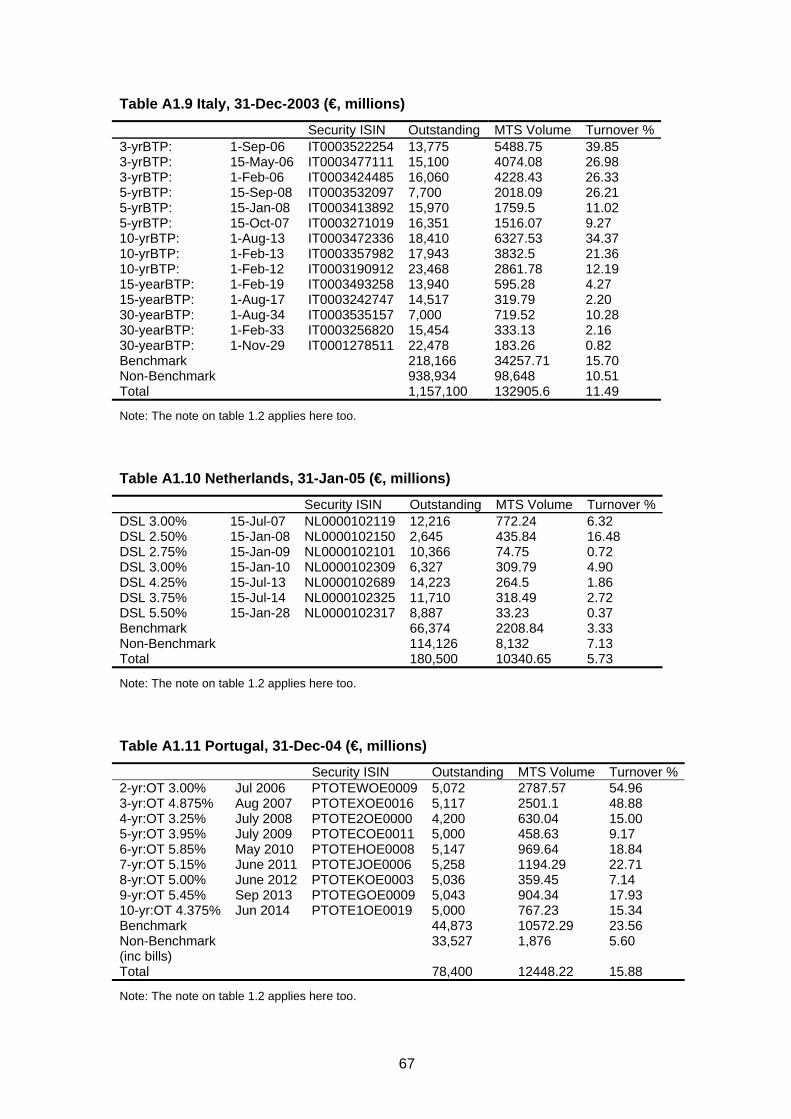
67
Table A1.9 Italy, 31-Dec-2003 (€, millions)
Security ISIN Outstanding MTS Volume Turnover %3-yrBTP: 1-Sep-06 IT0003522254 13,775 5488.75 39.85 3-yrBTP: 15-May-06 IT0003477111 15,100 4074.08 26.98 3-yrBTP: 1-Feb-06 IT0003424485 16,060 4228.43 26.33 5-yrBTP: 15-Sep-08 IT0003532097 7,700 2018.09 26.21 5-yrBTP: 15-Jan-08 IT0003413892 15,970 1759.5 11.02 5-yrBTP: 15-Oct-07 IT0003271019 16,351 1516.07 9.27 10-yrBTP: 1-Aug-13 IT0003472336 18,410 6327.53 34.37 10-yrBTP: 1-Feb-13 IT0003357982 17,943 3832.5 21.36 10-yrBTP: 1-Feb-12 IT0003190912 23,468 2861.78 12.19 15-yearBTP: 1-Feb-19 IT0003493258 13,940 595.28 4.27 15-yearBTP: 1-Aug-17 IT0003242747 14,517 319.79 2.20 30-yearBTP: 1-Aug-34 IT0003535157 7,000 719.52 10.28 30-yearBTP: 1-Feb-33 IT0003256820 15,454 333.13 2.16 30-yearBTP: 1-Nov-29 IT0001278511 22,478 183.26 0.82 Benchmark 218,166 34257.71 15.70 Non-Benchmark 938,934 98,648 10.51 Total 1,157,100 132905.6 11.49
Note: The note on table 1.2 applies here too.
Table A1.10 Netherlands, 31-Jan-05 (€, millions)
Security ISIN Outstanding MTS Volume Turnover %DSL 3.00% 15-Jul-07 NL0000102119 12,216 772.24 6.32 DSL 2.50% 15-Jan-08 NL0000102150 2,645 435.84 16.48 DSL 2.75% 15-Jan-09 NL0000102101 10,366 74.75 0.72 DSL 3.00% 15-Jan-10 NL0000102309 6,327 309.79 4.90 DSL 4.25% 15-Jul-13 NL0000102689 14,223 264.5 1.86 DSL 3.75% 15-Jul-14 NL0000102325 11,710 318.49 2.72 DSL 5.50% 15-Jan-28 NL0000102317 8,887 33.23 0.37 Benchmark 66,374 2208.84 3.33 Non-Benchmark 114,126 8,132 7.13 Total 180,500 10340.65 5.73
Note: The note on table 1.2 applies here too.
Table A1.11 Portugal, 31-Dec-04 (€, millions)
Security ISIN Outstanding MTS Volume Turnover %2-yr:OT 3.00% Jul 2006 PTOTEWOE0009 5,072 2787.57 54.96 3-yr:OT 4.875% Aug 2007 PTOTEXOE0016 5,117 2501.1 48.88 4-yr:OT 3.25% July 2008 PTOTE2OE0000 4,200 630.04 15.00 5-yr:OT 3.95% July 2009 PTOTECOE0011 5,000 458.63 9.17 6-yr:OT 5.85% May 2010 PTOTEHOE0008 5,147 969.64 18.84 7-yr:OT 5.15% June 2011 PTOTEJOE0006 5,258 1194.29 22.71 8-yr:OT 5.00% June 2012 PTOTEKOE0003 5,036 359.45 7.14 9-yr:OT 5.45% Sep 2013 PTOTEGOE0009 5,043 904.34 17.93 10-yr:OT 4.375% Jun 2014 PTOTE1OE0019 5,000 767.23 15.34 Benchmark 44,873 10572.29 23.56 Non-Benchmark (inc bills)
33,527 1,876 5.60
Total 78,400 12448.22 15.88
Note: The note on table 1.2 applies here too.
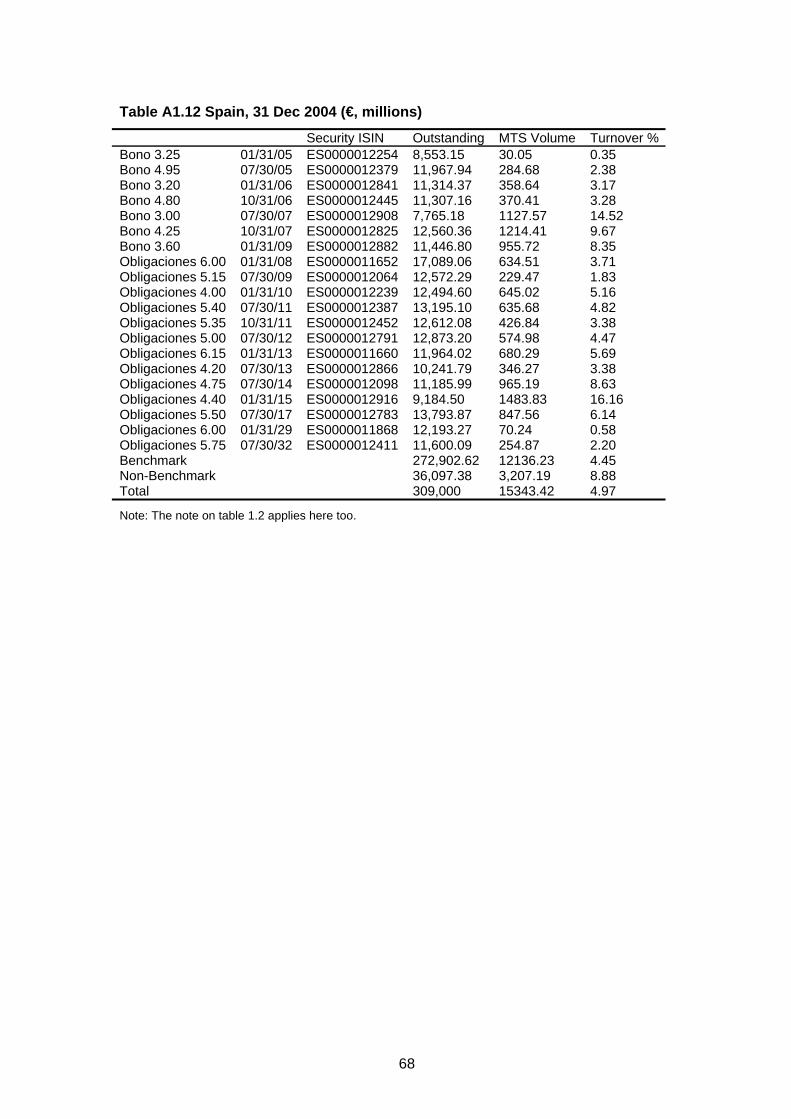
68
Table A1.12 Spain, 31 Dec 2004 (€, millions)
Security ISIN Outstanding MTS Volume Turnover %Bono 3.25 01/31/05 ES0000012254 8,553.15 30.05 0.35 Bono 4.95 07/30/05 ES0000012379 11,967.94 284.68 2.38 Bono 3.20 01/31/06 ES0000012841 11,314.37 358.64 3.17 Bono 4.80 10/31/06 ES0000012445 11,307.16 370.41 3.28 Bono 3.00 07/30/07 ES0000012908 7,765.18 1127.57 14.52 Bono 4.25 10/31/07 ES0000012825 12,560.36 1214.41 9.67 Bono 3.60 01/31/09 ES0000012882 11,446.80 955.72 8.35 Obligaciones 6.00 01/31/08 ES0000011652 17,089.06 634.51 3.71 Obligaciones 5.15 07/30/09 ES0000012064 12,572.29 229.47 1.83 Obligaciones 4.00 01/31/10 ES0000012239 12,494.60 645.02 5.16 Obligaciones 5.40 07/30/11 ES0000012387 13,195.10 635.68 4.82 Obligaciones 5.35 10/31/11 ES0000012452 12,612.08 426.84 3.38 Obligaciones 5.00 07/30/12 ES0000012791 12,873.20 574.98 4.47 Obligaciones 6.15 01/31/13 ES0000011660 11,964.02 680.29 5.69 Obligaciones 4.20 07/30/13 ES0000012866 10,241.79 346.27 3.38 Obligaciones 4.75 07/30/14 ES0000012098 11,185.99 965.19 8.63 Obligaciones 4.40 01/31/15 ES0000012916 9,184.50 1483.83 16.16 Obligaciones 5.50 07/30/17 ES0000012783 13,793.87 847.56 6.14 Obligaciones 6.00 01/31/29 ES0000011868 12,193.27 70.24 0.58 Obligaciones 5.75 07/30/32 ES0000012411 11,600.09 254.87 2.20 Benchmark 272,902.62 12136.23 4.45 Non-Benchmark 36,097.38 3,207.19 8.88 Total 309,000 15343.42 4.97
Note: The note on table 1.2 applies here too.
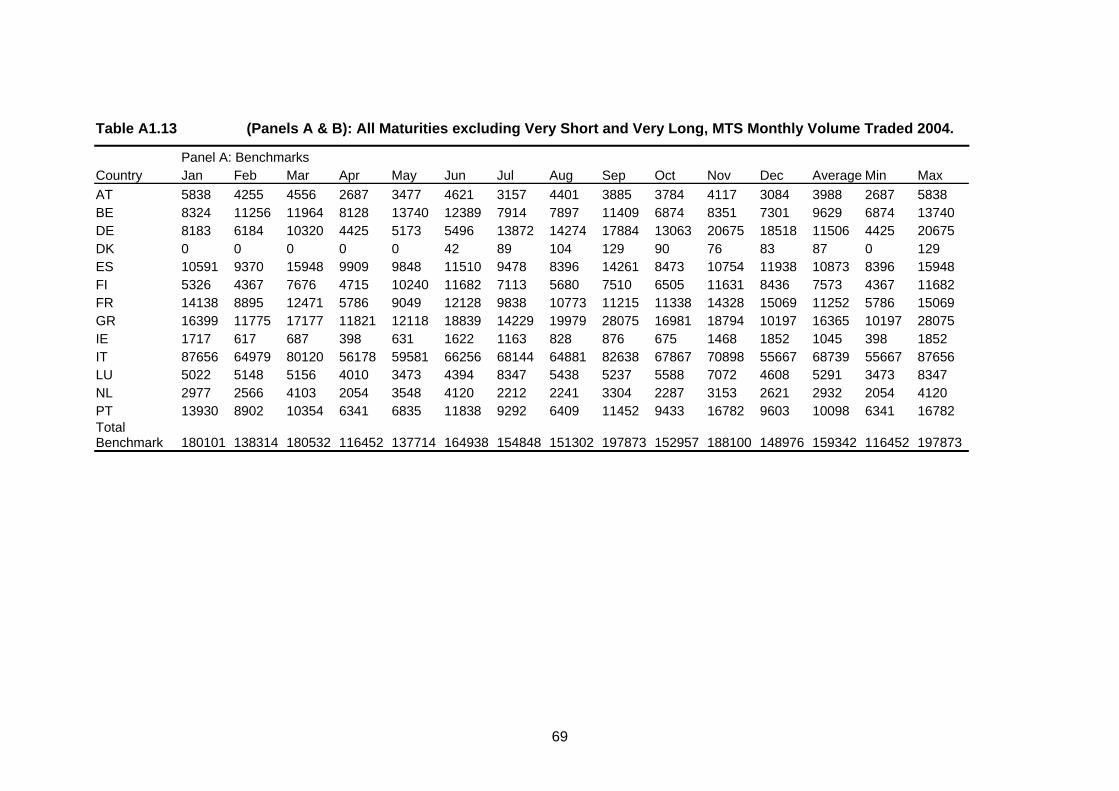
69
Table A1.13 (Panels A & B): All Maturities excluding Very Short and Very Long, MTS Monthly Volume Traded 2004.
Panel A: Benchmarks Country Jan Feb Mar Apr May Jun Jul Aug Sep Oct Nov Dec Average Min Max AT 5838 4255 4556 2687 3477 4621 3157 4401 3885 3784 4117 3084 3988 2687 5838 BE 8324 11256 11964 8128 13740 12389 7914 7897 11409 6874 8351 7301 9629 6874 13740 DE 8183 6184 10320 4425 5173 5496 13872 14274 17884 13063 20675 18518 11506 4425 20675 DK 0 0 0 0 0 42 89 104 129 90 76 83 87 0 129 ES 10591 9370 15948 9909 9848 11510 9478 8396 14261 8473 10754 11938 10873 8396 15948 FI 5326 4367 7676 4715 10240 11682 7113 5680 7510 6505 11631 8436 7573 4367 11682 FR 14138 8895 12471 5786 9049 12128 9838 10773 11215 11338 14328 15069 11252 5786 15069 GR 16399 11775 17177 11821 12118 18839 14229 19979 28075 16981 18794 10197 16365 10197 28075 IE 1717 617 687 398 631 1622 1163 828 876 675 1468 1852 1045 398 1852 IT 87656 64979 80120 56178 59581 66256 68144 64881 82638 67867 70898 55667 68739 55667 87656 LU 5022 5148 5156 4010 3473 4394 8347 5438 5237 5588 7072 4608 5291 3473 8347 NL 2977 2566 4103 2054 3548 4120 2212 2241 3304 2287 3153 2621 2932 2054 4120 PT 13930 8902 10354 6341 6835 11838 9292 6409 11452 9433 16782 9603 10098 6341 16782 Total Benchmark 180101 138314 180532 116452 137714 164938 154848 151302 197873 152957 188100 148976 159342 116452 197873
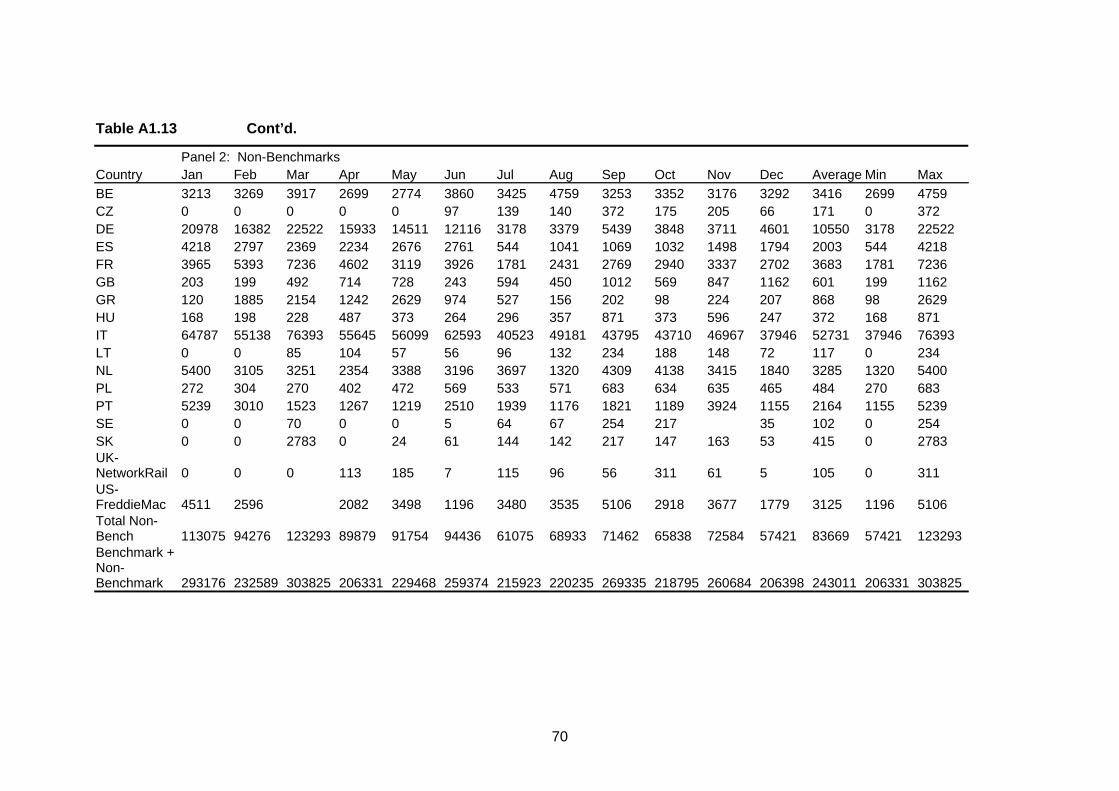
70
Table A1.13 Cont’d.
Panel 2: Non-Benchmarks Country Jan Feb Mar Apr May Jun Jul Aug Sep Oct Nov Dec Average Min Max BE 3213 3269 3917 2699 2774 3860 3425 4759 3253 3352 3176 3292 3416 2699 4759 CZ 0 0 0 0 0 97 139 140 372 175 205 66 171 0 372 DE 20978 16382 22522 15933 14511 12116 3178 3379 5439 3848 3711 4601 10550 3178 22522 ES 4218 2797 2369 2234 2676 2761 544 1041 1069 1032 1498 1794 2003 544 4218 FR 3965 5393 7236 4602 3119 3926 1781 2431 2769 2940 3337 2702 3683 1781 7236 GB 203 199 492 714 728 243 594 450 1012 569 847 1162 601 199 1162 GR 120 1885 2154 1242 2629 974 527 156 202 98 224 207 868 98 2629 HU 168 198 228 487 373 264 296 357 871 373 596 247 372 168 871 IT 64787 55138 76393 55645 56099 62593 40523 49181 43795 43710 46967 37946 52731 37946 76393 LT 0 0 85 104 57 56 96 132 234 188 148 72 117 0 234 NL 5400 3105 3251 2354 3388 3196 3697 1320 4309 4138 3415 1840 3285 1320 5400 PL 272 304 270 402 472 569 533 571 683 634 635 465 484 270 683 PT 5239 3010 1523 1267 1219 2510 1939 1176 1821 1189 3924 1155 2164 1155 5239 SE 0 0 70 0 0 5 64 67 254 217 35 102 0 254 SK 0 0 2783 0 24 61 144 142 217 147 163 53 415 0 2783 UK-NetworkRail 0 0 0 113 185 7 115 96 56 311 61 5 105 0 311 US-FreddieMac 4511 2596 2082 3498 1196 3480 3535 5106 2918 3677 1779 3125 1196 5106 Total Non-Bench 113075 94276 123293 89879 91754 94436 61075 68933 71462 65838 72584 57421 83669 57421 123293Benchmark + Non-Benchmark 293176 232589 303825 206331 229468 259374 215923 220235 269335 218795 260684 206398 243011 206331 303825
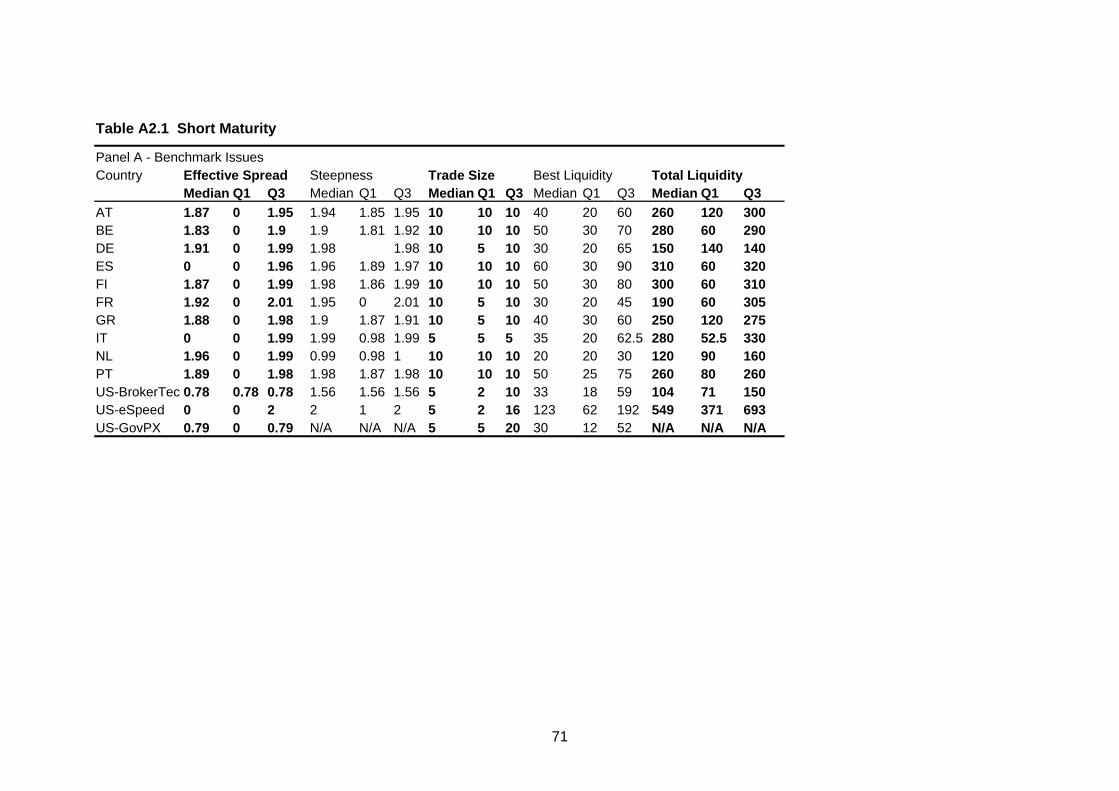
71
Table A2.1 Short Maturity
Panel A - Benchmark Issues Country Effective Spread Steepness Trade Size Best Liquidity Total Liquidity Median Q1 Q3 Median Q1 Q3 Median Q1 Q3 Median Q1 Q3 Median Q1 Q3 AT 1.87 0 1.95 1.94 1.85 1.95 10 10 10 40 20 60 260 120 300 BE 1.83 0 1.9 1.9 1.81 1.92 10 10 10 50 30 70 280 60 290 DE 1.91 0 1.99 1.98 1.98 10 5 10 30 20 65 150 140 140 ES 0 0 1.96 1.96 1.89 1.97 10 10 10 60 30 90 310 60 320 FI 1.87 0 1.99 1.98 1.86 1.99 10 10 10 50 30 80 300 60 310 FR 1.92 0 2.01 1.95 0 2.01 10 5 10 30 20 45 190 60 305 GR 1.88 0 1.98 1.9 1.87 1.91 10 5 10 40 30 60 250 120 275 IT 0 0 1.99 1.99 0.98 1.99 5 5 5 35 20 62.5 280 52.5 330 NL 1.96 0 1.99 0.99 0.98 1 10 10 10 20 20 30 120 90 160 PT 1.89 0 1.98 1.98 1.87 1.98 10 10 10 50 25 75 260 80 260 US-BrokerTec 0.78 0.78 0.78 1.56 1.56 1.56 5 2 10 33 18 59 104 71 150 US-eSpeed 0 0 2 2 1 2 5 2 16 123 62 192 549 371 693 US-GovPX 0.79 0 0.79 N/A N/A N/A 5 5 20 30 12 52 N/A N/A N/A
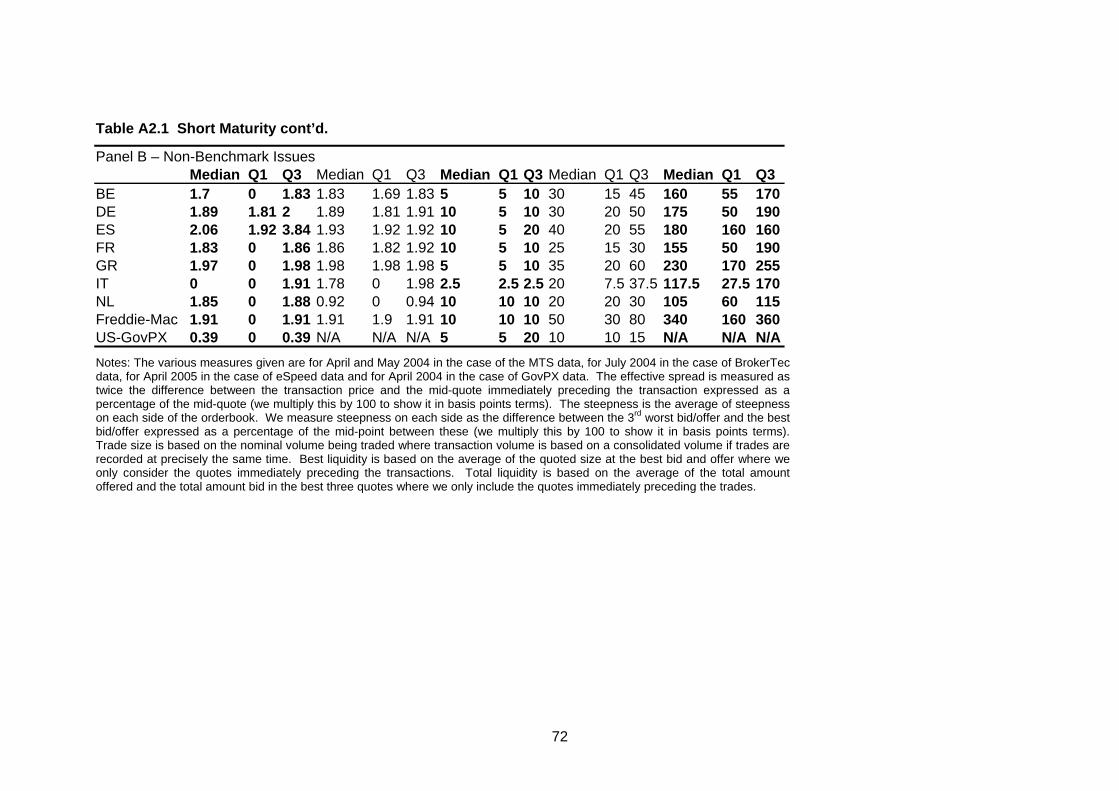
72
Table A2.1 Short Maturity cont’d.
Panel B – Non-Benchmark Issues Median Q1 Q3 Median Q1 Q3 Median Q1 Q3 Median Q1 Q3 Median Q1 Q3 BE 1.7 0 1.83 1.83 1.69 1.83 5 5 10 30 15 45 160 55 170DE 1.89 1.81 2 1.89 1.81 1.91 10 5 10 30 20 50 175 50 190ES 2.06 1.92 3.84 1.93 1.92 1.92 10 5 20 40 20 55 180 160 160FR 1.83 0 1.86 1.86 1.82 1.92 10 5 10 25 15 30 155 50 190GR 1.97 0 1.98 1.98 1.98 1.98 5 5 10 35 20 60 230 170 255IT 0 0 1.91 1.78 0 1.98 2.5 2.5 2.5 20 7.5 37.5 117.5 27.5 170NL 1.85 0 1.88 0.92 0 0.94 10 10 10 20 20 30 105 60 115Freddie-Mac 1.91 0 1.91 1.91 1.9 1.91 10 10 10 50 30 80 340 160 360US-GovPX 0.39 0 0.39 N/A N/A N/A 5 5 20 10 10 15 N/A N/A N/ANotes: The various measures given are for April and May 2004 in the case of the MTS data, for July 2004 in the case of BrokerTec data, for April 2005 in the case of eSpeed data and for April 2004 in the case of GovPX data. The effective spread is measured as twice the difference between the transaction price and the mid-quote immediately preceding the transaction expressed as a percentage of the mid-quote (we multiply this by 100 to show it in basis points terms). The steepness is the average of steepness on each side of the orderbook. We measure steepness on each side as the difference between the 3rd worst bid/offer and the best bid/offer expressed as a percentage of the mid-point between these (we multiply this by 100 to show it in basis points terms). Trade size is based on the nominal volume being traded where transaction volume is based on a consolidated volume if trades are recorded at precisely the same time. Best liquidity is based on the average of the quoted size at the best bid and offer where we only consider the quotes immediately preceding the transactions. Total liquidity is based on the average of the total amount offered and the total amount bid in the best three quotes where we only include the quotes immediately preceding the trades.

73
Table A2.2 Medium Maturity
Panel A - Benchmark Issues Country Effective Spread Steepness Trade Size Best Liquidity Total Liquidity Median Q1 Q3 Median Q1 Q3 Median Q1 Q3 Median Q1 Q3 Median Q1 Q3 AT 1.84 0 1.93 1.87 1.81 1.94 10 10 10 30 20 50 205 110 240BE 2.02 2.01 2.02 2.02 2 2.02 10 10 10 50 30 90 310 80 350DE 1.91 0 2 2 1.91 2 10 5 10 25 20 50 200 45 210ES 1.92 0 1.95 1.95 1.9 1.96 10 10 10 40 25 75 280 60 310FI 1.86 0 2.01 1.87 1.86 2.01 10 10 10 40 20 50 260 130 290FR 1.97 0 1.99 1.99 1.95 1.99 10 10 10 35 20 60 250 60 305GR 1.78 0 1.99 1.97 1.77 1.98 10 5 10 30 20 55 220 115 255IE 2.01 1.92 3.98 2.01 1.91 2.01 10 10 10 20 20 30 115 60 115IT 1.97 0 2.03 1.99 1.97 2.04 5 5 10 35 20 60 260 102.5 345NL 2.05 2.04 2.05 2.05 2.04 2.05 10 10 10 30 20 55 200 70 200PT 1.95 1.95 1.95 1.95 1.95 1.95 10 10 10 35 20 50 235 135 255US-BrokerTec 0.78 0.77 0.79 1.58 1.57 2.36 2 1 5 19 10 33 73 52 101US-eSpeed 0 0 2.01 2.01 1.01 2.02 3 1 8 40 21 64 246 147 316US-GovPX 1.59 0.79 5.53 N/A N/A N/A 3 2 5 8 3 10 N/A N/A N/A
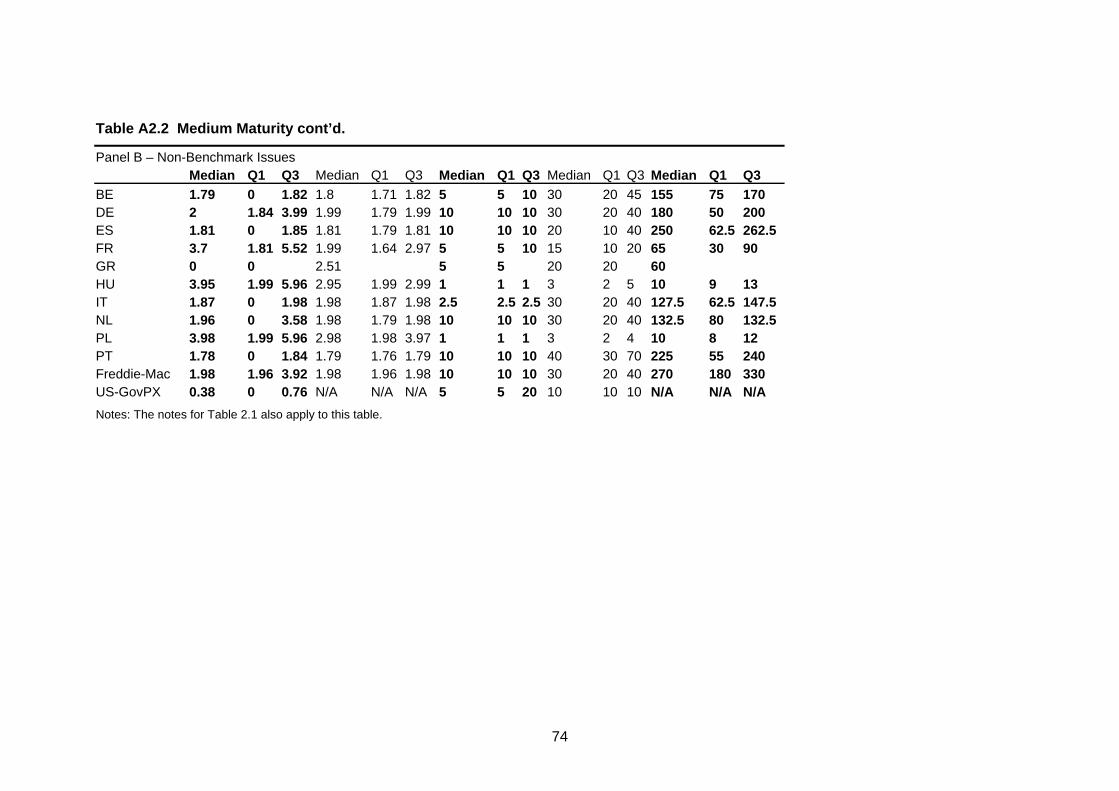
74
Table A2.2 Medium Maturity cont’d.
Panel B – Non-Benchmark Issues Median Q1 Q3 Median Q1 Q3 Median Q1 Q3 Median Q1 Q3 Median Q1 Q3 BE 1.79 0 1.82 1.8 1.71 1.82 5 5 10 30 20 45 155 75 170 DE 2 1.84 3.99 1.99 1.79 1.99 10 10 10 30 20 40 180 50 200 ES 1.81 0 1.85 1.81 1.79 1.81 10 10 10 20 10 40 250 62.5 262.5 FR 3.7 1.81 5.52 1.99 1.64 2.97 5 5 10 15 10 20 65 30 90 GR 0 0 2.51 5 5 20 20 60 HU 3.95 1.99 5.96 2.95 1.99 2.99 1 1 1 3 2 5 10 9 13 IT 1.87 0 1.98 1.98 1.87 1.98 2.5 2.5 2.5 30 20 40 127.5 62.5 147.5 NL 1.96 0 3.58 1.98 1.79 1.98 10 10 10 30 20 40 132.5 80 132.5 PL 3.98 1.99 5.96 2.98 1.98 3.97 1 1 1 3 2 4 10 8 12 PT 1.78 0 1.84 1.79 1.76 1.79 10 10 10 40 30 70 225 55 240 Freddie-Mac 1.98 1.96 3.92 1.98 1.96 1.98 10 10 10 30 20 40 270 180 330 US-GovPX 0.38 0 0.76 N/A N/A N/A 5 5 20 10 10 10 N/A N/A N/A Notes: The notes for Table 2.1 also apply to this table.
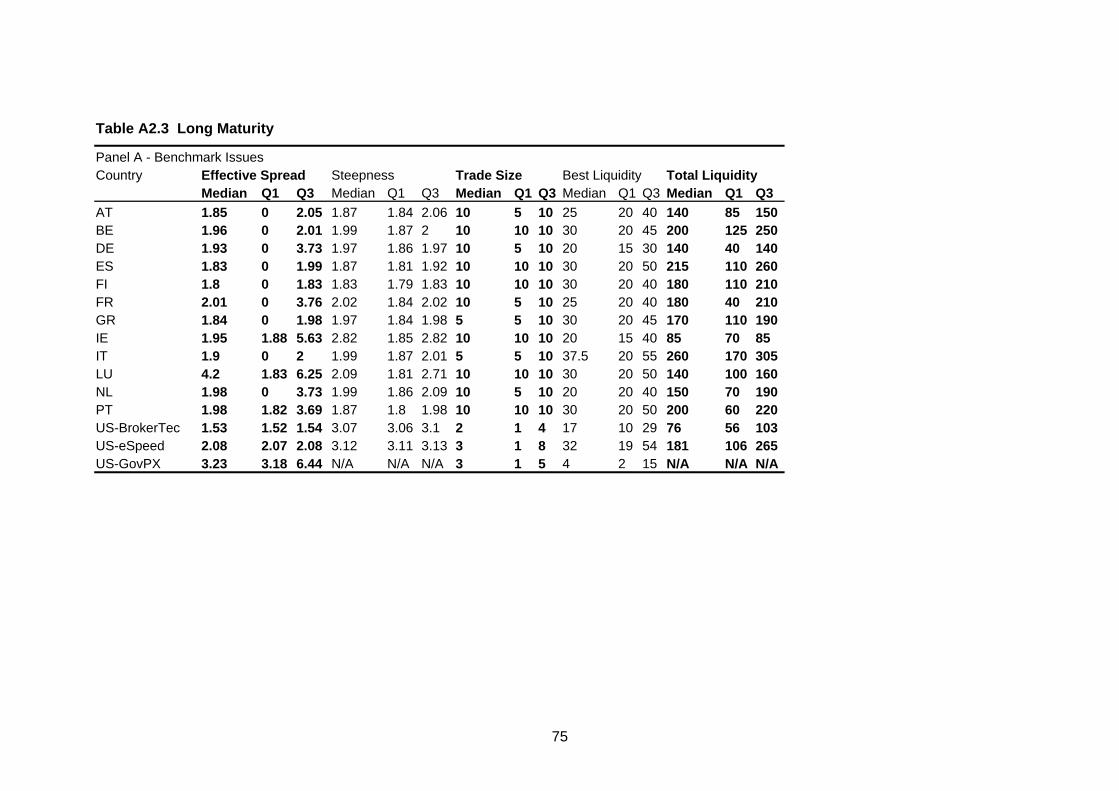
75
Table A2.3 Long Maturity
Panel A - Benchmark Issues Country Effective Spread Steepness Trade Size Best Liquidity Total Liquidity Median Q1 Q3 Median Q1 Q3 Median Q1 Q3 Median Q1 Q3 Median Q1 Q3 AT 1.85 0 2.05 1.87 1.84 2.06 10 5 10 25 20 40 140 85 150BE 1.96 0 2.01 1.99 1.87 2 10 10 10 30 20 45 200 125 250DE 1.93 0 3.73 1.97 1.86 1.97 10 5 10 20 15 30 140 40 140ES 1.83 0 1.99 1.87 1.81 1.92 10 10 10 30 20 50 215 110 260FI 1.8 0 1.83 1.83 1.79 1.83 10 10 10 30 20 40 180 110 210FR 2.01 0 3.76 2.02 1.84 2.02 10 5 10 25 20 40 180 40 210GR 1.84 0 1.98 1.97 1.84 1.98 5 5 10 30 20 45 170 110 190IE 1.95 1.88 5.63 2.82 1.85 2.82 10 10 10 20 15 40 85 70 85 IT 1.9 0 2 1.99 1.87 2.01 5 5 10 37.5 20 55 260 170 305LU 4.2 1.83 6.25 2.09 1.81 2.71 10 10 10 30 20 50 140 100 160NL 1.98 0 3.73 1.99 1.86 2.09 10 5 10 20 20 40 150 70 190PT 1.98 1.82 3.69 1.87 1.8 1.98 10 10 10 30 20 50 200 60 220US-BrokerTec 1.53 1.52 1.54 3.07 3.06 3.1 2 1 4 17 10 29 76 56 103US-eSpeed 2.08 2.07 2.08 3.12 3.11 3.13 3 1 8 32 19 54 181 106 265US-GovPX 3.23 3.18 6.44 N/A N/A N/A 3 1 5 4 2 15 N/A N/A N/A

76
Table A2.3 Long Maturity cont’d.
Panel B – Non-Benchmark Issues Median Q1 Q3 Median Q1 Q3 Median Q1 Q3 Median Q1 Q3 Median Q1 Q3 AT 1.98 0 2 1.99 1.98 2.95 10 10 10 30 20 35 120 90 145BE 1.56 1.5 4.51 2.25 1.5 4.51 5 5 5 15 12.5 20 70 30 90 DE 3.68 1.84 5.53 1.89 1.81 2.05 10 5 10 20 20 35 130 40 170ES 5.19 0 9.24 2.03 1.71 2.03 10 10 10 20 18 40 175 47 185FR 1.82 1.71 7.27 1.81 1.69 1.9 7.5 5 10 20 10 30 125 22.5 155HU 5.97 3.92 9.74 3.93 1.98 4.96 1 1 1 2 2 3 8 6 9 IT 1.98 0 1.98 1.98 1.96 1.98 2.5 2.5 5 30 20 40 97.5 15 110LT 7.87 1.97 9.89 4.95 3.94 7.87 1 1 1 2 2 3 8 7 9 PL 5.57 3.71 7.99 3.01 2 4.02 1 1 1 2 2 2 8 6 9 Freddie-Mac 3.99 3.87 6.01 1.94 1.93 2 10 10 10 30 20 40 200 100 220US-GovPX 1.48 0.74 1.48 N/A N/A N/A 5 5 11 10 10 10 N/A N/A N/A
Notes: The notes for Table 2.1 also apply to this table.

77
Table A2.4 Very Long Maturity. Panels A & B.
Panel A - Benchmark Issues Country Effective Spread Steepness Trade Size Best Liquidity Total Liquidity Median Q1 Q3 Median Q1 Q3 Median Q1 Q3 Median Q1 Q3 Median Q1 Q3 AT 5.89 1.96 8.25 2.95 1.96 3.93 5 5 5 10 10 15 40 35 50 BE 7.37 3.66 11.01 3.7 2.75 7.33 5 5 5 10 10 15 55 32.5 70 DE 8.11 6.09 12.17 2.04 2 3.6 2.5 2.5 5 10 7.5 15 50 32.5 60 ES 7.1 5.22 8.85 2.66 1.77 2.67 5 5 5 10 10 15 55 40 65 FR 4.08 2.07 8.14 2.07 2.06 3.11 5 5 5 12.5 10 15 70 47.5 95 GR 3.35 1.68 5.33 2.69 1.68 3.57 5 5 5 10 10 15 50 35 55 IT 4.01 2.03 5.39 2.08 2.02 3.03 2.5 2.5 5 10 7.5 12.5 42.5 32.5 60 NL 10.82 7.35 11.07 2.74 1.81 3.68 5 5 5 10 10 20 50 45 65 US-BrokerTec 1.55 1.53 3.1 4.57 3.06 6.1 2 1 3 8 5 12 27 21 34 US-eSpeed 1.83 1.82 3.65 2.75 2.75 3.68 1 1 2 5 3 9 38 23 53 Panel B – Non-Benchmark Issues DE 11.31 9.76 13.98 4.07 4 5.7 2.5 2.5 5 7.5 7.5 12.5 30 22.5 32.5ES 8.62 5.19 20.37 5.18 5.1 5.18 5 5 5 10 10 20 45 45 50 FR 8.53 2.76 17.48 8.23 2.06 10.8 2.5 2.5 5 7.5 5 10 20 15 25 IE 2.04 0 6.11 7.13 4.04 8.15 5 5 10 15 10 15 40 40 65 IT 3.91 1.9 7.69 2.61 1.74 3.3 2.5 2.5 5 7.5 5 10 32.5 22.5 37.5NL 5.94 0 8.9 2.97 1.48 5.22 5 5 5 10 10 10 40 35 50
Notes: The notes for Table 2.1 also apply to this table.
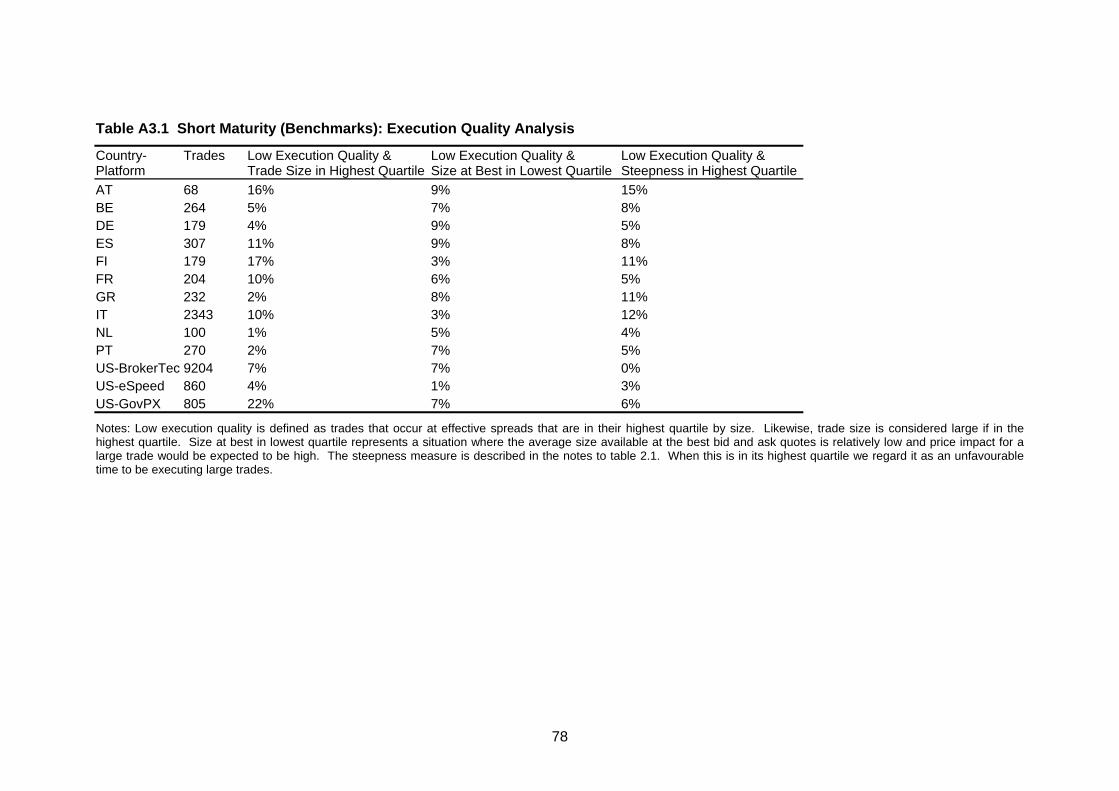
78
Table A3.1 Short Maturity (Benchmarks): Execution Quality Analysis
Country-Platform
Trades
Low Execution Quality & Trade Size in Highest Quartile
Low Execution Quality & Size at Best in Lowest Quartile
Low Execution Quality & Steepness in Highest Quartile
AT 68 16% 9% 15% BE 264 5% 7% 8% DE 179 4% 9% 5% ES 307 11% 9% 8% FI 179 17% 3% 11% FR 204 10% 6% 5% GR 232 2% 8% 11% IT 2343 10% 3% 12% NL 100 1% 5% 4% PT 270 2% 7% 5% US-BrokerTec 9204 7% 7% 0% US-eSpeed 860 4% 1% 3% US-GovPX 805 22% 7% 6%
Notes: Low execution quality is defined as trades that occur at effective spreads that are in their highest quartile by size. Likewise, trade size is considered large if in the highest quartile. Size at best in lowest quartile represents a situation where the average size available at the best bid and ask quotes is relatively low and price impact for a large trade would be expected to be high. The steepness measure is described in the notes to table 2.1. When this is in its highest quartile we regard it as an unfavourable time to be executing large trades.
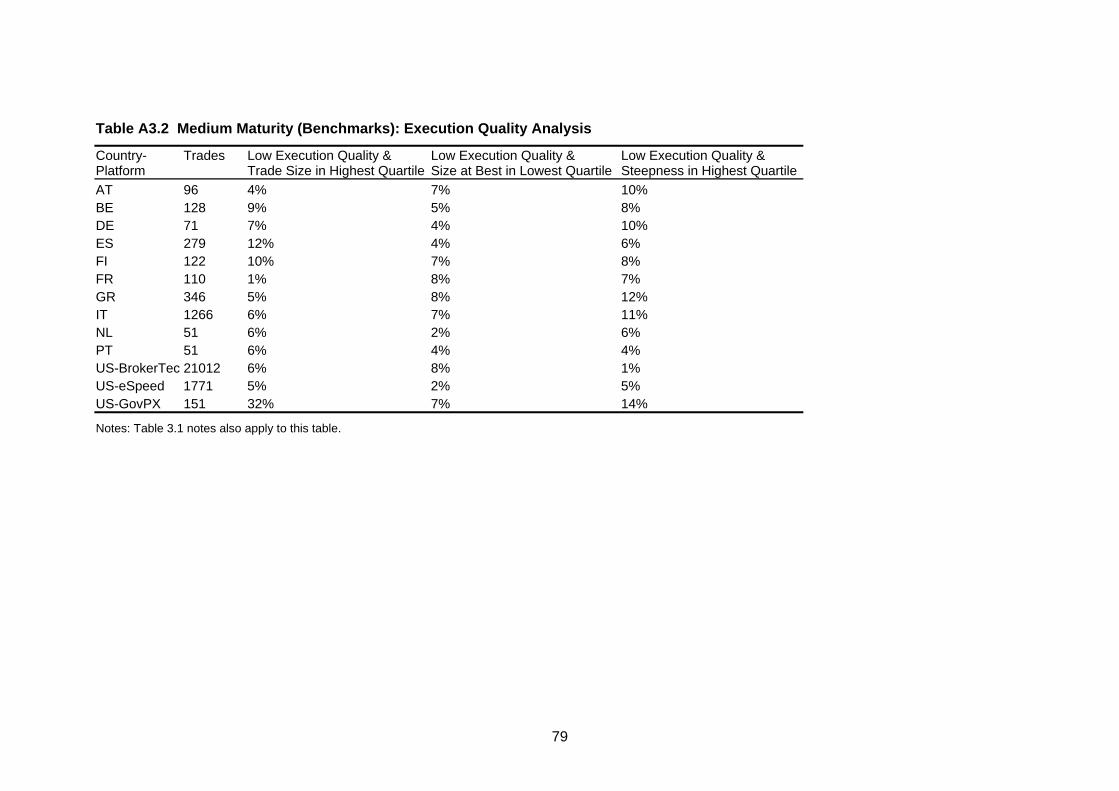
79
Table A3.2 Medium Maturity (Benchmarks): Execution Quality Analysis
Country-Platform
Trades
Low Execution Quality & Trade Size in Highest Quartile
Low Execution Quality & Size at Best in Lowest Quartile
Low Execution Quality & Steepness in Highest Quartile
AT 96 4% 7% 10% BE 128 9% 5% 8% DE 71 7% 4% 10% ES 279 12% 4% 6% FI 122 10% 7% 8% FR 110 1% 8% 7% GR 346 5% 8% 12% IT 1266 6% 7% 11% NL 51 6% 2% 6% PT 51 6% 4% 4% US-BrokerTec 21012 6% 8% 1% US-eSpeed 1771 5% 2% 5% US-GovPX 151 32% 7% 14%
Notes: Table 3.1 notes also apply to this table.
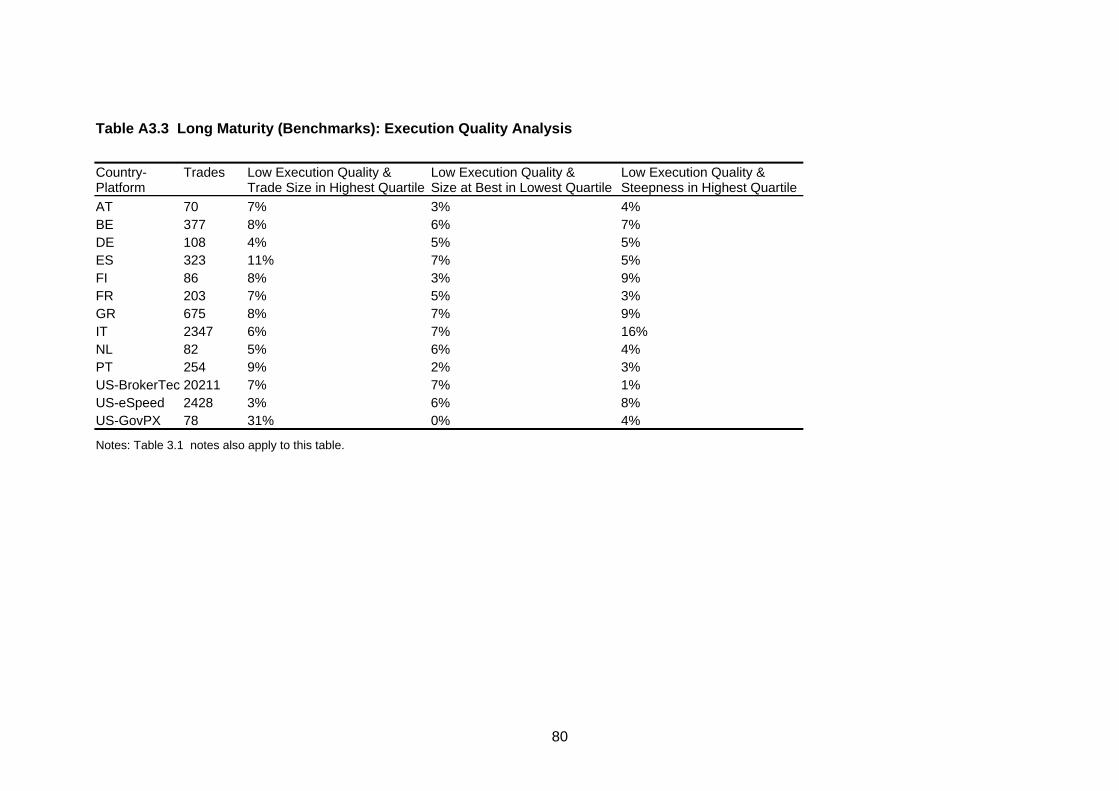
80
Table A3.3 Long Maturity (Benchmarks): Execution Quality Analysis Country-Platform
Trades
Low Execution Quality & Trade Size in Highest Quartile
Low Execution Quality & Size at Best in Lowest Quartile
Low Execution Quality & Steepness in Highest Quartile
AT 70 7% 3% 4% BE 377 8% 6% 7% DE 108 4% 5% 5% ES 323 11% 7% 5% FI 86 8% 3% 9% FR 203 7% 5% 3% GR 675 8% 7% 9% IT 2347 6% 7% 16% NL 82 5% 6% 4% PT 254 9% 2% 3% US-BrokerTec 20211 7% 7% 1% US-eSpeed 2428 3% 6% 8% US-GovPX 78 31% 0% 4%
Notes: Table 3.1 notes also apply to this table.
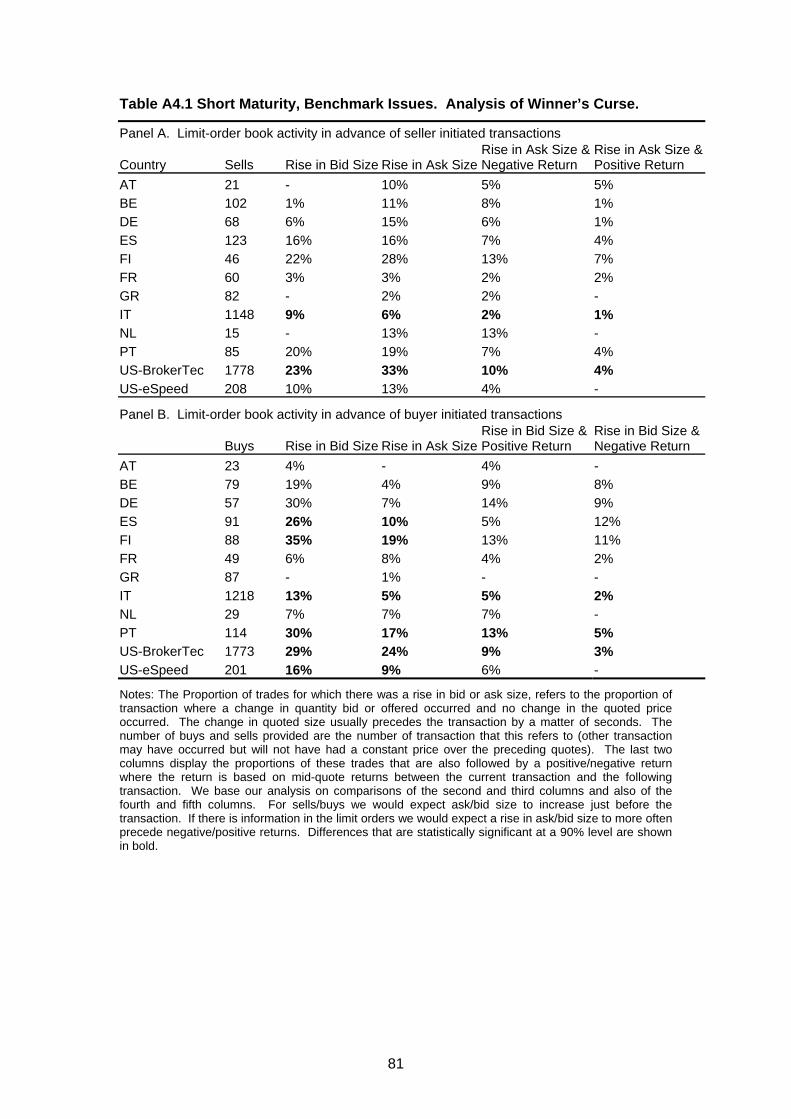
81
Table A4.1 Short Maturity, Benchmark Issues. Analysis of Winner’s Curse.
Panel A. Limit-order book activity in advance of seller initiated transactions
Country Sells Rise in Bid Size Rise in Ask SizeRise in Ask Size & Negative Return
Rise in Ask Size &Positive Return
AT 21 - 10% 5% 5% BE 102 1% 11% 8% 1% DE 68 6% 15% 6% 1% ES 123 16% 16% 7% 4% FI 46 22% 28% 13% 7% FR 60 3% 3% 2% 2% GR 82 - 2% 2% - IT 1148 9% 6% 2% 1% NL 15 - 13% 13% - PT 85 20% 19% 7% 4% US-BrokerTec 1778 23% 33% 10% 4% US-eSpeed 208 10% 13% 4% -
Panel B. Limit-order book activity in advance of buyer initiated transactions
Buys Rise in Bid Size Rise in Ask SizeRise in Bid Size & Positive Return
Rise in Bid Size &Negative Return
AT 23 4% - 4% - BE 79 19% 4% 9% 8% DE 57 30% 7% 14% 9% ES 91 26% 10% 5% 12% FI 88 35% 19% 13% 11% FR 49 6% 8% 4% 2% GR 87 - 1% - - IT 1218 13% 5% 5% 2% NL 29 7% 7% 7% - PT 114 30% 17% 13% 5% US-BrokerTec 1773 29% 24% 9% 3% US-eSpeed 201 16% 9% 6% -
Notes: The Proportion of trades for which there was a rise in bid or ask size, refers to the proportion of transaction where a change in quantity bid or offered occurred and no change in the quoted price occurred. The change in quoted size usually precedes the transaction by a matter of seconds. The number of buys and sells provided are the number of transaction that this refers to (other transaction may have occurred but will not have had a constant price over the preceding quotes). The last two columns display the proportions of these trades that are also followed by a positive/negative return where the return is based on mid-quote returns between the current transaction and the following transaction. We base our analysis on comparisons of the second and third columns and also of the fourth and fifth columns. For sells/buys we would expect ask/bid size to increase just before the transaction. If there is information in the limit orders we would expect a rise in ask/bid size to more often precede negative/positive returns. Differences that are statistically significant at a 90% level are shown in bold.

82
Table A4.2 Medium Maturity, Benchmark Issues, Analysis of Winner’s Curse
Panel A. Limit-order book activity in advance of seller initiated transactions
Country Sells Rise in Bid Size Rise in Ask SizeRise in Ask Size & Negative Return
Rise in Ask Size &Positive Return
BE 28 4% 11% 7% - DE 28 4% 14% 7% 4% ES 59 7% 29% 10% 10% FI 34 6% 3% 3% - FR 41 12% 5% 2% - GR 118 - - - - IT 365 10% 23% 10% 6% NL 6 - 17% 17% - PT 11 27% 45% 27% - US-BrokerTec 3332 18% 29% 10% 4% US-eSpeed 493 6% 17% 7% -
Panel B. Limit-order book activity in advance of buyer initiated transactions
Buys Rise in Bid Size Rise in Ask SizeRise in Bid Size & Positive Return
Rise in Bid Size &Negative Return
BE 52 25% 2% 8% 13% DE 32 13% 13% - 6% ES 108 12% 6% 6% 6% FI 40 3% 5% 3% - FR 21 - 5% - - GR 115 2% 1% 1% 1% IT 523 19% 12% 8% 4% LU 59 2% 2% 2% - NL 14 21% - 14% 7% PT 11 18% 36% 9% - US-BrokerTec 3297 27% 19% 10% 3% US-eSpeed 454 15% 4% 6% -
Notes: Notes for Table 4.1 also apply to this table. Differences that are statistically significant at a 90% level are shown in bold.
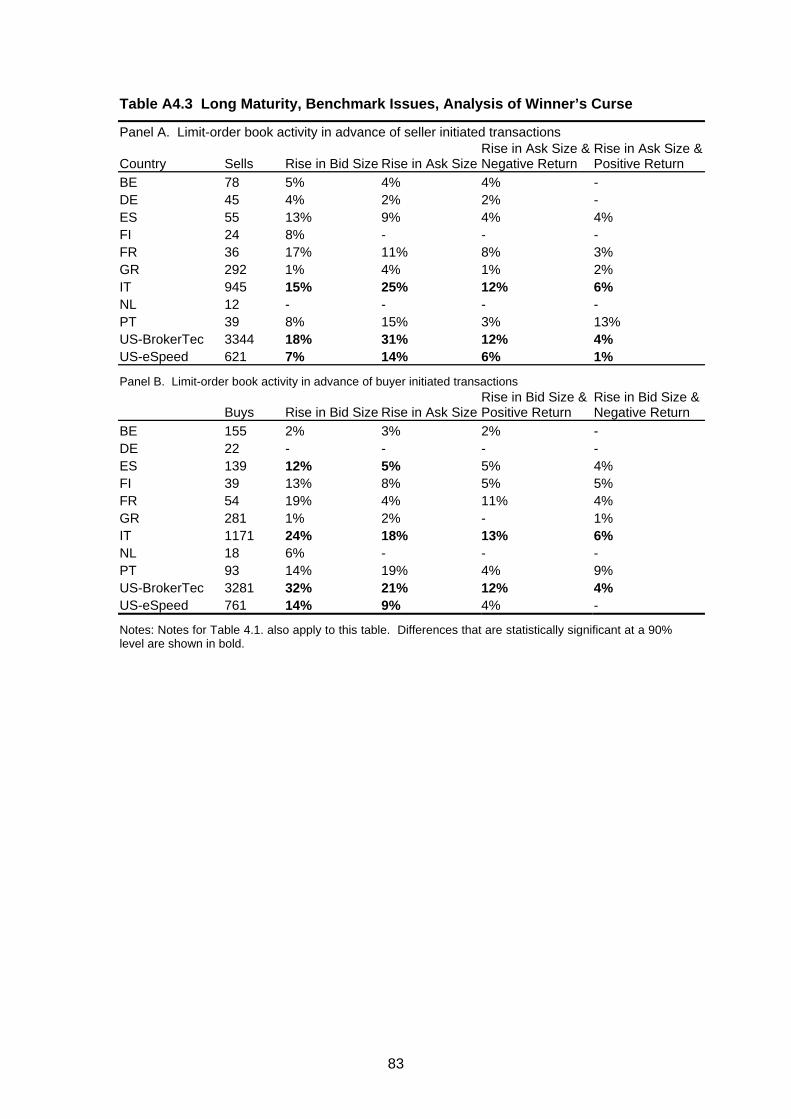
83
Table A4.3 Long Maturity, Benchmark Issues, Analysis of Winner’s Curse
Panel A. Limit-order book activity in advance of seller initiated transactions
Country Sells Rise in Bid Size Rise in Ask SizeRise in Ask Size & Negative Return
Rise in Ask Size &Positive Return
BE 78 5% 4% 4% - DE 45 4% 2% 2% - ES 55 13% 9% 4% 4% FI 24 8% - - - FR 36 17% 11% 8% 3% GR 292 1% 4% 1% 2% IT 945 15% 25% 12% 6% NL 12 - - - - PT 39 8% 15% 3% 13% US-BrokerTec 3344 18% 31% 12% 4% US-eSpeed 621 7% 14% 6% 1%
Panel B. Limit-order book activity in advance of buyer initiated transactions
Buys Rise in Bid Size Rise in Ask SizeRise in Bid Size & Positive Return
Rise in Bid Size &Negative Return
BE 155 2% 3% 2% - DE 22 - - - - ES 139 12% 5% 5% 4% FI 39 13% 8% 5% 5% FR 54 19% 4% 11% 4% GR 281 1% 2% - 1% IT 1171 24% 18% 13% 6% NL 18 6% - - - PT 93 14% 19% 4% 9% US-BrokerTec 3281 32% 21% 12% 4% US-eSpeed 761 14% 9% 4% -
Notes: Notes for Table 4.1. also apply to this table. Differences that are statistically significant at a 90% level are shown in bold.

84
Appendix 2
Institutions interviewed Agence France Trésor, Paris AKK Government Debt Management Agency, Budapest BNP Paribas, London Barclays Capital, London Barclays Global Investors Ltd, London Central Bank & Financial Services Authority of Ireland, Dublin Credit Suisse Securities (Europe), London Deutsche Bank AG, London Dresdner Kleinwort Wasserstein, London EuroMTS, London European Central Bank, Frankfurt European Investment Bank, Luxembourg Fidelity Investments International, London Hellenic Republic Ministry of Finance (Public Debt Division), Athens HSBC Bank, London ICAP, London Italian Treasury and DMO, Rome MarketAxess, London Morgan Stanley & Co International, London National Bank of Greece, Treasury Division, Athens National Treasury Management Agency, Dublin Newton Investment Management Ltd, London Norges Bank, Oslo OTP Bank, Budapest Threadneedle Investments, London TradeWeb, London

85
Appendix 3
Commissioning bodies The Association of British Insurers (ABI) represents the UK insurance industry. Its members include large institutional investors controlling funds worth some €1,600bn, including large holdings of corporate bonds. Website: www.abi.org.uk The City of London Corporation provides local government services for the City of London. It is committed to maintaining and enhancing the status of the City as the world's leading international financial and business centre through its policies and services. Website: www.cityoflondon.gov.uk The European Primary Dealers Association (EPDA) represents primary dealers in the euro zone government bond market. The EPDA is an affiliate of the Bond Market Association. Website: www.bondmarkets.com The International Capital Market Association (ICMA) represents financial institutions active in the international capital markets, with over 400 member firms drawn from some 50 countries. Website: www.icma-group.org The Investment Management Association (IMA) represents the UK asset management industry. Its members include independent fund managers, the asset management arms of retail banks, life insurers, investment banks and occupational pension scheme managers. Website: www.investmentuk.org The London Investment Banking Association (LIBA) is the principal trade association for firms active in the investment banking and securities industry, including the major international investment banks which base their European operations in London. Website: www.liba.org.uk The research was commissioned from: The Centre for Economic Policy Research (CEPR) is a network of Research Fellows who conduct research on issues affecting the European economy; the Centre's research includes open economy macroeconomics, international trade, financial economics, labour economics, industrial organization, public policy, and economic institutions. Website: www.cepr.org

The City of London Corporation
The City of London is exceptional in many ways,not least in that it has a dedicated local authoritycommitted to enhancing its status on the worldstage. The smooth running of the City’s businessrelies on the web of high quality services that theCity of London Corporation provides.
Older than Parliament itself, the City of LondonCorporation has centuries of proven success inprotecting the City’s interests, whether it bepolicing and cleaning its streets or in identifyinginternational opportunities for economic growth.It is also able to promote the City in a unique andpowerful way through the Lord Mayor of London,a respected ambassador for financial services who takes the City’s credentials to a remarkablywide and influential audience.
Alongside its promotion of the businesscommunity, the City of London Corporation has ahost of responsibilities which extend far beyondthe City boundaries. It runs the internationallyrenowned Barbican Arts Centre; it is the porthealth authority for the whole of the Thamesestuary; it manages a portfolio of propertythroughout the capital, and it owns and protects10,000 acres of open space in and around it.
The City of London Corporation, however, neverloses sight of its primary role – the sustained andexpert promotion of the ‘City’, a byword forstrength and stability, innovation and flexibility –and it seeks to perpetuate the City’s position as aglobal business leader into the new century.