european fund market mid year review 2015
TRANSCRIPT

MID-YEAR REVIEW 2015
EUROPEAN FUND MARKETDATA DIGEST

2
JAN-JUN 2015EUROPEAN FUND MARKET REVIEW—MID-YEAR REVIEW 2015
broadridge.com
No part of this document may be distributed, reporduced or posted without the express written premission of Broadridge Financial Solutions, Inc.
©2015 Broadridge Financial Solutions, Inc. Broadrdige and the Broadridge logo are registered tradmarks of Broadridge Financial Solutions, Inc.
AUTHOR INFORMATIONJérôme CouteurProduct Manager, [email protected]
Barbara FerraresiProduct Manager, [email protected]
Diana [email protected]
Broadridge Databases Featured:FundFileSalesWatch
Kalie HewittGraphics [email protected]
ABOUT BROADRIDGEBroadridge Financial Solutions, Inc. (NYSE:BR) is the leading provider of investor communications and technology-driven solutions for broker-dealers, banks, mutual funds and corporate issuers globally. Broadridge’s investor communications, securities processing and managed services solutions help clients reduce their capital investments in operations infrastructure, allowing them to increase their focus on core business activities. With over 50 years of experience, Broadridge’s infrastructure underpins proxy voting services for over 90% of public companies and mutual funds in North America, and processes on average $5 trillion in equity and fixed income trades per day. Broadridge employs approximately 7,400 full-time associates in 14 countries.
For more information about Broadridge, please visit www.broadridge.com.

3
JAN-JUN 2015 EUROPEAN FUND MARKET REVIEW—MID-YEAR REVIEW 2015
broadridge.com
OVERVIEWEurope was marked by fair weather and foul in the first half of 2015. On the upside Mario Draghi delivered a new round of quantitative easing, which was given sufficient advance airing to enable institutions and sophisticated investors to assign new money to the sectors most likely to benefit, namely Euro-denominated bonds. But umbrellas went up in May as clouds gathered around the possibility of Grexit, and impending rate rises in the US. Net sales of European retail funds responded in kind, soaring to their best levels on record (€80bn) in April, before falling to €4bn in May and then diving into redemption in June (-€25bn). By the end of the first half overall net flows were solid at €227bn but 14% down on the same period last year.
The mid-year slump that hit sales totals contained one important element of normality. This was the typical French liquidity cycle in which investors, mainly corporate treasurers, redeem their money market holdings to fund tax payments. Some €28bn was withdrawn from these funds as the first half ended, of which France was responsible for 75%. Excluding this customary money market distortion, the fund scene looked less dyspeptic with June reverting to diminutive inflows of €3bn. With or without money market funds, 2015 has so far been a slightly less spirited year for European asset managers than 2014.
Nonetheless, there will be few complaints from players with a strategic focus on mixed asset products. This asset class has been Europe’s outstanding success story, and one that seems to be resilient to all the economic headwinds that have dampened investment appetite. By the end of June these funds had registered net sales of €124bn, a figure that is just 5% off the record-breaking full-year total reached in 2014. Retail savers searching for yield have been the main driver of this extraordinary growth, helped along by their local bank providers. Funds of funds are an extension of the same dynamic and this is another sector that has witnessed exceptional growth, their first six-months’ inflows into open architecture products (€58bn) beating all previous full-year totals.
Despite fund selectors viewing equities and particularly European equities as offering greater value than most other sectors, investors have been reluctant to step much further up the risk ladder than mixed asset funds. Net inflows into stock funds have been slack to say the least. At €26bn for the first six months, including ETFs and those with passive strategies, equity funds remain 60% off their position in the equivalent period last year. There may be little new money streaming into equities but there seems to be plenty of movement between equity sectors. European equities ranked as the fourth-strongest sector, seemingly benefiting from investors cashing in their US stock funds and, increasingly, emerging markets.
The active/passive struggleNews stories abound in the battle for assets being fought between active fund managers and those in the expanding passive space. The reality is that in Europe passive funds still account for just 14% of total assets under management and ETFs for little more than 6%. However, their proportion of net sales is much larger and seems to be rising. So far this year passive funds have accounted for 25% of all net inflows, making it their second consecutive year of rising sales share. Within the passive segment, ETF sales are slightly above the traditional passive fund take but they are far from dictating the story line.
Pricing pressure is undoubtedly building in Europe and in those markets where a full commission-ban has been implemented the low-cost passive options have built considerable traction. However, until such restrictions are Europe-wide the appetite for actively managed funds remains overpowering. The current popularity of mixed asset funds is linked to the relative containment of passive success. Passive products in this arena are rare and as long as this remains the case, the index trackers will remain in the background.
Market successThe standard market rankings show cross-border groups, sourcing assets from multiple markets, as the most muscular in terms of sales generation. But which are the most promising markets, taking account of both foreign and domestic sales share? So far this year, according to Broadridge’s benchmarking service, SalesWatch, Italy continues to be the must-go-to market for cross-border players. With net sales of over €50bn so far this year, foreign groups have been responsible for 41%. But Spain has probably been more interesting. The strategic decision by local banks to feature third-party funds of funds has led to money being transferred from local single products, and heavily supplemented by substantial investment in foreign third-party products. Volumes for foreign groups remain below those of Italy but they seem to be catching up fast. Germany has also, finally, re-surfaced from the financial crisis and now ranks third in terms of sales success with foreign and local activity combined.
Competitor successWith retail investors hungry for funds those groups with high brand recognition or captive clients have had a good half year. BlackRock has scored the largest volume of inflows, standing head and shoulders above all its cross-border rivals, but Italy’s Intesa Sanpaolo, having successfully pioneered a range of mixed asset target maturity funds for its clients, is developing a strong head of steam. There is, though, a long tail of groups that have enjoyed inflows during the course of the year so concentration of business into the hands of a low number of groups is not a threat that should concern smaller players.
Diana MackayCEO Mackay Williams LLP
KEY DATA:TOTAL # OF MASTER GROUPS ........................................................ 1,874TOTAL # OF COMPANIES ................................................................ 2,734TOTAL # OF FUNDS ....................................................................... 34,982FUND LAUNCHES............................................................................... 985FUND CLOSURES ............................................................................ 1,376TOTAL NET ASSETS (JUNE 2015) ............................................. €8,222BNASSET GROWTH (YTD 2015) ....................................................... €801BNESTIMATED NET SALES (YTD 2015) ..........................................€226.7BNESTIMATED NET SALES (Q1 2015) ........................................... €168.6BNESTIMATED NET SALES (Q2 2015) ............................................€58.11BN

4
JAN-JUN 2015EUROPEAN FUND MARKET REVIEW—MID-YEAR REVIEW 2015
broadridge.com
OVERVIEW
FIGURE 2 GLOBAL NET SALES YTD 2015 (€M)
-150,000
-100,000
-50,000
0
50,000
100,000
150,000
200,000
250,000
300,000
USA Europe Asia Pacific Latin America MEA
Bond Equity Mixed Assets Money Market Other
-100,000
-50,000
0
50,000
100,000
150,000
200,000
250,000
YTD 2015 Jan 2015 Feb 2015 Mar 2015 Apr 2015 May 2015 Jun 2015
Bond Equity Mixed Assets Money Market Other
FIGURE 1 EUROPEAN NET SALES YTD 2015 (€M)
5
JAN-JUN 2015 EUROPEAN FUND MARKET REVIEW—MID-YEAR REVIEW 2015
broadridge.com
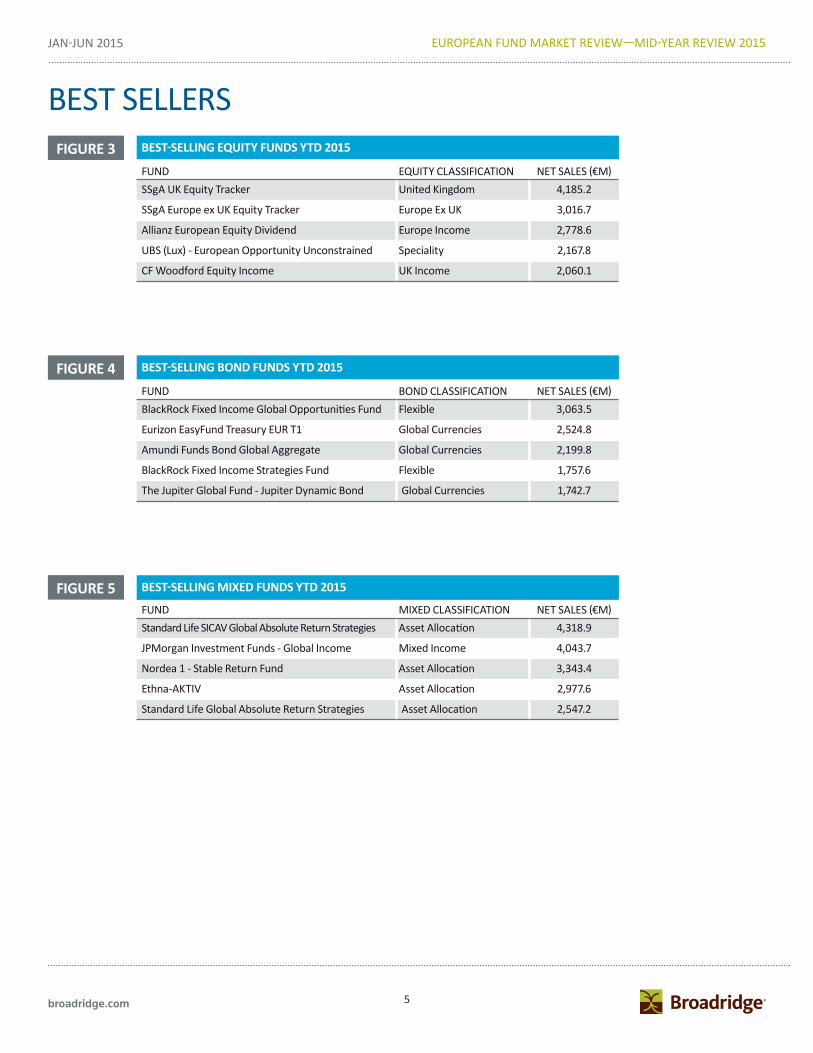
BEST-SELLING EQUITY FUNDS YTD 2015
FUND EQUITY CLASSIFICATION NET SALES (€M)SSgA UK Equity Tracker United Kingdom 4,185.2
SSgA Europe ex UK Equity Tracker Europe Ex UK 3,016.7
Allianz European Equity Dividend Europe Income 2,778.6
UBS (Lux) - European Opportunity Unconstrained Speciality 2,167.8
CF Woodford Equity Income UK Income 2,060.1
FIGURE 4
BEST SELLERSFIGURE 3
FIGURE 5
BEST-SELLING BOND FUNDS YTD 2015
FUND BOND CLASSIFICATION NET SALES (€M)BlackRock Fixed Income Global Opportunities Fund Flexible 3,063.5
Eurizon EasyFund Treasury EUR T1 Global Currencies 2,524.8
Amundi Funds Bond Global Aggregate Global Currencies 2,199.8
BlackRock Fixed Income Strategies Fund Flexible 1,757.6
The Jupiter Global Fund - Jupiter Dynamic Bond Global Currencies 1,742.7
BEST-SELLING MIXED FUNDS YTD 2015
FUND MIXED CLASSIFICATION NET SALES (€M)Standard Life SICAV Global Absolute Return Strategies Asset Allocation 4,318.9
JPMorgan Investment Funds - Global Income Mixed Income 4,043.7
Nordea 1 - Stable Return Fund Asset Allocation 3,343.4
Ethna-AKTIV Asset Allocation 2,977.6
Standard Life Global Absolute Return Strategies Asset Allocation 2,547.2

6
JAN-JUN 2015EUROPEAN FUND MARKET REVIEW—MID-YEAR REVIEW 2015
broadridge.com
EUROPEAN SALESFIGURE 6 EUROPEAN MARKET RANKING BY ESTIMATED NET SALES YTD 2015 (€M)
RANK FUND MARKET BOND COMMODITY EQUITY MIXED MM MM ENH PROPERTY OTHER TOTAL1 International 56,962.4 2,019.9 30,900.9 48,092.1 -7,672.1 133.7 190.7 -2,938.8 127,689.0 2 Italy 3,675.2 53.1 244.7 27,346.3 201.4 -366.7 -1,402.7 29,751.3 3 Germany 3,786.4 242.7 -1,541.1 14,835.1 -900.2 623.4 1,013.0 626.1 18,685.3 4 France 3,057.8 -114.2 -3,906.4 5,666.8 10,213.0 3,225.2 - -1,590.0 16,552.2 5 Switzerland 3,976.2 71.7 4,925.6 2,760.3 -970.3 -77.3 -46.3 274.2 10,914.1 6 Sweden 980.5 - -1,165.9 1,286.6 1,532.3 - - 3,373.0 6,006.5 7 Belgium -1,532.4 401.9 1,048.7 4,333.5 3,285.9 40.4 - -1,615.2 5,962.7 8 United Kingdom -3,398.5 0.1 -4,794.6 9,322.2 2,329.3 -28.4 2,016.8 -110.8 5,336.0 9 Netherlands 424.1 41.1 2,616.1 88.0 44.4 - - 188.8 3,402.4
10 Greece 17.1 - -6.8 30.9 1,688.6 -2.5 - -73.0 1,654.3 11 Poland -186.2 4.6 439.6 236.4 494.2 0.2 - 66.1 1,055.0 12 Norway 2,388.0 - -2,121.1 178.3 467.9 - - 33.9 946.9 13 Finland 427.9 -3.7 -614.5 113.9 834.0 201.1 101.1 -216.5 843.2 14 Denmark 2,495.1 - -1,756.1 323.9 -193.7 2.4 - -35.5 836.1 15 Austria 487.3 21.8 -280.8 525.3 -74.2 -3.2 326.8 -202.0 800.9 16 Croatia 274.3 - 20.5 60.2 129.5 - - -0.0 484.5 17 Czech Republic 123.2 -0.3 -47.0 227.7 -52.5 -0.5 54.7 18.6 323.8 18 Romania 86.8 - 8.6 99.9 89.2 -2.1 - 37.6 320.0 19 Turkey 176.9 -43.9 20.1 101.8 -16.8 - -0.0 33.4 271.7 20 Slovenia 11.9 - 76.7 22.9 17.2 - 0.7 - 129.4 21 Slovakia 3.1 3.8 -15.0 184.6 -143.8 0.7 8.4 -1.6 40.3 22 Malta 48.4 - 5.1 22.2 -43.7 -1.7 -1.4 -8.3 20.5 23 Bulgaria 4.5 0.1 6.5 3.9 2.7 0.3 - 0.0 18.0 24 Luxembourg -5.4 - 13.4 -3.0 - - - - 5.0 25 Ukraine - -0.0 -0.2 0.0 - - - -0.2 26 Lithuania 1.5 - 0.3 -0.3 - -5.0 - -1.2 -4.7 27 Liechtenstein -40.0 - 8.4 11.2 - -0.0 - 13.6 -6.8 28 Estonia -2.9 - -11.5 - - - - - -14.4 29 Latvia -0.3 - 0.3 4.4 -24.7 - - - -20.2 30 Russia -29.3 2.8 -48.6 9.3 -0.9 - - -0.3 -66.9 31 Hungary 26.3 -0.1 9.2 169.7 -513.2 -9.2 -40.6 -87.4 -445.3 32 Portugal -140.9 - 16.5 12.7 -276.6 - -76.3 -1.7 -466.4 33 Spain -5,799.5 -1.6 1,996.8 7,851.6 -2,190.4 -52.3 -0.8 -6,117.4 -4,313.5
TOTAL EUROPE 68,299.6 2,699.8 26,048.5 123,918.1 8,256.6 3,678.6 3,546.6 -9,736.8 226,710.9

7
JAN-JUN 2015 EUROPEAN FUND MARKET REVIEW—MID-YEAR REVIEW 2015
broadridge.com
FIGURE 7 TOP 25 SECTORS IN EUROPE (€M)
FIGURE 8 TOP AND BOTTOM FIVE SECTORS BY SALES YTD 2015 (€M)
ALL SECTOR RANKING
RANK FUND SECTOR ENS YTD 20151 Asset Allocation 63,750.7 2 Fund of Funds Conservative 25,378.0 3 Mixed Assets Balanced 19,918.1 4 Equities Europe 19,566.3 5 Mixed Assets Conservative 19,495.9 6 Bonds Global Currencies 19,115.1 7 Mixed Assets Income 16,814.9 8 Fund of Funds Balanced 16,311.8 9 Fund of Funds Asset Allocation 14,627.0
10 Equities Speciality 11,574.1 11 Equities Euroland 10,829.2 12 Bonds EUR Corp. Inv. Grade 9,421.5 13 Equities Japan 8,131.4 14 Equities Europe Income 7,670.7 15 Fund of Funds Bonds 7,213.9 16 Equities Europe Ex UK 6,411.3 17 Bonds EUR Corp. High Yield 6,034.8 18 Bonds Global Corporates 5,805.9 19 Bonds USD Corp. Inv. Grade 5,432.1 20 Bonds Flexible 5,088.1 21 Bonds Emerging Markets 4,751.0 22 Bonds European Currencies Corp. High Yield 4,503.8 23 Short Term Dynamic 4,105.2 24 Convertible Bonds & Options 4,047.2 25 Real Estate 3,546.6
REST -23,664.3 TOTAL 295,880.5
-30,000 -20,000 -10,000
010,00020,00030,00040,00050,00060,00070,000
Asset Alloc FF Cons Mix Bal Eq Europe Mix Cons Targ MatEuroland
Derivatives Eq Em Mkt Guarant'd Eq Nth Am

8
JAN-JUN 2015EUROPEAN FUND MARKET REVIEW—MID-YEAR REVIEW 2015
broadridge.com
Bnd Eur CIGGuarant'dBnd Eur
Targ Mat Euroland
Eq Speciality
Derivatives Mix Cons
Mix IncomeBnd Flex
Eq China Eq Euroland
Eq UK Inc Bnd Gl CurrMix BalEq Japan
Eq Em Mkt
Asset Alloc
Eq UK
Eq Nth Am
Eq Europe
Eq Global
-10,000
0
10,000
20,000
30,000
40,000
50,000
60,000
70,000
-30,000 -20,000 -10,000 0 10,000 20,000 30,000 40,000 50,000 60,000 70,000
Sales contribution (€m)
Perf
orm
ance
cont
ribut
ion
(€m
)FIGURE 9 SECTOR POSITIONING BY SALES AND PERFORMANCE CONTRIBUTION TO
ASSET GROWTH YTD 2015 (€M)
Note: Excludes money market funds.

9
JAN-JUN 2015 EUROPEAN FUND MARKET REVIEW—MID-YEAR REVIEW 2015
broadridge.com
Top 535%
6-1527%
16-2518%
Rest20%
RANK MASTER GROUP NAT # FUNDS ENS YTD 20151 BlackRock US 473 24,485.5 2 Intesa SP IT 514 17,706.3 3 UBS CH 639 12,447.2 4 DeAWM DE 754 10,810.8 5 State Street US 162 10,206.2 6 Allianz GI DE 407 7,330.4 7 Nordea SE 244 6,430.8 8 VR/Union DE 434 6,255.2 9 JP Morgan US 200 6,254.4
10 Soc Gen/Lyxor FR 310 5,764.5 11 Standard Life GB 113 5,742.7 12 Pioneer IT 426 5,409.6 13 Vanguard US 47 5,362.0 14 Invesco US 149 5,209.0 15 Cr Suisse CH 340 4,882.6 16 ANIMA IT 141 4,749.1 17 Amundi FR 568 4,662.5 18 Fidelity US 225 4,324.3 19 New York Life / Candriam US 146 4,159.6 20 GAM Holding CH 252 4,091.3 21 Henderson Global GB 84 3,944.1 22 ETHENEA LU 3 3,229.7 23 UBP CH 82 3,162.6 24 BNP Paribas FR 861 3,053.6 25 Northern Trust US 13 2,984.9
TOP 25 7,587 172,658.9 REST 20,587 42,116.8 TOTAL 28,174 214,775.7
FIGURE 10
FIGURE 11
TOP EUROPEAN MASTER GROUPS BY SALES YTD 2015 (€M)
MARKET SHARE OF LEADING MASTER GROUPS BY SALES YTD 2015 (€M)
PAN-EUROPEAN MASTER GROUPS SALES
Note: Excludes money market funds.

10
JAN-JUN 2015EUROPEAN FUND MARKET REVIEW—MID-YEAR REVIEW 2015
broadridge.com
Top 2529%
26-5016%
Rest55%
FIGURE 12
FIGURE 13
TOP 25 FUNDS BY ESTIMATED NET SALES YTD 2015 (€M)
MARKET SHARE OF BEST-SELLING 25 FUNDS
PAN-EUROPEAN FUND LEADERS SALES
RANK MASTER GROUP NAT FUND NAME DOMICILE LAUNCH DATE TYPE ENS YTD 20151 Standard Life GB Standard Life SICAV Global Absolute Return Strategies LU Jan-11 Mix 4,318.9 2 State Street US SSgA UK Equity Tracker UK Apr-05 Eq 4,185.2 3 JP Morgan US JPMorgan Investment Funds - Global Income LU Dec-08 Mix 4,043.7 4 Nordea SE Nordea 1 - Stable Return Fund LU Nov-05 Mix 3,343.4 5 BlackRock US BlackRock Fixed Income Global Opportunities Fund LU Jan-07 Bnd 3,063.5 6 State Street US SSgA Europe ex UK Equity Tracker UK Nov-06 Eq 3,016.7 7 ETHENEA LU Ethna-AKTIV LU Oct-01 Mix 2,977.6 8 Allianz GI DE Allianz European Equity Dividend LU Mar-09 Eq 2,778.6 9 Standard Life GB Standard Life Global Absolute Return Strategies UK Jan-08 Mix 2,547.2
10 Intesa SP IT Eurizon EasyFund Treasury EUR T1 LU Mar-15 Bnd 2,524.8 11 Amundi FR Amundi Funds Bond Global Aggregate LU Oct-07 Bnd 2,199.8 12 UBS CH UBS (Lux) European Opportunity Unconstrained LU Nov-10 Eq 2,167.8 13 Invesco US Invesco Perpetual Global Targeted Returns UK Sep-13 Mix 2,155.7 14 Carmignac FR Carmignac Patrimoine FR Jan-92 Mix 2,085.5 15 Woodford GB CF Woodford Equity Income UK Jun-14 Eq 2,060.1 16 Amundi FR Amundi Patrimoine FR Feb-12 Mix 2,028.1 17 Generali IT FORTUNA INVEST - Risk Control CH Sep-14 Mix 1,993.4 18 Allianz GI DE Allianz Income and Growth LU Jun-11 Mix 1,924.0 19 BlackRock US BlackRock - European Equity Income LU Dec-10 Eq 1,820.0 20 MFS US MFS Meridian - European Value Fund LU Oct-02 Eq 1,813.6 21 VR/Union DE PrivatFonds: Kontrolliert DE Jul-10 Mix 1,782.1 22 BlackRock US BlackRock Fixed Income Strategies Fund LU Sep-09 Bnd 1,757.6 23 Jupiter GB The Jupiter Global Fund - Jupiter Dynamic Bond LU May-12 Bnd 1,742.7 24 JP Morgan US JPMorgan Funds - Managed Reserves Fund LU Jun-10 Bnd 1,650.8 25 HSBC GB HSBC GIF-Global Emerging Markets Bond LU Jun-99 Bnd 1,636.6
TOTAL TOP 25 61,617.4 REST 153,158.4 TOTAL 214,775.7
Note: Excludes money market funds.

11
JAN-JUN 2015 EUROPEAN FUND MARKET REVIEW—MID-YEAR REVIEW 2015
broadridge.com
PRODUCT THEMES
FIGURE 14
FIGURE 15
TOP 10 MASTER GROUPS BY SALES YTD 2015 (€M)
TOP 10 FUNDS BY SALES YTD 2015 (€M)
RANK MASTER GROUPS NAT ASSETS JUNE 2015 ENS YTD 20151 BlackRock US 202,678.9 10,551.5 2 Soc Gen/Lyxor FR 46,918.4 5,204.8 3 DeAWM DE 52,936.7 4,687.9 4 UBS CH 22,961.7 3,930.1 5 State Street US 14,679.8 1,968.6 6 Vanguard US 15,406.2 1,593.8 7 Amundi FR 18,370.7 1,510.2 8 Commerzbank DE 7,335.7 1,283.4 9 Source US 13,815.4 415.9
10 BNP Paribas FR 4,672.9 291.9 TOTAL TOP 10 399,776.3 31,438.0 TOTAL 430,546.1 31,354.2
RANK MASTER GROUPS FUND NAME ENS YTD 20151 BlackRock iShares Core MSCI World UCITS ETF 1,533.6 2 BlackRock iShares EURO STOXX 50 UCITS ETF (DE) 1,280.1 3 DeAWM db x-trackers DAX® UCITS ETF (DR) 1,247.6 4 BlackRock iShares Euro High Yield Corporate Bond UCITS ETF 1,215.4 5 BlackRock iShares $ High Yield Corporate Bond UCITS ETF 1,189.6 6 DeAWM db x-trackers EURO STOXX 50® UCITS ETF (DR) 1,138.8 7 BlackRock iShares Core Euro Corporate Bond UCITS ETF 1,105.7 8 Vanguard Vanguard S&P 500 UCITS ETF 1,099.9 9 BlackRock iShares Core S&P 500 UCITS ETF (USD) 1,058.2
10 UBS UBS ETF - MSCI EMU 100% hedged to USD UCITS ETF 993.4 TOTAL TOP 10 11,862.2 TOTAL 31,354.2
EXCHANGE TRADED FUNDS

12
JAN-JUN 2015EUROPEAN FUND MARKET REVIEW—MID-YEAR REVIEW 2015
broadridge.com
RANK MASTER GROUPS FUND NAME ENS YTD 20151 State Street SSgA UK Equity Tracker 4,185.2 2 State Street SSgA Europe ex UK Equity Tracker 3,016.7 3 Northern Trust Northern Trust Europe Equity Index UCITS FGR Fund 1,267.2 4 State Street SSgA US Equity Index 1,045.8 5 Vanguard Vanguard Global Bond Index 1,002.1 6 Delta Lloyd Delta Lloyd Institutioneel Global Equity Index 723.7 7 Northern Trust Northern Trust North America Equity Index UCITS FGR Fund 628.2 8 Vanguard Vanguard FTSE UK All Share Index Unit Trust 620.7 9 MMC/Mercer Mercer QIF CCF - Passive Global Equity CCF 614.5
10 Northern Trust Northern Trust Developed Real Estate Index UCITS FGR Fund 611.4 TOTAL TOP 10 13,715.5 TOTAL 23,946.8
PRODUCT THEMES
FIGURE 16
FIGURE 17
TOP 10 MASTER GROUPS BY SALES YTD 2015 (€M)
TOP 10 FUNDS BY SALES YTD 2015 (€M)
RANK MASTER GROUPS NAT ASSETS JUNE 2015 ENS YTD 20151 State Street US 28,268.5 8,598.4 2 Vanguard US 64,104.0 3,887.8 3 Northern Trust US 3,770.2 2,984.9 4 Cr Suisse CH 55,907.3 2,950.9 5 UBS CH 56,861.5 1,383.9 6 Swisscanto CH 24,210.5 1,299.6 7 HSBC GB 10,349.6 821.3 8 Delta Lloyd GB 2,038.3 723.7 9 MMC/Mercer US 3,575.1 722.2
10 Fidelity US 4,020.5 471.4 TOTAL TOP 10 253,105.5 23,843.9 TOTAL 536,486.8 23,946.8
INDEX TRACKING FUNDS

13
JAN-JUN 2015 EUROPEAN FUND MARKET REVIEW—MID-YEAR REVIEW 2015
broadridge.com
Active86%
Index Tracking
8%
ETFs6%
Active96%
Index Tracking
1%ETFs3%
PRODUCT THEMES
FIGURE 18 MARKET SHARE OF PASSIVE FUNDS BY ASSETS
ACTIVE VS. PASSIVE
FIGURE 19 HISTORICAL NET SALES (€M)
0
50,000
100,000
150,000
200,000
250,000
300,000
350,000
2012 2013 2014 2015 YTD
Active Index Tracking ETFs
Note: Excludes money market funds.
AS OF JUNE 2015AS OF JUNE 2013

14
JAN-JUN 2015EUROPEAN FUND MARKET REVIEW—MID-YEAR REVIEW 2015
broadridge.com
RANK MASTER GROUPS FUND NAME ENS YTD 20151 BlackRock iShares Core Euro Corporate Bond UCITS ETF 1,105.7 2 Invesco Invesco Euro Corporate Bond Fund 1,053.9 3 Henderson Global Henderson Horizon - Euro Corporate Bond 838.0 4 Morgan Stanley Morgan Stanley-Euro Corporate Bond 835.7 5 Schroders Schroder ISF-Euro Corporate Bond 672.4 6 RBC BlueBay - Investment Grade Euro Aggregate Bond Fund 598.6 7 Vontobel Vontobel Fund - EUR Corporate Bond Mid Yield 580.8 8 ORIX / Robeco Robeco Financial Institutions Bonds 470.1 9 Schroders Schroder ISF-EURO Credit Conviction 444.3
10 BlackRock iShares Euro Corporate Bond 1-5yr UCITS ETF 427.4 TOTAL TOP 1O 7,026.8 TOTAL 9,421.5
PRODUCT THEMES
FIGURE 20
FIGURE 21
TOP 10 MASTER GROUPS BY SALES YTD 2015 (€M)
TOP 10 FUNDS BY SALES YTD 2015 (€M)
RANK MASTER GROUPS NAT ASSETS JUNE 2015 ENS YTD 20151 BlackRock US 22,480.3 1,533.6 2 Schroders GB 6,363.4 1,116.7 3 Invesco US 7,003.8 1,053.9 4 Henderson Global GB 3,651.1 838.0 5 Morgan Stanley US 3,780.8 837.6 6 ABN AMRO NL 742.4 760.3 7 Vontobel CH 1,377.6 580.8 8 Pioneer IT 5,571.6 548.8 9 ORIX / Robeco JP 3,048.1 430.3
10 State Street US 2,490.5 388.5 TOTAL TOP 1O 56,509.7 8,088.5 TOTAL 149,065.0 9,421.5
BONDS EUR CORP. INV. GRADE

15
JAN-JUN 2015 EUROPEAN FUND MARKET REVIEW—MID-YEAR REVIEW 2015
broadridge.com
PRODUCT THEMES
FIGURE 22
FIGURE 23
TOP 10 MASTER GROUPS BY SALES YTD 2015 (€M)
TOP 10 FUNDS BY SALES YTD 2015 (€M)
RANK MASTER GROUPS NAT ASSETS JUNE 2015 ENS YTD 20151 Invesco US 11,957.3 2,286.5 2 MFS US 7,868.0 2,189.9 3 Northern Trust US 1,443.2 1,514.1 4 Henderson Global GB 8,279.5 1,400.7 5 BlackRock US 25,137.6 1,371.6 6 BNP Paribas FR 9,986.9 1,086.7 7 ABN AMRO NL 2,184.8 883.1 8 Allianz GI DE 11,175.4 792.6 9 UBS CH 7,268.3 762.4
10 Jupiter GB 2,373.3 724.3 TOTAL TOP 1O 87,674.3 13,011.9 TOTAL 292,365.8 19,566.3
RANK MASTER GROUPS FUND NAME ENS YTD 20151 MFS MFS Meridian - European Value Fund 1,813.6 2 Invesco Invesco Pan European Structured Equity Fund 1,540.9 3 Northern Trust Northern Trust Europe Equity Index UCITS FGR Fund 1,267.2 4 BlackRock BlackRock Global Funds - European Fund 669.9 5 Allianz GI Allianz Global Investors Fund - Allianz Europe Equity Growth 662.5 6 UBS VVA - Aktien Euro Länder 616.4 7 Invesco INVESCO Pan European Equity Fund 615.3 8 Soc Gen/Lyxor Lyxor UCITS ETF MSCI Europe 605.8 9 BlackRock iShares STOXX Europe 600 (DE) 597.9
10 Jupiter The Jupiter Global Fund - Jupiter European Growth 588.9 TOTAL TOP 1O 8,978.3 TOTAL 19,566.3
EQUITIES EUROPE

16
JAN-JUN 2015EUROPEAN FUND MARKET REVIEW—MID-YEAR REVIEW 2015
broadridge.com
Top 5 sectors
49%
Next 10 sectors
23%
16-25 sectors
11%Rest17%
RANK FUND SECTOR # FUNDS ENS YTD 20151 Asset Allocation 144 15,803.82 Bonds Global Currencies 58 7,431.23 Mixed Assets Balanced 53 4,752.14 Equities Europe 35 3,031.15 Mixed Assets Income 16 2,501.46 Protected Fund 18 2,347.07 Equities Global 66 2,139.28 Equities Emerging Markets 37 1,874.89 Equities North America 19 1,822.6
10 Life Cycle 10 1,623.311 Target Maturity Other 15 1,353.412 Equities Real Estate 6 1,304.113 Bonds EUR Short-Term 5 1,287.914 Equities US Income 4 953.215 Fund of Funds Asset Allocation 36 890.616 Money Market EUR 6 822.517 Target Maturity Euroland 8 802.418 Bonds EUR 20 792.519 Bonds Global Corporates 11 769.020 Bonds EUR Corp. Inv. Grade 7 749.921 Equities Global Mid/Small Caps 6 746.222 Bonds Emerging Markets 8 729.323 Bonds DKK 2 680.424 Equities Japan 15 676.125 Bonds USD Corp. High Yield 10 661.2
TOP 25 615 56,545.1TOTAL 985 67,940.9
PRODUCT DEVELOPMENT
FIGURE 24
FIGURE 25
TOP 25 SECTORS OF NEW FUNDS YTD 2015 (€M)
MARKET SHARE OF LEADING SECTORS OF NEW FUNDS
NEW FUNDS BY SECTOR

17
JAN-JUN 2015 EUROPEAN FUND MARKET REVIEW—MID-YEAR REVIEW 2015
broadridge.com
Top 540%
Rest60%
CROSS-BORDER PROGRESS
FIGURE 26 TOP 25 INTERNATIONAL GROUPS BY SALES YTD 2015 (€M)
Note: Excludes money market funds.
RANK MASTER GROUP NAT # FUNDS ASSETS JUNE 2015 ENS YTD 20151 BlackRock US 396 390,744.4 23,417.22 UBS CH 373 110,947.2 10,135.73 DeAWM DE 390 121,878.8 8,372.84 JP Morgan US 159 127,238.7 6,452.35 Nordea SE 86 47,725.0 6,353.26 Allianz GI DE 73 46,456.3 6,170.37 Soc Gen/Lyxor FR 247 50,011.7 5,788.28 Invesco US 99 56,418.6 4,936.99 Amundi FR 210 60,023.1 4,450.8
10 Schroders GB 127 95,022.4 4,361.811 Standard Life GB 37 21,560.8 4,158.312 Fidelity US 157 96,712.5 4,043.713 Henderson Global GB 34 25,995.0 3,913.714 Vanguard US 40 68,079.2 3,837.315 Pictet CH 78 56,871.7 3,824.916 New York Life / Candriam US 81 19,477.4 3,675.817 GAM Holding CH 129 41,513.1 3,292.318 Pioneer IT 53 47,703.8 3,094.419 BNY Mellon US 58 28,871.7 2,968.520 MFS US 45 33,610.2 2,903.221 Jupiter Investment GB 15 9,553.2 2,613.922 Goldman Sachs US 100 50,046.1 2,601.823 BNP Paribas FR 297 61,390.6 2,413.724 State Street US 105 30,298.5 2,380.225 HSBC GB 124 39,143.5 2,319.8
TOP 25 3,513 1,737,293.4 128,480.6REST 5,744 1,612,137.8 6,746.8TOTAL 9,257 3,349,431.2 135,227.3
FIGURE 27 MARKET SHARE OF LEADING MASTER GROUPS BY SALES
GROUP WINNERS

18
JAN-JUN 2015EUROPEAN FUND MARKET REVIEW—MID-YEAR REVIEW 2015
broadridge.com
BlackRock
Fidelity
UBSJP Morgan
AXA
SchrodersDeAWM
Vanguard
InvescoGS
Allianz GI
Nordea
Standard Life
-5,000
0
5,000
10,000
15,000
20,000
25,000
30,000
35,000
-15,000 -10,000 -5,000 0 5,000 10,000 15,000 20,000 25,000 30,000
Sales contribution (€m)
Perf
orm
ance
cont
ribut
ion
(€m
)
FIGURE 28 GROUP POSITIONING BY SALES AND PERFORMANCE CONTRIBUTION TO ASSET GROWTH YTD 2015 (€M)
CROSS-BORDER PROGRESSGROUP WINNERS

19
JAN-JUN 2015 EUROPEAN FUND MARKET REVIEW—MID-YEAR REVIEW 2015
broadridge.com
CROSS-BORDER PROGRESS
-10,000
0
10,000
20,000
30,000
40,000
50,000
60,000
IT SP DEU CH BE FR AU SWE UK NL
Domestic Foreign
FIGURE 29 NET SALES OF FOREIGN GROUPS BY MARKET IN H1 2015 - ALL FUNDS (€M)
-6,000
-4,000
-2,000
0
2,000
4,000
6,000
8,000
SP IT BE AU SWE UK CH FR DEU NL
Domestic Foreign
FIGURE 30 NET SALES OF FOREIGN GROUPS BY MARKET IN H1 2015 - EQUITY ONLY (€M)
-8,000
-6,000
-4,000
-2,000
0
2,000
4,000
6,000
8,000
10,000
SP DEU CH IT FR UK SWE BE AU NL
Domestic Foreign
FIGURE 31 NET SALES OF FOREIGN GROUPS BY MARKET IN H1 2015 - BOND ONLY (€M)
Note: Excludes money market funds & ETFs1. Foreign activity is actual sales as measured by the Broadridge SalesWatch Confidential Service.2. The 55 members are estimated to account for 75-80% of the total crossborder sales activity
FOREIGN SHARE OF SALES IN EUROPE

20
JAN-JUN 2015EUROPEAN FUND MARKET REVIEW—MID-YEAR REVIEW 2015
broadridge.com
CROSS-BORDER PROGRESS
FIGURE 32 TOP 5 DOMESTIC AND FOREIGN SECTORS IN THE MAJOR MARKETS
Note: Excludes money market funds & ETFs
FRANCEDOMESTIC ENS YTD 2015 FOREIGN REAL SALES H1 2015
1 Asset Allocation 4,059.8 Equities Europe Confidential2 Mixed Assets Conservative 1,167.7 Bonds EUR Short-Term3 Fund of Funds Asset Allocation 1,028.4 Equities Europe Income4 Fund of Funds Conservative 1,001.2 Asset Allocation5 Bonds EUR Short-Term 972.3 Bonds EUR Corp. High Yield
GERMANYDOMESTIC ENS YTD 2015 FOREIGN REAL SALES H1 2015
1 Asset Allocation 6,128.1 Fund of Funds Balanced Confidential2 Mixed Assets Conservative 6,097.8 Fund of Funds Conservative3 Fund of Funds Balanced 2,428.7 Bonds EUR4 Fund of Funds Conservative 2,066.7 Mixed Assets Income5 Mixed Assets Balanced 1,902.1 Mixed Assets Balanced
ITALYDOMESTIC ENS YTD 2015 FOREIGN REAL SALES H1 2015
1 Asset Allocation 14,590.8 Mixed Assets Income Confidential2 Mixed Assets Balanced 5,348.8 Asset Allocation3 Bonds Global Currencies 5,095.2 Fund of Funds Asset Allocation4 Mixed Assets Conservative 3,927.5 Bonds Emerging Markets5 Fund of Funds Asset Allocation 3,159.9 Bonds EUR Corp. Inv. Grade
SWITZERLANDDOMESTIC ENS YTD 2015 FOREIGN REAL SALES H1 2015
1 Asset Allocation 2,593.8 Bonds Global Currencies Confidential2 Equities Europe 1,489.5 Bonds European Currencies Corp. High Yield3 Equities North America 1,264.3 Asset Allocation4 Bonds Global Currencies 1,262.5 Bonds USD Corp. Inv. Grade5 Equities Global Mid/Small Caps 884.4 Mixed Assets Income
UNITED KINGDOMDOMESTIC ENS YTD 2015 FOREIGN REAL SALES H1 2015
1 Asset Allocation 7,462.5 Bonds Flexible Confidential2 Equities Europe Ex UK 3,817.7 Bonds Global High Yield3 Real Estate 2,016.8 Bonds Emerging Markets4 Mixed Assets Balanced 1,650.7 Equities Global5 Fund of Funds Dynamic 1,622.0 Bonds EUR Corp. Inv. Grade
DOMESTIC VS. FOREIGN SECTORS

21
JAN-JUN 2015 EUROPEAN FUND MARKET REVIEW—MID-YEAR REVIEW 2015
broadridge.com
FOOTNOTES1. All data is year-to-date 2015 unless otherwise stated.2. ‘International’ fund market. Broadridge defines an International fund as a fund
that sources less than 80% of its assets from any single country. Some fund groups have domestic and international funds.
3. ‘Domestic’ fund market. If a fund sources more than 80% of its assets from a single country then the fund is allocated to that market regardless of its domicile.
4. Funds of funds have been excluded from all charts and tables (to avoid double-counting) unless otherwise stated. Therefore a market total is the sum of all the investment categories excluding the three funds of funds categories (in-house, ex-house and hedge).
5. The investment category ‘other’ includes a variety of different product categories. For most markets, especially Belgium, Spain and France, the figure comprises guaranteed funds, but there are also derivatives and other speciality funds in the ‘other’ category.
6. Property funds are open-ended property funds only.7. Master group. Analysis that aggregates the European mutual fund assets under the
umbrella of their parent company name. ENS stands for estimated net sales.8. ETFs are included in broadridge’s database on mutual funds, but this excludes
exchange-traded commodity products that are not mutual funds.9. References to foreign activity relate to actual sales as measured by Broadridge’s
SalesWatch confidential service. The 55 SalesWatch members are estimated to account for 75-80% of total cross-border sales activity.
The following report is based on the unique fund flows information delivered through Broadridge FundFile, our leading global fund flows database. The charts and tables in this report reflect only the tip of the iceberg in terms of the depth and breadth available from Broadridge FundFile. The report offers a high-level overview of European fund flow activity for 2015 year to date.
Broadridge FundFile enables deep fund flows analysis of all key geographical markets, covering Asia Pacific, Latin America, the Middle East and Africa, and the U.S., and delivers a truly global fund flows solution. By gradually building the international reach of its global sales data and maintaining its high quality and ease of use over the past ten years, FundFile has become the unparalleled source of data and analysis, with information on more than 100,000 funds.
The cross-border dimension of the European funds industry–the “international” fund market–can truly be assessed only with Broadridge SalesWatch, a unique cooperative and confidential benchmarking service that allows leading fund groups to track their cross-border sales and assets against their competitors’ by country, distribution channel, institutional versus retail activity, and both gross and net sales. This service now counts 55 of the leading asset managers among its members. (Some sample data taken from the tool can be seen on pages 19 and 20 of the current report).
ABOUT THE REPORT
As product line-ups, fund structures, investor bases and geographies expand, the complexities of fee calculations increase.Broadridge’s services and solutions help organisations with the calculations of dynamic and complex fee schedules. Our automated end to end solution, reduces revenue loss, fee leakage and improves revenue forecasts; providing clients the access, visibility and control they need to operate with confidence.
Global oversight of relations and contracts
Multifaceted vendor management strategies
Transparency into expenses, allocations and cash flow
Increased profitability and performance
Where Will You Find Additional Saving?
© 2015 Broadridge Financial Solutions, Inc., Broadridge and the Broadridge logo are registered trademarks of Broadridge Financial Solutions, Inc.
For more information please contact us at [email protected] or phone us at +1 617 960 2598 (North America) or +44 207 551 3287 (UK, Europe and Asia).