european cranes - research-doc.credit-suisse.com
TRANSCRIPT

DISCLOSURE APPENDIX AT THE BACK OF THIS REPORT CONTAINS IMPORTANT DISCLOSURES, ANALYST CERTIFICATIONS, LEGAL ENTITY DISCLOSURE AND THE STATUS OF NON-US ANALYSTS. US Disclosure: Credit Suisse does and seeks to do business with companies covered in its research reports. As a result, investors should be aware that the Firm may have a conflict of interest that could affect the objectivity of this report. Investors should consider this report as only a single factor in making their investment decision.
9 October 2017 Europe
Equity Research
Capital Goods
European Cranes Research Analysts
Leo Carrington
44 20 7883 4532
Andre Kukhnin, CFA
44 20 7888 0350
Max Yates
44 20 7883 8501
Artem Tokarenko
44 20 7888 2676
Iris Zheng
44 20 7883 5298
Specialist Sales: Andrew Bell
44 20 7888 0479
INITIATION
Konecranes and Cargotec Initiation We extend our Pan-European Capital Goods coverage, initiating with an
Outperform rating on Konecranes (TP €43) and a Neutral rating on
Cargotec (TP €52). We take a deep dive into evolving trends in port terminal
CapEx following structural changes in shipping and advances in automation,
as well as industry concentration following Konecranes' acquisition of Terex's
MHPS division. We find these trends somewhat supportive for Cargotec, but
believe Konecranes is set to benefit across all areas of its business.
■ Customer CapEx growth following a pause: Formation of shipping
alliances enabled use of ever-larger ships calling at fewer terminals,
straining ports' handling peaks. This resulted in uncertainty amongst port
operators planning capacity and a hiatus in CapEx growth in 2016 and
2017; we expect a catch-up in growth in 2018 and 2019 with 8% and 15%
growth respectively, settling to its c.5% historic growth rate mid-term, in line
with our container trade forecasts.
■ Port Automation - machines to outclass manual in 2018. In our view, in
terms of Lifts per Hour and safety, automated will outclass manual ports
and drive an equipment replacement cycle limited only by negotiation with
unions. Konecranes and Cargotec are the two leading suppliers of manual
and automated port products.
■ Industry concentration across Port and Industrial Cranes. Following
c.20 acquisitions since 2004, there are now three scale players in Port
Equipment and Industrial Cranes globally. We see Konecranes' acquisition
of Terex MHPS as concluding the trend; in Port Equipment, the three
largest players now control >50% of the market ex-China, and in Industrial
Cranes, the three largest players now control >50% the market. We see
industry concentration enabling pricing power across all of Konecranes'
products, and c50% of Cargotec's.
■ Stock calls: We favour Konecranes as it benefits from Port Equipment
growth and industry concentration. This provides it with a clear roadmap to
close the gap to the Mechanical peer group's margins, with upside to
synergy targets that we view as conservative. The investment case in
Cargotec is balanced as its positive exposure to growing end-markets in
Port Equipment and Marine cranes is balanced against valuation, which we
see as fair. Our target prices are DCF based.
Figure 1: Relative valuation – the crane companies trade at a c.20%
discount to their mechanical peers on 2018E EV/EBITA
Source: Credit Suisse estimates. Peers detailed in Figure 61
Div Yield
2017E 2018E 2017E 2018E 2017E 2017E 2018E 2019E
Cargotec N € 52.00 18.4 16.2 14.7 12.7 2.1% 8.2% 9.3% 9.5%
Konecranes OP € 43.00 22.8 14.8 16.1 11.6 2.7% 6.8% 9.0% 11.0%
Average 20.6 15.5 15.4 12.2 2.4% 7.5% 9.2% 10.2%
Pan Euro ME Avg. 23.0 20.8 17.4 15.8 2.4% 14.9% 15.4% 14.6%
PE EV/EBITA (Adj) EBITA % (Adj)Rating Target Price

9 October 2017
European Cranes 2
Key Charts Figure 2: c.55% of the Port Equipment market ex-
China is now controlled by two players...
Figure 3: …while in Industrial Cranes, >50% of the
market is controlled by the three largest players
Source: Credit Suisse market share estimates, Global ex-China. Market share based on 2016 reported sales.
Source: Credit Suisse market share estimates, Global ex-China. Market share based on 2016 reported sales.
Figure 4: Port Capex drives Port Equipment sales.
We forecast a rebound in CapEx growth of 8%/14%
in 2018E/2019E benefiting both companies…
Figure 5: …while growing ship size mean ports
upgrade cranes to handle higher peak loads,
providing growth opportunities in Port Equipment
Source: Company data, Credit Suisse estimates, Credit Suisse Proprietary Port Operator CapEx model
Source: Clarkson's
Figure 6: PPI data indicates Industrial Crane prices increased 80bps in 2017, having been static for the
previous 12 months, and on average outpacing the raw materials index on average
Source: Thomson Reuters
Cargotec Equipment,
30%
Konecranes Equipment,
22%
ZPMC Container
Equipment, 10%
Liebherr Maritime
Equipment, 12%
Others, 26%Konecranes
18%
Terex11%
Stahl 3%
Columbus McKinnon
16%Kito7%
Others45%
-40%
-30%
-20%
-10%
0%
10%
20%
30%
CS Port Operator CapEx Model growth %yoyCargotec (Kalmar) Org. GrowthKonecranes (Port Solutions) Org. GrowthZPMC (Container Cranes) growth
0%
10%
20%
30%
40%
50%
60%
70%
80%
90%
100%
100-2,999 TEU 3,000-5,999 TEU 6,000-7,999 TEU 8,000-11,999 TEU 12,000-14,999 TEU 15,000+ TEU
50
55
60
65
70
75
80
85
90
95
100
100
101
102
103
104
105
106
107
108
US PPI - Hoists, Overhead Cranes, &
Monorail Systems Nadj
US PPI - Overhead Traveling Cranes &
Monorail Systems Nadj
US PPI: Pp-Overhead Traveling
Crane,Hoistand Monorail System Mfg
US PPI: Overhead Cranes, Hoists And
Monorail Systems Nadj
Cranes and Compressors, R-M Cost Index

9 October 2017
European Cranes 3
Figure 7: Konecranes looks relatively undervalued
on 2018E multiples…
Figure 8: ..while Cargotec's valuation looks more in
line with the mechanicals sector.
Source: Company data, Credit Suisse estimates Source: Company data, Credit Suisse estimates
Figure 9: Konecranes - revenue, organic growth and
margin history and forecast
Figure 10: Cargotec - revenue, organic growth and
margin history
Source: Company data, Credit Suisse estimates Source: Company data, Credit Suisse estimates
Figure 11: Konecranes is currently credited with 9%
mid-cycle margins, while we see synergies and
pricing power push margins to 10.5% by 2020
Figure 12: Cargotec sees limited margin expansion,
which we see as fair due to undefined self-help
strategy & mixed record on service growth.
Source: Credit Suisse estimates Source: Credit Suisse estimates
8
9
10
11
12
13
14
15
16
17
18
19
Konecranes EV/EBITA Average EV/EBITA
Trough: 5.1 8
9
10
11
12
13
14
15
16
17
18
19
Cargotec EV/EBITA Average EV/EBITA
11.8%
7%7.4%
6.2%6.4%5.5%5.9%5.5%6.6%
6.9%9.3%
11.1%
-25%
-20%
-15%
-10%
-5%
0%
5%
10%
15%
20%
25%
0
900
1,800
2,700
3,600
4,500
Revenue (operating margins in label) Organic Growth % (RHS)
5.7%
2.4% 5.5%
6.6%4.8%
4%4.5%
6.2%7.1%
8.3% 9.3%9.4%
-30%
-25%
-20%
-15%
-10%
-5%
0%
5%
10%
15%
20%
25%
0
500
1,000
1,500
2,000
2,500
3,000
3,500
4,000
4,500
Revenue (operating margins in label) Organic growth % (RHS)
9 October 2017
European Cranes 4
Table of contents
Executive summary 6
Sector overview ......................................................................................................... 6
Konecranes: Initiate with an Outperform rating and target price of €43 ................... 8
Cargotec: Initiate with a Neutral rating and a €52 target price. ................................ 9
Medium-term Driver #1: structural changes in container shipping and port
automation to drive a rebound in customer CapEx in 2018E 10
Shipping line consolidation has been the principal factor slowing CapEx .............. 11
Benefits of port terminal automation ....................................................................... 12
End-market sizing ................................................................................................... 15
Medium-term Driver #2: Industrial Crane and Port Equipment industry
concentration should lead to better margins 21
Market shares by product type................................................................................ 22
Key Conclusions from the European Commission competition case ..................... 25
Effect on Pricing ...................................................................................................... 29
Company and end-market benchmarking 31
Company benchmarking ......................................................................................... 31
End-market benchmarking ...................................................................................... 34
Global cranes comp sheet ...................................................................................... 36
Konecranes (KCRA.HE) 40
Prime beneficiary of heavy lifting in market consolidation 40
Konecranes: Key charts .......................................................................................... 42
Konecranes: Valuation ............................................................................................ 46
Konecranes: Overview ............................................................................................ 49
Konecranes: Margin potential - synergies and pricing............................................ 56
Konecranes: Financials ........................................................................................... 68
Cargotec (CGCBV.HE) 73
Cargotec: Key charts .............................................................................................. 75
Cargotec: Valuation ................................................................................................ 78
Cargotec: Kalmar .................................................................................................... 81
Cargotec: Hiab ........................................................................................................ 87
Cargotec: MacGregor ............................................................................................. 92
Cargotec: Financials ............................................................................................. 107
Appendices: 112
9 October 2017
European Cranes 5
End-market Primers Series
This report contains detailed analysis on the Cranes end market, including sections on
Port Equipment and Industrial Cranes. Other end-market primers published by the team:
Marine, Industrial Automation, Offshore Wind, Elevators, Warehouse Automation,
Aerospace, Dairy, Healthcare, Locks, Low Voltage, Construction
Equipment, Metal 3D, Oil & Gas Capex, Mining, Cables, Power Generation
The authors of this report wish to acknowledge to contribution made by Sweta
Mishra, Manisha Boyina and Shruti Garg, employees of CRISIL Global Research and
Analytics, a business division of CRISIL limited, a third party provider of offshore
research services to Credit Suisse.
9 October 2017
European Cranes 6
Executive summary
Sector overview
We identify two key mid-term drivers that we view as beneficial for the European crane
companies;
■ Driver #1: a catch-up in port operator CapEx in 2018 and 2019 following a period of
end-market uncertainty, with additional growth opportunities from automation.
■ Driver #2: Industry concentration largely concluded by Konecranes' acquisition of
Terex's MHPS division is set to drive margin improvement in the Industrial Equipment
end market, and leave two strong Port Equipment players with scale to defend against
ZPMC, a major Chinese competitor.
We see Konecranes as the major beneficiary of these two factors, given 100% of its
revenues are derived from Port Equipment and Industrial Cranes, while only c.50% of
Cargotec's revenues (the Kalmar division)is set to benefit. As such, we prefer to play these
themes through Konecranes.
Driver #1: structural changes in container shipping, and port automation to drive a rebound in customer CapEx in 2018
■ Overcapacity, alliance formation and low freight rates between 2014-2016 led to
uncertainty in the container shipping industry and paused Container Port CapEx growth
in 2016 and 2017.
■ Alliance formation encouraged ordering of mega-vessels >20,000TEU, which require
significant upgrades to port equipment in order to handle the peak loads and physical
size of ships.
■ We expect port CapEx growth to bounce back in 2018, and see additional growth in
outer years from port automation as a solution to handle peak loads of larger ships,
which offer significant OpEx savings and safety improvements.
■ Cargotec and Konecranes are leaders in manual and automated container handing
equipment and are ideally placed to benefit from resumed CapEx growth in 2018. We
see opportunities for automation to accelerate the replacement cycle; however, very
strong union pressure will result in slow adoption rather than a "tipping point".
Where are we vs. consensus;
On 2019 revenues, we are 5% ahead of consensus for Konecranes Port Solutions and in
line for Cargotec Kalmar. For two relatively analogous businesses, we find this
discontinuity surprising, and therefore see good relative value in Konecranes.
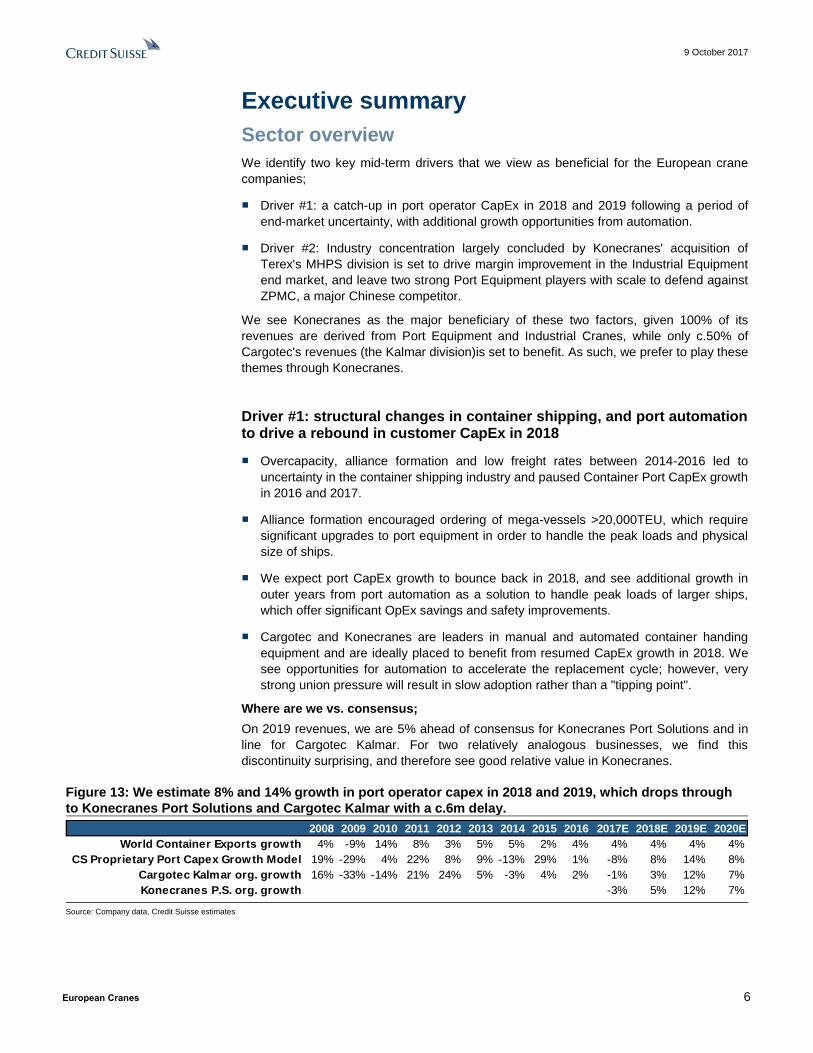
Figure 13: We estimate 8% and 14% growth in port operator capex in 2018 and 2019, which drops through
to Konecranes Port Solutions and Cargotec Kalmar with a c.6m delay.
Source: Company data, Credit Suisse estimates
2008 2009 2010 2011 2012 2013 2014 2015 2016 2017E 2018E 2019E 2020E
World Container Exports growth 4% -9% 14% 8% 3% 5% 5% 2% 4% 4% 4% 4% 4%
CS Proprietary Port Capex Growth Model 19% -29% 4% 22% 8% 9% -13% 29% 1% -8% 8% 14% 8%
Cargotec Kalmar org. growth 16% -33% -14% 21% 24% 5% -3% 4% 2% -1% 3% 12% 7%
Konecranes P.S. org. growth -3% 5% 12% 7%

9 October 2017
European Cranes 7
Driver #2: Industrial Crane and Port Equipment industry concentration will lead to better margins
■ Industry concentration in Industrial and Container cranes appears to be coming to an
end following c20 separate acquisitions, and culminating with Konecranes' acquisition
of Terex MHPS.
■ According to our estimates, in Container cranes, Cargotec, Konecranes and ZPMC
control c70% of the market, while globally ex. China, Cargotec and Konecranes control
>60% of the market.
■ In the European Industrial crane market, the top 2 OEMs, Konecranes and Columbus
McKinnon control c50% of the market, with no scale players in the residual portion.
■ We find the remedy enforced by the European Commission following the MHPS
acquisition more in favour of Konecranes, requiring only divestment of a specialist
product-group with €135m revenue while gaining €436m of NI sales, further
concentrating the mid-range market in particular.
■ As a result of industry concentration, we identify pricing tailwinds worth 75bps in 2018E
and 50bps in 2019E for Konecranes, mainly in the Industrial crane segment, while
deal-related synergies provide €140m of run-rate EBIT benefit by 2021.
Where are we vs. consensus;
For the Port Equipment businesses of Konecranes and Cargotec, we see industry
concentration as protective of pricing rather than providing meaningful margin upside as a
result of the presence of a strong Chinese competitor.
In Industrial Cranes, we see significant benefits for Konecranes' Industrial Equipment and
Service businesses. We are slightly ahead of consensus in terms of revenues for these
divisions, (+0.3% and +1.1% in 2018 and 2019 respectively). We are significantly ahead in
terms of operating profit; +3.6% and +9.7% in 2018 and 2019 respectively, in part due to
the positive pricing impact that is not discounted by consensus.
Figure 14: Two decades of industry concentration led by Konecranes have concluded following the Terex
MHPS Acquisition, in our view.
Source: Company data, We have only included acquisitions from the Industrial Crane and Port Equipment markets.
1994
1995
1996
1997
1998
1999
2000
2001
2002
2003
2004
2005
2006
2007
2008
2009
2010
2011
2012
2013
2014
2015
2016
2017
PWB Anchor
ARMSEL MHE
Kito Kito
Yale International
Columbus McKinnon Columbus McKinnon
CVS Ferrari CVS Ferrari
Belotti * Cargotec's bid for CVS Ferrari was blocked CVS Service
by the German Competition Commission
Demag Cranes
Noell
Fantuzzi
Terex (MHPS)
WMI Cranes Ltd
Asio Sistemas de Elevacion
Eydimen 2000
Meiden Host Systems
Consens Transport Sys.
MMH
Stahl Cranesystems
SMV Lifttrucks AB
MAN SWF
Konecranes Konecranes
Kone
Cargotec Cargotec
Navis
Asciano Automation
ZPMC ZPMC
Liebherr Liebherr
9 October 2017
European Cranes 8
Konecranes: Initiate with an Outperform rating and
target price of €43
■ Exposure to growth in 2018E. We like the c.30% exposure to Port Operator CapEx,
where we forecast 8% and 14% growth in 2018 and 2019. The remaining revenues
from Industrial Crane manufacturing and servicing, are late-cycle, giving growth of
3.6% and 4.8% in 2018E and 2019E.
■ Konecranes the beneficiary of industry concentration. We find multiple positive
outcomes following Konecranes’ acquisition of Terex MHPS; 1) the acquisition grew
exposure to Port Equipment by 28%, affirming Konecranes as a competitor to
Cargotec. 2) The transaction concentrated Konecranes’ end markets, giving 70%
control of the Port Equipment market to Konecranes and two others, while in Industrial
Cranes, Konecranes is one of two players controlling c.50% with the remainder
fragmented. We have seen signs of positive pricing trends in Industrial Cranes, which
we see set to continue.
■ Synergies potential understated. We regard Konecranes’ target of EUR140m of
synergies as conservative, having seen positive revisions to timing. We note the
detailed roadmap, but see potential increases to total synergies. We note favourable
company commentary around the purchased asset and potential benefits of expanded
product range as clear positives.
■ Aftermarket sales screen favourably against the Mechanical peers. Konecranes’
exposure to aftermarket revenues place it in the 2nd quartile of the Mechanical peer
group, with less correlation to OEM sales during down cycles. We think this deserves
better recognition from investors and a higher multiple.
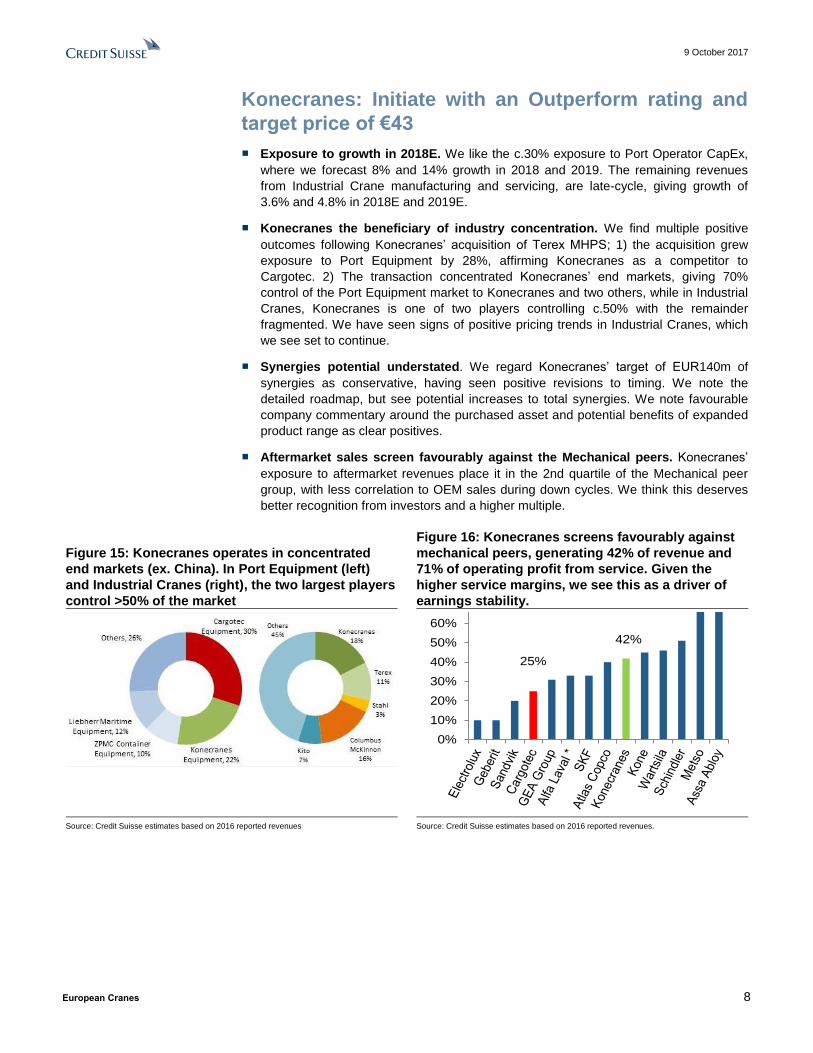
Figure 15: Konecranes operates in concentrated
end markets (ex. China). In Port Equipment (left)
and Industrial Cranes (right), the two largest players
control >50% of the market
Figure 16: Konecranes screens favourably against
mechanical peers, generating 42% of revenue and
71% of operating profit from service. Given the
higher service margins, we see this as a driver of
earnings stability.
Source: Credit Suisse estimates based on 2016 reported revenues Source: Credit Suisse estimates based on 2016 reported revenues.
25%
42%
0%
10%
20%
30%
40%
50%
60%
70%

9 October 2017
European Cranes 9
Cargotec: Initiate with a Neutral rating and a €52
target price.
■ Port equipment opportunity. We forecast port operator capex growth of 8% and 14%
in 2018E and 2019E respectively, while recent industry consolidation and imminent
adoption of automation will be protective for pricing. Cargotec derives c.50% of its
revenue from sales of Port Equipment.
■ Positive mid-term outlook, consensus optimistic near term. Overall we see strong
mid-term growth prospects for Cargotec from the MacGregor (marine) and Kalmar
(Port Equipment) divisions, however we near-term downside risk from earnings
revisions due to consensus forecasts which are, in our view, anticipating growth c.12
months early.
■ Long-term cyclicality risks weigh on valuation. We note that Cargotec’s relatively
low proportion of sales from aftermarket places it in the bottom quartile of the
Mechanical Capital Goods peer-group. In addition, we note a surprisingly high degree
of cyclicality in aftermarket organic growth and strong correlation to OE sales during
downturns. As such, we see the 19% discount to the sector on 2018E EV/EBITA
implied at current share price levels as appropriate.
Figure 17: Cargotec EBIT (€m) guidance evolution
vs. reported outcomes (and 2017 consensus).
Cargotec's low proportion of service places it in the
bottom quartile of the mechanical peer group, while
driving earnings volatility
Figure 18: MacGregor growth index – there is
clearly significant through-cycle upside; however,
with a marine upcycle only beginning, and long
revenue conversion, we see little near-term
catalysts
Source: Company data, Credit Suisse estimates. Vara consensus Source: Company data, Credit Suisse estimates
80
100
120
140
160
180
200
220
240
260
280
2009A 2010A 2011A 2012A 2013A 2014A 2015A 2016A 2017E
Bottom end of guidance Top end of guidance
Mid-point of EBIT guidance Actual/ C'sus forecast
50
70
90
110
130
150
170
190
2007 2009 2011 2013 2015 2017E 2019E
MacGregor Equipment MacGregor Services

9 October 2017
European Cranes 10
Medium-term Driver #1: structural changes in container shipping and port automation to drive a rebound in customer CapEx in 2018E
Summary:
1. Overcapacity, alliance formation and low freight rates between 2014 and 2016 caused
uncertainty in the container shipping industry and paused Container Port CapEx growth in
2016 and 2017.
2. Alliance formation increased orders for >20,000TEU mega vessels. Significant
upgrades to port equipment are required to handle the peak loads and the physical size of
these ships.
3. We expect port CapEx growth to bounce back in 2018, and see port automation as a
solution to handle the peak loads of larger ships, in addition to offering significant OpEx
savings and safety improvements.
4. Cargotec and Konecranes are leaders in manual and automated container handing
equipment and should be ideally placed to benefit from resumed CapEx growth in 2018.
We see opportunities for automation to accelerate the replacement cycle; however, strong
union pressure will likely result in gradual adoption rather than a "tipping point".
Figure 19: Cyclical port CapEx drives Cargotec
Kalmar's sales
Figure 20: Lows in the CapEx cycle follow declining
container rates; with recovering rates, we forecast
CapEx growth in 2018 and 2019
Source: Company data, Credit Suisse Proprietary Port Operator CapEx model. Data source: custom built index of 19 Port terminal Operators. China Merchant Port Holdings, Shanghai International Port Group and Ningbo Port have been deliberately excluded, as while they have shown strong accelerations in their Capex, the prime beneficiary of this is ZPMC, a local supplier. The strong acceleration in Capex in 2015 is largely due to investments by Hutchison, International Container Services and Adani Ports. Growth ex these names was 4%.
Source: Company data, Thompson Reuters, Credit Suisse Proprietary Port Operator CapEx model
-40%
-30%
-20%
-10%
0%
10%
20%
30%
CS Port Operator CapEx Model growth %yoy
Cargotec (Kalmar) Org. Growth
Konecranes (Port Solutions) Org. Growth
ZPMC (Container Cranes) growth
40
50
60
70
80
90
100
110
120
40
60
80
100
120
140
160
180
Port capex index (LHS) Freight rate index (leading, 18MMA)
9 October 2017
European Cranes 11
Shipping line consolidation has been the principal
factor slowing CapEx
We think that the formation of shipping line alliances has been the major driver of the
delay in port automation as port terminal operators wait to understand how this changes
the dynamics of the industry in terms of route choices and ports of call, as well as volume
dynamics due to the recently resumed trend of mega-vessel fleet growth.
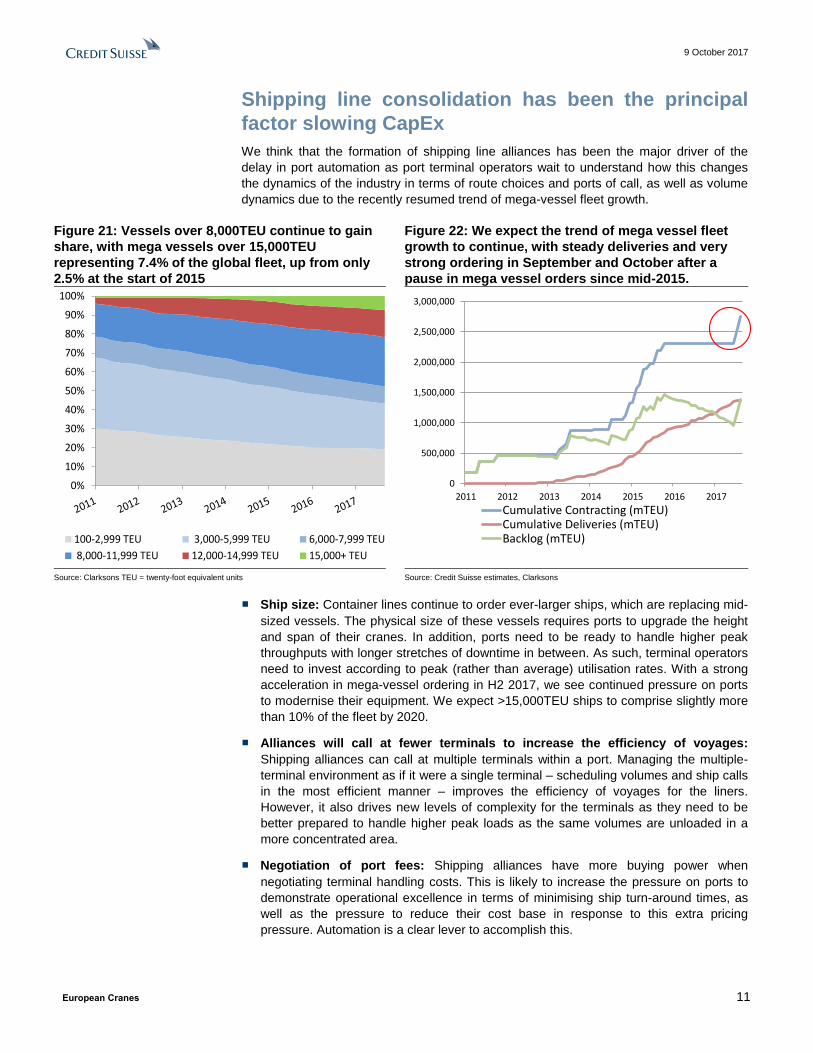
Figure 21: Vessels over 8,000TEU continue to gain
share, with mega vessels over 15,000TEU
representing 7.4% of the global fleet, up from only
2.5% at the start of 2015
Figure 22: We expect the trend of mega vessel fleet
growth to continue, with steady deliveries and very
strong ordering in September and October after a
pause in mega vessel orders since mid-2015.
Source: Clarksons TEU = twenty-foot equivalent units Source: Credit Suisse estimates, Clarksons
■ Ship size: Container lines continue to order ever-larger ships, which are replacing mid-
sized vessels. The physical size of these vessels requires ports to upgrade the height
and span of their cranes. In addition, ports need to be ready to handle higher peak
throughputs with longer stretches of downtime in between. As such, terminal operators
need to invest according to peak (rather than average) utilisation rates. With a strong
acceleration in mega-vessel ordering in H2 2017, we see continued pressure on ports
to modernise their equipment. We expect >15,000TEU ships to comprise slightly more
than 10% of the fleet by 2020.
■ Alliances will call at fewer terminals to increase the efficiency of voyages:
Shipping alliances can call at multiple terminals within a port. Managing the multiple-
terminal environment as if it were a single terminal – scheduling volumes and ship calls
in the most efficient manner – improves the efficiency of voyages for the liners.
However, it also drives new levels of complexity for the terminals as they need to be
better prepared to handle higher peak loads as the same volumes are unloaded in a
more concentrated area.
■ Negotiation of port fees: Shipping alliances have more buying power when
negotiating terminal handling costs. This is likely to increase the pressure on ports to
demonstrate operational excellence in terms of minimising ship turn-around times, as
well as the pressure to reduce their cost base in response to this extra pricing
pressure. Automation is a clear lever to accomplish this.
0%
10%
20%
30%
40%
50%
60%
70%
80%
90%
100%
100-2,999 TEU 3,000-5,999 TEU 6,000-7,999 TEU
8,000-11,999 TEU 12,000-14,999 TEU 15,000+ TEU
0
500,000
1,000,000
1,500,000
2,000,000
2,500,000
3,000,000
2011 2012 2013 2014 2015 2016 2017
Cumulative Contracting (mTEU)Cumulative Deliveries (mTEU)Backlog (mTEU)

9 October 2017
European Cranes 12
Why has port automation implementation lagged?
The port industry is at least 10 years behind other industries in terms of technical
development according to a Cargotec-funded McKinsey study. Despite the clear
operational and financial benefits of automation and the longstanding existence of the
technology, adoption has been very low.
We note that port operators are at a low point in their CapEx cycle, with no growth in 2016
and a c-5% decrease in CapEx spending in 2017, on our estimates, which has had an
effect on sales of all types of Port Terminal handling equipment. We see low port operator
CapEx as a result of the low rates environment and uncertainty surrounding the calling
patterns of the new shipping alliances. With the alliances now looking settled and the rates
environment improving as overcapacity is reduced, we anticipate a return to growth for
Port Operators in 2018, accompanied by an acceleration in automation projects.
We have identified four key phases of terminal automation:
2000-10 Early movers (e.g. ECT Delta) took time to achieve operational goals.
2010-15 Broader acceptance of automation, DPW and APM launched several projects.
2016-17 Pause in CapEx growth while productivity / technology advance imminent.
2018-30 30+ LPH achieved, Alliances settled and mega-vessel ordering confirmed,
resulting a resumption of growth in automation projects.
Figure 23: Port operator CapEx growth moves in line with underlying trade
growth. We forecast a catch-up with underlying demand by 2019, while see
scope for an additional spend as the benefits of port automation are realised
Source: Credit Suisse estimates, Credit Suisse Proprietary Port Operator CapEx model
Benefits of port terminal automation
The benefits of terminal automation can broadly be split into operational improvements
and cost reductions. Cargotec sees automation offerings as providing port operators with
an opportunity to reduce labour costs by 60% and other variable OpEx by 21%, before
taking into account the human and operational benefits of improved safety.
We identify five key benefits of automation:
1. Employee cost reductions: Following years of unionisation and general
underlying wage inflation, employee cost reduction is the primary potential benefit
of automation, in our view. According to Cargotec, the total annual cost of hiring a
straddle carrier driver on the US West Coast is $300k. (and ports require 10s of
80
100
120
140
160
180
200
Port capex index (LHS) Container trade index

9 October 2017
European Cranes 13
carriers working three shifts per day.) At Qingdao Qianwan Container Terminal
(QQCTN), the number of workers required to unload a cargo ship has been
reduced from 60 to 9 following the implementation of automation, representing an
85% reduction in employee costs.
2. Effective capacity increases: By accurately predicting throughput rates and
reducing non-revenue generating lifts, the productive capacity of existing
equipment is accelerated. This results in effective capacity increases without
expanding a port's footprint.
− Fewer unnecessary lifts: automated (or automation-ready) terminals scan
a container's data (typically printed letters) to track its location. Previously
this had all been done manually, which led to frequent errors.
− Consistent throughput rates: automated terminals are more consistent
and can operate in all weather conditions. This benefits planning of port
logistics and ship and truck turnaround times, improving service quality.
− Reduced downtime: automation means that machines are being built with
a much higher technology content, and the sensor load in new cranes
provides an opportunity to eliminate downtime via preventative servicing.
3. Safety: Port accidents can be fatal given the scale of machinery. Automation
allows segregation of humans and machines – the only task for truck drivers in an
automated terminal is loading containers onto lorries, where the driver has to get
out the cab, partly for safety reasons but also to manually confirm that the
interface is lined up properly on the truck.
4. Reduced energy consumption and wear and tear: Automated machinery can
be run more efficiently.
− Power consumption is reduced as automated movements avoid sharp
accelerations and boxes do not need to be lifted as high when
automatically controlled as the machine operates with tighter tolerances
than a human operator.
− These same factors reduce the effective utilisation rate and therefore cut
down on wear and tear over a given period. In addition, excessive speed
or fatigue are often factors in port accidents.
5. Lower pollution and emissions:
− Lithium batteries in straddle carriers and AVGs are highly efficient and
can be recharged quickly, making pure-electric and hybrid-electric
handling gear feasible.
− A fully automated unloading system needs no overhead lighting, which
further reduces energy consumption and light pollution.
What are the final hurdles to automation?
■ Unionisation: The key cost-saving opportunity for port terminal operators is in
reducing the number of employees manning equipment; however, this is also the
strongest resistance point.
− Port workforces are generally part of strong unions. Australia is the leader in port
automation, having started the process of union negotiations the earliest.
− Elsewhere, however (especially in the US), we anticipate negotiations with unions
to be extended and difficult – and slower than hoped for by the equipment OEMs.
We note that the proposed California cap-and-trade spending bill contains $140m
for spending on zero-emission port equipment, but with the proviso that the funds
cannot be spent on automated equipment.

9 October 2017
European Cranes 14
■ Lifts per Hour (LPH): automated terminals do not currently have the same throughput
as manual terminals, most likely due to the following:
− Integration of equipment and software is key, but improves with each project. At
QQCTN, Navis took one year to go live at 30 LPH, but at other sites it has taken
two years to get to 25 LPH. Cargotec notes that port operators tend to split up
contracts among the OEMs, which introduces significant integration challenges for
relatively new technology.
− The ship-to-ship (STS) transfer process is usually a bottleneck and remains manual
given that large cranes with long ropes have swaying containers, which makes the
process challenging to automate.
− Automated terminals are currently at mid-20s LPH (25-27) under the crane, while in
response to the threat of automation, non-automated terminals have stepped up to
30 LPH. Cargotec wants to get to 30 LPH by the end of 2017, while software
simulations at Cargotec can reach 45 LPH in perfect conditions using current
solutions.
− Machine vision: one of the factors that reduces the overall speed of automated
offerings is that current iterations of sensors cannot distinguish between different
obstacles. For instance, cranes will stop when birds fly past.
− Technology has been slow to develop in terms of applying well-established
automation, software and machine vision systems to the port terminal environment,
while port operators themselves have lacked the domain knowledge to implement
the systems.
■ Risk aversion:
− Customers are reluctant to outsource their terminal operating systems (TOS) to a
third party, and as such often rely on in-house systems that are unable to integrate
automated machinery.
− Ports have not been prepared to purchase machinery with no cabins, and
simultaneously are reluctant to invest in 'automation-ready' equipment that can be
slowly transitioned.
− We note too that port terminal operators have not needed to make risky
investments thus far in the 2010s, as they have been in better financial shape
relative to many of the liners. As such, we think the port operators may not have felt
pressure to invest.
In terms of efficiency, we think automated systems only need to reach parity with humans
to make automation worthwhile given its other benefits. We therefore see 2018 as a key
milestone in port automation, as automated port terminals will match manual equipment in
terms of lifts per hour, leaving only unionisation and risk aversion as the remaining
hurdles. We see efficiency/throughput as the main barrier to implementation, and expect to
see resumed announcements of large automated equipment orders in 2018, although the
pace will primarily depend on the progress of union negotiations.
9 October 2017
European Cranes 15
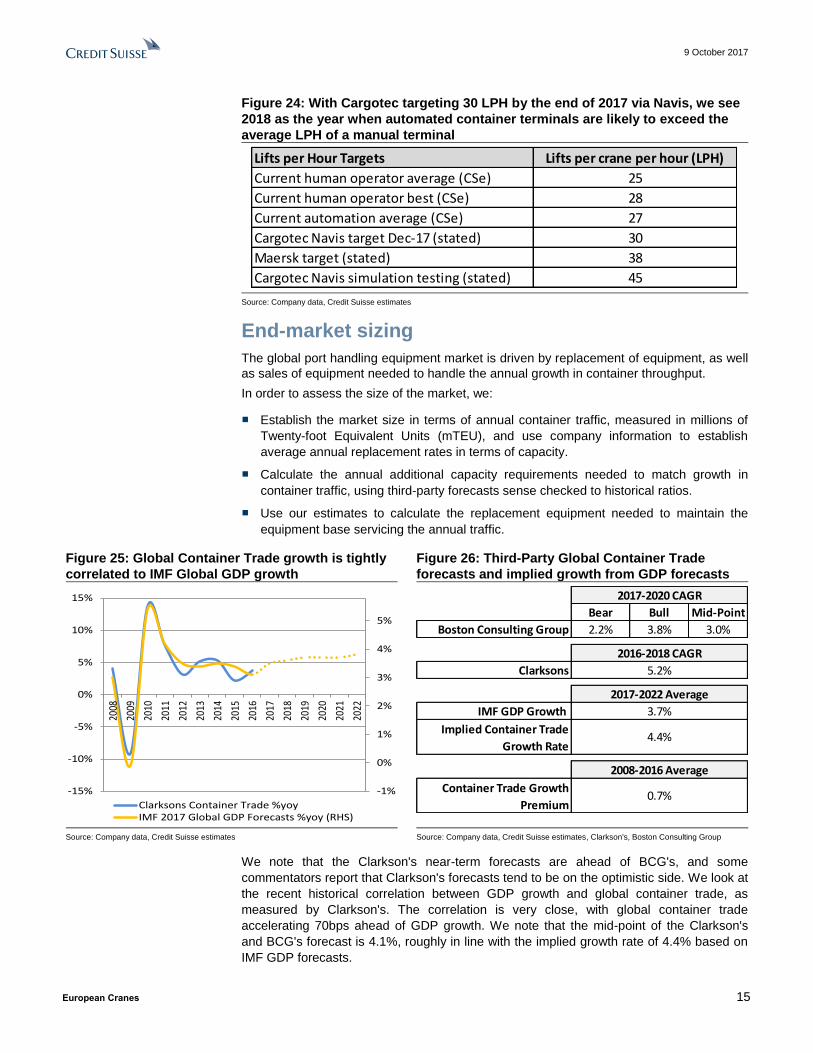
Figure 24: With Cargotec targeting 30 LPH by the end of 2017 via Navis, we see
2018 as the year when automated container terminals are likely to exceed the
average LPH of a manual terminal
Source: Company data, Credit Suisse estimates
End-market sizing
The global port handling equipment market is driven by replacement of equipment, as well
as sales of equipment needed to handle the annual growth in container throughput.
In order to assess the size of the market, we:
■ Establish the market size in terms of annual container traffic, measured in millions of
Twenty-foot Equivalent Units (mTEU), and use company information to establish
average annual replacement rates in terms of capacity.
■ Calculate the annual additional capacity requirements needed to match growth in
container traffic, using third-party forecasts sense checked to historical ratios.
■ Use our estimates to calculate the replacement equipment needed to maintain the
equipment base servicing the annual traffic.
Figure 25: Global Container Trade growth is tightly
correlated to IMF Global GDP growth
Figure 26: Third-Party Global Container Trade
forecasts and implied growth from GDP forecasts
Source: Company data, Credit Suisse estimates Source: Company data, Credit Suisse estimates, Clarkson's, Boston Consulting Group
We note that the Clarkson's near-term forecasts are ahead of BCG's, and some
commentators report that Clarkson's forecasts tend to be on the optimistic side. We look at
the recent historical correlation between GDP growth and global container trade, as
measured by Clarkson's. The correlation is very close, with global container trade
accelerating 70bps ahead of GDP growth. We note that the mid-point of the Clarkson's
and BCG's forecast is 4.1%, roughly in line with the implied growth rate of 4.4% based on
IMF GDP forecasts.
Lifts per Hour Targets Lifts per crane per hour (LPH)
Current human operator average (CSe) 25
Current human operator best (CSe) 28
Current automation average (CSe) 27
Cargotec Navis target Dec-17 (stated) 30
Maersk target (stated) 38
Cargotec Navis simulation testing (stated) 45
-1%
0%
1%
2%
3%
4%
5%
-15%
-10%
-5%
0%
5%
10%
15%
2008
2009
2010
2011
2012
2013
2014
2015
2016
2017
2018
2019
2020
2021
2022
Clarksons Container Trade %yoyIMF 2017 Global GDP Forecasts %yoy (RHS)
Bear Bull Mid-Point
Boston Consulting Group 2.2% 3.8% 3.0%
Clarksons 5.2%
IMF GDP Growth 3.7%
Implied Container Trade
Growth Rate4.4%
Container Trade Growth
Premium0.7%
2017-2020 CAGR
2016-2018 CAGR
2017-2022 Average
2008-2016 Average
9 October 2017
European Cranes 16
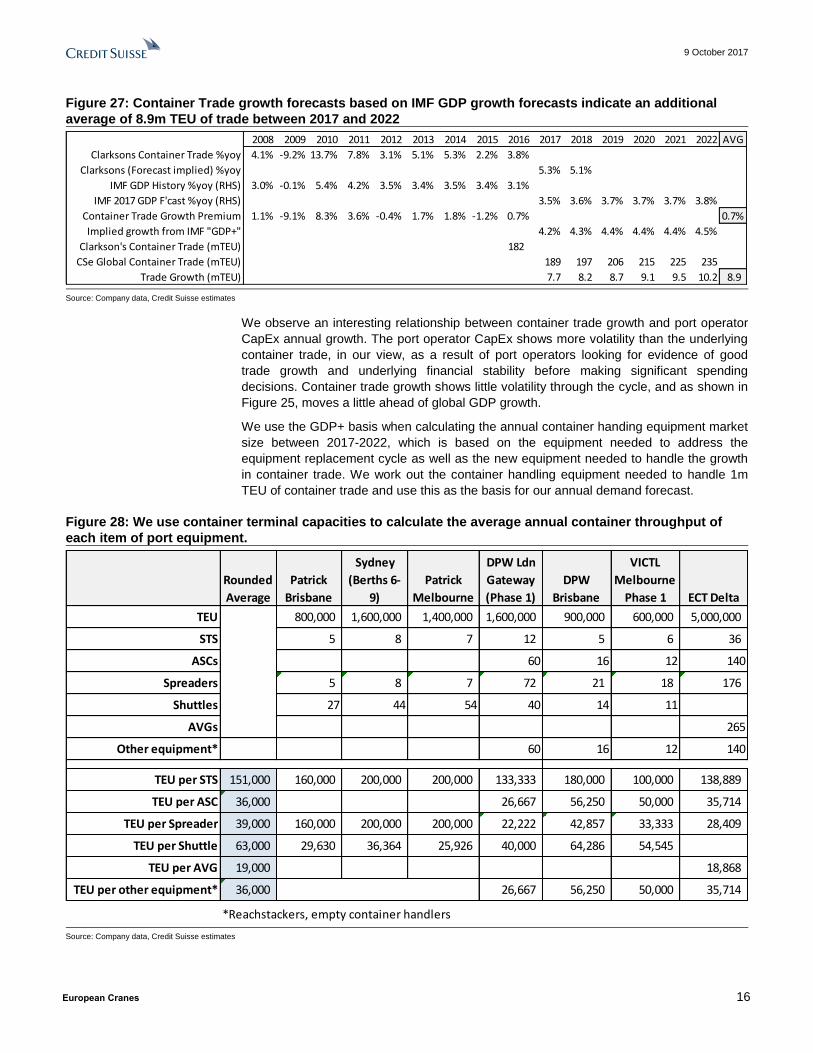
Figure 27: Container Trade growth forecasts based on IMF GDP growth forecasts indicate an additional
average of 8.9m TEU of trade between 2017 and 2022
Source: Company data, Credit Suisse estimates
We observe an interesting relationship between container trade growth and port operator
CapEx annual growth. The port operator CapEx shows more volatility than the underlying
container trade, in our view, as a result of port operators looking for evidence of good
trade growth and underlying financial stability before making significant spending
decisions. Container trade growth shows little volatility through the cycle, and as shown in
Figure 25, moves a little ahead of global GDP growth.
We use the GDP+ basis when calculating the annual container handing equipment market
size between 2017-2022, which is based on the equipment needed to address the
equipment replacement cycle as well as the new equipment needed to handle the growth
in container trade. We work out the container handling equipment needed to handle 1m
TEU of container trade and use this as the basis for our annual demand forecast.
Figure 28: We use container terminal capacities to calculate the average annual container throughput of
each item of port equipment.
Source: Company data, Credit Suisse estimates
2008 2009 2010 2011 2012 2013 2014 2015 2016 2017 2018 2019 2020 2021 2022 AVG
Clarksons Container Trade %yoy 4.1% -9.2% 13.7% 7.8% 3.1% 5.1% 5.3% 2.2% 3.8%
Clarksons (Forecast implied) %yoy 5.3% 5.1%
IMF GDP History %yoy (RHS) 3.0% -0.1% 5.4% 4.2% 3.5% 3.4% 3.5% 3.4% 3.1%
IMF 2017 GDP F'cast %yoy (RHS) 3.5% 3.6% 3.7% 3.7% 3.7% 3.8%
Container Trade Growth Premium 1.1% -9.1% 8.3% 3.6% -0.4% 1.7% 1.8% -1.2% 0.7% 0.7%
Implied growth from IMF "GDP+" 4.2% 4.3% 4.4% 4.4% 4.4% 4.5%
Clarkson's Container Trade (mTEU) 182
CSe Global Container Trade (mTEU) 189 197 206 215 225 235
Trade Growth (mTEU) 7.7 8.2 8.7 9.1 9.5 10.2 8.9
Rounded
Average
Patrick
Brisbane
Patrick
Sydney
(Berths 6-
9)
Patrick
Melbourne
DPW Ldn
Gateway
(Phase 1)
DPW
Brisbane
VICTL
Melbourne
Phase 1 ECT Delta
TEU 800,000 1,600,000 1,400,000 1,600,000 900,000 600,000 5,000,000
STS 5 8 7 12 5 6 36
ASCs 60 16 12 140
Spreaders 5 8 7 72 21 18 176
Shuttles 27 44 54 40 14 11
AVGs 265
Other equipment* 60 16 12 140
TEU per STS 151,000 160,000 200,000 200,000 133,333 180,000 100,000 138,889
TEU per ASC 36,000 26,667 56,250 50,000 35,714
TEU per Spreader 39,000 160,000 200,000 200,000 22,222 42,857 33,333 28,409
TEU per Shuttle 63,000 29,630 36,364 25,926 40,000 64,286 54,545
TEU per AVG 19,000 18,868
TEU per other equipment* 36,000 26,667 56,250 50,000 35,714
*Reachstackers, empty container handlers
9 October 2017
European Cranes 17
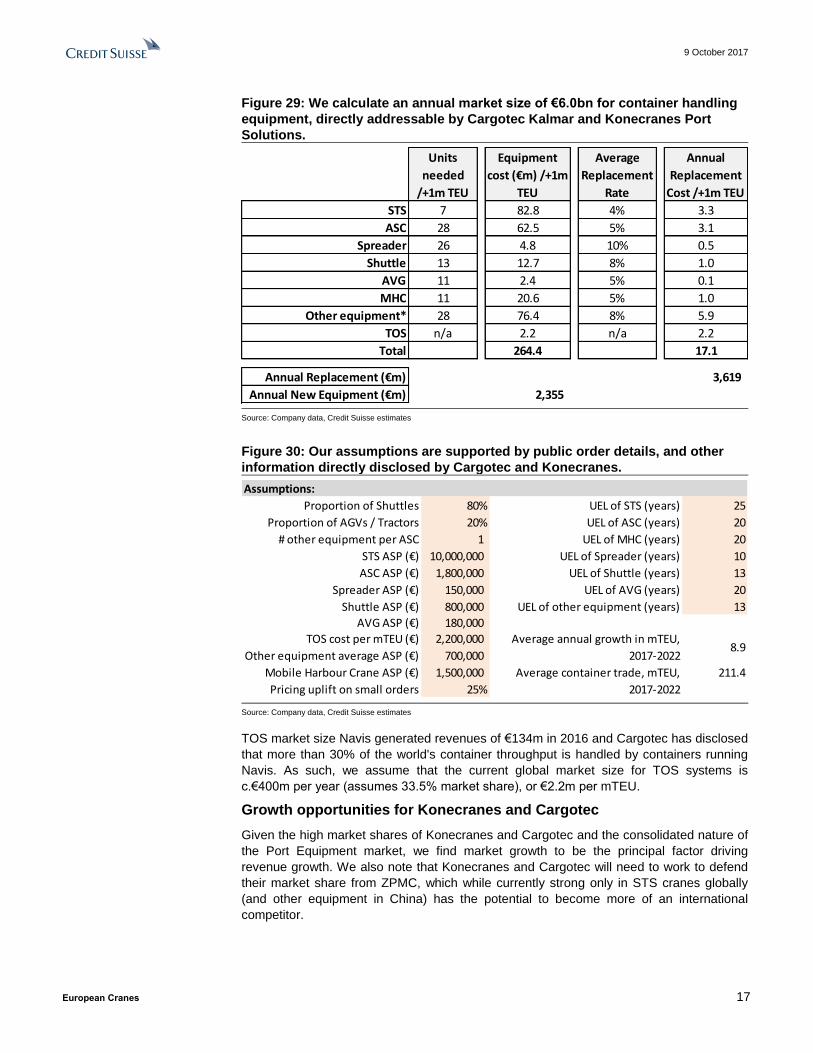
Figure 29: We calculate an annual market size of €6.0bn for container handling
equipment, directly addressable by Cargotec Kalmar and Konecranes Port
Solutions.
Source: Company data, Credit Suisse estimates
Figure 30: Our assumptions are supported by public order details, and other
information directly disclosed by Cargotec and Konecranes.
Source: Company data, Credit Suisse estimates
TOS market size Navis generated revenues of €134m in 2016 and Cargotec has disclosed
that more than 30% of the world's container throughput is handled by containers running
Navis. As such, we assume that the current global market size for TOS systems is
c.€400m per year (assumes 33.5% market share), or €2.2m per mTEU.
Growth opportunities for Konecranes and Cargotec
Given the high market shares of Konecranes and Cargotec and the consolidated nature of
the Port Equipment market, we find market growth to be the principal factor driving
revenue growth. We also note that Konecranes and Cargotec will need to work to defend
their market share from ZPMC, which while currently strong only in STS cranes globally
(and other equipment in China) has the potential to become more of an international
competitor.
Units
needed
/+1m TEU
New
Equipment
cost (€m) /+1m
TEU
Average
Replacement
Rate
Annual
Replacement
Cost /+1m TEU
STS 7 82.8 4% 3.3
ASC 28 62.5 5% 3.1
Spreader 26 4.8 10% 0.5
Shuttle 13 12.7 8% 1.0
AVG 11 2.4 5% 0.1
MHC 11 20.6 5% 1.0
Other equipment* 28 76.4 8% 5.9
TOS n/a 2.2 n/a 2.2
Total 264.4 17.1
Annual Replacement (€m) 3,619
Annual New Equipment (€m) 2,355
Proportion of Shuttles 80% UEL of STS (years) 25
Proportion of AGVs / Tractors 20% UEL of ASC (years) 20
# other equipment per ASC 1 UEL of MHC (years) 20
STS ASP (€) 10,000,000 UEL of Spreader (years) 10
ASC ASP (€) 1,800,000 UEL of Shuttle (years) 13
Spreader ASP (€) 150,000 UEL of AVG (years) 20
Shuttle ASP (€) 800,000 UEL of other equipment (years) 13
AVG ASP (€) 180,000
TOS cost per mTEU (€) 2,200,000
Other equipment average ASP (€) 700,000
Mobile Harbour Crane ASP (€) 1,500,000 211.4
Pricing uplift on small orders 25%
Average annual growth in mTEU,
2017-20228.9
Average container trade, mTEU,
2017-2022
Assumptions:
9 October 2017
European Cranes 18
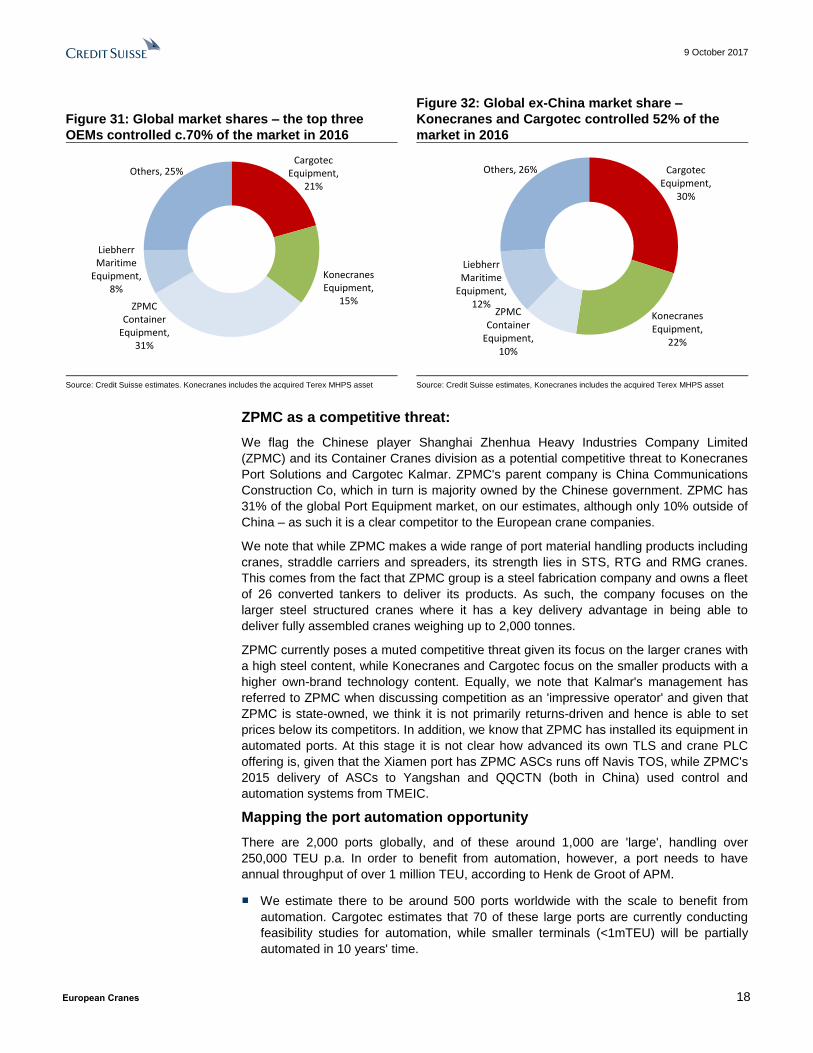
Figure 31: Global market shares – the top three
OEMs controlled c.70% of the market in 2016
Figure 32: Global ex-China market share –
Konecranes and Cargotec controlled 52% of the
market in 2016
Source: Credit Suisse estimates. Konecranes includes the acquired Terex MHPS asset Source: Credit Suisse estimates, Konecranes includes the acquired Terex MHPS asset
ZPMC as a competitive threat:
We flag the Chinese player Shanghai Zhenhua Heavy Industries Company Limited
(ZPMC) and its Container Cranes division as a potential competitive threat to Konecranes
Port Solutions and Cargotec Kalmar. ZPMC's parent company is China Communications
Construction Co, which in turn is majority owned by the Chinese government. ZPMC has
31% of the global Port Equipment market, on our estimates, although only 10% outside of
China – as such it is a clear competitor to the European crane companies.
We note that while ZPMC makes a wide range of port material handling products including
cranes, straddle carriers and spreaders, its strength lies in STS, RTG and RMG cranes.
This comes from the fact that ZPMC group is a steel fabrication company and owns a fleet
of 26 converted tankers to deliver its products. As such, the company focuses on the
larger steel structured cranes where it has a key delivery advantage in being able to
deliver fully assembled cranes weighing up to 2,000 tonnes.
ZPMC currently poses a muted competitive threat given its focus on the larger cranes with
a high steel content, while Konecranes and Cargotec focus on the smaller products with a
higher own-brand technology content. Equally, we note that Kalmar's management has
referred to ZPMC when discussing competition as an 'impressive operator' and given that
ZPMC is state-owned, we think it is not primarily returns-driven and hence is able to set
prices below its competitors. In addition, we know that ZPMC has installed its equipment in
automated ports. At this stage it is not clear how advanced its own TLS and crane PLC
offering is, given that the Xiamen port has ZPMC ASCs runs off Navis TOS, while ZPMC's
2015 delivery of ASCs to Yangshan and QQCTN (both in China) used control and
automation systems from TMEIC.
Mapping the port automation opportunity
There are 2,000 ports globally, and of these around 1,000 are 'large', handling over
250,000 TEU p.a. In order to benefit from automation, however, a port needs to have
annual throughput of over 1 million TEU, according to Henk de Groot of APM.
■ We estimate there to be around 500 ports worldwide with the scale to benefit from
automation. Cargotec estimates that 70 of these large ports are currently conducting
feasibility studies for automation, while smaller terminals (<1mTEU) will be partially
automated in 10 years' time.
Cargotec Equipment,
21%
Konecranes Equipment,
15%ZPMC Container
Equipment, 31%
Liebherr Maritime
Equipment, 8%
Others, 25% Cargotec Equipment,
30%
Konecranes Equipment,
22%
ZPMC Container
Equipment, 10%
Liebherr Maritime
Equipment, 12%
Others, 26%
9 October 2017
European Cranes 19
■ Currently, 40 are significantly automated, typically in the ASC stacking area only.
■ We identify seven ports that can be classified as semi-automated, where at least two
aspects of the terminal are automated:
− HHLA CTB Germany
− DPW London Gateway, UK
− Antwerp, Belgium
− DPW Brisbane, Australia
− Patrick Brisbane, Australia
− Patrick Sydney, Australia
− Jebel Ali T3 / T4, Dubai
■ We identify five ports that can be classified as fully or nearly fully automated:
− APM MV2 & ECT Delta, Rotterdam, Netherlands
− Los Angeles TraPac, US
− Long Beach Container Terminal, US
− VICT Melbourne, Australia
− Qingdao QQCTN, China
■ The bulk of the terminal automation market lies in the conversion of brownfield sites, as
opposed to the creation of new 'greenfield' ports. As such, inter-operability of
automated equipment with all brands, as well as the interface with legacy manual
equipment, is key for the container terminal operators.
■ Maersk wants to automate 20 terminals on the Rotterdam MV2 blueprint, and has
stated it aims for its cranes to "beat the manually-operated cranes' average
performance by 50%". The MV2 terminal cost $535m, according to Maersk.
■ DPW London Gateway is built with seven potential berths. Berths 1-3 are all in full use
(capacity: 1.6m TEU), while 4-7 are undeveloped and a decision on whether or not to
expand will be made in H2 2017 Implementation of automation will be more
straightforward in the future, drawing on lessons from the current offering. DP World
noted that the installation of Berth 3 was very simple and a direct copy of the system
already in place – Cargotec cites the 'copy with pride' principle as a pathway to
improve implementation.
■ The payback period of investing in an automated system is thought to be up to 6 years,
according to Cargotec Equally, though, developing and building the concept will take 4-
5 years.
Equipment choice
■ Port terminals typically involve several integrated systems. For example, London
Gateway uses Kalmar shuttle carriers and ASCs, ZPMC STS cranes partly automated
by ABB and OCR camera systems by CamCo. Most of the case studies cited by
Cargotec highlight the importance of being a systems integrator as well as
manufacturer.
■ Cargotec is aware of the risk of overlap with the big industrial automation names, and
approaches this by trying to create the right interface that works for the customer to
improve profitability, rather than focusing on selling a competing cloud product or a

9 October 2017
European Cranes 20
connectivity box. There are currently 17 terminals using Navis automated TOS,
including QQCTN, and they are integrated with products from a variety of other OEMs,
including Konecranes.
■ STS cranes are not typically automated due to software issues – according to DP
World, there is not a sufficiently stable system available yet. In readiness for the
required developments in software, one-third of the cranes at London Gateway are
automation-ready and can already be remotely controlled. We anticipate that ports that
have purchased 'automation-ready' equipment will switch over as soon as the Lifts per
Hour exceed those of manual operations, assuming labour negotiations are resolved.
■ In terms of servicing the largest ships, increasing the height and reach of cranes is
essential and a profitable business for Kalmar and Port Solutions (though Kalmar has a
mixed record in execution). We expect this business to continue growing steadily as
the average vessel size of the global fleet continues to increase.
■ We see automation as an interesting driver to accelerate the replacement cycle; DP
World tends to replace equipment before the expected end-of-life as new technology is
introduced. Across the board, DP World builds everything automation-ready as an
operational hedge against rising labour costs.
Conclusion:
We think 2018 will prove to be a key milestone in terminal automation: LPH rates at
automated terminals will exceed those at manual terminals, while safety and
environmental benefits should increase the appeal of automated terminals across both
cost and operational criteria.
We forecast the Port Operator CapEx cycle turning in 2018: This should provide a
supportive base for automation offerings as port operators' investment decisions catch up.
Chinese competition in certain equipment types, but not automation – yet: We flag
ZPMC as a credible competitor in certain product types, but currently this only extends to
STS and ASCs, where the proportion of steel relative to technology is much higher. We
also note that ZPMC currently outsources the procurement of automated systems that are
built into its cranes. However, we continue to watch for signs of improvement in ZPMC's
in-house technology.
Union strength will likely be a hurdle: We anticipate that Port Operators' negotiations
with employee unions will be complex and could dampen the speed of automation uptake.
As a result, we do not explicitly build benefits in volume and pricing from automation into
our forecasts.
Figure 33: What are we discounting?
Source: Company data, Credit Suisse estimates
2008 2009 2010 2011 2012 2013 2014 2015 2016 2017E 2018E 2019E 2020E
World Container Exports growth 4% -9% 14% 8% 3% 5% 5% 2% 4% 4% 4% 4% 4%
CS Proprietary Port Capex Growth Model 19% -29% 4% 22% 8% 9% -13% 29% 1% -8% 8% 14% 8%
Cargotec Kalmar org. growth 16% -33% -12% 19% 24% 5% -3% 4% 2% -1% 4% 12% 7%
Konecranes P.S. org. growth -4% 3% 13% 8%

9 October 2017
European Cranes 21
Medium-term Driver #2: Industrial Crane and Port Equipment industry concentration should lead to better margins
Summary:
1. Industry concentration in Industrial and Container cranes has now reached its likely
conclusion, in our view, following c.20 separate acquisitions in the space, culminating with
Konecranes' acquisition of Terex MHPS.
2. According to our estimates, in Container cranes, Cargotec, Konecranes and ZPMC
control 70% of the market, while globally ex. China, Cargotec and Konecranes control
c.60% of the market.
3. In the Global Industrial crane market, the top two OEMs, Konecranes and Columbus
McKinnon, control c.50% of the market, with no other players of similar scale.
4. We find the remedy enforced by the European Commission following the MHPS
acquisition relatively favourable for Konecranes, requiring only divestment of a specialist
product group with €135m in annual revenues while the company gains €436m of NI
sales, further concentrating the mid-range market in particular.
5. As a result of industry concentration, we identify pricing tailwinds worth 75bps in 2018E
and 50bps in 2019E for Konecranes, mainly in the Industrial crane segment, while deal-
related synergies provide €140m of run-rate EBIT benefit by 2021E.
Figure 34: Kito, Columbus McKinnon and Konecranes the scale players in Industrial cranes, while
Cargotec, Konecranes, ZPMC and Liebherr are the only OEMs with diversified Port Equipment offerings
Source: Company data, Credit Suisse estimates. We have only included acquisitions from the Industrial Crane and Port Equipment markets.
1994
1995
1996
1997
1998
1999
2000
2001
2002
2003
2004
2005
2006
2007
2008
2009
2010
2011
2012
2013
2014
2015
2016
2017
PWB Anchor
ARMSEL MHE
Kito Kito
Yale International
Columbus McKinnon Columbus McKinnon
CVS Ferrari CVS Ferrari
Belotti * Cargotec's bid for CVS Ferrari was blocked CVS Service
by the German Competition Commission
Demag Cranes
Noell
Fantuzzi
Terex (MHPS)
WMI Cranes Ltd
Asio Sistemas de Elevacion
Eydimen 2000
Meiden Host Systems
Consens Transport Sys.
MMH
Stahl Cranesystems
SMV Lifttrucks AB
MAN SWF
Konecranes Konecranes
Kone
Cargotec Cargotec
Navis
Asciano Automation
ZPMC ZPMC
Liebherr Liebherr

9 October 2017
European Cranes 22
Market shares by product type
Port Equipment:
Ship to Shore (STS) cranes: ZPMC is the clear leader globally and in Europe. As a steel
structures fabricator with its own transport fleet, ZPMC looks ideally placed to dominate
this product type. We anticipate that Cargotec may erode a small portion of ZPMC's
market share, having announced that it will produce STS cranes at its Taicang, China
production site. The Konecranes / Terex MHPS transaction has had a small impact in
concentrating this market, bringing the number of competitors to ZPMC down from four to
three; however due to the market domination by ZPMC; we do not expect the market
dynamics to change significantly.
Figure 35: Global STS Crane Market Share was
dominated by ZPMC in 2016
Figure 36: EMEA + Americas STS Crane Market
Share in 2016
Source: WorldCargoNews 2016 Source: WorldCargoNews, Credit Suisse estimates
Automatic Stacking Cranes (ASC): the Konecranes / Terex MHPS transaction has
significantly increased supplier concentration. Globally, the three largest players control
85% of the market, and within Europe this rises to c.97% of the market. The effect of the
consolidation is most visible in Europe, where Konecranes now controls 40% of the
market, having previously had only a 25% market share, behind Cargotec.
Figure 37: Global ASC Crane Market Share Figure 38: Europe ASC Crane Market Share
Source: European Commission (2016) Source: European Commission (2016)
ZPMC82%
Konecranes1.5%
Terex Demag1.5%
Liebherr7.0%
Sany0.7%
Kocks Krane3.0%
Others4%
ZPMC69.8%
Konecranes3.2%
Terex Demag3.2%
Liebherr14.3%
Sany1.6%
Kocks Krane4.8%
ZPMC35%
Konecranes25%
Terex Demag
8%
Cargotec25%
Hans Kunz8%
ZPMC3%
Konecranes15%
Terex Demag
25%Cargotec35%
Hans Kunz23%
9 October 2017
European Cranes 23
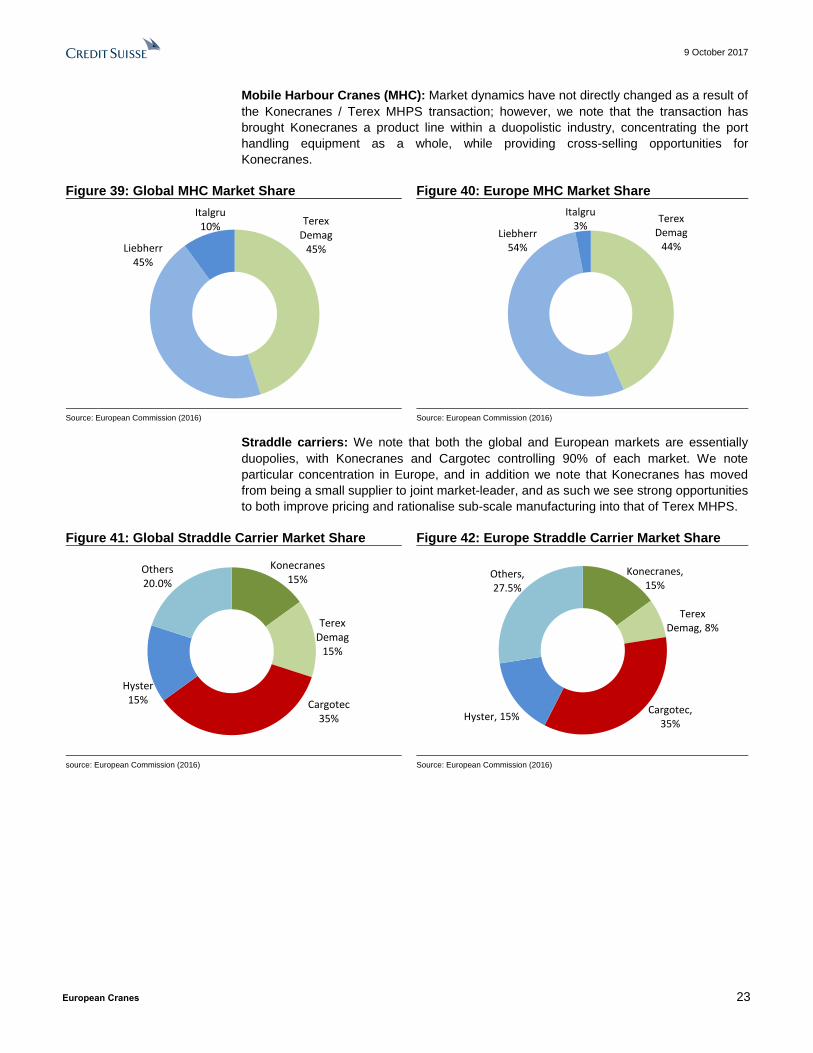
Mobile Harbour Cranes (MHC): Market dynamics have not directly changed as a result of
the Konecranes / Terex MHPS transaction; however, we note that the transaction has
brought Konecranes a product line within a duopolistic industry, concentrating the port
handling equipment as a whole, while providing cross-selling opportunities for
Konecranes.
Figure 39: Global MHC Market Share Figure 40: Europe MHC Market Share
Source: European Commission (2016) Source: European Commission (2016)
Straddle carriers: We note that both the global and European markets are essentially
duopolies, with Konecranes and Cargotec controlling 90% of each market. We note
particular concentration in Europe, and in addition we note that Konecranes has moved
from being a small supplier to joint market-leader, and as such we see strong opportunities
to both improve pricing and rationalise sub-scale manufacturing into that of Terex MHPS.
Figure 41: Global Straddle Carrier Market Share Figure 42: Europe Straddle Carrier Market Share
source: European Commission (2016) Source: European Commission (2016)
Terex Demag
45%Liebherr45%
Italgru10%
Terex Demag
44%Liebherr
54%
Italgru3%
Konecranes15%
Terex Demag
15%
Cargotec35%
Hyster15%
Others20.0%
Konecranes, 15%
Terex Demag, 8%
Cargotec, 35%
Hyster, 15%
Others, 27.5%

9 October 2017
European Cranes 24
Reach stackers: The market has been significantly concentrated following the
Konecranes / Terex MHPS consolidation, bringing 80% of the global market, and c.73% of
the European market under the control of three rather than four players. We see the reach
stacker market as being a potential area for continued consolidation given the fragmented
players (CVS Ferrari, Liebherr, Hoist, Unicarriers) operating in the residual part of the
market. That being said, we also note that reach stackers are not the highest-value items
in the port terminal handling portfolio given that they are not an automation target and use
hydraulic systems rather than motors and drives.
Figure 43: Global Reach Stacker Market Share Figure 44: Europe Reach Stacker Market Share
Source: European Commission (2016) Source: European Commission (2016)
Terminal Operating Software (TOS): Navis is the undisputed leader with a 25% market
share in a highly fragmented market (when excluding the small terminals, Navis has 39%
market share). TOS is a key part of Cargotec's acquisition strategy as the company aims
to invest in software assets, and as such we see this part of the market consolidating as
Cargotec acquires smaller vendors or takes large in-house generated software systems
under the Navis name. Konecranes has only a sub-scale offering in TOS that was
acquired from Terex. Both Konecranes and ZPMC sell Navis in their automation projects.
Figure 45: Global TOS Market Share (All Port Terminals)
Source: Cargotec Software Analyst day 2017
Konecranes7%
Terex Demag
38%Cargotec
45%
Liebherr5%
Others5% Konecranes
7%
Terex Demag45%
Cargotec45%
Liebherr3%
25%
4%
5%
3%5%
3%3%16%
36%
Cargotec Navis
TSB
Tideworks
Huadong
Jade
China Merchants
PSA
Others
Small Terminals
9 October 2017
European Cranes 25
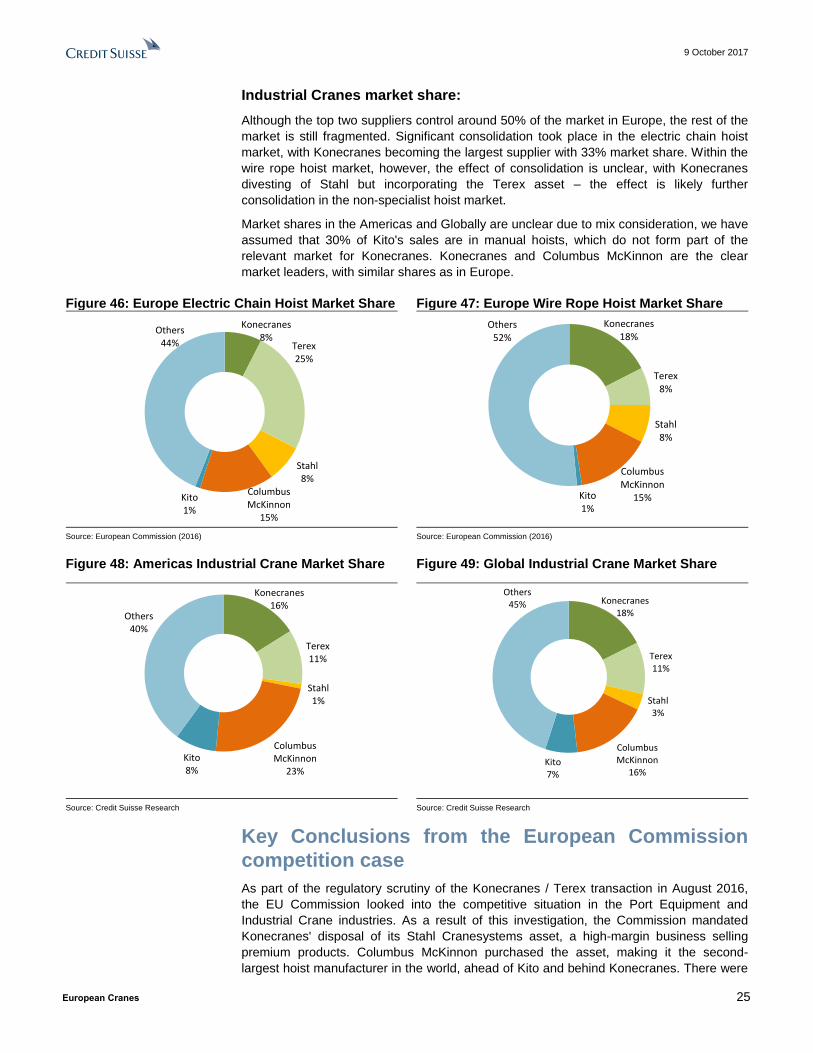
Industrial Cranes market share:
Although the top two suppliers control around 50% of the market in Europe, the rest of the
market is still fragmented. Significant consolidation took place in the electric chain hoist
market, with Konecranes becoming the largest supplier with 33% market share. Within the
wire rope hoist market, however, the effect of consolidation is unclear, with Konecranes
divesting of Stahl but incorporating the Terex asset – the effect is likely further
consolidation in the non-specialist hoist market.
Market shares in the Americas and Globally are unclear due to mix consideration, we have
assumed that 30% of Kito's sales are in manual hoists, which do not form part of the
relevant market for Konecranes. Konecranes and Columbus McKinnon are the clear
market leaders, with similar shares as in Europe.
Figure 46: Europe Electric Chain Hoist Market Share Figure 47: Europe Wire Rope Hoist Market Share
Source: European Commission (2016) Source: European Commission (2016)
Figure 48: Americas Industrial Crane Market Share Figure 49: Global Industrial Crane Market Share
Source: Credit Suisse Research Source: Credit Suisse Research
Key Conclusions from the European Commission
competition case
As part of the regulatory scrutiny of the Konecranes / Terex transaction in August 2016,
the EU Commission looked into the competitive situation in the Port Equipment and
Industrial Crane industries. As a result of this investigation, the Commission mandated
Konecranes' disposal of its Stahl Cranesystems asset, a high-margin business selling
premium products. Columbus McKinnon purchased the asset, making it the second-
largest hoist manufacturer in the world, ahead of Kito and behind Konecranes. There were
Konecranes8%
Terex25%
Stahl 8%
Columbus McKinnon
15%
Kito1%
Others44%
Konecranes18%
Terex8%
Stahl 8%
Columbus McKinnon
15%Kito1%
Others52%
Konecranes16%
Terex11%
Stahl 1%
Columbus McKinnon
23%
Kito8%
Others40%
Konecranes18%
Terex11%
Stahl 3%
Columbus McKinnon
16%Kito7%
Others45%
9 October 2017
European Cranes 26
no remedies required in the port machinery markets. Interestingly, the European
Commission considered the industrial crane market (i.e. the fully constructed crane
including steel structure) to be distinct from the industrial hoist market.
In our view, and as confirmed by Konecranes in past earnings calls, the motors, gears and
drives contain the technology content and drive service revenues. In addition, Konecranes
supplies these components to independent crane builders which carry different branding
(the 'power' brands) but are essentially the same product. As such, in some competitive
tenders, a Konecranes branded crane is tendering alongside one built by a local crane
builder but using a Konecranes power brand hoist. With both businesses equally profitable
to Konecranes, we see this route to market as advantageous, particularly in the context of
industry concentration.
As such, arguably Konecranes may have sidestepped some competitive concerns in only
being required to dispose of Stahl Cranesystems (€135m in annual revenues), while
growing its Industrial Equipment business by 36% and its Industrial Crane Service
business by 33%.
Link to EU Commission Findings
Industrial cranes (standard cranes and process cranes):
EU Commission Findings:
Industrial cranes allow handling loads, between 100 kilos and 100 tons.
Konecranes and Terex were well-established players in industrial cranes, and
Terex's KBK also has a strong product offering in modular cranes.
Standard industrial cranes are mainly used for lifting heavy loads, whereas
modular cranes are used in the assembly areas of production sites for light
loads (up to 2 tons), short span (below 8 metres), more precise than
standard cranes, as well as more expensive (up to 5 times the price of a
standard crane).
In the course of the European Commission market investigation, the majority
of customers indicated that they normally buy cranes prevalently in their own
country of operation and have limited information about pricing and
competitive offers made abroad.
Standard cranes is a mature market where barriers to entry are low and
expansion is easy. According to the Parties, there are no switching costs for
customers, who usually make their purchasing decision purely on the basis of
cost considerations. Finally, the Parties argue that there is excess capacity in
the market and that certain categories of customers of standard cranes, such
as OEMs and automotive players, can exert a significant degree of
bargaining power on standard crane suppliers.
Konecranes' brands have a price advantage (i.e. low prices) whereas Terex'
advantage is linked to the high quality, good reputation and the resulting high
brand loyalty associated to its products. In modular cranes, Terex KBK is
perceived as the best.
The majority of crane suppliers are not vertically integrated, but depend on
external suppliers for key components such as hoists. This implies that the
presence of alternative suppliers would likely eliminate all risks of anti-
competitive effect of the Transaction in relation to the crane markets.
CS view: Consolidation in a mature market is key to improving profitability. Konecranes is
a component supplier as well as industrial crane builder under its Verlinde, SWF, R&M
and now Demag brands. As such, we see Konecranes as particularly well positioned to
benefit from the consolidation.

9 October 2017
European Cranes 27
Hoists for industrial cranes:
EU Commission Findings:
The hoist is the lifting device of a crane, with either chain or wire rope.
Serially produced wire rope hoists are available with capacity up to 100T.
Largest volumes of chain hoists sold are with capacity up to 5T. Hoists can
be segmented in relation to their ability to change lifting and travelling speed.
Variable speed hoists, are particularly valuable in applications where care or
precision is needed. Most hoists only allow fixed speeds. The ability of
varying the speed is obtained by fitting a hoist with a frequency inverter.
The notifying party submits that the relevant geographic market for hoists is
global. This conclusion is based on the consideration that hoists are small
and relatively light, which makes long-distance transportation cost-efficient
Konecranes’ and Terex's price lists are brand-specific and global. Volume is
the main factor when considering discounts. Brands are consistently included
among the most relevant criteria for selecting a hoist supplier
The mix of distribution channels used by hoists' suppliers also varies by
country. One qualified hoists' competitor noted that "In Germany, France,
Netherlands and Austria, GI distribution plays a bigger role. In other countries
the crane builders and buyers of crane components/ component distributors
are more important. There is a high portion of direct sales from producers.
Demag is the leader in Germany/Austria while Konecranes' Verlinde is
strongest in France. Germany is the largest market in Europe for hoists,
accounting for c.35% of EEA sales for electric chain hoists and for c.25% of
total EEA sales for wire rope hoists.
The Commission understands that Konecranes (Stahl, SWF, Verlinde) and
Terex brands (Demag and Donati) are highly recognised amongst hoist users
as high quality and expensive products which constitute the main alternative.
One crane builder noted "Their products are becoming increasingly
expensive and in line and it is becoming very hard to find competitive prices
which was very easy before Kone bought out all the other companies"
As a consequence of these (and other) views, the Commission understands
that a majority of crane builders see the Transaction as having a negative
effect for hoists. The balance of views is stronger for variable speed wire rope
hoists and electric chain hoists. The Commission understands that similar
concerns have been echoed by distributors of hoists and to a lesser extent by
competitors for hoists. On these bases, the Commission considers that, even
if barriers to entry do not appear to be particularly high in technical terms, the
current saturation of the hoist markets by the major manufacturers would
make it particularly challenging to enter such markets, especially in Germany.
CS view: This strong response from customers drove the Commission to request the
disposal of Stahl, which reduced the market dominance of Konecranes, particularly in
France and Germany. The Commission considered the disposal of the whole overlap for
wire rope hoists and about half the overlap for electric chain hoists in the EEA and
Germany, while removing around half the overlap for wire rope hoists and electric chain
hoists in France. We find it interesting to note that hoist competitors (Kito, Columbus
McKinnon) were less opposed to the transaction than customers and distributors. We see
this as a sign that consolidation will improve pricing discipline among OEMs and reduce
competitive pressure in tenders.
9 October 2017
European Cranes 28
Provision of industrial crane services:
EU Commission Findings:
Konecranes offers services for its own and 3rd
party industrial cranes. Terex
has more limited services, which are focused on its own installed base.
The proposed Transaction gives rise to horizontally affected markets for the
supply of services in 8 European countries, where the Parties' combined
market share would range between [20-30]% (Austria, Estonia, Hungary) and
[50-60]% (Finland).
During the investigation, market participants (especially independent service
providers) raised concerns also in relation to the availability and prices of
spare parts post-merger, as well as on the availability and accessibility of the
certificates to be issued by the merged entity in order to allow third party
suppliers to perform inspections/maintenance/repairs on cranes and cranes
components. The Commission considers that those concerns are not
specifically linked to the proposed Transaction as access to spare parts was
already under the exclusive control of OEMs prior to the merger.
CS view: We note that Stahl Cranesystems was not sold with any service business, so the
transaction has further consolidated the fragmented market for industrial crane services.
We do not see any resulting sales synergies from the consolidation, though clearly there
may be cost synergies from joining service centres and growing the density of installed
base per service centre.
Supply of port equipment:
EU Commission Findings:
In straddle carriers, while Terex has been very strong, Konecranes is a small
player; its straddle carrier business has been unprofitable for a number of
years. Konecranes shut down its plant in Germany that was dedicated to
straddle carriers and shifted to using subcontractors. Consistent with this
phasing-out strategy, Konecranes has adopted an extremely selective
bidding strategy
The Commission considers that the Transaction entails a reduction of the
number of sizable players in the straddle carrier market from three to two.
The Parties submit that ZPMC is believed to be bidding to supply straddle
carriers in both U.S. and European opportunities
In ASCs, the Commission understands that neither Terex nor Konecranes
are considered as important suppliers for ASCs. In this relatively new market,
competition for all contracts is intense, particularly for the larger international
contracts that serve to attract even further business. Besides, the Parties
submit they will face aggressive price competition from ZPMC (although its
presence in Europe remains fairly limited).
The Commission did not identify any issues in the Reach Stackers market.
CS view: The competitive pressure from ZPMC was generally flagged as a factor
preventing a duopoly in port equipment, though we note that ZPMC is less of a competitive
threat in Europe and the US than in its home market of China. We also find it interesting
that the Commission left the exact definition of an ASC imprecise, and did not consider the
RTG or RMG markets in its analysis. We see the consolidation as a positive for
Konecranes and Cargotec, both in bringing down the number of global players from four
to three and creating opportunities to bring together sub-scale equipment manufacturing
facilities at Konecranes – for instance via closure of the lossmaking Lentigione site for
container handlers and terminal tractors.

9 October 2017
European Cranes 29
Effect on Pricing
In the port equipment market, we do not expect consolidation to lead to immediate
improvements in pricing dynamics, as the industry is currently in a hiatus period while the
port terminal operators' capex cycle turns. In the mid-term, however, we expect the
consolidation to be protective for Cargotec Kalmar's and Konecranes Port Solutions'
pricing, and should offset the pricing pressure generated by the port operators who are
careful to spread tenders across multiple vendors where possible. The transaction has
also provided Konecranes with the scale to catch up with Cargotec.
Hou and Robinson examined a range of industries for the years 1963-2001 and found that
concentrated industries earned above-average profits, with average EBIT margins ranging
from 11.0% for the lowest-concentration quintile to 13.6% for the highest (Industry
Concentration and Average Stock Returns, Hou and Robinson, 2006). The difference in
margin between quintiles was highest between the second-highest and highest quintiles,
where there was a 120bps margin difference due to lower competition.
There have been notable improvements in price dynamics within the Industrial Cranes end
market following the Konecranes MHPS Consolidation, with Konecranes and competitors
reporting improved pricing power and price increases being reflected in the US PPI data
as well, with an average 80bps increase in price between December 2016 and March
2018. While causation cannot be proven, we see better price dynamics as a natural effect
of the consolidation in the lower-margin industrial equipment segment.
Management comments in the companies' recent results calls bear this out.
Konecranes:
Q1 2017: “We have seen some changes in the marketplace that some of our
competitors have been actually increasing prices. And we see that the overall
market price environment is somewhat increasing.”
Q2 2017: "Maybe even the market prices have been going a little bit above
the cost inflation level. And seems that we have been successful in pushing
that forward in our pricing structure" (in equipment).
Columbus McKinnon:
Q1 2017*: "we expect more pricing than we had in this past year, which was
in the 10 to 20 basis point range to somewhere between 50 and 100 basis
points will be kind of the range to expect for the coming year."
Q2 2017*: "So the price increase is effective in July. It's on select products,
mainly our wire rope hoist products. One of our largest competitors has also
raised prices as well, effective in July. And we think in total that it's probably
worth about 15 basis points of price for us, which will get us back to the 50
basis points guidance for the year."
* Calendarised, Q4 17, Q1 18 according to Columbus McKinnon year-end.
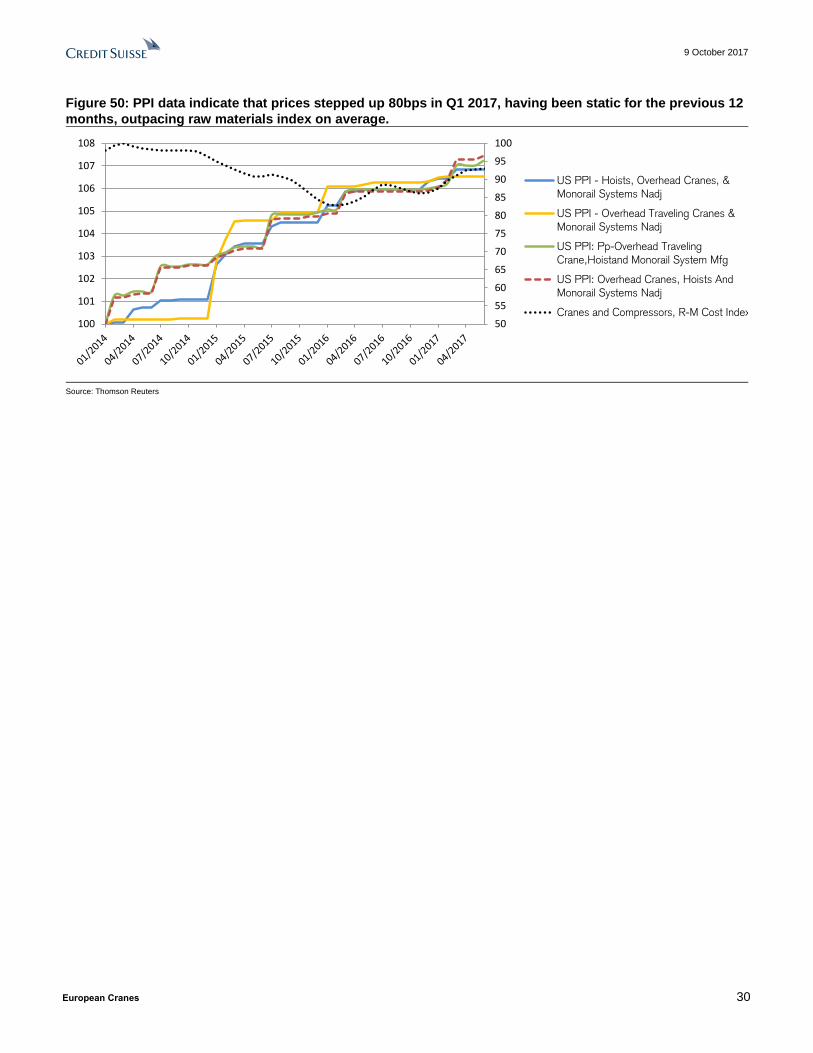
9 October 2017
European Cranes 30
Figure 50: PPI data indicate that prices stepped up 80bps in Q1 2017, having been static for the previous 12
months, outpacing raw materials index on average.
Source: Thomson Reuters
50
55
60
65
70
75
80
85
90
95
100
100
101
102
103
104
105
106
107
108
US PPI - Hoists, Overhead Cranes, &
Monorail Systems Nadj
US PPI - Overhead Traveling Cranes &
Monorail Systems Nadj
US PPI: Pp-Overhead Traveling
Crane,Hoistand Monorail System Mfg
US PPI: Overhead Cranes, Hoists And
Monorail Systems Nadj
Cranes and Compressors, R-M Cost Index

9 October 2017
European Cranes 31
Company and end-market benchmarking
Summary:
1. When comparing the crane OEMs with the mechanical peer group in terms of
aftermarket sales, we find that Konecranes falls in the third quartile, while Cargotec lags in
the bottom quartile.
2. The crane companies are clearly under-earning relative to the mechanical peer group.
We see clear opportunities for Konecranes to close the gap through pricing power and
synergies, while Cargotec faces a tougher challenge in self-help.
3. Konecranes screens better for R&D efficiency relative to Cargotec, with capitalised R&D
aligned with R&D turnover.
Company benchmarking
Aftermarket sales:
■ In terms of aftermarket sales, Konecranes screens well, with 42% of its sales coming
from service and spares. Konecranes reports its service business separately, and
growing in the service segment has been a clear strategy. We note that Konecranes
has been able to continue the growth of its service business in absolute terms, despite
the challenging end-market situation that is clear from the product sales.
■ Cargotec has historically struggled to grow its service business, and currently
generates 25% of its sales from services. Cargotec's growth of service revenues has
been in line with product revenue growth; however, we are reassured to see that during
2016, service revenues saw an only limited decline in contrast to the equipment
business.
Figure 51: Konecranes Service vs. NI sales index Figure 52: Cargotec Service vs. NI sales index
Source: Company data, Credit Suisse estimates Source: Company data, Credit Suisse estimates
■ Konecranes' service business has been significantly more stable in downturns than
Cargotec's. While both service businesses show a rather strong correlation with OE
growth rates, the Pearson correlation between service and product growth for Cargotec
is 89%, while at Konecranes it is lower, at 75%.
90
100
110
120
130
Konecranes Equipment Konecranes Services
90
100
110
120
130
Cargotec equipment Cargotec service

9 October 2017
European Cranes 32
Figure 53: Konecranes service vs. NI organic
growth rates show a 75% correlation
Figure 54: Cargotec service vs. NI organic growth
rates show an 89% correlation
Source: Company data, Credit Suisse estimates Source: Company data, Credit Suisse estimates
When benchmarking the percentage of aftermarket sales at the European crane
companies against the wider Mechanical peer group, Konecranes falls in the second
quartile while Cargotec is in the lowest quartile.
Figure 55: Proportion of aftermarket sales – Konecranes features in the top half
of the mechanical peer-group as of 2016
Source: Company data
Operating Margins:
■ Overall, the European Crane OEMs have under-earned their mechanical peers,
although they have started to catch up over 2015-2017 YTD.
■ Konecranes has seen a more consistent performance since 2011 due to its more
homogenous product range and higher proportion of sales derived from services. That
said, overall the margin has been on average below that of Cargotec as well as the
sector, highlighting the large potential benefits to be gained from the Terex MHPS
acquisition in terms of gaining scale and improving service density.
■ Cargotec has seen its margins accelerate as a result of the strong growth and margin
performance of Hiab more than offsetting declines in MacGregor.
■ We see Konecranes as able to move back ahead of Cargotec as Hiab looks for growth
in emerging markets, while Konecranes should see the benefits from industry
concentration and deal-related synergies.
-40%
-20%
0%
20%
40%
Konecranes Equipment, % yoyKonecranes Service, % yoy
-60%
-40%
-20%
0%
20%
40%
Cargotec Equipment % yoy Cargotec Service % yoy
10%
10% 20%
25%31% 33% 33% 40% 42% 45%
46%51%
66%67%

9 October 2017
European Cranes 33
Figure 56: While under-earning against the mechanicals, the European crane
companies are beginning to catch up
Source: Company data, Credit Suisse estimates
Figure 57: With margins at the lower end of the industrial peers, we find the
crane companies attract lower EV/EBITA multiples, with Cargotec rewarded a
little more than Konecranes, which we see as unjustified
Source: Credit Suisse estimates
0%
2%
4%
6%
8%
10%
12%
14%
Mechanicals underlying EBITA margin 4QMAKonecranes underlying EBITA margin 4QMACargotec underlying EBITA margin 4QMA
ABB
LEGRANDPHILIPS
SCHNEIDER
SIEMENS
NEXANS
PRYSMIAN
ALFA LAVAL
ASSA ABLOY
ATLAS COPCO
ELECTROLUX
GEA
KONE
METSOSANDVIK
SCHINDLER
SKF
WARTSILA
BODYCOTE
HALMA
IMI
ROTORK
SMITHS GROUP
WEIR
CARGOTEC
KONECRANES
9
10
11
12
13
14
15
16
17
18
19
4% 6% 8% 10% 12% 14% 16% 18% 20% 22% 24%
2018E
EV
/EB
ITA
2018E EBITA Margin
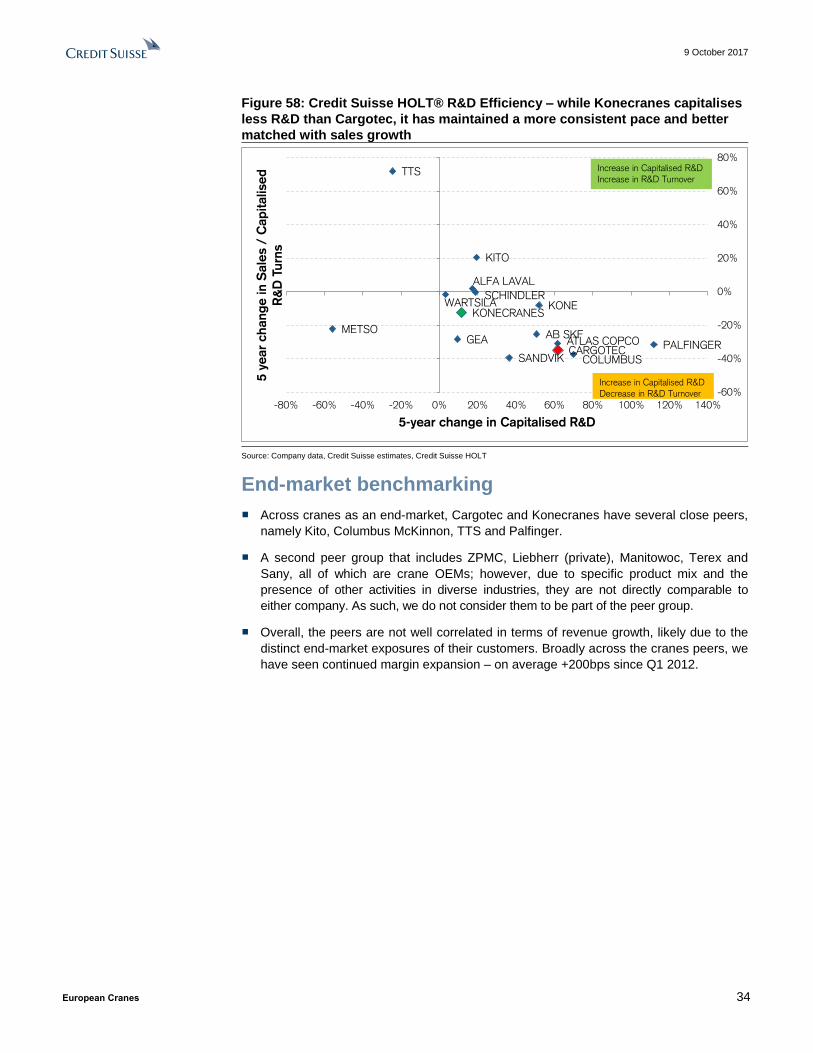
9 October 2017
European Cranes 34
Figure 58: Credit Suisse HOLT® R&D Efficiency – while Konecranes capitalises
less R&D than Cargotec, it has maintained a more consistent pace and better
matched with sales growth
Source: Company data, Credit Suisse estimates, Credit Suisse HOLT
End-market benchmarking
■ Across cranes as an end-market, Cargotec and Konecranes have several close peers,
namely Kito, Columbus McKinnon, TTS and Palfinger.
■ A second peer group that includes ZPMC, Liebherr (private), Manitowoc, Terex and
Sany, all of which are crane OEMs; however, due to specific product mix and the
presence of other activities in diverse industries, they are not directly comparable to
either company. As such, we do not consider them to be part of the peer group.
■ Overall, the peers are not well correlated in terms of revenue growth, likely due to the
distinct end-market exposures of their customers. Broadly across the cranes peers, we
have seen continued margin expansion – on average +200bps since Q1 2012.
KONECRANES
CARGOTECCOLUMBUS
PALFINGERSANDVIK
WARTSILA
ATLAS COPCO
KONE
TTS
ALFA LAVAL
KITO
AB SKF
SCHINDLER
GEAMETSO
-60%
-40%
-20%
0%
20%
40%
60%
80%
-80% -60% -40% -20% 0% 20% 40% 60% 80% 100% 120% 140%
5 y
ear
ch
ang
e in S
ale
s /
Cap
italised
R&
D T
urn
s
5-year change in Capitalised R&D
Increase in Capitalised R&D
Increase in R&D Turnover
Increase in Capitalised R&D
Decrease in R&D Turnover

9 October 2017
European Cranes 35
Figure 59: Margins across the cranes end-market have continued to improve
Source: Company data
Figure 60: Revenue growth trends across the end market are not well
correlated, though we note strong average growth across the period of c6%
Source: Company data
0%
2%
4%
6%
8%
10%
12%
Q12012
Q22012
Q32012
Q42012
Q12013
Q22013
Q32013
Q42013
Q12014
Q22014
Q32014
Q42014
Q12015
Q22015
Q32015
Q42015
Q12016
Q22016
Q32016
Q42016
Q12017
Q22017
Margins
Cargotec Konecranes Palfinger
Columbus McKinnon (RHS) Kito Peer Group 1 average
-15%
-10%
-5%
0%
5%
10%
15%
20%
25%
Q12013
Q22013
Q32013
Q42013
Q12014
Q22014
Q32014
Q42014
Q12015
Q22015
Q32015
Q42015
Q12016
Q22016
Q32016
Q42016
Q12017
Q22017
Revenue
Cargotec (Cse organic) Konecranes (constant currency)
Palfinger Columbus McKinnon (organic where stated)
Kito Peer Group 1 average
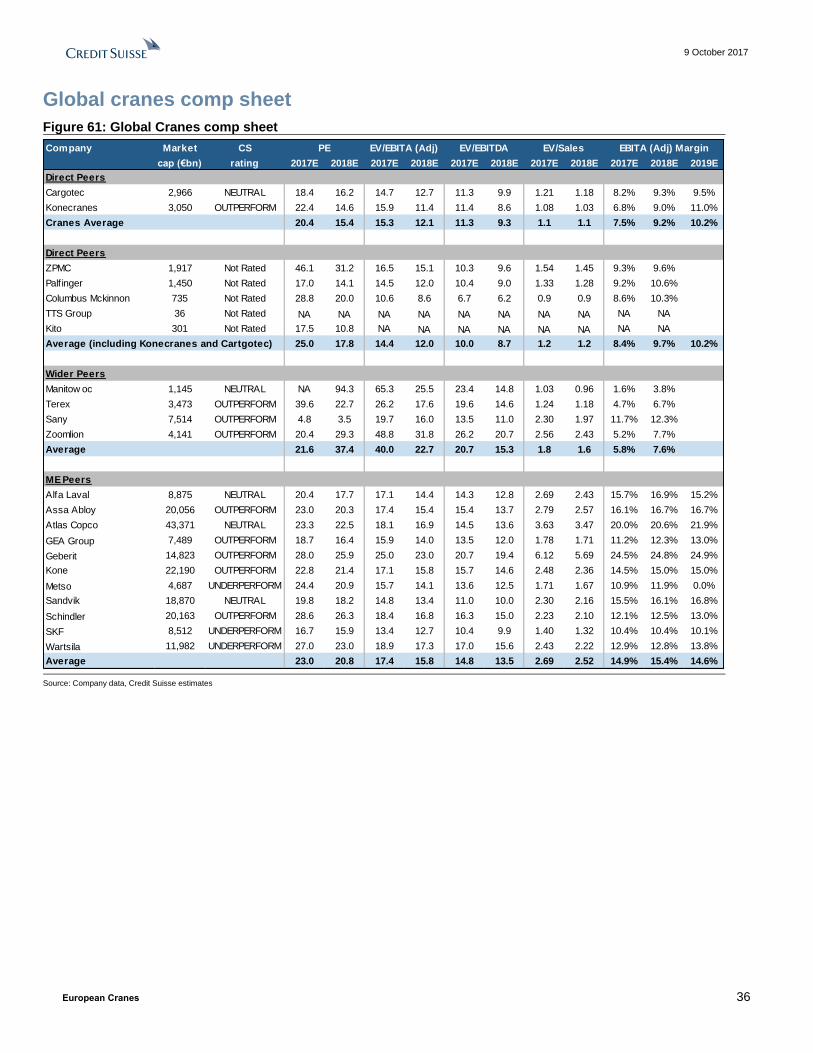
9 October 2017
European Cranes 36
Global cranes comp sheet
Figure 61: Global Cranes comp sheet
Source: Company data, Credit Suisse estimates
Company Market CS
cap (€bn) rating 2017E 2018E 2017E 2018E 2017E 2018E 2017E 2018E 2017E 2018E 2019E
Direct Peers
Cargotec 2,966 NEUTRAL 18.4 16.2 14.7 12.7 11.3 9.9 1.21 1.18 8.2% 9.3% 9.5%
Konecranes 3,050 OUTPERFORM 22.4 14.6 15.9 11.4 11.4 8.6 1.08 1.03 6.8% 9.0% 11.0%
Cranes Average 20.4 15.4 15.3 12.1 11.3 9.3 1.1 1.1 7.5% 9.2% 10.2%
Direct Peers
ZPMC 1,917 Not Rated 46.1 31.2 16.5 15.1 10.3 9.6 1.54 1.45 9.3% 9.6%
Palfinger 1,450 Not Rated 17.0 14.1 14.5 12.0 10.4 9.0 1.33 1.28 9.2% 10.6%
Columbus Mckinnon 735 Not Rated 28.8 20.0 10.6 8.6 6.7 6.2 0.9 0.9 8.6% 10.3%
TTS Group 36 Not Rated NA NA NA NA NA NA NA NA NA NA
Kito 301 Not Rated 17.5 10.8 NA NA NA NA NA NA NA NA
Average (including Konecranes and Cartgotec) 25.0 17.8 14.4 12.0 10.0 8.7 1.2 1.2 8.4% 9.7% 10.2%
Wider Peers
Manitow oc 1,145 NEUTRAL NA 94.3 65.3 25.5 23.4 14.8 1.03 0.96 1.6% 3.8%
Terex 3,473 OUTPERFORM 39.6 22.7 26.2 17.6 19.6 14.6 1.24 1.18 4.7% 6.7%
Sany 7,514 OUTPERFORM 4.8 3.5 19.7 16.0 13.5 11.0 2.30 1.97 11.7% 12.3%
Zoomlion 4,141 OUTPERFORM 20.4 29.3 48.8 31.8 26.2 20.7 2.56 2.43 5.2% 7.7%
Average 21.6 37.4 40.0 22.7 20.7 15.3 1.8 1.6 5.8% 7.6%
ME Peers
Alfa Laval 8,875 NEUTRAL 20.4 17.7 17.1 14.4 14.3 12.8 2.69 2.43 15.7% 16.9% 15.2%
Assa Abloy 20,056 OUTPERFORM 23.0 20.3 17.4 15.4 15.4 13.7 2.79 2.57 16.1% 16.7% 16.7%
Atlas Copco 43,371 NEUTRAL 23.3 22.5 18.1 16.9 14.5 13.6 3.63 3.47 20.0% 20.6% 21.9%
GEA Group 7,489 OUTPERFORM 18.7 16.4 15.9 14.0 13.5 12.0 1.78 1.71 11.2% 12.3% 13.0%
Geberit 14,823 OUTPERFORM 28.0 25.9 25.0 23.0 20.7 19.4 6.12 5.69 24.5% 24.8% 24.9%
Kone 22,190 OUTPERFORM 22.8 21.4 17.1 15.8 15.7 14.6 2.48 2.36 14.5% 15.0% 15.0%
Metso 4,687 UNDERPERFORM 24.4 20.9 15.7 14.1 13.6 12.5 1.71 1.67 10.9% 11.9% 0.0%
Sandvik 18,870 NEUTRAL 19.8 18.2 14.8 13.4 11.0 10.0 2.30 2.16 15.5% 16.1% 16.8%
Schindler 20,163 OUTPERFORM 28.6 26.3 18.4 16.8 16.3 15.0 2.23 2.10 12.1% 12.5% 13.0%
SKF 8,512 UNDERPERFORM 16.7 15.9 13.4 12.7 10.4 9.9 1.40 1.32 10.4% 10.4% 10.1%
Wartsila 11,982 UNDERPERFORM 27.0 23.0 18.9 17.3 17.0 15.6 2.43 2.22 12.9% 12.8% 13.8%
Average 23.0 20.8 17.4 15.8 14.8 13.5 2.69 2.52 14.9% 15.4% 14.6%
PE EBITA (Adj) MarginEV/EBITA (Adj) EV/SalesEV/EBITDA

9 October 2017
European Cranes 37
Credit Suisse HOLT: market implied and analyst scenario analysis
Figure 62: Konecranes and Cargotec are priced for returns to decline from what they are forecast to achieve in t+1
Source: Credit Suisse HOLT. HOLT Sector Specialist: Kevin Paul [email protected] HOLT Sector Generalist: Clayton Gillespie [email protected]
Figure 63: Konecranes and Cargotec are trading below their implied multiples, which can be seen by
comparing HOLT P/B with CFROI
Source: Credit Suisse HOLT. HOLT Sector Specialist: Kevin Paul [email protected] HOLT Sector Generalist: Clayton Gillespie [email protected]
KONECRANES and CARGOTEC are priced for returns to decline from what
they are forecast to achieve in t+1
This is market commentary and not a research document 6
0
5
10
15
20
25
30
35
40
ATLAS KONECRANES PALF KONE CARGOTEC SAND AB SKF WARTSILA ALFA LAVAL GEA GROUP COLUMBUS SCHINDLER METSO
Eco
nom
ic R
etur
n (C
FR
OI
%)
10-yr CFROI® Median LFY CFROI® CFROI® Forecast Market Implied CFROI®
-10
-5
0
5
10
15
20
25
ATLAS KONECRANES PALF KONE CARGOTEC SAND AB SKF WARTSILA ALFA LAVAL GEA GROUP COLUMBUS SCHINDLER METSO
Ass
et G
row
th (
%)
10-yr Asset Growth Median LFY Asset Growth Asset Growth Forecast Market Implied Asset Growth
Low relative expectations High relative expectations
Source: Credit Suisse HOLT Lens ™ Data Date: 3rd October 2017
7
HOLT P/ B to CFROI
KCR1VCMCO
Konecranes and Cargotec are undervalued on HOLT P/B for their level of forecast
CFROI
Source: Credit Suisse HOLT Lens ™ Data Date: 3rd October 2017This is market commentary and not a research document

9 October 2017
European Cranes 38
Figure 64: Konecranes and Cargotec have improved margins recently, and still have room to increase them
further before they achieve peer median levels
Source: Credit Suisse HOLT. HOLT Sector Specialist: Kevin Paul [email protected] HOLT Sector Generalist: Clayton Gillespie [email protected]
Figure 65: Konecranes is one of only two peers with positive CFROI revisions over the last 13 weeks, yet it
has seen little price performance over the same time period
Source: Credit Suisse HOLT. HOLT Sector Specialist: Kevin Paul [email protected] HOLT Sector Generalist: Clayton Gillespie [email protected]
AB SKF
ALFA
ATLAS
CARGOTEC
COLUMBUS
GEA GROUP
KITO
KONE
KONECRANES
METSO
PALF
SANDVIK
SCHINDLER
TTS
WARTSILA
-6
-3
0
3
6
9
12
-30% -20% -10% 0% 10% 20% 30% 40% 50% 60%
LFY
Marg
in -
LFY
Peer
Med
ian M
arg
in
3 year percentage change in HOLT Operating Margin
124%, -7.54
Recent Decrease in marginsMargins above peer median
Konecranes and Cargotec have improved margins recently and still have
room to increase them further before they achieve peer median levels
This is market commentary and not a research document 5
Recent Increase in marginsMargins below peer median
Source: Credit Suisse HOLT Data Date: 4th October 2017
Konecranes is one of only two peers with positive CFROI revisions over the last 13
weeks, yet it has seen little price performance over the same time period
This is market commentary and not a research document 7
Konecranes CFROI Revisions Cargotec CFROI Revisions
CFROI Revisions vs Relative Price Performance
Source: Credit Suisse HOLT Lens ™ Data Date: 3rd October 2017

9 October 2017
European Cranes 39
Figure 66: Using CS Analyst Scenario forecasts, Konecranes is priced for new peak margins of 14% and 4%
long run sales growth
Source: Credit Suisse HOLT. HOLT Sector Specialist: Kevin Paul [email protected] HOLT Sector Generalist: Clayton Gillespie [email protected]
Figure 67: Using CS Analyst Scenario forecasts, Cargotec is priced for new peak margins of 12% and 7%
long run sales growth
Source: Credit Suisse HOLT; HOLT Sector Specialist: Kevin Paul [email protected] HOLT Sector Generalist: Clayton Gillespie [email protected]
Margin improvements will depend on:
• MHPS Synergies
• Effect of industry concentration
• Port operator capex recovery
• Aftermarket sales
This is market commentary and not a research document 8
Market implied price €37.66
Relative Wealth Chart Sales, Margins & Turns
Scenario in HOLT Lens
Using CS Analyst Scenario forecasts, Konecranes is priced for new peak margins
of 14% and 4% long run sales growth
Source: Credit Suisse HOLT Lens ™ Data Date: 4th October 2017
CS Analyst Scenario
Margins reaching
new peaks of 14%
Acquisition leads to
initial decline in turns
to 1.15x
Priced for 4% long
run sales growth
Using CS Analyst Scenario forecasts, Cargotec is priced for new peak margins of
12% and 7% long run sales growth
This is market commentary and not a research document 9
Priced for 7% long
run sales growth Market implied price €53.20
Relative Wealth Chart Sales, Margins & Turns
CS Analyst Scenario
Margins increasing to
new peaks of 12%Scenario in HOLT Lens
Source: Credit Suisse HOLT Lens ™ Data Date: 5th October 2017
Margin improvements will depend on:
• Increases in ship sizes
• Port automation
• Cycle pick-up
• Effect of industry concentration

9 October 2017
European Cranes 40
Europe/Finland Industrial Machinery
Konecranes (KCRA.HE) Rating OUTPERFORM Price (05 Oct 17, €) 38.64 Target price (€) 43.00 Market Cap (€ m) 3,049.5 Enterprise value (€ m) 3,571.1 Target price is for 12 months.
Research Analysts
Leo Carrington
44 20 7883 4532
Andre Kukhnin, CFA
44 20 7888 0350
Max Yates
44 20 7883 8501
Artem Tokarenko
44 20 7888 2676
Iris Zheng
44 20 7883 5298
Specialist Sales: Andrew Bell
44 20 7888 0479
Prime beneficiary of heavy lifting in market
consolidation ■ We initiate with an Outperform rating and a target price of €43.
■ Exposure to growth in 2018E: We like the c30% exposure to Port Operator
CapEx, where we forecast 8% in 2018 and 14% growth in 2019. The
remaining revenues from Industrial Crane manufacturing and servicing, are
late-cycle, giving growth of 3.6% and 4.8% in 2018E and 2019E.
■ Konecranes has been a beneficiary of industry concentration: We note
multiple positives from Konecranes’ acquisition of Terex MHPS: 1) The
acquisition increased exposure to Port Equipment by 28%, solidifying its'
position as a competitor to Cargotec. 2) The transaction concentrated
Konecranes’ end markets, giving 70% control of the Port Equipment market
to Konecranes and two others, while in Industrial Cranes, Konecranes and
one other company control c50% of the market. We have seen signs of
positive pricing trends in Industrial Cranes and think this is set to continue.
■ Deal synergies potential understated: Despite the detailed roadmap, we
see targeted synergies of €140m as conservative, having already seen
faster realisation than initially guided. Additionally, we see benefits of
expanded product ranges, and application of the Konecranes service model.
■ Aftermarket sales screen favourably vs. peers: Konecranes’ percentage
of revenues from aftermarket puts it in the 2nd quartile of the Mechanical
peer group, and limits correlation to OEM sales during down cycles. We
think this is underappreciated by the market.
■ Catalysts and risks: Q3 results on 25 October. The 2017 CMD on 14
December is held concurrently with a site visit where we expect to see
detailed 2018 synergy roadmap. Synergy delivery behind guidance is the
main source of downside risk, in our view.
■ Valuation: Konecranes is trading at a 27% discount to the sector on 2018E
EV/EBITA, which we think is not fully justified given its high aftermarket
sales. Our target price is DCF based and shows 11% potential upside driven
principally by margin benefits from synergies and increased pricing power.
Share price performance
The price relative chart measures performance against the
HEX25 INDEX. which closed at 4042.8 on 05/10/17
On 05/10/17 the spot exchange rate was €1/Eu 1.-
Eu.85/US$1
Performance 1M 3M 12M Absolute (%) 6.0 4.2 23.5 Relative (%) 1.7 3.0 7.5
Financial and valuation metrics
Year 12/16A 12/17E 12/18E 12/19E Revenue (€ m) 2,118.3 3,241.1 3,346.1 3,595.0 EBITDA (€ m) 138.6 510.5 367.6 467.7 Adjusted net income (€ m) 81.70 134.81 206.20 266.61 CS EPS (adj.) (€) 1.39 1.70 2.61 3.35 Prev. EPS (€) ROIC (%) 10.9 15.0 9.3 13.6 P/E (adj.) (x) 27.8 22.8 14.8 11.5 P/E rel. (%) 138.4 126.0 89.3 74.9 EV/EBITDA (x) 23.1 7.0 9.6 7.3
Dividend (12/17E, €) 1.05 Net debt/equity (12/17E,%) 40.2 Dividend yield (12/17E,%) 2.7 Net debt (12/17E, € m) 521.6 BV/share (12/17E, €) 16.4 IC (12/17E, € m) 1,817.5 Free float (%) 85.3 EV/IC (12/17E, (x) 2.0 Source: Company data, Thomson Reuters, Credit Suisse estimates

9 October 2017
European Cranes 41
Konecranes (KCRA.HE)
Price (05 Oct 2017): €38.64; Rating: OUTPERFORM; Target Price: 43.00; Analyst: Leo Carrington
Income statement (€ m) 12/16A 12/17E 12/18E 12/19E
Revenue 2,118 3,241 3,346 3,595 EBITDA 139 511 368 468 Depr. & amort. (54) (127) (129) (118) EBIT 85 343 207 333 Net interest exp. (35) (50) (46) (38) Associates 6 (0) 0 0 PBT 106 170 256 358 Income taxes (24) (36) (50) (91) Profit after tax 82 135 206 267 Minorities - - - - Preferred dividends - - - - Associates & other 0 0 0 0 Net profit 82 135 206 267 Other NPAT adjustments (44) 123 (95) (63) Reported net income 38 258 111 204
Cash flow (€ m) 12/16A 12/17E 12/18E 12/19E
EBIT 85 343 207 333 Net interest (11) (50) (46) (38) Cash taxes paid - - - - Change in working capital 41 115 (30) (71) Other cash and non-cash items (5) (136) 79 26 Cash flow from operations 110 273 210 250 CAPEX (26) (70) (74) (79) Free cashflow to the firm 97 238 173 211 Acquisitions (0) (722) 0 0 Divestments 48 2 0 0 Other investment/(outflows) 0 222 0 0 Cash flow from investments 22 (568) (74) (79) Net share issue/(repurchase) - - - - Dividends paid (62) (82) (82) (90) Issuance (retirement) of debt - - - - Cashflow from financing (19) 326 (82) (90) Changes in net cash/debt 47 (365) 55 82 Net debt at start 203 156 522 467 Change in net debt (47) 365 (55) (82) Net debt at end 156 522 467 385
Balance sheet (€ m) 12/16A 12/17E 12/18E 12/19E
Assets Total current assets 1,008 1,624 1,716 1,886 Total assets 1,530 3,641 3,677 3,809 Liabilities Total current liabilities 866 1,301 1,308 1,326 Total liabilities 1,085 2,344 2,351 2,369 Total equity and liabilities 1,530 3,640 3,676 3,808
Per share 12/16A 12/17E 12/18E 12/19E
No. of shares (wtd avg.) (mn) 59 78 78 78 CS EPS (adj.) (€) 1.39 1.70 2.61 3.35 Prev. EPS (€) Dividend (€) 1.05 1.05 1.05 1.15 Free cash flow per share (€) 1.65 3.06 2.22 2.71
Key ratios and valuation 12/16A 12/17E 12/18E 12/19E
Growth/Margin (%) Sales growth (%) (0.4) 53.0 3.2 7.4 EBIT growth (%) 34.8 304.6 (39.8) 61.1 Net income growth (%) 1.4 65.0 53.0 29.3 EPS growth (%) 1.0 22.1 53.5 28.4 EBITDA margin (%) 6.5 15.8 11.0 13.0 EBIT margin (%) 4.0 10.6 6.2 9.3 Pretax profit margin (%) 5.0 5.3 7.7 10.0 Net income margin (%) 3.9 4.2 6.2 7.4
Valuation 12/16A 12/17E 12/18E 12/19E
EV/Sales (x) 1.5 1.1 1.1 1.0 EV/EBITDA (x) 23.1 7.0 9.6 7.3 EV/EBIT (x) 37.8 10.4 17.0 10.3 Dividend yield (%) 2.72 2.72 2.72 2.98 P/E (x) 27.8 22.8 14.8 11.5
Credit ratios (%) 12/16A 12/17E 12/18E 12/19E
Net debt/equity (%) 35.1 40.2 35.2 26.8 Net debt to EBITDA (x) 1.1 1.0 1.3 0.8 Interest coverage ratio (x) 2.5 6.9 4.5 8.8
Company Background
Konecranes builds and services industrial cranes, namely Port Terminal Cranes, and Industrial overhead Cranes and Hoists. From 2017, the acquired assets of Terex MHPS were consolidated, increasing the size of the business by around 50%.
Blue/Grey Sky Scenario
Our Blue Sky Scenario (€) 51.00
Mid-cycle growth of 5% would result from the Port Operator CapEx cycle resuming as anticipated, but accelerated by significant implementation of automated container terminals drives better growth. Better than anticipated deal-related synergies would further increase the mid-cycle margin to 11.5%.
Our Grey Sky Scenario (€) 34.00
Mid-cycle growth of 3% in a situation where the pause in Port Operator CapEx continues, while the uptake of automated terminals is muted. Mid-cycle margins may only reach 8.5% in a situation where poor implementation of synergies results in a low retention rate.
Share price performance
The price relative chart measures performance against the HEX25 INDEX.
which closed at 4042.8 on 05/10/17
On 05/10/17 the spot exchange rate was €1/Eu 1.- Eu.85/US$1
Source: FTI, Company data, Thomson Reuters, Credit Suisse Securities (EUROPE) LTD. Estimates

9 October 2017
European Cranes 42
Konecranes: Key charts
Figure 68: Konecranes sales guidance vs. history Figure 69: Konecranes EBITA guidance vs. history
Source: Company data, Credit Suisse estimates of bounds of guidance. Vara Consensus Source: Company data, Credit Suisse estimates of bounds of guidance. Vara Consensus
Figure 70: Consensus EPS revisions has shown
some momentum in 2018 analyst forecasts
Figure 71: New Equipment vs. Service growth index
highlights the strength of the Service business
Source: Thomson Reuters Source: Company data, Credit Suisse estimates
Figure 72: 42% Aftermarket sales puts Konecranes
in the 2nd quartile of mechanical peers in 2016
Figure 73: Konecranes is late-cycle, showing a c1-
year lag to the German IFO
Source: Company data, Credit Suisse estimates Source: Company data, Credit Suisse estimates
1,500
2,000
2,500
3,000
3,500
2010A 2011A 2012A 2013A 2014A 2015A 2016A 2017E
Bottom end of guidance Top end of guidance
Mid-point of sales guidance Actual (red) / C'sus (green)
100
120
140
160
180
200
220
240
2010A 2011A 2012A 2013A 2014A 2015A 2016A 2017EBottom end of guidance Top end of guidance
Mid-point of EBIT guidance Actual (red) / C'sus (green)
1.0
1.5
2.0
2.5
3.0
3.5
2014 2015 2016 2017 2018
90
100
110
120
130
Cargotec equipment Cargotec service
25%
42%
0%
10%
20%
30%
40%
50%
60%
70%
-25%
-20%
-15%
-10%
-5%
0%
5%
10%
15%
20%
25%
-40%
-30%
-20%
-10%
0%
10%
20%
30%
2008 2009 2010 2011 2012 2013 2014 2015 2016 2017 2018
KCRA Ex FX Revenue % yoy smoothedGerman IFO (Leading 11m, RHS)
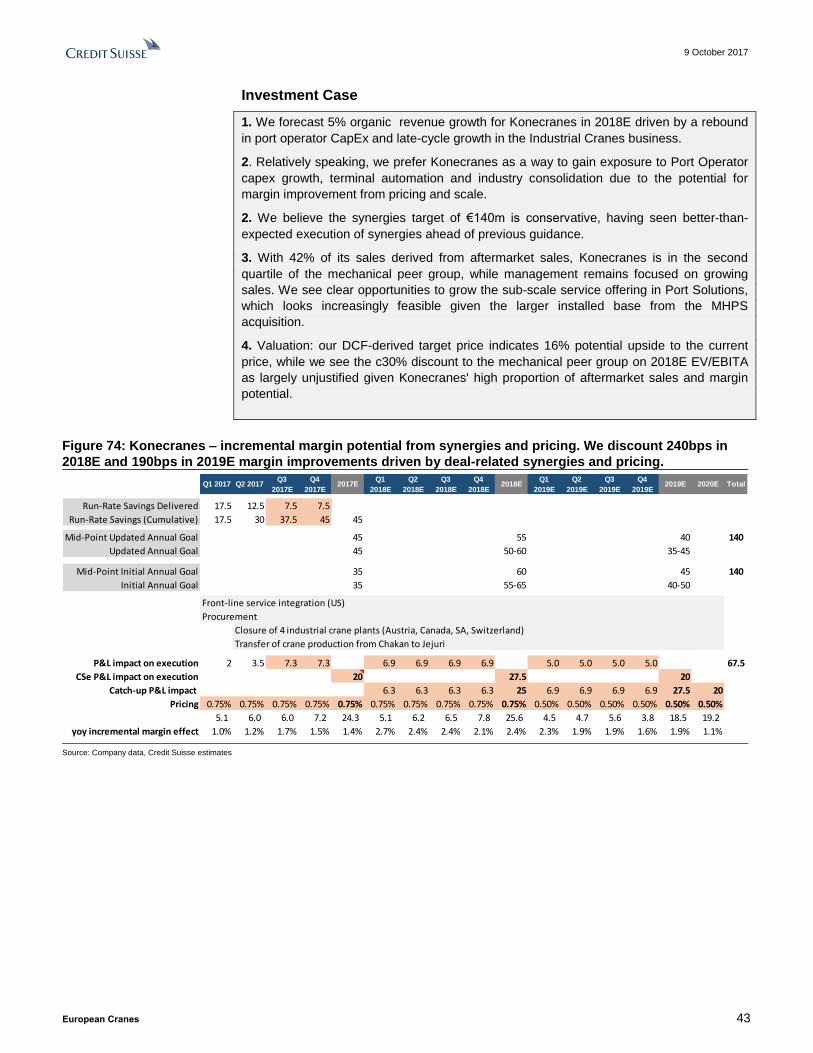
9 October 2017
European Cranes 43
Investment Case
1. We forecast 5% organic revenue growth for Konecranes in 2018E driven by a rebound
in port operator CapEx and late-cycle growth in the Industrial Cranes business.
2. Relatively speaking, we prefer Konecranes as a way to gain exposure to Port Operator
capex growth, terminal automation and industry consolidation due to the potential for
margin improvement from pricing and scale.
2. We believe the synergies target of €140m is conservative, having seen better-than-
expected execution of synergies ahead of previous guidance.
3. With 42% of its sales derived from aftermarket sales, Konecranes is in the second
quartile of the mechanical peer group, while management remains focused on growing
sales. We see clear opportunities to grow the sub-scale service offering in Port Solutions,
which looks increasingly feasible given the larger installed base from the MHPS
acquisition.
4. Valuation: our DCF-derived target price indicates 16% potential upside to the current
price, while we see the c30% discount to the mechanical peer group on 2018E EV/EBITA
as largely unjustified given Konecranes' high proportion of aftermarket sales and margin
potential.
Figure 74: Konecranes – incremental margin potential from synergies and pricing. We discount 240bps in
2018E and 190bps in 2019E margin improvements driven by deal-related synergies and pricing.
Source: Company data, Credit Suisse estimates
Q1 2017 Q2 2017Q3
2017E
Q4
2017E2017E
Q1
2018E
Q2
2018E
Q3
2018E
Q4
2018E2018E
Q1
2019E
Q2
2019E
Q3
2019E
Q4
2019E2019E 2020E Total
Run-Rate Savings Delivered 17.5 12.5 7.5 7.5
Run-Rate Savings (Cumulative) 17.5 30 37.5 45 45
Mid-Point Updated Annual Goal 45 55 40 140
Updated Annual Goal 45 50-60 35-45
Mid-Point Initial Annual Goal 35 60 45 140
Initial Annual Goal 35 55-65 40-50
Front-line service integration (US)
Procurement
Closure of 4 industrial crane plants (Austria, Canada, SA, Switzerland)
Transfer of crane production from Chakan to Jejuri
P&L impact on execution 2 3.5 7.3 7.3 6.9 6.9 6.9 6.9 5.0 5.0 5.0 5.0 67.5
CSe P&L impact on execution 20 27.5 20
Catch-up P&L impact 6.3 6.3 6.3 6.3 25 6.9 6.9 6.9 6.9 27.5 20
Pricing 0.75% 0.75% 0.75% 0.75% 0.75% 0.75% 0.75% 0.75% 0.75% 0.75% 0.50% 0.50% 0.50% 0.50% 0.50% 0.50%
5.1 6.0 6.0 7.2 24.3 5.1 6.2 6.5 7.8 25.6 4.5 4.7 5.6 3.8 18.5 19.2
yoy incremental margin effect 1.0% 1.2% 1.7% 1.5% 1.4% 2.7% 2.4% 2.4% 2.1% 2.4% 2.3% 1.9% 1.9% 1.6% 1.9% 1.1%

9 October 2017
European Cranes 44
Figure 75: Konecranes 2017E Profit Bridge. In H1, Konecranes benefited from a positive mix effect that we
estimate at €20m, which will only partly reverse in H2. Self-help programs from 2016 were visible in Q1 17 in
particular, and we estimate worth €26m in 2017. Cost savings and pricing tailwinds are worth €44m in total
in 2017. Volume declines weigh -€29m, while €9m of FX and €14m of central cost increases yoy bring 2017E
EBITA to €220m
Source: Credit Suisse estimates
Figure 76: Konecranes 2018E Profit Bridge. We see earnings progression driven by €53 of deal synergies
and €25m of pricing tailwinds. Organic volume growth adds €20m and a reduction in central costs is a €10m
tailwind. FX will be an €11m headwind and we anticipate €14m of negative cost development. We are 5% of
consensus on 2018E operating profit.
Source: Company data, Credit Suisse estimates
184
22020 3
26
20
24 12
2 15
914
170
180
190
200
210
220
230
240
250
260
270
280
220
302
53
25
89 3 0 11
10 14
200
210
220
230
240
250
260
270
280
290
300
310
320
330

9 October 2017
European Cranes 45
CS vs. Consensus – where do we differ?
Services: Across orders and sales, we are roughly in line with consensus. We do not yet
explicitly discount sales synergies from the acquisition of the Terex installed base. We are
meaningfully ahead of consensus on operating margin, discounting 370bps margin
expansion between 2017 and 2019 compared with consensus' 170bps. This is from
increased sales of high-margin components that were previously purchased from Terex,
and the full €20m of synergies from branch consolidation.
Industrial equipment: We are in line with consensus on orders, but on average 3.5%
ahead for 2018E and 2019E revenues. On margins, we discount 30bps more margin
expansion between 2017 and 2019 than consensus, but our stronger revenue growth
forecast drops through into absolute EBITA.
Port solutions:. In 2019E we see strong orders from the rebound in Port Operator CapEx.
This drives us 5% ahead of consensus in 2019E revenue. We are above consensus on
operating margin in 2019E, discounting 330bps margin expansion between 2017 and 2019
compared with consensus's 260bps. This drops through to absolute adjusted EBITA.
Figure 77: Konecranes - Credit Suisse forecasts vs. Consensus
Source: Credit Suisse estimates, Vara Research. Conditional formatting shows difference to consensus +/- 3%
Vara Research 2017E 2017E CS vs 2018E 2018E CS vs 2019E 2019E CS vs
Konecranes CS F'cast Cons'us Cons'us CS F'cast Cons'us Cons'us CS F'cast Cons'us Cons'us
Orders
Service 960 983 -2% 1,000 1,010 -1% 1,036 1,050 -1%
Change yoy% -2.2% 0.2% 4.2% 2.7% 3.6% 4.0%
Industrial Equipment 1,154 1,170 -1% 1,198 1,186 1% 1,257 1,228 2%
Change yoy% 0.5% 1.8% 3.8% 1.4% 5.0% 3.5%
Port Solutions 984 1,014 -3% 1,060 1,075 -1% 1,184 1,115 6%
Change yoy% -5.8% -3.0% 7.7% 6.0% 11.8% 3.7%
Internal orders (130) (133) -2% (128) (117) 9% (128) (143) -10%
Group Orders 2,968 3,034 -2% 3,129 3,154 -1% 3,349 3,250 3%
Change yoy% -1.9% 0.3% 5.4% 4.0% 3.0%
Sales
Service 1,193 1,209 -1% 1,233 1,263 -2% 1,288 1,313 -2%
Change yoy% -1.7% -0.4% 3.3% 4.5% 4.4% 4.0%
Industrial Equipment 1,151 1,136 1% 1,196 1,159 3% 1,259 1,205 4%
Change yoy% 1.8% 0.5% 3.9% 2.0% 5.3% 4.0%
Port Solutions 1,032 1,022 1% 1,046 1,073 -3% 1,177 1,123 5%
Change yoy% -5.5% -6.4% 1.4% 5.0% 12.6% 4.7%
Internal sales (135) (131) 3% (129) (129) 0% (129) (153) -16%
Group Sales 3,241 3,236 0% 3,346 3,366 -1% 3,595 3,488 3%
Change yoy% -1.1% -1.3% 3.2% 4.0% 3.6%
Underlying EBITA
Service 163 168 -3% 190 186 2% 223 204 9%
Margin% 13.7% 13.9% 15.4% 14.7% 17.4% 15.5%
Industrial Equipment 30 26 17% 54 50 9% 87 76 14%
Margin% 2.6% 2.3% 4.5% 4.3% 6.9% 6.3%
Port Solutions 55 56 -2% 74 74 0% 102 91 12%
Margin% 5.3% 5.5% 7.0% 6.9% 8.6% 8.1%
EBITA on Internal sales (28) (30) -7% (15) (22) -28% (16) (20) -21%
Underlying EBITA 220 220 0% 302 288 5% 396 351 13%
Margin% 6.8% 6.8% 9.0% 8.5% 11.0% 10.1%

9 October 2017
European Cranes 46
Konecranes: Valuation
In Figure 78 we show our calculation of enterprise value (EV). We use the average share
price for a given year for historical EV and the current share price for forecasts.
Figure 78: Konecranes: Enterprise Value Calculation (€m)
Source: Company data, Credit Suisse estimates
Figure 79: Konecranes: Multiple history & forecasts
Source: Company data, Credit Suisse estimates
DCF
We use a Discounted Cash Flow (DCF) valuation as our primary tool for determining
Konecranes’ fair value. We use a three-stage DCF with the following method:
■ Stage 1—Years 1 to 3. We use our explicit model forecasts for free cash flow for the
first three years.
■ Stage 2—Years 4 to 10. We use broader assumptions for the next seven years.
■ Stage 3—Terminal value. We base our terminal value on year-10 cash flow, a terminal
growth rate of 2% and an invested capital growth rate of 2%.
EV calculation 2008 2009 2010 2011 2012 2013 2014 2015 2016 2017E 2018E 2019E
Share price, € 21 17 25 24 22 25 24 27 26 39 39 39
Diluted no of shares 59 59 59 59 58 58 58 59 59 77.853221 78 78
Market capitalisation 1,242 994 1,457 1,430 1,257 1,464 1,380 1,595 1,500 3,008 3,008 3,008
Net debt 14 -72 -15 220 182 187 150 203 156 522 467 385
Pension provision 3 4 4 4 5 6 8 9 8 8 8 8
Minority interest 2 5 6 6 6 6 0 0 0 20 17 10
CS Enterprise value 1,261 931 1,451 1,660 1,450 1,664 1,537 1,807 1,665 3,558 3,500 3,412
December YE 2008 2009 2010 2011 2012 2013 2014 2015 2016 2017E 2018E 2019E
Average/Current 21 17 25 24 22 25 24 27 26 39 39 39
High 32 22 32 34 27 29 27 33 37
Low 10 11 19 13 15 21 19 21 18
P/E Average 7.3 11.8 18.9 20.2 14.4 19.0 18.6 19.8 18.4 22.8 14.8 11.5
P/E High 11.2 15.1 24.3 28.3 17.5 21.4 21.4 23.8 26.3
P/E Low 3.5 7.6 14.9 11.1 9.5 15.8 14.9 15.4 13.0
EV/Sales Average 0.6 0.6 0.9 0.9 0.7 0.8 0.8 0.8 0.8 1.1 1.0 0.9
EV/Sales High 0.9 0.7 1.2 1.2 0.8 0.9 0.9 1.0 1.1
EV/Sales Low 0.3 0.3 0.7 0.5 0.5 0.7 0.6 0.7 0.6
Operating margin 11.8% 7.1% 7.4% 6.2% 6.4% 5.5% 5.9% 5.5% 6.6% 6.8% 9.0% 11.0%
EV/EBITDA Average 4.6 6.1 9.9 10.5 7.9 9.7 9.5 10.5 8.6 11.5 8.8 6.9
EV/EBITDA High 7.0 8.0 12.8 14.1 9.4 10.8 10.8 12.4 11.9
EV/EBITDA Low 2.2 3.8 7.8 6.4 5.6 8.3 7.8 8.5 6.3
EV/EBITA Average 5.1 7.8 12.6 14.2 10.5 14.4 12.9 15.4 11.8 16.1 11.6 8.6
EV/EBITA High 7.8 10.2 16.2 19.1 12.5 16.0 14.6 18.1 16.4
EV/EBITA Low 2.4 4.9 9.9 8.7 7.4 12.2 10.6 12.4 8.7
FCF yield Average 6.9% 19.5% 2.0% -5.1% 8.1% 4.4% 7.9% -0.1% 5.6% 6.7% 4.5% 5.7%
FCF yield High 4.5% 15.2% 1.6% -3.6% 6.6% 3.9% 6.9% -0.1% 3.9%
FCF yield Low 14.5% 30.1% 2.6% -9.3% 12.2% 5.3% 9.9% -0.1% 7.9%
Dividend yield Average 4.3% 5.3% 4.1% 4.2% 4.8% 4.2% 4.4% 3.9% 4.1% 2.7% 2.7% 3.0%
Dividend yield High 2.8% 4.2% 3.2% 3.0% 3.9% 3.7% 3.8% 3.2% 2.9%
Dividend yield Low 9.0% 8.2% 5.2% 7.5% 7.2% 5.0% 5.5% 4.9% 5.8%
EV/IC Average 1.5 1.3 1.8 1.6 1.3 1.6 1.4 1.6 1.7 1.2 1.2 1.2
EV/IC High 2.3 1.7 2.3 2.1 1.5 1.8 1.6 1.9 2.4
EV/IC Low 0.7 0.8 1.4 1.0 0.9 1.4 1.2 1.3 1.3
P/BV Average 3.1 2.4 3.2 3.3 2.7 3.3 3.1 3.5 3.4 2.3 2.3 2.1
P/BV High 4.8 3.1 4.1 4.6 3.3 3.7 3.5 4.2 4.8
P/BV Low 1.5 1.6 2.5 1.8 1.8 2.7 2.5 2.7 2.4

9 October 2017
European Cranes 47
Figure 80: Konecranes: Key DCF assumptions
Source: Credit Suisse estimates
Our base-case DCF valuation for Konecranes is €43 per share. We find this valuation is
sensitive to: (1) WACC; (2) long-term (year-4 onwards) operating profit margin; and (3)
mid-term (years 4-10) growth rate assumptions. We therefore believe a useful application
of this model is to show the DCF value sensitivity to these parameters.
Below we show our DCF valuation sensitivity to the operating profit (EBIT) and mid-term
growth rate assumptions.
Figure 81: Konecranes: DCF sensitivity EBIT margin and mid-term growth rate assumptions €, unless otherwise stated
Source: Credit Suisse estimates
In Figure 82 we show our DCF valuation sensitivity to WACC and mid-term growth rate
assumptions.
Key DCF assumptions
Mid-Cycle Grow th (years 4 to 10) 3.5%
Mid-cycle EBIT margin (years 4+) 10.5%
Mid-cycle NOPAT margin 7.2%
Mid-cycle NOPAT to FCF conversion ratio 80%
Invested capital 2,936
Invested capital grow th (years 4+) 2.0%
Terminal grow th rate 2.0%
10-year average FCF yield 5.7%
WACC 8.0%
Mid-cycle growth rate
1.0% 1.5% 2.0% 2.5% 3.0% 3.5% 4.0% 4.5% 5.0% 5.5% 6.0%
8.5% 5.9% 30 31 32 33 34 35 36 37 38 39 40
9.0% 6.2% 32 33 34 35 36 37 38 39 40 41 43
9.5% 6.6% 34 35 36 37 38 39 40 41 43 44 45
10.0% 6.9% 36 37 38 39 40 41 42 43 45 46 47
10.5% 7.2% 37 38 40 41 42 43 44 46 47 48 50
11.0% 7.6% 39 40 41 43 44 45 46 48 49 51 52
11.5% 7.9% 41 42 43 45 46 47 49 50 51 53 54
12.0% 8.3% 43 44 45 46 48 49 51 52 54 55 57
12.5% 8.6% 44 46 47 48 50 51 53 54 56 57 59
EBIT
margin
NOPAT
margin

9 October 2017
European Cranes 48
Figure 82: Konecranes: DCF sensitivity to WACC and mid-term growth rate €, unless otherwise stated
Source: Credit Suisse estimates
Profit Pools
Figure 83: 2017E Profit pools. Excluding the effects of pricing and synergies which we specifically
discount, we see strong operational opportunities for earnings growth in service. We estimate a potential
c10% organic growth of the MHPS Service segment by rolling out the Konecranes business model, while
margins can expand in Konecranes Service through direct supply of Demag parts to their service base.
Source: Credit Suisse estimates
Growth rate
WACC 1.0% 1.5% 2.0% 2.5% 3.0% 3.5% 4.0% 4.5% 5.0% 5.5% 6.0%
6.0% 58 60 62 64 66 68 70 72 74 76 78
6.5% 51 53 54 56 58 60 61 63 65 67 69
7.0% 46 47 49 50 52 53 55 56 58 60 61
7.5% 41 43 44 45 46 48 49 51 52 54 55
8.0% 38 39 40 41 42 43 45 46 47 49 50
8.5% 35 36 37 38 39 40 41 42 43 44 46
9.0% 32 33 34 35 36 37 38 39 40 41 42
9.5% 30 30 31 32 33 34 35 36 37 38 39
10.0% 27 28 29 30 31 31 32 33 34 35 36
-2%
0%
2%
4%
6%
8%
10%
12%
14%
16%
18%
20%
22%
Business Unit revenue as a % of Konecranes Group
Port Crane Service (2%) MHPS Service (9%)KC Service (26%) KC Port Cranes and Lift Trucks (ex-service) (14%)MHPS Industrial Equipment (13%) KC Industrial Equipment (ex-STAHL) (21%)MHPS Port Cranes (ex-service) (15%)

9 October 2017
European Cranes 49
Konecranes: Overview
Konecranes comprises three divisions - Industrial Equipment, Service and Port Solutions.
Historically the business has been late cycle, showing on average an 11-month lag to
economic indicators such as the German IFO.
These divisions can be grouped into 1) the overhead crane business, which incorporates
Industrial Equipment and Service, and, 2) the port equipment business known as the Port
Solutions division.
Overhead Cranes
The overhead crane business is the largest, with 68% of revenues derived from the
manufacture and service of overhead cranes in 2016. The strategy is driven mainly by the
attachment of service contracts to equipment sales, and as such Konecranes focusses on
selling complex electrified cranes systems which generate good service business. The
vast majority of the service business is the service of both own and 3rd
party branded
overhead cranes, with a small local machine tool servicing business. Overhead cranes are
used in a broad selection of end markets which Konecranes does not directly disclose.
The key end markets, however, are;
■ General manufacturing: We estimate that 35% of cranes are sold directly into the
general manufacturing end market, while we estimate that 20% of revenues are via
sales channels, principally the independent crane builders and distributors. Overhead
cranes are found in every factory for the ad-hoc movement of heavy equipment or
machinery, or as a key piece of equipment in discrete manufacturing processes for the
movement of heavy parts of finished components.
■ Power: We estimate 15% of revenues are derived from the power end markets.
Nuclear cranes are a strong competence of Konecranes, but this market is currently at
very low levels in terms of new equipment. The principal uses of industrial cranes in
power generation are for in-situ installation during construction, and ongoing use as
part of plant maintenance.
■ Shipbuilding: We estimate <5% of revenues are derived from the end market - heavy
duty gantry cranes (sometimes called Goliath cranes) are used to move steel plate and
box sections.
■ Transportation: We estimate 8% of revenues are from the transportation end-market,
the majority of which from automotive manufacturing
■ Process industries: Overhead cranes are mission critical pieces of equipment in
heavy process industries such as steel manufacturing (we estimate 15%) where
dangerous loads of 100s of tons need precise movement, and pulp and paper (we
estimate 5%) where large volumes of heavy raw material and finished goods need
movement.
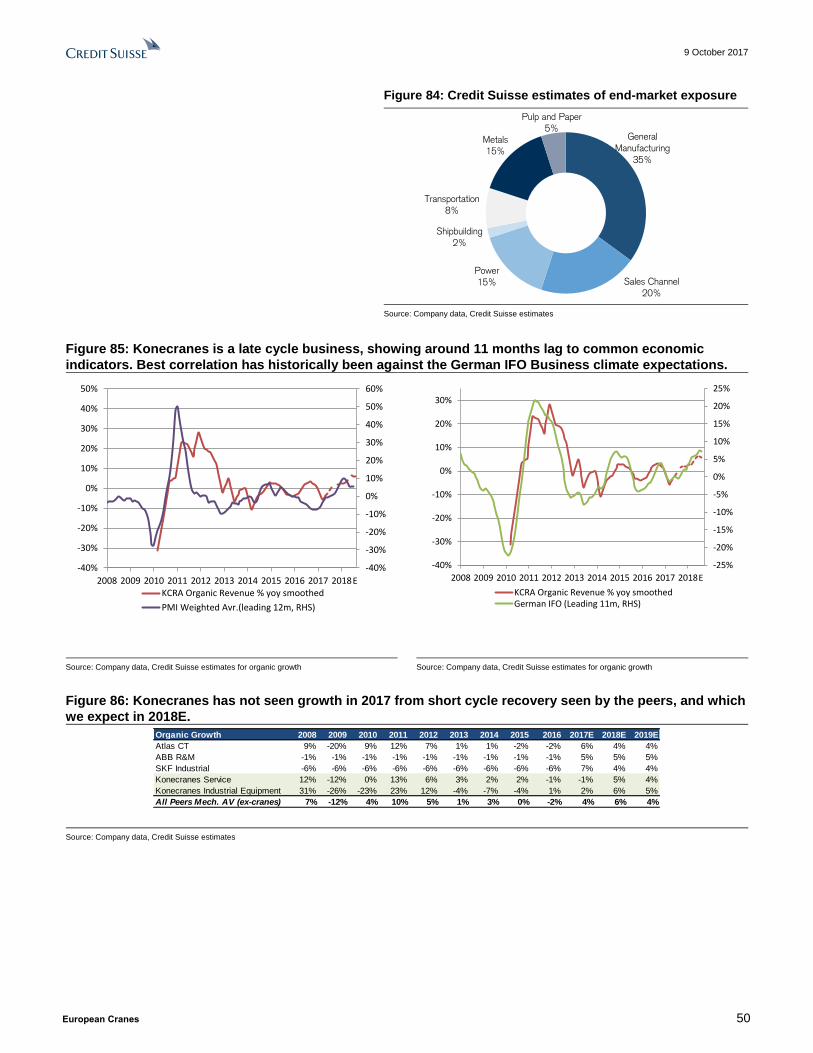
9 October 2017
European Cranes 50
Figure 84: Credit Suisse estimates of end-market exposure
Source: Company data, Credit Suisse estimates
Figure 85: Konecranes is a late cycle business, showing around 11 months lag to common economic
indicators. Best correlation has historically been against the German IFO Business climate expectations.
Source: Company data, Credit Suisse estimates for organic growth Source: Company data, Credit Suisse estimates for organic growth
Figure 86: Konecranes has not seen growth in 2017 from short cycle recovery seen by the peers, and which
we expect in 2018E.
Source: Company data, Credit Suisse estimates
General
Manufacturing
35%
Sales Channel
20%
Power
15%
Shipbuilding
2%
Transportation
8%
Metals
15%
Pulp and Paper
5%
-40%
-30%
-20%
-10%
0%
10%
20%
30%
40%
50%
60%
-40%
-30%
-20%
-10%
0%
10%
20%
30%
40%
50%
2008 2009 2010 2011 2012 2013 2014 2015 2016 2017 2018KCRA Organic Revenue % yoy smoothed
PMI Weighted Avr.(leading 12m, RHS)
E
-25%
-20%
-15%
-10%
-5%
0%
5%
10%
15%
20%
25%
-40%
-30%
-20%
-10%
0%
10%
20%
30%
2008 2009 2010 2011 2012 2013 2014 2015 2016 2017 2018
KCRA Organic Revenue % yoy smoothedGerman IFO (Leading 11m, RHS)
E
Organic Growth 2008 2009 2010 2011 2012 2013 2014 2015 2016 2017E 2018E 2019E
Atlas CT 9% -20% 9% 12% 7% 1% 1% -2% -2% 6% 4% 4%
ABB R&M -1% -1% -1% -1% -1% -1% -1% -1% -1% 5% 5% 5%
SKF Industrial -6% -6% -6% -6% -6% -6% -6% -6% -6% 7% 4% 4%
Konecranes Service 12% -12% 0% 13% 6% 3% 2% 2% -1% -1% 5% 4%
Konecranes Industrial Equipment 31% -26% -23% 23% 12% -4% -7% -4% 1% 2% 6% 5%
All Peers Mech. AV (ex-cranes) 7% -12% 4% 10% 5% 1% 3% 0% -2% 4% 6% 4%

9 October 2017
European Cranes 51
Service Opportunities
Following the MHPS acquisition, Konecranes has increased market share in service from
25% to 33% (in the addressable market – overall market is 75% covered by in-house
service).
The transaction offered clear early benefits in capturing the full value of spares from the
installed base. Before the acquisition, Konecranes' service business was servicing Demag
cranes, however unable to benefit from the profitable spare parts aftermarket business, as
parts needed to be purchased from Demag at a pass-through margin. With the integrated
business, Konecranes is now better able to capture the full margin, as well as eliminating
potential routes for customers to order 3rd party spares.
The clear opportunity in service however is in maximising the potential of the acquired
service business by applying the Konecranes operating model, something that has not
been specifically built into the €140m of anticipated deal synergies, which are mainly
focused on the cost side.
Figure 87: Konecranes installed base under service contracts, with average
service value per item of the installed base.
Source: Company data, Credit Suisse estimates
Konecranes has historically performed well in service, increasing the installed base under
service contracts while growing the service value per crane under contract. This has been
driven by Konecranes' long term strategy of growing service revenues (both maintenance
and spares) through focusing on sales of cranes with a higher service need, as well as the
overall attachment rate.
When calculating the average revenue per service base item per quarter, we have seen a
significant step down between Q4 16 (€114) and Q2 17 (€99). The driver of this step-down
is due to the difference in service approach of Konecranes and the acquired Terex
(Demag) business. Demag service was primarily the higher margin sale of spares, and we
see a significant revenue opportunity from bringing the Konecranes service operational
approach across to the acquired asset. If Konecranes can return the average revenue per
crane of the Demag asset to the Konecranes average by 2019, and this revenue per crane
disparity is shared across the portion of revenues from ad-hoc service, we see potential
upside of a +10.4% increase in revenues from what is currently implied.
We do not specifically discount this growth opportunity given the absence of any track
record and uncertainty around these metrics, we see this as significantly derisking our
service growth estimates which are currently based on end-market growth.
80
85
90
95
100
105
110
115
120
300,000
350,000
400,000
450,000
500,000
550,000
600,000
650,000
Total number of equipment under contract
Revenue per service base item per quarter (EUR) RHS

9 October 2017
European Cranes 52
Figure 88: Service: Financials (€m).
Source: Company data, Credit Suisse estimates
Port Equipment:
The Port Solutions division is involved with the manufacture and service of port handling
equipment, and the division is analogous to Cargotec's Kalmar, albeit without a software
offering. The key end market is container ports, and the macro cycle is driven by Port
Operator capex which we cover in detail in Medium-term Driver #1: structural changes in
container shipping and port automation to drive a rebound in customer CapEx in 2018.
Figure 89: Equipment financials (including port equipment pre 2017) (€m)
Source: Company data, Credit Suisse estimates
0%
3%
6%
9%
12%
15%
18%
0
300
600
900
1200
1500
Order Revenue Margin
0%
2%
4%
6%
8%
10%
12%
14%
0
500
1,000
1,500
2,000
2,500
3,000
2008 2009 2010 2011 2012 2013 2014 2015 2016 2017E 2018E 2019E 2020E
All Equip. Order All Equip. Revenue All Equip. Margin
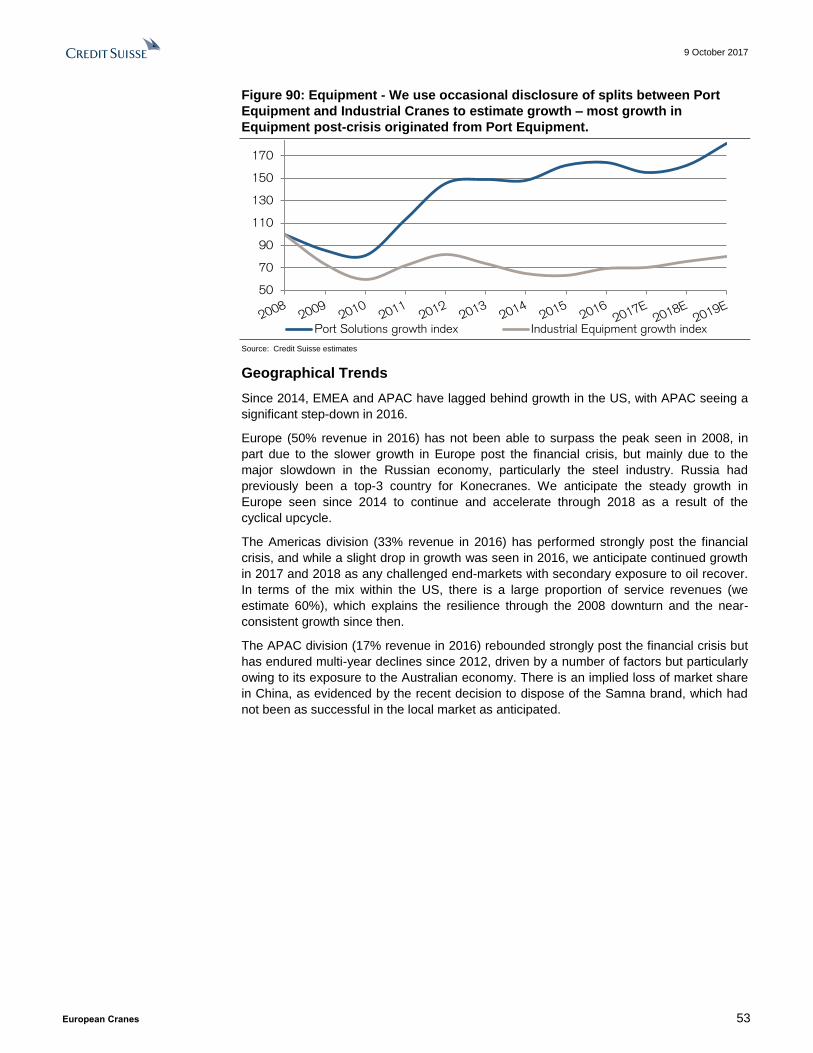
9 October 2017
European Cranes 53
Figure 90: Equipment - We use occasional disclosure of splits between Port
Equipment and Industrial Cranes to estimate growth – most growth in
Equipment post-crisis originated from Port Equipment.
Source: Credit Suisse estimates
Geographical Trends
Since 2014, EMEA and APAC have lagged behind growth in the US, with APAC seeing a
significant step-down in 2016.
Europe (50% revenue in 2016) has not been able to surpass the peak seen in 2008, in
part due to the slower growth in Europe post the financial crisis, but mainly due to the
major slowdown in the Russian economy, particularly the steel industry. Russia had
previously been a top-3 country for Konecranes. We anticipate the steady growth in
Europe seen since 2014 to continue and accelerate through 2018 as a result of the
cyclical upcycle.
The Americas division (33% revenue in 2016) has performed strongly post the financial
crisis, and while a slight drop in growth was seen in 2016, we anticipate continued growth
in 2017 and 2018 as any challenged end-markets with secondary exposure to oil recover.
In terms of the mix within the US, there is a large proportion of service revenues (we
estimate 60%), which explains the resilience through the 2008 downturn and the near-
consistent growth since then.
The APAC division (17% revenue in 2016) rebounded strongly post the financial crisis but
has endured multi-year declines since 2012, driven by a number of factors but particularly
owing to its exposure to the Australian economy. There is an implied loss of market share
in China, as evidenced by the recent decision to dispose of the Samna brand, which had
not been as successful in the local market as anticipated.
50
70
90
110
130
150
170
190
Port Solutions growth index Industrial Equipment growth index
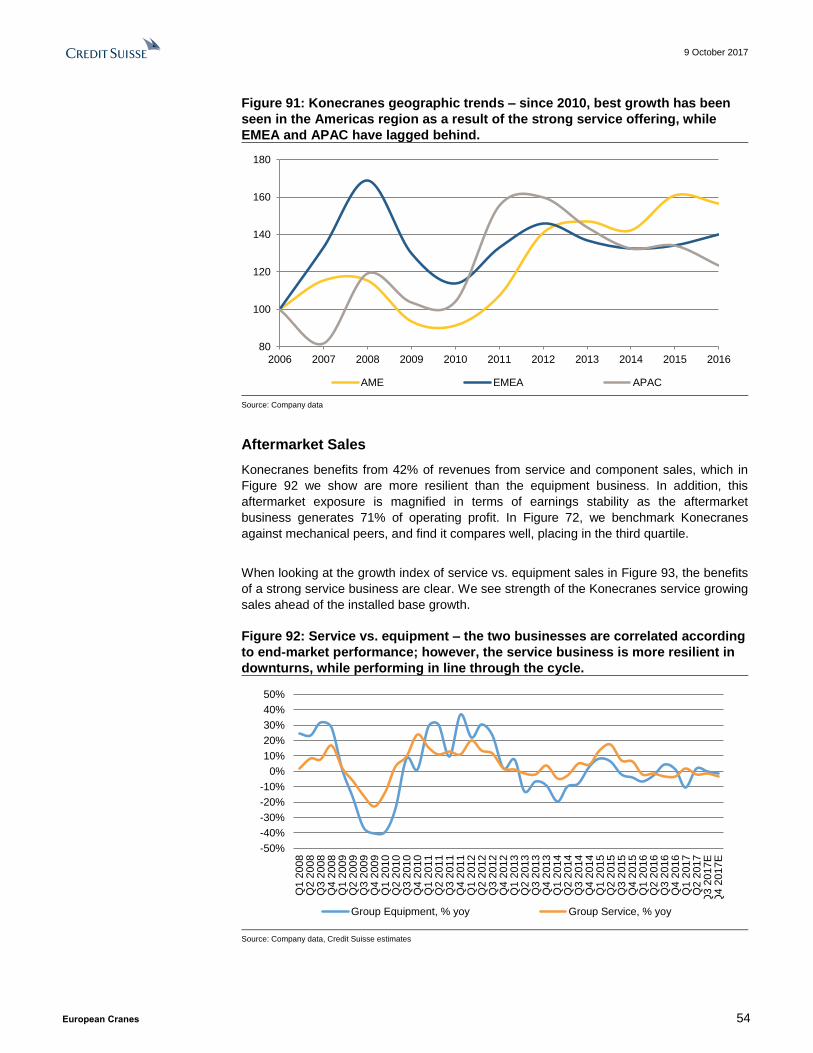
9 October 2017
European Cranes 54
Figure 91: Konecranes geographic trends – since 2010, best growth has been
seen in the Americas region as a result of the strong service offering, while
EMEA and APAC have lagged behind.
Source: Company data
Aftermarket Sales
Konecranes benefits from 42% of revenues from service and component sales, which in
Figure 92 we show are more resilient than the equipment business. In addition, this
aftermarket exposure is magnified in terms of earnings stability as the aftermarket
business generates 71% of operating profit. In Figure 72, we benchmark Konecranes
against mechanical peers, and find it compares well, placing in the third quartile.
When looking at the growth index of service vs. equipment sales in Figure 93, the benefits
of a strong service business are clear. We see strength of the Konecranes service growing
sales ahead of the installed base growth.
Figure 92: Service vs. equipment – the two businesses are correlated according
to end-market performance; however, the service business is more resilient in
downturns, while performing in line through the cycle.
Source: Company data, Credit Suisse estimates
80
100
120
140
160
180
2006 2007 2008 2009 2010 2011 2012 2013 2014 2015 2016
AME EMEA APAC
-50%
-40%
-30%
-20%
-10%
0%
10%
20%
30%
40%
50%
Q1
2008
Q2
2008
Q3
2008
Q4
2008
Q1
2009
Q2
2009
Q3
2009
Q4
2009
Q1
2010
Q2
2010
Q3
2010
Q4
2010
Q1
2011
Q2
2011
Q3
2011
Q4
2011
Q1
2012
Q2
2012
Q3
2012
Q4
2012
Q1
2013
Q2
2013
Q3
2013
Q4
2013
Q1
2014
Q2
2014
Q3
2014
Q4
2014
Q1
2015
Q2
2015
Q3
2015
Q4
2015
Q1
2016
Q2
2016
Q3
2016
Q4
2016
Q1
2017
Q2
2017
Q3 2
017E
Q4 2
017E
Group Equipment, % yoy Group Service, % yoy

9 October 2017
European Cranes 55
Figure 93: Konecranes service vs. equipment sales growth index from 2011.
Service has seen consistent growth despite a slowdown in installed base
growth from declining equipment sales
Source: Company data
80
100
120
140
2011 2012 2013 2014 2015 2016
Equipment Services
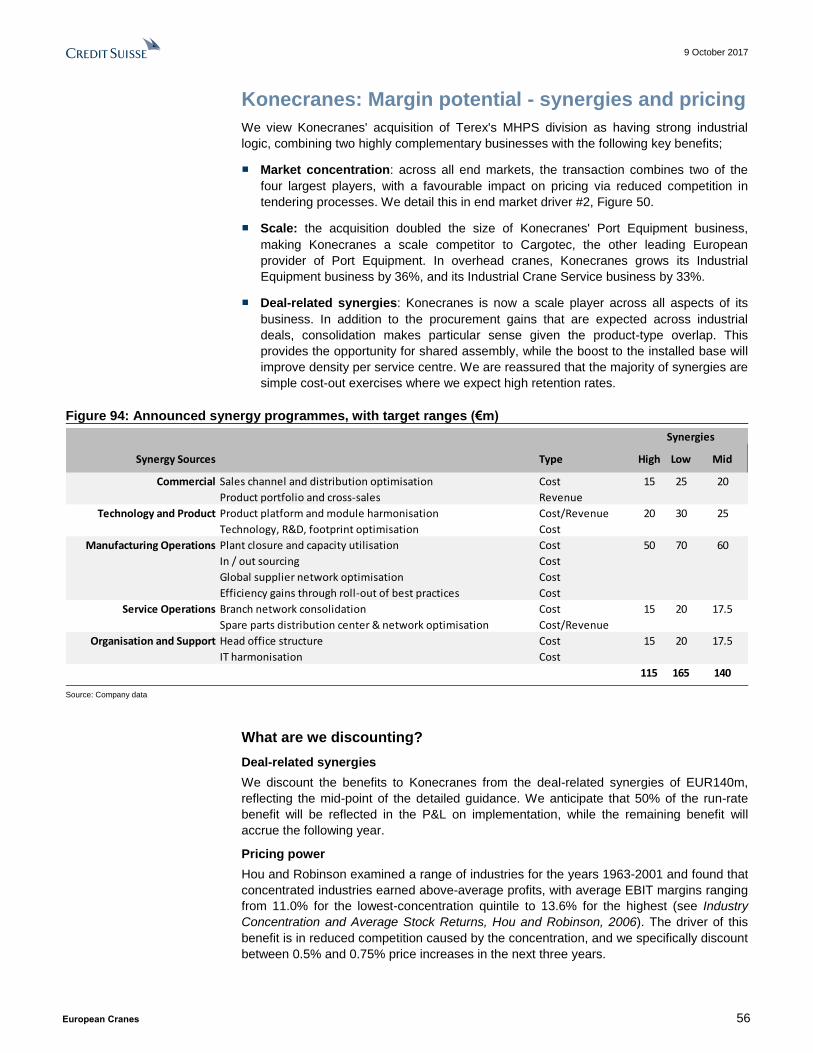
9 October 2017
European Cranes 56
Konecranes: Margin potential - synergies and pricing
We view Konecranes' acquisition of Terex's MHPS division as having strong industrial
logic, combining two highly complementary businesses with the following key benefits;
■ Market concentration: across all end markets, the transaction combines two of the
four largest players, with a favourable impact on pricing via reduced competition in
tendering processes. We detail this in end market driver #2, Figure 50.
■ Scale: the acquisition doubled the size of Konecranes' Port Equipment business,
making Konecranes a scale competitor to Cargotec, the other leading European
provider of Port Equipment. In overhead cranes, Konecranes grows its Industrial
Equipment business by 36%, and its Industrial Crane Service business by 33%.
■ Deal-related synergies: Konecranes is now a scale player across all aspects of its
business. In addition to the procurement gains that are expected across industrial
deals, consolidation makes particular sense given the product-type overlap. This
provides the opportunity for shared assembly, while the boost to the installed base will
improve density per service centre. We are reassured that the majority of synergies are
simple cost-out exercises where we expect high retention rates.
Figure 94: Announced synergy programmes, with target ranges (€m)
Source: Company data
What are we discounting?
Deal-related synergies
We discount the benefits to Konecranes from the deal-related synergies of EUR140m,
reflecting the mid-point of the detailed guidance. We anticipate that 50% of the run-rate
benefit will be reflected in the P&L on implementation, while the remaining benefit will
accrue the following year.
Pricing power
Hou and Robinson examined a range of industries for the years 1963-2001 and found that
concentrated industries earned above-average profits, with average EBIT margins ranging
from 11.0% for the lowest-concentration quintile to 13.6% for the highest (see Industry
Concentration and Average Stock Returns, Hou and Robinson, 2006). The driver of this
benefit is in reduced competition caused by the concentration, and we specifically discount
between 0.5% and 0.75% price increases in the next three years.
Synergy Sources Type High Low Mid
Commercial Sales channel and distribution optimisation Cost 15 25 20
Product portfolio and cross-sales Revenue
Technology and Product Product platform and module harmonisation Cost/Revenue 20 30 25
Technology, R&D, footprint optimisation Cost
Manufacturing Operations Plant closure and capacity utilisation Cost 50 70 60
In / out sourcing Cost
Global supplier network optimisation Cost
Efficiency gains through roll-out of best practices Cost
Service Operations Branch network consolidation Cost 15 20 17.5
Spare parts distribution center & network optimisation Cost/Revenue
Organisation and Support Head office structure Cost 15 20 17.5
IT harmonisation Cost
115 165 140
Synergies
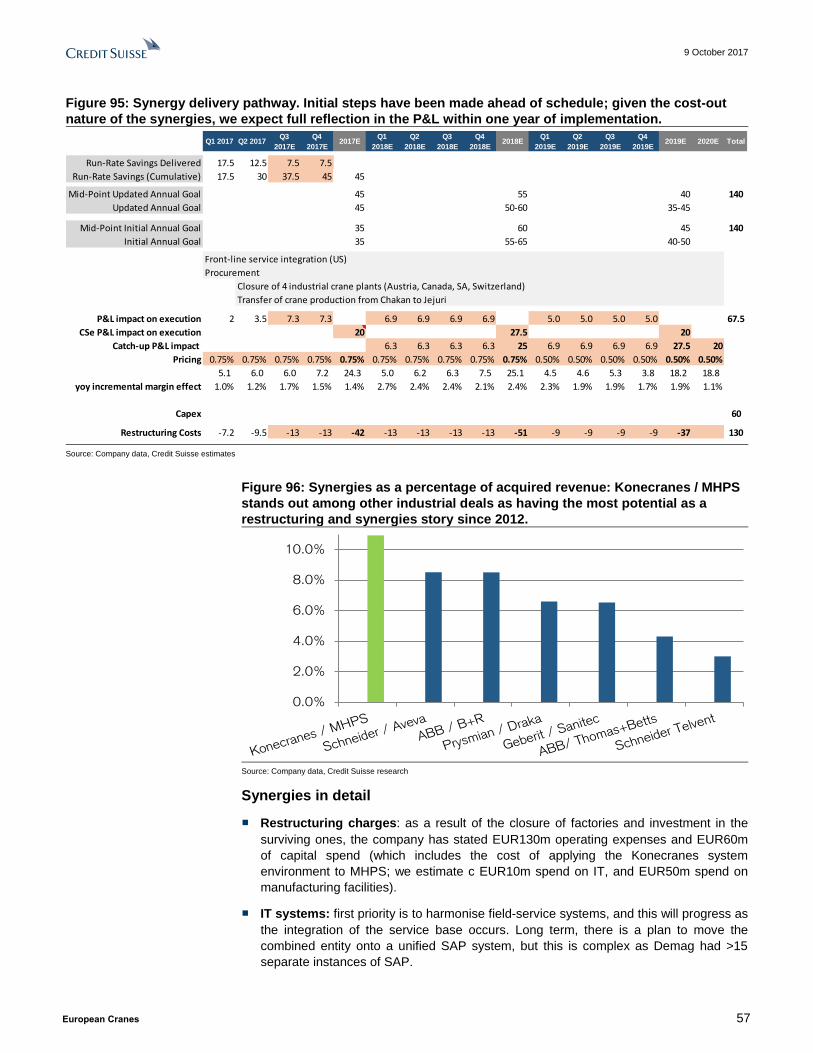
9 October 2017
European Cranes 57
Figure 95: Synergy delivery pathway. Initial steps have been made ahead of schedule; given the cost-out
nature of the synergies, we expect full reflection in the P&L within one year of implementation.
Source: Company data, Credit Suisse estimates
Figure 96: Synergies as a percentage of acquired revenue: Konecranes / MHPS
stands out among other industrial deals as having the most potential as a
restructuring and synergies story since 2012.
Source: Company data, Credit Suisse research
Synergies in detail
■ Restructuring charges: as a result of the closure of factories and investment in the
surviving ones, the company has stated EUR130m operating expenses and EUR60m
of capital spend (which includes the cost of applying the Konecranes system
environment to MHPS; we estimate c EUR10m spend on IT, and EUR50m spend on
manufacturing facilities).
■ IT systems: first priority is to harmonise field-service systems, and this will progress as
the integration of the service base occurs. Long term, there is a plan to move the
combined entity onto a unified SAP system, but this is complex as Demag had >15
separate instances of SAP.
Q1 2017 Q2 2017Q3
2017E
Q4
2017E2017E
Q1
2018E
Q2
2018E
Q3
2018E
Q4
2018E2018E
Q1
2019E
Q2
2019E
Q3
2019E
Q4
2019E2019E 2020E Total
Run-Rate Savings Delivered 17.5 12.5 7.5 7.5
Run-Rate Savings (Cumulative) 17.5 30 37.5 45 45
Mid-Point Updated Annual Goal 45 55 40 140
Updated Annual Goal 45 50-60 35-45
Mid-Point Initial Annual Goal 35 60 45 140
Initial Annual Goal 35 55-65 40-50
Front-line service integration (US)
Procurement
Closure of 4 industrial crane plants (Austria, Canada, SA, Switzerland)
Transfer of crane production from Chakan to Jejuri
P&L impact on execution 2 3.5 7.3 7.3 6.9 6.9 6.9 6.9 5.0 5.0 5.0 5.0 67.5
CSe P&L impact on execution 20 27.5 20
Catch-up P&L impact 6.3 6.3 6.3 6.3 25 6.9 6.9 6.9 6.9 27.5 20
Pricing 0.75% 0.75% 0.75% 0.75% 0.75% 0.75% 0.75% 0.75% 0.75% 0.75% 0.50% 0.50% 0.50% 0.50% 0.50% 0.50%
5.1 6.0 6.0 7.2 24.3 5.0 6.2 6.3 7.5 25.1 4.5 4.6 5.3 3.8 18.2 18.8
yoy incremental margin effect 1.0% 1.2% 1.7% 1.5% 1.4% 2.7% 2.4% 2.4% 2.1% 2.4% 2.3% 1.9% 1.9% 1.7% 1.9% 1.1%
Capex 60
Restructuring Costs -7.2 -9.5 -13 -13 -42 -13 -13 -13 -13 -51 -9 -9 -9 -9 -37 130
0.0%
2.0%
4.0%
6.0%
8.0%
10.0%

9 October 2017
European Cranes 58
■ Closure of branches: where service branches are duplicated in regions, these will be
closed with the service personnel transferred to other branches. This is a major source
of the early synergies, and in H1 has progressed well in the US, with other countries to
follow.
■ Go-to market strategy: there were significant differences in the distribution strategies
for Demag and Konecranes, and these need to be harmonised with service offerings.
This is a complex process, and will be implemented in 2018/ 2019, in our view.
■ Manufacturing operations: the EUR50-70m savings presented by the company
include potential opportunities to right-size the existing business when relative
strengths of the acquired vs. legacy operations are clear. Manufacturing locations will
have some flexibility in product lines, which is possible with the combined entity.
■ Cross-selling: while not a major source of synergies, there are benefits to customers
in terms of a larger product range. Feedback from management is that sales teams see
advantages in the larger product range in terms of ability to open conversations, while
in Port Solutions, there have been advantages in the broader harbour crane offering.
■ Cash flow: the transaction has presented some cash flow benefits as depreciation
looks set to exceed capex once the EUR60m incremental has been deployed
■ Retention: management has been clear that the savings will not be given back to the
customer in lower price. Synergies targets are considered ambitious but not
aggressive, and do not build in benefits from higher volumes.

9 October 2017
European Cranes 59
Konecranes: Company Primer
Figure 97: Konecranes - Company Overview
Source: Company data, Credit Suisse research
Figure 98: Konecranes – Divisions
Source: Company data, Credit Suisse research
Konecranes is a provider of lifting equipment and services across manufacturing
and process industries, shipyards, ports and container terminals. Konecranes was
formed in April 1994 when KONE Corporation made some structural changes and
sold the operations of its crane division. In 1996, Konecranes was listed on Helsinki
Stock exchange. The company is headquartered in Hyvinkaa, Finland.
Transformational M&A: In May 2016, Konecranes announced the purchase of
Terex’s MHPS division, consolidating from January 2017. ‘Combined 2016’ figures
refer to the combined reported results as if MHPS had been consolidated from
January 2016
Combined Workforce: 18,000 employees
Combined Sales in FY2016: €3.3bn (of which €2.1bn Konecranes)
Operating income in FY2016: €184m with a margin of 5.6%
Key Management
Company Overview
Source: Company data as of FY 2016
Sales by Geography, 2016 Combined
Slide 2
Employees by Geography, 2016 Combined
Chairman Christoph Vitzthum
President & CEO Panu Routila
CFO Teo Ottola
IR VP Miikka Kinnunen
EMEA50%
AME33%
APAC17%
EMEA59%
AME20%
APAC21%
The combined company consists of three divisions:
Service: 600 service locations providing specialized maintenance services and spares for industrial cranes,
hoists and port equipment.
Industrial Equipment: produces hoists, cranes and crane components marketed through a multi-brand
portfolio for customers including process industries, nuclear, industries handling heavy loads, shipyards, and
bulk material terminals.
Port Solutions: offers a full range of container handling equipment, shipyard handling equipment and
heavy duty lift trucks along with complete service range for container port and intermodal terminals.
Divisions
Source: Company data as of FY 2016
Sales by Division, 2016 Combined
Slide 3
EBIT by Division, 2016 Combined
Service35%
Industrial equipment
33%
Port Solutions
32%
Service74% (4.8% margin)
Industrial equipment0% (-0.5% margin)
Port Solutions26% (12.6% margin)

9 October 2017
European Cranes 60
Figure 99: Konecranes – Service
Source: Company data, Credit Suisse research
Figure 100: Konecranes – Service Growth Drivers
Source: Company data, Credit Suisse research
4%
6%
8%
10%
12%
14%
0
200
400
600
800
1000
1200
Orders Sales Undl EBIT Margin (RHS)
Source: Company data as of FY 2016
Slide 4
Divisions: Service Key Figures (2016 combined): Orders of €1,045m, Sales of
€1,214m with a margin of 12.6%.
Service offering:
Inspections, preventive maintenance, remote and on-callservice, repairs, modernizations, and a variety ofconsultation services for overhead industrial cranes.
Spare parts.
In addition there is a small business, mainly in Finland,servicing Machine Tools.
Brands: Konecranes service both own-brand (25%) and 3rd party(75%) overhead cranes
Service – Financials (€m)Service – Room to grow core business
Source: Company data as of FY 2016
Slide 4
Market position
Competing
external
suppliers
~75%
Konecranes
~25%
In-house
service
67%
Open
market
33%
Estimated global annual spend on crane maintenance. We estimate Konecranes now has 33% of the Open Market following the MHPS deal
Total market > €10bn Open market > €3bn
SegmentsMarket
Position
Overhead crane maintenance #1
Machine tool service n/a
Slide 5
Divisions: Service - Growth Drivers
Source: Company data
Slide 5
A key driver of the service business is underlying industrial activity, though with less cyclicality than seen for the equipmentbusiness. The service business has structural growth characteristics.
Aside from general stability of any service business, a contributing factor of Service revenue stability is the contractedservice base, where Konecranes is trying to grow both the number of units under service agreements, as well as the annualrevenue per unit.
Overall, the Industrial Cranes business is designed to drive service revenue. Konecranes focus on the equipment of highervalue, electrified and with complex control systems in order to generate the maximum service opportunity.
We note a step-down in revenue per service base in Q2 2017, as a result of bringing the full Demag service base into themetrics. Bringing the service revenues per instance of installed base up to Konecranes values is a core element of revenuesynergies for Konecranes. trend
Service – revenue per item of equipment in contracted service base Service revenue trends vs. equipment (€m)
0
500
1,000
1,500
2,000
Service Equipment
80
85
90
95
100
105
110
115
120
300,000
350,000
400,000
450,000
500,000
550,000
600,000
650,000
Total number of equipment under contract
Revenue per service base item per quarter (EUR) RHS

9 October 2017
European Cranes 61
Figure 101: Konecranes – Industrial Equipment
Source: Company data, Credit Suisse research. Credit Suisse estimates of pre 2016 divisional financials
Figure 102: Konecranes – Industrial Equipment Growth Drivers
Source: Company data, Thomson Reuters
Konecranes equipment
66%
margin: 1.9%
MHPS equipment
34%
margin: 0.3%
-1%
0%
1%
2%
3%
0
200
400
600
800
1000
1200
Orders Sales Undl EBIT Margin (RHS)
Slide 6
Divisions: Industrial Equipment
Key Figures (2016 combined): Orders of €1,149m, Sales of€1,131m with a margin of -0.5%.
Products:
Cranes (~50%): Industrial overhead and gantry cranes. Agilonmaterial handling solutions.
Components (~50%): hoists, trolleys and electrics
End-markets: General industrial, logistics, metal production, paper& forest, power, nuclear cranes, transportation, chemicals
Brands: Konecranes is the largest brand for equipment sold directlyto end users, with Demag slightly smaller. SWF, Verlinde, R&M,Morris Crane systems, and Donati are ‘Power Brands’ sold todistributors and crane-builders.
Industrial Equipment – Financials (€m)
Slide 6
Market position
SegmentsMarket
Position
Industrial Cranes #1
Lift trucks (container handling, and heavy forklift >10t) #2
Port cranes (includes shipyard cranes) #3 - 5
Industrial Equipment – Profit Pools
Source: Company data as of FY 2016, Credit Suisse estimates of pre 2016 divisional financials
-25%
-20%
-15%
-10%
-5%
0%
5%
10%
15%
20%
25%
-40%
-30%
-20%
-10%
0%
10%
20%
30%
2008 2009 2010 2011 2012 2013 2014 2015 2016 2017 2018
KCRA Organic Revenue % yoy smoothedGerman IFO (Leading 11m, RHS)
E
Source: Company data as of FY 2016
Slide 7
Source: Company data as of FY 2016
Slide 7
Divisions: Industrial Equipment - growth drivers
Given that overhead cranes are used across a wide variety of end markets, general industrial production is a keydriver of the equipment business.
The key specific end markets for Konecranes industrial equipment are Logistics, Metals Production and Power.
Konecranes is a late-cycle business, seeing a 11-month delay between the business cycle and the impact onrevenues. We see the German IFO as correlating well with Konecranes, reflecting the overall end-marketexposure of Konecranes towards heavy process industries and general manufacturing.
Regional IP growth – stable trends across regionsGerman IFO vs. Konecranes ex-FX revenue growth
-4%
0%
4%
8%
12%
Dec-10 Dec-11 Dec-12 Dec-13 Dec-14 Dec-15 Dec-16 Dec-17E
Regio
nal change (
yoy%
)
Europe America Asia Global
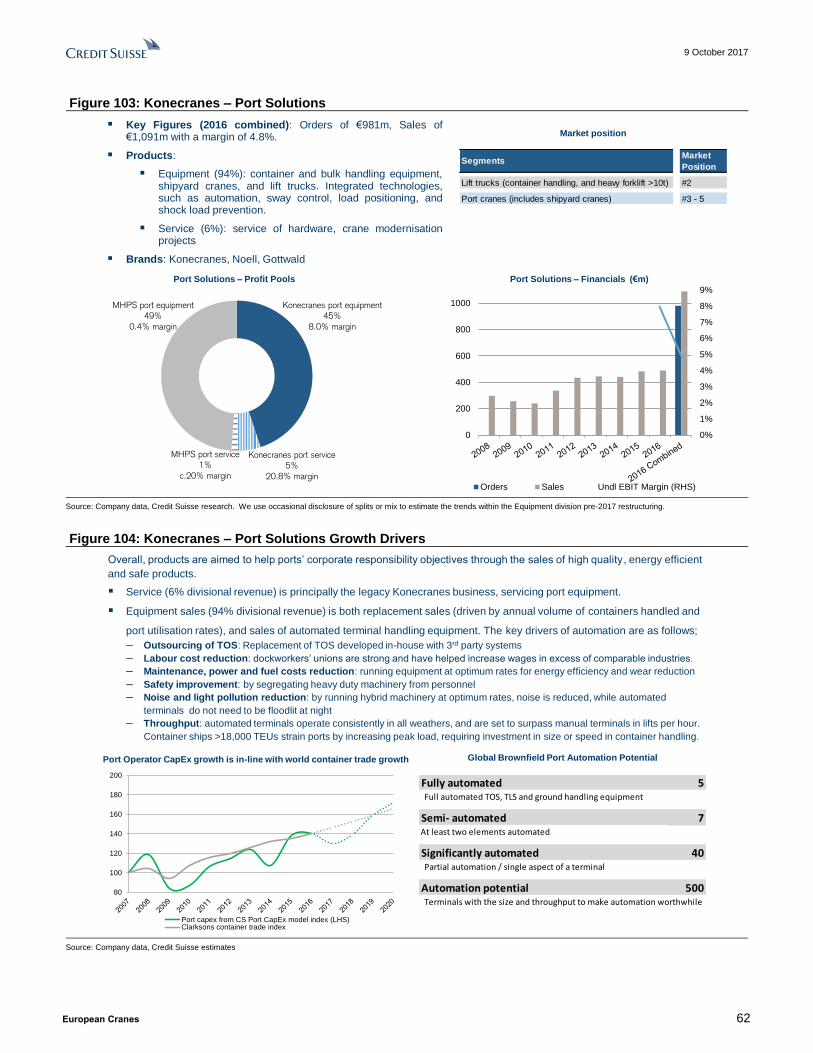
9 October 2017
European Cranes 62
Figure 103: Konecranes – Port Solutions
Source: Company data, Credit Suisse research. We use occasional disclosure of splits or mix to estimate the trends within the Equipment division pre-2017 restructuring.
Figure 104: Konecranes – Port Solutions Growth Drivers
Source: Company data, Credit Suisse estimates
Divisions: Port Solutions
Slide 8
Source: Company data as of FY 2016, Credit Suisse estimates of pre 2016 divisional financials
Slide 8
Key Figures (2016 combined): Orders of €981m, Sales of€1,091m with a margin of 4.8%.
Products:
Equipment (94%): container and bulk handling equipment,shipyard cranes, and lift trucks. Integrated technologies,such as automation, sway control, load positioning, andshock load prevention.
Service (6%): service of hardware, crane modernisationprojects
Brands: Konecranes, Noell, Gottwald
Slide 8
SegmentsMarket
Position
Lift trucks (container handling, and heavy forklift >10t) #2
Port cranes (includes shipyard cranes) #3 - 5
Market position
Port Solutions – Financials (€m)
0%
1%
2%
3%
4%
5%
6%
7%
8%
9%
0
200
400
600
800
1000
Orders Sales Undl EBIT Margin (RHS)
Konecranes port equipment
45%
8.0% margin
Konecranes port service
5%
20.8% margin
MHPS port service
1%
c.20% margin
MHPS port equipment
49%
0.4% margin
Port Solutions – Profit Pools
Overall, products are aimed to help ports’ corporate responsibility objectives through the sales of high quality , energy efficient
and safe products.
Service (6% divisional revenue) is principally the legacy Konecranes business, servicing port equipment.
Equipment sales (94% divisional revenue) is both replacement sales (driven by annual volume of containers handled and
port utilisation rates), and sales of automated terminal handling equipment. The key drivers of automation are as follows;
– Outsourcing of TOS: Replacement of TOS developed in-house with 3rd party systems
– Labour cost reduction: dockworkers’ unions are strong and have helped increase wages in excess of comparable industries.
– Maintenance, power and fuel costs reduction: running equipment at optimum rates for energy efficiency and wear reduction
– Safety improvement: by segregating heavy duty machinery from personnel
– Noise and light pollution reduction: by running hybrid machinery at optimum rates, noise is reduced, while automated
terminals do not need to be floodlit at night
– Throughput: automated terminals operate consistently in all weathers, and are set to surpass manual terminals in lifts per hour.
Container ships >18,000 TEUs strain ports by increasing peak load, requiring investment in size or speed in container handling.
Divisions: Port Solutions - Growth Drivers
Source: Company data as of FY 2016, Clarksons Shipping data
Slide 9
Global Brownfield Port Automation PotentialPort Operator CapEx growth is in-line with world container trade growth
Fully automated 5 Full automated TOS, TLS and ground handling equipment
Semi- automated 7At least two elements automated
Significantly automated 40 Partial automation / single aspect of a terminal
Automation potential 500 Terminals with the size and throughput to make automation worthwhile
80
100
120
140
160
180
200
Port capex from CS Port CapEx model index (LHS)Clarksons container trade index

9 October 2017
European Cranes 63
Figure 105: Konecranes – Equipment: Products and Brands
Source: Company data. All images credit to Konecranes.
Figure 106: Konecranes – MHPS Acquisition (Summary)
Source: Company data
Source: Company data as of FY 2016
Slide 10
Equipment: Products and Brands
Source: Company data as of FY 2016
Slide 10
Brands: Konecranes, EX-Series (Harzardous)
CLX Chain Hoists Custom and Automated Cranes
Brands: Konecranes
Brands: Konecranes, Goliath Brands: Konecranes
Overhead Cranes
CXT Wire Rope Hoists Open Winch Cranes
Brands: Konecranes CXT, UNO, NEO, Explorer Brands: Konecranes SMARTON, UNITON
Automated Guided Vehicles
Brands: Konecranes Gottwald
Workstation Lifting Systems
Electric and Manual Hoists Worstation and Jib Cranes
Brands: Brands: Konecranes
Shipyard Cranes
Block and Plate Handling Cranes Single / Double Boom Shipyard Cranes
Brands: Konecranes, Konecranes Liftace Brands: Konecranes, Konecranes Liftace
Container Lift Trucks Horizontal Transportation
Brands: Konecranes, Konecranes Liftace
Brands: Konecranes
Terminal Tractors:
Products: Sprinter, A-Sprinter, A-STRAD
Rubber Tyred Gantry (RTG) Cranes Rail Mounted Gantry (RMG) Cranes
Products: Konecranes Noell, BOXHUNTER Products: BOXPORTER
Reach Stackers Fork Lift Trucks
Port Solutions Industrial Equipment
Lift Trucks
Container Yard
Quayside
Ship-To-Shore (STS) Gantry Cranes Noell Straddle Carriers
Brands: Konecranes / Konecranes Noell
MHPS Acquisition
Source: Company data as of FY 2016
Slide 11
Strategic rationale:
Combines a highly complementary set of products in port handling equipment and overhead cranes.
Strengthens service offering on a wider scale.
Creates global footprint to be able to serve customers globally.
Creates a stronger basis for future technology and R&D, for example in automation, software and digitalization
Can reach economies of scale to improve margins in the equipment businesses.
Allows for IT infrastructure to be leveraged, improving processes worldwide.
Global Footprint post MHPS
EMEA50%
AME33%
APAC17%
Services – Product Split post acquisition
Service40%
Product60%
Synergy at EBIT level, run rate impact at YE (in €m)
Previously reported estimates (€m)
45
140
50-60
35-45
0
50
100
150
2017 2018 2019 Total
P&L impact of
€15-20m expected in 2017
35 55- 65 40-50 140

9 October 2017
European Cranes 64
Figure 107: Konecranes – MHPS Acquisition (History and Finances)
Source: Company data, Credit Suisse research
Figure 108: Konecranes – MHPS Acquisitions (Integration & Group Reorganisation, 2016)
Source: Company data, Credit Suisse research. All figures quoted are 2016.
MHPS is a supplier of industrial cranes, crane components and services under Demag brand. It is a port technology expert
with a broad range of solutions under the Gottwald and Noell brands. The company generated €1.4bn sales in 2015, has
operations in 16 countries and employs 7,000 people.
MHPS History:
1819 – First operations in Wetter of company that became Demag in 1910
1824 – Noell commences operations in Wurzburg
1906 – Gottwald Port Technology is founded in Dusseldorf
2011 – Operations come under Terex ownership
MHPS – History & Finances
Source: Company data as of FY 2016
Slide 12
SG&A
▪ SG&A efficiencies
▪ IT system consolidation
▪ Engineering and R&D optimization
Operations
▪ Manufacturing footprint
▪ Capacity utilization
▪ Overall operational optimization
Supply chain optimization
Insourcing/ outsourcing
Freight and logistics efficiency
Procurement
▪
▪
▪
Opportunity through Synergies - €140m synergies at EBIT level
Konecranes Combined MHPS
120
3550 4550 1000
460K 740K 280K
Service
locations
Technicians
Service
contract base
485 605
Significant strengthening of service capabilities
MHPS Integration & Group Reorganisation
*€830m includes €89m of intercompany revenue Source: Company data as of FY 2016
Slide 13
KC Port Crane
Service
Revenue: €53m
Adj. EBITA: €11m
Margin: 20.8%
Konecranes Equipment
Revenue: €1,231m
Adj. EBIT: €52m
Margin: 4.2%
Konecranes Service
Revenue: €968m
Adj. EBIT: €111m
Margin: 11.5%
MHPS
Revenue: €1,280m
EBIT: €39m
Margin: 3.1%
STAHL
Revenue: €135m
EBIT: €23m
Margin: 17.0%
Columbus
McKinnon
Konecranes Service
Revenue: €915m
Adj. EBITA: €100m
Margin: 10.9%
Konecranes Industrial Equipment
Revenue: €830m *Adj. EBITA: €16m
Margin: 1.9%
Konecranes Port Solutions
Revenue: €543m
Adj. EBITA: €50m
Margin: 9.3%
KC Port Cranes and
Lift Trucks
Revenue: €490m
Adj. EBITA: €39m
Margin: 8.0 %
MHPS Industrial
Equipment
Revenue: €436m
Adj. EBITA: €1m
Margin: 0.3%
Combined Service
Revenue: €1214m
Adj. EBITA: €153m
Margin: 12.6%
Combined Industrial Equipment
Revenue: €1131m
Adj. EBITA: €-6.1m
Margin: -0.5%
Combined Port Solutions
Revenue: €1091m
Adj. EBITA: €53m
Margin: 4.8%
MHPS Port Cranes
Revenue: €548m
Adj. EBITA: €2m
Margin: 0.4%
MHPS Service
Revenue: €299m
Adj. EBITA: €53m
Margin: 17.7%

9 October 2017
European Cranes 65
Figure 109: Konecranes – MHPS Acquisitions (Synergies Targets & Implementation)
Source: Company data
Figure 110: Konecranes – Acquisitions and Disposals
Source: Company data, Credit Suisse research. Konecranes has disposed of the Samna brand, but retained the manufacturing facilities as it has found the Demag brands better in China.
MHPS Implementation & Group Targets
Source: Company data as of FY 2016
Slide 14
▪ ~30 MEUR of run-rate synergies already implemented during H1/17
▪ Integration activities progressing well
- 2017 activities largely launched and ongoing
- 2018 activities implementation being already planned
▪ Closure of a number of industrial crane plants
- Johannesburg, RSA
- Salzburg, AUT (manufacturing only, offices to remain open)
- Dietlikon, SUI (manufacturing only, offices to remain open)
- Edmonton, CAN (announced during Q1)
▪ Transfer of crane production from Chakan to Jejuri, IND
▪ Potential closure of plant being discussed with unions and local authorities at Lentigione site in Italy
▪ Keep momentum and focus on synergy delivery – ensure no slippage
▪ Launch implementation for remaining 2017 integration activities
▪ Develop and progress 2018 and 2019 integration activities
▪ Continue focusing on our customers
Main Achievements
Next Steps
▪ Go to market and sales channel optimization
▪ Combined product optimization and cross-sales
▪ Product platform and module harmonization
▪ Technology and R&D portfolio and footprint optimization
▪ Plant closure and capacity utilization optimization
▪ In and out-sourcing for cost and quality gains
▪ Global supplier network optimization, scale and harmonization
▪ Efficiency gains through roll-out of lean production best practices
▪ US Branch network consolidation mostly implemented, other geographies in planning
▪ Spare parts distribution centre and network optimization
▪ Mgmt. and back office scale, organization structure optimization
▪ IT: infra, support, HW and business application harmonization
Total 140 MEUR
~ 50 - 70 MEUR
Main levers
Commercial
Technology and
product platforms
Service operations
Organization and
support
Manufacturing
operations
Initial synergy
estimate
~ 15 - 25 MEUR
~ 20 - 30 MEUR
~ 15 - 20 MEUR
~ 15 - 20 MEUR
Synergy sources remain intact; Speed of implementation increased
Acquisitions and Disposals
Source: Company data as of FY 2016
Slide 17
Announced Consol. Date Name CountryPrice
(mEUR)
Revenue
(mEUR)
EBITDA
(mEUR)Staff Splits Products / Comments
05/01/2016 04/01/2017 Terex Corporation 1,280 1,398 41 7,000 CSe 30% service Transformational deal
04/07/2013 Various small 3
04/07/2012 Various small 3
01/07/2011 01/07/2011Saudi Cranes & Steel Works
Factory Company Limited
Saudi
Arabia17 100 Equipment
Konecranes acquired 100 percent of the Saudi Arabian crane manufacturer
Saudi Cranes & Steel Works Factory Company. Saudi Cranes’ core business is
designing, manufacturing and selling industrial cranes.
11/10/2010 01/02/2011 WMI Cranes India 60 34 EquipmentKonecranes entered into an agreement to acquire the Indian crane
company WMI Cranes Ltd. (WMI).
02/07/2010 Various small 8
01/10/2009 01/10/2009Machine Tool Solutions
UnlimitedUS 4 18 Service
Konecranes expanded its machine tool service (MTS) business to the U.S,
providing a range of services, including tool rebuilding, control retrofits,
preventive maintenance, calibration and repair services
18/11/2009 18/11/2009 Dynamic Crane SystemsSouth
Africa8 75 assume 50/50 Brings ownership from 19.5% to 100%.
29/07/2009 29/07/2009 ACS Technologies Austria 7 65 EquipmentKonecranes increased its ownership in the Austrian ACS Konecranes GmbH
(former ACS Technologies GmbH) from 49.9% to 80%
29/07/2009 29/07/2009 Knight Europe GmbH Germany 9 35 EquipmentAcquired the assets of the German company Knight Europe GmbH & Co.
KG.
04/05/2009 01/11/2009 Sanma (65%) China 18 500 Equipment
Konecranes has signed an agreement to acquire the majority of Jiangsu
Three Horses Crane Manufacture Co. Ltd. (SANMA), one of the leading hoist
and crane manufacturers in China.
2009 Electron Services England 3 20 Service
Acquired three MTS companies in the UK; K&B Europe Ltd, Electron Service
Ltd, the assets of Machine Tool Services (GB) Ltd were acquired at the
beginning of November.
Announced Disposal Date Division BuyerPrice
(mEUR)
Revenue
(mEUR)
EBITDA
(mEUR)Staff Revenue Split Products / Comments
Sep-16 31/01/2017 STAHL CraneSystemsColumbus
McKinnon224 135 30 650 Equipment Germany based company. Booked 190m capital gain
Q4 2008 STAHL CraneSystems BV Equipment Austria
Acquisitions
Disposals

9 October 2017
European Cranes 66
Figure 111: Konecranes – Shareholding
Source: Company data, Credit Suisse research
Shareholding
Source: Company data as of FY 2016
Slide 18
Major shareholders as of 31 Dec 2016 Shareholder by category
Private companies
15% Financial and insurance institutions
2%
Public sector organizations
5%
Households11%
Non-profit organizations
4%
Foreigners7%
Nominee registered
56%
Hartwall Capital
9% Terex Corporation
7%
Solidium3%
Stig Gustavson &
fmly3%
Varma Mutual Pension
Insurance Company
1%Others77%
As of 31st December, 2016, Konecranes had 63, 272, 342 shares and possessed 7.1% of the total number of shares
having a market value of EUR 152.7m.
The total number of shareholders amounted to 19, 523 as of 31st December, 2016. Nominee registered shareholders
contributed to more than 50%.
As of 31st July 2017, Hartwell Capital is the largest shareholder with 9% of shares followed by Terex corporation
(7%).

9 October 2017
European Cranes 67
Figure 112: Konecranes – Executive Management Team
Source: Company data, Credit Suisse research
Name Konecranes Experience Previous Experience
Panu Routila 2015-2017: President / CEO 2008-2015: Ahlstrom Capital Oy, President and CEO
Age: 53 2002-2008: Altems Oy, Kuusakoski Group, CEO
President / CEO 1995-2002: Draw n Copper Products, Outokumpu Group, Director (Prev. Controller)
Teo Ottola 2007-2017: Member of Executive Board 2004-2007: Elcoteq SE, CFO
Age: 49 1998-2004: Elcoteq Netw ork Oyj, SVP (Prev. Group Business Controller)
CFO 1996-1998: Elcoteq Lohja Oy, Business Controller
Susanna Schneeberger 2017: Chief Strategy Officer 2015-2016: Terex material Handling & Port Solutions, VP & MD
Age: 44 2007-2015: Trelleborg AB, VP, Sales & Marketing; Director- Strategic Business Development
CSO 2002-2006: IXOS Softw are AG, Director, Strategy & Markets, Head - European Marketing
2000-2002: IconMedialab AG, Management Consultant, Project Manager
1997-2000: International Masters Publishers, Product Division Manager
Fabio Fiorino 2012-2017: Executive VP, BA Service, Chief Customer Officer 2006-2009: Morris Material Handling, Inc., President
Age: 50 2011-2012: Executive VP, Head of BA Service 2002-2006: Drivecon, Inc., President
Service - Executive VP 2010-2011: Konecranes America, VP, BA Service 1999-2002: R&M Materials Handling, Inc., President
1998-1999: Konecranes America, VP, Business Development, LatAm 1989-1994: AECL, Mechanical / Project Engineer
1995-1998:Konecranes Canada, Marketing Manager
Mikko Uhari 2016-2017: Executive VP, Industrial Equipment 1982-1997: KONE Corporation, Managerial positions, Wood Handling Division.
Age: 60 2012-2016: Executive VP, Strategy and Technology
Industrial Equipment - Executive VP 2011-2012: Executive VP, Head of Market Operations
2010-2011: Executive VP, Head of BA Equipment
2005-2009: KCI Konecranes, President, New Equipment BA
2004-2005: KCI Konecranes, President, Special Cranes
1997-2003: KCI Konecranes, President, Harbor and Shipyard Cranes
Mika Mahlberg 2016-2017: Executive Vice President, Port Solutions 1996-1997: Crow n Cork & Seal Company, World Class Manufacturing Manager
Age: 54 2008-2016: VP, Head of Business Unit Port Cranes 1990-1995: Partek Group, Managerial positions, BA Precast Concrete
Port Solutions - Executive VP 2006-2007: KCI Konecranes, Director, VLC Cranes
2000-2006: KCI Konecranes, Director, STS Cranes
1997-2000: Project Manager, Harbor and Shipyard Cranes
Mikka Kinnunen 2009-2016: VP, Investor Relations 2001-2009: Carneige Investment Bank AB, Financial Analyst
Age: 40
Investor Relations - VP

9 October 2017
European Cranes 68
Konecranes: Financials
Figure 113: Konecranes Quarterly Overview
Source: Company data, Credit Suisse estimates
€m 1Q 2016 2Q 2016 3Q 2016 4Q 2016 1Q 2017 2Q 2017 3Q 2017E 4Q 2017E 2016 2017E
Orders by Division
Service 245 255 241 240 246 251 230 232 774 960
Growth % 27.4% 23.5% 22.7% 22.1% -4.3% 23.9%
Organic Growth % -1.7% -2.5% -1.0% 1.0% -2.9% -0.9%
Industrial Equipment 276 301 276 297 271 309 278 298 1217 1154
Growth % 8.8% 4.1% 11.0% -29.4% -3.2% -5.1%
Organic Growth % -3.4% 1.8% 2.5% 3.5% -1.9% 1.2%
Port Solutions 171 250 203 421 247 262 266 209 984
Growth % 0.0% 0.0% 0.0% 0.0% n/a
Organic Growth % 44.6% 6.4% 33.0% -47.0% -4.0%
Group Orders 657 762 685 922 735 790 740 703 1,921 2,968
Growth % 73% 65% 76% 18% -2.3% 54.6%
Organic Growth % 10.3% 6.6% 9.9% -20.4% -0.9% -0.3%
Revenue by Division
Service 280 304 296 334 285 298 284 327 968 1193
Growth % 28.6% 21.8% 21.2% 22.1% -2.4% 23.3%
Organic Growth % -0.9% -3.2% -2.0% 1.0% -1.0% -1.3%
Industrial Equipment 253 283 275 319 250 297 280 325 1231 1151
Growth % -3.1% -2.9% -7.5% -11.1% -0.7% -6.5%
Organic Growth % -4.2% 2.7% 3.5% 5.0% 0.6% 1.8%
Port Solutions 220 242 278 352 181 238 272 340 1032
Growth % n/a n/a n/a n/a 0.0%
Organic Growth % -17.5% -1.7% 0.0% 0.0% -4.1%
Group Revenue 716 787 804 971 683 797 801 959 2118 3241
Growth % 49.1% 50.8% 54.8% 56.4% -0.4% 53.0%
Organic Growth % -5.8% -2.5% 1.5% 2.1% 1.1% -1.1%
Operating Profit by Division
Service 27 38 37 51 33 41 40 49 111 163
Margin % 9.7% 12.4% 12.7% 14.4% 11.6% 13.8% 14.0% 15.0% 11.4% 13.7%
Industrial Equipment -14 -5 3 10 0 6 10 15 52 30
Margin % -5.4% -1.7% 1.1% 3.0% -0.2% 2.1% 3.5% 4.5% 4.2% 2.6%
Port Solutions 0 14 10 29 3 13 12 27 55
Margin % 0.0% 5.7% 3.7% 8.2% 1.4% 5.5% 4.5% 8.0% 5.3%
Group Operating Profit 9 43 47 86 31 51 55 84 141 220
Margin % 1.2% 5.4% 5.8% 8.8% 4.5% 6.4% 6.8% 8.7% 6.6% 6.8%
2016 figures for combined company

9 October 2017
European Cranes 69
Figure 114: Konecranes Divisional Overview
Source: Company data, Credit Suisse estimates
Divisional Overview €m 2008 2009 2010 2011 2012 2013 2014 2015 2016 2017E 2018E 2019E
Orders
Service 658 498 606 695 735 716 751 809 774 960 1,000 1,036
Change yoy, % 5.6% -24.3% 21.5% 14.7% 5.8% -2.6% 4.9% 7.8% -4.3% 23.9% 4.2% 3.6%
Organic growth, % (CSe) 9.0% -25.0% 15.1% 16.1% 0.8% 0.4% 6.4% -1.0% -2.9% -0.9% 5.7% 3.6%
Industrial Equipment 1,545 942 1,005 1,292 1,340 1,320 1,263 1,258 1,217 1,154 1,198 1,257
Change yoy, % 13.3% -39.0% 6.7% 28.5% 3.8% -1.5% -4.3% -0.4% -3.2% -5.1% 3.8% 5.0%
Organic growth, % (CSe) 17.2% -39.8% 3.8% 29.2% 0.0% 0.5% -3.0% -5.7% -1.9% 1.2% 5.3% 5.0%
Port Solutions 984 1,060 1,184
Change yoy, % n/a 7.7% 11.8%
Organic growth, % (CSe) -4.0% 9.2% 11.8%
GROUP ORDERS 2,203 1,441 1,536 1,896 1,970 1,921 1,904 1,965 1,921 2,968 3,129 3,349
Change yoy, % 10.9% -34.6% 6.6% 23.4% 3.9% -2.5% -0.9% 3.3% -2.3% 54.6% 5.4% 7.0%
Organic growth, % (CSe) 14.3% -34.1% 9.1% 24.4% -0.3% -0.1% 0.5% -3.3% -0.9% -0.3% 5.4% 7.0%
Revenues
Service 754 667 708 796 884 889 895 992 968 1,193 1,233 1,288
Change yoy, % 9.0% -11.5% 6.1% 12.5% 11.1% 0.6% 0.7% 10.9% -2.4% 23.3% 3.3% 4.4%
Organic growth, % (CSe) 12.4% -12.4% -0.1% 13.4% 5.6% 3.3% 2.1% 2.1% -1.0% -1.3% 4.8% 4.4%
Industrial Equipment 1,495 1,131 949 1,201 1,413 1,329 1,222 1,240 1,231 1,151 1,196 1,259
Change yoy, % 27.3% -24.3% -16.1% 26.6% 17.6% -5.9% -8.1% 1.5% -0.7% -6.5% 3.9% 5.3%
Organic growth, % (CSe) 30.7% -25.7% -22.6% 23.4% 12.2% -4.1% -6.9% -3.9% 0.6% 1.8% 6.3% 5.3%
Port Solutions 1,032 1,046 1,177
Change yoy, % n/a 1.4% 12.6%
Organic growth, % (CSe) -4.1% 2.6% 12.6%
GROUP SALES 2,103 1,671 1,546 1,896 2,172 2,100 2,012 2,126 2,118 3,241 3,346 3,595
Change yoy, % 20.1% -20.5% -7.5% 22.6% 14.5% -3.3% -4.2% 5.7% -0.4% 53.0% 3.2% 7.4%
Organic growth, % (CSe) 21.3% -21.1% -14.1% 21.0% 9.1% -1.1% -2.9% -1.1% 1.1% -1.1% 5.0% 7.4%
Reported EBIT
Service 106 74 63 49 75 68 87 99 102 139 165 207
Margin, % 14.1% 11.0% 8.8% 6.2% 8.4% 7.6% 9.7% 10.0% 10.6% 11.6% 13.4% 16.1%
Industrial Equipment 194 84 65 78 78 38 46 19 43 3 28 70
Margin, % 13.0% 7.4% 6.8% 6.5% 5.5% 2.8% 3.7% 1.5% 3.5% 0.2% 2.3% 5.6%
Port Solutions 42 64 97
Margin, % 4.1% 6.1% 8.2%
GROUP REP. EBIT 249 98 112 107 133 85 116 63 85 343 207 333
Group Margin, % 11.8% 5.9% 7.3% 5.6% 6.1% 4.0% 5.8% 3.0% 4.0% 10.6% 6.2% 9.3%
Underlying EBITA
Service 106 76 63 56 75 81 89 103 111 163 190 223
Margin, % 14.1% 11.4% 8.8% 7.0% 8.4% 9.1% 10.0% 10.4% 11.4% 13.7% 15.4% 17.4%
Industrial Equipment 194 102 67 82 84 54 47 34 52 30 54 87
Margin, % 13.0% 9.0% 7.1% 6.8% 6.0% 4.1% 3.8% 2.7% 4.2% 2.6% 4.5% 6.9%
Port Solutions 55 74 102
Margin, % 5.3% 7.0% 8.6%
Group 249 119 115 117 138 116 119 118 141 220 302 396
Group Margin, % 11.8% 7.1% 7.4% 6.2% 6.4% 5.5% 5.9% 5.5% 6.6% 6.8% 9.0% 11.0%

9 October 2017
European Cranes 70
Figure 115: Konecranes Income Statement
Source: Company data, Credit Suisse estimates
Figure 116: Konecranes Balance Sheet
Source: Company data, Credit Suisse estimates
Income Statement €m 2008 2009 2010 2011 2012 2013 2014 2015 2016 2017E 2018E 2019E
GROUP SALES 2,103 1,671 1,546 1,896 2,172 2,100 2,012 2,126 2,118 3,241 3,346 3,595
Operating profit (EBIT) 249 98 112 107 133 85 116 63 85 343 207 333
M argin, % 11.8% 5.9% 7.3% 5.6% 6.1% 4.0% 5.8% 3.0% 4.0% 10.6% 6.2% 9.3%
Share of associated companies' & JV's net income-4 -2 3 4 4 4 4 5 6 0 0 0
Gain on disposal of investment in associated company 0 0 0 0 0 0 0 0 6 0 0 0
Net Interest -9 -7 -4 -15 -12 (13) (12) (13) (35) (50) (46) (38)
Financial income 10 4 11 11 7 18 2 8 1 40 20 20
Financial expenses -19 -11 -14 -26 -19 (31) (15) (20) (36) (90) (66) (58)
Reported PBT 236 89 111 96 124 76 108 55 62 293 161 295
Underlying PBT 240 112 112 102 126 103 107 105 106 170 256 358
Income taxes -70 -26 -33 -31 -39 (26) (33) (25) (24) (36) (50) (91)
Underlying tax rate % 29.0% 23.3% 29.7% 30.1% 31.2% 25.3% 30.7% 23.4% 23.0% 20.9% 19.5% 25.5%
Profit after tax 167 62 78 65 85 50 75 31 38 258 111 204
Underlying PAT 171 86 78 71 87 77 74 81 82 135 206 267
Underlying PAT Margin 8.1% 5.1% 5.1% 3.8% 4.0% 3.7% 3.7% 3.8% 3.9% 4.2% 6.2% 7.4%
Minorities 0 -1 -1 -1 1 0 0 0 0 -3 -3 -6
Reported Net Income 166 64 79 66 84 49 75 31 38 260 114 210
Operating Net Income 171 85 77 71 88 77 74 81 82 132 203 261
Dividends paid 53 53 59 59 60 61 61 61 62 82 82 90
Retained Earnings 113 10 20 6 24 (12) 14 (31) (24) 178 32 120
Basic Reported EPS 2.83 1.08 1.35 1.11 1.47 0.85 1.29 0.52 0.64 3.34 1.47 2.69
Change yoy, % 30.4% -61.8% 25.0% -17.8% 32.7% -42.2% 51.3% -59.4% 22.8% 420.9% -56.1% 83.6%
Diluted Reported EPS 2.82 1.08 1.34 1.10 1.47 0.85 1.29 0.52 0.64 3.34 1.47 2.69
Change yoy, % 32.4% -61.7% 24.1% -17.9% 33.2% -42.1% 51.5% -59.3% 22.8% 420.9% -56.1% 83.6%
CS operating EPS 2.89 1.43 1.30 1.19 1.52 1.33 1.28 1.38 1.39 1.70 2.61 3.35
Operating EPS growth, % 53.8% -50.5% -9.0% -8.2% 27.3% -12.4% -4.0% 7.7% 1.0% 22.1% 53.5% 28.4%
Basic no of shares 59 59 59 59 57 58 58 59 59 78 78 78
Diluted no of shares 59 59 59 59 58 58 58 59 59 78 78 78
Balance Sheet €m 2008 2009 2010 2011 2012 2013 2014 2015 2016 2017E 2018E 2019E
Total PPE & Intangibles 132 157 167 207 215 232 252 251 226 897 842 803
Other Fixed Assets 106 130 178 241 263 251 249 255 171 1,120 1,120 1,120
Total Non-current assets 238 287 345 448 478 483 501 506 397 2,017 1,961 1,923
Inventories 333 248 270 347 370 326 336 365 282 575 594 638
Accounts receivable & other non-interest-bearing assets398 265 316 406 442 369 365 377 379 577 596 640
Accounts payable and other non-interest-bearing liabilities135 84 117 152 157 147 137 139 99 230 237 255
Working Capital 596 430 468 601 655 547 563 603 562 922 952 1,023
Cash and cash equivalents 101 138 98 73 145 132 98 81 167 225 280 362
Interest-bearing liabilities 12 27 50 164 122 187 80 225 270 112 112 112
Interest-bearing liabilities (NCL) 103 39 33 129 206 133 167 59 54 635 635 635
Net debt/ (cash) 14 -72 -15 220 182 187 150 203 156 522 467 385
Other investments 135 123 146 175 141 173 180 156 305 246 246 246
Other liabilities 555 504 519 567 629 570 644 606 662 1,367 1,367 1,367
Net Assets 401 407 456 437 463 445 450 456 446 1,297 1,326 1,440

9 October 2017
European Cranes 71
Figure 117: Konecranes Cash Flow Statement
Source: Company data, Credit Suisse estimates
Cash Flow Statement €m 2008 2009 2010 2011 2012 2013 2014 2015 2016 2017E 2018E 2019E
Net income 167 62 78 65 85 49 75 31 38 258 111 204
Taxes 70 26 33 31 39 26 33 25 25 36 50 91
Financial income and expenses 9 7 4 15 12 13 12 13 35 50 46 38
Share of ass.' & joint ventures' 4 2 -3 -4 -4 (4) (4) (5) (12) 0 0 0
Dep, amo. & impairment 27 33 31 41 44 56 43 54 54 127 129 118
P&L on sale of Fas & businesses -1 1 -1 0 0 2 (0) 1 3 -218 0 0
Other adjustments 0 2 1 3 3 2 (2) (3) 6 6 0 0
Change in w orking capital -91 155 -46 -119 28 28 27 (28) 41 115 (30) (71)
Change in int. free receivables -92 172 -50 -92 -5 17 22 27 (50) 13 (19) (44)
Change in inventories -77 95 -7 -57 -19 33 4 (17) 61 (14) (19) (44)
Change in int free cur. Lia. 78 -112 11 30 52 (21) 1 (37) 30 116 7 18
CFO (bef fin. items & taxes) 184 288 97 31 208 173 184 88 188 374 306 380
Interest received 3 1 2 6 6 4 3 6 9 40 20 20
Interest paid -8 -5 -6 -11 -15 (13) (13) (16) (19) (90) (66) (58)
Other f inancing items -1 -2 -5 -7 -5 1 5 (13) (39) -15 0 0
Income taxes paid -71 -60 -31 -41 -35 (44) (30) (26) (30) (36) (50) (91)
Net Cash flow from Ops. 107 223 57 -21 159 120 148 39 110 273 210 250
Operating Cashflow/UL EBIT 43.1% 187.6% 49.9% -17.8% 114.7% 103.9% 124.5% 33.1% 78.0% 123.8% 69.5% 63.2%
Capex -23 -30 -29 -53 -59 (58) (42) (43) (27) (71) (74) (79)
Disposals of f ixed assets 1 1 2 1 2 2 3 3 2 1 0 0
Net Capex -22 -29 -28 -52 -57 (56) (39) (41) (26) (70) (74) (79)
as a % of sales 1.1% 1.8% 1.9% 2.8% 2.7% 2.7% 2.1% 2.0% 1.3% 2.2% 2.2% 2.2%
Free Cash Flow 85 194 30 -73 102 64 110 -2 84 202 136 171
FCF/Op. Net Income 50.0% 229.7% 38.6% -103.2% 116.1% 83.0% 147.6% -2.1% 102.8% 152.6% 67.2% 65.8%
FCF/NOPAT 48.6% 231.6% 36.8% -92.1% 107.5% 84.4% 132.3% -2.6% 98.3% 104.1% 65.4% 62.7%

9 October 2017
European Cranes 72
PEERs
PEERs is a global database that captures unique information about companies within the
Credit Suisse coverage universe based on their relationships with other companies – their
customers, suppliers and competitors. The database is built from our research analysts’
insight regarding these relationships. Credit Suisse covers over 3,000 companies globally.
These companies form the core of the PEERs database, but it also includes relationships
on stocks that are not under coverage.
For more information, see our November 2016 PEERs report: A chain reaction: Supply chain strategies.
Figure 118: Konecranes PEERS analysis
Source: Credit Suisse PEERs

9 October 2017
European Cranes 73
Europe/Finland Industrial Machinery
Cargotec (CGCBV.HE) Rating NEUTRAL Price (05 Oct 17, €) 53.75 Target price (€) 52.00 Market Cap (€ m) 2,966.0 Enterprise value (€ m) 3,441.7 Target price is for 12 months.
Leo Carrington
44 20 7883 4532
Andre Kukhnin, CFA
44 20 7888 0350
Max Yates
44 20 7883 8501
Artem Tokarenko
44 20 7888 2676
Iris Zheng
44 20 7883 5298
Specialist Sales: Andrew Bell
44 20 7888 0479
Good business, but valuation fair
■ We initiate on Cargotec with a Neutral rating and a €52 target price.
■ Port equipment opportunity, but we prefer Konecranes as a play on the
theme. We estimate port operator capex growth of 8% in 2018e and 14% in
2019, while recent industry consolidation and imminent adoption of
automation will be protective for pricing. Cargotec derives c50% of its
revenue from sales of Port Equipment..
■ Positive mid-term outlook, consensus optimistic near term. Overall we
see strong mid-term growth prospects for Cargotec from the MacGregor
(marine) and Kalmar (Port Equipment) divisions; however, we see near-term
downside risk from earnings revisions due to consensus forecasts which
are, in our view, anticipating growth c12 months too early.
■ Long-term cyclicality risks weigh on valuation. We note that Cargotec’s
relatively low proportion of sales from aftermarket places it in the bottom
quartile of the Mechanical Capital Goods peer-group. In addition, we note a
surprisingly high degree of cyclicality in aftermarket organic growth and
strong correlation to OE sales during downturns. As such, we see the c20%
discount to the sector as appropriate.
■ Risks: Downside risk could arise if the pause in Port Operator CapEx
growth continues into 2018, while we see upside risk from acceleration in
the marine recovery.
■ Catalysts: 27/10/2017 - Q3 2017 results.
■ Valuation: Cargotec is trading on a 19% discount to the sector on 2018e
EBITA. We derive our target price using a DCF model. We see limited re-
rating potential given the nature of the aftermarket business, while mid-term
growth opportunities are balanced against high expectations from
consensus.
Performance 1M 3M 12M Absolute (%) 9.9 -2.5 32.0 Relative (%) 5.7 -3.6 16.1
Financial and valuation metrics
Year 12/16A 12/17E 12/18E 12/19E Revenue (€ m) 3,514.4 3,338.5 3,303.5 3,544.4 EBITDA (€ m) 335.0 358.4 393.8 426.0 Adjusted net income (€ m) 178.40 189.70 214.40 239.70 CS EPS (adj.) (€) 2.75 2.93 3.31 3.70 Prev. EPS (€) ROIC (%) 10.3 10.7 11.8 12.8 P/E (adj.) (x) 19.5 18.4 16.2 14.5 P/E rel. (%) 97.2 101.7 97.8 94.2 EV/EBITDA (x) 10.5 9.6 8.4 7.5
Dividend (12/17E, €) 1.13 Net debt/equity (12/17E,%) 32.0 Dividend yield (12/17E,%) 2.1 Net debt (12/17E, € m) 475.7 BV/share (12/17E, €) 22.9 IC (12/17E, € m) 1,963.5 Free float (%) 66.0 EV/IC (12/17E, (x) 1.8 Source: Company data, Thomson Reuters, Credit Suisse estimates
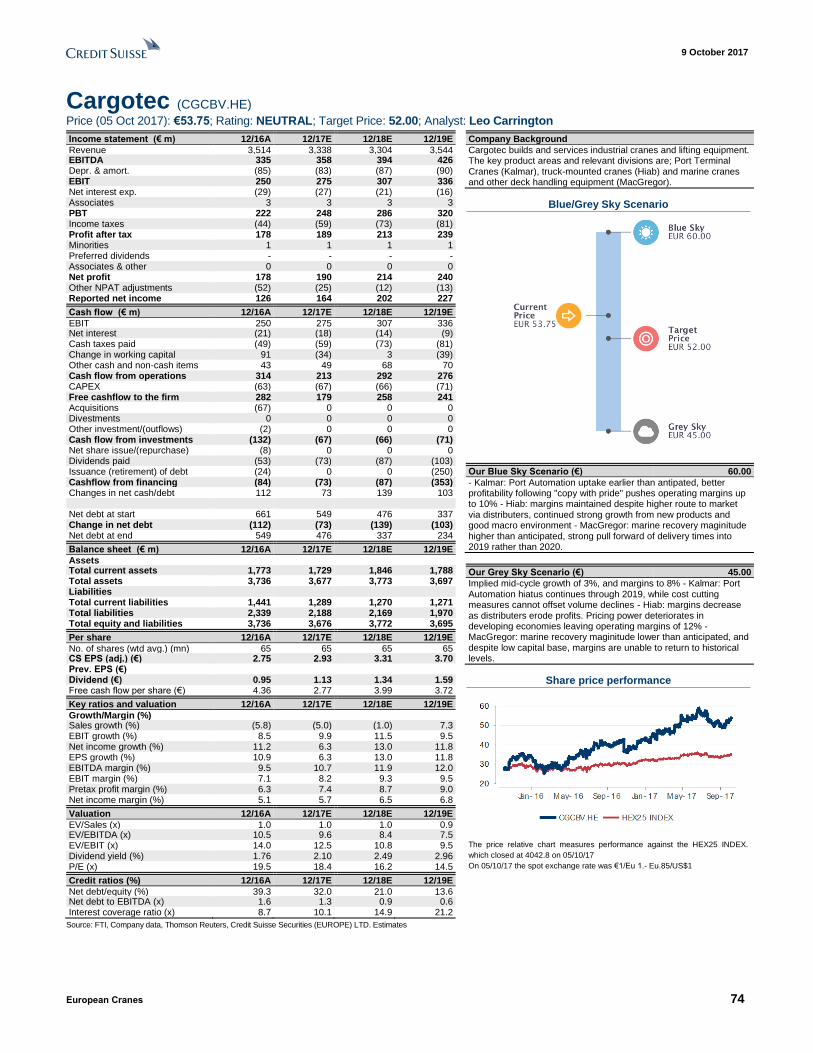
9 October 2017
European Cranes 74
Cargotec (CGCBV.HE)
Price (05 Oct 2017): €53.75; Rating: NEUTRAL; Target Price: 52.00; Analyst: Leo Carrington
Income statement (€ m) 12/16A 12/17E 12/18E 12/19E
Revenue 3,514 3,338 3,304 3,544 EBITDA 335 358 394 426 Depr. & amort. (85) (83) (87) (90) EBIT 250 275 307 336 Net interest exp. (29) (27) (21) (16) Associates 3 3 3 3 PBT 222 248 286 320 Income taxes (44) (59) (73) (81) Profit after tax 178 189 213 239 Minorities 1 1 1 1 Preferred dividends - - - - Associates & other 0 0 0 0 Net profit 178 190 214 240 Other NPAT adjustments (52) (25) (12) (13) Reported net income 126 164 202 227
Cash flow (€ m) 12/16A 12/17E 12/18E 12/19E
EBIT 250 275 307 336 Net interest (21) (18) (14) (9) Cash taxes paid (49) (59) (73) (81) Change in working capital 91 (34) 3 (39) Other cash and non-cash items 43 49 68 70 Cash flow from operations 314 213 292 276 CAPEX (63) (67) (66) (71) Free cashflow to the firm 282 179 258 241 Acquisitions (67) 0 0 0 Divestments 0 0 0 0 Other investment/(outflows) (2) 0 0 0 Cash flow from investments (132) (67) (66) (71) Net share issue/(repurchase) (8) 0 0 0 Dividends paid (53) (73) (87) (103) Issuance (retirement) of debt (24) 0 0 (250) Cashflow from financing (84) (73) (87) (353) Changes in net cash/debt 112 73 139 103 Net debt at start 661 549 476 337 Change in net debt (112) (73) (139) (103) Net debt at end 549 476 337 234
Balance sheet (€ m) 12/16A 12/17E 12/18E 12/19E
Assets Total current assets 1,773 1,729 1,846 1,788 Total assets 3,736 3,677 3,773 3,697 Liabilities Total current liabilities 1,441 1,289 1,270 1,271 Total liabilities 2,339 2,188 2,169 1,970 Total equity and liabilities 3,736 3,676 3,772 3,695
Per share 12/16A 12/17E 12/18E 12/19E
No. of shares (wtd avg.) (mn) 65 65 65 65 CS EPS (adj.) (€) 2.75 2.93 3.31 3.70 Prev. EPS (€) Dividend (€) 0.95 1.13 1.34 1.59 Free cash flow per share (€) 4.36 2.77 3.99 3.72
Key ratios and valuation 12/16A 12/17E 12/18E 12/19E
Growth/Margin (%) Sales growth (%) (5.8) (5.0) (1.0) 7.3 EBIT growth (%) 8.5 9.9 11.5 9.5 Net income growth (%) 11.2 6.3 13.0 11.8 EPS growth (%) 10.9 6.3 13.0 11.8 EBITDA margin (%) 9.5 10.7 11.9 12.0 EBIT margin (%) 7.1 8.2 9.3 9.5 Pretax profit margin (%) 6.3 7.4 8.7 9.0 Net income margin (%) 5.1 5.7 6.5 6.8
Valuation 12/16A 12/17E 12/18E 12/19E
EV/Sales (x) 1.0 1.0 1.0 0.9 EV/EBITDA (x) 10.5 9.6 8.4 7.5 EV/EBIT (x) 14.0 12.5 10.8 9.5 Dividend yield (%) 1.76 2.10 2.49 2.96 P/E (x) 19.5 18.4 16.2 14.5
Credit ratios (%) 12/16A 12/17E 12/18E 12/19E
Net debt/equity (%) 39.3 32.0 21.0 13.6 Net debt to EBITDA (x) 1.6 1.3 0.9 0.6 Interest coverage ratio (x) 8.7 10.1 14.9 21.2
Company Background
Cargotec builds and services industrial cranes and lifting equipment. The key product areas and relevant divisions are; Port Terminal Cranes (Kalmar), truck-mounted cranes (Hiab) and marine cranes and other deck handling equipment (MacGregor).
Blue/Grey Sky Scenario
Our Blue Sky Scenario (€) 60.00
- Kalmar: Port Automation uptake earlier than antipated, better profitability following "copy with pride" pushes operating margins up to 10% - Hiab: margins maintained despite higher route to market via distributers, continued strong growth from new products and good macro environment - MacGregor: marine recovery maginitude higher than anticipated, strong pull forward of delivery times into 2019 rather than 2020.
Our Grey Sky Scenario (€) 45.00
Implied mid-cycle growth of 3%, and margins to 8% - Kalmar: Port Automation hiatus continues through 2019, while cost cutting measures cannot offset volume declines - Hiab: margins decrease as distributers erode profits. Pricing power deteriorates in developing economies leaving operating margins of 12% - MacGregor: marine recovery maginitude lower than anticipated, and despite low capital base, margins are unable to return to historical levels.
Share price performance
The price relative chart measures performance against the HEX25 INDEX.
which closed at 4042.8 on 05/10/17
On 05/10/17 the spot exchange rate was €1/Eu 1.- Eu.85/US$1
Source: FTI, Company data, Thomson Reuters, Credit Suisse Securities (EUROPE) LTD. Estimates

9 October 2017
European Cranes 75
Cargotec: Key charts
Figure 119: Cargotec sales guidance vs history (€m) Figure 120: Cargotec EBIT guidance vs. history (€m)
Source: Company data, Vara Consensus Source: Company data, Vara Consensus
Figure 121: Cargotec EPS revisions
Figure 122: Cargotec equipment vs. OE growth
index
Source: Thomson Reuters Source: Company data, Credit Suisse estimates
Figure 123: Cargotec EBIT split, 2016 Figure 124: Revenue index by origin
Source: Company data Source: Company data
2,400
2,600
2,800
3,000
3,200
3,400
3,600
3,800
2009A 2010A 2011A 2012A 2013A 2014A 2015A 2016A 2017E
Bottom end of guidance Top end of guidance
Mid-point of Sales guidance Actual/ C'sus forecast
80
100
120
140
160
180
200
220
240
260
280
2009A 2010A 2011A 2012A 2013A 2014A 2015A 2016A 2017E
Bottom end of guidance Top end of guidance
Mid-point of EBIT guidance Actual/ C'sus forecast
1.0
1.5
2.0
2.5
3.0
3.5
4.0
2014 2015 2016 2017 2018
90
100
110
120
130
Cargotec equipment Cargotec service
The company consists of three divisions which all sell products as well as services:
Kalmar: the principal businesses are the supply of port handling equipment to intermodal container
terminals, and container management software to terminal operators and ship operators.
Hiab: produces truck-mounted cranes and forklifts, demountables, tail lifts and recycling / forestry cranes
under a wide variety of brand-names.
MacGregor: selling mechanical products to the offshore and merchant shipping sectors, Macgregor offers
deck handling equipment, winches offshore-specific machinery.
Divisions
Source: Company data as of FY 2016
Sales by Geography, 2016
Slide 3
Employees by Division, 2016
Kalmar52%
Hiab27%
MacGregor21%
Kalmar46%
Hiab48%
MacGregor6%
EBIT by Division, 2016
48%
30%22%
Service12%
Products36%
Service7%
Products23%
Service6%
Product16%
Kalmar Hiab MacGregor
60
80
100
120
140
160
180
200
2007 2008 2009 2010 2011 2012 2013 2014 2015 2016
Europe Americas APAC

9 October 2017
European Cranes 76
Investment Summary
1. Positive outlook in Kalmar (Port Equipment) and Marine (MacGregor) is offset by
optimistic consensus growth estimates. In MacGregor, we expect -7.5% order growth for
2017E, while consensus anticipates -3.5% revenue growth in 2018E which is not feasible
due to the 15 month average delay between orders and revenue recognition. In Kalmar,
consensus expects flat order growth for 2017E while 2017 H1 has seen orders down 6%,
giving an implied order growth rate in 2017 H2 of 9%, which we see as optimistic.
2. We see material cyclicality risk mid-term, from the low proportion of aftermarket sales of
25%, and the high degree of correlation of aftermarket sales growth to OE in downturns.
3. Valuation: our DCF valuation is in line with where Cargotec currently trades, while we
see the 19% discount to the mechanical peer group as justified given the cyclicality risk of
holding the stock.
4. Relatively speaking, we prefer Konecranes as a play on Port Operator capex growth,
terminal automation and industry consolidation, due to the potential for margin
improvement.
Figure 125: Cargotec Profit bridge – 2016 - 2017E operating profit growth mainly
from cost savings
Source: Company data, Credit Suisse estimates
250
27592
4
13
0
23
4 8
0
39
0 2
220
230
240
250
260
270
280
290

9 October 2017
European Cranes 77
CS vs. Consensus - Where are we different?
Kalmar: We are behind consensus for 2017E, as order trends YTD have been weak, and
Cargotec has stated that it does not see big orders in Q3, while Konecranes has confirmed
the same outlook for Q4 too. Between 2018 and 2019, we see better acceleration in
growth in Kalmar, driven by our Port Operator CapEx model.
Hiab: We are broadly in line with consensus, though we do not anticipate the use of
dealers in emerging countries to erode the margin as highly as consensus.
Macgregor: We are broadly in line with consensus on MacGregor order trends although
significantly behind in terms of 2018 and 2019 revenue. We note the average delay
between order and revenue recognition of 15 months, and find the 32% organic decline in
orders in 2016 and our estimate of a c-8% decline in orders in 2017E incompatible with
consensus estimates of a –3.5% revenue decline in 2018.
Figure 126: Cargotec – Credit Suisse forecasts vs. Consensus
Source: Credit Suisse estimates, Vara consensus. Conditional formatting shows difference to consensus +/- 3%
Vara Research 2017 2018 2019E
2017E 2017E CS vs 2018E 2018E CS vs 2019E 2019E CS vs
CS F'cast Cons'us Cons'us CS F'cast Cons'us Cons'us CS F'cast Cons'us Cons'us
Orders
Kalmar 1,638 1,727 -5.1% 1,970 1,840 7.0% 2,324 1,925 20.7%
Change yoy% -4.8% 0.3% 20.2% 6.5% 18.0% 4.6%
Hiab 1,089 1,098 -0.8% 1,126 1,134 -0.7% 1,183 1,165 1.6%
Change yoy% 7.2% 8.1% 3.4% 3.3% 5.0% 2.7%
MacGregor 504 507 -0.5% 554 577 -4.0% 676 660 2.4%
Change yoy% -7.8% -7.3% 9.9% 13.9% 22.0% 14.3%
Group Orders 3,232 3,332 -3.0% 3,650 3,552 2.8% 4,183 3,750 11.6%
Change yoy% -1.6% 1.5% 12.9% 6.6% 14.6% 5.6%
Sales
Kalmar 1,673 1,688 -0.9% 1,710 1,792 -4.6% 1,915 1,906 0.5%
Change yoy% -1.6% -0.7% 2.2% 6.2% 12.0% 6.4%
Hiab 1,084 1,096 -1.1% 1,125 1,141 -1.4% 1,170 1,175 -0.4%
Change yoy% 4.6% 5.8% 3.8% 4.1% 4.0% 3.0%
MacGregor 582 623 -6.5% 468 601 -22.1% 459 661 -30.6%
Change yoy% -25.3% -20.0% -19.5% -3.5% -2.0% 10.0%
Group Sales 3,338 3,405 -2.0% 3,304 3,534 -6.5% 3,544 3,742 -5.3%
Change yoy% -5.0% -3.1% -1.0% 3.8% 7.3% 5.9%
Underlying EBIT
Kalmar 135 143 -5.2% 154 163 -5.5% 174 182 -4.3%
Margin% 8.1% 8.5% 9.0% 9.1% 9.1% 9.5%
Hiab 166 161 3.3% 172 168 2.3% 176 173 1.4%
Margin% 15.3% 14.7% 15.3% 14.7% 15.0% 14.7%
MacGregor 15 16 -6.8% 18 20 -11.3% 23 31 -26.0%
Margin% 2.5% 2.5% 3.8% 3.3% 5.0% 4.7%
Corporate underlying -41 -40 1.7% -37 -39 -5.6% -37 -40 -8.2%
Underlying EBIT 275 279 -1.4% 307 312 -1.7% 336 346 -2.9%
Margin% 8.2% 8.2% 9.3% 8.8% 9.5% 9.2%
EBITDA 358 394 426
EBITDA margin, % 10.7% 11.9% 12.0%
Net interest -27 -21 -16
Underlying PBT 248 286 320
Tax rate, % 7.4% 8.7% 9.0%
CS operating EPS 2.93 2.97 -1.4% 3.31 3.37 -1.8% 3.70 3.78 -2.1%
Change yoy, % 6.3% 7.8% 13.0% 13.5% 11.8% 12.2%
CARGOTEC €m
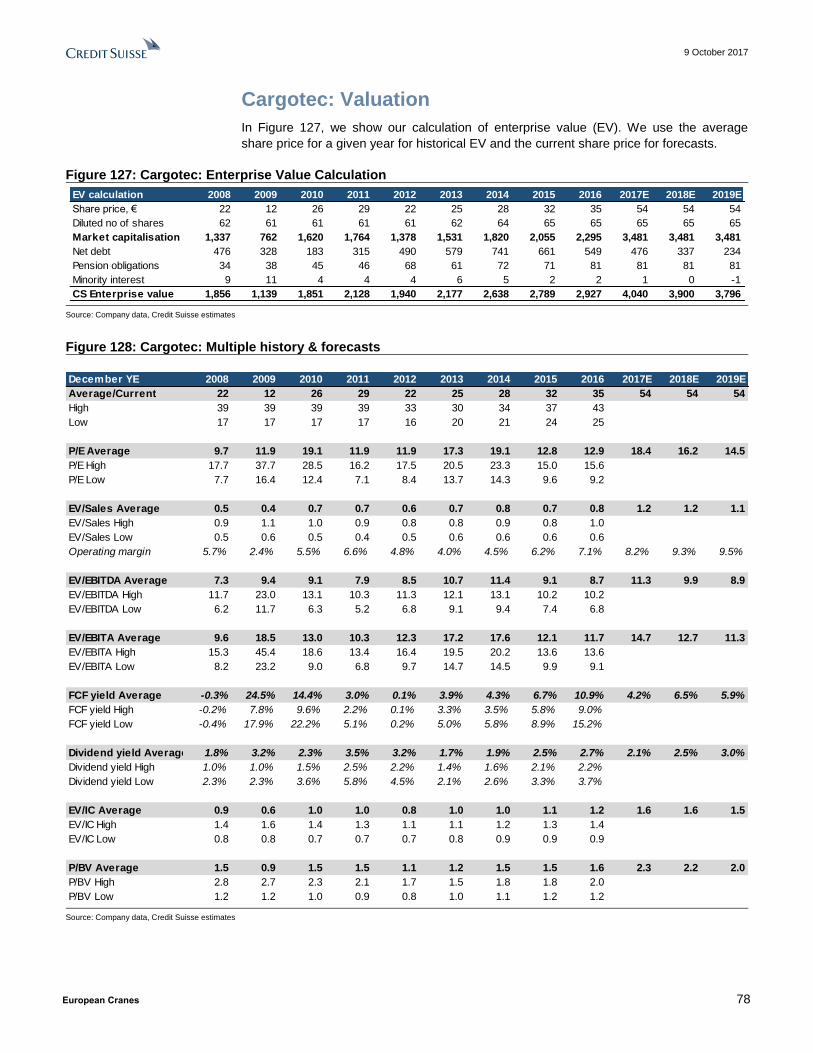
9 October 2017
European Cranes 78
Cargotec: Valuation
In Figure 127, we show our calculation of enterprise value (EV). We use the average
share price for a given year for historical EV and the current share price for forecasts.
Figure 127: Cargotec: Enterprise Value Calculation
Source: Company data, Credit Suisse estimates
Figure 128: Cargotec: Multiple history & forecasts
Source: Company data, Credit Suisse estimates
EV calculation 2008 2009 2010 2011 2012 2013 2014 2015 2016 2017E 2018E 2019E
Share price, € 22 12 26 29 22 25 28 32 35 54 54 54
Diluted no of shares 62 61 61 61 61 62 64 65 65 65 65 65
Market capitalisation 1,337 762 1,620 1,764 1,378 1,531 1,820 2,055 2,295 3,481 3,481 3,481
Net debt 476 328 183 315 490 579 741 661 549 476 337 234
Pension obligations 34 38 45 46 68 61 72 71 81 81 81 81
Minority interest 9 11 4 4 4 6 5 2 2 1 0 -1
CS Enterprise value 1,856 1,139 1,851 2,128 1,940 2,177 2,638 2,789 2,927 4,040 3,900 3,796
December YE 2008 2009 2010 2011 2012 2013 2014 2015 2016 2017E 2018E 2019E
Average/Current 22 12 26 29 22 25 28 32 35 54 54 54
High 39 39 39 39 33 30 34 37 43
Low 17 17 17 17 16 20 21 24 25
P/E Average 9.7 11.9 19.1 11.9 11.9 17.3 19.1 12.8 12.9 18.4 16.2 14.5
P/E High 17.7 37.7 28.5 16.2 17.5 20.5 23.3 15.0 15.6
P/E Low 7.7 16.4 12.4 7.1 8.4 13.7 14.3 9.6 9.2
EV/Sales Average 0.5 0.4 0.7 0.7 0.6 0.7 0.8 0.7 0.8 1.2 1.2 1.1
EV/Sales High 0.9 1.1 1.0 0.9 0.8 0.8 0.9 0.8 1.0
EV/Sales Low 0.5 0.6 0.5 0.4 0.5 0.6 0.6 0.6 0.6
Operating margin 5.7% 2.4% 5.5% 6.6% 4.8% 4.0% 4.5% 6.2% 7.1% 8.2% 9.3% 9.5%
EV/EBITDA Average 7.3 9.4 9.1 7.9 8.5 10.7 11.4 9.1 8.7 11.3 9.9 8.9
EV/EBITDA High 11.7 23.0 13.1 10.3 11.3 12.1 13.1 10.2 10.2
EV/EBITDA Low 6.2 11.7 6.3 5.2 6.8 9.1 9.4 7.4 6.8
EV/EBITA Average 9.6 18.5 13.0 10.3 12.3 17.2 17.6 12.1 11.7 14.7 12.7 11.3
EV/EBITA High 15.3 45.4 18.6 13.4 16.4 19.5 20.2 13.6 13.6
EV/EBITA Low 8.2 23.2 9.0 6.8 9.7 14.7 14.5 9.9 9.1
FCF yield Average -0.3% 24.5% 14.4% 3.0% 0.1% 3.9% 4.3% 6.7% 10.9% 4.2% 6.5% 5.9%
FCF yield High -0.2% 7.8% 9.6% 2.2% 0.1% 3.3% 3.5% 5.8% 9.0%
FCF yield Low -0.4% 17.9% 22.2% 5.1% 0.2% 5.0% 5.8% 8.9% 15.2%
Dividend yield Average 1.8% 3.2% 2.3% 3.5% 3.2% 1.7% 1.9% 2.5% 2.7% 2.1% 2.5% 3.0%
Dividend yield High 1.0% 1.0% 1.5% 2.5% 2.2% 1.4% 1.6% 2.1% 2.2%
Dividend yield Low 2.3% 2.3% 3.6% 5.8% 4.5% 2.1% 2.6% 3.3% 3.7%
EV/IC Average 0.9 0.6 1.0 1.0 0.8 1.0 1.0 1.1 1.2 1.6 1.6 1.5
EV/IC High 1.4 1.6 1.4 1.3 1.1 1.1 1.2 1.3 1.4
EV/IC Low 0.8 0.8 0.7 0.7 0.7 0.8 0.9 0.9 0.9
P/BV Average 1.5 0.9 1.5 1.5 1.1 1.2 1.5 1.5 1.6 2.3 2.2 2.0
P/BV High 2.8 2.7 2.3 2.1 1.7 1.5 1.8 1.8 2.0
P/BV Low 1.2 1.2 1.0 0.9 0.8 1.0 1.1 1.2 1.2

9 October 2017
European Cranes 79
DCF
We use a Discounted Cash Flow (DCF) valuation as our primary tool for determining
Cargotec’s fair value. We use a three-stage DCF with the following method:
■ Stage 1—Years 1 to 3. We use our explicit model forecasts for free cash flow for the
first three years.
■ Stage 2—Years 4 to 10. We use broader assumptions for the next seven years.
■ Stage 3—Terminal value. We base our terminal value on year-ten cash flow, a terminal
growth rate of 2% and an invested capital growth rate of 2%.
Figure 129: Cargotec: Key DCF assumptions (€m)
Source: Credit Suisse estimates
Our base-case DCF valuation for Cargotec is €52 per share. We find this valuation is
sensitive to: (1) WACC; (2) long-term (year-4 onwards) operating profit margin; and (3)
mid-term (years 4-10) growth rate assumptions. We therefore believe a useful application
of this model is to show the DCF value sensitivity to these parameters.
Below we show our DCF valuation sensitivity to the operating profit (EBIT) and mid-term
growth rate assumptions.
Figure 130: Cargotec: DCF sensitivity EBIT margin and mid-term growth rate assumptions €, unless otherwise stated
Source: Credit Suisse estimates
In Figure 131 we show our DCF valuation sensitivity to WACC and mid-term growth rate
assumptions.
Key DCF assumptions
Mid-Cycle Grow th (years 4 to 10) 3.5%
Mid-cycle EBIT margin (years 4+) 9.0%
Mid-cycle NOPAT margin 6.6%
Mid-cycle NOPAT to FCF conversion ratio 85%
Invested capital 2,471
Invested capital grow th (years 4+) 2.0%
Terminal grow th rate 2.0%
10-year average FCF yield 5.6%
WACC 8.0%
Mid-cycle growth rate
1.0% 1.5% 2.0% 2.5% 3.0% 3.5% 4.0% 4.5% 5.0% 5.5% 6.0%
7.0% 5.1% 36 37 38 39 40 41 42 44 45 46 47
7.5% 5.5% 39 40 41 42 43 44 45 47 48 49 50
8.0% 5.9% 41 42 43 44 46 47 48 49 51 52 54
8.5% 6.2% 43 44 46 47 48 50 51 52 54 55 57
9.0% 6.6% 46 47 48 50 51 52 54 55 57 58 60
9.5% 7.0% 48 49 51 52 53 55 56 58 60 61 63
10.0% 7.4% 50 52 53 55 56 58 59 61 63 64 66
10.5% 7.7% 53 54 56 57 59 60 62 64 66 67 69
11.0% 8.1% 55 57 58 60 61 63 65 67 69 70 72
EBITA
margin
NOPAT
margin

9 October 2017
European Cranes 80
Figure 131: Cargotec: DCF sensitivity to WACC and mid-term growth rate €, unless otherwise stated
Source: Credit Suisse estimates
Cargotec: Profit Pools
■ In line with the rest of our coverage, the highest margin profit pools within Cargotec are
the service businesses of Kalmar and Hiab, although the Kalmar service business is
larger than that of Hiab given its long standing focus from the management team.
■ The largest profit pool within the equipment business is Hiab products, which have
benefited from strong consistent growth, as well as pricing power over the fragmented
customer base. Kalmar products are an important profit pool but not as large as the
Kalmar service business.
■ The MacGregor profit pools are small but, when looking at aggregated service and
equipment pools, still accretive due to pro-active cost cutting and a capital light model.
The merchant business has decreased less than the offshore businesses, both in
terms of organic declines and margin.
■ There is clear profit growth potential in the Kalmar Software and Kalmar Automation
and Projects (KAP) profit pools, which are currently break-even and loss-making
respectively due to ongoing investments. The loss-making situation in KAP is
magnified by the highly suppressed demand environment in large automation projects.
We anticipate that the Kalmar Software profit pool will gradually grow in significance as
the high R&D spend is reduced, and management has stated that a 'software type'
margin of 20-25% is feasible mid-term. We anticipate that the KAP profit pool will grow
in 2018 as the demand environment improves and the 'copy with pride' principle is
implemented in new automation projects.
Growth rate
WACC 1.0% 1.5% 2.0% 2.5% 3.0% 3.5% 4.0% 4.5% 5.0% 5.5% 6.0%
6.0% 69 71 73 75 78 80 82 85 87 90 92
6.5% 61 63 65 67 69 71 73 75 77 79 82
7.0% 55 57 58 60 62 63 65 67 69 71 73
7.5% 50 51 53 54 56 57 59 61 62 64 66
8.0% 46 47 48 50 51 52 54 55 57 58 60
8.5% 42 43 44 46 47 48 49 51 52 53 55
9.0% 39 40 41 42 43 44 46 47 48 49 51
9.5% 36 37 38 39 40 41 42 43 44 46 47
10.0% 34 35 36 37 37 38 39 40 41 42 44

9 October 2017
European Cranes 81
Figure 132: Cargotec 2017E Profit Pools
Source:, Credit Suisse estimates
Cargotec: Kalmar
Figure 133: Financials (€m)
Source: Company data, Credit Suisse estimates
Kalmar is Cargotec's largest division, contributing 50% of Cargotec's revenue in 2017E,
and 48% of its underlying operating profit with an 8% margin. This margin compares
favorably with the peer group (Konecranes Port Solutions: 4.8% margin in 2016).
-6%
-3%
0%
3%
6%
9%
12%
15%
18%
21%
Und
erlyin
g O
pe
ratin
g M
arg
in
Business Unit Revenue as % of Cargotec Group
Kalmar Service (13%) Hiab: Service (7%)Hiab: Products (25%) Kalmar Equipment (23%)MacGregor: Merchant (13%) MacGregor: Offshore: Aker / Pusnes (2%)MacGregor: Offshore: Hatlapa (2%) Kalmar Software (5%)MacGregor: Offshore: Legacy (0.5%) Kalmar: Automation + Projects (8.4%)
0%
1%
2%
3%
4%
5%
6%
7%
8%
9%
10%
0
500
1,000
1,500
2,000
2,500
Orders Revenue Margin

9 October 2017
European Cranes 82
Profitability is a key focus; one of the main levers for this is developing its automation
offering, to take advantage of growth once the Port Operator CapEx cycle resumes. This is
reflected in the choice of management with the divisional President Antti Kaunonen’s
industrial automation background.
Kalmar's focus has always been in the mechanical elements of operations, but the
company is looking to push automation into the port. Kalmar prefers to integrate the
‘intelligence’ into its machines, rather than sell a bolt-on ‘black box’ with the intelligence.
This is in contrast to Konecranes, which has been using Terex as an automation partner,
and which it is now integrating following the MHPS acquisition.
As in the rest of the mechanicals space, automation represents an opportunity to win
higher share of the customers' wallet by demonstrating quality, selling additional services
and cutting costs.
Kalmar's Equipment business with associated services represented 72% of the division's
revenue with a 12% operating margin in 2017E. Organic growth is driven by the
replacement of machinery and intermodal infrastructure projects, while we see cost-cutting
measures as mostly offsetting price pressure.
The Automation and Projects business represents the sales of automation equipment, as
well as the associated system integration services. This represents 17% of the division's
revenue, with a -6% margin, according to our estimates for 2017E. This margin is low due
to much lower than anticipated volumes and high R&D and implementation cost. Mid-term,
we see margin recovering to around that of the equipment business once volumes return,
while long term we see no structural reason for the margin not to exceed that of the
equipment business, due to additional service opportunity and higher technology content.
Kalmar's growing software business consists of Navis Terminal Operating System (TOS)
software, as well as Interschalt ship loading software. This business constitutes 11% of
Kalmar's revenue for 2017E while breaking even due to high R&D spend. We see
software as a strong growth area for Cargotec, as the shipping industry plays catch-up
with digital strategy, and efficiency benefits of digital Terminal and Vessel Management
become clear. Navis is expected to grow 19% CAGR 2011-2017E, and we see this growth
increasing slightly as it gains market share and incorporates new functionality from R&D
and acquisitions. In 2017, we see strong growth in the software business as partially
masking the small declines in the Equipment and Automation and Projects businesses.
We estimate that Cargotec will derive 25.9% of revenues from service in 2017E.
Cargotec's service business is less cyclical than the equipment business, and through
2016 and 2017 has seen only slight declines (-1%) compared to -7% in equipment.
Equipment and Automation business overview
■ Market share: According to our market sizing exercise in Figure 32, equipment market
share is 22% globally, and 32% globally ex-China in 2016. We see growth potential
mainly from market growth as terminals sourcing strategy is to have 2-3 suppliers in
horizontal transport.
■ Unexpected consequences: threat of automation drove a union response; manual
port throughput speed (measured in lifts per hour, target = 32) has accelerated ahead
of automated offerings.
■ Profitability: In automation projects, profits have been low due to volume effect and
high investments in R&D which is capitalized. In addition, the large automation orders
can be a lower margin than the overall Kalmar margins due to the volumes involved.
■ Navis cost / pricing: Navis generated revenues of €134m in 2016, and Cargotec has
disclosed that >30% of the world's container throughput is handled by containers
running Navis. As such, we assume that the current global market size for TOS
systems is c.€400m per year (assumes 33.5% market share), or €2.2m per mTEU.

9 October 2017
European Cranes 83
Figure 134: Information from announced orders implies ASPs of €0.4-1m for container handling equipment,
c €1.8m for ERTGs, €1-2.9m for crane upgrades, €77,000 for terminal tractors and €56,000 for light forklifts
Source: Company data, Credit Suisse research. In addition to the announced order information, we note that Cargotec disclose that sales at Rainbow-Cargotec in 2016 were €140m, with 'almost 100' RTGs sold through the JV. Assuming 98 units sold, the ASP implied is €1.4m.
Software business overview
Kalmar's software offering currently consists of Navis (a TOS), Kalmar Terminal Logistics
System (TLS), Interschalt, a vessel planning tool and XVELA, a collaborative platform in
development to improve communication through the intermodal value chain.
■ TOS: TOS is the ERP for Container Terminals, managing container movements,
governing automation systems and communicating with vessels and intermodal
dispatch. TOS is integrated with ERP for billing, and TLS to control hardware.
■ TLS: TLS is the software that control PLCs, motors and drives within equipment. TLS
is included in automation products, but is not part of Navis. ABB, Siemens and ZPMC
only provide TLS and not TOS.
■ Benefits of advanced TOS Software:
− optimise container yard moves
− optimise terminal vehicle routing and efficiency
− optimise rail land truck load and discharge patterns
− analytics for decision making
■ Automation: Each Navis release sees a 15-20% speed improvement in lifts per hour.
■ Open architecture: Navis is built on an open platform, which is key for interoperability
with all brands of equipment and legacy infrastructure. This means that the Navis
offering is not directly linked to Kalmar branded machinery, which is essential for
operating brownfield sites. Kalmar works closely with ZPMC on automation projects
and Konecranes is a distributer of Navis software.
Order
AnnouncedValue
Number
Of Units
Average Value
Per Unit (EUR)Product Type Location Customer Other Details
June, 2017 EUR 13m 16 813,000 Hybrid Shuttle
Carriers
USA Port of Virginia Contains an option for additional 40 units
May, 2013 EUR 10m 25 400,000 Reachstackers Algeria GICEP Reachstacker
May, 2015 EUR 18m 18 1,000,000 Rough terrain
container handlers
USA US Department of
Defense
Kalmar RT240s
December, 2016 EUR 10m 7 1,429,000 RTG Cranes Algeria GICEP E-One² RTGs, including Kalmar SmartProfile, Kalmar
SmartRail and Kalmar SmartFleet.
September, 2014 USD 14m 7 2,000,000 RTG Cranes Chile Puerto Central S.A E-One2 RTGs, including spares, training, civil works, and
other auxiliaries to automate certain RTG processes.
August, 2014 EUR 8m 4 2,000,000 RTG Cranes Brazil Super Terminais E-One2 Zero Emission RTGs, including a standard diesel
generator set for dual-mode operation.
December, 2013 EUR 17m 12 1,417,000 RTG Cranes Kenya Kenya Ports
Authority (KPA)E-One2 hybrid RTGs
December, 2013 EUR 17m 8 2,125,000 RTG Cranes Norway Port of Oslo Zero emission rubber-tyred gantry (RTG) cranes, featuring
SmartPort automation technology
August, 2015 EUR 25m 20 1,250,000 RTG Cranes,
Forklift trucks
Colombia SPRBun 14 Kalmar E-One2 rubber-tyred gantry cranes (RTGs) and six
Kalmar forklift trucks.
May, 2016 EUR20m 7 2,857,000 STS crane upgrades Malaysia PTP Increasing crane capacity by 22%, modernising electrical
systems, and other safety & capability enhancements.
July, 2013 EUR 2m 2 1,000,000 STS crane upgrades Hong Kong SITA Waste
Services Ltd
Retrofit and upgrade two Hong Kong-based NDC ship-to-
shore (STS) crane units
February, 2017 EUR 70m 708 99,000 Terminal Tractors North
America
Kalmar Ottawa T2 terminal tractor
December, 2016 EUR 5m 93 54,000 Terminal Tractors Malaysia Port of Tanjung
Pelepas
Kalmar 4x2 medium terminal tractors. Manufactured in
Shanghai, have a gross combination weight of 70 tonnes
February, 2015 EUR 40m 512 78,000 Terminal tractors North
America
Ottawa T2 terminal tractors
October, 2012 EUR20m 355 56,000 Rough terrain forklift US U.S. Department
of Defense
Light capability rough terrain forklift trucks (LCRTF)

9 October 2017
European Cranes 84
■ Internal software development is a priority: Kalmar has an impressive emulation
and testing suite which uses game engines to model how cranes behave in different
situations, and optimizes the ratios of equipment in new ports. Kalmar's facilities in
Tampere have test rigs, including an automated full size terminal model to refine the
offering and behavior of the automated components.
■ Market share: Navis is the leader in TOS software, owning 25% of the market, but
39% of the mid and large size terminal (defined as over 250,000 TEU P/A). Typically
software represents around 10% of the cost of a large automation equipment order.
■ Margins: Cargotec has stated on more than one occasion that a 25% margin is the
five-year target, though it is currently break-even due to high levels of investment.
■ Future shift to Software as a Service (SaaS): Navis has started the process of
shifting its customers onto recurring revenue models, which offer more opportunities to
sell add-on services, and participate in the efficiency benefits of automation. We see a
muted risk of slower revenue growth as customers are moved onto a SaaS model;
however, assuming it is done at a controlled rate and in a high growth environment, the
effect on near-term revenues should not be acute.
■ Growth prospects: Navis has been taking share - at the recent Software analyst day,
management stated that of the last 10 automated terminals, Navis had won 8 of the
TOS contracts. We forecast growth to accelerate from the following areas;
− Conventional or automated TOS (conversions from manual / in-house systems)
− Add on modules to bring in extra functionality and carrier functionality
− Professional services, consulting and support (this is a new offering, and the value
can be 2x the cost of the license fee)
■ Interschalt software: Interschalt is Kalmar's stowage planning tool, and is the market
leader with 12 out of 20 shipping lines using the system. Individual products include;
− Blue Tracker fleet management (still a small business, Wartsila competitor)
− MACS3: vessel stowage software, allowing storage of more boxes. This provides
benefits to trim, improving safety, fuel efficiency and operational compliance as well
as matching the ship computer calculations to the load, allowing faster departures.
■ XVELA: launched in 2014, this software is a Navis-built collaboration tool to improve
communication between terminals and liners in order to pro-actively manage vessel
loading to minimize the number of moves needed.
− Pure SaaS business model, with cloud-based services as being 'winner takes all'
and focuses on building functionality.
− The product was taken to market in March 2017 with current interest from 4 of the
top 10 carriers, with a commitment from two to build on their main routes.
− Some monetisation from SaaS is expected in 2017; however material revenue
streams will not be until 2018.
■ Peers and competitors: Navis has no direct peers of comparable size; wider
competitors include Descartes Systems Group and GT Nexus which are both direct
peers in logistics/SCM software, but with limited container shipping exposure. These
companies may feature in Cargotec's acquisition strategy as specific software assets'
targets. Cargotec has not indicated any desire to dispose of Navis, but in our view
Navis could be an appealing target for mid-sized logistics or SCM software businesses.

9 October 2017
European Cranes 85
■ Acquisition strategy: Kalmar does not look to expand the mechanicals line, believing
it has a wide and competitive portfolio, while services and software are key targets.
Acquisitions here are challenging as people retention is key, and acquisitions in the
software space tend to be expensive. Cargotec has stated that acquisitions must
obtain market share or new functionality. We see a bias of growth coming from
acquisitions rather than organic growth, and flag niche software players and in-house
(i.e. developed by terminals) TOS systems as acquisition targets. Building this
business by acquisition is one of Cargotec's stated strategic aims, and we view a
strong software offering as synergistic with Automation and Project sales. Interschalt is
currently serving the container stowage market; however, bulk business is a big market
and could be addressed via acquisitions.
Figure 135: Global TOS Market Share
Source: Cargotec Software Analyst day 2017
Kalmar order book trends
■ The duration between an order being booked and sales being recognised is between
6-12 months, according to company management. We find an average 9-month lag as
relatively consistent across recent history, despite fluctuations in order book growth
from large orders received. We forecast Kalmar's near-term revenues accelerating
ahead of lagged orders due to an absence of big projects, which tend to sit in the order
book for longer.
■ When large automation orders are seen in 2018, we expect they will take longer than
the average three quarters to hit revenues due to complexities in delivery.
25%
4%
5%
3%5%
3%3%16%
36%
Cargotec Navis
TSB
Tideworks
Huadong
Jade
China Merchants
PSA
Others
Small Terminals

9 October 2017
European Cranes 86
Figure 136: Kalmar organic order growth (leading 3 quarters) vs. organic revenue growth
Source: Company data, Credit Suisse estimates (indicated by dashed line)
Kalmar geographic trends
■ Since the 2008 financial crisis, which affected all regions, Kalmar's growth has come
mainly from the Americas and APAC regions, while Europe has been stagnant.
■ We see this trend continuing but we expect Europe to catch up over the next few years
driven by growth from port automation projects and an end to the Capex hiatus given
shipping alliances appear more stable.
Figure 137: Kalmar geographic revenue growth index, from 2007
Source: Company data, Credit Suisse estimates Note: between 2010 and 2011, Kalmar and Hiab were combined in a single division, index in this era is smoothed based on Credit Suisse estimates
Kalmar revenue growth
■ The basis of Kalmar's revenue growth is the growth in global container trade; port
utilisation of equipment drives the replacement cycle and addition of port capacity
drives new equipment sales.
■ This is reflected in the average annual growth in world container exports which was
4.1% between 2012 and 2017E while Kalmar's average CSe organic growth rate over
the same period has been 5.1%.
-15%
-10%
-5%
0%
5%
10%
15%
-40%
-30%
-20%
-10%
0%
10%
20%
30%
40%
Q4 2013
Q1 2014
Q2 2014
Q3 2014
Q4 2014
Q1 2015
Q2 2015
Q3 2015
Q4 2015
Q1 2016
Q2 2016
Q3 2016
Q4 2016
Q1 2017
Q2 2017
Q3 2017E
Q4 2017E
Q1 2018E
KALMAR Organic order growth % yoy (9m leading) KALMAR Organic sales growth % yoy (RHS)
60
80
100
120
140
160
180
2007 2008 2009 2010 2011 2012 2013 2014 2015 2016
Europe Americas APAC

9 October 2017
European Cranes 87
■ We expect Cargotec to continue to outgrow the market as structural factors such as
increased drives for efficiency, consolidation of shipping lines and the continued
upscaling of container vessels provide new challenges for the industry that are
addressed by Kalmar's products.
■ We note, however, that there is no direct correlation between Kalmar's quarterly growth
and growth in underlying throughput for two reasons; 1) the order backlog is around 9
months, providing a lag between orders and revenue and, 2) spend on capital
equipment is driven by Port Operator's CapEx cycle, which is in turn driven by the
needs of the shipping alliances.
■ As such, we set our long-term growth expectations for Kalmar around 4.5%, in line with
our forecasts for world container throughput growth; however, we forecast a near-term
catch up in growth, following a pause in Port Operator CapEx spending growth. We
forecast 3% and 15% growth for Kalmar in 2018E and 2019E respectively.
Figure 138: Kalmar service vs. equipment sales growth index, from 2011
Source: Company data, Credit Suisse research
Cargotec: Hiab
Figure 139: Financials (€m)
Source: Company data, Credit Suisse estimates
80
100
120
140
160
180
2011 2012 2013 2014 2015 2016 2017E 2018E 2019E
Equipment Services
0%
2%
4%
6%
8%
10%
12%
14%
16%
18%
0
200
400
600
800
1,000
1,200
1,400
Orders Revenue Margin

9 October 2017
European Cranes 88
Hiab is Cargotec's truck-mounted crane business, providing both equipment (77% of
revenue in 2017E) and service (23%). We estimate that the operating margin in the
product business is 14%, while the service business' operating margin in 20%.
In both cases, high margins are the result of strong product development (54 new products
launched in 2016, c. 45 in 2015 and 70% of products being less than 3 years old) as well
as surprisingly high technology content (for instance, the remote control interfaces). We
see this trend continuing, and the company has stated that there will be 'even more' new
products launched in 2017 than 2016.
Customers are generally small, which supports pricing power. There is some seasonality
with rental companies placing orders in Q4, following a trade fair in Q3 which drives sales
in Q1.
While all Hiab products are designed to be attached to trucks, the replacement cycle of
cranes on older trucks and retrofits mean Hiab's sales growth is not tightly correlated with
new truck sales. The principal end market for Hiab cranes is the construction industry, and
given the size of cranes, Hiab is closely related to the residential construction industry.
In Europe, 15% of trucks above 15 tons are equipped with load handling equipment,
whereas in the Americas and Asia the figure is around 5%, as load handling equipment is
typically installed in flatbed trucks.
Hiab business overview
■ Mature business in EMEA and Americas: market penetration opportunities are now
limited and we anticipate that equipment sales will follow overall correlation with end
markets.
■ APAC strategy: very low market penetration, though strong in certain niches. Success
from distribution channels and large orders.
■ Expansion to new geographies via distributers: Hiab is also disproportionately
based in developed countries, and sees a significant growth opportunity from
expansion into new markets. The company anticipates that there will be reduction in
margins from such a move as organic sales in new geographies will, at least in the
mid-term, be mediated through distributers. Pricing is anticipated to be stable in
different geographies; however, the distributers take a commission which erodes the
margin.
■ Acquisition targets: Hiab is looking at acquiring local distributers as part of its growth
strategy in order to maintain higher margins. We also see opportunities in acquiring
new product lines built by sub-scale manufacturers, giving accretion opportunities by
moving production to the Hiab main assembly sites.

9 October 2017
European Cranes 89
Figure 140: Information from announced orders implies ASPs of €20-71,000 for loader cranes and a mid-point
of €42,000 for truck-mounted forklifts
Source: Company data, Credit Suisse research
Figure 141: Hiab service vs. equipment sales growth
index, from 2011 – a product refresh programme has
driven equipment sales at the expense of services
Figure 142: Hiab vs. Palfinger growth index – despite
Hiab's strong performance, it has underperformed
compared to its key competitor
Source: Company data, Credit Suisse research Source: Company data, Credit Suisse research
Order
AnnouncedValue
Number
Of Units
Average Value
Per Unit (EUR)Product Type Location Customer Other Details
June, 2017 EUR 2m 40 50,000 Loader Cranes Japan FutureBud
International
HIAB XS 088 CLX
July, 2017 EUR 1m 50 20,000 Loader Cranes China Shanghai
Longcheng SVP
HIAB 111B-2CLX
January, 2017 EUR 1m 14 71,000 Loader Cranes France Guisnel Mid-range loader cranes: seven HIAB X-HiPro 232 loader
cranes and five X-HiPro 192 loader cranes as well as two
smaller cranes, HiDuo 138 and HiDuo 188.
November, 2015 EUR 2m 90 22,000 Loader Cranes Australia Coates Hire HIAB T Series
March, 2017 EUR 2.5 76 33,000 Loader Cranes and
Hooklifts
Finland Scania 69 MULTILIFT XR21Z hooklifts and 7 HIAB X188 cranes
March, 2014 EUR 6.4m 201 32,000 Loader Cranes and
Hooklifts
Finland Finnish Defence
Forces
172 MULTILIFT XR2IZ hooklifts, 13 HIAB X188 cranes and 16
MULTILIFT CHU container handling units
January, 2017 EUR 0.5m 15 33,000 Truck Mounted
Forklifts
Germany Behrens-Wöhlk-
Gruppe
MOFFETT E-Series truck mounted forklifts
October, 2015 EUR 3m 60 50,000 Truck Mounted
Forklifts
US M8 and M5 truck-mounted forklifts
80
100
120
140
160
180
2011 2013 2015 2017E 2019E
Hiab Equipment Hiab Services
80
100
120
140
160
180
200
2010 2011 2012 2013 2014 2015 2016Hiab Palfinger

9 October 2017
European Cranes 90
Hiab: correlation to end market performance
Figure 143: Truck sales growth in Europe and US
Figure 144: Truck sales weighted to region
exposure
Source: Credit Suisse PCAR Database Source: Company data, Credit Suisse research
Figure 145: Construction activity, US & Europe Figure 146: Activity weighted to region exposure
Source: Company data, Credit Suisse research Source: Company data, Credit Suisse research
-60%
-40%
-20%
0%
20%
40%
60%
2007 2008 2009 2010 2011 2012 2013 2014 2015 2016 2017
US Medium Duty Truck (Monthly) Retail Sales 3MMA % y/yEurope 3.5-16t sales % yoy
-40%
-20%
0%
20%
40%
2007 2008 2009 2010 2011 2012 2013 2014 2015 2016 2017
Hiab Weighted Global Truck Sales, yoy growth
-40%
-20%
0%
20%
2007 2008 2009 2010 2011 2012 2013 2014 2015 2016 2017US Construction Expenditures - Residential 3MMAEU28 Volume Index Of Production: Buildings, 3MMACSe US Total Non-Resi Construction Expenditure 3MMA
-20%
-15%
-10%
-5%
0%
5%
10%
2007 2008 2009 2010 2011 2012 2013 2014 2015 2016 2017
Global Construction Growth yoy, Hiab weighting
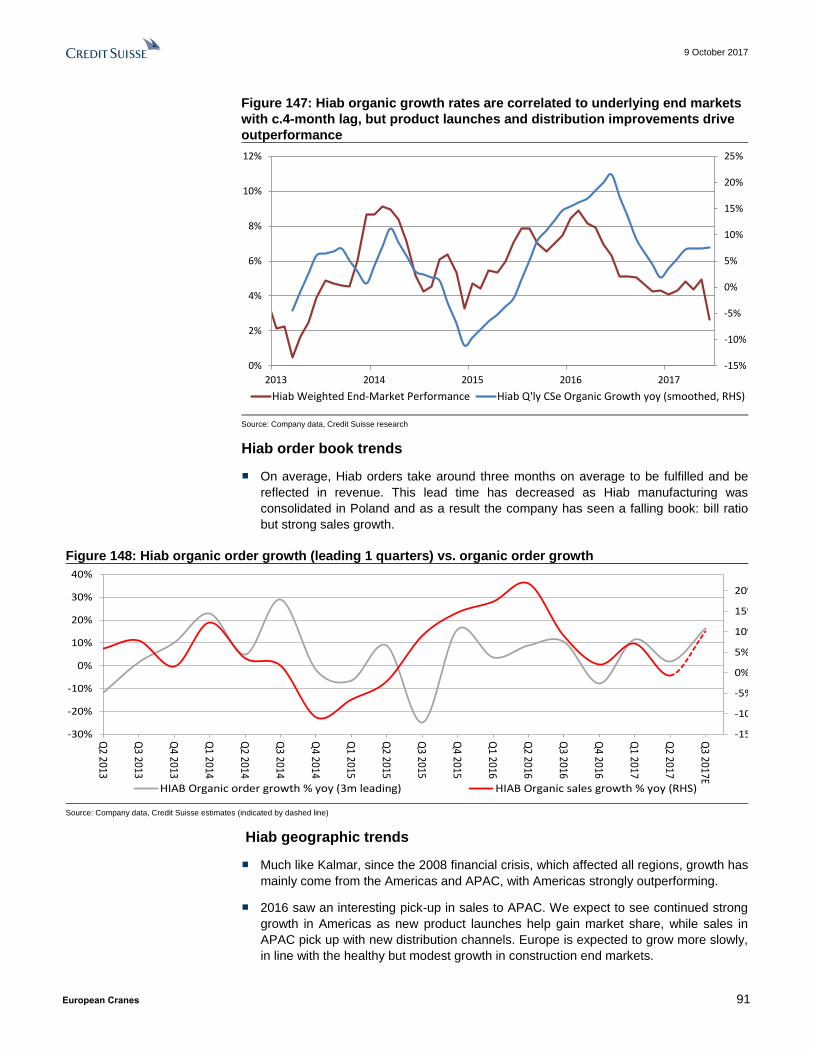
9 October 2017
European Cranes 91
Figure 147: Hiab organic growth rates are correlated to underlying end markets
with c.4-month lag, but product launches and distribution improvements drive
outperformance
Source: Company data, Credit Suisse research
Hiab order book trends
■ On average, Hiab orders take around three months on average to be fulfilled and be
reflected in revenue. This lead time has decreased as Hiab manufacturing was
consolidated in Poland and as a result the company has seen a falling book: bill ratio
but strong sales growth.
Figure 148: Hiab organic order growth (leading 1 quarters) vs. organic order growth
Source: Company data, Credit Suisse estimates (indicated by dashed line)
Hiab geographic trends
■ Much like Kalmar, since the 2008 financial crisis, which affected all regions, growth has
mainly come from the Americas and APAC, with Americas strongly outperforming.
■ 2016 saw an interesting pick-up in sales to APAC. We expect to see continued strong
growth in Americas as new product launches help gain market share, while sales in
APAC pick up with new distribution channels. Europe is expected to grow more slowly,
in line with the healthy but modest growth in construction end markets.
-15%
-10%
-5%
0%
5%
10%
15%
20%
25%
0%
2%
4%
6%
8%
10%
12%
2013 2014 2015 2016 2017
Hiab Weighted End-Market Performance Hiab Q'ly CSe Organic Growth yoy (smoothed, RHS)
-15%
-10%
-5%
0%
5%
10%
15%
20%
-30%
-20%
-10%
0%
10%
20%
30%
40%
Q2 2013
Q3 2013
Q4 2013
Q1 2014
Q2 2014
Q3 2014
Q4 2014
Q1 2015
Q2 2015
Q3 2015
Q4 2015
Q1 2016
Q2 2016
Q3 2016
Q4 2016
Q1 2017
Q2 2017
Q3 2017E
HIAB Organic order growth % yoy (3m leading) HIAB Organic sales growth % yoy (RHS)
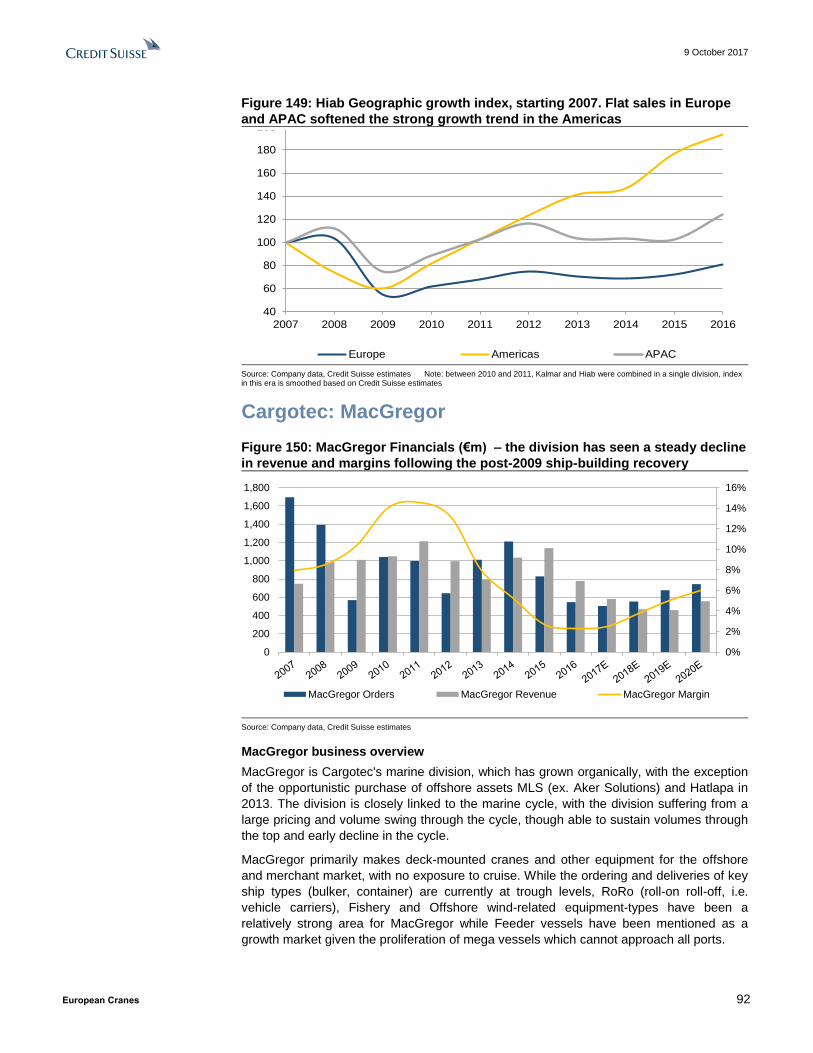
9 October 2017
European Cranes 92
Figure 149: Hiab Geographic growth index, starting 2007. Flat sales in Europe
and APAC softened the strong growth trend in the Americas
Source: Company data, Credit Suisse estimates Note: between 2010 and 2011, Kalmar and Hiab were combined in a single division, index in this era is smoothed based on Credit Suisse estimates
Cargotec: MacGregor
Figure 150: MacGregor Financials (€m) – the division has seen a steady decline
in revenue and margins following the post-2009 ship-building recovery
Source: Company data, Credit Suisse estimates
MacGregor business overview
MacGregor is Cargotec's marine division, which has grown organically, with the exception
of the opportunistic purchase of offshore assets MLS (ex. Aker Solutions) and Hatlapa in
2013. The division is closely linked to the marine cycle, with the division suffering from a
large pricing and volume swing through the cycle, though able to sustain volumes through
the top and early decline in the cycle.
MacGregor primarily makes deck-mounted cranes and other equipment for the offshore
and merchant market, with no exposure to cruise. While the ordering and deliveries of key
ship types (bulker, container) are currently at trough levels, RoRo (roll-on roll-off, i.e.
vehicle carriers), Fishery and Offshore wind-related equipment-types have been a
relatively strong area for MacGregor while Feeder vessels have been mentioned as a
growth market given the proliferation of mega vessels which cannot approach all ports.
40
60
80
100
120
140
160
180
200
2007 2008 2009 2010 2011 2012 2013 2014 2015 2016
Europe Americas APAC
0%
2%
4%
6%
8%
10%
12%
14%
16%
0
200
400
600
800
1,000
1,200
1,400
1,600
1,800
MacGregor Orders MacGregor Revenue MacGregor Margin

9 October 2017
European Cranes 93
The division is asset light, with 90% of manufacturing and 30% of design and engineering
capacity outsourced. MacGregor is also insulated slightly by its service business that now
represents c.30% of sales vs. 14% at the 2011 peak. The service business consists of
spare part sales and maintenance services. In downturns, the spare parts business
performs better than maintenance, which is often brought in-house or simply postponed.
Currently MacGregor is near break-even in terms of volumes, and management states that
the business needs to reach around EUR1bn in annual sales to achieve its margin target
of 10%, as the business did between 2009 and 2012.
Overall, the division has been supported by its wide exposure, where product groups like
RoRo and Fishery have been helpful in weathering the downturn. In terms of strategy, it
appears that purchasing offshore assets opportunistically in 2013 was an error, as while
the dollar value of oil is suppressed and shale gas is cheap, North Sea and deep water
drilling will likely remain at low levels. In response, MacGregor is pivoting towards gas
exposure via FLNG (via the Flintstone acquisition) and FSRU. Equally, the division has
been the first to engage in autonomous bulk unloading, and has created products for
offshore floating wind turbines which repurpose offshore oil technology.
Figure 151: MacGregor equipment vs. service yoy trends: Service sales are less
cyclical than equipment, but participate in upturns as underinvested vessels
are returned to full operational order. We note that service has been more
resilient in the recent shipping downturn than post-2008.
Source: Company data, Credit Suisse research
M&A strategy
The company's stated strategy is to consider further distressed assets; however, given the
experience of buying offshore assets in 2013, and the limited outlook for offshore, we
would expect future acquisitions to be on the merchant or gas side.
Software and intelligent technology has also been flagged, and we view such assets
positively (assuming sensible valuation) given the low current adoption of software in
marine markets, and the possibilities of generating a synergistic offering with Kalmar
software. In terms of size, the company is looking at bolt-on acquisitions. For this reason,
we do not consider TTS Group (a recent acquisition target of Palfinger) to be a likely
acquisition target for MacGregor. In addition, while the products are highly complementary,
anti-trust concerns may emerge over monopolisation of marine cranes and in particular
AHC cranes.
-60%
-40%
-20%
0%
20%
40%
60%
MacGregor Equipment % yoy MacGregor Service % yoy
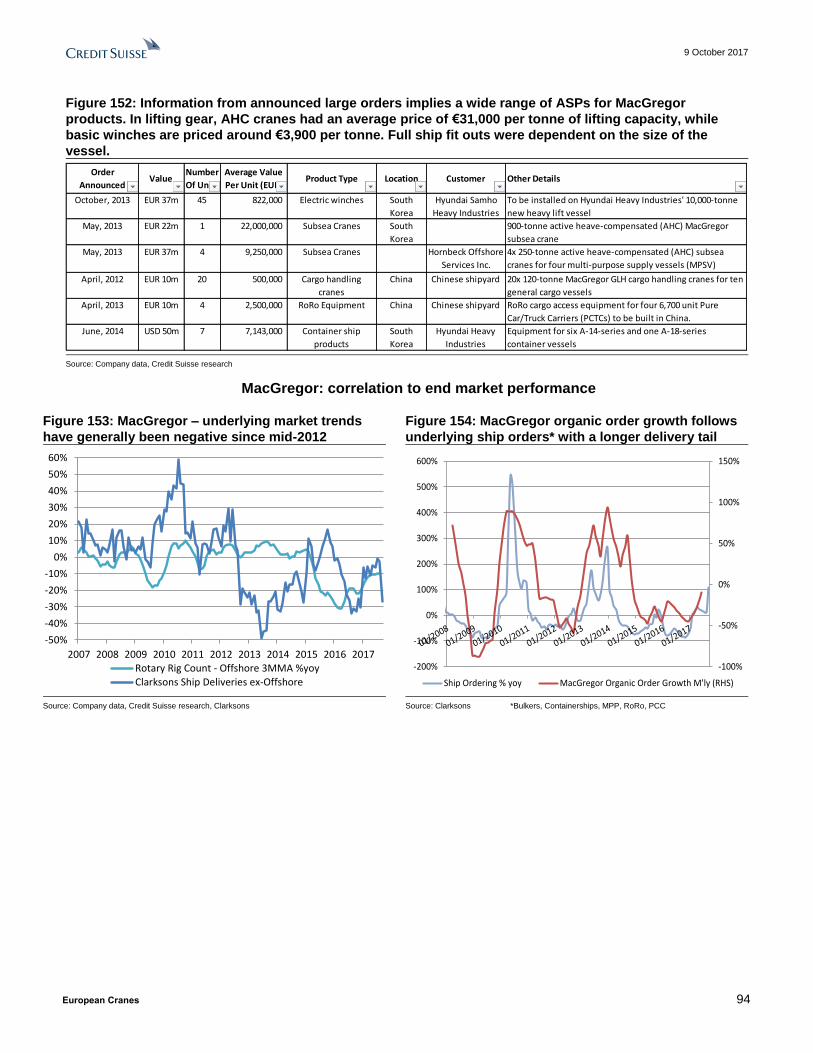
9 October 2017
European Cranes 94
Figure 152: Information from announced large orders implies a wide range of ASPs for MacGregor
products. In lifting gear, AHC cranes had an average price of €31,000 per tonne of lifting capacity, while
basic winches are priced around €3,900 per tonne. Full ship fit outs were dependent on the size of the
vessel.
Source: Company data, Credit Suisse research
MacGregor: correlation to end market performance
Figure 153: MacGregor – underlying market trends
have generally been negative since mid-2012
Figure 154: MacGregor organic order growth follows
underlying ship orders* with a longer delivery tail
Source: Company data, Credit Suisse research, Clarksons Source: Clarksons *Bulkers, Containerships, MPP, RoRo, PCC
Order
AnnouncedValue
Number
Of Units
Average Value
Per Unit (EUR)Product Type Location Customer Other Details
October, 2013 EUR 37m 45 822,000 Electric winches South
Korea
Hyundai Samho
Heavy Industries
To be installed on Hyundai Heavy Industries' 10,000-tonne
new heavy lift vessel
May, 2013 EUR 22m 1 22,000,000 Subsea Cranes South
Korea
900-tonne active heave-compensated (AHC) MacGregor
subsea crane
May, 2013 EUR 37m 4 9,250,000 Subsea Cranes Hornbeck Offshore
Services Inc.
4x 250-tonne active heave-compensated (AHC) subsea
cranes for four multi-purpose supply vessels (MPSV)
April, 2012 EUR 10m 20 500,000 Cargo handling
cranes
China Chinese shipyard 20x 120-tonne MacGregor GLH cargo handling cranes for ten
general cargo vessels
April, 2013 EUR 10m 4 2,500,000 RoRo Equipment China Chinese shipyard RoRo cargo access equipment for four 6,700 unit Pure
Car/Truck Carriers (PCTCs) to be built in China.
June, 2014 USD 50m 7 7,143,000 Container ship
products
South
Korea
Hyundai Heavy
Industries
Equipment for six A-14-series and one A-18-series
container vessels
-50%
-40%
-30%
-20%
-10%
0%
10%
20%
30%
40%
50%
60%
2007 2008 2009 2010 2011 2012 2013 2014 2015 2016 2017Rotary Rig Count - Offshore 3MMA %yoy
Clarksons Ship Deliveries ex-Offshore
-100%
-50%
0%
50%
100%
150%
-200%
-100%
0%
100%
200%
300%
400%
500%
600%
Ship Ordering % yoy MacGregor Organic Order Growth M'ly (RHS)
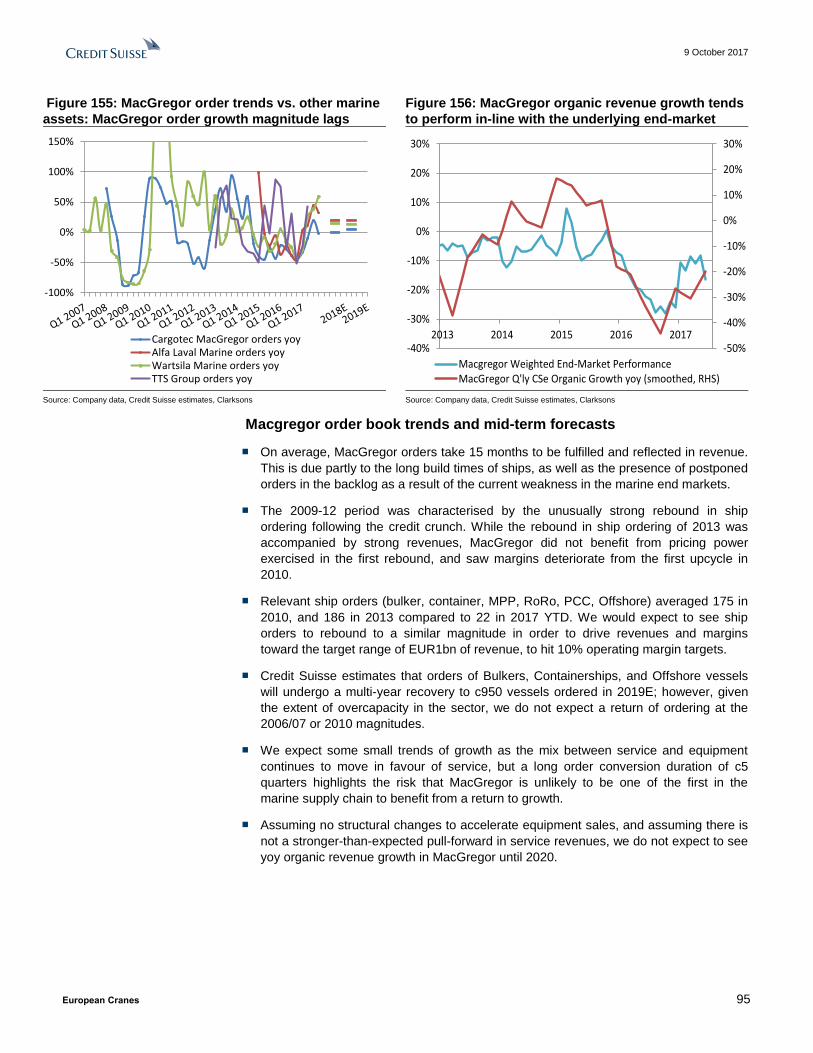
9 October 2017
European Cranes 95
Figure 155: MacGregor order trends vs. other marine
assets: MacGregor order growth magnitude lags
Figure 156: MacGregor organic revenue growth tends
to perform in-line with the underlying end-market
Source: Company data, Credit Suisse estimates, Clarksons Source: Company data, Credit Suisse estimates, Clarksons
Macgregor order book trends and mid-term forecasts
■ On average, MacGregor orders take 15 months to be fulfilled and reflected in revenue.
This is due partly to the long build times of ships, as well as the presence of postponed
orders in the backlog as a result of the current weakness in the marine end markets.
■ The 2009-12 period was characterised by the unusually strong rebound in ship
ordering following the credit crunch. While the rebound in ship ordering of 2013 was
accompanied by strong revenues, MacGregor did not benefit from pricing power
exercised in the first rebound, and saw margins deteriorate from the first upcycle in
2010.
■ Relevant ship orders (bulker, container, MPP, RoRo, PCC, Offshore) averaged 175 in
2010, and 186 in 2013 compared to 22 in 2017 YTD. We would expect to see ship
orders to rebound to a similar magnitude in order to drive revenues and margins
toward the target range of EUR1bn of revenue, to hit 10% operating margin targets.
■ Credit Suisse estimates that orders of Bulkers, Containerships, and Offshore vessels
will undergo a multi-year recovery to c950 vessels ordered in 2019E; however, given
the extent of overcapacity in the sector, we do not expect a return of ordering at the
2006/07 or 2010 magnitudes.
■ We expect some small trends of growth as the mix between service and equipment
continues to move in favour of service, but a long order conversion duration of c5
quarters highlights the risk that MacGregor is unlikely to be one of the first in the
marine supply chain to benefit from a return to growth.
■ Assuming no structural changes to accelerate equipment sales, and assuming there is
not a stronger-than-expected pull-forward in service revenues, we do not expect to see
yoy organic revenue growth in MacGregor until 2020.
-100%
-50%
0%
50%
100%
150%
Cargotec MacGregor orders yoyAlfa Laval Marine orders yoyWartsila Marine orders yoyTTS Group orders yoy
-50%
-40%
-30%
-20%
-10%
0%
10%
20%
30%
-40%
-30%
-20%
-10%
0%
10%
20%
30%
2013 2014 2015 2016 2017
Macgregor Weighted End-Market PerformanceMacGregor Q'ly CSe Organic Growth yoy (smoothed, RHS)

9 October 2017
European Cranes 96
Figure 157: A marine recovery will drive a strong recovery in orders, which we
forecast for 2018….
Source: Company data, Credit Suisse estimates
Figure 158: ….however given the c15-month delay between orders and revenue, we do not expect MacGregor
revenues to benefit until 2020. We expect some demand pull-forward as servicing ticks up before OE.
Source: Company data, Credit Suisse estimates (indicated by dashed line)
MacGregor geographic trends
Sales in APAC, led by sales to local shipbuilders, grew strongly through the financial crisis
as long-lead times and the rapid pick-up in ship-building smoothed any pause in ordering.
This region has seen sharp trends in response to ship ordering.
-80%
-60%
-40%
-20%
0%
20%
40%
60%
80%
100%
-100%
-50%
0%
50%
100%
150%
Orders (Ex Tankers) %yoy MacGregor Organic Orders yoy
-60%
-50%
-40%
-30%
-20%
-10%
0%
10%
20%
30%
-100%
-80%
-60%
-40%
-20%
0%
20%
40%
60%
80%
100%
Q2
20
14
Q3
20
14
Q4
20
14
Q1
20
15
Q2
20
15
Q3
20
15
Q4
20
15
Q1
20
16
Q2
20
16
Q3
20
16
Q4
20
16
Q1
20
17
Q2
20
17
Q3
20
17
E
Q4
20
17
E
Q1
20
18
E
Q2
20
18
E
Q3
20
18
E
MACGREGOR Organic order growth % yoy (15m leading) MACGREGOR Organic sales growth % yoy (RHS)
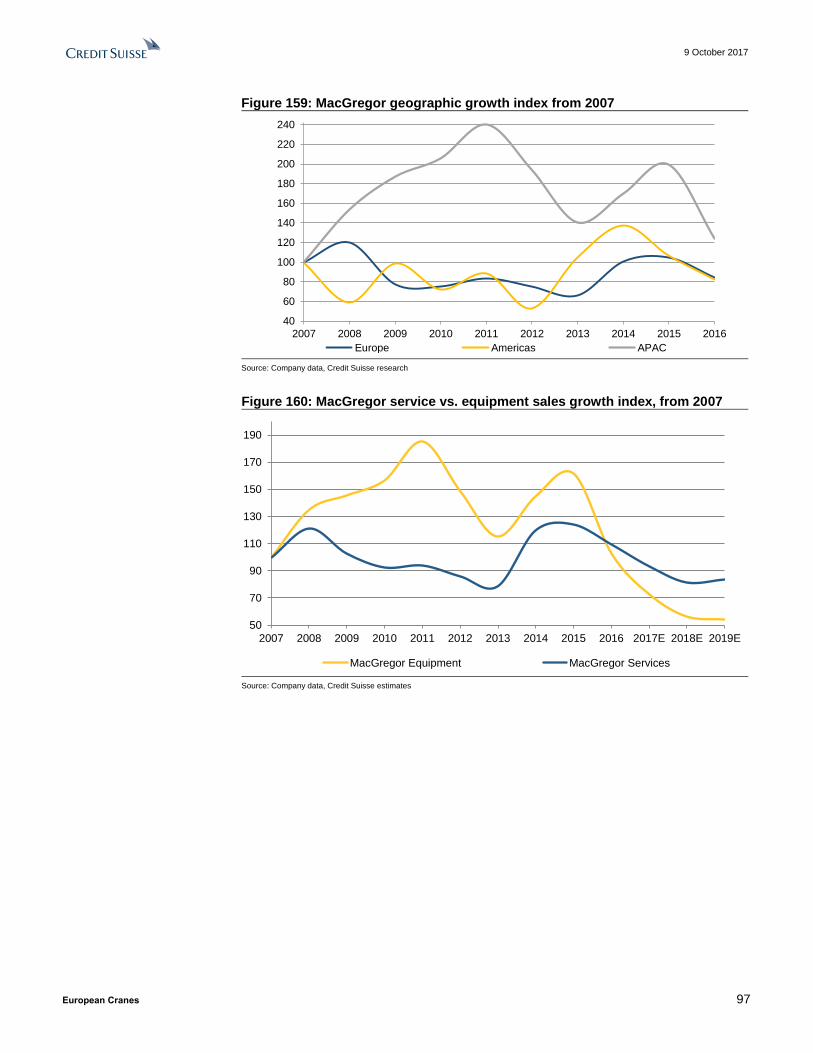
9 October 2017
European Cranes 97
Figure 159: MacGregor geographic growth index from 2007
Source: Company data, Credit Suisse research
Figure 160: MacGregor service vs. equipment sales growth index, from 2007
Source: Company data, Credit Suisse estimates
40
60
80
100
120
140
160
180
200
220
240
2007 2008 2009 2010 2011 2012 2013 2014 2015 2016
Europe Americas APAC
50
70
90
110
130
150
170
190
2007 2008 2009 2010 2011 2012 2013 2014 2015 2016 2017E 2018E 2019E
MacGregor Equipment MacGregor Services

9 October 2017
European Cranes 98
Cargotec Company Primer
Figure 161: Cargotec - Company Overview
Source: Company data, Credit Suisse research
Figure 162: Cargotec - Divisions
Source: Company data, Credit Suisse research
Cargotec is a manufacturer of cargo handling machinery for ships,
ports, terminals and local distribution. Cargotec was formed in 2005,
when it demerged from KONE Corporation. The company is currently
headquartered in Helsinki, Finland.
Workforce: 11,184 employees located across 100 countries
Sales in FY2016: € 3.5bn
Operating income in FY2016: € 198mn with a margin of 5.6%
Key Management
Company Overview
Source: Company data as of FY 2016
Sales by Geography, 2016
Slide 2
Finland2%
Other EMEA40%
China10%
South Korea4%
Other APAC13% USA
23%
OtherAmericas
8%
Fixed Assets by Geography, 2016 Employees by Geography, 2016
Finland14%
Other EMEA40%
APAC8%
Americas15%
Finland9%
Other EMEA40%
APAC24%
Americas14%
Chairman Ilkka Herlin
CEO Mika Vehvilainen
CFO Mikko Puolakka
IR VP Hanna Maria Heikkinen
The company consists of three divisions which all sell products as well as services:
Kalmar: the principal businesses are the supply of port handling equipment to intermodal container
terminals, and container management software to terminal operators and ship operators.
Hiab: produces truck-mounted cranes and forklifts, demountables, tail lifts and recycling / forestry cranes
under a wide variety of brand-names.
MacGregor: selling mechanical products to the offshore and merchant shipping sectors, Macgregor offers
deck handling equipment, winches offshore-specific machinery.
Divisions
Source: Company data as of FY 2016
Sales by Geography, 2016
Slide 3
Employees by Division, 2016
Kalmar52%
Hiab27%
MacGregor21%
Kalmar46%
Hiab48%
MacGregor6%
EBIT by Division, 2016
48%
30%22%
Service12%
Products36%
Service7%
Products23%
Service6%
Product16%
Kalmar Hiab MacGregor

9 October 2017
European Cranes 99
Figure 163: Cargotec – Kalmar Summary
Source: Company data, Credit Suisse research
Figure 164: Cargotec – Kalmar Products
Source: Company data. Image credits to Cargotec
Source: Company data as of FY 2016
Slide 4
Kalmar: summary Kalmar is a provider of cargo handling solutions and services to ports,
terminals, distribution centers and heavy industry.
The business area is divided into:
Automation & Projects
Equipment & Services
Software
Key Figures: Sales of €1.7bn in 2016 with a margin of 8%. The divisionhas an employee base of 5,702 working out of 30 countries
Customers: Ports and terminal operators globally, distribution centers andheavy industry in Europe and USA.
End markets: Ports & terminals account for 80% of revenue exposure,distribution centers account for the remaining 20%.
Revenues by geography Sales Mix, 2016
Source: Company data as of FY 2016
Slide 4
Market position
0%
10%
20%
30%
40%
50%
60%
70%
80%
90%
100%
2014 2015 2016
EMEA Americas APAC
Automation & Projects
20%
Software10%
Equipment & Service
70%
SegmentsMarket
positionMarket size
Automation & Projects #1 - 2
Mobile Equipment #1
Bromma #1
Navis #1 € 0.5bn
Services #1 € 7.6bn
€ 7.0bn
Source: Company data as of FY 2016. Image credits to Cargotec
Slide 5
Kalmar: products
Products: Kalmar’s product portfolio consists of straddle shuttle carriers,terminal tractors, yard cranes, ship to shore cranes, reachstackers, emptycontainer handlers and forklift trucks.
Manufacturing: The division has assembly units located in China, India,Malaysia, Poland, Sweden and the United States.
Brands: Navis for TOS, Bromma for spreaders and all other products under theKalmar brand. Xvela is a collaboration platform
Forklift trucks Reachstakers
Masted container handlers
a) Empty container handlers
b) Loaded container handlers
RTG Cranes
a) AutoRTG
b) Zero Emission RTG
c) Smart Power RTG
d) Classic RTG
Ship to Shore Cranes
Shuttle Carriers
a) AutoShuttle
b) Electric Shuttle Carrier
c) Hybrid Shuttle Carrier
d) Fast Charge Shuttle Carrier
Straddle Carriers
a) AutoStraddle
b) Electric Straddle Carrier
c) Hybrid Straddle Carrier
d) Fast Charge Straddle Carrier
e) Classic Straddle Carrier
Terminal Tractors
Product Portfolio
Key Competitors
SmartPort Automation
Equipment Automation
Terminal Operating system (TOS)
Terminal Logistic system (TLS)
On - Call technical support
Service Contracts
Parts & Parts Care
Crane Upgrades
Training Academy
Automation & Services
LIEBHERR
ABB
Terex
ZPMC
Sany

9 October 2017
European Cranes 100
Figure 165: Cargotec – Kalmar Growth Drivers
Source: Company data, Credit Suisse estimates
Figure 166: Cargotec – Hiab Summary
Source: Company data, Credit Suisse estimates
Kalmar’s focus on quality, energy efficiency and safety helps the terminal operators (80% of sales) and distribution centres
(20% sales) meet their corporate responsibility objectives
Equipment sales (70% Kalmar by revenue) are principally replacement sales and driven by annual volume of containers
handled, a function of global trade. Port utilisation rates drives service revenue.
Software (9%) and Automation & Projects (21%) are driven by efforts to improve cost and throughput efficiency in cargo
handling. The key drivers are as follows;
– Outsourcing of TOS: Replacement of TOS developed in-house with 3rd party systems
– Labour cost reduction: dockworkers’ unions are strong and have helped increase wages in excess of comparable industries.
– Maintenance, power and fuel costs reduction: running equipment at optimum rates for energy efficiency and wear reduction
– Safety improvement: by segregating heavy duty machinery from personnel
– Noise and light pollution reduction: by running hybrid machinery at optimum rates, noise is reduced, while automated
terminals do not need to be floodlit at night
– Throughput: automated terminals operate consistently in all weathers, and are set to surpass manual terminals in lifts per hour.
Container ships >18,000 TEUs strain ports by increasing peak load, requiring investment in size or speed in container handling.
Kalmar - Growth Drivers
Source: Company data as of FY 2016, Clarksons Shipping data
Slide 6
Global Brownfield Port Automation PotentialPort Operator CapEx growth is in-line with world container trade growth
Fully automated 5 Full automated TOS, TLS and ground handling equipment
Semi- automated 7At least two elements automated
Significantly automated 40 Partial automation / single aspect of a terminal
Automation potential 500 Terminals with the size and throughput to make automation worthwhile
80
100
120
140
160
180
200
Port capex from CS Port CapEx model index (LHS)Clarksons container trade index
Source: Company data as of FY 2016
Slide 7
Hiab: summary Hiab caters to on-road load handling equipment and services. The division
offers products, services and spare parts used in delivery and transport.
The business area consists of three main units:
Sales & Markets
Product & Supply
Central Functions
Key Figures: Sales of €1.0bn in 2016 with a margin of 13.5%. The divisionhas an employee base of 2,997 working out of 30 countries
Customers: Transportation companies, constructors/OEMs, governments,fleet operators, rental companies and single truck owners
End markets: Construction, distribution, forestry, defense, marine, energy,waste and recycling
Revenues by geography Sales Mix, 2016
Source: Company data as of FY 2016
Slide 7
Market position (2016)
Commercial 80%
Largecustomers
10%
Military 10%
SegmentsMarket
positionMarket size
Loader cranes #2 € 1.3bn
Tail lif ts #1 € 0.5bn
Demountables #1 € 0.4bn
Truck-mounted forklifts #1 € 0.2bn
Forestry cranes #2 € 0.2bn
0%
10%
20%
30%
40%
50%
60%
70%
80%
90%
100%
2014 2015 2016
EMEA Americas APAC
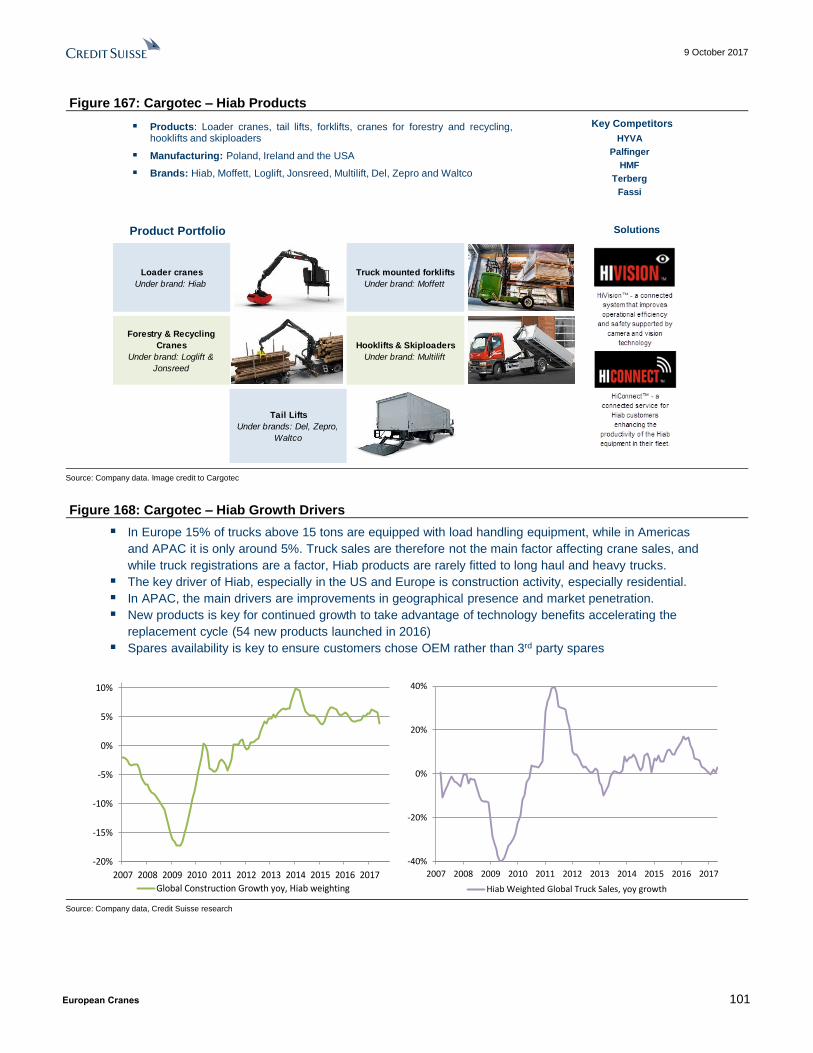
9 October 2017
European Cranes 101
Figure 167: Cargotec – Hiab Products
Source: Company data. Image credit to Cargotec
Figure 168: Cargotec – Hiab Growth Drivers
Source: Company data, Credit Suisse research
Slide 8
Source: Company data as of FY 2016. Image credit to Cargotec
Slide 8
Hiab: products
Products: Loader cranes, tail lifts, forklifts, cranes for forestry and recycling,hooklifts and skiploaders
Manufacturing: Poland, Ireland and the USA
Brands: Hiab, Moffett, Loglift, Jonsreed, Multilift, Del, Zepro and Waltco
Product Portfolio
Key Competitors
Solutions
Loader cranes
Under brand: Hiab
Truck mounted forklifts
Under brand: Moffett
Forestry & Recycling
Cranes
Under brand: Loglift &
Jonsreed
Hooklifts & Skiploaders
Under brand: Multilift
Tail Lifts
Under brands: Del, Zepro,
Waltco
HYVA
Palfinger
HMF
Terberg
Fassi
In Europe 15% of trucks above 15 tons are equipped with load handling equipment, while in Americas
and APAC it is only around 5%. Truck sales are therefore not the main factor affecting crane sales, and
while truck registrations are a factor, Hiab products are rarely fitted to long haul and heavy trucks.
The key driver of Hiab, especially in the US and Europe is construction activity, especially residential.
In APAC, the main drivers are improvements in geographical presence and market penetration.
New products is key for continued growth to take advantage of technology benefits accelerating the
replacement cycle (54 new products launched in 2016)
Spares availability is key to ensure customers chose OEM rather than 3rd party spares
Hiab: Growth Drivers
Source: Company data as of FY 2016, Eurostat, US Sensus data, ACT data, ACEA data
Slide 9
-40%
-20%
0%
20%
40%
2007 2008 2009 2010 2011 2012 2013 2014 2015 2016 2017
Hiab Weighted Global Truck Sales, yoy growth
-20%
-15%
-10%
-5%
0%
5%
10%
2007 2008 2009 2010 2011 2012 2013 2014 2015 2016 2017
Global Construction Growth yoy, Hiab weighting

9 October 2017
European Cranes 102
Figure 169: Cargotec – MacGregor Summary
Source: Company data, Credit Suisse research
Figure 170: Cargotec - MacGregor Products
Source: Company data. Image credit to Cargotec
Source: Company data as of FY 2016
Slide 10
MacGregor: summary MacGregor sells mechanical products to the offshore and merchant
shipping sectors, MacGregor offers deck handling equipment, winchesoffshore-specific machinery.
The business area consists of three main aspects:
Merchant marine equipment sales
Offshore marine equipment sales
Services
Key Figures: Sales of €779m in 2016 with a margin of 2.3%. The divisionhas an employee base of 2,500 working out of 33 countries
Customers: Shipyards, ship-owners (container ships, bulkers, RoRO carferry etc.)
End markets: Maritime transportation and offshore industries
Revenues by geography Sales Mix, 2016
Source: Company data as of FY 2016
Slide 10
Market position (2016)
0%
10%
20%
30%
40%
50%
60%
70%
80%
90%
100%
2014 2015 2016
EMEA Americas APAC
Merchant75%
Offshore25%
SegmentsMarket
positionMarket
Conatiner Lashing #1
Hatch Covers #1 -2
Cranes & Selfunloaders #1
RoRo #1
Offshore advanced load
handling #1
Offshore w inches #2
Mooring systems #1
Loading & off loading
systems#1
Marine
~3/4 of
sales
Offshore
~1/4 of
sales
MacGregor: Products
Source: Company data as of FY 2016. Image credit to Cargotec
Slide 11
Manufacturing: 90% outsourced, (30% design outsourced). The division has a deep sea crane production unit as partof its Chinese JV
Brands: MacGregor, Hatlapa, Porsgrunn, Pusnes and Triplex
Bulk handling
equipmentDoors
Offshore loading
systems
Car decksFishery
equipment
Port & terminal
equipment
Cargo cranes Flinstone products Ramps
.
Compressors
General cargo
handling
equipment
Rescue and work
boats davits
Container
handling
equpiment
Hatch covers Steering gear
Deck machinery
Offshore &
Subsea load
handling
Woodfield marine
loading arms
Product Portfolio Key Competitors
IHI
TTS Marine
Navalimpianti
NOV
Huisman
SEC
Rolls Royce
German Lashing
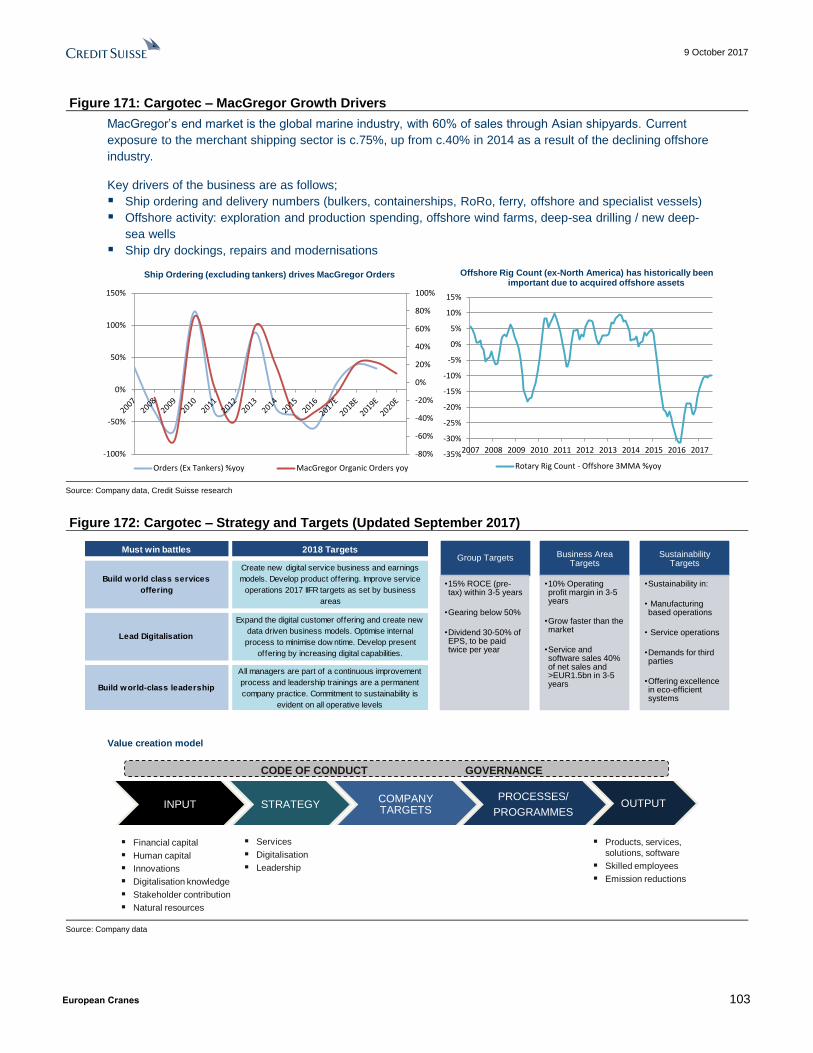
9 October 2017
European Cranes 103
Figure 171: Cargotec – MacGregor Growth Drivers
Source: Company data, Credit Suisse research
Figure 172: Cargotec – Strategy and Targets (Updated September 2017)
Source: Company data
MacGregor’s end market is the global marine industry, with 60% of sales through Asian shipyards. Current
exposure to the merchant shipping sector is c.75%, up from c.40% in 2014 as a result of the declining offshore
industry.
Key drivers of the business are as follows;
Ship ordering and delivery numbers (bulkers, containerships, RoRo, ferry, offshore and specialist vessels)
Offshore activity: exploration and production spending, offshore wind farms, deep-sea drilling / new deep-
sea wells
Ship dry dockings, repairs and modernisations
MacGregor: Growth Drivers
Source: Company data as of FY 2016, baker Hughes Rig Count, Clarksons Research
Slide 12
Offshore Rig Count (ex-North America) has historically been important due to acquired offshore assets
Ship Ordering (excluding tankers) drives MacGregor Orders
-80%
-60%
-40%
-20%
0%
20%
40%
60%
80%
100%
-100%
-50%
0%
50%
100%
150%
Orders (Ex Tankers) %yoy MacGregor Organic Orders yoy
-35%
-30%
-25%
-20%
-15%
-10%
-5%
0%
5%
10%
15%
2007 2008 2009 2010 2011 2012 2013 2014 2015 2016 2017
Rotary Rig Count - Offshore 3MMA %yoy
Strategy & Targets (Updated September 2017)
Source: Company data as of FY 2016
Slide 13
INPUT STRATEGYCOMPANY TARGETS
PROCESSES/
PROGRAMMESOUTPUT
Financial capital
Human capital
Innovations
Digitalisation knowledge
Stakeholder contribution
Natural resources
Services
Digitalisation
Leadership
CODE OF CONDUCT GOVERNANCE
Products, services,
solutions, software
Skilled employees
Emission reductions
Value creation model
Must win battles 2018 Targets
Build world class services
offering
Lead Digitalisation
Build world-class leadership
Create new digital service business and earnings
models. Develop product offering. Improve service
operations 2017 IIFR targets as set by business
areas
Expand the digital customer offering and create new
data driven business models. Optimise internal
process to minimise dow ntime. Develop present
offering by increasing digital capabilities.
All managers are part of a continuous improvement
process and leadership trainings are a permanent
company practice. Commitment to sustainability is
evident on all operative levels
Group Targets
•15% ROCE (pre-tax) within 3-5 years
•Gearing below 50%
•Dividend 30-50% of EPS, to be paid twice per year
Business Area Targets
•10% Operating profit margin in 3-5 years
•Grow faster than the market
•Service and software sales 40% of net sales and >EUR1.5bn in 3-5 years
Sustainability Targets
•Sustainability in:
• Manufacturing based operations
• Service operations
•Demands for third parties
•Offering excellence in eco-efficient systems
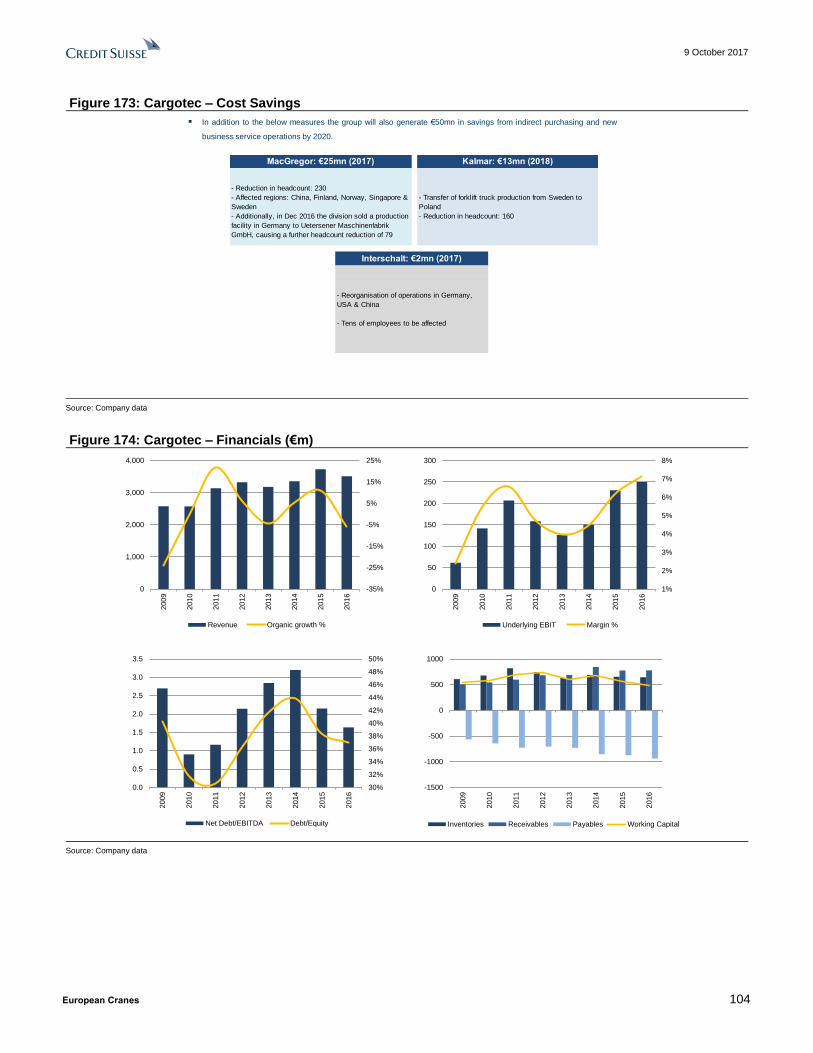
9 October 2017
European Cranes 104
Figure 173: Cargotec – Cost Savings
Source: Company data
Figure 174: Cargotec – Financials (€m)
Source: Company data
Cost savings
Source: Company data as of FY 2016
Slide 14
In addition to the below measures the group will also generate €50mn in savings from indirect purchasing and new
business service operations by 2020.
- Reorganisation of operations in Germany,
USA & China
- Tens of employees to be affected
- Reduction in headcount: 230
- Affected regions: China, Finland, Norway, Singapore &
Sweden
- Additionally, in Dec 2016 the division sold a production
facility in Germany to Uetersener Maschinenfabrik
GmbH, causing a further headcount reduction of 79
MacGregor: €25mn (2017) Kalmar: €13mn (2018)
- Transfer of forklift truck production from Sweden to
Poland
- Reduction in headcount: 160
Interschalt: €2mn (2017)
Financials
Source: Company data as of FY 2016
Slide 15
-35%
-25%
-15%
-5%
5%
15%
25%
0
1,000
2,000
3,000
4,000
2009
2010
2011
2012
2013
2014
2015
2016
Revenue Organic growth %
1%
2%
3%
4%
5%
6%
7%
8%
0
50
100
150
200
250
3002009
2010
2011
2012
2013
2014
2015
2016
Underlying EBIT Margin %
30%
32%
34%
36%
38%
40%
42%
44%
46%
48%
50%
0.0
0.5
1.0
1.5
2.0
2.5
3.0
3.5
2009
2010
2011
2012
2013
2014
2015
2016
Net Debt/EBITDA Debt/Equity
-1500
-1000
-500
0
500
1000
2009
2010
2011
2012
2013
2014
2015
2016
Inventories Receivables Payables Working Capital
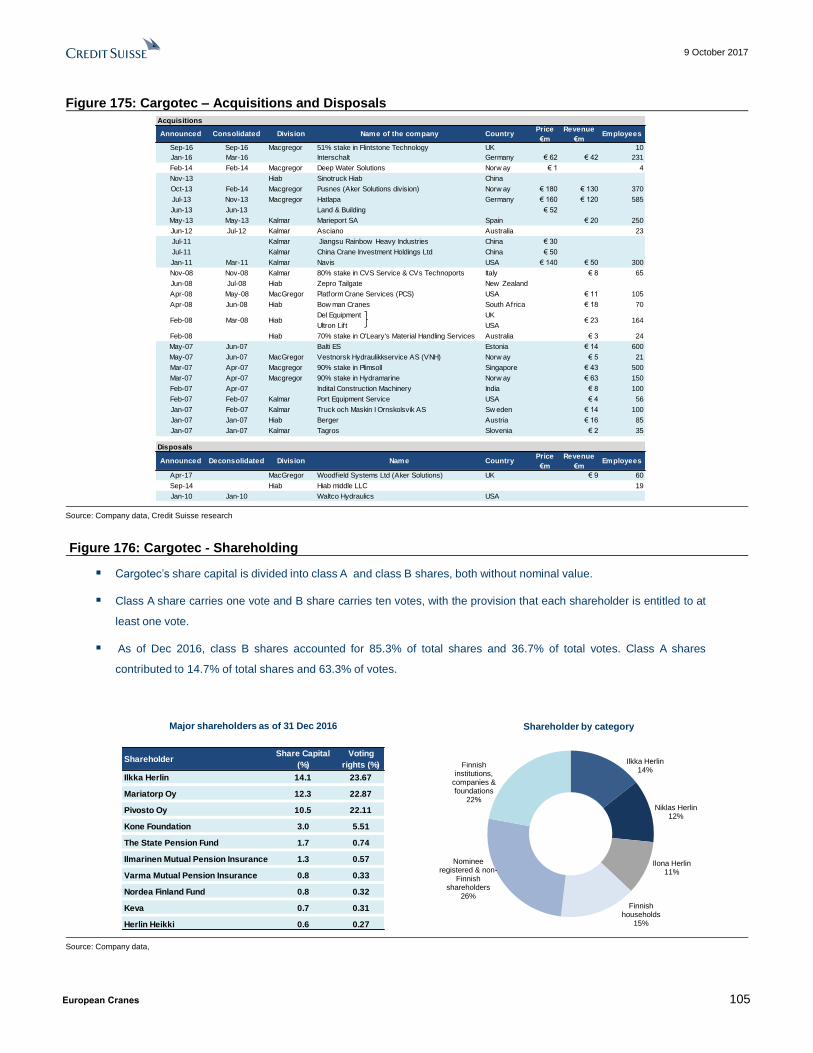
9 October 2017
European Cranes 105
Figure 175: Cargotec – Acquisitions and Disposals
Source: Company data, Credit Suisse research
Figure 176: Cargotec - Shareholding
Source: Company data,
Acquisitions and Disposals
Source: Company data as of FY 2016
Slide 17
Announced Consolidated Division Name of the company CountryPrice
€m
Revenue
€mEmployees
Sep-16 Sep-16 Macgregor 51% stake in Flintstone Technology UK 10
Jan-16 Mar-16 Interschalt Germany € 62 € 42 231
Feb-14 Feb-14 Macgregor Deep Water Solutions Norw ay € 1 4
Nov-13 Hiab Sinotruck Hiab China
Oct-13 Feb-14 Macgregor Pusnes (Aker Solutions division) Norw ay € 180 € 130 370
Jul-13 Nov-13 Macgregor Hatlapa Germany € 160 € 120 585
Jun-13 Jun-13 Land & Building € 52
May-13 May-13 Kalmar Marieport SA Spain € 20 250
Jun-12 Jul-12 Kalmar Asciano Australia 23
Jul-11 Kalmar Jiangsu Rainbow Heavy Industries China € 30
Jul-11 Kalmar China Crane Investment Holdings Ltd China € 50
Jan-11 Mar-11 Kalmar Navis USA € 140 € 50 300
Nov-08 Nov-08 Kalmar 80% stake in CVS Service & CVs Technoports Italy € 8 65
Jun-08 Jul-08 Hiab Zepro Tailgate New Zealand
Apr-08 May-08 MacGregor Platform Crane Services (PCS) USA € 11 105
Apr-08 Jun-08 Hiab Bow man Cranes South Africa € 18 70
Del Equipment UK
Ultron Lift USA
Feb-08 Hiab 70% stake in O'Leary's Material Handling Services Australia € 3 24
May-07 Jun-07 Balti ES Estonia € 14 600
May-07 Jun-07 MacGregor Vestnorsk Hydraulikkservice AS (VNH) Norw ay € 5 21
Mar-07 Apr-07 Macgregor 90% stake in Plimsoll Singapore € 43 500
Mar-07 Apr-07 Macgregor 90% stake in Hydramarine Norw ay € 63 150
Feb-07 Apr-07 Indital Construction Machinery India € 8 100
Feb-07 Feb-07 Kalmar Port Equipment Service USA € 4 56
Jan-07 Feb-07 Kalmar Truck och Maskin I Ornskolsvik AS Sw eden € 14 100
Jan-07 Jan-07 Hiab Berger Austria € 16 85
Jan-07 Jan-07 Kalmar Tagros Slovenia € 2 35
Announced Deconsolidated Division Name CountryPrice
€m
Revenue
€mEmployees
Apr-17 MacGregor Woodfield Systems Ltd (Aker Solutions) UK € 9 60
Sep-14 Hiab Hiab middle LLC 19
Jan-10 Jan-10 Waltco Hydraulics USA
Disposals
Acquisitions
Feb-08 Mar-08 Hiab € 23 164
Shareholding
Source: Company data as of FY 2016
Slide 18
ShareholderShare Capital
(%)
Voting
rights (%)
Ilkka Herlin 14.1 23.67
Mariatorp Oy 12.3 22.87
Pivosto Oy 10.5 22.11
Kone Foundation 3.0 5.51
The State Pension Fund 1.7 0.74
Ilmarinen Mutual Pension Insurance 1.3 0.57
Varma Mutual Pension Insurance 0.8 0.33
Nordea Finland Fund 0.8 0.32
Keva 0.7 0.31
Herlin Heikki 0.6 0.27
Ilkka Herlin 14%
Niklas Herlin12%
Ilona Herlin11%
Finnish households
15%
Nominee registered & non-
Finnish shareholders
26%
Finnish institutions,
companies & foundations
22%
Major shareholders as of 31 Dec 2016 Shareholder by category
Cargotec’s share capital is divided into class A and class B shares, both without nominal value.
Class A share carries one vote and B share carries ten votes, with the provision that each shareholder is entitled to at
least one vote.
As of Dec 2016, class B shares accounted for 85.3% of total shares and 36.7% of total votes. Class A shares
contributed to 14.7% of total shares and 63.3% of votes.

9 October 2017
European Cranes 106
Figure 177: Cargotec – Executive Management Team
Source: Company data,
Name Cargotec Experience Previous Experience
Mika Vehvilainen 2013-2017: Executive Board Member 2010-2013: Finnair PLC, President and CEO
Age: 56 1991-2009: Nokia Siemens Netw ork, COO (2007) and Different Positions
President / CEO
Mikko Puolakka 2016-2017: Executive Board Member 2010-2016: Outotec Oyj, CFO
Age: 48 2007-2010: Ecloteq SE, CFO (Prev. Director Finance Europe)
CFO 2001-2003: Ecloteq AG, Manager Finance
1999-2001: Huhtamaki Oyj, Operations Controller (Prev. 1995 -Different Treasury Positions)
1997-1999: Leaf Poland Sp.z.o.o., Manager Finance
Mikael Laine 2014-2017: Executive Board Member 2012-2013: Moventas Group, President and CEO
Age: 53 2008-2012: Moventas Group, SVP, Business Development and Corporate Functions
CSO 2005-2008: YAP Solutions Oy, CEO
1996-2005: TeliaSonera Corporation, CFO, SVP, Deputy CEO and Different positions
1995-1996: Mikrolog Oy Ltd, CFO
Antti Kaunonen 2015-2017: Employed by Cargotec 2007-2015: Voith - Germany
Age: 58 2016-2017: President, Kalmar 1986-2007: Metso - Finland, China
Kalmar - President 1983-2007: Tampere University of Technology, Professor
Roland Sunden 2014-2017: Executive Board Member 2012-2014: CoCreate BV, Founder / MD
Age: 64 2006-2012: LM Wind Pow er, CEO
Hiab - President 2003-2006: Case New Holland, Agricultural Division, President
2000-2003: Volvo Construction Equipment, Executive VP
1985-2000: Volvo Bus North America, President and CEO (1998) and Different positions
Michel van Roozendaal 2015-2017: Executive Board Member 2010-2015: Ingersoll Rand, Thermo King Division, VP & GM; Services, Contracting and Aftermarket, EMEIA, VP
Age: 54 2007-2009: United Technologies Fire & Security, MD
McGregor - President 2004-2006: Danaher Motion, Europe, President
2000-2004: Johnson Controls, North Europe Region, VP
1991-2000: Honeyw ell, Different positions
Tiina Aaltonen
Investor Relations

9 October 2017
European Cranes 107
Cargotec: Financials
Figure 178: Cargotec: Divisional Quarterly Overview
Source: Company data, Credit Suisse estimates
Divisional Overview (€m) 1Q 2016 2Q 2016 3Q 2016 4Q 2016 1Q 2017 2Q 2017 3Q 2017 4Q 2017 2017E 2018E
Orders by Division
Kalmar 454 438 389 440 448 386 379 425 1638 1970
Growth % -0.2% -2.7% -16.0% 11.3% -1.3% -11.9% -2.5% -3.3% -4.8% 20.2%
Organic Growth % 1.6% 0.4% -15.7% 11.0% -3.9% -12.3% 0.0% 0.4% -4.0% 22.0%
Hiab 275 239 220 282 288 279 233 290 1089 1126
Growth % 7.4% 8.1% -7.9% 12.5% 4.7% 16.7% 5.7% 2.7% 7.2% 3.4%
Organic Growth % 8.8% 10.8% -7.4% 12.3% 2.5% 16.6% 8.0% 6.0% 8.0% 5.0%
MacGregor 173 149 124 101 121 136 153 95 504 554
Growth % -24.1% -32.3% -38.0% -44.2% -30.1% -8.7% 23.0% -5.8% -7.8% 9.9%
Organic Growth % -21.0% -28.1% -38.8% -44.8% -33.3% -9.7% 20.0% -1.7% -7.0% 12.0%
Group Orders 902 826 733 823 857 801 764 810 3232 3650
Growth % -3.9% -7.3% -18.7% -0.4% -5.0% -3.1% 4.3% -1.6% -1.6% 12.9%
Organic Growth % -2.6% -4.7% -18.9% -0.9% -7.3% -3.5% 7.2% 2.4% -0.4% 14.8%
Revenue by Division
Kalmar 367 420 436 477 364 403 447 459 1673 1710
Growth % -7.1% 7.4% 6.6% 1.8% -0.8% -4.0% 2.5% -3.8% -1.6% 2.2%
Organic Growth % -5.7% 9.3% 5.6% 0.4% -4.3% -4.5% 5.0% -0.1% -1.0% 4.0%
Hiab 246 283 250 257 270 282 267 265 1084 1125
Growth % 16.0% 19.4% 9.2% 2.7% 9.8% -0.4% 6.6% 3.3% 4.6% 3.8%
Organic Growth % 17.4% 22.1% 9.7% 2.6% 7.5% -0.5% 8.0% 5.8% 5.0% 5.0%
MacGregor 216 196 169 198 160 160 124 138 582 468
Growth % -23.4% -36.4% -41.5% -23.9% -25.9% -18.4% -26.7% -30.2% -25.3% -19.5%
Organic Growth % -20.6% -32.9% -43.0% -25.5% -30.0% -18.5% -22.5% -25.0% -24.0% -17.0%
Group Revenue 829 899 855 931 794 845 837 862 3338 3304
Growth % -6.7% -4.0% -7.8% -4.8% -4.2% -6.0% -2.1% -7.4% -5.0% -1.0%
Organic Growth % -5.7% -2.1% -8.7% -6.0% -7.1% -6.1% 0.8% -3.5% -4.0% 0.7%
Operating Profit by Division
Kalmar 26 32 36 42 28 33 37 38 135 154
Margin % 7.0% 7.6% 8.3% 8.7% 7.6% 8.2% 8.2% 8.2% 8.1% 9.0%
Hiab 32 42 33 33 40 44 37 45 166 172
Margin % 13.2% 14.7% 13.2% 12.8% 14.6% 15.6% 14.0% 17.0% 15.3% 15.3%
MacGregor 9 5 3 1 2 5 4 4 15 18
Margin % 4% 3% 2% 0% 2% 3% 3% 3% 3% 4%
Group Operating Profit 67 79 72 75 70 82 78 87 316 344
Margin % 24.4% 25.0% 23.2% 21.8% 23.8% 26.8% 25.2% 27.8% 25.9% 28.1%

9 October 2017
European Cranes 108
Figure 179: Cargotec: Divisional Overview
Source: Company data, Credit Suisse estimates
Divisonal Overview (€m) 2008 2009 2010 2011 2012 2013 2014 2015 2016 2017E 2018E 2019E
ORDERS
Kalmar 1,464 1,565 1,430 1,482 1,763 1,721 1,638 1,970 2,324
Change yoy% 0.0% 6.9% -8.6% 3.6% 19.0% -2.4% -4.8% 20.2% 18.0%
Organic order growth % yoy 0.0% 1.8% -6.1% 4.7% 11.4% -1.2% -4.0% 22.0% 18.0%
Hiab 776 850 869 909 967 1,016 1,089 1,126 1,183
Change yoy% 0.0% 9.5% 2.2% 4.6% 6.4% 5.1% 7.2% 3.4% 5.0%
Organic order growth % yoy 0.0% 5.3% 4.9% 5.7% -0.9% 6.2% 8.0% 5.0% 5.0%
MacGregor 1,393 569 1,040 997 645 1,011 1,210 828 547 504 554 676
Change yoy% -17.9% -59.2% 82.8% -4.1% -35.3% 56.7% 19.7% -31.6% -34.0% -7.8% 9.9% 22.0%
Organic order growth % yoy -17.3% -64.5% 73.9% -5.8% -42.7% 63.2% 20.7% -38.4% -32.5% -7.0% 12.0% 22.0%
Group Orders 3,768 1,831 1,039 3,234 3,058 3,310 3,601 3,558 3,284 3,232 3,650 4,183
Change yoy% -8.2% -51.4% -43.3% 211.3% -5.4% 8.2% 8.8% -1.2% -7.7% -1.6% 12.9% 14.6%
Organic order growth % yoy -5.6% -52.8% -50.8% 210.9% -11.0% 11.8% 9.9% -8.9% -6.9% -0.4% 14.8% 14.6%
REVENUE
Kalmar 1,159 1,495 1,550 1,487 1,663 1,700 1,673 1,710 1,915
Change yoy% 0.0% 29.0% 3.7% -4.0% 11.9% 2.2% -1.6% 2.2% 12.0%
Organic sales growth % yoy 0.0% 23.8% 5.3% -2.9% 4.3% 2.4% -1.0% 4.0% 12.0%
Hiab 769 840 841 840 928 1,036 1,084 1,125 1,170
Change yoy% 0.0% 9.2% 0.1% -0.1% 10.5% 11.6% 4.6% 3.8% 4.0%
Organic sales growth % yoy 0.0% 5.0% 2.7% 1.0% 3.2% 12.7% 5.0% 5.0% 4.0%
MacGregor 985 1,009 1,050 1,213 995 794 1,034 1,139 779 582 468 459
Change yoy% 31.7% 2.4% 4.1% 15.5% -18.0% -20.2% 30.2% 10.1% -31.6% -25.3% -19.5% -2.0%
Organic sales growth % yoy 25.0% -3.3% -4.8% 13.9% -25.4% -15.5% 5.7% 2.3% -30.8% -24.0% -17.0% -2.0%
Group Revenue 3,399 2,581 2,575 3,139 3,327 3,181 3,358 3,730 3,514 3,338 3,304 3,544
Change yoy% 12.6% -24.1% -0.2% 21.9% 6.0% -4.4% 5.6% 11.1% -5.8% -5.0% -1.0% 7.3%
Organic sales growth % yoy 13.3% -25.7% -7.7% 21.1% 0.4% -1.8% 0.3% 3.0% -5.6% -4.0% 0.7% 7.3%
OPERATING PROFIT
Kalmar 56 42 64 57 130 135 135 154 174
Margin% 4.8% 2.8% 4.1% 3.9% 7.8% 8.0% 8.1% 9.0% 9.1%
Hiab 21 28 24 61 101 140 166 172 176
Margin% 2.7% 3.3% 2.9% 7.3% 10.8% 13.5% 15.3% 15.3% 15.0%
MacGregor 84 105 148 176 131 63 54 30 18 15 18 23
Margin% 8.5% 10.4% 14.0% 14.5% 13.2% 7.9% 5.2% 2.6% 2.3% 2.5% 3.8% 5.0%
Group Underlying EBIT 193 61 142 207 158 126 150 231 250 275 307 336
Margin% 5.7% 2.4% 5.5% 6.6% 4.8% 4.0% 4.5% 6.2% 7.1% 8.2% 9.3% 9.5%

9 October 2017
European Cranes 109
Figure 180: Cargotec: Income Statement
Source: Company data, Credit Suisse estimates
PROFIT & LOSS (€m) 2008 2009 2010 2011 2012 2013 2014 2015 2016 2017E 2018E 2019E
Group Orders 3,768 1,831 2,729 3,234 3,058 3,310 3,601 3,558 3,284 3,232 3,650 4,183
Change yoy% -8.2% -51.4% 49.0% 18.5% -5.4% 8.2% 8.8% -1.2% -7.7% -1.6% 12.9% 14.6%
Organic order growth % yoy -5.6% -52.8% 41.5% 18.2% -11.0% 11.8% 9.9% -8.9% -6.9% -0.4% 14.8% 14.6%
Group Revenue 3,399 2,581 2,575 3,139 3,327 3,181 3,358 3,730 3,514 3,338 3,304 3,544
Change yoy% 12.6% -24.1% -0.2% 21.9% 6.0% -4.4% 5.6% 11.1% -5.8% -5.0% -1.0% 7.3%
Organic sales growth % yoy 13.3% -25.7% -7.7% 21.1% 0.4% -1.8% 0.3% 3.0% -5.6% -4.0% 0.7% 7.3%
COGS (2,763) (2,159) (2,052) (2,481) (2,693) (2,598) (2,723) (2,942) (2,674) (2,470) (2,412) (2,570)
Gross Profit 637 422 523 658 634 583 635 788 840 868 892 975
Gross Profit Margin 18.7% 16.4% 20.3% 21.0% 19.1% 18.3% 18.9% 21.1% 23.9% 26.0% 27.0% 27.5%
Total Cost (464) (423) (392) (451) (502) (490) (513) (577) (644) – – –
Share of associated companies' & JV's net income1 1 1 1 () () 5 3 3 3 3 3
Group Reported EBIT 174 131 207 132 93 128 214 199 250 295 323
Group Reported EBIT Margin 5.1% 0.0% 5.1% 6.6% 4.0% 2.9% 3.8% 5.7% 5.6% 7.5% 8.9% 9.1%
Group Restructuring Cost (19) (61) (11) – (27) (34) (24) (18) (52) (25) (12) (13)
Group Underlying EBIT 193 61 142 207 158 126 150 231 250 275 307 336
Group Underlying EBIT Margin 5.7% 2.4% 5.5% 6.6% 4.8% 4.0% 4.5% 6.2% 7.1% 8.2% 9.3% 9.5%
Underlying EBITDA 253 121 202 270 228 203 231 307 335 358 394 426
EBITDA Margin% 7.4% 4.7% 7.9% 8.6% 6.9% 6.4% 6.9% 8.2% 9.5% 10.7% 11.9% 12.0%
Net Interest (29) (27) (30) (15) (9) (14) (28) (27) (29) (27) (21) (16)
Reported PBT 145 (27) 102 192 123 79 98 186 169 223 274 307
Underlying PBT 164 34 112 192 150 113 122 204 222 248 286 320
Tax (24) 34 (24) (43) (33) (23) (26) (43) (44) (59) (73) (81)
Effective rate, % 14.9% 99.4% 21.0% 22.3% 22.1% 20.7% 21.4% 21.3% 19.8% 23.8% 25.4% 25.4%
Minorities 2 4 4 1 1 1 () (1) (1) (1) (1)
Reported Net Income 118 3 74 149 89 55 72 143 126 164 202 227
Operating Net Income 138 64 85 149 116 89 95 161 178 190 214 240
Operating net income margin % 4.0% 2.5% 3.3% 4.7% 3.5% 2.8% 2.8% 4.3% 5.1% 5.7% 6.5% 6.8%
Dividend 25 24 37 61 44 26 35 52 61 73 87 103
Retained profits 94 (22) 37 87 45 29 36 91 65 91 116 124
CS operating EPS 2.2 1.0 1.4 2.4 1.9 1.4 1.5 2.5 2.8 2.9 3.3 3.7
EPS growth, % -9.3% -53.0% 32.3% 75.4% -21.8% -24.0% 2.6% 68.4% 10.9% 6.3% 13.0% 11.8%
DPS 0.4 0.4 0.6 1.0 0.7 0.4 0.5 0.8 0.9 1.1 1.3 1.6
DPS growth, % -62.0% 0.0% 0.0% 0.0% 0.0% -41.7% 31.1% 45.6% 18.8% 18.8% 18.8% 18.8%
Dividend Cover (X) 5.6 2.6 2.3 2.4 2.6 3.4 2.7 3.1 2.9 2.6 2.5 2.3

9 October 2017
European Cranes 110
Figure 181: Cargotec: Balance Sheet
Source: Company data, Credit Suisse estimates
Figure 182: Cargotec: Cash flow statement
Source: Company data, Credit Suisse estimates
BALANCE SHEET (€m) 2008 2009 2010 2011 2012 2013 2014 2015 2016 2017E 2018E 2019E
PPE and Intangibles 1,038 1,086 1,131 1,264 1,325 1,395 1,550 1,555 1,623 1,608 1,587 1,569
Other f ixed assets 177 147 147 184 282 246 311 347 340 340 340 340
Fixed assets 1,215 1,233 1,278 1,448 1,607 1,640 1,862 1,902 1,963 1,948 1,927 1,909
Inventories 882 609 679 821 747 631 691 655 647 596 581 620
Trade and other receivables 714 506 546 599 685 691 845 778 779 713 706 757
Trade and other payables 724 565 643 727 704 728 854 872 936 785 766 817
Working capital 872 551 582 693 729 593 682 562 490 524 521 560
WC as % of sales 25.7% 21.3% 22.6% 22.1% 21.9% 18.6% 20.3% 15.1% 13.9% 15.7% 15.8% 15.8%
Cash 79 267 318 204 209 306 205 176 273 346 485 338
Short-term debt 115 83 97 98 259 300 193 69 165 164 164 114
Long-term debt 440 511 404 421 440 585 753 768 657 658 658 458
Net debt / (cash) 476 328 183 315 490 579 741 661 549 476 337 234
Pension deficit 34 38 45 46 68 61 72 71 81 81 81 81
Other investments 149 72 95 48 49 68 49 59 74 74 74 74
Other liabilities 862 609 659 652 609 422 566 449 500 500 500 500
Net assets 865 881 1,069 1,177 1,218 1,240 1,214 1,342 1,397 1,489 1,604 1,727
CASH FLOW STATEMENT (€m) 2008 2009 2010 2011 2012 2013 2014 2015 2016 2017E 2018E 2019E
Net income 121 7 78 149 90 55 72 143 125 164 201 226
Depreciation & amortisation 60 60 61 63 70 77 81 77 85 83 87 90
Financing items 53 (7) 30 15 9 14 28 27 29 27 21 16
Taxes 0 0 23 43 33 23 26 43 44 59 73 81
Change in w orking capital (99) 230 108 (100) (96) 13 8 29 91 (34) 3 (39)
Others (1) (1) (7) (4) (8) (2) (12) (4) – – – –
Cash flow from financing items and taxes 0 0 0 (63) (38) (92) (94) (119) (60) (86) -93 -97
Net cash flow from operating activities 94 264 259 103 60 89 110 196 314 213 292 276
Net Capex (98) (77) (27) (50) (58) (29) (32) (58) (63) (67) (66) (71)
Free Cash Flow (5) 187 233 53 1 60 78 138 251 146 225 206
FCF/Op. Net Income -3.3% 292.2% 274.7% 35.7% 1.3% 68.2% 82.3% 86.0% 140.5% 76.9% 105.2% 85.8%
Net cash flow from Investing activities (155) (87) (68) (186) (179) (117) (230) (58) (132) (67) (66) (71)
Net cash flow from Financing activities (62) 29 (145) (19) 101 163 15 (178) (84) (73) (87) (353)
Net Cashflow (124) 206 46 (102) (18) 135 (105) (40) 98 73 139 (147)

9 October 2017
European Cranes 111
PEERs
PEERs is a global database that captures unique information about companies within the
Credit Suisse coverage universe based on their relationships with other companies – their
customers, suppliers and competitors. The database is built from our research analysts’
insight regarding these relationships. Credit Suisse covers over 3,000 companies globally.
These companies form the core of the PEERs database, but it also includes relationships
on stocks that are not under coverage.
For more information, see our November 2016 PEERs report: A chain reaction: Supply chain strategies.
Figure 183: Cargotec PEERS analysis
Source: Credit Suisse PEERs

9 October 2017
European Cranes 112
Appendices: Appendix 1 - Glossary:
AGV - Autonomous guided vehicle
ARTG - Automatic rubber tire gantry (crane)
ASC - Automatic stacking crane (see ARTG)
LPH - Lifts per hour
ERTG - Electric RTG
MHC - Mobile Harbour Crane
NI - New equipment
OE - Original equipment (i.e. products)
OEM - Original equipment manufacturer
RMG - Rail mounted gantry (crane)
RTG - Rubber tire gantry (crane)
SCM - Supply chain management
STS - Ship to shore (crane)
TEU - Twenty-foot Equivalent Unit
TLS - Terminal logistics system
TOS - Terminal operating system
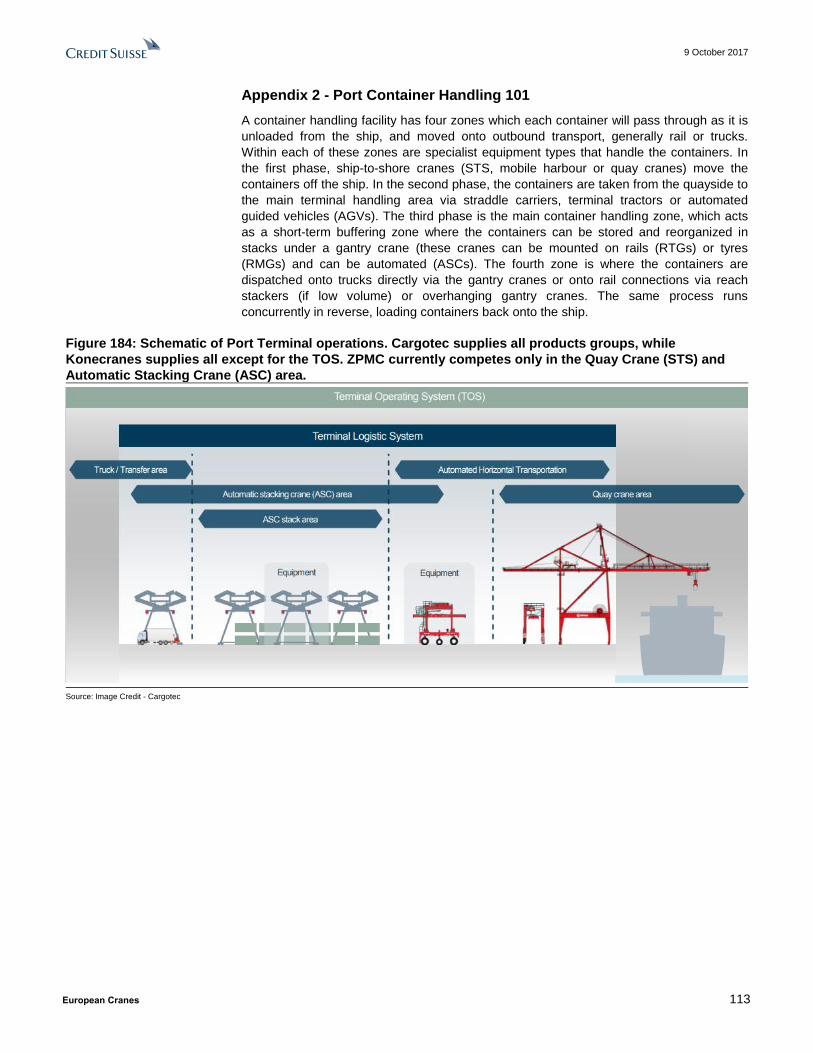
9 October 2017
European Cranes 113
Appendix 2 - Port Container Handling 101
A container handling facility has four zones which each container will pass through as it is
unloaded from the ship, and moved onto outbound transport, generally rail or trucks.
Within each of these zones are specialist equipment types that handle the containers. In
the first phase, ship-to-shore cranes (STS, mobile harbour or quay cranes) move the
containers off the ship. In the second phase, the containers are taken from the quayside to
the main terminal handling area via straddle carriers, terminal tractors or automated
guided vehicles (AGVs). The third phase is the main container handling zone, which acts
as a short-term buffering zone where the containers can be stored and reorganized in
stacks under a gantry crane (these cranes can be mounted on rails (RTGs) or tyres
(RMGs) and can be automated (ASCs). The fourth zone is where the containers are
dispatched onto trucks directly via the gantry cranes or onto rail connections via reach
stackers (if low volume) or overhanging gantry cranes. The same process runs
concurrently in reverse, loading containers back onto the ship.
Figure 184: Schematic of Port Terminal operations. Cargotec supplies all products groups, while
Konecranes supplies all except for the TOS. ZPMC currently competes only in the Quay Crane (STS) and
Automatic Stacking Crane (ASC) area.
Source: Image Credit - Cargotec

9 O
cto
ber 2
01
7
Eu
rop
ean
Cra
nes
114
Appendix 4: Company Primers
Figure 185: Konecranes summary
Source: Company data, Credit Suisse research. Image credit to Konecranes
Operating Profit split (2016, combined) Sales Mix (2016, combined) Geographic Mix (2016, combined)
Management
Chairman Christoph Vitzthum
President, CEO Panu Routila
CFO Teo Ottola
IR - VP Miikka Kinnunen
* Industrial Equipment reported -€6m loss
Division Market Position Main Competitors Key Drivers/ Themes Product Example
Service
FY 2016 Sales EUR 1.2bn
-1.0% YoY organic growth
FY 2016 EBIT EUR 1.53bn
12.6% Margin
#1 in Overhead crane maintenance Columbus McKinnon, In-House operations
- Underlying industrial activity, though
with less cyclicality than for equipment
business.
- Structural growth characteristics.
- Contracted service base, where
Konecranes is trying to grow both the
number of units under service
agreements, as well as the annual
revenue per unit.
Industrial Equipment
FY 2016 Sales EUR 1.1bn
0.6% YoY organic growth
FY 2016 EBIT EUR -6m
-0.5% Margin
#1 in Industrial cranes Columbus McKinnon, Kito, Abus - General industrial production
Port Solution
FY 2016 Sales EUR 1.1bn
FY 2016 EBIT EUR 53m
4.9% Margin
#2 in Lift trucks (container handling & heavy
forklift >10t)
#3-#5 in Port cranes (incl. shipyard cranes)
Cargotec, Liebherr, Sany, ZPMC
- Outsourcing of TOS
- Labour cost reduction:
- Maintenance, power and fuel costs
reduction
- Safety improvement
- Noise and light pollution reduction
- Throughput
KONECRANES - LEO CARRINGTON, ACA +44 (0)20 7883 4532/ [email protected]
End Market Order Mix (2016, combined)Shareholding Structure
Free Float: 87.64%
Top 5 shareholders
Blackrock 12.36%, HTT 2 Holding 8.71%,
Polaris Capital Management 4.56%,
Sanderson Asset Management 4.06%, Harris
Associates LP 3.99%
Ownership by country
US 37%, Finland 25%, Britain 14%,
Luxembourg 8%, Ireland 4% and others
Products
Inspections, Preventive maintenance programs, Remote and On-call service, Repairs and
Improvements, Spare parts, Modernizations, and a variety of consultation services.
Industrial cranes, Workstation lifting systems (incl. components such as wire rope hoists,
electric chain hoists), Nuclear cranes, Container and bulk handling equipment, Shipyard
cranes and Lift trucks
Rubber Tired Gantry (RTG) cranes, Ship-to-Shore (STS) cranes, Rail Mounted Gantry
(RMG) cranes, Automated Stacking Cranes (ASCs), Straddle Carriers, Sprinter Carriers
and lift trucks. Shipyard cranes incl. Goliath Gantry Crane . Software products for
warehousing logistics, container terminal operation, and consulting services for new
container terminal design and container terminal modernization
Service74%
Port Solutions
26%
Service35%
Industrial Equipment
33%
Port Solutions
32%
AME33%
APAC17%
EMEA50%
Product60%
Service40%

9 O
cto
ber 2
01
7
Eu
rop
ean
Cra
nes
115
Figure 186: Cargotec summary page
Source: Company data, Credit Suisse research. Image credit to Cargotec
Operating Profit Split (2016) Sales Mix (2016) End Market Mix (2016)
Management
Chairman & CEO Mika Vehvilainen
CFO Mikko Puolakka
IR Tiina Aaltonen
Division Products End Markets / Channels Main Competitors Revenue Split by Geo Key Drivers/ Themes
Kalmar
FY 2016 Sales EUR 1,700m
2.2% YoY organic growth
FY 2016 EBIT SEK 1.35 Bn
8% Margin
Straddle and Shuttle carriers, yard cranes,
ship-to-shore cranes, reachstackers, empty
container handlers, terminal tractors, forklift
trucks. Services include technical support,
crane upgrades. Navis terminal operating
systems, Bromma spreaders, Siwertell bulk
handling system are parts of Kalmar.
Equipment & Service 70%, Automation &
Projects 20%, Software 10%
ZPMC, Konecranes, Terex, Liebherr, ABB,
SanyEurope 42%, America 36%, APAC 22%
Service growth, Growth in software through new
offering, Transfer of assembly operations from
Sweden to Poland
Hiab
FY 2016 Sales EUR 1,036m
11.6% YoY organic growth
FY 2016 EBIT SEK 1.4 Bn
13.5% Margin
HIAB loader cranes, JONSERED recycling
and forestry cranes, LOGLIFT forestry cranes,
MOFFETT truck mounted forklifts, MULTLIFT
demountables, ZEPRO, DEL and WALTCO
tail lifts, as well as services and spare parts.
Commercial 80%, Large Customer 10%,
Military 10%Palfinger, Fassi, HMF, Hyva, Terberg Europe 48%, America 41%, APAC 11%
Service growth, Expansion of footprint in core
and emerging markets, product segments,
Expansion of digitalized business solutions
MacGregor
FY 2016 Sales EUR 779m
-31.6% YoY organic growth
FY 2016 EBIT SEK 0.18 Bn
2.3% Margin
Engineering solutions and services for
handling marine cargoes, vessel operations,
offshore loads, crude / liquefied natural gas
transfer and offshore mooring, and lifetime
support, maintenance and service solutions.
Woodfield systems offered to onshore
customers.
Merchant 75%, Offshore 25%TTS, Rolls - Royce, Liebherr, Mitsubishi,
German Lashing, SMS KoreaEurope 34%, America 7%, APAC 59%
Service growth, Enhanced customer centricity,
Continued investments in digitalization, Focus
on operational efficiency
CARGOTEC - LEO CARRINGTON, ACA +44 20 7883 4532/ [email protected]
Geographic Mix (2016)Shareholding Structure
Free Float: 88.76%
Top 5 shareholders
Wipunen varainhallinta oy 11.24%, Mariatorp
Oy 9.06%, Pivosto Oy 6.98%, Dimensional
Fund Advisors 2.81%, Norges Bank 2.71%
Ownership by country
Finland 60.84%, USA 13.19%, Sweden 6.52%,
Norway 4.11%, Britain 3.74% , Luxembourg
2.94%, Ireland 1.7%, Germany 0.65%, Ohers
4.87%
Kalmar 48%
Hiab 30%
MacGregor 22%
Kalmar 46%
Hiab 48%
MacGregor 6%
Finland 2%
Other EMEA 40%
China 10%South Korea4%
Other APAC 13%
USA 23%
Other Americas 8%
Equipment & Services 34%
Automation & Projects 10%
Software5%
Commercial 23%
Large Customers
3%
Military 3%
Merchant 17%
Offshore 6%
9 October 2017
European Cranes 116
Companies Mentioned (Price as of 05-Oct-2017) ABB (ABBN.S, SFr24.47) AP Moller Maersk (MAERSKb.CO, Dkr11570.0) Adani Ports & SEZ (APSE.BO, Rs386.0) Alfa Laval (ALFA.ST, Skr201.7) Assa Abloy (ASSAb.ST, Skr177.0) Atlas Copco (ATCOa.ST, Skr346.5) Cargotec (CGCBV.HE, €53.75, NEUTRAL, TP €52.0) China Communications Construction Co Ltd (1800.HK, HK$9.93) China Merchant Holdings (0144.HK, HK$24.15) Columbus McKin (CMCO.OQ, $37.97) Descartes (DSG.TO, C$35.27) Descartes (DSGX.OQ, $28.1) Electrolux (ELUXb.ST, Skr283.5) GEA Group (G1AG.DE, €38.905) Geberit (GEBN.S, SFr463.6) Hutchison Port Holdings Trust (HPHT.SI, $0.435) Hyster Yale Mat (HY.N, $78.57) ICTSI Jasa Prima (KARW.JK, Rp135) Kito (6409.T, ¥1,440) Kone Corporation (KNEBV.HE, €45.58) Konecranes (KCRA.HE, €38.64, OUTPERFORM, TP €43.0) Liebherr (Unlisted) Metso (METSO.HE, €31.28) NZP (601018.SS, Rmb5.87) Palfinger (PLFRY.PK, $28.8) Palfinger (PALF.VI, €38.58) Rolls-Royce (RR.L, 921.0p) SKF (SKFb.ST, Skr178.2) Sandvik (SAND.ST, Skr143.4) Sany Heavy Industry Co (600031.SS, Rmb7.65) Schindler-Holding AG (SCHP.S, SFr217.6) Shanghai International Port Co.,Ltd (600018.SS, Rmb6.69) Siemens (SIEGn.DE, €119.5) TTS Group (TTSMEUR.PAp, €119.5) TTS Group (TTSM.OL, Nkr3.94) Terex Corporation (TEX.N, $45.43) The Manitowoc Company, Inc (MTW.N, $9.52) Wartsila (WRT1V.HE, €60.7) ZPMC (600320.SS, Rmb5.39) ZPMC (900947.SS, $0.538)
Disclosure Appendix
Analyst Certification Leo Carrington, Andre Kukhnin, CFA, Max Yates, Artem Tokarenko and Iris Zheng each certify, with respect to the companies or securities that the individual analyzes, that (1) the views expressed in this report accurately reflect his or her personal views about all of the subject companies and securities and (2) no part of his or her compensation was, is or will be directly or indirectly related to the specific recommendations or views expressed in this report.
3-Year Price and Rating History for China Communications Construction Co Ltd (1800.HK)
1800.HK Closing Price Target Price
Date (HK$) (HK$) Rating
23-Oct-14 5.71 6.00 N
06-Nov-14 6.70 9.00 O
30-Mar-15 11.42 13.70
28-Apr-15 15.12 18.80
31-Aug-15 9.22 11.80
25-Feb-16 7.06 9.80
29-Mar-16 8.51 10.60
26-Apr-16 9.13 11.40
29-Mar-17 11.08 13.70
* Asterisk signifies initiation or assumption of coverage.
The analyst(s) responsible for preparing this research report received Compensation that is based upon various factors including Credit Suisse's total revenues, a portion of which are generated by Credit Suisse's investment banking activities
As of December 10, 2012 Analysts’ stock rating are defined as follows: Outperform (O) : The stock’s total return is expected to outperform the relevant benchmark* over the next 12 months. Neutral (N) : The stock’s total return is expected to be in line with the relevant benchmark* over the next 12 months. Underperform (U) : The stock’s total return is expected to underperform the relevant benchmark* over the next 12 months. *Relevant benchmark by region: As of 10th December 2012, Japanese ratings are based on a stock’s total return relative to the analyst's coverage universe which consists of all companies covered by the analyst within the relevant sector, with Outperforms representing the most attractiv e, Neutrals the less attractive, and Underperforms the least attractive investment opportunities. As of 2nd October 2012, U.S. an d Canadian as well as European ratings are based on a stock’s total
N EU T RA L
O U T PERFO RM

9 October 2017
European Cranes 117
return relative to the analyst's coverage universe which consists of all companies covered by the analyst within the relevant sector, with Outperforms representing the most attractive, Neutrals the less attractive, and Underperforms the least attractive investment opportunities. For Latin American and non -Japan Asia stocks, ratings are based on a stock’s total return relative to the average total return of the relevant country or regional b enchmark; prior to 2nd October 2012 U.S. and Canadian ratings were based on (1) a stock’s absolute total return potential to its current share price and (2) the relative attractiv eness of a stock’s total return potential within an analyst’s coverage universe. For Australian and New Zealand stocks, the expected total return (ETR) calculation includes 12 -month rolling dividend yield. An Outperform rating is assigned where an ETR is greater than or equal to 7.5%; Underperform where an ETR less than or equal to 5%. A Neutral may be assigned where the ETR is between -5% and 15%. The overlapping rating range allows analysts to assign a rating that puts ETR in the context of associated risks. Prior to 18 May 2015, ETR ranges for Outperform and Underperform ratings did not overlap with Neutral thresholds between 15% and 7.5%, which was in operation from 7 July 2011. Restricted (R) : In certain circumstances, Credit Suisse policy and/or applicable law and regulations preclude certain types of communications, including an investment recommendation, during the course of Credit Suisse's engagement in an investment banking transaction and in certain other circumstances. Not Rated (NR) : Credit Suisse Equity Research does not have an investment rating or view on the stock or any other securities related to the company at this time. Not Covered (NC) : Credit Suisse Equity Research does not provide ongoing coverage of the company or offer an investment rating or investment view on the equity security of the company or related products.
Volatility Indicator [V] : A stock is defined as volatile if the stock price has moved up or down by 20% or more in a month in at least 8 of the past 24 months or the analyst expects significant volatility going forward.
Analysts’ sector weightings are distinct from analysts’ stock ratings and are based on the analyst’s expectations for the fundamentals and/or valuation of the sector* relative to the group’s historic fundamentals and/or valuation: Overweight : The analyst’s expectation for the sector’s fundamentals and/or valuation is favorable over the next 12 months. Market Weight : The analyst’s expectation for the sector’s fundamentals and/or valuation is neutral over the next 12 months. Underweight : The analyst’s expectation for the sector’s fundamentals and/or valuation is cautious over the next 12 months. *An analyst’s coverage sector consists of all companies covered by the analyst within the relevant sector. An analyst may cov er multiple sectors.
Credit Suisse's distribution of stock ratings (and banking clients) is:
Global Ratings Distribution
Rating Versus universe (%) Of which banking clients (%) Outperform/Buy* 45% (64% banking clients)
Neutral/Hold* 40% (58% banking clients) Underperform/Sell* 13% (53% banking clients) Restricted 2%
*For purposes of the NYSE and FINRA ratings distribution disclosure requirements, our stock ratings of Outperform, Neutral, a nd Underperform most closely correspond to Buy, Hold, and Sell, respectively; however, the meanings are not the same, as our stock ratings are determined on a relative basis. (Please refer to definitions above.) An investor's decision to buy or sell a security should be based on investment objectives, current holdin gs, and other individual factors.
Important Global Disclosures Credit Suisse’s research reports are made available to clients through our proprietary research portal on CS PLUS. Credit Suisse research products may also be made available through third-party vendors or alternate electronic means as a convenience. Certain research products are only made available through CS PLUS. The services provided by Credit Suisse’s analysts to clients may depend on a specific client’s preferences regarding the frequency and manner of receiving communications, the client’s risk profile and investment, the size and scope of the overall client relationship with the Firm, as well as legal and regulatory constraints. To access all of Credit Suisse’s research that you are entitled to receive in the most timely manner, please contact your sales representative or go to https://plus.credit-suisse.com . Credit Suisse’s policy is to update research reports as it deems appropriate, based on developments with the subject company, the sector or the market that may have a material impact on the research views or opinions stated herein. Credit Suisse's policy is only to publish investment research that is impartial, independent, clear, fair and not misleading. For more detail please refer to Credit Suisse's Policies for Managing Conflicts of Interest in connection with Investment Research: https://www.credit-suisse.com/sites/disclaimers-ib/en/managing-conflicts.html . Credit Suisse does not provide any tax advice. Any statement herein regarding any US federal tax is not intended or written to be used, and cannot be used, by any taxpayer for the purposes of avoiding any penalties. Credit Suisse has decided not to enter into business relationships with companies that Credit Suisse has determined to be involved in the development, manufacture, or acquisition of anti-personnel mines and cluster munitions. For Credit Suisse's position on the issue, please see https://www.credit-suisse.com/media/assets/corporate/docs/about-us/responsibility/banking/policy-summaries-en.pdf .
Target Price and Rating Valuation Methodology and Risks: (12 months) for Cargotec (CGCBV.HE)
Method: Our Neutral rating is based on valuation, which we see as fair, with the stock trading in-line with our EUR52 target price. Our EUR52 target price is based on our discounted cash flow model. We base our terminal value on year-ten cash flow using modelled forecasts in years 1-3, and mid-term assumptions in years 4-10 discounting 3.5% mid-cycle growth rate, 9.0% through-cycle margin, 8% WACC and 85% cash conversion. We use a terminal growth rate of 2% and an invested capital growth rate of 2%.
Risk: Upside risk to the EUR52 target price and Neutral rating is an unexpected rapid recovery in the marine (MacGregor) division. Downside risk to the EUR52 target price and Neutral rating are 1) an unexpected stagnation in the European or North American residential housing markets, 2) an extended downturn in port operator capex or 3) no acceleartion in the service businesses despite clear management focus.

9 October 2017
European Cranes 118
Target Price and Rating Valuation Methodology and Risks: (12 months) for Konecranes (KCRA.HE)
Method: Outperform rating is based on the upside indicated by our target price, as well as Konecranes being our favoured way to play a return to growth in port operator CapEx, port automation and industry concentration. Our DCF gives a target price of EUR43 - we base our terminal value on year-ten cash flow using modelled forecasts in years 1-3, and mid-term assumptions in years 4-10 discounting 3.5% mid-cycle growth rate, 10.5% through-cycle margin, 8% WACC and 80% cash conversion. We use a terminal growth rate of 2% and an invested capital growth rate of 2%.
Risk: Upside risks to the Outperform rating and EUR43 target price are; 1) better than guided synergies progress in either timing or amount 2) improvements to the growth environment due to either a better end market outlook or unexpected sales synergies following industry concentration. Downside risk to the outperform rating and EUR43 target price is principally unexpected lower run-rate of synergies announced, or the loss of pricing power in either the Port Equipment or Industrial Crane end market.
Please refer to the firm's disclosure website at https://rave.credit-suisse.com/disclosures/view/selectArchive for the definitions of abbreviations typically used in the target price method and risk sections.
See the Companies Mentioned section for full company names Credit Suisse currently has, or had within the past 12 months, the following as investment banking client(s): KCRA.HE, 1800.HK Credit Suisse currently has, or had within the past 12 months, the following issuer(s) as client(s), and the services provided were non-investment-banking, securities-related: 1800.HK Credit Suisse expects to receive or intends to seek investment banking related compensation from the subject company (KCRA.HE, 1800.HK) within the next 3 months. Within the last 12 months, Credit Suisse has received compensation for non-investment banking services or products from the following issuer(s): 1800.HK As of the date of this report, Credit Suisse makes a market in the following subject companies (1800.HK). Credit Suisse or a member of the Credit Suisse Group is a market maker or liquidity provider in the securities of the following subject issuer(s): CGCBV.HE, 1800.HK, KCRA.HE A member of the Credit Suisse Group is party to an agreement with, or may have provided services set out in sections A and B of Annex I of Directive 2014/65/EU of the European Parliament and Council ("MiFID Services") to, the subject issuer (CGCBV.HE, KCRA.HE, 1800.HK) within the past 12 months. Please visit https://credit-suisse.com/in/researchdisclosure for additional disclosures mandated vide Securities And Exchange Board of India (Research Analysts) Regulations, 2014 Credit Suisse may have interest in (APSE.BO) As of the end of the preceding month, Credit Suisse beneficially own 1% or more of a class of common equity securities of (1800.HK).
For date and time of production, dissemination and history of recommendation for the subject company(ies) featured in this report, disseminated within the past 12 months, please refer to the link: https://rave.credit-suisse.com/disclosures/view/report?i=315415&v=sm6c8w24qr26bzhc10nn6ho1 .
Important Regional Disclosures Singapore recipients should contact Credit Suisse AG, Singapore Branch for any matters arising from this research report. The analyst(s) involved in the preparation of this report may participate in events hosted by the subject company, including site visits. Credit Suisse does not accept or permit analysts to accept payment or reimbursement for travel expenses associated with these events. Restrictions on certain Canadian securities are indicated by the following abbreviations: NVS--Non-Voting shares; RVS--Restricted Voting Shares; SVS--Subordinate Voting Shares. Individuals receiving this report from a Canadian investment dealer that is not affiliated with Credit Suisse should be advised that this report may not contain regulatory disclosures the non-affiliated Canadian investment dealer would be required to make if this were its own report. For Credit Suisse Securities (Canada), Inc.'s policies and procedures regarding the dissemination of equity research, please visit https://www.credit-suisse.com/sites/disclaimers-ib/en/canada-research-policy.html. Principal is not guaranteed in the case of equities because equity prices are variable. Commission is the commission rate or the amount agreed with a customer when setting up an account or at any time after that. This research report is authored by: Credit Suisse International ......................................................... Leo Carrington ; Andre Kukhnin, CFA ; Max Yates ; Artem Tokarenko ; Iris Zheng To the extent this is a report authored in whole or in part by a non-U.S. analyst and is made available in the U.S., the following are important disclosures regarding any non-U.S. analyst contributors: The non-U.S. research analysts listed below (if any) are not registered/qualified as research analysts with FINRA. The non-U.S. research analysts listed below may not be associated persons of CSSU and therefore may not be subject to the FINRA 2241 and NYSE Rule 472 restrictions on communications with a subject company, public appearances and trading securities held by a research analyst account. Credit Suisse International ......................................................... Leo Carrington ; Andre Kukhnin, CFA ; Max Yates ; Artem Tokarenko ; Iris Zheng
Important Credit Suisse HOLT Disclosures With respect to the analysis in this report based on the Credit Suisse HOLT methodology, Credit Suisse certifies that (1) the views expressed in this report accurately reflect the Credit Suisse HOLT methodology and (2) no part of the Firm’s compensation was, is, or will be directly related to the specific views disclosed in this report. The Credit Suisse HOLT methodology does not assign ratings to a security. It is an analytical tool that involves use of a set of proprietary quantitative algorithms and warranted value calculations, collectively called the Credit Suisse HOLT valuation model, that are consistently applied to all the

9 October 2017
European Cranes 119
companies included in its database. Third-party data (including consensus earnings estimates) are systematically translated into a number of default algorithms available in the Credit Suisse HOLT valuation model. The source financial statement, pricing, and earnings data provided by outside data vendors are subject to quality control and may also be adjusted to more closely measure the underlying economics of firm performance. The adjustments provide consistency when analyzing a single company across time, or analyzing multiple companies across industries or national borders. The default scenario that is produced by the Credit Suisse HOLT valuation model establishes the baseline valuation for a security, and a user then may adjust the default variables to produce alternative scenarios, any of which could occur. Additional information about the Credit Suisse HOLT methodology is available on request. The Credit Suisse HOLT methodology does not assign a price target to a security. The default scenario that is produced by the Credit Suisse HOLT valuation model establishes a warranted price for a security, and as the third-party data are updated, the warranted price may also change. The default variable may also be adjusted to produce alternative warranted prices, any of which could occur. CFROI®, HOLT, HOLTfolio, ValueSearch, AggreGator, Signal Flag and “Powered by HOLT” are trademarks or service marks or registered trademarks or registered service marks of Credit Suisse or its affiliates in the United States and other countries. HOLT is a corporate performance and valuation advisory service of Credit Suisse.
Important disclosures regarding companies or other issuers that are the subject of this report are available on Credit Suisse’s disclosure website at https://rave.credit-suisse.com/disclosures or by calling +1 (877) 291-2683.

9 October 2017
European Cranes 120
This report is produced by subsidiaries and affiliates of Credit Suisse operating under its Global Markets Division. For more information on our structure, please use the following link: https://www.credit-suisse.com/who-we-are This report may contain material that is not directed to, or intended for distribution to or use by, any person or entity who is a citizen or resident of or located in any locality, state, country or other jurisdiction where such distribution, publication, availability or use would be contrary to law or regulation or which would subject Credit Suisse or its affiliates ("CS") to any registration or licensing requirement within such jurisdiction. All material presented in this report, unless specifically indicated otherwise, is under copyright to CS. None of the material, nor its content, nor any copy of it, may be altered in any way, transmitted to, copied or distributed to any other party, without the prior express written permission of CS. All trademarks, service marks and logos used in this report are trademarks or service marks or registered trademarks or service marks of CS or its affiliates.The information, tools and material presented in this report are provided to you for information purposes only and are not to be used or considered as an offer or the solicitation of an offer to sell or to buy or subscribe for securities or other financial instruments. CS may not have taken any steps to ensure that the securities referred to in this report are suitable for any particular investor. CS will not treat recipients of this report as its customers by virtue of their receiving this report. The investments and services contained or referred to in this report may not be suitable for you and it is recommended that you consult an independent investment advisor if you are in doubt about such investments or investment services. Nothing in this report constitutes investment, legal, accounting or tax advice, or a representation that any investment or strategy is suitable or appropriate to your individual circumstances, or otherwise constitutes a personal recommendation to you. CS does not advise on the tax consequences of investments and you are advised to contact an independent tax adviser. Please note in particular that the bases and levels of taxation may change. Information and opinions presented in this report have been obtained or derived from sources believed by CS to be reliable, but CS makes no representation as to their accuracy or completeness. CS accepts no liability for loss arising from the use of the material presented in this report, except that this exclusion of liability does not apply to the extent that such liability arises under specific statutes or regulations applicable to CS. This report is not to be relied upon in substitution for the exercise of independent judgment. CS may have issued, and may in the future issue, other communications that are inconsistent with, and reach different conclusions from, the information presented in this report. Those communications reflect the different assumptions, views and analytical methods of the analysts who prepared them and CS is under no obligation to ensure that such other communications are brought to the attention of any recipient of this report. Some investments referred to in this report will be offered solely by a single entity and in the case of some investments solely by CS, or an associate of CS or CS may be the only market maker in such investments. Past performance should not be taken as an indication or guarantee of future performance, and no representation or warranty, express or implied, is made regarding future performance. Information, opinions and estimates contained in this report reflect a judgment at its original date of publication by CS and are subject to change without notice. The price, value of and income from any of the securities or financial instruments mentioned in this report can fall as well as rise. The value of securities and financial instruments is subject to exchange rate fluctuation that may have a positive or adverse effect on the price or income of such securities or financial instruments. Investors in securities such as ADR's, the values of which are influenced by currency volatility, effectively assume this risk. Structured securities are complex instruments, typically involve a high degree of risk and are intended for sale only to sophisticated investors who are capable of understanding and assuming the risks involved. The market value of any structured security may be affected by changes in economic, financial and political factors (including, but not limited to, spot and forward interest and exchange rates), time to maturity, market conditions and volatility, and the credit quality of any issuer or reference issuer. Any investor interested in purchasing a structured product should conduct their own investigation and analysis of the product and consult with their own professional advisers as to the risks involved in making such a purchase. Some investments discussed in this report may have a high level of volatility. High volatility investments may experience sudden and large falls in their value causing losses when that investment is realised. Those losses may equal your original investment. Indeed, in the case of some investments the potential losses may exceed the amount of initial investment and, in such circumstances, you may be required to pay more money to support those losses. Income yields from investments may fluctuate and, in consequence, initial capital paid to make the investment may be used as part of that income yield. Some investments may not be readily realisable and it may be difficult to sell or realise those investments, similarly it may prove difficult for you to obtain reliable information about the value, or risks, to which such an investment is exposed. This report may provide the addresses of, or contain hyperlinks to, websites. Except to the extent to which the report refers to website material of CS, CS has not reviewed any such site and takes no responsibility for the content contained therein. Such address or hyperlink (including addresses or hyperlinks to CS's own website material) is provided solely for your convenience and information and the content of any such website does not in any way form part of this document. Accessing such website or following such link through this report or CS's website shall be at your own risk.
This report is issued and distributed in European Union (except Switzerland): by Credit Suisse Securities (Europe) Limited, One Cabot Square, London E14 4QJ, England, which is authorised by the Prudential Regulation Authority and regulated by the Financial Conduct Authority and the Prudential Regulation Authority. Germany: Credit Suisse Securities (Europe) Limited Niederlassung Frankfurt am Main regulated by the Bundesanstalt fuer Finanzdienstleistungsaufsicht ("BaFin"). United States and Canada: Credit Suisse Securities (USA) LLC; Switzerland: Credit Suisse AG; Brazil: Banco de Investimentos Credit Suisse (Brasil) S.A or its affiliates; Mexico: Banco Credit Suisse (México), S.A. (transactions related to the securities mentioned in this report will only be effected in compliance with applicable regulation); Japan: by Credit Suisse Securities (Japan) Limited, Financial Instruments Firm, Director-General of Kanto Local Finance Bureau ( Kinsho) No. 66, a member of Japan Securities Dealers Association, The Financial Futures Association of Japan, Japan Investment Advisers Association, Type II Financial Instruments Firms Association; Hong Kong: Credit Suisse (Hong Kong) Limited; Australia: Credit Suisse Equities (Australia) Limited; Thailand: Credit Suisse Securities (Thailand) Limited, regulated by the Office of the Securities and Exchange Commission, Thailand, having registered address at 990 Abdulrahim Place, 27th Floor, Unit 2701, Rama IV Road, Silom, Bangrak, Bangkok10500, Thailand, Tel. +66 2614 6000; Malaysia: Credit Suisse Securities (Malaysia) Sdn Bhd; Singapore: Credit Suisse AG, Singapore Branch; India: Credit Suisse Securities (India) Private Limited (CIN no.U67120MH1996PTC104392) regulated by the Securities and Exchange Board of India as Research Analyst (registration no. INH 000001030) and as Stock Broker (registration no. INB230970637; INF230970637; INB010970631; INF010970631), having registered address at 9th Floor, Ceejay House, Dr.A.B. Road, Worli, Mumbai - 18, India, T- +91-22 6777 3777; South Korea: Credit Suisse Securities (Europe) Limited, Seoul Branch; Taiwan: Credit Suisse AG Taipei Securities Branch; Indonesia: PT Credit Suisse Sekuritas Indonesia; Philippines:Credit Suisse Securities (Philippines ) Inc., and elsewhere in the world by the relevant authorised affiliate of the above. Additional Regional Disclaimers Hong Kong: Credit Suisse (Hong Kong) Limited ("CSHK") is licensed and regulated by the Securities and Futures Commission of Hong Kong under the laws of Hong Kong, which differ from Australian laws. CSHKL does not hold an Australian financial services licence (AFSL) and is exempt from the requirement to hold an AFSL under the Corporations Act 2001 (the Act) under Class Order 03/1103 published by the ASIC in respect of financial services provided to Australian wholesale clients (within the meaning of section 761G of the Act). Research on Taiwanese securities produced by Credit Suisse AG, Taipei Securities Branch has been prepared by a registered Senior Business Person. Australia (to the extent services are offered in Australia): Credit Suisse Securities (Europe) Limited (“CSSEL”) and Credit Suisse International (“CSI”) are authorised by the Prudential Regulation Authority and regulated by the Financial Conduct Authority (“FCA”) and the Prudential Regulation Authority under UK laws, which differ from Australian Laws. CSSEL and CSI do not hold an Australian Financial Services Licence (“AFSL”) and are exempt from the requirement to hold an AFSL under the Corporations Act (Cth) 2001 (“Corporations Act”) under Class Order 03/1099 published by the Australian Securities and Investments Commission (“ASIC”), in respect of the financial services provided to Australian wholesale clients (within the meaning of section 761G of the Corporations Act). This material is not for distribution to retail clients and is directed exclusively at Credit Suisse's professional clients and eligible counterparties as defined by the FCA, and wholesale clients as defined under section 761G of the Corporations Act. Credit Suisse (Hong Kong) Limited (“CSHK”) is licensed and regulated by the Securities and Futures Commission of Hong Kong under the laws of Hong Kong, which differ from Australian laws. CSHKL does not hold an AFSL and is exempt from the requirement to hold an AFSL under the Corporations Act under Class Order 03/1103 published by the ASIC in respect of financial services provided to Australian wholesale clients (within the meaning of section 761G of the Corporations Act). Credit Suisse Securities (USA) LLC (CSSU) and Credit Suisse Asset Management LLC (CSAM LLC) are licensed and regulated by the Securities Exchange Commission of the United States under the laws of the United States, which differ from Australian laws. CSSU and CSAM LLC do not hold an AFSL and is exempt from the requirement to hold an AFSL under the Corporations Act under Class Order 03/1100 published by the ASIC in respect of financial services provided to Australian wholesale clients (within the meaning of section 761G of the Corporations Act). Malaysia: Research provided to residents of Malaysia is authorised by the Head of Research for Credit Suisse Securities (Malaysia) Sdn Bhd, to whom they should direct any queries on +603 2723 2020. Singapore: This report has been prepared and issued for distribution in Singapore to institutional investors, accredited investors and expert investors (each as defined under the Financial Advisers Regulations) only, and is also distributed by Credit Suisse AG, Singapore Branch to overseas investors (as defined under the Financial Advisers Regulations). Credit Suisse AG, Singapore Branch may distribute reports produced by its foreign entities or affiliates pursuant to an arrangement under Regulation 32C of the Financial Advisers Regulations. Singapore recipients should contact Credit Suisse AG, Singapore Branch at +65-6212-2000 for matters arising from, or in connection with, this report. By virtue of your status as an institutional investor, accredited investor, expert investor or overseas investor, Credit Suisse AG, Singapore Branch is exempted from complying with certain compliance requirements under the Financial Advisers Act, Chapter 110 of Singapore (the “FAA”), the Financial Advisers Regulations and the relevant Notices and Guidelines issued thereunder, in respect of any financial advisory service which Credit Suisse AG, Singapore Branch may provide to you. UAE: This information is being distributed by Credit Suisse AG (DIFC Branch), duly licensed and regulated by the Dubai Financial Services Authority (“DFSA”). Related financial services or products are only made available to Professional Clients or Market Counterparties, as defined by the DFSA, and are not intended for any other persons. Credit Suisse AG (DIFC Branch) is located on Level 9 East, The Gate Building, DIFC, Dubai, United Arab Emirates. EU: This report has been produced by subsidiaries and affiliates of Credit Suisse operating under its Global Markets Division In jurisdictions where CS is not already registered or licensed to trade in securities, transactions will only be effected in accordance with applicable securities legislation, which will vary from jurisdiction to jurisdiction and may require that the trade be made in accordance with applicable exemptions from registration or licensing requirements. Non-US customers wishing to effect a transaction should contact a CS entity in their local jurisdiction unless governing law permits otherwise. US customers wishing to effect a transaction should do so only by contacting a representative at Credit Suisse Securities (USA) LLC in the US. Please note that this research was originally prepared and issued by CS for distribution to their market professional and institutional investor customers. Recipients who are not market professional or institutional investor customers of CS should seek the advice of their independent financial advisor prior to taking any investment decision based on this report or for any necessary explanation of its contents. This research may relate to investments or services of a person outside of the UK or to other matters which are not authorised by the Prudential Regulation Authority and regulated by the Financial Conduct Authority and the Prudential Regulation Authority or in respect of which the protections of the Prudential Regulation Authority and Financial Conduct Authority for private customers and/or the UK compensation scheme may not be available, and further details as to where this may be the case are available upon request in respect of this report. CS may provide various services to US municipal entities or obligated persons ("municipalities"), including suggesting individual transactions or trades and entering into such transactions. Any services CS provides to municipalities are not viewed as "advice" within the meaning of Section 975 of the Dodd-Frank Wall Street Reform and Consumer Protection Act. CS is providing any such services and related information solely on an arm's length basis and not as an advisor or fiduciary to the municipality. In connection with the provision of the any such services, there is no agreement, direct or indirect, between any municipality (including the officials,management, employees or agents thereof) and CS for CS to provide advice to the municipality. Municipalities should consult with their financial, accounting and legal advisors regarding any such services provided by CS. In addition, CS is not acting for direct or indirect compensation to solicit the municipality on behalf of an unaffiliated broker, dealer, municipal securities dealer, municipal advisor, or investment adviser for the purpose of obtaining or retaining an engagement by the municipality for or in connection with Municipal Financial Products, the issuance of municipal securities, or of an investment adviser to provide investment advisory services to or on behalf of the municipality. If this report is being distributed by a financial institution other than Credit Suisse AG, or its affiliates, that financial institution is solely responsible for distribution. Clients of that institution should contact that institution to effect a transaction in the securities mentioned in this report or require further information. This report does not constitute investment advice by Credit Suisse to the clients of the distributing financial institution, and neither Credit Suisse AG, its affiliates, and their respective officers, directors and employees accept any liability whatsoever for any direct or consequential loss arising from their use of this report or its content. Principal is not guaranteed. Commission is the commission rate or the amount agreed with a customer when setting up an account or at any time after that. No information or communication provided herein or otherwise is intended to be, or should be construed as, a recommendation within the meaning of the US Department of Labor’s final regulation defining "investment advice" for purposes of the Employee Retirement Income Security Act of 1974, as amended and Section 4975 of the Internal Revenue Code of 1986, as amended, and the information provided herein is intended to be general information, and should not be construed as, providing investment advice (impartial or otherwise). Copyright © 2017 CREDIT SUISSE AG and/or its affiliates. All rights reserved.
Investment principal on bonds can be eroded depending on sale price or market price. In addition, there are bonds on which investment principal can be eroded due to changes in redemption amounts. Care is required when investing in such instruments. When you purchase non-listed Japanese fixed income securities (Japanese government bonds, Japanese municipal bonds, Japanese government guaranteed bonds, Japanese corporate bonds) from CS as a seller, you will be requested to pay the purchase price only.