european comparability and national best ... - statistik
TRANSCRIPT

European Comparability and National Best Practices of EU-SILC:
A Review of Data Collection and Coherence of the Longitudinal Component
THOMAS GLASER, ELISABETH KAFKA, NADJA LAMEI, LARS LYBERG, MATTHIAS TILL
Working Paper 5/2015

InformationThe General Information Service of STATISTICS AUSTRIA is available for any questions, either in written form or by telephone, at the following address:Guglgasse 13, 1110 Vienna Tel.: +43 (1) 711 28-7070 e-mail: [email protected] Fax: +43 (1) 715 68 28
Publisher and producerSTATISTICS AUSTRIA Federal Institution under Public Law Guglgasse 13, 1110 Vienna
Editor in chargeFranz Ferdinand Eiffe and Matthias Till
LayoutWaltraud Unger
Authors:Thomas Glaser, Elisabeth Kafka, Nadja Lamei (all Statistics Austria), Lars Lyberg (University of Stockholm), Matthias Till (Statistics Austria)
Contact: [email protected] or [email protected]
This work has been supported by the second Network for the analysis of EU-SILC (NetSILC2), funded by Eurostat. The European Commission bears no responsibility for the analyses and conclusions, which are solely those of the authors.
This work package draws from close collaboration and exchange with other National Statistical Institutes and Net-SILC2 partners. In particular, those partners working on sampling and tracing rules were consulted about potential fields of further enquiry and evaluation of certain fieldwork strategies. We’d like to thank all of them for their helpful comments and fruitful cooperation. Thanks to Tony Atkinson, Sigita Grundiza, Eric Marlier and Mateja Petrusevic for their valuable input. All remaining errors are our own.
DISCLAIMERThe views and opinions expressed in this publication are those of the authors and do not necessarily reflect the views of the Statistics Austria.
© STATISTIK AUSTRIA Vienna, 2015

Content
1 Introduction ................................................................................................................ 51.1 Questions covered and structure of the report ......................................................................51.2 Methods .........................................................................................................................................6
2 Quality standards to ensure comparability, coherence, and accuracy of longitudinal data .................................................................................. 72.1 General Quality Criteria for European Social Statistics and EU-SILC ..................................72.2 Longitudinal survey design ..................................................................................................... 11
3 Strengths and weaknesses in key processes and control mechanisms of EU-SILC in Member States .......................................................... 133.1 Risks associated with different error sources .......................................................................143.2 Aspects of measurement and nonresponse error ...............................................................15
4 Coherence of cross-sectional and longitudinal estimates in EU-SILC ............. 274.1 Coherence of longitudinal and cross-sectional estimates in different
EU countries ................................................................................................................................284.2 Unit nonresponse and coherence ...........................................................................................304.3 Weighting and coherence ........................................................................................................314.4 Indicator of representativeness and coherence ...................................................................334.5 Coherence by multiple predictors ..........................................................................................354.6 Conclusions .................................................................................................................................36
5 Summary of recommendations to reach best practice ..................................... 365.1 Recommendations to ensure comparability of estimates between
Member States............................................................................................................................365.2 Recommendations to minimise nonresponse bias .............................................................375.3 Recommendations for enhancing coherence between cross-sectional and
longitudinal estimates ..............................................................................................................385.4 Recommendations for reducing measurement error .........................................................38
6 References ................................................................................................................. 41
4 EuropEan Comparability and national bEst praCtiCEs of Eu-silC
Abstract
All best practices on comparative surveys indicate that guidelines alone do not automatically ensure accuracy and comparability. Comparative statistical products depend crucially on process quality. The inventory of EU-SILC field-work practices presented in this paper shows that these processes vary enormously between Member States. Even nationally, optimal designs may thus fail to deliver comparability. The situation is aggravated by the fact that EU-SILC integrates several collections, one cross-sectional and several longitudinal of varying duration. They were designed to give answers to different questions, in particular measures of poverty at one point in time and sequences of poverty over time. If, however, the same cross-sectional indicators would be obtained from each component of EU-SILC they would be expected to give coherent results. Nonetheless, we observe discrepancies of hugely varying degree between Member States. In accordance with the ESS Vision 2020 this paper therefore argues for a new regime of “controlled flex-ibility” of harmonisation, including infrastructures which assist Member States in the design and control of their work.
EuropEan Comparability and national bEst praCtiCEs of Eu-silC 5
1 Introduction
This paper aims to document and present recommendations on existing field work practices for EU-SILC and their relation to the coherence of the Europe 2020 social inclusion target indicators. The approach combines two comple-mentary perspectives:
• A data user’s perspective and • A data producer’s perspective.
The study focuses on the fieldwork process and data collection as represented in the EU-SILC operation 2009 and the resulting Eurostat User Data base of 2009. 1 Those two perspectives which were originally addressed as two separate tasks of our project, are here presented together in order to get a broader picture and derive practical recommendations.
EU-SILC is a cross-sectional data collection with a longitudinal component. Usually the latter is a subsample of a cross-sec-tional sample survey (i.e. the longitudinal component is integrated). It is possible to obtain estimates for social inclu-sion indicators from both longitudinal and cross-sectional data. The cross-sectional component fully represents the cross-sectional target population and is generally the more accurate reference for estimates on the situation in any particular year. The longitudinal component complements current living conditions with trajectories over time. Thus, it informs on patterns of persistence, recurrence and change. Additionally, the longitudinal component enhances pre-cision of estimates for annual change. Inevitably, the results obtained from the longitudinal subsample differ from the full cross- sectional sample but these discrepancies should be within plausible limits.
In the paper at hand we present first conclusions on coherence within EU-SILC components. More concretely, we focus on the at-risk-of-poverty rate (at 60% of the median equivalised income) and scrutinise potential causes for high and low coherence between cross-sectional and longitudinal estimates (over two years).
1.1 Questions covered and structure of the report
The subsequent chapter 2 discusses by which quality standards we may identify best practice. These criteria con-sider the established quality framework of the European Statistical System as well as the international experience in the field of survey research in view of the specificity of longitudinal data and the particular design of the longitudinal component within EU-SILC operations. Against this framework we identified three key parameters to evaluate best practice for longitudinal data:
• comparability • coherence • accuracy
We aimed to identify best practices in data collection and facilitate information exchange on data collection meth-ods. A factor which is crucial in the design of EU-SILC is that it is an output harmonised survey. This results in a vari-ety of data collection techniques to be practiced in the Member States. Chapter 3 addresses the question of the main strengths and weaknesses in key processes and control mechanisms that can be recognised in these national EU-SILC operations. This is based on a review of methodological analysis and national quality reports. The aim was to verify, augment or adapt the metadata frame which is currently under development at Eurostat to compare national data collections. Further details on fieldwork were collected from Member States through a dedicated questionnaire. A standardised frame was set up to categorise this complementary information. The so called “Inventory on fieldwork
1) The Inventory on field-work practice and the calculation of the degree of coherence between cross-sectional and longitudinal samples as well as any numbers on response etc. presented here refer to EU-SILC 2009. This means that any developments after that period are not accounted for in this report or are only mentioned in short. This is due to the availability of Quality Reports in the timeframe of this Net-SILC2 project. The User Databases of EU-SILC, i.e. the micro-data files of the cross-sectional as well as the longitudinal component, are available for scien-tific users via Eurostat, see: http://ec.europa.eu/eurostat/web/microdata/european_union_statistics_on_income_and_living_conditions (retrieved 2015-02-06)

6 EuropEan Comparability and national bEst praCtiCEs of Eu-silC
procedures” is here used to present national fieldwork practices and evaluate them with a view to the issues of non-response and measurement error.2
Chapter 4 deals with coherence between longitudinal and cross-sectional estimates obtained from EU-SILC 2009. This chapter is tapping on the question how observed differences in coherence are related to:
• the extent of nonresponse,• selectivity of nonresponse, • weights.
To ascertain the plausible degree of required consistency we estimated the potential impact of population change and sampling errors. Thereby, we focussed in particular on those five countries with the highest and five countries with the lowest discrepancies of the at-risk-of poverty indicator. The observed inconsistencies were compared to the poten-tial impact of population change and sampling errors. To ascertain the extent to which coherent estimates require widely dispersed weighting factors we specifically look at coefficients of variation of longitudinal and base weights. Also we calculated the so-called R-indicator3 on the unbiased estimation of variables relevant to the definition of the Europe 2020 social inclusion target group.
The final chapter presents a synthesis of both tasks and entails key recommendations for EU-SILC for minimising non-response bias and measurement error as well as ensuring comparability and coherence between cross-sectional and longitudinal estimates.
1.2 Methods
The material for this report comes from different sources: metadata on EU-SILC 2009 have been primarily obtained from the national and European Comparative Quality Reports (FQR, IQR, ECQR). A questionnaire on fieldwork proce-dures was developed by Statistics Austria and sent out to Member states in the end of 2012. It collected additional information along the following dimensions:
• Set-up of the questionnaire (pre-test, implementation, lists, languages)• Modes of data collection: CATI/CAPI/PAPI/CAWI/mixed mode• Organisation of interviewers and interviewing: training, number, level of control, legal status• Gaining and maintaining cooperation: incentives, information for respondents, contact information and con-
tact rules• Panel management: technical implementation, implementation of tracking, panel attrition• Other factors (sample frame, procedural changes)• Factors not considered (sampling, ...)
Additional information on longitudinal tracing rules came from a Eurostat questionnaire.4
Input from the analysis of EU-SILC 2009 UDB data was used to identify countries with lower and higher coherence com-pared to the average. As a final step, in-depth interviews were conducted with survey and fieldwork managers in five
2) The inventory is implemented as a Microsoft Access Data Base which can be downloaded at: http://www.statistik.at/web_de/frageboegen/private_haushalte/eu_silc/071274.html (retrieved 2015-02-06)
3) Statistics Netherlands has coordinated a 7th framework project which produced a software to calculate a standardised indicator of repre-sentativeness (R-indicator). Partners were NSIs from Norway and Slovenia, and the Universities of Southampton and Leuven http://www.risq-project.eu/ (retrieved 2015-02-06)
4) The longitudinal component of EU-SILC: Survey of NSIs, conducted by the Institute for Social and Economic Research at the University of Essex in 2012.

EuropEan Comparability and national bEst praCtiCEs of Eu-silC 7
Member States.5 The metadata collected by Statistics Austria has been validated by the countries’ EU-SILC-teams and a final version of the “Inventory on fieldwork procedures” was produced. This was implemented as a Microsoft Access database. The database is a prototype which illustrates for the operation 2009 how differences in national fieldwork practices may be easily identified and further analysed. It is available for download at Statistics Austria’s Website.6
2 Quality standards to ensure comparability, coherence, and accuracy of longitudinal data
In the original work plan for this study, a set of operational criteria should have been developed from which best prac-tice could be identified in a straightforward manner. From these, ideally, a number of best performing Member States would have been found and presented as role models to which other Member States could compare themselves. This undertaking was only in part successful. Upon careful reflection, it has been found that the most serious challenge for EU-SILC is comparability. Even if each Member State had found its own optimal solution- which is clearly not the case – variation of methods would still imply a quality deficit from comparative perspective. The conflict between best practice and comparability is of a general nature and not limited to social statistics. The subsequent sections intro-duce quality standards for comparative statistics and explain in particular its relevance for the design of longitudinal data such as EU-SILC.
2.1 General Quality Criteria for European Social Statistics and EU-SILC
Increasing abundance of data over the last decades implies a pressure on official statistics. It is essential to distinguish quality information from the ubiquitous administrative and digital traces of human and business conduct on one side and arbitrary “polls” on the other side. In view of the cost involved with generating quality information, quality guide-lines are employed to ensure users of the value of their statistical products by nearly all organisations dealing with data and social statistics in particular. Thereby, quality can be defined along different dimensions, some of which are recurring in many approaches.
Notwithstanding the criteria expressed in relevant documents7, Eurostat (2014) recognises a graded approach to qual-ity in the European Statistical System related to the increasing importance of statistics for European governance:
“In reality, the quality of statistics is neither one-dimensional nor absolute. Instead, it has to be understood as a rela-tive concept, the products’ characteristics being defined in relation to users’ needs. As with other products, statistical information has to be ‘fit for purpose’ and this approach, leading to differentiated quality assurance (for statistics for direct policy use, standard and experimental statistics), emerges from continuous optimisation and learning in close interaction with users.”
General principles are performed and substantiated by quality guidelines for individual statistics. Originally, EU-SILC has been designed for a standard quality operation. Clearly it is not linked to any direct policy decision of the kinds typically found in the context of fiscal surveillance. But today it may be seen as a little bordering upon such level given its increased relevance for thematic coordination within the Europe 2020 growth strategy and its prominent headline target on the reduction of the number of people at-risk-of-poverty or social exclusion.
5) The countries chosen were Portugal, Sweden, France, the Netherlands and Slovakia. The first four were interviewed by telephone in March-April 2014; Slovakia provided information in written form.
6) http://www.statistik.at/web_de/frageboegen/private_haushalte/eu_silc/071274.html (retrieved 2015-02-06)
7) Those are The European Statistics Code of Practice and the Quality Assurance Framework of the European Statistical System (ESS QAF). See http://ec.europa.eu/eurostat/web/quality (retrieved 2015-02-06)
8 EuropEan Comparability and national bEst praCtiCEs of Eu-silC
An overview of the common quality criteria which are used by selected organisations and how they relate to the pres-ent quality framework of EU-SILC has been presented by Verma (2007). Essentially, the present Commission Regula-tion on EU-SILC annual quality reporting reinforces the main quality principles of European Statistics (ES) as follows8:
• Relevance: ES must meet the needs of users
• Accuracy and reliability: ES must accurately and reliably portray reality
• Timeliness and punctuality: ES must be disseminated in a timely and punctual manner
• Coherence and comparability: ES should be consistent internally, over time and comparable between regions and countries; it should be possible to combine and make joint use of related data from different sources
• Accessibility and clarity: ES should be presented in a clear and understandable form, disseminated in a suitable and convenient manner, available and accessible on an impartial basis with supporting metadata and guidance
EU-SILC regulations require quality reports in and intermediary and final version, which are produced at both EU and national level each year. For EU-SILC 2009 two separate reports, the intermediate quality report and final quality report were required.9 The intermediate quality report focused on the cross-sectional operation while the final one included also information on the longitudinal operation. Although these reports are publicly available through Eurostat’s web-site they may seem too detailed for some purposes. For the immediate attention of the users of statistical indicators Eurostat also provides thorough documentation in meta-data sheets attached to each indicator.10
While the ESS quality framework puts emphasis on statistical products and indicators, survey methodology (Lyberg and Biemer 2008, p428ff.) stresses a quality as based on three-levels:
• product quality• process quality• organisational quality aspects
The most critical of these is process quality which directly determines product quality. This is all about survey design, quality assurance and quality control. In turn, process quality reflects organisational quality. Seen in this light the work presented here relates most strongly to process quality and its implication on the quality of the final EU-SILC data but also aspects of organisational quality and product quality will be reflected in our recommendations.
EU-SILC is an output harmonised survey. It is not totally clear what that entails other than the fact that participating countries are given almost complete freedom to arrive at the specified statistical goals in terms of parameter esti-mates and other statistical products and their associated quality characteristics. If EU-SILC were an input harmonised survey some of the survey steps would be standardised, albeit not all of them. In practice, surveys conducted within the European Statistical System are a mix of input and output harmonisation. For instance, in the EU-SILC case coun-tries are required to use probability sampling and some question response alternatives are specified in a detailed way. Output harmonisation makes it extremely difficult to achieve strict comparability between countries. Certain varia-tions in the field procedures are impossible to account for at the output stage. In a worst case for example, the cog-nitive content of a question will vary so much across Member States that the aggregation of target variables would come next to mixing apples and pears.
8) COMMISSION REGULATION (EC) No 28/2004 of 5 January 2004 implementing Regulation (EC) No 1177/2003 of the European Parliament and of the Council concerning Community statistics on income and living conditions (EU-SILC) as regards the detailed content of intermediate and final quality reports.
9) In the course of EU-SILC 2011 quality reporting guidelines were renewed in order to be in line with the ESS standard for quality reports struc-ture (ESQRS). From EU-SILC 2011 onwards quality reports are delivered in electronic form via the ESS metadata handler in two phases (ESQRS version 1 and ESQRS version 2).
10) See http://ec.europa.eu/eurostat/cache/metadata/en/ilc_esms.htm (retrieved 2015-02-06)

EuropEan Comparability and national bEst praCtiCEs of Eu-silC 9
By all standards EU-SILC is an example of an international social survey in the same vein as, for instance, the European Social Survey, the Eurobarometer, and the Programme for International Assessment of Adult Competences (PIAAC). During the last 20 years these and similar international longitudinal surveys have benefited from development work that has taken place within these surveys and also within the continuing workshop on Comparative Survey Design and Implementation (CSDI). Slowly a best practice for these kinds of surveys has emerged and is described in Hark-ness et al 2010 and in the Cross Cultural Survey Guidelines11.
The main message from this comparative research is that just providing instructions to participating survey organisa-tions is not sufficient to obtain good accuracy and good comparability. Collective experience confirms that the suc-cess in an international survey depends crucially on specific quality assurance and quality control measures. Without an infrastructure that can assist countries in their design and control work this is very hard to accomplish. Compara-bility in process quality may hence be a case for those “centres of excellence” which have already been suggested in a strategic paper for the European Statistical System, the ESS Vision 2020.12
Quality assurance means that a series of measures intended to develop a good estimate or a good service is imple-mented. Examples of such measures can be an interviewer training program or using an incentive to increase response rates (Lyberg 2012). But implementing such programs does not guarantee that we actually get what we want. That is why we also have to implement quality control. The quality control through monitoring or back-checks will tell us if interviewers actually work as intended. Paradata on nonresponse will tell us if incentives actually have a uniform effect on response rates or if they attract specific groups more than others, which could have detrimental effect on the total survey error. If we get paradata results we do not like we have to take action, i.e. we have to be responsive (Heeringa and Groves 2006). Currently, there are not that many quality control measures implemented in EU-SILC.
The most urgent issue to handle in international surveys is the set-up of a central team that can formulate the survey requirements and their theoretical justifications. The central team also decides which design steps are such that flex-ibility can be allowed across countries and which design steps are such that some kind of standardisation is neces-sary. Even though output harmonisation in practice means that some standardisation is required, the complete free-dom to choose methods and allocate resources is not in line with current best practices used in the international social surveys mentioned above. Comparability of EU-SILC would benefit from becoming an input harmonised survey with “controlled flexibility”.
Thus, a central coordination team is essential for an international survey to be successful. Also, competent transla-tion of questions and other survey materials is a key to comparability. This is an error source that is underappreciated, since it was not mentioned by the countries when we collected information from them. Bad or incomplete translation can change the meaning of questions thereby compromising cross-country comparability. Generally speaking, the problem of survey translations is not very well known among survey managers and survey methodologists. A posi-tive example in this field is research by FORS in Lausanne, where on the Swiss case the many problems, even within a language group, have been illustrated.13
We have a tendency to believe that translations can be performed by anyone with an understanding of the source questionnaire material language and the specific country language. We sometimes even use family members as inter-preters and it happens that interviewers translate “on the fly”. Such practice should be avoided by any professional comparative data collection. Translatology is a science of its own and that is slowly being recognised by survey organ-isations. Translation is an example of a survey step in EU-SILC that should be standardised (Harkness 2008). Modern quality assurance of translation of survey materials usually involves the formation of a team with complementing com-petences and using quality control techniques other than the criticised back translation practice. Other critical survey steps in international surveys include questionnaire testing, interviewer training and monitoring, correct calculation of base weights and design effects, and nonresponse adjustment techniques.
11) posted at http://ccsg.isr.umich.edu/ (retrieved 2015-02-06)
12) http://ec.europa.eu/eurostat/documents/10186/756730/ESS-Vision-2020.pdf/8d97506b-b802-439e-9ea4-303e905f4255 (retrieved 2015-02-06)
13) http://forscenter.ch/de/forschung-publikationen-projekte/forschung-2/survey-translation/ (retrieved 2014-08-12)

10 EuropEan Comparability and national bEst praCtiCEs of Eu-silC
The current set-up of European Social Statistics is such that several regulations provide a framework. These need to be interpreted and general instructions (such as Doc 65 in the case of EU-SILC) are sent to Member States for them to implement in individual ways. While respecting subsidiarity and the heterogeneity of the organisations involved, this cannot result in optimal comparability. Numerous studies show that countries do things differently because they have problems understanding the reasoning behind the requirements. In particular, in the European Statistical System organisations have often developed genuine approaches adapted to national circumstances which do not necessarily consider the comparative perspective. Such organisations tend to do things their own way, or simply do not have the financial and methodological resources to adjust to the requirements of comparative survey research.
EU-SILC is a complicated survey involving many methodological challenges. After going through the responses to our survey on practices used by the countries we realised that the variation is such that it is difficult to say to what extent comparability is obtained. Sometimes the approaches used have very different error structures. It is known that the choice of data collection method has an impact on the survey error, especially via nonresponse and meas-urement error characteristics. Some error sources, especially translation of survey materials and the extensive use of proxy interviews, seem more or less unexplored. Quality control efforts are not used very extensively and the way Eurostat’s methodological guidelines are presented allows the national designs to differ a lot. Since there is very little discussion about control and evaluation and a lack of using recent methodology, we believe that it is time for a new approach along the following lines:
A. Current best practices should be developed for the various aspects and process steps of EU-SILC. This could be accomplished through specifications following the model that the European Social Survey uses (European Social Survey 2013). This document covers aspects such as14:• demands on the data collection organisation itself, • preparation of a source questionnaire, • addition of country-specific questions, • questionnaire translation and question pretesting, • sampling principles and calculation of effective sample size based on design effects, • a common way of calculating response rates, how to increase response rates,• interviewer monitoring, • and data preparation.
B. One needs to develop an infrastructure consisting of a central team that can help countries build the capacity needed to conduct this survey and whose members can assist countries in implementing the best practices.
C. It is very important to distinguish between those aspects and survey steps that must be standardised and those that have to vary. Examples of the former might include team translation, question pretesting, a common case coding system, and prescribed data collection modes and mode combinations.
D. Survey steps where variations are useful include the choice of sampling frame, what kind of sampling system should be used and various ways to gain participation. These are steps that depend heavily on local circum-stances and it would make no sense to prescribe certain procedures or methods.
E. Current best methods mean at least two things. First, current means that modern methods should be imple-mented as much as possible even if the longitudinal aspects might be affected. For instance, it is important to collect process data, i.e. paradata, during the implementation so that it becomes possible to adjust survey pro-cesses so that, say, nonresponse bias is minimised. Second, current means that one has to adjust the best method when new knowledge is gained. Thus, a current best method document is something that is alive and whenever it is changed the change has to be communicated to the data collection organisations.
Admittedly, a switch from output to input harmonisation would not be a quick fix. But the switch would not have to be expensive. Uncontrolled field work is usually inefficient and standardised procedures will save money from an aggre-gated and mid-term perspective. Apart from comparability, gains in precision are possible when bias can be reduced. For example, Fuller (1990) demonstrated that it could be justified to use one fourth of the available resources only to
14) Other documents that can be used include similar specifications concerning PIAAC, the CSDI guidelines mentioned and the process stand-ard ISO 20252 for Market, Opinion and Social Research (2012).

EuropEan Comparability and national bEst praCtiCEs of Eu-silC 11
estimate the variance of the measurement error in order to improve longitudinal estimates. If it is indeed possible to materialise precision gains, these can in turn be directly related to sample sizes and give leeway to making surveys cheaper. All this requires a qualified staff and capacity building among NSIs and especially for the central team suggested.
2.2 Longitudinal survey design
Longitudinal panel data are defined by measurement for at least two or more points in time (cf. Menard 2005, p. 601). The different measurement periods of longitudinal survey designs are called waves. The time between waves is not generally fixed; it can be constant, as well as, in irregular intervals. Generally, the purpose of longitudinal designs is to allow for analysis of changes, i.e. more specific, changes on the individual level. Outcome differences of different groups in one cross-sectional sample or in between the same groups in two independent cross-sectional samples are not useful as an indicator of real change. Contextual differences as well as cohort effects may be equally justified in explaining differences. This limits any cross-sectional design and trend analysis when the intended research purpose is to measure change. So the value added of genuinely longitudinal designs is that they make it possible to study change over time rather than the outcomes of change. A separate review of the longitudinal component of EU-SILC defined general characteristics and benefits of longitudinal surveys (Eiffe/Till 2013, p. 4f., emphasis added):
“First, researchers want to know how the outcome changes over time. The aim of such research approach is to describe specific patterns of change over time. How many units have changed their status? How fast does change occur (is it a linear or non-linear)? Is change consistent over time? The second type of questions relates to how we may predict change. The objective is to detect heterogeneity in change across individuals or groups and to deter-mine the relationship between predictors and the shape of trajectories. […]
Answering both questions can improve a society’s capacity to understand human behaviour. Often this involves impact assessment for social programmes. In a repeated survey non-sampling errors gain special relevance. Firstly, the rela-tive importance of non-sampling errors increases as the sampling precision for estimates of change is improved. Sec-ondly, there are specific survey errors such as panel conditioning and panel attrition which are relevant in longitudi-nal designs. Panel conditioning describes the change in responses between waves that is not due to a change in the underlying measurement issue but that is a reaction to being part of a panel (cf. Menard 2005, p. 601). Therefore, it is not a true change but a methodological artefact. However, it can be also seen from the bright side: panel data can improve the quality of statistical results because repeated interviews lead to improved response quality, responses can be validated with values from other waves and if necessary corrected (cf. Eiffe/Till 2014, p. 4f). Panel attrition is a form of nonresponse that refers to the loss of survey participants after successful participation in wave one. It can occur in between any of the waves of a panel and is critical to quality if it is non-random in relation to the subject of the study.
The regulation regarding the EU-SILC longitudinal component requires that individuals of the original sample shall be traced over at least four successive years.15 In nearly all countries, the sample of the longitudinal component is or has been integrated into the cross-sectional component. The design’s main advantage is that it reduces volatility and random fluctuations of the cross-sectional results over time. Panel data provides smoother time series and more pre-cise estimates of change than a series of cross-sectional surveys. In order to have the same precision for estimates on change from pure cross sections a much larger sample would be necessary (cf. ibd., p. 5).
Figure 1 describes the rotational design of EU-SILC with integrated cross-sectional (red) and longitudinal data (blue) illus-trated for the year 2009.16 Because of the four-year rotational design in 2009 four rotations contribute to the cross-sec-tion. Each of these rotations commenced in a different year. Hence, there are three rotations which have been followed
15) Cf. REGULATION (EC) No 1177/2003 OF THE EUROPEAN PARLIAMENT AND OF THE COUNCIL concerning Community statistics on income and living conditions (EU-SILC) and COMMISSION REGULATION (EC) No 1982/2003 implementing Regulation (EC) No 1177/2003 as regards the sampling and tracing rules.
16) The choice of (at least) four rotations with four years duration is proposed by Euorstat, cf. Euorstat 2013 p.17f. This sample design is followed by all countries with three exceptions: France and Norway apply the proposed rotational design, but with eight years duration and Luxem-burg makes use of a pure panel with a refreshment sample. See also ch. 3.2.1 of this paper.

12 EuropEan Comparability and national bEst praCtiCEs of Eu-silC
up in 2009 (wave 2 of 2008, wave 3 of 2007, wave 4 of 2006) and one newly selected subsample (wave 1 of 2009). The rotation which started in 2005 was concluded in 2008 and therefore not followed up in 2009.
Cross-sectional indicators (CS) based on EU-SILC are usually estimated by using all four rotations of a specific year. Since every rotation was representative of the population when it was first selected (wave 1), it should also be possible to use only longitudinal data (e.g. from the two year panel (L2)) as a basis for estimating a cross-sectional indicator. How-ever, one important obstacle appears here because the already followed up waves 2 - 4 cannot account for new per-sons added to the population in wave 1. So, estimators based on longitudinal data are biased for the year of wave 1 if they are used for estimating cross-sectional data. This issue will be later scrutinised in detail in chapter 4.
Figure 1: EU-SILC rotational design with four rotations
Source: own depiction based on Eurostat (2013), figure 1.
Weights are necessary in a sample survey for estimators which are representative of the entire population of inter-est. EU-SILC applies a weighting scheme for the cross-section which adjusts for sampling design (design weight), unit nonresponse (nonresponse weights) and establishes coherence with known external marginal distributions (calibra-tion of final weights). In the longitudinal perspective the base weights (final cross-sectional weights of the first wave, adjusted for attrition in every subsequent year) represent the longitudinal population (adjusted for new migrants).
Figure 2 gives a simplified overview of the EU-SILC weighting scheme and the cross-sectional (in blue) and longitudi-nal perspective (in red) which is applied for every rotational sample separately. The final cross-sectional weights and the longitudinal weights are derived by combining the respective sub-samples belonging to the cross-section of (a specific) longitudinal panel. Principally both the household cross-sectional weight and the individual longitudinal weight should capture characteristics of the sampling design and unit nonresponse. However, the final household cross-sectional weight incorporates adjustments to external data (calibration), but the longitudinal weights are only the calibrated weights of the first wave, adjusted for attrition and rescaled for the referring two-, three- or four-year population. The adjustment for attrition should be carried out by dividing the base weights of a specific year by esti-mated response propensities which may result from logistic regressions.17 This step in the weighting procedure is cru-cial for longitudinal weights. If the response propensities are not correctly estimated or if they are poorly estimated, e.g. because of a lack of sufficient predictor variables, longitudinal weights may not reflect the panel population cor-rectly. For example, if persons with very low income have a low response propensity in reality, but their response pro-pensity is overestimated, attrition adjusted base weights will be too low for this group leading to an underrepresenta-tion of this group in the panel.
17) Cf. Eurostat 2013, p. 31f.
Statistics Austria Work Package (WP) CO&ME-LONGIT.1
Cross-sectional indicators (CS) based on EU-SILC are usually estimated by using all four rotations of a specific year. Since every rotation was representative of the population when it was first selected (wave 1), it should also be possible to use only longitudinal data (e.g. from the two year panel (L2)) as a basis for estimating a cross-sectional indicator. However, one important obstacle appears here because the already followed up waves 2 - 4 cannot account for new persons added to the population in wave 1. So, estimators based on longitudinal data are biased for the year of wave 1 if they are used for estimating cross-sectional data. This issue will be later scrutinised in detail in chapter 4. Figure 1: EU-SILC rotational design with four rotations
Source: own depiction based on Eurostat (2013), figure 1.
Weights are necessary in a sample survey for estimators which are representative of the entire population of interest. EU-SILC applies a weighting scheme for the cross-section which adjusts for sampling design (design weight), unit nonresponse (nonresponse weights) and establishes coherence with known external marginal distributions (calibration of final weights). In the longitudinal perspective the base weights (final cross-sectional weights of the first wave, adjusted for attrition in every subsequent year) represent the longitudinal population (adjusted for new migrants).
Figure 2 gives a simplified overview of the EU-SILC weighting scheme and the cross-sectional (in blue) and longitudinal perspective (in red) which is applied for every rotational sample separately. The final cross-sectional weights and the longitudinal weights are derived by combining the respective sub-samples belonging to the cross-section of (a specific) longitudinal panel. Principally both the household cross-sectional weight and the individual longitudinal weight should capture characteristics of the sampling design and unit nonresponse. However, the final household cross-sectional weight incorporates adjustments to external data (calibration), but the longitudinal weights are only the calibrated weights of the first wave, adjusted for attrition and rescaled for the referring two-, three- or four-year population. The adjustment for attrition should be carried out by dividing the base weights of a specific year by estimated response propensities which may result from logistic regressions.21 This step in the weighting procedure is crucial for longitudinal weights. If the response propensities are not correctly estimated or if they are poorly estimated, e.g. because of a lack of sufficient predictor variables, longitudinal weights may not reflect the panel population correctly. For example, if
21 Cf. Eurostat 2013, p. 31f.
CS (conventional)cross-sectional estimator
L2 longit. estimator(biased for t)
20092008200720062005
EU-SILC 2009 fullcross-sectional sample
13

EuropEan Comparability and national bEst praCtiCEs of Eu-silC 13
Figure 2: Simplified scheme of cross-sectional and longitudinal weighting procedure
Source: own depiction based on Eurostat (2013), p 32 ff.
It has to be mentioned that in the initial design of EU-SILC as described in the regulations the priority is on the cross-sec-tional data: they should be comparable, timely and of a high quality. Longitudinal data were more or less seen as a nice-to-have by-product of the design, that allow for change analysis but with smaller samples and a reduced set of variables.18 However, this view is changing in recent years and the longitudinal character of the data is beginning to be seen as a value in itself. With regard to the new regulation under development, the rotational design is foreseen to be possibly prolonged to a six year panel and more and more use of the panel for political analysis purposes is being made.19 So far, the most prominent and at the time only income poverty indicator that relies on data of four waves is the persistent at-risk-of-poverty rate.20
The main quality criteria considered here are reflected in the Inventory of field work practices discussed below as well as the coherence of longitudinal estimates with the full cross-sectional sample.
3 Strengths and weaknesses in key processes and control mechanisms of EU-SILC in Member States
Several reviews of EU-SILC as well as the comparative quality reports have tried to summarise the different settings of EU-SILC in the participating countries.21 A high degree of flexibility in the national implementations was found both a blessing and a curse: ideally the higher flexibility would mean that the same underlying concepts would be met by the best suitable method in each country; actually it often resulted in problems of comparability because national specif-icities complicate cross-country analysis. Some of these issues could be resolved in the meantime through coopera-tion and communication and were just a sign of the introductory phase of SILC, some remain (e.g. the big differences in the design of household/address samples vs. selected respondent design), some were and will be tackled through legislation that goes a bit more in the direction of input harmonisation again (e.g. common guidelines for SILC mod-ules with example questionnaires). New challenges lie ahead, e.g. the increase of survey modes, the introduction of web interviews in some countries and comparability issues associated with this.
18) Also, the regulation makes clear that cross sectional and longitudinal data need not necessarily come from the same source.
19) Cf. Documentation of the Legal Revision of EU-SILC-Task Force available on CIRCABC.
20) Agilis (2012).
21) See for an early example Clémenceau & Museux (2007), pp.11-36.
Statistics Austria Work Package (WP) CO&ME-LONGIT.1
persons with very low income have a low response propensity in reality, but their response propensity is overestimated, attrition adjusted base weights will be too low for this group leading to an underrepresentation of this group in the panel.Figure 2: Simplified scheme of cross-sectional and longitudinal weighting procedure
Source: own depiction based on Eurostat (2013), p 32 ff.
It has to be mentioned that in the initial design of EU-SILC as described in the regulations the priority is on the cross-sectional data: they should be comparable, timely and of a high quality. Longitudinal data were more or less seen as a nice-to-have by-product of the design, that allow for change analysis but with smaller samples and a reduced set of variables.22 However, this view is changing in recent years and the longitudinal character of the data is beginning to be seen as a value in itself. With regard to the new regulation under development, the rotational design is foreseen to be possibly prolonged to a six year panel and more and more use of the panel for political analysis purposes is being made.23 So far, the most prominent and at the time only income poverty indicator that relies on data of four waves is the persistent at-risk-of-poverty rate.24
The main quality criteria considered here are reflected in the Inventory of field work practices discussed below as well as the coherence of longitudinal estimates with the full cross-sectional sample.
3 Strengths and weaknesses in key processes and control mechanisms of EU-SILC in
Member States
Several reviews of EU-SILC as well as the comparative quality reports have tried to summarisethe different settings of EU-SILC in the participating countries.25 A high degree of flexibility in the national implementations was found both a blessing and a curse: ideally the higher flexibility would mean that the same underlying concepts would be met by the best suitable
22 Also, the regulation makes clear that cross sectional and longitudinal data need not necessarily come from the same source.23 Cf. Documentation of the Legal Revision of EU-SILC-Task Force available on CIRCABC.24 Agilis (2012).25 See for an early example Clémenceau & Museux (2007), pp.11-36.
Sampledesign
Nonresponse Adjustment Base weight Household X-weight
Nonresponse Base weightAdjustment Household X-weight
(t=1)
(t>1)
Nonresponse …
panel attrition
Individual L-weight
14
14 EuropEan Comparability and national bEst praCtiCEs of Eu-silC
To increase efficiency and to reduce costs, synergies between countries should be strengthened. An inventory of field-work practices should therefore help to identify best practices in data collection and facilitate information exchange on data collection methods. The first step in creating such an Inventory for EU-SILC was to define the characteristics of data collection and key quality indicators that are relevant to identify best practices in EU-SILC. This selection was done with the theoretical background of types of survey error described in the following chapter.
3.1 Risks associated with different error sources
A common, yet not the only, survey objective is to produce accurate data. Accuracy implies the absence of survey error which occurs in different stages of the survey and has various sources. Common theory differentiates between sam-pling and non-sampling error. Within non-sampling errors there are five different types that affect the accuracy of data: specification, coverage, nonresponse, measurement and processing error. For EU-SILC, the errors that are caused by coverage or processing issues underlie quite detailed regulations and documentation guidelines22, whereas nonre-sponse and measurement error is less often addressed and remains mainly in the responsibility of each country. Spec-ification error occurs when the research question does not fully match the survey question. A highly controlled field-work situation is, however, required for unbiased measurement. This paper therefore puts a focus on measurement and nonresponse error.
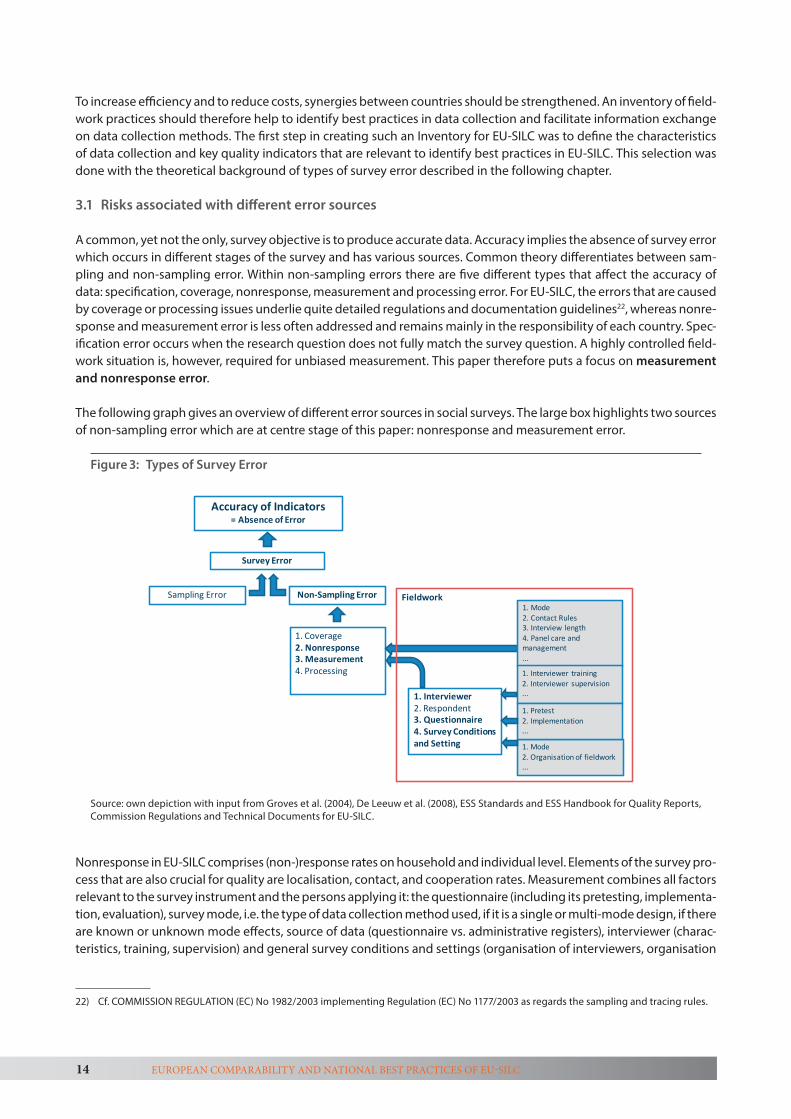
The following graph gives an overview of different error sources in social surveys. The large box highlights two sources of non-sampling error which are at centre stage of this paper: nonresponse and measurement error.
Figure 3: Types of Survey Error
Source: own depiction with input from Groves et al. (2004), De Leeuw et al. (2008), ESS Standards and ESS Handbook for Quality Reports, Commission Regulations and Technical Documents for EU-SILC.
Nonresponse in EU-SILC comprises (non-)response rates on household and individual level. Elements of the survey pro-cess that are also crucial for quality are localisation, contact, and cooperation rates. Measurement combines all factors relevant to the survey instrument and the persons applying it: the questionnaire (including its pretesting, implementa-tion, evaluation), survey mode, i.e. the type of data collection method used, if it is a single or multi-mode design, if there are known or unknown mode effects, source of data (questionnaire vs. administrative registers), interviewer (charac-teristics, training, supervision) and general survey conditions and settings (organisation of interviewers, organisation
22) Cf. COMMISSION REGULATION (EC) No 1982/2003 implementing Regulation (EC) No 1177/2003 as regards the sampling and tracing rules.
Statistics Austria Work Package (WP) CO&ME-LONGIT.1
Figure 3: Types of Survey Error
Source: own depiction with input from Groves et al. (2004), De Leeuw et al. (2008), ESS Standards and ESS Handbook for Quality Reports, Commission Regulations and Technical Documents for EU-SILC.
Based on these error types the structure for the Inventory on best practises in data collection in EU-SILC was set up. The following chapters give brief descriptions on some of the most relevant fields possibly associated with nonresponse and measurement error. The aim of this is not only to supplement the existing EU-SILC documentation but also to give an overview of measures to deal with nonresponse and measurement error in the countries and make recommendations on this basis.
3.2 Aspects of measurement and nonresponse error
3.2.1 Survey Conditions and Settings
EU-SILC is set against a background of national and European legislation. This rigid context implies that some Member States may remain in accord with the regulation without achieving optimal process quality. Implementation differs substantially across countries because of EU-SILC being mainly output harmonised. Survey conditions and settings that should be discussed here are: Who is responsible for SILC? How is it financed? Is SILC mandatory or voluntary for participating households? Is the fieldwork centralised or decentralised? Is it a “stand alone” survey or is it combined with other (national or European) surveys, at the same time or sequentially? Are administrative data or registers used, to what extent? Then there are other than the “hard facts”, e.g. a society’s attitude towards social surveys, the way in which information on movers is available to former neighbours and so on. Cultural factors like this are not apparent and cannot easily be explained, but may lead to different forms and extent of measurement or nonresponse error.
The following is a short overview of the known facts to come closer to this question of interest, (numbers in brackets next to each heading indicate the respective Item in the Inventory):
Accuracy of Indicators= Absence of Error
Survey Error
Non-Sampling ErrorSampling Error
1. Coverage2. Nonresponse3. Measurement4. Processing
1. Interviewer2. Respondent3. Questionnaire4. Survey Conditions and Setting
1. Mode2. Contact Rules3. Interview length4. Panel care and management...
1. Mode2. Organisation of fieldwork...
1. Interviewer training2. Interviewer supervision...
1. Pretest2. Implementation...
Fieldwork
16
EuropEan Comparability and national bEst praCtiCEs of Eu-silC 15
of fieldwork, contact for respondents). To evaluate all this a lot of context information is required, e.g. about design of the sample, sampling units, sampling frame, sample size, rotational groups, design effect and so on.
Based on these error types the structure for the Inventory on best practises in data collection in EU-SILC was set up. The following chapters give brief descriptions on some of the most relevant fields possibly associated with nonre-sponse and measurement error. The aim of this is not only to supplement the existing EU-SILC documentation but also to give an overview of measures to deal with nonresponse and measurement error in the countries and make rec-ommendations on this basis.
3.2 Aspects of measurement and nonresponse error
3.2.1 Survey Conditions and Settings
EU-SILC is set against a background of national and European legislation. This rigid context implies that some Mem-ber States may remain in accord with the regulation without achieving optimal process quality. Implementation dif-fers substantially across countries because of EU-SILC being mainly output harmonised. Survey conditions and settings that should be discussed here are: Who is responsible for SILC? How is it financed? Is SILC mandatory or voluntary for participating households? Is the fieldwork centralised or decentralised? Is it a “stand alone” survey or is it combined with other (national or European) surveys, at the same time or sequentially? Are administrative data or registers used, to what extent? Then there are other than the “hard facts”, e.g. a society’s attitude towards social surveys, the way in which information on movers is available to former neighbours and so on. Cultural factors like this are not apparent and cannot easily be explained, but may lead to different forms and extent of measurement or nonresponse error.
The following is a short overview of the known facts to come closer to this question of interest, (numbers in brackets next to each heading indicate the respective Item in the Inventory):
Outsourcing of fieldwork [I 452]:In all of the countries the statistical offices are in charge of the data collection process: as EU-SILC is a survey under the European Statistical System the National Statistical Institutes are bound by the regulation to fulfil their duty as to delivering the micro data and indicators according to the criteria specified therein. However, the data collec-tion process is not necessarily conducted by the NSIs themselves, but can also be outsourced. The case of Austria, where due to financial and personnel constraints the fieldwork was outsourced from 2003 to 2006 and partly in 2007, showed that quality control is rather burdensome in this scenario. Generally, a lack of transparency should be expected when the data producer is not the same entity as the unit finally responsible for the data quality – espe-cially, but not only when this outsourcing is due to financial reasons. One important finding of the questionnaire on fieldwork, therefore, was that for the year 2009 none of the European Union Member States reported that they outsourced their fieldwork or parts of it.23
Centralisation vs. decentralisation [I 451]:Somewhat more of the responding countries reported their fieldwork as being centrally organised (8) than decen-tralised to regional offices (5). Technology and interview mode as well as register use may play a role in this deci-sion as well as organisational structures beyond the EU-SILC survey. CATI and CAPI mode (for CAWI it is supposed to be the same, but in 2009 it was not used yet) go together with centralisation, countries using PAPI mode more often have decentralised structures.24
23) The only exception of an EU-SILC but not EU-country is Switzerland. Outsourcing in this definition is rather strict and refers to fieldwork as a whole or in parts being carried out by other companies or legal entities than the NSI. It does not include interviewers working for the NSI as free-lancers, which is more often the case. In the latter situation the responsibility of the interviewer remains towards the NSI (or its regional offices).
24) See chapter 3.2.4 Interviewing Mode.

16 EuropEan Comparability and national bEst praCtiCEs of Eu-silC
There is no clear recommendation as to which form of organisation is more efficient as regards quality control and outcome: an intermediate organisational level can be successful in eliminating quality problems as it may be more directly accessible to interviewers or respondents, but it may also produce bias and lack of comparability if the standards for operating this intermediate level are not clear or equally implemented.
Duration of fieldwork, Continuous vs. one-off survey [I 455], rotational design [I 25]:Most countries collect data for EU-SILC in the first half of the year. Only four countries reported the duration of the fieldwork to be twelve months long for EU-SILC 2009: Ireland, Sweden, Italy and the United Kingdom.25 Such a continuous survey situation is also foreseen in the EU-SILC regulation and conditions are specified for it: usually it should go together with a moving 12-months reference period for income. Reason for this deviation from usual fieldwork periods is the integration with national surveys. All the other countries had shorter duration of fieldwork between one month at the shortest (SK) and up to 8 months (BE). The average duration of fieldwork for those coun-tries without the ones using a 12 months period is 4.6 months. From the Austrian example it is known that field-work duration differs slightly every year and is dependent on factors like availability of staff, other surveys in the field at the same time, preparation and programming of the questionnaire etc. Not only the duration of the field-work, though, is critical for the quality but also when in the year it takes place. The regulation specifies “…field-work for the survey component shall be carried out over a limited period as close as possible to the income refer-ence period… as to minimise time lag between income and current variables.” (Regulation (EC) No 1177/2003, p. 3). In the implementing regulation it is recommended that fieldwork should be extending over less than four con-secutive months and the lag between income reference period and fieldwork should be limited to eight months (cf. COMMISSION REGULATION (EC) No 1981/2003 of 21 October 2003).
The impact of the fieldwork period may be relevant for indicators that are prone to seasonal effects, e.g. work related indicators but tend to be negligible for income distribution as a whole (cf. Clémenceau et al. 2007, p. 31) or the risk-of-poverty rate. For comparability of cross-sectional and longitudinal data it would be also of interest if the survey period, both on the aggregate and in the individual household, is stable over the years. If the interviewing period be moved from the beginning of the year to the middle in the next year a greater time lag between the waves occurs that could have an impact on the number of movers, non-traceable households etc., so relative stability is an advantage in an ongoing panel. Different times for the measurement may affect the measurement error.
From the perspective of nonresponse a field work period that is too short to make enough contacts and trace movers is negative. So the interviewing capacity has to be well planned to avoid both a big time lag between the reference period and the interview and an increase of non-participation because of a condensed fieldwork period.
Concerning the design nearly all countries use the integrated four year rotational design as recommended by the regulation. France and Norway deviate insofar as they use the same design but with a different duration (8 years). Lux-emburg has a pure panel with a refreshment sample every year. Finland reported for 2009 to have two new rotational groups, one with a planned duration of four and one with two years. A special situation is known for two countries using a kind of access panel approach, Germany and the Netherlands (see below - Voluntary participation and sam-ple selection [not in inventory]:). Although those designs are treated as if they allow for representative cross-sectional results as well as a sample of persons that can be traced over four years, true representativeness of the initial sample is questionable dependent on the level of initial response rates. Sampling errors and nonresponse are quite likely dif-ferent due to these differences in design.
25) For Italy it was found in the CIQR of EU-SILC 2010 this situation changed in 2010 to a survey period from May to November. In Sweden the in-depth telephone interview found out that from 2015 on the fieldwork period will be shortened to January throughout May/June.
Table 1: Organisation of fieldwork
Is the fieldwork organized centrally or are there regional field managers etc.?
centralised AT BE DK FI HU LU MT SI
decentralised DE EL IT LT PL
Source: Inventory of best practices for data collection methods in EU-SILC, data for EU-SILC 2009, only filled cases.
EuropEan Comparability and national bEst praCtiCEs of Eu-silC 17
Financing [not in inventory]:Usually the most important question for data producers is how resources and quality criteria can be brought into accordance. As a general rule, the European Commission finances only the implementation phase of a new statis-tics, for EU-SILC it was the first four years. So for the year of interest, 2009, depending on when the countries joined the project, Eurostat co-financing does not play a role anymore, at least for the EU-25 countries.26 No information as to who financed the 2009 SILC survey in the single member states is available to us - if it was directly financed by the budget allocated for the NSI or funded by a ministry, on federal or lower level etc. This is not per se of inter-est here but it should be kept in mind that data quality is dependent on the resources.
Voluntary participation and sample selection [not in inventory]: The fact if a survey is voluntary or compulsory for participants is most relevant for response rates and quality of the data, however it is no category of the standard quality reporting to Eurostat. We assume that in most countries EU-SILC is done on a voluntary basis, i.e. no legal background obligates households or persons to participate. This is the case in Austria where the idea behind this is that no person shall be forced to participate in a survey where the subject of inter-est is living conditions and well-being. We assume that the quality of the data is higher if they are given on a voluntary basis, well knowing that non-participation may be strongly related to those variables of interest.27 In-depth interviews with selected countries found out that also in Sweden and the Netherlands the situation is the same. It is, however, known to be different in France (waves one to four compulsory, from wave five on voluntary) and Portugal (manda-tory for the households, in principle, but there are no fines imposed). The example of France where a major drop in participation rates is found between waves four and five highlights the impact of the legal situation on response rates.
Some examples of “access panel” are also known in EU-SILC: In the Netherlands EU-SILC households are recruited from the Labour Force Survey. After the last LFS wave (with about 50% voluntary response) the household respondent is asked if the household is willing to participate in EU-SILC. About 90% agree to this. A similar model is used in Germany. Recruitment bias is in these cases an additional component of potential error besides nonresponse and panel attrition. It has to be taken into account in the evaluation of the design of weights and quality of indicators.
Registers [I 117, I 122], SRD, Feed forward [I 287-291]:As concerns the use of administrative data or registers developments have been significant in the past few years. Initially, only few countries (DK, FI, IS, NL, NO, SE, SI) have used registers. For them, there was a special design fore-seen in the EU-SILC regulation: the selected respondent design (SRD): Only a selected household respondent receives a personal questionnaire, household and income variables are collected through registers or through this selected respondent. This is maybe the most serious design variation across Member States and is reflected in mark-edly different results. In most countries households (or addresses) are sampling units and generally all of its mem-bers are traced over time. From a quality perspective these differences matter a lot: MS using the SRD are generally more reluctant to introduce qualitative and subjective questions into the survey as they are obviously not suitable for their design. Weighting schemes have to be different in the household approach and the SRD: in the first case the household and the personal weight are the same whereas the latter requires besides a household weight two personal weights: one for the selected respondents (to make inference on interview data) and one for all persons in the households which is identical to the household weights (to make inference on income data from registers). And longitudinal aspects have to take into account that in the SRD only the selected respondent is followed-up.
In the meantime some other countries, among them France since 2008 and Austria since 2012, are making use of reg-isters. However, these “second generation register countries” did not change to the SRD but still have the household as surveying unit. Thus, there are three fundamentally different models of data collection types which exist in parallel:
• “old” register countries using SRD, • “new” register countries,
26) Austria, Belgium, Denmark, Greece, Ireland, Luxembourg, Norway have launched EU-SILC in 2003, in 2004 six more Member States plus Esto-nia and Island followed. So in 2005 EU-SILC was carried out in all (at that time 25) Member States, plus Norway and Iceland.
27) That can be controlled for to some degree since the use of administrative data.

18 EuropEan Comparability and national bEst praCtiCEs of Eu-silC
• countries which collect information through conventional survey interview modes.
Many additional differences exist for example regarding the amount of information that is fed forward between waves.
Törmälehto (2013) draws the following conclusions from the 2012 Workshop on registers in the context of EU-SILC:28 Registers potentially affect all phases of a survey process: sampling, survey data collection and questionnaires, pro-cessing, weighting, variance estimation, quality control, and dissemination.
• The sources of errors in registers can be discussed in a general framework, but it is quite challenging to general-ise about quality of registers in a cross-national context.
• There is variation within countries across sources, and possibly across variables within sources. Some register data may originate from survey-like data collections (self-administered questionnaires) or, at the other extreme, from entirely electronic exchanges of administrative data.
• The combined use of survey and register data affects the total survey error (Groves, 2004), and effectively expands the traditional survey error sources to those related to registers (single sources) and data integration from multi-ple sources. So, there are more sources of error, but usually the expectation is to have a lower total error because there is less measurement error.
Further studies have to be carried out to investigate the impact of register use in the different countries on error and out-come. For the second part, a study comparing income variables and income related indicators calculated using both the survey approach on the one hand and administrative data on the other was conducted by Statistics Austria (2013). It came to the conclusion that the potential error made in registers is very different to that from survey data, the quality seems overall better as indicated by a larger dispersion of income due to better representation of the lower and higher deciles.
In a panel not every piece of information need to be asked again in the follow up waves, because much is already known from an earlier wave. The method that uses information which is “fed forward” from past observations is usu-ally known as dependent interviewing (Lynn et al. 2004, p.6):
“The term “dependent interviewing” is generally used to refer to structured interviews where the choice of questions and/or the wording of questions vary across sample members, depending on prior information held by the survey organisation about the sample member. Typically, this prior information comes from a previous survey data collec-tion exercise (interview or questionnaire), though it may alternatively come from an external source such as admin-istrative data used as the survey sampling frame.”
The impact of this feeding forward has to be further analysed to understand its impact on changes between waves. Several ways to confirm or alter information from previous waves can be used that may lead to different answers, either laying emphasis on change or on stability.29 The advantage of dependent interviewing as opposed to independent interviewing is that it is believed to better reflect the true size of changes – one reason to conduct panel surveys on the first hand (see 2.2). A potential reduction of measurement error can also be attributed to the fact that dependent interviewing helps reduce the interview length and response burden.
Feeding forward of information from a previous wave is in EU-SILC somehow practised by 23 countries [I 287]:
• 10 for contact information only• 21 for basic information on household members• 11 for detailed information on target variables.
28) Summary of slides presented at the EU-SILC Task Force Legal Revision meeting in February 2013.
29) A general distinction is made between proactive and reactive dependent interviewing, but subtypes according to the way the information is presented exist (see Lynn et al. 2004).

EuropEan Comparability and national bEst praCtiCEs of Eu-silC 19
Recommendations for general conditions of the EU-SILC survey with a potential to be harmonised, i.e. not interfering with national legal and strategic decisions are the following:
• Systematic impact assessment of varying survey designs, including use of registers and selected respondent model. In particular the response rates and measurement error in the cross-sectional and longitudinal compo-nent need to be evaluated. Access panels introduce recruitment bias as another source of error which has to be well documented and treated by weighting.
• Embrace voluntary participation to ensure respondent’s cooperation. If participation is mandatory response rates may seem higher but effects on measurement errors remain problematic.
• Further explore uses of register data to ensure quality and assess survey error.• Document variables which are fed forward and establish common rules for feeding forward to ensure compara-
bility and coherence between cross-sectional and longitudinal estimates.• The fieldwork period must be chosen such that contact and response rates are maximised while keeping the lag
between the reference period and the interview low.
3.2.2 Questionnaire
The questionnaire development process in EU-SILC is very unusual and imprecise. Participating countries get a descrip-tion of the EU-SILC target variables. This description specifies, for instance, reference period, sampling unit, modes permitted, and exact wording of response alternatives. There is typically also a description of the research questions that the survey question is supposed to shed some light on. This procedure goes contrary to current best practice for an international survey that aims for good data quality and good comparability, which are top priorities for EU-SILC. There are at least five problems with the current approach.
A. The guidelines assume that the same wording can be used across countries. This is not possible. The same word-ing does not necessarily generate comparability. Instead it is the meaning of the question that must be preserved across participating countries.
B. Unlike other international surveys there is no source questionnaire that countries are supposed to translate and adapt so that the aforementioned meaning can be preserved.
C. No attention is given to the questionnaire development in different countries. We have checked the question-naires for the UK and Sweden and they are different. Sweden has blended EU-SILC with its regular survey on living conditions, which results in a very extensive questionnaire. It is not clear how it was possible to isolate interview duration time for the SILC questions under those circumstances. The UK also seems to blend its SILC questions with other questions and the survey is called The General Lifestyle Survey, which is different in scope from any-thing alluding to living conditions.
D. The leeway that is given to countries can have bad effects. For instance, Sweden starts a series of questions on whether the household can afford vacation travel, certain food items, and sufficient heating of their living quar-ters with the following information : “You might find the following questions strange from our country’s per-spective, but they are part of an EU survey “. This is an example of an unacceptable statement that is such that it triggers so called social desirability bias. This introductory statement by the interviewer implies that you are expected not to have these financial problems and the result will be underreporting.
Another example of consequences of this kind of freedom is the choice of mode. Some countries use PAPI, oth-ers CAPI or CATI. This has consequences for data quality since these modes have different error structures. Typ-ically in interview modes there is a tendency to obtain recency effects, i.e., a given response alternative is more likely to be chosen when presented at the end rather than at the beginning of a list of response alternatives. With PAPI and CAPI this effect can be reduced by using show cards and many of the countries do that. There are also other inherent differences between telephone and face-to-face interviews, differences that are associated with the questions. For instance, due to the greater distance between respondent and interviewer in the telephone mode, interviewer effects on the answers to sensitive questions are smaller than in face-to-face surveys. On the
20 EuropEan Comparability and national bEst praCtiCEs of Eu-silC
other hand, we have noticed that the workload for CATI interviewers tend to be much larger than for PAPI and CAPI interviewers in some countries.
When modes are mixed this is typically done because one wants to increase response rates. In no country were any question changes made when a telephone questionnaire was used in a face-to-face situation and vice versa. Mixed mode is often used to increase response rates but the effects on measurement error are usually ignored (Dillman 2007).
E. EU-SILC seems to ignore the translation issue. Questions and other survey materials have to be translated. In this case we do not have a source questionnaire. Instead countries use the guideline texts for translation. It is not clear how this process is conducted in different countries but obviously there is no standardisation in place. Unfortunately, this is a topic that we did not investigate in our best practice study. We notice, however, a num-ber of potential problems. The recommended translation technique for surveys is team translation, which con-sists of five steps (Harkness et al 2010). A translation team consists of translators, reviewers and adjudicators who decide on outgoing translations when translators and reviewers do not agree. Translators should be trained on translating survey questions and other survey materials. Reviewers should also be good translators and know questionnaire design principles. This might seem like a costly and time-consuming set-up, but experience tells us that it might be more expensive to use translation bureaus or, even worse, someone who « knows » the lan-guage. We have all seen examples of how very minor wording changes can result in huge differences in response distributions. This is what happens with bad translations, i.e., you do not always get the chance to ask the ques-tion you need to ask.
The five team translation steps are: First, draft translations are produced. Second, a review and refine session takes place. Third, deviations between translations are resolved by the adjudicator. Fourth, the resulting question or questions are pretested, revised and if necessary reviewed and adjusted again. Fifth, documentation is done and continuously updated as the procedure goes on. The procedure is called TRAPD (translation, review, adju-dication, pre-test and documentation) and is used in the European Social Survey. Some argue that back transla-tion is a cheap alternative to team translation but it turns out that back translation actually does not review lan-guage B in the language sequence A-B-A. For instance, even though back translation takes us back to the source language A, we will not always discover ambiguities that might exist in the B language translation.
To preserve the meaning of a survey question across countries it might be necessary to adapt the question word-ing so that it measures the same concept but perhaps uses an alternative wording. A simple example is when the US distance called « blocks » is reworded to a suitable number of meters to obtain equivalence. It is not clear to what extent such adaptation has taken place in EU-SILC. Our guess is that most translations have been more word for word.
It turns out that many countries use just one questionnaire language. It is not clear how sample persons with lim-ited or no knowledge in that language are handled by the survey organisations. One option is to exclude them from the survey. Another is to use proxy interviewing, which might be a mixture of interpretation by relatives (usually daughters and sons) or proxy interviewing. The very large portion of proxy interviewing in some coun-tries seems to suggest that this is how they have solved the language problem, despite the fact that the EU-SILC guidelines talk about using proxy as an exception. As a contrast Sweden has translated its questionnaire into eight languages and the corresponding proxy rate is less than 3%.30
Many statistical agencies have cognitive laboratories that handle the testing of questions and questionnaires and they often work together with the survey managers on the actual questionnaire design. It seems as if pre-testing has been limited in EU-SILC, though. The typical ingredients in pretesting are expert reviews, think-aloud sessions, cognitive interviews, and focus groups and debriefings with potential respondents and interviewers. It is absolutely essential that more pretesting takes place in the future.
30) For a discussion of proxy rates see 3.2.4.

EuropEan Comparability and national bEst praCtiCEs of Eu-silC 21
Recommendations for questionnaire development include the following:
• A source questionnaire is needed so that participating countries have a realistic benchmark in their own ques-tionnaire development.
• Questions are mode sensitive. One cannot expect a specific question to work in the same way across mode choices. EU-SILC must be much more careful regarding what modes and mode combinations are acceptable.
• A team translation methodology must be enforced. Currently there is no control over this process step.• Questions and questionnaires must be pretested using one or several of the standard pretesting methodologies.• A central team has to follow and assist countries and their questionnaire design work.
3.2.3 Interviewers
The interviewing task is very diverse and includes several sub-tasks: contact the respondents, convince them to par-ticipate, conduct the interview, code drop outs etc. The most important decision to be taken for every single task is whether the protocol is strictly enforced (e.g. in applying the questionnaire) or allows for one’s own initiative (e.g. contacting respondents) (Lessler at al 2008).
The interviewing task of EU-SILC depends much on the circumstances of the whole surveying process, if interview-ers are responsible to collect income information as well or not, the interview mode, etc. The quality of the data is to a big extent an outcome of the interviewers’ understanding and implementation of the concepts, so their training is crucial. Their motivation and thus also the quality of the whole survey depends also on circumstances of their work like type of contract, payment, work load and fluctuation.
Training [I 322-328] and stability [I 418-425]:Interviewer training for SILC takes on average more than one workday for unexperienced and about one work-day for experienced interviewers (see Table 2).
A stable interviewer staff is, of course, advantageous because the initial investment in the training is costly. But also response rates and cooperation of households turn out better with stable, reliable and well trained interviewers.
On average, across Member States and depending on mode between one fifth and one third of the interviewers of the previous wave conduct EU-SILC again in the follow up wave(s).
Workload [I 435-449]:To prevent clustering inside the sample because of too few interviewers or interviewers with a too big share of the total sample the number of sample units assigned to one interviewer can be on purpose limited. On the average the workload is between 43 sample units in the PAPI and 171 in the CATI case (see Table 4). As CATI is usually under tighter control and quicker to conduct than CAPI or PAPI interviews this bigger workload might seem acceptable.
Table 2: Average training of interviewers (hours) by mode
PAPI CAPI CATI
Experienced 7 14 8Unexperienced 10 24 13
Source: Inventory of best practices for data collection methods in EU-SILC 2009, only filled cases.
Table 3: Average number of interviewers by mode
PAPI CAPI CATI
Total 311* 123 104Share of “new” interviewers 19% 33% 39%
* without Poland and Italy with more than 1000 interviewers each.Source: Inventory of best practices for data collection methods in EU-SILC 2009, only filled cases.

22 EuropEan Comparability and national bEst praCtiCEs of Eu-silC
Nevertheless, the average for CATI is extremely high for this kind of study and the effects on interviewer variance could be very large. We would therefore recommend the number of sample units assigned to one interviewer be restricted to a smaller number and the variation between interviewers, the range, to be shortened.
Payment and contracts [I 431-434]:The types of contracts for interviewers and their payment differs substantially between countries and seems to be more dependent on general company policies of the NSIs than only on requirements of EU-SILC. Interviewing staff is in some countries permanently employed by the NSI, others have short term fixed contracts and again others have interviewers working on a self-employed contractual basis. Payment is most often a combination of a guar-anteed amount and variable components, the first either as a fixed weekly/monthly amount or based on the num-ber of sample units, the variable component dependent on factors such as response rate, travelling costs etc. But also payment models with purely variable costs dependent on the successful interview and the opposite – fixed monthly or hourly payment are practised. Usually for countries having different modes the employment models and pay are also different within. CATI interviewers most likely are NSI’s staff and receive hourly or monthly wages not directly dependent on their interviewing success, interviewers in the field are more often dependent on the outcome of their work.
No direct impact of payment and contractual factors can of course be traced on the quality and recommendations on this cannot be easily made as national specifics have to be taken into account. But it is important to report on these differences and evaluate potential influences on measurement error.
Supervision, support and feed-back for interviewers [I 358-367]A general recommendation to fight measurement error might be to make data checks as soon as possible in the process, preferably during the data entry itself – like it is usually done in electronic forms of data collection (CAPI, CATI, CAWI), to a smaller extent also in PAPI.
Post-hoc control is also of great importance: Supervision, support and feed-back for interviewers are therefore classi-cal tasks of the survey unit. But only ten countries reported active measures like re-contacting households and check-ing the answers, informing interviewers of their performance, giving feedback to new interviewers etc. Possibilities of direct or indirect control and methods to quickly react to faulty developments are, of course, also dependent on the interviewing mode, legal arrangements of the contracts and the institutional setting.
Computer-Assisted Recorded Interviewing (CARI) is a powerful tool in monitoring interviewers. It refers to the collec-tion, management, coding and other uses of sound recordings taken during data collection. Many software packages for CAPI and CATI, like for example Blaise (developed by Statistics Netherlands) that many countries use for SILC support CARI. The output of this are paradata like timings data and sound files that can be very useful for supervision, training of interviewers, coding and editing of data. The use of this supervision technique has not been reported in EU-SILC.31
Recommendations in this field of interviewers are very straightforward:
• Let the interviewers have enough knowledge about the survey and its content to convey this to the sample households is the best way to increase cooperation and response rates.
31) This doesn’t necessarily mean it is not used by now, it was however not mentioned in the questionnaire on fieldwork relating for EU-SILC 2009.
Table 4: Average interviewer workload by mode
PAPI CAPI CATI
assigned sample units 43 72 171completed interviews 35 48 138
Source: Inventory of best practices for data collection methods in EU-SILC 2009, only filled cases.

EuropEan Comparability and national bEst praCtiCEs of Eu-silC 23
• Clear standards of interviewer behaviour are needed to prevent interviewer bias. Training and supervision has to address both and mention where flexibility is allowed (e.g. the freedom to decide when to approach the house-holds, how to contact them etc.)
• To limit the number of sample points (or the area) that one interviewer is assigned is a simple measure to avoid too much effect of one interviewer on the whole sample.
• Interviewing is so sensitive to errors that we cannot really afford not to monitor them. The effective sample size is reduced if we allow too much interviewer variance. The use of CARI is recommended for interviewer monitoring.
3.2.4 Interviewing Mode
In 2009 besides extracting information from registers (see above) the following four interview modes were used [I 188-191]:
• Paper-And Pencil Personal Interview (PAPI)• Computer-Assisted Personal Interview (CAPI)• Computer-Assisted Telephone Interview (CATI)• Self-administrated questionnaire.
The most common modes were CAPI and CATI. Single mode PAPI is still common in some countries (BG, IT, LU, HU, PL, RO, SK) and Germany relies on self-administered interviews. Some countries complemented modes but to a small extent. For a full overview of modes used, including mode switches during the fieldwork period and proxy rate see Table 5.
14 countries used only one single mode, 16 had mixed or multi mode design32, thereof four with more than two modes [I 192]. A combination of both concurrent (two or more modes used on different parts of the sample at the same time, also known as mixed mode design) and sequential (one mode used after the other, also known as multi mode design) mixed mode design seems the most common way: The sample is initially portioned according to the modes that are available for the respective wave or according to information from the previous wave, then during the fieldwork mode switches are done when needed. Nine out of the 16 countries with mixed modes had mode switches implemented [I 193-198]. The usual direction of the change took place from CATI interview in the initial contact to CAPI. Reasons given for this mode switch were if the respondents’ preference, non-availability of telephone number, non-success of con-tact by telephone for other reasons, etc. Only Spain reported the reverse direction of mode switch from CAPI to CATI. The case of Austria where mode switches are possible in both directions (CAPI to CATI, CATI to CAPI) is exceptional but proofed as a good solution to increase response.33
When more than one mode is used, it is important to ensure cognitive equivalents in questions (De Leeuw 2005). Lit-tle information is available on how questions are presented, e.g. by use of showcards in the CAPI situation that are not available in CATI. In the Austrian situation CATI and CAPI versions were aligned from 2010 on, after initial differences as regards use of showcards with examples (CAPI), the reading of categories (CATI) vs. visual aids (CAPI) etc. Generally speaking those differences should be avoided to prevent mode effects. However, questions need and cannot always be exactly the same for all modes used.
Proxy interviews are generally discouraged, but proxy and (non-)response rate are interdependent. The quality of proxy interviews depends on the person giving the information and the type of the question. Questions that are purely subjective are not allowed to be asked to another person than the respondent in SILC.34 Response error tends to increase by proxy responses. Biased responses may be an outcome of high proxy rates, because proxy interviews become more often necessary for special groups of persons (people in (self-) employment, younger adults, people with health problems, etc.).
32) Mixed refers to parallel use of different modes, multi to consecutive use of different modes.
33) Slovenia reported a few cases of switches from CATI to CAPI; the general direction is CATI to CAPI.
34) See, for example, guidelines of the 2013 ad-hoc Module on Well-being. Some countries have special rules to accept or not accept proxies in general or for selected variables. The EU-SILC variable on subjective health however is answered by proxies.

24 EuropEan Comparability and national bEst praCtiCEs of Eu-silC
The above table (Table 5) shows very different proxy rates: Most countries have a proxy rate between 20% and 40%. Five countries present a proxy rate below 10% (EL, NL, SK, SE, CH). Two Member States present a proxy rate above 40% (DK, FI), those are two of the countries using the ‘selected respondent model’ (SRD). The case of the SRD coun-tries has to be specially evaluated: the household respondent (in most cases selected respondent) is asked for infor-mation about all household members, therefore, these countries have a high percentage of proxy interviews concern-ing personal interviews. But there are also exceptions: The in-depth interview with Sweden revealed that even among SR-countries the treatment of proxies is very different. Sweden basically counts proxy interviews for elderly people who are the selected respondents and are incapable of answering themselves because of health problems. Denmark has the special rule that all respondents chosen as selected respondents who are below 25 years and live with their parents are not accepted as respondent, parents give a proxy interview for them. Finland has a similar but more flex-ible rule that the interviewer can decide if the SR is well informed enough. The practise of when to accept or force a proxy and the coding of what is a proxy seems to be vastly different in the EU-SILC countries. To allow for better qual-ity control this should be harmonised.
Recommendations drawn from the various situations in the field of survey mode therefore can be summarised as follows:
• Electronic modes are preferable over PAPI or self-administered survey modes as they increase the control of the survey situation, of the answers on items and across various parts of the questionnaire.
• To prevent mode effects, the questions should work in the same way across modes. That means that is not always the best solution to have the same questions and explanations regardless of the mode, but that adapted word-
Table 5: Interview mode as percentage of individual records obtained, mode switches and proxy rate
PAPI CAPI CATI Self-adm. Mode switch Proxy Rate
BE 100.0 12.9BG 100.0 19.5CZ 79.1 20.9 14.9DK 93.0 7.0 CATI > self-adm. 49.0DE 100.0 19.8EE 2.0 97.8 0.2 22.2IE 100.0 27.5EL 86.5 9.9 3.6 0.1 7.6ES 92.6 7.4 CAPI > CATI 39.9FR 100.0 27.5IT 100.0 18.8CY 0.1 99.9 21.0LV 6.7 57.1 36.2 0.1 CATI > CAPI 21.5LT 68.8 30.8 0.4 14.1LU 100.0 18.6HU 100.0 11.1MT 100.0 31.2NL 100.0 1.5AT 58.0 42.0 CAPI < > CATI 22.6PL 100.0 18.5PT 3.9 96.1 18.4RO 100.0 13.6SI 47.2 52.8 CATI > CAPI 24.2SK 99.7 0.3 4.6FI 3.5 96.5 CATI > CAPI 42.7SE 0.2 99.8 CATI > CAPI 2.7UK 100.0 10.4IS 100.0 0.0NO 1.4 98.6 CATI > CAPI 25.1CH 0.3 99.7 CATI > CAPI 3.4
Source: Eurostat (2011), CIQR 2009 / Inventory of best practices for data collection methods in EU-SILC 2009. Percentages for mode split without proxies.

EuropEan Comparability and national bEst praCtiCEs of Eu-silC 25
ing might be necessary. Alternatively, Dillman (2007) suggested unimode approaches where questions are for-mulated in ways that make them suitable across modes but that is not always possible.
• Mode switches allow for a greater flexibility in the fieldwork situation and may increase the response in general and for particular groups. People not participating because of the initial mode offered may have certain charac-teristics (e.g. non-availability of income, often not at home because of the job situation etc.) that are not randomly associated with the variables of interest. If they are responding to other modes this selection error is reduced. Two-way mode switches are more complicated to administer but may prove useful.
• Proxys should be avoided, however, if necessary proxy information may be of better quality than imputation. Clear recommendations when and how to use proxies, also in the selected respondent design, are necessary. It is necessary that the use of proxies is investigated in more detail.
3.2.5 Contact with households, panel cooperation and treatment of nonresponse
The EU-SILC interview is rather demanding for the households, both in content and duration. The survey length as an indicator for burden of participation is a relevant factor for nonresponse. Interview duration is reported on aver-age as 27 minutes over all countries and interview modes [I 283]. A panel like SILC requires special attention and work in gaining and maintaining cooperation of the households.35 Precontacts with households usually take place through advance letters, sometimes combined with brochures or leaflets explaining the purpose of the survey [I 261].
13 countries use incentives to get higher participation rates [I 262-278]:
• 4 use vouchers• 6 small gifts• 3 cash• 6 other incentives.
Most countries give their incentives to responding households only, i.e. conditional on completion of the question-naire for the whole household. Usually the value of the incentives is between a few Euros for small presents and 10 to 30 Euros for vouchers or cash incentives. Only some countries report variation of the value of the incentive depend-ent on the size of the household. The only countries using (also) unconditional incentives are Austria, Finland (both: Statistical brochures before the interview) and the UK (for wave 1 households). The UK uses also special incentives for wave two households (vouchers). Austria also gives conditional incentives after the interview (vouchers, small gifts). A model of lotteries – winners to be drawn from participating households – is applied in Malta and Norway.
Other special measures used during fieldwork to enhance response rates are used by 14 countries. They reported the following [I 296-303]:
• 7 set priorities for processing sample units during the fieldwork period• 11 schedule visits and phone calls• 9 provide specific information material• 1 uses specific incentives• 10 deploy special interviewers
In case of non-successful contacts it is important to know at least something about the non-participants as well. When registers are available these may contain suitable information on the households, address information can be of use and sometimes a call-back approach or special short survey for nonrespondents or interviewers are applied. In total 20 countries reported measures like this to get as many information for the non-participants as possible [I 293-294]. For the attrition in the longitudinal panel households or persons dropping out can be analysed with their infor-mation from the last available wave.
35) For a review on tracing practices and the longitudinal aspect of SILC from fieldwork perspective refer to Iacovou/Lynn 2013.

26 EuropEan Comparability and national bEst praCtiCEs of Eu-silC
Nonresponse bias was assessed by 14 countries. They used one or more of the following methods (I 308-313]:
• 7 did evaluations of coherence with other data sources• 8 analysed subgroup response rates• 10 used statistical models for response probabilities of special subgroups• 3 compared indicators calculated according to different weighting schemes
Finally, 24 of countries performed nonresponse adjustments to counteract bias:
• 16 through weighting• 22 through calibration• 3 through model based estimators
As concerns the analysis of nonresponse a further comment has to be made concerning the coding. Through anal-ysis of the UDB data and in-depth interviews we came to the conclusion that at the moment the coding of nonre-sponse is inconsistent between countries. The reason is that requirements of the regulation and recommendations in Doc065 are unclear or do not conform to the actual field situations. One example is that of variable DB120 “Con-tact at address”: For some countries we encountered a rather high percentage of “unable to access” addresses. Orig-inally this code was reserved for households that cannot be contacted by the interviewer because of long lasting weather or geographic factors. It is actually used, tough, also for the CATI case when the telephone number doesn’t work, answering machine or nobody picks up the phone etc. Since there was no special code for this foreseen in the regulation some countries agreed this coding with Eurostat.36 So the problem as seen on this example is that docu-mentation and data reality have grown apart in some cases during the first years of EU-SILC. This, of course, makes quality control a more difficult task. It is recommended to review and if necessary incorporate these special codes in the new SILC legislation.
Recommendations for interaction with household and panel care:
• Panel participation is best gained if the purpose of the survey is clear and the commitment to participate not only once but in a panel is sought. So, communication with the households has to be clear on this point from the beginning.
• The use of incentives is most helpful if it can be communicated as a symbolic reward to participating household, instead of material compensation for their time. When and what to use as an incentive seems to vary culturally. Incentives usually work selectively so that they may be used to appeal in particular to the hardest to reach groups, while at the same time caution is warranted to avoid introducing bias.
• Not only advance letters but also refusal conversion letters and communication in between waves are a good means to keep up the communication with the households.
• Methods should be investigated to prevent and correct unbalanced samples by use of paradata. Responsive design can steer the contact and refusal conversion attempts over to parts of the sample that are not balanced (cf. Heeringa and Groves 2006).
• Recommend a specific case coding scheme like the one provided by the American Association for Public Opin-ion Research (AAPOR). That one is suitable for EU-SILC.37
36) The concrete example has been confirmed by the Netherlands and Sweden in the in-depth telephone interviews.
37) http://www.aapor.org/AAPORKentico/Communications/AAPOR-Journals/Standard-Definitions.aspx (retrieved 2015-02-06). Codes for survey outcome and calculation of outcome rates is a topic for constant debate (AAPOR 2014): “Although response rate information alone is not suf-ficient for determining how much nonresponse error exists in a survey, or even whether it exists, calculating the rates is a critical first step to understanding the presence of this component of potential survey error. By knowing the disposition of every element drawn in a survey sample, researchers can assess whether their sample might contain nonresponse error and the potential reasons for that error.”

EuropEan Comparability and national bEst praCtiCEs of Eu-silC 27
4 Coherence of cross-sectional and longitudinal estimates in EU-SILC
In the previous chapter a description of the various challenges EU-SILC poses in terms of data collection was pre-sented. This chapter will deal with different ways of using these data as a basis for estimation. A reasonable way to assess the quality is to compare estimates of indicators such as the at-risk-of-poverty rate on the basis of longitu-dinal or cross-sectional data.
For a large part the samples of the two-year longitudinal panel and the cross-section overlap. As was already described in chapter 2.2 the cross-section consists of four rotations and the longitudinal two-year panel of three. These three rotations which commenced in 2006, 2007 and 2008 also include new entries from the year 2009, who are new-borns and persons moving into the selected households. Of these migrants only those who move in from outside the popu-lation (e.g. from abroad or institutionalised households) are of concern from a design based perspective of estimation, because they, together with new-borns, represent population change. Persons moving in from other households in the population do not change the mass of the grossed up population.38 Each of the rotations belonging to the longi-tudinal dataset should deliver estimates which are representative for the population, if they are weighted by the base weights (RB060), because the base weights incorporate the calibrated final weights of the first year of the respective rotation and should account for attrition and in- and outflows due to migration, death and new-borns during the fol-low-up years. Therefore, estimators based on the longitudinal and cross-sectional sample should be (nearly) unbi-ased and should also deliver similar results. Differences of estimators based on longitudinal and cross-sectional data should only be due to population change. Estimators based on the cross-section (XQ(t)) of a given year t can be viewed as a function of the balanced panel population of the years (t-1, t) evaluated in year t (XP(t)) and the “inflow-population” (INflow) of year t (XIN(t)). The INflow consists of births, migrants (from abroad) and persons leaving non-private house-holds (e.g. dormitories, boarding schools, prisons) and entering private households. Figure 3 shows the segmentation of the cross-section of year t and the constant mass of the balanced panel of year t-1 and t.
Figure 4: Two-year longitudinal and cross-sectional populations of EU-SILC
Source: own depiction.
A discrepancy between estimates based on the two-year longitudinal panel (XP(t)) and the cross-section (XQ(t)) came up with EU-SILC 2007 in Austria. Estimates for the at-risk-of-poverty rate based on the two-, three- or four-year panel turned out to be about 2 percentage points lower than the estimate based on the cross-section (cf. Table 6). This dis-crepancy could not be attributed to differences in the referring populations (absence of the INflow population in the
38) These so-called “co-residents” receive a zero base weight and therefore do not affect the respective household weights. However, they receive a household weight by averaging weights over all persons within the household. Cf. Eurostat (2013) p. 33ff.
Statistics Austria Work Package (WP) CO&ME-LONGIT.1
perspective of estimation, because they, together with new-borns, represent population change. Persons moving in from other households in the population do not change the mass of the grossed up population. 42 Each of the rotations belonging to the longitudinal dataset should deliver estimates which are representative for the population, if they are weighted by the base weights (RB060), because the base weights incorporate the calibrated final weights of the first year of the respective rotation and should account for attrition and in- and outflows due to migration, death and new-borns during the follow-up years. Therefore, estimators based on the longitudinal and cross-sectional sample should be (nearly) unbiased and should also deliver similar results. Differences of estimators based on longitudinal and cross-sectional data should only be due to population change. Estimators based on the cross-section (XQ(t)) of a given year t can be viewed as a function of the balanced panel population of the years (t-1, t) evaluated in year t (XP(t)) and the “inflow-population” (INflow) of year t (XIN(t)). The INflow consists of births, migrants (from abroad) and persons leaving non-private households (e.g. dormitories, boarding schools, prisons) and entering private households. Figure 3 shows the segmentation of the cross-section of year t and the constant mass of the balanced panel of year t-1 and t. Figure 4: Two-year longitudinal and cross-sectional populations of EU-SILC
Source: own depiction.
A discrepancy between estimates based on the two-year longitudinal panel (XP(t)) and the cross-section (XQ(t)) came up with EU-SILC 2007 in Austria. Estimates for the at-risk-of-poverty rate based on the two-, three- or four-year panel turned out to be about 2 percentage points lower than the estimate based on the cross-section (cf. Table 6). This discrepancy could not be attributed to differences in the referring populations (absence of the INflow population in the panel samples) which can only be accountable for 0.4 percentage points difference at most. The standard error for the at-risk-of-poverty rate can cause a deviation of about 1 percentage point.
In order to establish coherence, EU-SILC in Austria introduced a longitudinal weight calibration procedure, where the panel rotations are calibrated on the part of the cross-sectional sample (including calibration on the median equivalised income and the at-risk-of-poverty-rate) which belongs to the balanced panel population. In addition to the marginal distributions used in the
42 These so-called “co-residents” receive a zero base weight and therefore do not affect the respective household weights. However, they receive a household weight by averaging weights over all persons within the household. Cf. Eurostat (2013) p. 33ff.
Balanced Panel Population
Balanced Panel Population
INflow (birth, migr. etc)
OUTflow (death, migr. etc.)
xQ(t) = f[ xP(t) , xIN(t)]
X-section X-section tt-1
31

28 EuropEan Comparability and national bEst praCtiCEs of Eu-silC
panel samples) which can only be accountable for 0.4 percentage points difference at most. The standard error for the at-risk-of-poverty rate can cause a deviation of about 1 percentage point.
In order to establish coherence, EU-SILC in Austria introduced a longitudinal weight calibration procedure, where the panel rotations are calibrated on the part of the cross-sectional sample (including calibration on the median equivalised income and the at-risk-of-poverty-rate) which belongs to the balanced panel population. In addition to the marginal dis-tributions used in the cross-sectional weighting procedure (household size, tenure status, region, age, sex, citizenship, beneficiaries of unemployment benefits) the longitudinal calibration procedure also adjusted weights to the number of individuals belonging to the population not covered in the panel (migrants and new-borns) as well as the number of persons below the median equivalised income and the number of persons below the at-risk-of-poverty threshold. With this procedure coherence between the cross-sectional and the longitudinal samples could be established. As it can be seen in Table 6, after longitudinal calibration, estimates only differ by a small amount which is attributable to differences in the referring populations caused by the absence of the INflow population in the panel population.
Later survey years in Austria showed a gain in coherence of estimates of the at-risk-of-poverty rate. In 2009 the dis-crepancy ranged from 0.3 to 0.0 percentage points. Longitudinal calibration was still carried out in order be method-ologically consistent and also to be able to counter possible future discrepancies beforehand.
In Austria the gain in coherence from 2008 onwards is mainly due to a change in fieldwork. Until 2007 the fieldwork was conducted mainly by external institutes using the CAPI technique (Computer Assisted Personal Interviewing). In 2008 the entire fieldwork was taken over by Statistics Austria and also the CATI technique (Computer Assisted Tele-phone Interviewing) was used for a large part for follow-up households. It seems that the improved quality of the field-work caused a gain in coherence of cross-sectional and longitudinal estimates.
The question now arises if such discrepancies between cross-sectional and longitudinal estimates can also be found in other countries participating in EU-SILC. If there is lack of coherence in certain countries, sources of incoherence should be scrutinised.
4.1 Coherence of longitudinal and cross-sectional estimates in different EU countries
The following coherence assessment will focus on the two-year panel 2008-2009. The focus on the two-year panel is based on the fact that it reflects the more recent fieldwork situations best. Also differences due to standard error and population change play a more important role in the longer two-year and three-year panels.
Comparisons will also focus on the at-risk-of-poverty rate (ARP) instead of the central Europe 2020 indicator “at-risk-of-poverty or social exclusion” since not all the variables required for this indicator are available in the longitudinal data of EU-SILC. Hence, the difference Δ in estimates can simply be written as the difference of ARP based on the two-year panel (L2) and the cross-section (CS): Δ = ARPL2 - ARPCS (1)
However, a comparison of the at-risk-of-poverty rate based on longitudinal and cross-sectional data sets only makes sense, if the referring populations are comparable. Let A be the percentage of new-borns and migrants in year t and B the difference of the indicator for nationals minus foreigners, then the cross-sectional estimate adjusted by the INflow population ARPCSadj can be written as follows: ARPCSadj = ARPCS + (A x B) (2)
Table 6: At-risk-of-poverty before & after longitudinal calibration
x-section 2-yr panel 3-yr panel 4-yr panel
before 12.0 10.2 9.8 10.2after 12.0 11.6 11.5 11.5
Source: EU-SILC in Austria 2007.

EuropEan Comparability and national bEst praCtiCEs of Eu-silC 29
The adjusted difference Δ’ simply facilitates the adjusted cross-sectional sample: Δ‘ = ARPL2 - ARPCSAdj (3)
The final step in the coherence assessment lies in expressing the adjusted difference Δ’ in relation to the standard error of this difference. The standard error of Δ’ is calculated under the simplified assumption of independent samples: SE(Δ‘) = Sqrt(VAR(ARPCSadj) + VAR(ARPL2)) (4)
Finally, the adjusted difference, corrected by its standard error is defined as follows:
Δ‘‘ = |Δ‘|/SE(Δ‘) (5)
Table 7 shows the results of the comparison of the at-risk-of-poverty rate estimated on the basis of the adjusted cross-sectional sample [3] of 2009 and the two-year panel 2008-2009 [1], where the main focus lies on the adjusted difference [4].
In Table 7 five countries with high (red) and with low discrepancies (blue) can be identified. However, for the majority of countries these differences are rather small in relation to the standard error of the difference.
In the following sections a descriptive analysis of certain sources of lack of coherence will be scrutinised: unit-nonre-sponse, (longitudinal) weighting and the variation of (estimated) response propensities used in the indicator of rep-
Table 7: At-risk-of poverty rates 2009 obtained from cross-sectional and longitudinal EU-SILC data
Country
At-risk-of-poverty-rate 2009 Difference adj. X-sectional - panel estimate
2-year panel * [1]
full X-data ** [2]
adj. X-data *** [3]
in ppts [4] = [3]-[1]
in % 100 x [4]/[3]
in SE **** |[4]/SE[4]|
PT 17.8 17.9 17.8 0.0 0.1 0.0AT 11.9 12.0 11.9 0.0 0.2 0.1EE 19.6 19.7 19.7 -0.1 -0.6 0.2CY 16.3 16.2 16.2 0.2 1.0 0.2SK 11.0 11.0 10.9 0.1 1.0 0.2CZ 8.4 8.6 8.5 -0.1 -0.1 0.3PL 17.0 17.1 17.1 -0.1 -0.7 0.4BE 14.0 14.6 14.4 -0.4 -2.7 0.7LT 19.7 20.6 20.6 -0.9 -4.2 0.7LV 24.9 25.7 25.7 -0.8 -2.9 0.7HU 12.8 12.4 12.3 0.5 4.2 1.3ES 18.8 19.5 19.4 -0.6 -2.9 1.6IS 8.9 10.2 10.2 -1.2 -12.0 1.6NO 12.9 11.7 11.7 1.2 10.3 1.7LU 12.0 14.9 14.6 -2.6 -18.0 1.7EL 21.4 19.7 19.7 1.7 8.8 2.1UK 16.0 17.4 17.3 -1.2 -7.1 2.4IT 17.7 18.4 18.3 -0.7 -3.5 2.7FR 11.9 12.9 12.7 -0.8 -6.6 3.1NL 9.2 11.1 11.0 -1.7 -16.0 3.4FI 11.8 13.8 13.8 -2.0 -14.0 3.8DK 9.6 13.1 13.1 -3.5 -27.0 4.5SE 7.9 13.3 13.2 -5.3 -40.0 17.9
Source: Eurostat EU-SILC 2009 UDB version 3/2013, own calculations.* Individuals originally sampled in 2008 who were retained in the sample 2009, weighted by RB062.** All individuals in the cross sectional EU-SILC sample weighted by RB050a.*** column [2] is adjusted by the difference of the total at-risk-of-poverty rate and that of the combined subsample of foreigners and new-borns multiplied by the percentage of this group in the total population.**** The (maximum) standard error of the difference is approximated as the square root of the sum of the variance of each estimate, assum-ing no overlap between the cross sectional and the longitudinal samples.

30 EuropEan Comparability and national bEst praCtiCEs of Eu-silC
resentativeness (“R-indicator”) as proposed by the RISQproject.39 In the final sub-section a multiple linear regression model will be fitted that will use the abovementioned measures as predictors for coherence.
4.2 Unit nonresponse and coherence
Based on the longitudinal SILC UDB data of 2008 and 2009 response rates were calculated for several countries. The unit nonresponse rate is defined as follows:
NR:= 1
number of persons with surveyed information in year tnumber of persons eligible from year t -
(6)
Eligibility in year t-1 was defined using the household status (DB110), the personal membership status (RB110) from year t-1. The unit nonresponse rate for all rotational subsamples contributing to the panel 2008-2009 varies consider-ably across countries as can be seen in Figure 5.
A lack of coherence between cross-sectional and longitudinal estimates may stem from a comparatively high unit non-response rate. If unit nonresponse does not happen completely at random, adjustments have to be made to weights in order to compensate for selective nonresponse. Principally high unit nonresponse does not directly imply high non-response bias, but if weight adjustments do not capture all groups of nonrespondents that cause biased estimates of important survey variables, selective nonresponse may come more into effect if its rate is high.
So the underlying hypothesis here is:
H1: The higher the unit nonresponse, the lower coherence between cross-sectional and longitudinal estimates.
As Figure 5 indicates, there does not seem to be an obvious, monotone relationship between high unit nonresponse rate and lack of coherence. The countries in Figure 5 are ordered from low to high coherence (from left to right) based on the difference adjusted by standard errors described in formula (5).
Figure 5: Unit Nonresponse rates 2008-2009 by country
Source: Eurostat EU-SILC 2009 UDB version 3/2013, own calculations
Pearson’s correlation coefficient of Δ’’ ~ NR has a value of 0.12, which is rather low and indicates rising incoherence by rising unit nonresponse. The difference Δ’’ has some high and many low values, especially Sweden is an outlier.
39) Cf. http://www.risq-project.eu/indicators.html (retrieved 2015-02-06)
Statistics Austria Work Package (WP) CO&ME-LONGIT.1
Source: Eurostat EU-SILC 2009 UDB version 3/2013, own calculations Pearson’s correlation coefficient of Δ’’ ~ NR has a value of 0.12, which is rather low and indicates rising incoherence by rising unit nonresponse. The difference Δ’’ has some high and many low values, especially Sweden is an outlier. Excluding Sweden from the analyses delivers a different picture in favour of hypothesis H1, because now the correlation of Δ’’ ~ NR amounts to 0.49 showing a rather strong relation between rising unit nonresponse and rising incoherence. Figure 6 shows a scatterplot of this relation. A tendency of lower coherence by higher unit nonresponse can be fitted to the data. However, this trend is not particularly obvious. The r-square of the corresponding linear regression, i.e. Δ’’ ~ NR, is rather low (R2=0.24) indicating that overall only a rather small part of the dispersion of the coherence across countries can be explained by unit nonresponse. While, in general, low nonresponse ensures also high coherence, the degree to which higher nonresponse implies incoherence seems to depend on other factors as well.
-
5
10
15
20
25
30
SE DK FI NL FR IT UK GR LU NO IS ES HU LV LT BE PL CZ SK CY EE AT PT
Uni
t non
resp
onse
rate
2-y
ear p
anel
35

EuropEan Comparability and national bEst praCtiCEs of Eu-silC 31
Excluding Sweden from the analyses delivers a different picture in favour of hypothesis H1, because now the correla-tion of Δ’’ ~ NR amounts to 0.49 showing a rather strong relation between rising unit nonresponse and rising incoher-ence. Figure 6 shows a scatterplot of this relation. A tendency of lower coherence by higher unit nonresponse can be fitted to the data. However, this trend is not particularly obvious. The r-square of the corresponding linear regression, i.e. Δ’’ ~ NR, is rather low (R2=0.24) indicating that overall only a rather small part of the dispersion of the coherence across countries can be explained by unit nonresponse. While, in general, low nonresponse ensures also high coher-ence, the degree to which higher nonresponse implies incoherence seems to depend on other factors as well.
Figure 6: Unit Nonresponse rate and coherence
Source: Eurostat EU-SILC 2009 UDB version 3/2012, own calculations
4.3 Weighting and coherence
As shown in Figure 2 both the cross-sectional and the longitudinal sample should facilitate nearly unbiased estimation of indicators. Cross-sectional weights should include calibration as a means of countering unit nonresponse whereas longitudinal weights rely on the correct adjustment of base weights in terms of unit nonresponse. Since every adjust-ment of base weights to this attrition introduces new information and therefore additional variance, a hint of absent or insufficiently executed nonresponse weighting, may be indicated by a small variation of longitudinal weights.40
Since the mean of the weights differs by country, the variance is not the ideal measure for comparing the dispersion of longitudinal weights. In this case, the coefficient of variation (CV) is more appropriate. So in this context the follow-ing hypothesis is of relevance:
H1: The higher the coefficient of variation of the longitudinal weight (rb062), the higher coherence.
Again, coherence is operationalised by the standard error adjusted difference of longitudinal and cross-sectional esti-mates (Δ’’).
40) It is assumed here that unit nonresponse does not occur completely at random. If the missing data mechanism was completely at random (MCAR) the base weights would only have to be scaled up by a constant factor which would not influence the CV. Also the case of no attri-tion is not taken into account. In that case the base weights of the preceding year would be almost identical to RB062 (except for adjust-ments for new migrants, cf. Eurostat 2013, p. 39), leading to a low CV of RB062. However, this case does not happen in practice. Furthermore, also a small group of nonrespondents may cause recognisable bias. The underlying assumption that the CV is not influenced by the amount of attrition is also indicated in the analysed UDB data by a linear correlation of almost zero between the unit nonresponse rate of the 2-year panel and the CV of the longitudinal weight RB062 (cf. Table 8).
Statistics Austria Work Package (WP) CO&ME-LONGIT.1
Figure 6: Unit Nonresponse rate and coherence
Source: Eurostat EU-SILC 2009 UDB version 3/2012, own calculations
4.3 Weighting and coherence
As shown in Figure 2 both the cross-sectional and the longitudinal sample should facilitatenearly unbiased estimation of indicators. Cross-sectional weights should include calibration as a means of countering unit nonresponse whereas longitudinal weights rely on the correct adjustment of base weights in terms of unit nonresponse. Since every adjustment of base weights to this attrition introduces new information and therefore additional variance, a hint of absent or insufficiently executed nonresponse weighting, may be indicated by a small variation of longitudinal weights.44
Since the mean of the weights differs by country, the variance is not the ideal measure for comparing the dispersion of longitudinal weights. In this case, the coefficient of variation (CV) is more appropriate. So in this context the following hypothesis is of relevance:
H2: The higher the coefficient of variation of the longitudinal weight (rb062), the higher coherence.
Again, coherence is operationalised by the standard error adjusted difference of longitudinal and cross-sectional estimates (Δ’’).
44 It is assumed here that unit nonresponse does not occur completely at random. If the missing data mechanism was completely at random (MCAR) the base weights would only have to be scaled up by a constant factor which would not influence the CV. Also the case of no attrition is not taken into account. In that case the base weights of the preceding year would be almost identical to RB062(except for adjustments for new migrants, cf. Eurostat 2013, p. 39), leading to a low CV of RB062. However, this case does not happen in practice. Furthermore, also a small group of nonrespondents may cause recognisable bias. The underlying assumption that the CV is not influenced by the amount of attrition is also indicated in the analysed UDB data by a linear correlation of almost zero between the unit nonresponse rate of the 2-year panel and the CV of the longitudinal weight RB062 (cf. Table 8).
36

32 EuropEan Comparability and national bEst praCtiCEs of Eu-silC
Figure 7: Coefficient of variation for longitudinal weights (rb062) by country
Source: Eurostat EU-SILC 2009 UDB version 3/2013, own calculations.
The countries in Figure 7 are again ordered by ascending coherence from left to right. As in Figure 5, no obvious ten-dency can be seen. However, the very low CV of Sweden needs some explanation. Consultation with Statistics Swe-den gave some insights to the weighting process of EU-SILC in Sweden. It seems that using only marginal distribution on age and gender in calibration of the base weights from the first survey year leads to the observed small variation of longitudinal weights.
The correlation of Δ’’ ~ CV(RB062) has a negative value (-0.28) and is rather low, but indicates that the hypothesis H2 mentioned above seems to be true. However, the corresponding linear regression shows a very poor model fit (R2=0.08). Filtering for outliers, i.e. excluding Sweden from the analyses, shows a stronger correlation of Δ’’ ~ CV(RB062) in the opposite direction with a value of 0.30. This means that the relation suspected in H2 does not seem to be accurate. Higher variation of longitudinal weights may indicate lower coherence. A linear regression with Δ’’ as dependent and CV(RB062) as independent variable resulted in a model with a rather poor fit of (R2=0.09). This weak linear correlation can also be seen in Figure 8.
Figure 8: Coefficient of variation for longitudinal weights (rb062) and coherence
Source: Eurostat EU-SILC 2009 UDB version 3/2013, own calculations
Statistics Austria Work Package (WP) CO&ME-LONGIT.1
Figure 7: Coefficient of variation for longitudinal weights (rb062) by country
Source: Eurostat EU-SILC 2009 UDB version 3/2013, own calculations
The countries in Figure 7 are again ordered by ascending coherence from left to right. As in Figure 5, no obvious tendency can be seen. However, the very low CV of Sweden needs some explanation. Consultation with Statistics Sweden gave some insights to the weighting process of EU-SILC in Sweden. It seems that using only marginal distribution on age and gender in calibration of the base weights from the first survey year leads to the observed small variation of longitudinal weights.
The correlation of Δ’’ ~ CV(RB062) has a negative value (-0.28) and is rather low, but indicates that the hypothesis H2 mentioned above seems to be true. However, the corresponding linear regression shows a very poor model fit (R2=0.08). Filtering for outliers, i.e. excluding Sweden from the analyses, shows a stronger correlation of Δ’’ ~ CV(RB062) in the opposite direction with a value of 0.30. This means that the relation suspected in H2 does not seem to be accurate. Higher variation of longitudinal weights may indicate lower coherence. A linear regression with Δ’’ as dependent and CV(RB062) as independent variable resulted in a model with a rather poor fit of (R2=0.09). This weak linear correlation can also be seen in Figure 8.
10
30
50
70
90
110
130
150
SE DK FI NL FR IT UK GR LU NO IS ES HU LV LT BE PL CZ SK CY EE AT PT
CV(
RB0
62) i
n %
37
Statistics Austria Work Package (WP) CO&ME-LONGIT.1
Figure 8: Coefficient of variation for longitudinal weights (rb062) and coherence
Source: Eurostat EU-SILC 2009 UDB version 3/2013, own calculations
4.4 Indicator of representativeness and coherence
The main reason for nonresponse adjustments of weights is to counter potential bias. Bias of an estimator may occur if nonresponse is selective in terms of characteristics related to the estimator. For example, if migrants are more likely to be at-risk-of-poverty then comparatively high nonresponse rates of this group would lead to an underrepresentation in the response set and therefore to a systematic underestimation of the at-risk-of-poverty rate. If such selective unit nonresponse exists, weight adjustments (e.g. inverses of estimated response propensities, calibration) become necessary. If these adjustments are carried out differently for cross-sectional or longitudinal weights then estimates based on cross-sectional or longitudinal data may differ. Based on quality reports and feedback from certain national statistical institutes it is assumed that cross-sectional estimates are principally more reliable, because the cross-sectional weighting procedure incorporates adjustments to sampling design, unit nonresponse and calibration to external sources. Longitudinal weights rely mostly on a year by year base weight adjustment by estimated response propensities. Further adjustments like calibration are usually not carried out for longitudinal weights.
The previous chapter showed that there is only a little correlation between the dispersion of longitudinal weights and coherence. However, this comparison has an important shortcoming. The weighting procedures applied for longitudinal weights may differ considerably from country to country and so results may be distorted.
As was already laid out in Figure 2, longitudinal weights are base weights corrected for attrition. According to Eurostat guidelines these weight adjustments should be carried out by dividing base weights by estimated response propensities.45 Preferably, response propensities should be estimated by logistic regressions.
45 Cf. Eurostat document EU-SILC 065 2009 operation, p. 35ff.
38

EuropEan Comparability and national bEst praCtiCEs of Eu-silC 33
4.4 Indicator of representativeness and coherence
The main reason for nonresponse adjustments of weights is to counter potential bias. Bias of an estimator may occur if nonresponse is selective in terms of characteristics related to the estimator. For example, if migrants are more likely to be at-risk-of-poverty then comparatively high nonresponse rates of this group would lead to an underrepresenta-tion in the response set and therefore to a systematic underestimation of the at-risk-of-poverty rate. If such selective unit nonresponse exists, weight adjustments (e.g. inverses of estimated response propensities, calibration) become necessary. If these adjustments are carried out differently for cross-sectional or longitudinal weights then estimates based on cross-sectional or longitudinal data may differ. Based on quality reports and feedback from certain national statistical institutes it is assumed that cross-sectional estimates are principally more reliable, because the cross-sec-tional weighting procedure incorporates adjustments to sampling design, unit nonresponse and calibration to exter-nal sources. Longitudinal weights rely mostly on a year by year base weight adjustment by estimated response pro-pensities. Further adjustments like calibration are usually not carried out for longitudinal weights.
The previous chapter showed that there is only a little correlation between the dispersion of longitudinal weights and coherence. However, this comparison has an important shortcoming. The weighting procedures applied for longitu-dinal weights may differ considerably from country to country and so results may be distorted.
As was already laid out in Figure 2, longitudinal weights are base weights corrected for attrition. According to Eurostat guidelines these weight adjustments should be carried out by dividing base weights by estimated response propen-sities.41 Preferably, response propensities should be estimated by logistic regressions.
A measure that compares the deviation of estimated response propensities by categories of variables known for both respondents and nonrespondents is the so-called “R-Indicator”.42 It is a measure of the dispersion of estimated response propensities. If the missing data mechanism leading to unit nonresponse is MCAR (missing completely at random) then all response propensities are constant and the R-Indicator amounts to 1. Its lower bound varies with the nonre-sponse rate and reaches its lowest value of zero at a nonresponse rate of 50%. The extreme values of 0% and 100% nonresponse allow for no variation of response propensities and therefore the R-Indicator is equal to 1 in these cases.
Let ˆ iρ be the estimated response propensity and bwi the base weight, i.e. RB060 from the previous year t-1. The indi-cator of representativeness ˆ ˆ( )iR ρ is defined as follows:
( ) 2
1
1 ˆ1 2 ( )ˆ ˆ1
N
i i ii
R bwN
ρ ρρ=
= − −− ∑ (7)
If there is no selective unit nonresponse all estimated response propensities should be constant leading to a value of 1 for the R-Indicator.
The calculation of the R-Indicator was carried out by applying a macro for the statistical software SAS developed by the RISQ-project (Representativeness Indicators for Survey Quality). Since it is important to use the same variables for every country for the estimation of response propensities implemented for the calculation of the R-Indicator, only var-iables that were filled for all countries could be used in the analysis. Response propensities were estimated by a logis-tic regression model based on characteristics of the year 2008 known for both respondents and nonrespondents of 2009. Explanatory variables for estimation of response propensities are:
• Age-group (10 categories)• Gender• Type of main household income (5 categories)• Deciles of equivalised household income• At-risk-of-poverty
41) Cf. Eurostat document EU-SILC 065 2009 operation, p. 35ff.
42) Cf. Schouten e al., 2009.
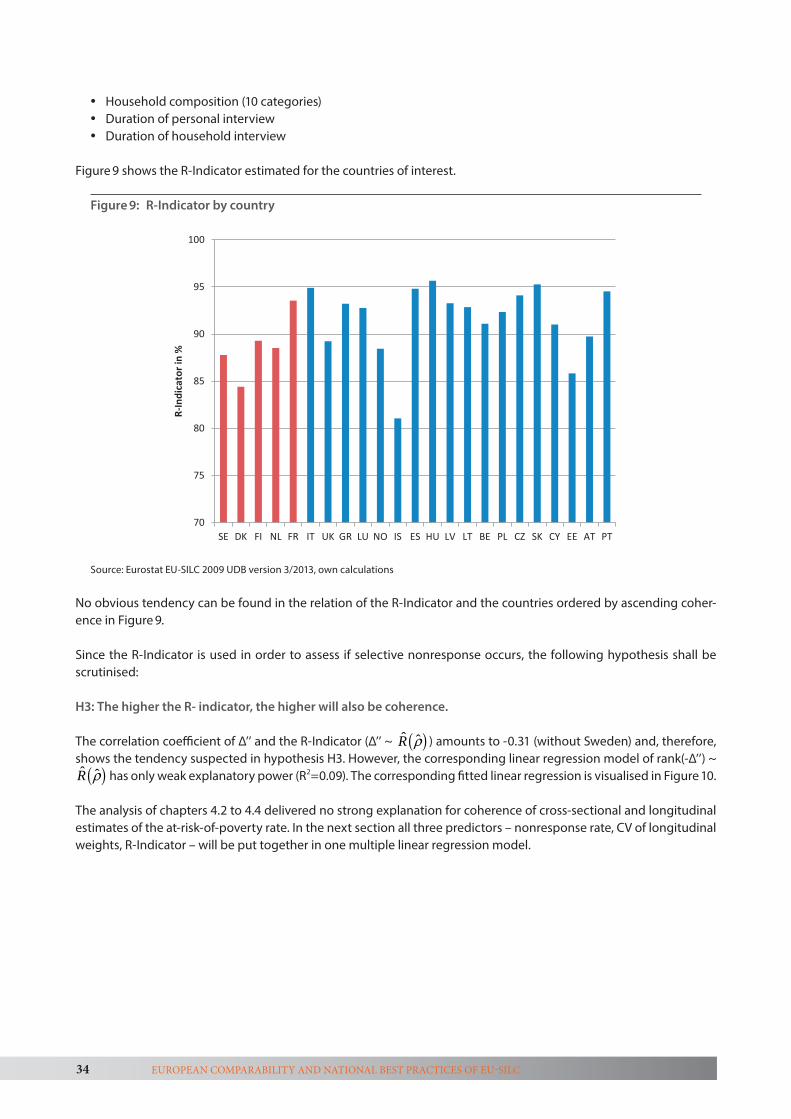
34 EuropEan Comparability and national bEst praCtiCEs of Eu-silC
• Household composition (10 categories)• Duration of personal interview• Duration of household interview
Figure 9 shows the R-Indicator estimated for the countries of interest.
Figure 9: R-Indicator by country
Source: Eurostat EU-SILC 2009 UDB version 3/2013, own calculations
No obvious tendency can be found in the relation of the R-Indicator and the countries ordered by ascending coher-ence in Figure 9.
Since the R-Indicator is used in order to assess if selective nonresponse occurs, the following hypothesis shall be scrutinised:
H3: The higher the R- indicator, the higher will also be coherence.
The correlation coefficient of Δ’’ and the R-Indicator (Δ’’ ~ ( )ˆ ˆR ρ ) amounts to -0.31 (without Sweden) and, therefore, shows the tendency suspected in hypothesis H3. However, the corresponding linear regression model of rank(-Δ’’) ~
( )ˆ ˆR ρ has only weak explanatory power (R2=0.09). The corresponding fitted linear regression is visualised in Figure 10.
The analysis of chapters 4.2 to 4.4 delivered no strong explanation for coherence of cross-sectional and longitudinal estimates of the at-risk-of-poverty rate. In the next section all three predictors – nonresponse rate, CV of longitudinal weights, R-Indicator – will be put together in one multiple linear regression model.
Statistics Austria Work Package (WP) CO&ME-LONGIT.1
Figure 9: R-Indicator by country
Source: Eurostat EU-SILC 2009 UDB version 3/2013, own calculations
No obvious tendency can be found in the relation of the R-Indicator and the countries ordered by ascending coherence in Figure 9.
Since the R-Indicator is used in order to assess if selective nonresponse occurs, the following hypothesis shall be scrutinised:
H3: The higher the R- indicator, the higher will also be coherence.
The correlation coefficient of Δ’’ and the R-Indicator (Δ’’ ~ 𝑅𝑅�(ρ�)) amounts to -0.31 (without Sweden) and, therefore, shows the tendency suspected in hypothesis H3. However, the corresponding linear regression model of rank(-Δ’’) ~ 𝑅𝑅�(ρ�) has only weak explanatory power (R2=0.09). The corresponding fitted linear regression is visualised in Figure 10.
70
75
80
85
90
95
100
SE DK FI NL FR IT UK GR LU NO IS ES HU LV LT BE PL CZ SK CY EE AT PT
R-In
dica
tor i
n %
40
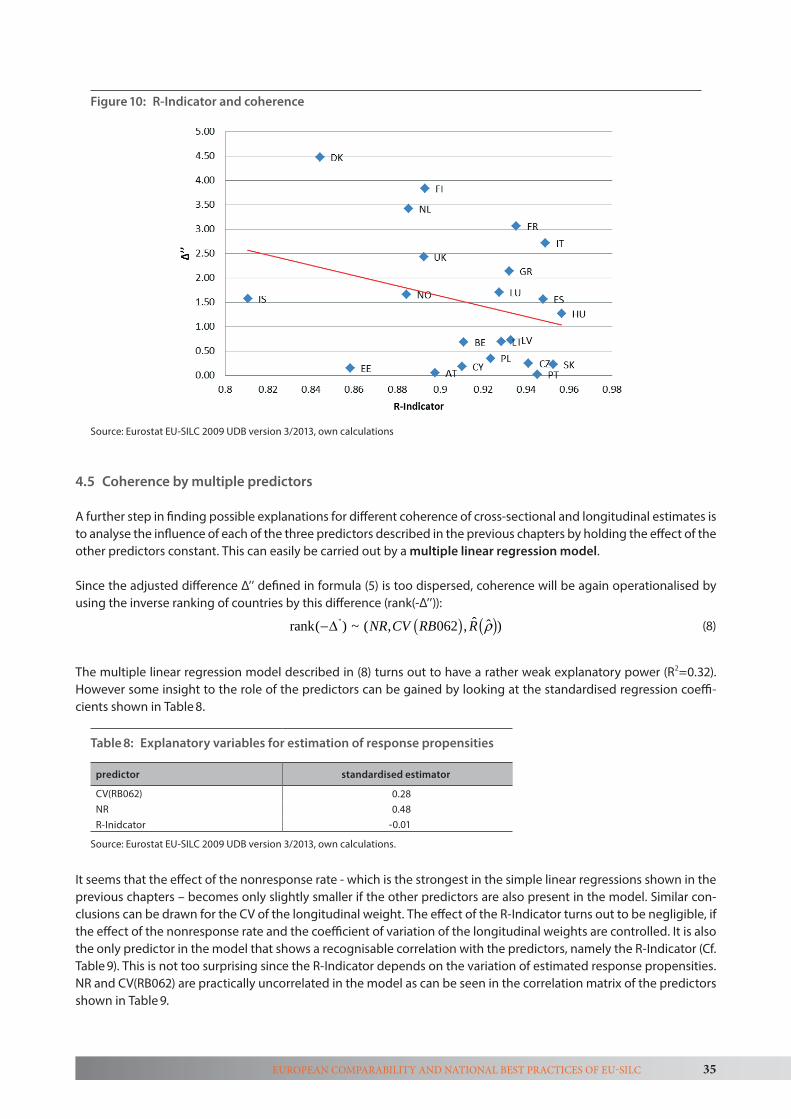
EuropEan Comparability and national bEst praCtiCEs of Eu-silC 35
Figure 10: R-Indicator and coherence
Source: Eurostat EU-SILC 2009 UDB version 3/2013, own calculations
4.5 Coherence by multiple predictors
A further step in finding possible explanations for different coherence of cross-sectional and longitudinal estimates is to analyse the influence of each of the three predictors described in the previous chapters by holding the effect of the other predictors constant. This can easily be carried out by a multiple linear regression model.
Since the adjusted difference Δ’’ defined in formula (5) is too dispersed, coherence will be again operationalised by using the inverse ranking of countries by this difference (rank(-Δ’’)):
( ) ( )''rank( ) ~ ( , 062 , )ˆ ˆNR CV RB R ρ−∆ (8)
The multiple linear regression model described in (8) turns out to have a rather weak explanatory power (R2=0.32). However some insight to the role of the predictors can be gained by looking at the standardised regression coeffi-cients shown in Table 8.
It seems that the effect of the nonresponse rate - which is the strongest in the simple linear regressions shown in the previous chapters – becomes only slightly smaller if the other predictors are also present in the model. Similar con-clusions can be drawn for the CV of the longitudinal weight. The effect of the R-Indicator turns out to be negligible, if the effect of the nonresponse rate and the coefficient of variation of the longitudinal weights are controlled. It is also the only predictor in the model that shows a recognisable correlation with the predictors, namely the R-Indicator (Cf. Table 9). This is not too surprising since the R-Indicator depends on the variation of estimated response propensities. NR and CV(RB062) are practically uncorrelated in the model as can be seen in the correlation matrix of the predictors shown in Table 9.
Statistics Austria Work Package (WP) CO&ME-LONGIT.1
Figure 10: R-Indicator and coherence
Source: Eurostat EU-SILC 2009 UDB version 3/2013, own calculations
The analysis of chapters 4.2 to 4.4 delivered no strong explanation for coherence of cross-sectional and longitudinal estimates of the at-risk-of-poverty rate. In the next section all three predictors – nonresponse rate, CV of longitudinal weights, R-Indicator – will be put together in one multiple linear regression model.
4.5 Coherence by multiple predictors
A further step in finding possible explanations for different coherence of cross-sectional and longitudinal estimates is to analyse the influence of each of the three predictors described in the previous chapters by holding the effect of the other predictors constant. This can easily be carried out by a multiple linear regression model.
Since the adjusted difference Δ’’ defined in formula (5) is too dispersed, coherence will be again operationalised by using the inverse ranking of countries by this difference (rank(-Δ’’)):
rank(−∆′′) ~ (𝑁𝑁𝑁𝑁,𝐶𝐶𝐶𝐶(𝑁𝑁𝑅𝑅062),𝑁𝑁�(ρ�)) (8)
The multiple linear regression model described in (8) turns out to have a rather weakexplanatory power (R2=0.32). However some insight to the role of the predictors can be gained by looking at the standardised regression coefficients shown in Table 8.Table 8: Explanatory variables for estimation of response propensities
Eurostat EU-SILC 2009 UDB version 3/2013, own calculations.
predictor standardised estimator
CV(RB062) 0.28
NR 0.48
R-Inidcator -0.01
41
Table 8: Explanatory variables for estimation of response propensities
predictor standardised estimator
CV(RB062) 0.28NR 0.48R-Inidcator -0.01
Source: Eurostat EU-SILC 2009 UDB version 3/2013, own calculations.

36 EuropEan Comparability and national bEst praCtiCEs of Eu-silC
4.6 Conclusions
The exploration of linear predictors for cross-sectional and longitudinal estimates of the at-risk-of-poverty rate remained somewhat inconclusive. Unit nonresponse of persons in the two-year panel 2008-2009 seems to play the most impor-tant role among the factors considered here. The variation of the (two-year) longitudinal weight also seems to play an important role. It may be that weight adjustments of base weights which are later rescaled to the panel population and adjusted for new migrants do not capture attrition adequately. A calibration step at the end of the longitudinal weighting procedure may be advisable.
However, coherence of cross-sectional and longitudinal estimates may have a variety of different sources within each country. EU-SILC is an output harmonised survey and sample selection, fieldwork and data editing procedures vary con-siderably between countries and all these factors may contribute to coherence in a different and also nonlinear way.
One conclusion that can be drawn from Table 7 is that coherence appears lowest for some register countries (SE, DK, FI, NL). It seems that the selected respondent design (SRD) applied in these countries is an important factor for inco-herence, independent of nonresponse and its selectivity. More work has to be put into the analysis of the effects of the selected respondent model in order to obtain more precise explanation for a lack of coherence between cross-sec-tional and longitudinal estimates in EU-SILC.
5 Summary of recommendations to reach best practice
In the following sub-sections recommendations for the amelioration of data collection and data editing for EU-SILC that can be deduced from the preceding chapters will be presented.
5.1 Recommendations to ensure comparability of estimates between Member States
EU-SILC was initially designed to make comparable analysis on the social situation of persons in private households throughout the EU. The main idea was to prefer comparable results to comparable methods; however, it is question-able if true comparability can be reached with limited number of common standards.
• Countries are in a difficult position. Before the launch of EU-SILC a number of them already had similar surveys in place with an established set of questions and methodology with a steady and informed user base. Thus, there is an inherent conflict between very clear national interests and more distant international interests. This imbal-ance needs to change. The international and comparative interests need to be conveyed more clearly to the member states and research and reforms based on the results of the survey should be made more visible. These surveys are expensive undertakings and countries need all stimulation possible when doing this difficult job.
• When going through the lifecycle of an international survey it is rather obvious that some processes are more familiar to survey managers than others. Traditionally competence is very high when it comes to process steps such as sampling, frame construction, nonresponse reduction, nonresponse adjustment and documentation. Competencies regarding conceptualisation, measurement, translation, quality assurance and quality control methods may be less developed. Thus there is need for capacity building in these latter areas with an emphasis on the multinational and multicultural context.
Table 9: Correlations of explanatory variables
CV(RB062) NR R-Indicator
CV(RB062) 1.00 0.02 0.08NR 0.02 1.00 0.56R-Indicator 0.08 0.56 1.00
Source: Eurostat EU-SILC 2009 UDB version 3/2013, own calculations.
EuropEan Comparability and national bEst praCtiCEs of Eu-silC 37
• Country reports also show that there is a lack of knowledge regarding new methods such as responsive design, paradata, cognitive elements of the response process, and interviewer and other mode effects. This leads to design decisions that are sometimes far from optimal resulting in larger errors and costs than necessary. This lack of competence needs to be improved.
• An efficient way of building capacity among NSI staff will be the review of the CSDI guidelines, the websites of PIAAC, SHARE and the European Social Survey (that recently became an ERIC). Lynn (2009) is a recent mono-graph on longitudinal surveys and Stoop et al (2010) provide an update on how to improve survey response in the European Social Survey. NSI staff should also be encouraged to take advantage of international meetings on survey methodology: The CSDI workshop is conducted every year since 2002. Participants present studies and research on comparative survey issues. Attendance from European NSI’s and Eurostat has been extremely lim-ited over the years. In 2016, a conference on multinational studies will take place in Chicago. Other conferences of interest for EU-SILC people include the yearly American Association for Public Opinion Research. Yearly work-shops also include the nonresponse workshop that meets next time in Reykjavik early September 2014 and the workshop on total survey error that organises a conference in September 2015 in Baltimore.
• Comparability demands strengthening input harmonisation of EU-SILC. The current system where certain prod-uct characteristics are specified by Eurostat and then things are up to the service providers to deliver them, has clear weaknesses. The partly satisfactory documentation in the form of the present quality reports is symp-tomatic of the great variability in methods between Member States. This built-in variability does not gener-ate comparability, nor does it promote continuous improvement. A central team needs to be assigned the task of redesigning the survey so that it becomes similar to other international surveys in terms of infrastructure, methodology and quality. In that redesign work we go from ad hoc to a so called deliberate design where we give comparability another meaning than what is usually the case. In multi-population studies concepts such as equivalence, cultural bias, and response styles become more prominent and have to be studied carefully. That is currently not the case.
5.2 Recommendations to minimise nonresponse bias
Excessive and increasing nonresponse for longitudinal data collections may raise concerns about how representa-tive they can be ultimately putting in question their long term viability. It is, however, important to focus on the preci-sion impact rather than attrition itself. Ultimately, the justification of data collection cost depends on the investments which are made to keep bias low and assess measurement error. “The use of one fourth of the available resources to estimate the variance of the measurement error in order to use measurement error estimation methods can be justi-fied” (Fuller 1990, p 179).
Nonresponse is due to several factors in the field situation as it was shown before – therefore a range of techniques and tactics has to be employed to prevent bias due to this. One single technique will not prove successful (Lynn 2008).
In a panel survey we face the problem of accumulative nonresponse, plus attrition in the panel might be of a different quality than initial nonresponse. For a comprehensive check list of key practices in panel surveys, with the main goal being the reduction of attrition (bias) see Devstat (2012).
In addition to those, we consider the following points as most relevant for EU-SILC:
• A common definition of tracing rules is needed for EU-SILC. As it was shown (ibd. and Iacovou/Lynn 2013), cur-rently countries’ efforts and success in tracing sample persons from wave to wave vary a lot. This is partly due to unclear specifications and practical guidelines.
• Common definitions and use of variable codes for response and drop out reasons are needed. Not all codes proved to be apt for what they were initially intended. A review of the target variables designed to provide those codes is in need (see also AAPOR standards).

38 EuropEan Comparability and national bEst praCtiCEs of Eu-silC
• Measures to increase response rates should be scrutinised and best practise shared between countries. As a begin-ning recommendations for the use of incentives in SILC could be made taking into account a review of existing literature in this context. However, higher response rates do not necessarily mean lower nonresponse bias (cf. Schouten et al. 2009). Measures to increase response, therefore, have to be checked for undesirable side effects of the net-sample getting more selective.
• Patterns of nonresponse for follow-up rotations should be analysed. Such a nonresponse analysis can make use of data from the previous survey year known for both respondents and nonresponse. The aim of this analysis is to make an assessment of possible bias caused by groups not being represented correctly in the respondent sample. This knowledge is the basis of a suitable nonresponse weighting procedure to adjust base weights.
5.3 Recommendations for enhancing coherence between cross-sectional and longitudinal estimates
While the analysis presented in chapter 4 did not reveal a strong and simple linear pattern of rising incoherence caused by either unit nonresponse rate or its selectivity or the dispersion of weights, we can nonetheless draw the following conclusions regarding fieldwork and weighting:
• Member States which had low rates of unit nonresponse between 2008 and 2009 generally also had higher coherence of cross-sectional and longitudinal estimates. It has also been found that Member States which did not ensure systematic tracing of persons that leave the household between two waves exhibit over proportional inconsistencies (cf. chapter 4.2 and 4.5). Consequently, minimising unit nonresponse and adherence to tracing rules must take priority to ensure coherence.43
• Results confirm, that Member States which fail to compensate for selective attrition by adjusting base weights, have to expect higher incoherence. Base weights need to be adjusted by the inverse of the response propensity. As a straight-forward method for estimating the response propensity it is recommended to use logistic regression.44
• Member States which have gone through major design shifts or fail to ensure low nonresponse rates and can-not compensate for selective attrition in their weighting scheme may depart from design based longitudinal weights and ensure coherence by calibration of longitudinal weights.45
5.4 Recommendations for reducing measurement error
To sum up the findings on measurement error, these are our recommendations:
• The variability in questionnaire development must decrease. Currently, member states are allowed to develop very different data collection instruments, which is a violation of all known questionnaire design principles. This practice will generate problems with comparability and has to cease. The only way to improve it is by creating a source questionnaire that is used across all member states. Deviations from this model, for instance by adding questions, should be allowed only if tests show that they do not impact the estimates.
43) An analysis on the longitudinal SILC UDB of 2008 (ver. 4) carried out by ISER showed that in certain countries (DK, FI, IS, NL, NO, SE) young persons (aged 16-25) leaving their parents’ home were not followed up. Cf. Iacovou et al. (2012), ch. 4.2. This group can be assumed to have increased risk of entry into poverty situations.
44) Cf. Eurostat (2013), p. 34ff.
45) In the extreme case, countries that are using a longitudinal calibration of income poverty indicators (AT, SK) enforce a high coherence between cross-sectional and longitudinal estimates of income poverty indicators (cf. Table 7 in chapter 4.1). However, such a forced consistency may cause inconsistencies in terms of other characteristics, but since the persistent at-risk-of-poverty rate is the most important indicator based on longitudinal EU-SILC data consistency for the at-risk-of-poverty rate is more important than possible distortions of other estimates. In any case, comparisons of important variables should be made before and after calibration.

EuropEan Comparability and national bEst praCtiCEs of Eu-silC 39
• When a source questionnaire is in place it will be possible to work with translations and adaptations in more meaningful ways using modern methods such as TRAPD.
• Countries show a very large variation when it comes to interviewer issues. Systematic monitoring is rare com-pared to North America where interviewer variance and fabrication of data are recognised as serious error sources. New software called CARI is used by more and more survey organisations in the U.S. and Canada. This software uses the microphone on the laptop to record the conversation between the interviewer and the respondent. The software is such that monitoring can be administered by sampling interviewers, questions, areas, etc. and it becomes possible to actually estimate the frequencies of various problems, something that has not really been possible in the past. Usually many problems discovered can be traced to the questions, so this is not a quality control of the interviewers only.
• Interviewer workload varies too much and it is also too extensive for many interviewers. A few interpenetration experiments should be conducted so that the interviewer intra-class correlation coefficient can be estimated. This coefficient can be quite high for some of the variables resulting in overstated confidence levels for the asso-ciated estimates.
• Many questions are prone to social desirability bias. Since the interview mode is used we cannot easily escape this problem by using self-administered modes instead. However, there are techniques that can help reduce the effects on the total survey error. Such techniques include placement of such questions, loading them or using other rewording techniques. It is also possible to be more selective when it comes to including such questions in the questionnaire. A source questionnaire would open opportunity for further methodological work.
• The fact that interview length varies so much between countries is a concern. It raises questions about how this metric is obtained. There could also be a question about using estimates, as in PAPI or when EU-SILC is embed-ded into a larger questionnaire, or using actual measurements as in CAPI and CATI, where time is recorded auto-matically. Interview techniques can also play a role. Our study shows that average interview duration is between 13 and 58 minutes. This difference is so large that is plausible to assume that at least in those two extreme coun-tries the calculation method will be different.
• It is common in CAPI and PAPI that the interview is contaminated by other persons being present. We did not ask about this in our member state survey. It is known, however, that this is a common problem and that bystand-ers can make the respondent edit his or her answers. The typical procedure is that the interviewer asks for pri-vacy but that might be impossible to do at the outset, since other persons might be asked to act as interpreters. It can also be difficult for social reasons and for participation to enforce that rule.
• Countries obviously treat language problems differently. EU-SILC needs to investigate this issue in more depth. This is an area where a certain amount of standardisation is justified. It goes without saying that conducting the survey in different languages compared to just one will improve quality. We also fear that the excessive use of proxies in some countries is one way of solving the language problem. Also we do not know if some people in the target populations have been excluded due to language problems.
• The freedom regarding mode choice is not good for quality. Generally PAPI and CAPI do not generate the same response distributions as CATI if applied on identical samples. If that were the case we would not have any issues with so called mode effects. It is quite urgent that mode effect studies be conducted. The current practice, also with some administrative data thrown in at times, is basically out of control from a comparative perspective. One should also start experimenting with self-administered modes, which requires a simpler questionnaire and a lower response burden. The excessive use of proxies is not good. Studies have shown that even factual questions can be problematic since the proxy person formally does not know the answers. But the main issue is whether countries have solved their respondent language problems by proxies interpreting what the inter-viewers say. This has to be investigated in more detail. It is also important to define more rigorously who can serve as a proxy (Groves et al 2009).

40 EuropEan Comparability and national bEst praCtiCEs of Eu-silC
• It would be good to have a common field work period in all countries. That would enhance comparability.
• Currently there is a discussion about the use of opt-in panels and the use of nonprobability sampling in survey research. Those practices are already part of today’s survey work in many areas and are without any doubt part of the future for our entire field. For the time being, though, it is not realistic to explore those avenues.

EuropEan Comparability and national bEst praCtiCEs of Eu-silC 41
6 References
American Association of Public Opinion Research (AAPOR) Standard Definitions:http://www.aapor.org/AAPORKentico/Communications/AAPOR-Journals/Standard-Definitions.aspx (retrieved 2015-02-06)
Agilis (2012): Task 5.1.1 - Working paper with the description of the ‘Income and living conditions dataset’.
Clémenceau, A. and Museux, J.M. (2007): EU-SILC: general presentation of the instrument. In: Eurostat (2007): Comparative EU statistics on Income and Living Conditions: Issues and Challenges. pp. 11-36.
COMMISSION REGULATION (EC) No 1982/2003 of 21 October 2003 implementing Regulation (EC) No 1177/2003 of the European Parliament and of the Council concerning Community statistics on income and living conditions (EU-SILC) as regards the sampling and tracing rules.
COMMISSION REGULATION (EC) No 28/2004 of 5 January 2004 implementing Regulation (EC) No 1177/2003 of the European Parliament and of the Council concerning Community statistics on income and living conditions (EU-SILC) as regards the detailed content of intermediate and final quality reports.
COMMISSION REGULATION (EC) No 1981/2003 of 21 October 2003 implementing Regulation (EC) No 1177/2003 of the European Parliament and of the Council concerning Community statistics on income and living conditions (EU-SILC) as regards the fieldwork aspects and the imputation procedures.
Cross Cultural Survey Guidelines:http://ccsg.isr.umich.edu/ (retrieved 2015-02-06)
CSDI, International Workshop on Comparative Survey Design and Implementation:http://csdiworkshop.org (retrieved 2015-02-06)
Devstat (2012): Outcome of the study on the Assessment of the future design of the EU-SILC longitudinal component. Task 3 – Best practices to reduce and control attrition bias. Eurostat Doc LC-Legal/37-3/12/EN.
De Leeuw, E. (2005): To mix or not to mix data collection modes in surveys. Journal of Official Statistics. Vol. 21, no. 2, pp. 233-255.
De Leeuw/Hox/Dillman (2008): International Handbook of Survey Methodology. New York/London: Lawrence Erlbaum Associates.
Dillman, D. (2007). Mail and Internet Surveys. Wiley.
Eiffe, F.F. and Till, M. (2013): The Longitudinal Component of EU-SILC: Still Underused? Net-SILC2 Working Paper 1/2013.
Eurostat (2011). 2009 COMPARATIVE EU INTERMEDIATE QUALITY REPORT Version 3 – July 2011:http://ec.europa.eu/eurostat/documents/1012329/6064601/2009+EU-IQR.pdf/bd516bd8-398b-4a81-91cb- 5e48f5129461 (retrieved 2015-02-06)
Eurostat (2009). ESS Handbook for Quality Reports:http://ec.europa.eu/eurostat/documents/3859598/5909913/KS-RA-08-016-EN.PDF/3237357a-d671-40b5-a4b5- 706fa28c1121?version=1.0 (retrieved 2015-02-06)
Eurostat (2012): The longitudinal component of EU-SILC: Survey of NSIs, conducted by the Institute for Social and Economic Research at the University of Essex:https://essex.eu.qualtrics.com/SE/?SID=SV_0cwhkAabAK1nxqt (retrieved 2015-02-06)
42 EuropEan Comparability and national bEst praCtiCEs of Eu-silC
Eurostat (2013): Description of target variables. EU-SILC doc 065/13. Eurostat. Luxemburg.
ESS Standards for Quality Reports (2009)
Eurostat (2014): Webpage Introduction to Quality:http://ec.europa.eu/eurostat/web/quality/overview (retrieved 2015-02-06).
European Social Survey (2013). Specification for ESS-ERIC Member and Observer Countries, Round 7, April.
Fuller, W. A. (1990) Analysis of Repeated Surveys, Survey Methodology, Vol. 16, No. 2., pp. 167-180.
Groves, R.M. et al. (2004). Survey Methodology. Hoboken: John Wiley & Sons.
Groves, R.M. et al. (2009). Survey Methodology, 2nd edition: Hoboken: Wiley.
Harkness, J. (2008). Comparative Survey Research: Goal and Challenges. In De Leeuw/Hox/Dillman: International Handbook of Survey Methodology. New York/London: Lawrence Erlbaum Associates, pp 56-77
Harkness, J. et al (eds) (2010). Survey Methods in Multinational, Multiregional, and Multicultural Contexts. Wiley.
Heeringa, S.G. and Groves, R.M. (2006): Responsive Design for Household Surveys:http://deepblue.lib.umich.edu/bitstream/handle/2027.42/71787/?sequence=1 (retrieved 2015-02-06)
Hsiao, C. (2007): Panel data analysis – advantages and challenges, Test, Vol. 16, pp.1-22.Iriondo, I., & Pérez-Amaral, T. (2013). The Effect of Educational Mismatch on Wages Using European Panel Data (No. 700). Queen Mary, University of London, School of Economics and Finance.
Iacovou, M./ Kaminska, O./ Levy, H. (2012): Using EU-SILC data for cross-national analysis: strengths, problems and recommendations. ISER Working paper No. 2012-03:https://www.iser.essex.ac.uk/publications/working-papers/iser/2012-03.pdf (retrieved 2015-02-06)
Iacovou, M. & Lynn, P. (2013): Implications of the EU-SILC following rules, and their implementation, for longitudinal analysis. ISER Working paper No. 2013-17:https://www.iser.essex.ac.uk/publications/working-papers/iser/2013-17.pdf (retrieved 2015-02-06)
International Standards Organization(ISO)(2012). Standard for market, Opinion, and Social Research. ISO 20252, second edition.
Lessler/Eyerman/Wang (2008): Interviewer Training. In: De Leeuw/Hox/Dillman (2008): International Handbook of Survey Methodology. New York/London: Lawrence Erlbaum Associates. pp.442-460.
Lyberg, L. (2012). Survey Quality. Survey Methodology, 38, 2,107-130.
Lyberg, L. and Biemer, P. (2008): Quality Assurance and Quality Control in Surveys. In: De Leeuw/Hox/Dillman (2008): International Handbook of Survey Methodology. New York/London: Lawrence Erlbaum Associates. pp. 421-441.
Lynn, P. The Problem of Nonresponse. In: De Leeuw/Hox/Dillman (2008): International Handbook of Survey Methodology. New York/London: Lawrence Erlbaum Associates. pp. 35-55.
Lynn, P. (ed.)(2009). Methodology of Longitudinal Surveys. Wiley.
Lynn/Jäckle/Jenkins/Sala (2004). The Effect of dependent interviewing on responses to questions on income sources. ISER Working paper No. 2004-16.

EuropEan Comparability and national bEst praCtiCEs of Eu-silC 43
Menard, S. (2005): Longitudinal Studies, Panel, Encyclopedia of Social Measurement, Vol. 2 (2005). Elsevier.
REGULATION (EC) No 1177/2003 OF THE EUROPEAN PARLIAMENT AND OF THE COUNCIL of 16 June 2003 concerning Community statistics on income and living conditions (EU-SILC).
Särndal, C.-E. and Lundström, S. (2005): Estimations in Surveys with Nonresponse. West Sussex: John Wiley and Sons.
Schouten, B., Cobben, F. and Bethlehem, J. (2009). Indicators of representativeness of survey response. Survey Methodology Vol. 35, pp. 101-113. Statistic Canada.
Singer, J. and Willet, J. (2003): Applied longitudinal data analysis – Modeling change and event occurrence. Oxford: University Press.
Statistik Austria (2013): Methodenbericht EU-SILC 2012. Wien.
Stoop, I. et al (2010). Improving Survey Response. Lessons learned from the European Social Survey. Iley.
Törmälehto, V.-M. (2013): Outcomes of the workshop on registers in the context of EU-SILC. Presentation held at the EU-SILC Task Force Legal Revision meeting in February 2013.