european commission final report
TRANSCRIPT

European Commission
Final Report
Collection and analysis of data to inform certain reviews required under Directive 2010/75/EU on industrial emissions (IED): (a) Differentiated thresholds for the rearing of different poultry species; and (b) Capacity thresholds for the simultaneous rearing of different types of animals currently in the scope of the IED within the same installation
AMEC Environment & Infrastructure UK Limited
September 2012
© AMEC Environment & Infrastructure UK Limited September 2012 Doc Reg No. 30310rr001i5
Copyright and Non-Disclosure Notice The contents and layout of this report are subject to copyright owned by AMEC (©AMEC Environment & Infrastructure UK Limited 2012). save to the extent that copyright has been legally assigned by us to another party or is used by AMEC under licence. To the extent that we own the copyright in this report, it may not be copied or used without our prior written agreement for any purpose other than the purpose indicated in this report. The methodology (if any) contained in this report is provided to you in confidence and must not be disclosed or copied to third parties without the prior written agreement of AMEC. Disclosure of that information may constitute an actionable breach of confidence or may otherwise prejudice our commercial interests. Any third party who obtains access to this report by any means will, in any event, be subject to the Third Party Disclaimer set out below.
Third-Party Disclaimer Any disclosure of this report to a third party is subject to this disclaimer. The report was prepared by AMEC at the instruction of, and for use by, our client named on the front of the report. It does not in any way constitute advice to any third party who is able to access it by any means. AMEC excludes to the fullest extent lawfully permitted all liability whatsoever for any loss or damage howsoever arising from reliance on the contents of this report. We do not however exclude our liability (if any) for personal injury or death resulting from our negligence, for fraud or any other matter in relation to which we cannot legally exclude liability.
Document Revisions
No. Details Date
1 Draft final report outline for client comment
4th November 2011
2 Interim Report 1st December 2011
3 Draft Final Report 5th March 2012
4 Final Report 3rd July 2012
5 Final report taking into account Member State feedback
6th September 2012


© AMEC Environment & Infrastructure UK Limited September 2012 Doc Reg No. 30310rr001i5

v
© AMEC Environment & Infrastructure UK Limited September 2012 Doc Reg No. 30310rr001i5
Executive Summary
Introduction
The purpose of this final report is to provide the European Commission with the results of the data collection and analysis for Tasks 3a and 3b of the following study: “Collection and analysis of data to inform certain reviews required under Directive 2010/75/EU on industrial emissions (IED) and to inform Commission Guidance on the content of the baseline report under Article 22 of the IED” (contract number 070307/2011/600007/FRA/C3).
The tasks covered in this report are:
• Task 3a: Gathering and analysing information to support the Commission in reporting in line with Article 73(3)(a) on the establishment in Annex I of the IED of differentiated capacity thresholds for the rearing of different poultry species, including the specific case of quail.
• Task 3b: Gathering and analysing information to support the Commission in reporting in line with Article 73(3)(b) on the establishment in Annex I of the IED of capacity thresholds for the simultaneous rearing of different type of animals within the same installation.
This report and appendices has been updated (September 2012) to take into account feedback received from Member States as part of a consultation undertaken during July-August 2012. The consultation was aimed at correcting any errors in the interpretation of information provided by Member States during the study rather than inviting feedback on the findings of the analysis.
Objectives
The Commission’s review of the IPPC Directive identified a specific problem with regards to scope in that the same threshold (40,000 places) is currently applied for all poultry installations irrespective of the actual species being reared. Different species produce different quantities of manure and slurry (and hence different levels of ammonia emissions as well as other environmental effects) which are not reflected in the current approach. Therefore, Annex I of the original proposals for IED included a disaggregated threshold for poultry broken down by species. In addition, the original proposals included a provision for species other than those listed above in the form of a threshold calculated on the basis of equivalent nitrogen excretion factors compared to the thresholds above. However, these revised thresholds and text were removed by the European Parliament and Council during the co-decision process and a review clause inserted (Article 73(3)(a)). The objective of this task was to revisit this issue, building on data gathered previously and supplemented with additional data gathering.
Furthermore, there is no provision in the existing legislation for bringing under the remit of the IED, installations where there is a mixture of livestock enterprises at a single installation, where no individual enterprise exceeds the

vi
© AMEC Environment & Infrastructure UK Limited September 2012 Doc Reg No. 30310rr001i5
individual species/enterprise type thresholds but, when considered together, the installation may constitute a major pollution risk. The original IED proposal included a change to Annex I of the Directive to address this issue. However, this revision was removed by the European Parliament and Council during the co-decision process but with a provision to revisit this issue at a later date (Article 73(3)(b)).
Data collection
In addition to a review of relevant literature and available datasets, a representative sample of Member States was selected for direct consultation. Relevant European-wide industry trade associations were also consulted. The approach taken and summary of responses received are provided in Section 2 of the report.
Data analysis: differentiated poultry thresholds (Task 3a)
Section 3 of the report presents the analysis for the differentiated poultry thresholds task and is broadly split into two main subsections:
• Section 3.2 – Baseline definition: this sets out the current situation in terms of numbers of installations, emissions, BAT requirements and existing legislation.
• Section 3.3 – Options analysis: this includes a summary of the options considered and their impacts in terms of numbers of installations affected, costs, emission reductions and associated benefits.
The following points can be made in relation to the potential for including differentiated thresholds for different poultry species under the IED based on the review of information and analysis undertaken for this report:
• A number of MSs already regulate different poultry installations through the application of a weighted approach to derive thresholds. There appear to be three main approaches for doing this based on Livestock Units (LU or LSUs), Equivalent Nitrogen Excretion Factors (ENEF) and animal-equivalent (weighted approach based on nitrogen and phosphorus excretion factors as well as other variables). These are described in more detail in Section 3.3.1.
• Data gathered during this study has revealed significant variation in assumptions for both ENEFs and LSUs between sources for each species e.g. ENEFs for broilers vary from 0.24 to 0.61 kg of nitrogen per place per year. This may be reflective of differences in housing and/or feeding strategies as well as inter- and intra-species differences e.g. some MSs provided details for multiple types of a single species such as ducks. However, whilst there are differences between the figures from different sources (where comparable), it is clear that some species (e.g. turkeys) are potentially more polluting than others when comparing values from a single source. This is to be expected considering the size differences between species as well as variations in feeding and housing strategies. This data has been used to derive indicative thresholds for different poultry species (Table 3.19).
• Relatively limited information has been provided by the MSs consulted during this study on the numbers of farms rearing other (non-chicken) poultry species and the number that could be affected by
vii
© AMEC Environment & Infrastructure UK Limited September 2012 Doc Reg No. 30310rr001i5
the application of differentiated thresholds. Based on the limited information provided by three MSs (Italy, Poland and the UK) scaled using Eurostat data for the EU27 and modelling by Alterra and IIASA as part of the IPPC Directive review, the estimated number of poultry installations that could be affected is around 900-3,200 installations based on the differentiated thresholds included in the original IED proposal. The upper estimate is based on a small number of MS responses and therefore should only be taken as a rough estimate of the maximum number of farms that could be affected as farm sizes and species mixes may vary considerably between MSs. This is discussed in greater detail in Section 3.3.2.
• Indicative unit (i.e. per farm) NH3 emission reductions, costs and benefits have been derived based on existing literature sources and applied to the estimate of the total number of farms – laying hen, turkey and duck farms only – that could be affected based on the thresholds included in the original IED proposals. This results in an estimate of NH3 emission reductions of around 4-35 kilotonnes per year which have been monetised using CAFE damage cost functions to give indicative health and environmental benefits of around €40-1,100 million per year. Total annual compliance and administrative costs have been estimated to be in the order of €10-60 million per year although the administrative costs could be much lower if a non-permitting regime (e.g. general binding rules) is applied. The way in which these values have been derived, as well as the associated uncertainties and limitations, is described in Section 3.3.
• In addition to reductions in NH3 emissions, there may also be benefits in terms of reduced odour and dust emissions e.g. as a result of improvements in livestock housing. Emissions of other pollutants such as N2O and methane are not expected to change significantly.
• It is important to note that some farms may already be captured by the IED and/or equivalent national legislation due to the weighted approaches to derive thresholds taken by some MSs. In these instances emission reductions, compliance and administrative costs and benefits could be lower.
Data analysis: mixed activities (Task 3b)
Section 4 of the report presents the analysis for the mixed activities task and follows a similar structure to that of the poultry chapter:
• Section 4.2 – Baseline definition: this sets out the current situation in terms of numbers of installations, emissions, BAT requirements and existing legislation.
• Section 4.3 – Analysis: this includes a summary of the options considered and their impacts in terms of numbers of installations affected, costs, emission reductions and associated benefits.
The following points can be made in relation to the potential for including mixed activities under the IED based on the review of information and analysis undertaken for this report:
• As for poultry, a number of MSs already regulate livestock installations through the application of a weighted approach to derive thresholds. There appear to be three main approaches for doing this based on LU, ENEF and animal-equivalent (weighted approach based on overall pollution potential).

viii
© AMEC Environment & Infrastructure UK Limited September 2012 Doc Reg No. 30310rr001i5
• In both the previous study and the consultation undertaken for this study, it was discovered that MSs do not necessarily have the information available to them to determine the number of farms potentially affected within their territory by the mixed activities rule. Therefore the analysis undertaken for this report is based primarily on data from Eurostat on the number of farms currently just below the individual species thresholds from the IED in order to estimate the number of farms potentially affected. Depending on the percentage of farms just below the existing thresholds that are assumed to be affected, the number of farms that could be affected ranges from around 600 (10%) to 5,900 (100%). A best estimate of the number affected is 10-30% i.e. around 600 to 1,800. The way in which these figures have been estimated is described in more detail in Section 4.3.2.
• As for poultry, indicative unit (i.e. per farm) emission reductions, costs and benefits have been derived based on existing literature sources and applied to the best estimate of the total number of farms that could be affected. This results in an estimate of NH3 emission reductions of around 1-20 kilotonnes per year which have been monetised using CAFE damage cost functions to give indicative benefits of around €15-600 million per year. Total annual compliance and administrative costs have been estimated to be in the order of €10-60 million per year although the administrative costs could be much lower if a non-permitting regime (e.g. general binding rules) is applied. These estimates are highly uncertain due to a lack of data on the number of farms that could be affected as well as the changes that they would be required to make. The way in which these values have been derived, as well as the associated uncertainties and limitations, is described in Section 4.3.
• In addition to reductions in NH3 emissions, there may also be benefits in terms of reduced odour and dust emissions e.g. as a result of improvements in livestock housing. Emissions of other pollutants such as N2O and methane are not expected to change significantly.
• It is important to note that some farms may already be captured by the IED and/or equivalent national legislation due to the weighted threshold approaches taken by some MSs. In these instances emission reductions, compliance and administrative costs and benefits could be lower.
• There are a number of potential practical issues with applying a mixed activities rule depending upon the way in which it is applied. The simplest approach appears to be that based on the existing thresholds in the Directive. This is discussed in greater detail in Section 4.3.6.

ix
© AMEC Environment & Infrastructure UK Limited September 2012 Doc Reg No. 30310rr001i5
Contents
1. Project understanding 1
1.1 This report 1
1.2 Project context 1
1.2.1 IED background 1
1.2.2 Differentiated poultry thresholds 3
1.2.3 Mixed activities 5 1.3 Structure of this report 5
2. Data collection 7
2.1 Overview 7
2.2 Initial review of existing data sources 8
2.3 Member State selection 9
2.4 Stakeholder consultation 11
3. Data analysis: differentiated poultry thresholds 13
3.1 Overview 13
3.2 Baseline definition 13
3.2.1 Numbers of installations 13
3.2.2 Environmental impacts 19
3.2.3 BREF BAT requirements 23
3.2.4 Current regulation 27 3.3 Options analysis 41
3.3.1 Summary of options 41
3.3.2 Number of installations potentially affected 50
3.3.3 Changes in emissions 51
3.3.4 Costs 52
3.3.5 Benefits 54

x
© AMEC Environment & Infrastructure UK Limited September 2012 Doc Reg No. 30310rr001i5
3.3.6 Other potential impacts 54 3.4 Summary 57
4. Data analysis: mixed activities 59
4.1 Overview 59
4.2 Baseline definition 59
4.2.1 Numbers of installations 59
4.2.2 Environmental impacts 61
4.2.3 BREF BAT requirements for pigs 61
4.2.4 Current regulation 65 4.3 Data assessment 67
4.3.1 Overview 67
4.3.2 Number of installations potentially affected 67
4.3.3 Changes in emissions 73
4.3.4 Costs 73
4.3.5 Benefits 74
4.3.6 Practicability of applying rules to calculate thresholds for mixed farms 75
4.3.7 Summary 77
5. Conclusions 78
5.1 Differentiated poultry thresholds 78
5.2 Mixed activities 79
Table 1.1 Elements of the IED of relevance to this study 2 Table 2.1 Overview of data to be gathered for each task 7 Table 2.2 Data sources identified 8 Table 2.3 Overview of data received from Member States in response to the proforma 10 Table 3.1 Poultry species reared in IED poultry farms (France) 14 Table 3.2 Poultry heads and holdings by flock size in Germany 2010 14 Table 3.3 Poultry farms and places (Italy) 15 Table 3.4 Total number of farms and bird places in Poland in 2010 (Poland) 16 Table 3.5 UK poultry numbers in 2011 16 Table 3.6 Number of poultry heads and holdings disaggregated by species in EU27, 2007 17 Table 3.7 Permitting situation 19 Table 3.8 Indicative crude protein and phosphorous levels in BAT-feeds for poultry 24 Table 3.9 Summary of characteristics of BAT for the reduction of emissions from poultry housing 24 Table 3.10 National legislation 28 Table 3.11 Summary of relevant legislation that may impact on the intensive livestock sectors 31 Table 3.12 Livestock numbers thresholds for Annex IX 37

xi
© AMEC Environment & Infrastructure UK Limited September 2012 Doc Reg No. 30310rr001i5
Table 3.13 Measures affecting pigs and poultry units 39 Table 3.14 Thresholds Derived Using an LSU Approach 42 Table 3.15 Mean N excretion factors for a Number of Species 43 Table 3.16 Slaughter weight/N excretion factor ratios 43 Table 3.17 Derived ENEF values and putative thresholds for other poultry species 44 Table 3.18 Overview of data gathered during this study for the three main options for determining thresholds (ENEF, LSU and
animal equivalent) 46 Table 3.19 Indicative thresholds derived for each poultry species using the current threshold for broilers as a reference point
(number of places, rounded) 49 Table 3.20 Summary of derived thresholds using different approaches 50 Table 3.21 Numbers of installations potentially affected (based on thresholds included in original IED proposals) 51 Table 3.22 Costs summary 54 Table 3.23 Benefits summary 54 Table 3.24 Summary of indicative costs and benefits 57 Table 4.1 Number of swine heads and holdings in EU27, 2007 59 Table 4.2 Indicative crude protein and phosphorous levels in BAT-feeds for pigs 61 Table 4.3 Summary of characteristics of BAT for the reduction of emissions from pig housing 62 Table 4.4 BAT requirements for the reduction of emissions from pig manure storage 64 Table 4.5 BAT on land-spreading equipment 65 Table 4.6 National legislation relating to ‘mixed activities’ 66 Table 4.7 Number of holdings in the EU27 just below the Directive thresholds 68 Table 4.8 Number of holdings by Member State just below the Directive thresholds 68 Table 4.9 Number of holdings potentially affected by the mixed activities criterion 72 Table 4.10 Costs summary 74 Table 4.11 Benefits summary 75 Table 4.12 Summary of costs and benefits 77 Table B.3 Historic emissions and projections for agriculture 5 Table B.4 Poultry species reared in IED poultry farms 6 Table 5.5 Nitrogen excretion factors according to poultry species 7 Table 5.6 Animal-equivalents according to poultry species 7 Table B.7 Thresholds and pollutant levels of different poultry (based on CORPEN standards) 9 Table 5.8 Current permitting and planning regime according to size of holding 10 Table 5.9 Holdings below IED threshold covered by the IED due to associated activities 10 Table B.10 Laying hen heads and holdings by flock size, in Germany 2010 11 Table B.11 Broiler heads and holdings by flock size, in Germany 2010 13 Table B.12 Turkey heads and holdings by flock size, in Germany 2010 13 Table B.13 Permitting thresholds under different German laws 15 Table B.14 Poultry farms and places 17 Table B.15 Poultry farms and heads with a threshold of 40000 heads for broilers, guinea fowls, geese and other poultry, 30000
for laying hens, 24000 for ducks, 11500 for turkeys 18 Table B.16 Total number of farms and bird places in Poland in 2010 20 Table B.17 Emissions from poultry installations (note 1) 20 Table B.18 Number of animals and nitrogen excretion rates, Spain 21 Table B.19 Number of places and farms by poultry type, Catalonia 22 Table B.20 Greenhouse gas emissions from agriculture (2009) 22 Table B.21 Poultry heads in the UK, 2009-2011 (thousands) 24 Table B.22 Broiler heads and holdings in the UK, 2005 and 2010 24 Table B.23 Nitrogen Excretion Factors, kg N hd-1 year-1 for livestock in the UK, 2009 25 Table B.24 Summary of compliance and administrative costs for inclusion of additional poultry installations1 27 Table B.25 Summary of emission reductions and associated benefits from inclusion of additional poultry installations 28 Figure 3.1 Number of poultry holdings by number of heads (2007) 18 Figure 3.2 Ammonia emissions disaggregated by poultry species for years 1990-2009 20 Figure 3.3 Ammonia emissions by NFR Code 1990-2009 21 Figure 4.1 MS breakdown of number of holdings for 2003, 2005 and 2007 (breeding sows and other pigs) 60 Figure 4.2 Number of holdings just below the Directive thresholds – MS breakdown 70 Figure 4.3 Number of holdings potentially affected by the mixed activities criterion 71 Figure B.1 Ammonia emissions in the UK, 1990-2009 26
Appendix A Data Proforma Appendix B Stakeholder Consultation

xii
© AMEC Environment & Infrastructure UK Limited September 2012 Doc Reg No. 30310rr001i5
1
© AMEC Environment & Infrastructure UK Limited September 2012 Doc Reg No. 30310rr001i5
1. Project understanding
1.1 This report The purpose of this final report is to provide the Commission with the results of the data collection and analysis for Tasks 3a and 3b of the following study: “Collection and analysis of data to inform certain reviews required under Directive 2010/75/EU on industrial emissions (IED) and to inform Commission Guidance on the content of the baseline report under Article 22 of the IED” (contract number 070307/2011/600007/FRA/C3).
The tasks covered in this report are:
• Task 3a: Gathering and analysing information to support the Commission in reporting in line with Article 73(3)(a) on the establishment in Annex I of the IED of differentiated capacity thresholds for the rearing of different poultry species, including the specific case of quail; and
• Task 3b: Gathering and analysing information to support the Commission in reporting in line with Article 73(3)(b) on the establishment in Annex I of the IED of capacity thresholds for the simultaneous rearing of different type of animals within the same installation.
This report and appendices has been updated (September 2012) to take into account feedback received from Member States as part of a consultation undertaken during July-August 2012. The consultation was aimed at correcting any errors in the interpretation of information provided by Member States during the study rather than inviting feedback on the findings of the analysis. In some instances, Member States have provided additional information of relevance to the study. Whilst it has not been possible to take this into account in the report this information has been summarised in the appendices.
1.2 Project context
1.2.1 IED background
The Commission published its proposal and an impact assessment for a Directive on industrial emissions (Industrial Emissions Integrated Pollution Prevention and Control, IED 1) on 21st December 2007, which consolidated seven existing Directives related to industrial emissions into a single clear and coherent legislative instrument. These existing Directives included titanium dioxide industry related directives (78/176/EEC,
1 “Proposal for a Directive of the European Parliament and of the Council on industrial emissions (integrated pollution prevention and control) (recast)”. European Commission, Brussels, 21st December 2007. Available from: http://ec.europa.eu/environment/ippc/proposal.htm

2
© AMEC Environment & Infrastructure UK Limited September 2012 Doc Reg No. 30310rr001i5
82/883/EEC, 92/112/EEC), the IPPC Directive (96/61/EC), the Solvent Emission Directive (1999/13/EC), the Waste Incineration Directive (2000/76/EC) and the LCP Directive (2001/80/EC). The Commission’s impact assessment2 identified a number of problems related “(1) to shortcomings in the current legislation that lead to unsatisfactory implementation and difficulties in Community enforcement actions and, thereby, to loss of health and environmental benefits and (2) to the complexity and lack of coherence of parts of the current legal framework.”
The impact assessment and proposed Directive were informed by a series of studies undertaken over several years as part of the review of the IPPC Directive. Political agreement on the text was reached at the European Council on 25th June 2009 and a common position outlined by the Commission in November 2009. Following agreement between Council and Parliament on 7 July 2010, the Directive (2010/75/EU) was formally adopted on 24 November 2010 and published in the Official Journal on 17th December 2010; coming into force on 6th January 2011.
The Directive places a number of requirements on the European Commission to undertake additional actions over the coming years, some of which are the subject of this service request. The table below summarises the key requirements of relevance to this study.
Table 1.1 Elements of the IED of relevance to this study
IED Text Task in this study
Article 3 Definitions
Tasks 1 and 3a
(18) hazardous substances means substances or mixtures defined in Article 3 of regulation 1272/2008 on classification, labelling and packaging of substances and mixtures
(19) “baseline report means information on the state of soil and groundwater contamination by relevant hazardous substances
(23) 'poultry' means poultry as defined in point 1 of Article 2 of Council Directive 90/539/EEC of 15 October 1990 on animal health conditions governing intra-Community trade in, and imports from third countries of, poultry and hatching eggs
Article 22 Site closure
2 “Commission Staff Working Document: Accompanying document to the Proposal for a Directive of the European Parliament and of the Council on industrial emissions (integrated pollution prevention and control) (recast). Impact Assessment.” European Commission, Brussels, 21st December 2007. Available from: http://ec.europa.eu/environment/ippc/proposal.htm
3
© AMEC Environment & Infrastructure UK Limited September 2012 Doc Reg No. 30310rr001i5
IED Text Task in this study
Where the activity involves the use, production or release of relevant hazardous substances and having regard to the possibility of soil and groundwater contamination at the site of the installation, the operator shall prepare and submit to the competent authority a baseline report before starting operation of an installation or before a permit for an installation is updated for the first time after 7 January 2013.
The baseline report shall contain the information necessary to determine the state of soil and groundwater contamination so as to make a quantified comparison with the state upon definitive cessation of activities provided for under paragraph 3.
The baseline report shall contain at least the following information:
(a) information on the present use and, where available, on past uses of the site;
(b) where available, existing information on soil and groundwater measurements that reflect the state at the time the report is drawn up or, alternatively, new soil and groundwater measurements having regard to the possibility of soil and groundwater contamination by those hazardous substances to be used, produced or released by the installation concerned.
Where information produced pursuant to other national or Union law fulfils the requirements of this paragraph that information may be included in, or attached to, the submitted baseline report.
The Commission shall establish guidance on the content of the baseline report.
Article 73 Review
2. The Commission shall by 31 December 2012, review the need to control emissions from:
(a) the combustion of fuels in installations with a total rated thermal input below 50MW; Task 2a
(b) the intensive rearing of cattle; and Task 2b
(c) the spreading of manure. Not covered by this study.
The Commission shall report the results of that review to the European Parliament and to the Council accompanied by a legislative proposal where appropriate.
3. The Commission shall report to the European Parliament and the Council, by 31 December 2011, on the establishment in Annex I of:
(a) differentiated capacity thresholds for the rearing of different poultry species, including the specific case of quail; Task 3a
(b) capacity thresholds for the simultaneous rearing of different types of animals within the same installation. Task 3b
The Commission shall report the results of that review to the European Parliament and to the Council accompanied by a legislative proposal where appropriate.
As outlined above, this report addresses Task 3a and 3b of the study.
1.2.2 Differentiated poultry thresholds
The Commission’s review of the IPPC Directive identified a specific problem with regards to the scope of the current IPPC Directive in that the same threshold (40,000 places) is currently applied for all poultry installations irrespective of the actual species being reared. Different species produce different quantities of manure and slurry (and hence different levels of ammonia emissions as well as other environmental effects) which is not reflected in

4
© AMEC Environment & Infrastructure UK Limited September 2012 Doc Reg No. 30310rr001i5
the current approach. Therefore Annex I of the original proposals for IED included a disaggregated threshold for poultry broken down by species (Activity 6.6 concerning the intensive rearing of poultry or pigs):
• 40,000 places for broilers;
• 30,000 places for laying hens;
• 24,000 places for ducks;
• 11,500 places for turkeys.
In addition, the original proposed Directive included a provision for species other than those listed above in that a threshold should be calculated on the basis of equivalent nitrogen excretion factors compared to the thresholds above.
These proposals to amend the thresholds were based on analysis undertaken to support the review of the IPPC Directive3,4. This found that only a small number of farms would be affected across the EU (approximately 900) resulting in a reduction in ammonia emissions of approximately 10kt per year. Impacts on other pollutants (e.g. CH4 and N2O) were considered to be negligible. The total annual compliance costs were estimated to be less than €10 million giving an average cost of reducing ammonia emissions around €1,000 per tonne. Administrative costs were estimated to be “…in the same order of magnitude than for the current IPPC farms and would ensure a more level playing field in this sector since the current IPPC thresholds exclude certain poultry installations with similar or higher environmental impacts than IPPC installations.” No significant social impacts were anticipated.
However, these revised thresholds were removed by the European Parliament and Council during the co-decision process. The objective of this task is to revisit this issue, building on data gathered previously and supplemented with additional data gathering.
Furthermore, an additional definition to the Directive of 'poultry' was added (as outlined in Table 1.1 above). This makes reference to the definition of poultry as set out in Directive 90/539/EEC of 15 October 1990 on animal health conditions governing intra-Community trade in, and imports from third countries of, poultry and hatching egg. Article 2 of this Directive defines poultry as the following:
“…fowl, turkeys, guinea fowl, ducks, geese, quails, pigeons, pheasants and partridges reared or kept in captivity for breeding, the production of meat of eggs for consumption, or for re-stocking supplies of game.”
It is in the context of this definition that information has been collected.
3 IIASA (2007): Measures in agriculture to reduce ammonia emissions. Final report to the European Commission, June 2007.
4 Alterra, Wageningen UR, Eurocare, University of Bonn and A&F (2007): Impact assessment of a possible modification of the IPPC Directive as regards intensive livestock rearing (part of a project on integrated measures in agriculture to reduce ammonia emissions). Final report for the European Commission, June 2007.
5
© AMEC Environment & Infrastructure UK Limited September 2012 Doc Reg No. 30310rr001i5
1.2.3 Mixed activities
There is no provision in the existing legislation for bringing under the remit of the IED, installations where there is a mixture of livestock enterprises at a single installation, where no individual enterprise exceeds the individual species/enterprise type thresholds but, when considered together, it may constitute a major pollution risk.
The original IED proposal included a change to Annex I of the Directive to address this issue; this is summarised in the box below.
Box 1 Proposed Annex I - Article 6.6 (proposed IED)
Intensive rearing of poultry or pigs with more than:
(a) 40,000 places for broilers or 30,000 places for laying hens or 24,000 places for ducks or 11,500 places for turkeys
(b) 2,000 places for production pigs (over 30kg), or
(c) 750 places for sows
In cases of other poultry species than referred in point (a) or different types of species referred in points (a), (b) and (c) reared on the same installation, the threshold shall be calculated on the basis of equivalent nitrogen excretion factors compared to the thresholds set above.
However, this revision was removed by the European Parliament and Council during the co-decision process but with a provision to review the proposals by 31st December 2011.
1.3 Structure of this report This report is structured as follows:
• Section 2 presents an overview of the information gathered during the study.
• Section 3 presents the findings for the investigations on differentiated poultry thresholds.
• Section 4 presents the findings for the investigations on mixed activities.
• Section 5 presents the overall conclusions.
Appendix A presents the data proformas sent to Member States and trade associations.
Appendix B provides a summary of information received from Member States.

6
© AMEC Environment & Infrastructure UK Limited September 2012 Doc Reg No. 30310rr001i5

7
© AMEC Environment & Infrastructure UK Limited September 2012 Doc Reg No. 30310rr001i5
2. Data collection
2.1 Overview The table below summarises the data that the Commission wanted to be gathered for each task based on the project specification.
Table 2.1 Overview of data to be gathered for each task
Task Data to be gathered
Task 3a: Gathering and analysing information to support the Commission in reporting in line with Article 73(3)(a) of the IED on the establishment in Annex I of differentiated thresholds for the rearing of different poultry species
Building on existing data already available the following should be gathered for a representative sample of MSs:
number of installations linked with the number of animals with a clear distinction between those already covered by IED and the others .
Nitrogen excretion factors (preferably at NUTS 2 level) and volumes of manure produced.
quantitative estimation of the environmental impacts, including impacts to water, air, climate change and biodiversity, for each size-category of installation.
description of the current regulation of this sector across the EU, including environmental regulations and those linked to the Common Agricultural Policy.
level of variation of environmental performance across the EU, for each size-category of installations.
estimation of the impacts of implementing the IPPC Directive (reduction of the environmental impacts/estimation of the economic and social impacts).
estimation of the costs of implementing the IPPC Directive (including those associated to permits application, costs for authorities for issuing permits and controlling the installations).
Task 3b: Gathering and analysing information to support the Commission in reporting in line with Article 73(3)(b) of the IED on the possible establishment of capacity thresholds for the simultaneous rearing of different types of animals currently included in the scope of IED within the same installation
Building on existing data already available the following should be gathered for a representative sample of MSs:
Number of installations concerned by the "mixed activities", as well as the number and type of animals.
Permitting regime and conditions applicable for such "mixed activities".
Quantitative estimation of the environmental impacts, including impacts to water, air, climate change and biodiversity, of such "mixed activities".
Description of the current regulation of this sector across the EU, including environmental regulations and those linked to the Common Agricultural Policy.
Practicability of applying rules to calculate the thresholds for mixed farms.
The following sections provide a summary of the data gathered for each task.
8
© AMEC Environment & Infrastructure UK Limited September 2012 Doc Reg No. 30310rr001i5
2.2 Initial review of existing data sources The table below provides an overview of some of the publicly available information sources that have been reviewed and a summary of some of the relevant data they contain.
Table 2.2 Data sources identified
Source Data contained
ALTERRA (2007): Integrated measures in agriculture to reduce ammonia emissions
Gathered data on total number of poultry head and installations by MS for EU25 (2003 data from Eurostat).
Presents data on how the number animals covered by IPPC permits in each MS (based on 2003 Eurostat data and consultation with MSs in 2006).
Investigated most promising measures and estimates potential reductions in ammonia emissions.
Estimated impacts of implementing revised thresholds for EU-25.
Information on national livestock legislation.
Provides a detailed breakdown of excretion factors for different livestock.
IIASA (2007): Measures in agriculture to reduce ammonia emissions
Assessed costs and emissions reductions of extending the IPPC Directive building on the outputs of the Alterra work.
Included the following tasks:
o Task 1 (Impact of the CAP reform and possible further liberalisation);
o Task 2 (Impact of the full implementation of the IPPC Directive);
o Task 3 (Impact of the Commission Biomass Action Plan);
o Task 4 (Impact of the Nitrate and Water Framework Directive);
o Task 5 (Most promising measures);
o Task 6 (Extension of the IPPC Directive).
Eurostat data Number of installations and number of animals by species and farm size.
Only limited provisional data is currently available from the 2010 Farm Structure Survey; instead the complete 2007 dataset is used here.
Data is only available for the following poultry categories: “broilers”, “laying hens” and “other poultry”.
Proposals for a revised Annex IX of the Gothenburg Protocol including supporting Guidance Document
See Section 3.2.4 for further details.
Range of measures for controlling emissions of ammonia from agricultural sources.
Costs of implementation by measure (data not available for all measures).
Benefits (in terms of NH3 emission reduction).
Proposed revised version covers cattle as well as pigs and poultry.
JRC (2008) Evaluation of the livestock sector's contribution to the EU greenhouse gas emissions (GGELS)
Provides an estimate of the net emissions of GHGs and ammonia (NH3) from livestock sector in the EU-27 according to animal species, animal products and livestock systems following a food chain approach.

9
© AMEC Environment & Infrastructure UK Limited September 2012 Doc Reg No. 30310rr001i5
Source Data contained
The Intensive Rearing of Poultry and Pigs BREF (July 2003)
Sets out the major activities and production systems found in intensive poultry production, including: housing, feeding strategy, rearing of animals, collection and storage of manure, on-site treatment of manure etc.
BAT conclusions.
This BREF is currently being revised. An initial working draft has been made publicly available (March 2011) but this contains no BAT conclusions. The second working draft with initial BAT conclusions has yet to be finalised.
AMEC (2008) IA for the UK government of the possible introduction of differentiated poultry thresholds
Includes an assessment of the impacts of implementing the IPPC Directive (including estimation of reduction of ammonia emissions and estimation of economic impacts).
Includes what UK farmers are already required to do (if not under IPPC) such as under the Nitrates Directive (if they are in a designated NVZ) and UK specific legislation such as Local Air Pollution Control (LAPC), code of good agricultural practice (COGAP), etc.
See summary provided in Appendix B.
AMEC (2009) “Study to inform ongoing discussions on the proposal for a Directive on industrial emissions – Part 2: Intensive Livestock Farming”
Study to support the Commission during negotiations on the IED. Part 2 focussed on the possible inclusion of a “mixed activities” criterion within proposed changes to Annex I - Article 6.6 of the Directive which affects intensive livestock farming.
Includes an assessment of the number of possible installations that could be affected.
Investigated alternative approaches for setting thresholds for other species.
Various Directives designed to protect animal welfare (e.g. Housing of Laying Hens Directive)
Specifies minimum space requirements per animal.
Various other design criteria.
2.3 Member State selection In line with the contract specification, data gathering for this task was focused on a selection of Member States rather than all 27. Members States were selected for data collection and analysis in order to form a ‘representative sample’ (see Table 2.3). The selection criteria used were:
• Coverage of the majority of livestock holdings potentially affected by the “differentiated poultry” thresholds and “mixed activities” criteria respectively.
• Considers the MSs who may be most affected in percentage terms.
• Provides sufficient geographical (and therefore climatic variation) coverage of the EU 27.
Data proformas were developed in collaboration with the Commission (see Appendix A) and sent to relevant IEEG members requesting information to be returned by 30th November 2011.
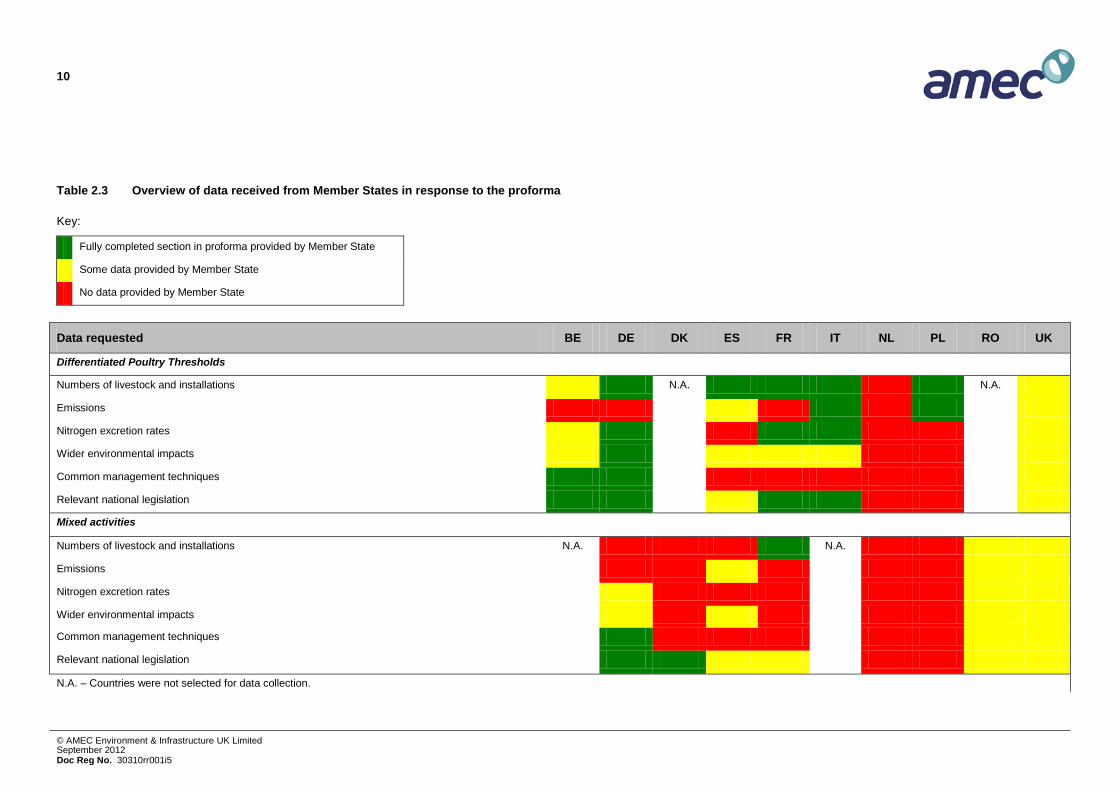
A table summarising the response received is included on the following page. This table also provides an overview of the data received from each Member State using a ‘traffic light’ system to assess the data of interest for each topic. In this table, different colours are used to represent whether a Member State has provided full, partial or no information about a particular topic.
A summary of any information received is provided in Appendix B.
10
© AMEC Environment & Infrastructure UK Limited September 2012 Doc Reg No. 30310rr001i5
Table 2.3 Overview of data received from Member States in response to the proforma
Key:
Fully completed section in proforma provided by Member State
Some data provided by Member State
No data provided by Member State
Data requested BE DE DK ES FR IT NL PL RO UK
Differentiated Poultry Thresholds
Numbers of livestock and installations N.A. N.A.
Emissions
Nitrogen excretion rates
Wider environmental impacts
Common management techniques
Relevant national legislation
Mixed activities
Numbers of livestock and installations N.A. N.A.
Emissions
Nitrogen excretion rates
Wider environmental impacts
Common management techniques
Relevant national legislation
N.A. – Countries were not selected for data collection.
11
© AMEC Environment & Infrastructure UK Limited September 2012 Doc Reg No. 30310rr001i5
2.4 Stakeholder consultation The consultation with stakeholders other than Member States focussed on gathering the views of relevant European-wide industry associations (Copa-Cogeca and AvecPoultry). These associations discussed the issues with their members and technical working groups; however, limited information was provided at a European-level. Input was provided by several national level associations including Breiz Europe, a French trade body representing agricultural economic businesses in a specific region of France with highly intensive agriculture, the National Farmer’s Union (NFU, UK), the Ulster Farmers’ Union (UFU, Northern Ireland) and the British Poultry Council.

12
© AMEC Environment & Infrastructure UK Limited September 2012 Doc Reg No. 30310rr001i5
13
© AMEC Environment & Infrastructure UK Limited September 2012 Doc Reg No. 30310rr001i5
3. Data analysis: differentiated poultry thresholds
3.1 Overview This section of the report presents the analysis for the differentiated poultry thresholds task and is broadly split into two main subsections:
• Section 3.2 – Baseline definition: this sets out the current situation in terms of numbers of installations, emissions, BAT requirements and existing legislation.
• Section 3.3 – Options analysis: this includes a summary of the options considered and their impacts in terms of numbers of installations affected, costs, emission reductions and associated benefits.
3.2 Baseline definition
3.2.1 Numbers of installations
MS specific data
As described in Section 2.4, relatively limited information has been provided by MSs as part of the consultation undertaken for this study. Information on numbers of poultry installations that has been received is summarised below.
Belgium
Some information on numbers of poultry installations was provided for Belgium but this was only for the Flanders region; this is summarised in the appendices.
France
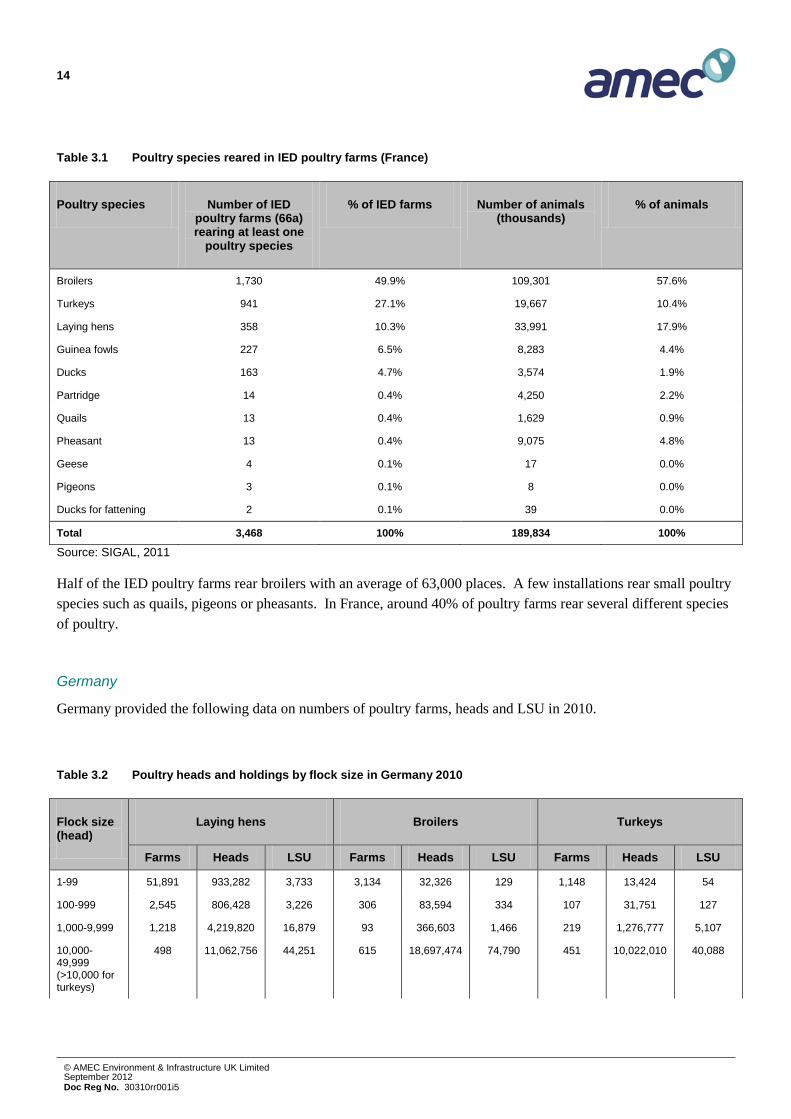
The table below summarises the data provided by France in relation to numbers of poultry farms currently captured under the IED. The French authorities have indicated that quail farms are mostly not included in the table as they were, until the recent decision of the European Court of Justice, considered by the French national regulations to be under the IPPC threshold when converted into animal equivalents.
14
© AMEC Environment & Infrastructure UK Limited September 2012 Doc Reg No. 30310rr001i5
Table 3.1 Poultry species reared in IED poultry farms (France)
Poultry species Number of IED poultry farms (66a) rearing at least one
poultry species
% of IED farms Number of animals (thousands)
% of animals
Broilers 1,730 49.9% 109,301 57.6%
Turkeys 941 27.1% 19,667 10.4%
Laying hens 358 10.3% 33,991 17.9%
Guinea fowls 227 6.5% 8,283 4.4%
Ducks 163 4.7% 3,574 1.9%
Partridge 14 0.4% 4,250 2.2%
Quails 13 0.4% 1,629 0.9%
Pheasant 13 0.4% 9,075 4.8%
Geese 4 0.1% 17 0.0%
Pigeons 3 0.1% 8 0.0%
Ducks for fattening 2 0.1% 39 0.0%
Total 3,468 100% 189,834 100%
Source: SIGAL, 2011
Half of the IED poultry farms rear broilers with an average of 63,000 places. A few installations rear small poultry species such as quails, pigeons or pheasants. In France, around 40% of poultry farms rear several different species of poultry.
Germany
Germany provided the following data on numbers of poultry farms, heads and LSU in 2010.
Table 3.2 Poultry heads and holdings by flock size in Germany 2010
Flock size (head)
Laying hens Broilers Turkeys
Farms Heads LSU Farms Heads LSU Farms Heads LSU
1-99 51,891 933,282 3,733 3,134 32,326 129 1,148 13,424 54
100-999 2,545 806,428 3,226 306 83,594 334 107 31,751 127
1,000-9,999 1,218 4,219,820 16,879 93 366,603 1,466 219 1,276,777 5,107
10,000-49,999 (>10,000 for turkeys)
498 11,062,756 44,251 615 18,697,474 74,790 451 10,022,010 40,088

15
© AMEC Environment & Infrastructure UK Limited September 2012 Doc Reg No. 30310rr001i5
Flock size (head)
Laying hens Broilers Turkeys
Farms Heads LSU Farms Heads LSU Farms Heads LSU
50,000 and more
134 18,256,713 73,027 384 48,351,081 193,404
Total 56,286 35,278,999 141,116 4,532 67,531,078 270,124 1,925 11,343,962 45,376
Italy
The table below summarises the number of farms and animals over and under the 40,000 places threshold for the main poultry categories (the former are the farms already covered by the IED).
Table 3.3 Poultry farms and places (Italy)
Species > 40,000 places < = 40,000 places Total
Broilers Farms 591 51,625 52,215
Number of places 72,801,727 20,453,455 93,255,182
Laying hens Farms 210 68,943 69,153
Number of places 28,506,761 8,524,411 37,031,173
Turkeys Farms 62 6,562 6,624
Number of places 4,742,649 7,011,855 11,754,504
Guinea fowls Farms 8 3,029 3,038
Number of places 1,066,577 1,000,819 2,067,396
Ducks Farms 1 4,140 4,141
Number of places * * 522,589
Geese Farms 2 3,160 3,162
Number of places * * 253678
Other poultry Farms 76 3,670 3,746
Number of places 9,859,894 2,483,466 12,343,360
Note: data marked * are confidential (art. 9 d.lgs. n. 322/89)
Source: Istat, SPA 2007 – UE
Poland
The table below summarises the number of poultry holdings and heads in Poland in 2010.

16
© AMEC Environment & Infrastructure UK Limited September 2012 Doc Reg No. 30310rr001i5
Table 3.4 Total number of farms and bird places in Poland in 2010 (Poland)
Species Number of farms Number of birds
Broilers 3,392 267,601,503
Breeding chickens 592 12,510,680
Layers 1,069 44,364,186
Turkeys 763 14,967,913
Ducks 217 1,945,895
Geese 972 3,820,673
Spain
Spain provided some details of the number of birds broken down by different types of layers and broilers only. However, no details were provided at a national level of numbers of farms or birds for other poultry species. This level of detail was partially provided for one province only (Catalonia). This data is summarised in Appendix B.
UK
The table below summarises the number of poultry heads in the UK in 2011 (data for 2009 and 2010 were also provided). The number of holdings was provided for broilers only.
Table 3.5 UK poultry numbers in 2011
Number of heads (thousands)
Total poultry 162,551
Total breeding and laying fowl 48,610
Hens and pullets laying eggs for eating 38,357
Breeding flock 10,253
Broilers 102,461
Other poultry 11,481
Ducks 2,367
Geese 111
Turkeys 3,930
All other poultry 5,072

17
© AMEC Environment & Infrastructure UK Limited September 2012 Doc Reg No. 30310rr001i5
Eurostat data
At an EU level, Eurostat provides summary data on poultry, by number of heads and holdings, according to broilers, laying hens and “Other poultry” (Table 3.6). The “Other poultry” category includes ducks, turkeys, geese and guinea-fowl, although unfortunately no further level of disaggregation is currently available. Other poultry species such as quail, pigeons, pheasants and partridges are not covered by the data. From 2013, the FSS will include a further question identifying the species in question.
Table 3.6 Number of poultry heads and holdings disaggregated by species in EU27, 2007
Number of heads (1000s) Number of holdings
Broiler Laying hens Other Total Broiler Laying hens Other Total1
793,500 509,320 202,450 1,505,270 3,316,150 5,963,090 1,757,120 6,518,950
Notes:
1) The three categories cannot be summed to give total number of holdings as there is overlap between holdings due to mixed activities (e.g. a single farm may have broiler and laying hen places)
Figure 3.1 shows the number of holdings by size of poultry flock.

18
© AMEC Environment & Infrastructure UK Limited September 2012 Doc Reg No. 30310rr001i5
Figure 3.1 Number of poultry holdings by number of heads (2007)
0
1,000
2,000
3,000
4,000
5,000
6,000
10000 - 19999 20000 - 24 999 25 000 -29 999 30000_34999 35000_39999 >= 40,000
Laying hens
Broilers
Note: The class 1-9,999 heads has been removed to allow better visualisation of the data in the larger holding classes i.e. the number of holdings in this size class are significantly higher than other categories.
Table 3.7 shows the number of IPPC poultry farms based on the IPPC permit information collected in the Entec (2009) study compared against total number of poultry farms from the latest Eurostat data (2007)5. These data show that the total number of IPPC poultry farms in the EU is around 8,000; constituting approximately 0.1% of the total number of farms but a significant proportion of total poultry places.
5 Results from the Farm Structure Survey (FSS) 2010 are not yet available in sufficient detail for use in this study.

19
© AMEC Environment & Infrastructure UK Limited September 2012 Doc Reg No. 30310rr001i5
Table 3.7 Permitting situation
Number
IPPC permits (2008)1 8,802
Total number of poultry holdings (Eurostat, 2007) 6,518,950
% of holdings covered by IPPC 0.1%
Notes:
1) Entec (2009) Monitoring of Permitting Progress for Existing IPPC Installations
3.2.2 Environmental impacts
As outlined in the Intensive Livestock BREF (2003), agricultural activities on intensive poultry and pig farms can contribute to a number of environmental impacts; these include:
• acidification (NH3, SO2, NOx);
• eutrophication (N, P);
• increase of greenhouse effect (CO2, CH4, N2O);
• desiccation (groundwater use);
• local disturbance (odour, noise);
• diffuse spreading of heavy metals (mainly from feed additives) and chemical residues (e.g. pesticides, cleaning chemicals, veterinary products).
The quality and composition of manure produced and the way it is stored and handled are the main factors determining the emission levels from intensive livestock production. The main focus of this study – at least in quantitative terms – in relation to environmental impacts has been on NH3 emissions although other potential impacts have also been considered.
Figure 3.2 shows the total ammonia emissions from different poultry species over the period 1990 to 2009 based on data submitted by Member States under the UNECE Convention on Long-range Transboundary Air Pollution (LRTAP Convention)6. The contribution from laying hens has decreased from over 200 Gg/year to approximately 150 Gg/year over this period whilst the contribution from turkeys has increased approximately three-fold from 5 Gg/year to 15 Gg/year. Ammonia emissions from broilers changed by a smaller amount, increasing from approximately 110 Gg/year in 1990 to approximately 130 Gg/year in 2009, representing a 20% increase.
6 Available from: http://www.eea.europa.eu/data-and-maps/data/data-viewers/eea-air-pollutant-emissions-data-viewer-lrtap-convention

20
© AMEC Environment & Infrastructure UK Limited September 2012 Doc Reg No. 30310rr001i5
Figure 3.3 presents the same data but alongside ammonia emissions from other sources to help visualise the contribution that different poultry types make to total emissions.
Figure 3.2 Ammonia emissions disaggregated by poultry species for years 1990-2009
0
50
100
150
200
250
300
350
400
450
500
1990 1991 1992 1993 1994 1995 1996 1997 1998 1999 2000 2001 2002 2003 2004 2005 2006 2007 2008 2009
EU27
NH3
emiss
ions
(Gg)
NFR Code 4 B 9 a Laying hens NFR Code 4 B 9 b Broilers NFR Code 4 B 9 c Turkeys NFR Code 4 B 9 d Other poultry
Source: CLRTAP Data

21
© AMEC Environment & Infrastructure UK Limited September 2012 Doc Reg No. 30310rr001i5
Figure 3.3 Ammonia emissions by NFR Code 1990-2009
0
1000
2000
3000
4000
5000
6000
1990 1991 1992 1993 1994 1995 1996 1997 1998 1999 2000 2001 2002 2003 2004 2005 2006 2007 2008 2009
EU27
NH3
em
issio
ns (G
g)
NFR Code 4 B 9 b Broilers
NFR Code 4 B 9 c Turkeys
NFR Code 4 B 9 a Laying hens
NFR Code 4 B 9 d Other poultry
NFR Code 4 B 1 a and b Cattle dairy and non-dairy
NFR Code 4 B 8 Swine
NFR Code 4 Other agriculture
NFR Code 1 Energy production and distribution
NFR Code 11 Natural emissions
NFR Code 7 Other
NFR Code 6 Waste
NFR Code 3 Solvent and Product Use
NFR Code 2 Industrial Processes

22
© AMEC Environment & Infrastructure UK Limited September 2012 Doc Reg No. 30310rr001i5
23
© AMEC Environment & Infrastructure UK Limited September 2012 Doc Reg No. 30310rr001i5
3.2.3 BREF BAT requirements
The Intensive Rearing of Poultry and Pigs BREF (July 2003) sets out BAT for installations with numbers of animal places above the relevant thresholds in Annex I of the IPPC Directive. This is currently being revised and a final draft is expected to be published at some point in 20127. BAT requirements are described against the following main areas with the primary aim of reducing ammonia emissions:
• Feeding strategies;
• Housing systems;
• Water and energy usage; and
• Manure storage, on-farm treatment and landspreading.
Feeding Strategies
As far as nitrogen and consequently nitrates and ammonia outputs are concerned, a basis for BAT is to feed animals with diets appropriate to their life stage (phase-feeding) with lower crude protein contents and lower phosphorus contents as they get older. In this way, feed supply more closes matches the animals’ needs.
A crude protein reduction of 1 to 2 % (10 to 20 g/kg of feed) can usually be achieved depending on the breed/genotype and the current starting point. A total phosphorus reduction of 0.05 to 0.1 % (0.5 to 1 g/kg of feed) can be achieved depending on the breed/genotypes, the use of feed raw materials and the actual starting point by the application of highly digestible inorganic feed phosphates and/or phytase in the feed. The resulting range of dietary crude protein and phosphorus contents is reported in Table 3.8. However, it is quite likely that the objective of matching feed supply to animal requirements will be business as usual (BAU) for most large-scale installations due to the cost savings that such measures provide.
7 An initial working draft has been made publicly available (March 2011) but this contains no BAT conclusions. A second working draft was due to be made available in February 2012 which contains some initial BAT conclusions but this has been delayed.

24
© AMEC Environment & Infrastructure UK Limited September 2012 Doc Reg No. 30310rr001i5
Table 3.8 Indicative crude protein and phosphorous levels in BAT-feeds for poultry
Species Phases Crude Protein Content (% in feed)
Total phosphorous content (% in feed)
Remark
Broiler Starter 20-22 0.65 – 0.75 Decrease of 10% in the protein content of the animal feed on all farms will lower NH3 emissions by about 5% and N leaching and emissions of N2O by about 3% relative to the ND full 2020 reference scenario
Grower 19-21 0.60 – 0.70
Finisher 18-20 0.57 – 0.67
Turkey <4 weeks 24-27 1.00 – 1.10
5-8 weeks 22-24 0.95 – 1.05
9-12 weeks 19-21 0.85 – 0.95
13+ weeks 16-19 0.80 – 0.90
16+ weeks 14-17 0.75 – 0.85
Layer 18 – 40 weeks 15.5 – 16.5 0.45 – 0.55
40+ weeks 14.5 – 15.5 0.41 – 0.51
Source: BREF (2003) on Intensive Rearing of Poultry and Pigs
Housing systems
Emissions to air from poultry housing can be reduced by reducing the amount of droppings, by changing their composition (especially by drying) and/or by removing them from the housing, and either storing them somewhere more appropriate or immediately applying them onto land (if appropriate).
For laying hens, the principle behind the reduction of ammonia emissions from cages is the frequent removal of manure. Drying of manure also reduces emissions. For broilers, for both animal welfare reasons and to minimise ammonia emissions, wet litter must be avoided. Table 3.9 provides a summary of BAT.
Table 3.9 Summary of characteristics of BAT for the reduction of emissions from poultry housing
Measure NH3 reduction (%)
Cross-media effects Applicability Extra investment (€/bird place)
Operating cost (€/bird place/year)
Techniques for cage housing of laying hens
Manure removal by way of belts to closed storage
58-76 Energy for belts
Emission from storage
Needs separate storage
Specific construction on feed hopper
+1.14 +0.17 (total)

25
© AMEC Environment & Infrastructure UK Limited September 2012 Doc Reg No. 30310rr001i5
Measure NH3 reduction (%)
Cross-media effects Applicability Extra investment (€/bird place)
Operating cost (€/bird place/year)
Vertical tiered cages with manure belts and forced air drying
58 Energy for belts
Low emission from storage
Needs separate storage
0.39 (I)
2.05 (NL)
0.193 (I)
0.570 (NL)
Vertical tiered cages with manure belt and whisk-forced air drying
60 Energy for whisk moving and belt
Low emission from storage
Needs separate storage
2.25 (I) 0.11 (energy)
0.310 (total)
Vertical tiered cages with manure belts and improved forced air drying
70-88 High energy input
Low odour levels
Needs separate storage
Preheating for increased reduction
0.65 (I)
2.50 (NL)
0.36 (I)
0.80 ( NL)
Vertical tiered cages with manure belt and drying tunnel over the cages
80 high energy input
Very low emissions from storage
Needs separate storage
Special construction overhead drying tunnel
2.79 (I) 0.23 – 0.28 (energy)
0.48 total (I)
Techniques for non-cage housing of laying hens
Deep litter with forced manure drying
60 Energy for airflow and air heating
Floor construction requirements
16.13
Deep litter with perforated floor and forced drying
65 Energy for airflow and air heating
Floor construction requirements
No data
Aviary system 71 High dust levels
Energy depends on belt system
Application special equipment
No data
Techniques for the housing of broilers
Naturally ventilated house with a fully littered floor and equipped with non-leaking drinking systems, or
well-insulated fan ventilated house with a fully littered floor and equipped with non-leaking drinking systems (VEA-system)
0.080
(kg NH3/ bird place/year)
Dust levels
Energy input depends on ventilation system
Commonly applied No data
Source: BREF (2003) on Intensive Rearing of Poultry and Pigs
Water and energy use
BAT is to reduce water use by doing all of the following
26
© AMEC Environment & Infrastructure UK Limited September 2012 Doc Reg No. 30310rr001i5
• cleaning animal housing and equipment with high-pressure cleaners after each production cycle. Typically wash-down water enters the slurry system and therefore it is important to find a balance between cleanliness and using as little water as possible
• carry out a regular calibration of the drinking-water installation to avoid spill
• keeping record of water use through metering of consumption; and
• detecting and repairing leakages as quickly as possible.
Note that one of the purposes for carefully monitoring water wastage is to avoid manure becoming wet, thus resulting in greater emissions than if the manure was dry.
BAT for poultry housing is to reduce energy use by doing all of the following:
• insulating buildings in regions with low ambient temperatures (U-value 0.4 W/m2/°C or better)
• optimising the design of the ventilation system in each house to provide good temperature control and to achieve minimum ventilation rates in winter
• avoiding resistance in ventilation systems through frequent inspection and cleaning of ducts and fans, and
• applying low energy lighting.
Manure storage
BAT is to design storage facilities for poultry manure with sufficient capacity until further treatment or application to land can be carried out. The required capacity depends on the climate and the periods in which application to land is not possible.
If manure needs to be stored, BAT is to store dried poultry manure in a barn with an impermeable floor and with sufficient ventilation. For a temporary stack of poultry manure in the field, BAT is to position the heap away from sensitive receptors.
This crosses over with the Nitrates Directive. The Directive requires Member States to define Nitrate Vulnerable Zones (NVZs) and, within the NVZs, livestock farmers have to provide sufficient manure storage capacity for a prescribed minimum period. Outside NVZs, provision of adequate capacity is voluntary but regarded as good agricultural practice.

27
© AMEC Environment & Infrastructure UK Limited September 2012 Doc Reg No. 30310rr001i5
On-farm processing of manure
In general, on-farm processing of manure is BAT only under certain conditions (i.e. is a conditional BAT). The conditions in on-farm manure processing that determine if a technique is BAT are related with conditions such as the availability of land and local nutrient excess or demand.
Poultry manure can be used for burning in power stations and could potentially be considered BAT (although the BREF does not make any conclusions regarding off-site treatment).
Techniques for land-spreading manure
In the BREF (2003) document it was concluded that for reducing ammonia emissions from land-spreading poultry manure, incorporation is the important factor not the spreading technique. BAT on land-spreading – wet or dry – solid poultry manure is incorporation within 12 hours8.
3.2.4 Current regulation
National legislation
The table below provides a short overview of Member States’ national legislation targeted at poultry installations that may impact on emissions to air, water, climate change or biodiversity as well as planning controls for new units.
Other relevant legislation
Table 3.11 presents a summary of other relevant legislation that may impact on the intensive livestock sectors.
8 However, this was contested by two Member States who considered that incorporation within 24 hours, which has an associated ammonia emission reduction of around 60 – 70 %, is BAT.

28
© AMEC Environment & Infrastructure UK Limited September 2012 Doc Reg No. 30310rr001i5
Table 3.10 National legislation
MS Summary of legislation Source
Belgium In Flanders, regulations concerning environmental safety are laid down in the “VLAREM II” legislation. This law covers almost all livestock farms and contains requirements to limit impacts on air emissions, water emissions, warming effects and biodiversity.
No information was provided about specific measures.
Consultation
Denmark In 2007 a new Environmental Approval Act for Livestock Holdings (Act No. 1572) was put into force. The Act requires the approval of projects for livestock holdings and sets a National minimum requirement for environmental protection for odour, ammonia, nitrates and phosphorus surplus.
The Act is based on a Livestock Unit (LSU) approach for determining whether an installation is covered by the legislation or not. The approval system applies to all livestock holdings with more than 75 LU. The conversion factors have been determined on the basis of average figures for 2000 prepared by the Danish Institute of Agricultural Sciences (DJF) and published in DJF report No 36 (November, 2001). 1 LSU has been determined on the basis of 100 kg N ex storage per livestock unit housed in the animal-housing system with the lowest rate of nitrogen losses. For cattle, however, the values for livestock units remain at the same level as in Statutory Order No 877 of 10 December 1998, where 1 LSU is determined as 100 kg N ex storage based on an average of animal housing systems. Further information is provided in Appendix B
Consultation
France The Classified Installations for the Protection of the Environment (ICPE Law) regulation and permit regime covers agricultural installations. The ICPE defines activities according to a volume or a capacity of production. Above a given threshold expressed in animal numbers, the potential impacts on the environment are considered sufficiently high to require an impact study and an administrative authorization with public consultation.
The legislation takes into account the number of equivalent animal instead of the number of places. In this system of equivalences, a hen, a chicken, guinea fowls or pheasant is equivalent to 1 animal-equivalent (AE), a duck is equivalent to 2 AE, a turkey or a goose is equivalent to 3 AE, forced-feeding poultry is equivalent to 5 AE but a pigeon or a partridge is equivalent to ¼ AE and a quail is equivalent to 1/8 AE. These values are currently being revised (please see Appendix B for further information).
Consultation
Germany In 2006, a “National Framework for the Assessment of Animal Rearing Procedures” was published by two national working groups (on “animal welfare” and “environment and technology”). This framework is not legally binding (but advisory), but provides information and criteria for the competent bodies giving permits for animal farms falling under the IPPC-directive (now IED-directive). The objective of the framework is to safeguard a common implementation procedure and level both in environmental protection and animal welfare all over Germany. The authorization process (permit) of animal farms itself lies within the responsibility of the Federal States, according to the constitution of Germany. The framework includes poultry, pigs, cattle and horses.
Poultry farms with more than 15,000 places for laying hens need a simplified permit according to the German Federal Law on Emissions (Bundesimmissionsschutzgesetz; 4th Ordinance part 5.4.7.1). Simplified in this case means there is no public participation in the permit process. Larger farms (>40,000 laying hen places) need a permit with public approval. See Appendix B for further information. Farms that require a permit have to adopt systems and techniques that are Best Available Techniques (“Best Verfügbare Technike”).
Consultation

29
© AMEC Environment & Infrastructure UK Limited September 2012 Doc Reg No. 30310rr001i5
MS Summary of legislation Source
Italy Mandatory measures to reduce emissions are currently only in place for surface and ground water protection. On 07.04.06 a new Decree of Italian Ministry of Agriculture was issued concerning manure utilization in Vulnerable and Non Vulnerable Zones, cattle manure included. The decree obliges farmers to achieve in animal manure application to crops 50% of Nitrogen efficiency for slurry and 40% for solid manure. This N efficiency requires the use of methods of manure application able to reduce emissions to air at least of 30% compared with the traditional surface landspreading method.
Consultation
Netherlands No information was received from the Netherlands during the consultation.
According to Alterra (2007) the IPPC Directive is implemented mainly through the Environmental Management Act (Wet Milieubeheer, 2005). Based on this Act, several general binding rules are in force regarding livestock farming:
• to reduce emissions of ammonia and odour, farmers are obliged to cover their outdoor slurry storage facilities, built before 1987 (Besluit Mestbassins Milieubeheer, 1991)
• to reduce emissions of ammonia from animal houses, emission limit values for housing systems are laid down (Besluit Ammoniakemissie Huisvesting Veehouderij, 2005)
Besides the general Environmental Management Act, the special Ammonia and Livestock Farming Act is also of importance. This Act protects vulnerable nature against ammonia deposition. In a zone of 250 m around these areas, new stock farms are not allowed and existing farms may only expand if housing systems are applied with a very high reduction of ammonia emission (more stringent than BAT).
Furthermore, based on the Soil Protection Act (Wet Bodembescherming), there are general binding rules in force that oblige farmers to apply slurry to grassland and arable land with low emission techniques.
Alterra (2007)
Poland National legislation imposes similar approach for both poultry and cattle. Those farms that don’t fall under the scope of IED requirements are obliged to obtain so called single – media permits. Permit for emission to air is required for intensive rearing of animals with more than 210 DJP1. For farms below this threshold but above 60 DJP only notification to the competent authority is required. This requirement is a general rule and should be applied to any rearing activity where the number of animals exceeds the thresholds. Discharging or rural utilization of wastewaters is also regulated in separate permit anytime when amount of wastewaters exceeds 5 m3.
Poland has also Code of Good Agricultural Practice where information concerning pollution prevention and control can be found (http://www.kzgw.gov.pl/files/file/Materialy_i_Informacje/Dyrektywy_Unijne/Azotowa/kodeks_dobrej_praktyki_rolniczej.pdf). 1 DJP – factor used in general for purposes of environmental impact assessment issues. Table with DJP factors for different animals species can be found in the Annex to the following regulation (Council of Ministers' Order of 9 November 2010 on projects with substantial environmental impact (Journal of Laws No. 213, item 1397))
Consultation

30
© AMEC Environment & Infrastructure UK Limited September 2012 Doc Reg No. 30310rr001i5
MS Summary of legislation Source
Spain The IPPC Directive was transposed into Spanish Law 16 in 2002, which includes a new system for environmental authorization (e.g. Environmental Impact Assessment) for installations concerned. IPPC applies to all sectors, including intensive rearing of poultry and pigs. For other poultry than laying hens, equivalent numbers of animals are used to judge IPPC compliance. No further information available.
Aside from the IPPC Law (16/2002), the Spanish regional authorities require the farmers to elaborate a manure management plan prior to commencing activities. They have different mechanisms to control the application of manure in agriculture, along with voluntary systems for improved feeding systems and the codes of good practices in the application of manure to agriculture.
It is noted that for laying hens, in most cases, efficient systems of animal feed are adopted and storage times of manure are minimised.
Consultation and Alterra (2007)
UK All farms in the Nitrate Vulnerable Zones have to comply with an Action Programme that implements the Nitrates Directive. Action Programmes are being revised. Furthermore, all farms in England and Wales have to comply with the "The Waste Management (England and Wales) Regulations 2006" that fully implements the Waste Framework Directive for agriculture. This includes protecting the environment when dealing with agricultural waste. Livestock manures and slurries are not ‘waste’ if they are applied to agricultural land for agricultural or ecological benefit, whether on the farm where produced or sent to another farm. Similar legislation applies in Northern Ireland and Scotland.
Specific regulatory programs that specifically affect animal farming are:
• Discharge Consents (under Water Resources Act 1991), apply to small number of the dairy farmers in England and Wales
• The Control of Pollution (Silage, Slurry and Agricultural Fuel Oil - SSAFO) Regulations 1991 as amended. These regulations set standards for the construction of storage facilities for silage, slurry, and agricultural fuel oil, built or modified after 1991.
• The Ground Water Regulations 1998 deal with land spreading of certain substances. Typically, farmers who wish to apply spent sheep dip or pesticide washings to land will need to obtain a written authorization that contains conditions under which the activity can be carried out.
Water Abstraction Licenses; mainly applies to arable farmers that irrigate high value crops, although it does apply to other farms that extract water from wells or directly from surface waters.
Other relevant legislation includes: Nitrate Pollution Prevention Regulations 2008, Sludge Use in Agriculture -Sewage Sludge Regulations 1989, Hazardous Waste Regulations 2005, Water Resources (Control of Pollution) (Silage, Slurry and Agricultural Fuel Oil) (England) Regulations 2010, Environmental Permitting Regulations 2010 (EPR), Water Resources (Abstraction & Impounding) Regulations 2006, Environmental Impact Assessment (EIA) - Scoping Opinions and Environmental Statement, Town and Country Planning (EIA2) Regulations 2011.
Consultation and Alterra (2007)

31
© AMEC Environment & Infrastructure UK Limited September 2012 Doc Reg No. 30310rr001i5
Table 3.11 Summary of relevant legislation that may impact on the intensive livestock sectors
Policy/Legislation Summary Scope Relevant time-scales
Requirements Potential implications for the sector
Environmental Impact Assessment Directives (1985/337; 1997/11, 2003/35; 2009/31). See: http://eur-lex.europa.eu/LexUriServ/LexUriServ.do?uri=CONSLEG:1985L0337:20090625:EN:PDF
Requires applications for planning permission for certain projects to be accompanied by an Environmental Statement. For some (Annex I) this is mandatory, for others (Annex II) an ES is needed if impacts are expected to be significant.
Annex I includes:
17. Installations for the intensive rearing of poultry or pigs with more than:
(a) 85 000 places for broilers, 60 000 places for hens;
(b) 3 000 places for production pigs (over 30 kg); or
(c) 900 places for sows.
Annex II includes:
(e) Intensive livestock installations (projects not included in Annex I)
Already in place
Requires developers to provide:
A description of the project
Alternatives considered
Description of the environmental context
Description of the significant environmental impacts
Mitigation measures to be implemented
Pig and poultry installations are explicitly covered.
Nitrates Directive (1991/676). See: http://eur-lex.europa.eu/LexUriServ/LexUriServ.do?uri=OJ:L:1991:375:0001:0008:EN:PDF
Intended to provide protection of water against pollution caused from agricultural sources. The aim is to reduce pollution by nitrates from agricultural sources and prevent further such pollution.
Requires MSs to define Nitrate Vulnerable Zones based on actual or potential threat of pollution by nitrates and/or eutrophication. Action Programmes within NVZs set out measures to be followed by farmers. Monitoring by MSs is mandatory with a review every 4 years of NVZ designation and AP. A code of practice has to be defined and its requirements are mandatory within NVZs and voluntary outside them.
Next implementation report to be published in 2013 (relative to the period 2008-2011). Last implementation report (period 2004-2007) is available at the following website: http://ec.europa
The Directive requires that the Action Programmes contain rules relating to:
periods when the land application of fertilizers is prohibited;
the capacity of storage vessels for livestock manure;
the land application of fertilizer to steeply sloping ground;
the land application of fertilizer to water-saturated, flooded, frozen or snow-covered ground;
High - Regulations apply to all farming sectors but requirements for limits on times and nutrient applications for manure spreading impact mainly on pigs, poultry and dairy herds.

32
© AMEC Environment & Infrastructure UK Limited September 2012 Doc Reg No. 30310rr001i5
Policy/Legislation Summary Scope Relevant time-scales
Requirements Potential implications for the sector
.eu/environment/water/water-nitrates/index_en.html
the conditions for land application of fertilizer near water courses;
procedures for the land application, including rate and uniformity of spreading, of both chemical fertilizer and livestock manure;
limitation of the land application of fertilizers based on a balance between the foreseeable nitrogen requirements of the crops, and the nitrogen supply to the crops from the soil and from fertilization; and
the amount of livestock manure applied to the land each year, including by the animals themselves, shall not exceed 170 kg N per hectare.
Cross Compliance under the Common Agricultural Policy (‘Common rules’) (2003/1782; 2009/73). See: http://eur-lex.europa.eu/LexUriServ/LexUriServ.do?uri=OJ:L:2009:316:0065:0112:EN:PDF
Cross-compliance is a mechanism that links direct payments to compliance by farmers with basic standards concerning the environment, food safety, animal and plant health and animal welfare, as well as the requirement of maintaining land in good agricultural and environmental condition.
Cross-compliance has two strands:
Statutory management requirements (SMR): in essence, a requirement to comply with other environmental legislation
The obligation of keeping land in good agricultural and environmental condition (GAEC) refers to a range of standards related to soil protection, maintenance of soil organic matter and structure, avoiding the deterioration of habitats, and water management.
Current CAP runs to 31st December 2012 but suggestions are that the replacement policy will not be in place until 1st January 2015
Wide variation in measures by MS, although Annex IV lists four key areas:
Soil erosion
Soil organic matter
Soil structure
Minimum level of maintenance of agricultural land (which covers five different areas: - minimum livestock stocking rates and/or appropriate regimes; protection of permanent pasture; retention of landscape features including where appropriate the grubbing up of olive trees; avoiding encroachment of unwanted vegetation on agricultural land; and, maintenance of olive groves in good vegetative condition.
Summary measures are given below (taken from
Applies to all farmers in receipt of Pillar I subsidies, which are based on land area. Intensive livestock producers, by definition, have a low land area relative to stock numbers, so impact is possibly less significant than some other legal instruments

33
© AMEC Environment & Infrastructure UK Limited September 2012 Doc Reg No. 30310rr001i5
Policy/Legislation Summary Scope Relevant time-scales
Requirements Potential implications for the sector
IEEP report: http://www.ieep.eu/assets/372/cc_descriptive.pdf) – see Annex 1.
Early indications (See: http://ec.europa.eu/agriculture/cap-post-2013/legal-proposals/com625/625_en.pdf) are that around 30% of subsidies will be contingent on measures intended to ensure protect climate and environment: crop diversification, maintenance of permanent pastures and ecological focus areas.
Water Framework Directive (2000/60) (incorporating Groundwater Directive 2006/118) See: http://eur-lex.europa.eu/LexUriServ/LexUriServ.do?uri=OJ:L:2000:327:0001:0072:EN:PDF
The Directive aims to:
expand the scope of water protection to all waters, surface waters and groundwater
achieve "good status" for all waters by a set deadline
provide water management based on river basins
adopt a "combined approach" of emission limit values and quality standards
streamline legislation
Applies to all waters, whether surface or ground waters. Applies an outcome-oriented approach – waters are to achieve good ecological status, with some concessions to significantly altered water bodies (e.g. in urban environments).
Operational programme of measures in place by 2012.
Good status to be achieved in all waters by 2015.
This is a directive to combine some earlier legislation affecting water quality, and provides a framework for achieving desired outcomes at river basin level. It will apply the ‘polluter pays principle’ and sets a framework of powers for using appropriate economic instruments. At Article 11, it calls for the establishment of a programme of measures for each river basin district and sets the scope for such measures. This includes measures to regulate and/or control point source and diffuse pollution to water. Supplementary measure, as listed in Annex VI (Part B) can also be introduced and include some that may be of relevance, e.g.:
- emission controls
- codes of good practice
- negotiated environmental agreements
- other relevant measures
Possibly low - Impacts likely to be felt via Nitrates Directive and Cross-Compliance, rather than through WFD per se although this will depend on the programme of measures which could go beyond the Nitrates Directive.
Gothenburg Protocol 1999 (originating from Geneva
Annex IX deals specifically with pollution from agriculture with
It is open to any country to become a signatory to the
Revision in process, likely
Current suggestions for revisions will impose requirements on the national government, but
High - scope will cover pigs, poultry and cattle. Three levels

34
© AMEC Environment & Infrastructure UK Limited September 2012 Doc Reg No. 30310rr001i5
Policy/Legislation Summary Scope Relevant time-scales
Requirements Potential implications for the sector
Convention of 1979), part of the Convention on Long-range Transboundary Air Pollution. Annex IX deals with pollution from agriculture. See: http://www.unece.org/fileadmin/DAM/env/lrtap/full%20text/1999%20Multi.E.Amended.2005.pdf
measures including:
• Good agricultural practice including livestock feeding strategies and low-emission animal housing systems,
• Urea and ammonium carbonate fertilisers,
• Manure application,
• Manure storage, and
• Animal housing.
The Protocol including Annex IX is being revised (see section below on Gothenburg Procotol).
Protocol; currently, there are some 47 signatories.
Annex IX focuses on emission of ammonia from agricultural sources to air.
to be agreed in 2012
also on farms, such as:
adoption of low protein feeding strategies
building designs to minimise air emission
More details provided in Annex 2, below.
of aspiration under consideration – between 5 and 50 cattle LSUs. Impacts will be felt by much smaller livestock units than IED or EIA Directives, whichever level of targets is adopted.
Habitats Directive (92/43). See: http://eur-lex.europa.eu/LexUriServ/LexUriServ.do?uri=CONSLEG:1992L0043:20070101:EN:PDF. See also the Birds Directive (1979/409; 2009/147). See: http://eur-lex.europa.eu/LexUriServ/LexUriServ.do?uri=OJ:L:2010:020:0007:0025:EN:PDF
The Directive aims enhance biodiversity by protecting important habitats against loss or degradation.
Designated sites – Special Areas of Conservation (and under Birds Directive – Special Protection Areas)
Already in place
MSs to put in place procedures to ensure that it can take action to protect designated sites from loss or damage. Anyone taking action that may impact on a designated site is required to obtain permission, which will only be given if the competent authority is satisfied that no significant harm or loss will arise.
Low – only applies where livestock unit may affect designated site. Case law confirms this (see: http://eur-lex.europa.eu/LexUriServ/LexUriServ.do?uri=CELEX:62009J0538:EN:HTML)
National Emission Ceilings Directive (2001/81). For consolidated version, see: http://eur-lex.europa.eu/LexUriServ/LexUri
Aims to limit emissions of acidifying and eutrophying
pollutants to protect against risks of adverse effects and to move
Pollutants covered are:
sulphur dioxide
nitrogen oxides
Baseline set at 2002 by each MS with ceilings for 2010
National programmes to include information on adopted and envisaged policies and measures and quantified estimates of the effect of these policies and measures on emissions of the pollutants in 2010. Anticipated significant
Low - Something of an enabling form of legislation i.e. Member States are required to implement European legislation and take further measures – where

35
© AMEC Environment & Infrastructure UK Limited September 2012 Doc Reg No. 30310rr001i5
Policy/Legislation Summary Scope Relevant time-scales
Requirements Potential implications for the sector
Serv.do?uri=CONSLEG:2001L0081:20090420:EN:PDF
towards the long-term objectives of not exceeding critical levels and loads and of effective protection of all people against recognised health risks from air pollution by establishing national emission ceilings, taking the years 2010 and 2020 as benchmarks, and by means.
Volatile Organic Compounds (VOC)
Ammonia
changes in the geographical distribution of national emissions are also to be indicated.
necessary – to meet ceilings.
Animal Welfare Directive (1998/221) See: http://eur-lex.europa.eu/LexUriServ/LexUriServ.do?uri=OJ:L:1998:221:0023:0027:EN:PDF
This Directive lays down minimum standards for the protection of animals bred or kept for farming purposes
All animals kept for agricultural production.
In force Air circulation, dust levels, temperature, relative air humidity and gas concentrations must be kept within limits which are not harmful to the animals. These requirements may limit the types of measures suitable for inclusion in a BREF.
Low - Building designs are already prepared with these considerations in mind.
Housing of Laying Hens Directive (1999/74) See: http://eur-lex.europa.eu/LexUriServ/LexUriServ.do?uri=OJ:L:1999:203:0053:0057:EN:PDF and 1998/58
Sets minimum standards for the protection of laying hens.
All establishments with more than 350 hens but not to those with only breeding laying hens.
In force. total ban on the use of conventional cage systems by 2012
Sets out parameters for the design of buildings and cages, plus the minimum space required per bird. These requirements may limit the types of measures suitable for inclusion in a BREF.
Low for poultry (nil for cattle and pigs) - Designs for new buildings should already be prepared with these considerations in mind. Med-High for existing installations of older design.
Protection of Pigs Directive (91/630). See: http://eur-lex.europa.eu/LexUriServ/LexUriServ.do?uri=CELEX:31991L0630:EN:HTML and subsequent amendments and COM2006/669. See: http://eur-lex.europa.eu/LexUriServ/LexUriServ.do?uri=COM:2006:0669:FIN:EN:PDF) .
This Directive provides for minimum standards for the protection of pigs confined for rearing and fattening but does not apply to holdings with fewer than six pigs or five sows with their piglets.
Applies to all pigs kept for production
All provisions come into force by or before 1st January 2013.
Sets out parameters for the design of buildings and pens, plus the minimum space required per animal. These requirements may limit the types of measures suitable for inclusion in a BREF. Also, sets out certain provisions concerning dietary needs.
Low for pigs (nil for cattle and poultry) – Designs for new building should already be prepared with these considerations in mind. Med – High for existing installation of older design.

36
© AMEC Environment & Infrastructure UK Limited September 2012 Doc Reg No. 30310rr001i5
Gothenburg Protocol
Introduction
The 1999 Gothenburg Protocol to Abate Acidification, Eutrophication and Ground-level Ozone sets emission ceilings for four pollutants: sulphur, NOx, VOCs and ammonia. Annex IX deals specifically with pollution from agriculture with measures including:
• Defining good agricultural practice;
• Livestock feeding strategies;
• Low-emission animal housing systems;
• Nitrogen budgeting (using input-output balances);
• Use of urea and ammonium sulphate/phosphate fertilisers;
• Manure application;
• Manure storage; and
• Animal housing.
The Protocol including Annex IX is currently being revised. On 3rd May 2012, the United Nations issued a document describing certain amendments to the Protocol9. It seems that any decision on Annex IX has been deferred (see Paragraph K (3) concerning Article 10). Some minor amendments have been suggested (at ‘V’ on page 78) but these allow for a change of the timetable, rather than anything affecting the proposed measures. Consequently, comments below are based on the current proposals for revisions.
Accompanying the Annex IX with proposed revisions is a Guidance Document which contains detailed descriptions of measures that could be applied, together with indications of costs. 10 There is only partial overlap between BAT and the Gothenburg Protocol guidance document, since BAT has only been defined for the pig and poultry sectors, whilst the Gothenburg document has a wider scope. This section reviews the Guidance Document in order to identify measures that could be relevant to a re-cast Industrial Emissions Directive, or other policy mechanism that could be used to achieve the same objectives.
9 The document has not been published formally.
10 Draft Guidance Document for Preventing and Abating Ammonia Emissions from Agricultural Sources. Available from: http://live.unece.org/fileadmin/DAM/env/documents/2011/eb/wg5/WGSR49/Informal%20docs/21_Ammonia_Guidance_Document_Version_20_August_2011.pdf

37
© AMEC Environment & Infrastructure UK Limited September 2012 Doc Reg No. 30310rr001i5
Scope
The expectation is that the proposed Protocol revisions and supporting documents (e.g. Annex IX and the Guidance Document) would be ratified by individual countries and EU as a whole. Some of the measures within Annex IX would apply across the whole of the country’s territory and to all farms, whereas some would only apply to livestock farms above a specified threshold of stock numbers.
Targets and thresholds are set for a number of areas. The current proposals for Annex IX are to provide three different levels of aspiration (A, B and C). With respect to livestock numbers the thresholds are:
Table 3.12 Livestock numbers thresholds for Annex IX
Aspiration level Pigs Poultry
Existing Annex IX
2,000 fatteners or 750 sows
40,000
Proposed Annex IX
A 50 LSU (Notes 1 & 2)
B 200 LSU 40,000
C 2,000 fatteners or 750 sows
40,000
Note 1: This could also include cattle LSUs.
Note 2: Measures requiring “Nitrate input-output balances” would apply (under Aspiration A) to all cattle farms with over 5 LSUs whereas all other measures apply only to cattle farms with over 50 LSUs.
Confidence in the efficacy of measures:
In the draft Guidance Document, strategies and techniques for the abatement of NH3 emissions and N losses are grouped into three categories:
1. Category 1: Well researched, considered to be practical or potentially practical, and there are quantitative data on their abatement efficiency, at least on the experimental scale;
2. Category 2: These are promising, but research on them is at present inadequate, or it will always be difficult to quantify their abatement efficiency. This does not mean that they cannot be used as part of an NH3 abatement strategy, depending on local circumstances.
3. Category 3: These have been shown to be ineffective or are likely to be excluded on practical grounds.

38
© AMEC Environment & Infrastructure UK Limited September 2012 Doc Reg No. 30310rr001i5
Only Category 1 and 2 strategies have been considered. The table on the following page provides a summary of some of the key measures affecting pig and poultry units taken from the draft Guidance Document.

39
© AMEC Environment & Infrastructure UK Limited September 2012 Doc Reg No. 30310rr001i5
Table 3.13 Measures affecting pigs and poultry units
Type of Measure/ Technique/Technology
Costs relative to Reference Technology
Targets (range represents different aspirations C - A)
Extent to which measure are thought to be ‘Business as Usual’
Extent of impacts Other comments
Whole cycle nitrogen management and use of abatement techniques (paras 22 – 33, plus Table 2*)
€200 - €500/farm (but decreasing over time) Net effect of improving NUE = +/-€1 per kg
Mixed crop systems: 0.3-0.6 kg/kg Nitrogen Use Efficiency (NUE) for pigs and poultry; landless systems: 0.7-0.9 kg/kg NUE (pigs) and 0.6-0.9 kg/kg NUE (poultry)
Variable but more likely to be BAU on larger, more technically advanced farms and less so on smaller units
Varies with level of aspiration – see Table above.
Targets are farm and regionally specific
Low protein feeding strategies (paras 43 - 46 and Tables 4 and 5*)
No data provided Target levels of crude protein (CP levels in feed) Pigs (Table 4): Weaner (<10kg): 19-21 Piglet (<25kg): 17-19 Fattening (25-50kg): 15-17 Fattening (50 – 110kg): 14-15 Fattening (>110kg): 12-13 Gestating sow: 13-15 Lactating sow: 15-17 Poultry (Table 5) Chicken broiler – starter: 20-22 Chicken broiler – grower: 19-21 Chicken broiler – finisher: 18-20 Chicken layer <4 wks: 15.5–16.5 Chicken layer >4 wks: 14.5-15.5 Turkeys <4 wks: 24-27 Turkeys 5-8 wks: 22-24 Turkeys 9-12 wks: 19.21
Probably in widespread use because of high cost of protein.
Varies with level of aspiration – see Table above.
Feed manufacturers will have a key role in supplying feed with appropriate attributes and advisory support

40
© AMEC Environment & Infrastructure UK Limited September 2012 Doc Reg No. 30310rr001i5
Type of Measure/ Technique/Technology
Costs relative to Reference Technology
Targets (range represents different aspirations C - A)
Extent to which measure are thought to be ‘Business as Usual’
Extent of impacts Other comments
Turkeys 13+ wks: 16-19 Turkeys 16+ wks: 14-17
Livestock housing - (paras 62 – 110 and Tables 7 - 11*)
- Pigs: €0 – 37.17 per
place per year - Laying hens (caged
and non-caged): €0 – 8.0 per kg NH3 abated per year
- Broilers: €0 – 8.0 per kg NH3 abated per year
- Turkeys: €0 – 8.0 per kg NH3 abated per year
Target reductions in ammonia emissions vary depending on type of animal and measure
- Pigs: 10% to 65% - Laying hens (caged): 30% to
95% - Laying hens (non-caged):
60% to 95% - Broilers: 20% to 94% - Turkeys and ducks (20% to
94%
Likely to be BAU for larger and more modern installations. For smaller units, BAU will be more variable
Could be significant to smaller units at the higher levels of aspiration (A and B)
Cheaper to apply to new build than conversion of existing buildings
Manure storage techniques (paras 111 to 121 and Table 12*)
€0 to €8/m3 of storage per year for existing buildings but up to €14.9 for new build (of which new tank is €6.94)
Target reductions in ammonia emissions range from 40% to 100% depending on type of measure
Many of the techniques suggested are already regarded as BAT/good practice, so will be BAU for larger installations
Impacts likely to be greater outside NVZs and for smaller units at the higher level of aspirations (A and B)
Costs are likely to be significantly lower for new build than for retrofit
Manure application techniques (paras 122 to 165 and Tables 13 to 15*)
€-0.5 to €2.0/kg NH3 abated/yr Target reductions in ammonia emissions range typically from 40% to 60% depending on type of measure used and other factors (e.g. weather, soil type)
Many of the techniques will already apply in NVZs and so be BAU
Impacts likely to be greater outside NVZs and whether land to which manure/slurry applied is arable or grassland
Contractors will have a key role where farm does not have its own spreading machinery
Fertiliser application (paras 166 to 183 and Table 16*)
€-0.5 to €2.0/kg NH3 abated/yr Target reductions in ammonia emissions range from 30% to 90% depending on type of measure used and other factors (e.g. weather, soil type)
Variable but more likely to be BAU on larger, more technically advanced farms and less so on smaller units
Variable but likely to be higher outside NVZs and with dairy farms
Fertiliser manufacturers will have a role in some measures (e.g. use of urease inhibitors)
*These refer to the paragraphs and tables from which the information in the draft Guidance Document is drawn. See: http://live.unece.org/fileadmin/DAM/env/documents/2011/eb/wg5/WGSR49/Informal%20docs/21_Ammonia_Guidance_Document_Version_20_August_2011.pdf
41
© AMEC Environment & Infrastructure UK Limited September 2012 Doc Reg No. 30310rr001i5
3.3 Options analysis
3.3.1 Summary of options
Overview of options
There are a number of ways in which the current thresholds in the IED could be amended including variations based around the following:
• thresholds in the original IED proposal for broilers (40,000 places), laying hens (30,000), ducks (24,000) and turkeys (11,500) supplemented with calculated thresholds for other species e.g. based on the approaches described below.
• thresholds for all species based on the Equivalent Nitrogen Excretion Factors (ENEF) approach; this approach was included in the original IED proposal for those species not listed above.
• thresholds for all species based on the “Livestock Units” approach.
• Other MS specific approaches/thresholds such as those developed by France based around the concept of animal-equivalent (Annex I to Decree No 2005-989)11.
Some of these options are already applied by a selection of MSs in their national legislation.
Discussion of possible approaches for setting thresholds
Two main means have been observed for calculating thresholds – based on Livestock Units (LU or LSUs) and on Equivalent Nitrogen Excretion Factors (ENEF) (Alterra, 2007). For the IPPC Directive Review, Alterra applied the ENEF approach for estimating alternative thresholds for use in the scenario modelling as it was felt to be a more appropriate measure for reflecting the impact of animal production on the environment. However, in this review, we have examined the potential outcomes using both approaches as well as other approaches such as that used in France.
Livestock Units Approach
Eurostat provides the following definition of Livestock Unit: “The Livestock unit (LU) is a unit used to compare or aggregate numbers of animals of different species or categories. Equivalences based on the food requirements of the animals are defined. By definition, a cow weighing 600 kg and producing 3000 litres of milk per year = 1 LU,
11 Further details of this approach are set out in Appendix 2.

42
© AMEC Environment & Infrastructure UK Limited September 2012 Doc Reg No. 30310rr001i5
a calf for slaughter = 0.45 LU, a nursing ewe = 0.18 LU, a sow = 0.5 LU and a duck = 0.014 LU.” The Food and Agriculture Organisation (FAO) has also produced a list of LUs by key species and for different regions.
By equating these LSU value for poultry species for which IPPC thresholds have been set, further thresholds can be derived for those for which no IPPC thresholds have been set. By way of example, if the target weight for 1 LSU = 600kg, and a quail weighs 0.2kg at slaughter, then 3,000 quail equate to 1 LSU (600/0.2). However, this approach makes no provision for time taken to reach target weights (or, put another way, throughput). For this approach to be valid, growth rates and food conversion rates would need to be broadly similar.
For interest, Table 3.14 below uses the known LSU and threshold data to develop indications of what thresholds may be applied (using the LSU approach) to other species of poultry. This calculates how many LSUs it takes to reach the threshold, either the initial thresholds that were proposed in the original IED proposals where this is available, or the calculated threshold using the average LSU for those species for which a threshold is available. However, the wide variation in body weights for an LSU (300kg – 750kg) and the number of LSU to reach proposed thresholds (150 – 240), means that this is not a very reliable basis for producing thresholds.
Table 3.14 Thresholds Derived Using an LSU Approach
Species Threshold (P=Proposed; D=Derived)
LSU per animal Threshold in LSU Terms
Pigs 2000 (P) 0.08 160
Sows 750 (P) 0.2 150
Broilers 40000 (P) 0.005 200
Layers 30,000 (P) 0.008 240
Ducks 24000 (P) 0.01 240
Turkeys (mid-weight) 11500 (P) 0.0165 190
Quail, pigeons and partridges 475000 (D) 0.0004 190
Guinea Fowl 63300 (D) 0.003 190
Geese – light 19000 (D) 0.01 190
Geese – heavy 11875 (D) 0.016 190
Turkey - light 14600 (D) 0.013 190
Turkey – heavy 9500 (D) 0.02 190
Ostrich 575 (D) 0.33 190
The current thresholds, when assessed in LSU terms, show considerable variation between a low of 150 LSUs (for sows) and 240 (for ducks and layers). In other words, the thresholds would be more favourable towards ducks and layers than sows.
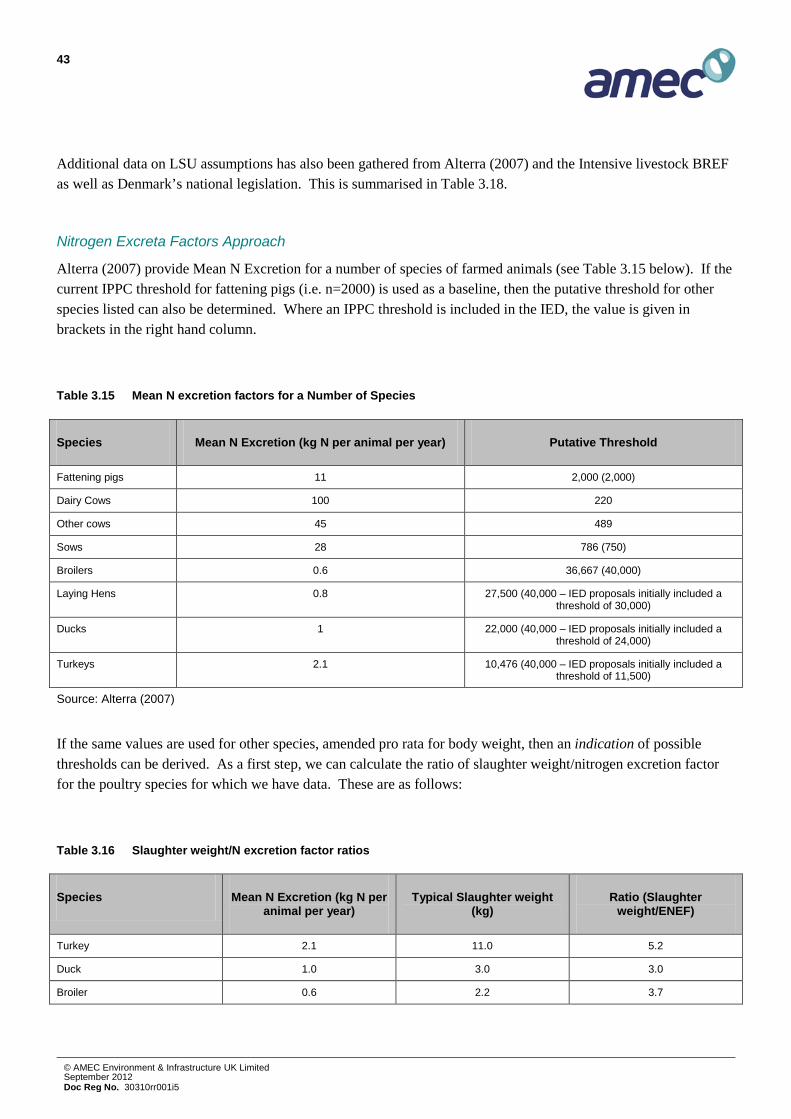
43
© AMEC Environment & Infrastructure UK Limited September 2012 Doc Reg No. 30310rr001i5
Additional data on LSU assumptions has also been gathered from Alterra (2007) and the Intensive livestock BREF as well as Denmark’s national legislation. This is summarised in Table 3.18.
Nitrogen Excreta Factors Approach
Alterra (2007) provide Mean N Excretion for a number of species of farmed animals (see Table 3.15 below). If the current IPPC threshold for fattening pigs (i.e. n=2000) is used as a baseline, then the putative threshold for other species listed can also be determined. Where an IPPC threshold is included in the IED, the value is given in brackets in the right hand column.
Table 3.15 Mean N excretion factors for a Number of Species
Species Mean N Excretion (kg N per animal per year) Putative Threshold
Fattening pigs 11 2,000 (2,000)
Dairy Cows 100 220
Other cows 45 489
Sows 28 786 (750)
Broilers 0.6 36,667 (40,000)
Laying Hens 0.8 27,500 (40,000 – IED proposals initially included a threshold of 30,000)
Ducks 1 22,000 (40,000 – IED proposals initially included a threshold of 24,000)
Turkeys 2.1 10,476 (40,000 – IED proposals initially included a threshold of 11,500)
Source: Alterra (2007)
If the same values are used for other species, amended pro rata for body weight, then an indication of possible thresholds can be derived. As a first step, we can calculate the ratio of slaughter weight/nitrogen excretion factor for the poultry species for which we have data. These are as follows:
Table 3.16 Slaughter weight/N excretion factor ratios
Species Mean N Excretion (kg N per animal per year)
Typical Slaughter weight (kg)
Ratio (Slaughter weight/ENEF)
Turkey 2.1 11.0 5.2
Duck 1.0 3.0 3.0
Broiler 0.6 2.2 3.7

44
© AMEC Environment & Infrastructure UK Limited September 2012 Doc Reg No. 30310rr001i5
However, using the values for turkeys, ducks and broilers as a basis, the ENEF values for other poultry species can be estimated using the ratio produced above (5.2, 3.0 and 3.7 respectively). However, the wide range of values means that any putative threshold derived in this way should not be considered robust. The value thus derived can be converted to a putative threshold using (for example) the threshold for fattening pigs (of 2,000) multiplied by the ENEF value (11) = 22,000. Layers do not quite fit this approach to setting thresholds as the slaughter weight is of little relevance to the production system; chickens are kept for their egg-laying not their meat.
Table 3.17 Derived ENEF values and putative thresholds for other poultry species
Species Mean N Excretion (kg N per animal per year) Derived Putative Threshold (Max and Min Values divided into 22,000)
Max Min Lower Upper
Ostrich 100kg/3 = 33.3 100kg/5.2 = 19.2 660 1,145
Geese 7.5kg/3 = 2.5 7.5kg/5.2 = 1.44 8,800 15,300
Guinea fowl 1.6kg/3 = 0.53 1.6kg/5.2 = 0.31 41,500 70,700
Quail, pigeon and partridges
0.2kg/3 = 0.067 0.2kg/5.2 = 0.038 330,000 580,000
It is, however, pertinent to make note of the findings of recent research in Scotland and Northern Ireland12 which suggests that the standard data on nitrogen excretion from animals of different species used to generate the IPPC thresholds may overstate the amount of nitrogen (by a considerable margin in some cases). They attribute this difference to changes in the way the animals are managed and fed.
Additional data on nitrogen excretion factors has also been provided by Austria, France, Germany, Ireland, Italy, Spain and the UK. This is summarised in Table 3.18
Animal-equivalent approach (France)
The French government has introduced legislation (Annex I to Decree No 2005-989) for the purpose of implementing the IPPC Directive which employs the concept of animal-equivalent. Under this system, poultry and game birds are counted by using the following values:
• quail = 0.125;
12 See: http://www.sniffer.org.uk/Webcontrol/Secure/ClientSpecific/ResourceManagement/UploadedFiles/UKPIR01%20Technical%20report.pdf

45
© AMEC Environment & Infrastructure UK Limited September 2012 Doc Reg No. 30310rr001i5
• pigeon, partridge = 0.25;
• hen, standard chicken, ‘quality label’ chicken, organic chicken, pullet, laying hen, breeder hen, pheasant, guinea fowl, mallard duck = 1;
• roasting duck, duck ready for force-feeding, breeder duck = 2;
• turkey, goose = 3;
• force-fed geese or duck = 5.
These have been defined according to the species’ impact on air, soil and water as well as other impacts such as noise and odour (see Appendix B for further details). Within the French legislation there are two criteria used for determining farms to be regulated:
i. Each farm with more than 40 000 poultry places must hold an IPPC permit.
ii. Under the IPPC threshold, the national legislation takes into account the number of animal-equivalent instead of the number of places. Poultry farms are subject to authorisation with impact studies and public participation if they hold more than 30 000 animal-equivalents of poultry. Furthermore, poultry farms declare if they detain between 5,000 and 30,000 animal-equivalents of poultry. This national approach for regulation was in force before the implementation of the IPPC directive.
Summary
The table on the following page provides a summary of the data gathered during this study covering the three main approaches described above. Gaps in the table indicate that no data was provided for that particular species.

46
© AMEC Environment & Infrastructure UK Limited September 2012 Doc Reg No. 30310rr001i5
Table 3.18 Overview of data gathered during this study for the three main options for determining thresholds (ENEF, LSU and animal equivalent)
MS / Source
Units Broilers Layers Pullets Turkeys Guinea Fowl
Ducks Geese Quails Pigeons Pheasants Partridges
Alterra (2007)
kg N per place per year
0.6 0.8 2.1 1
Intensive livestock BREF
Livestock unit (where 1 LSU = 500kg animal mass)
0.0008 (25 days) – 0.0014 (36 days)
0.0034 (average mass 1.7kg) – 0.004 (average mass 2kg)
0.0079 (hens) – 0.0164 (male)
0.0022 (average mass 1.1kg) – 0.0038 (average mass 1.9kg)
Austria (note 1)
kg N per place per year
0.52 0.52 1.1 1.1 1.1
Denmark (Note 2)
Number of units equalling 1 LSU
2,600 (56 day broiler) – 4,500 (32 day broiler) broilers produced
167 hen-years
1,050-1,360 190 (cocks) – 340 (hens) turkeys produced
900 ducks produced
290 geese produced
France kg N per place per year
0.31 0.71 0.99 (medium)
0.32 Muscovy – 0.61
Pekin – 0.86
0.67 0.15
Animal-equivalent
1 1 1 3 1 2 3 0.125 0.25 1 0.25
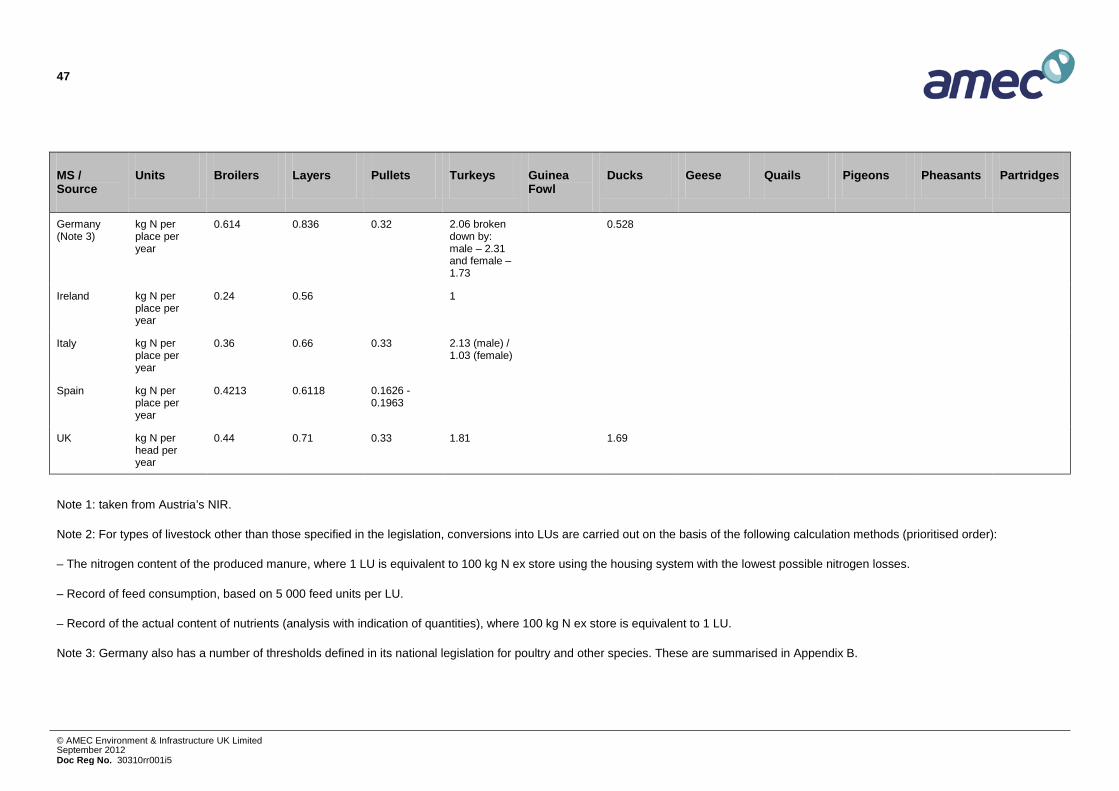
47
© AMEC Environment & Infrastructure UK Limited September 2012 Doc Reg No. 30310rr001i5
MS / Source
Units Broilers Layers Pullets Turkeys Guinea Fowl
Ducks Geese Quails Pigeons Pheasants Partridges
Germany (Note 3)
kg N per place per year
0.614 0.836 0.32 2.06 broken down by: male – 2.31 and female – 1.73
0.528
Ireland kg N per place per year
0.24 0.56 1
Italy kg N per place per year
0.36 0.66 0.33 2.13 (male) / 1.03 (female)
Spain kg N per place per year
0.4213 0.6118 0.1626 - 0.1963
UK kg N per head per year
0.44 0.71 0.33 1.81 1.69
Note 1: taken from Austria’s NIR.
Note 2: For types of livestock other than those specified in the legislation, conversions into LUs are carried out on the basis of the following calculation methods (prioritised order):
– The nitrogen content of the produced manure, where 1 LU is equivalent to 100 kg N ex store using the housing system with the lowest possible nitrogen losses.
– Record of feed consumption, based on 5 000 feed units per LU.
– Record of the actual content of nutrients (analysis with indication of quantities), where 100 kg N ex store is equivalent to 1 LU.
Note 3: Germany also has a number of thresholds defined in its national legislation for poultry and other species. These are summarised in Appendix B.

48
© AMEC Environment & Infrastructure UK Limited September 2012 Doc Reg No. 30310rr001i5
It is interesting to note that there is significant variation in assumptions for both ENEF and LSUs between sources for each species e.g. ENEFs for broilers vary from 0.24 to 0.61 kg of nitrogen per place per year. This may reflect differences in housing and/or feeding strategies as well as inter- or intra-species differences e.g. some MSs provided details for multiple types of a single species such as ducks. However, whilst there are differences between the figures from different sources (where comparable), it is clear that some species are potentially more polluting than others when comparing values from a single source. This is to be expected considering the size differences between species as well as variations in feeding and housing strategies.
These different approaches and underlying assumptions can be applied to derive indicative thresholds for different poultry species. For this analysis, we have based our estimations on the current threshold for broilers e.g. if a MS uses an equivalent nitrogen excretion factor (e.g. kg N per place per year) of 0.3 for broilers and 0.6 for laying hens then the derived threshold for the latter would be 20,000. The table on the following page summarises the resulting thresholds for each species and data source (where data was available). Where multiple values have been provided for a single species (e.g. different sized turkeys) we have taken an average or middle value.
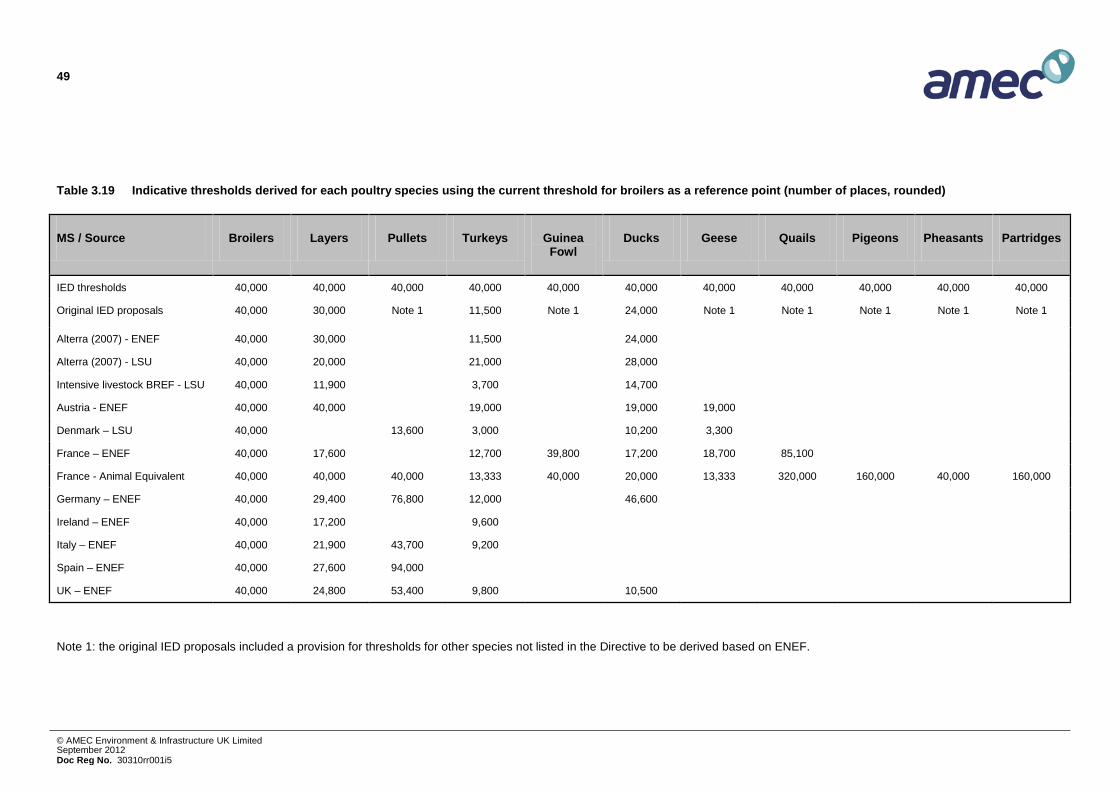
49
© AMEC Environment & Infrastructure UK Limited September 2012 Doc Reg No. 30310rr001i5
Table 3.19 Indicative thresholds derived for each poultry species using the current threshold for broilers as a reference point (number of places, rounded)
MS / Source Broilers Layers Pullets Turkeys Guinea Fowl
Ducks Geese Quails Pigeons Pheasants Partridges
IED thresholds 40,000 40,000 40,000 40,000 40,000 40,000 40,000 40,000 40,000 40,000 40,000
Original IED proposals 40,000 30,000 Note 1 11,500 Note 1 24,000 Note 1 Note 1 Note 1 Note 1 Note 1
Alterra (2007) - ENEF 40,000 30,000 11,500 24,000
Alterra (2007) - LSU 40,000 20,000 21,000 28,000
Intensive livestock BREF - LSU 40,000 11,900 3,700 14,700
Austria - ENEF 40,000 40,000 19,000 19,000 19,000
Denmark – LSU 40,000 13,600 3,000 10,200 3,300
France – ENEF 40,000 17,600 12,700 39,800 17,200 18,700 85,100
France - Animal Equivalent 40,000 40,000 40,000 13,333 40,000 20,000 13,333 320,000 160,000 40,000 160,000
Germany – ENEF 40,000 29,400 76,800 12,000 46,600
Ireland – ENEF 40,000 17,200 9,600
Italy – ENEF 40,000 21,900 43,700 9,200
Spain – ENEF 40,000 27,600 94,000
UK – ENEF 40,000 24,800 53,400 9,800 10,500
Note 1: the original IED proposals included a provision for thresholds for other species not listed in the Directive to be derived based on ENEF.

50
© AMEC Environment & Infrastructure UK Limited September 2012 Doc Reg No. 30310rr001i5
In line with the data presented in Table 3.18, there is a wide range of variability in terms of the calculated thresholds between sources. For the main species of relevance, these can be summarised as follows.
Table 3.20 Summary of derived thresholds using different approaches
Species ENEF approach LSU approach Animal Equivalent approach
Broilers 40,000 (used as basis for calculation)
Layers 17,200-40,000 11,900-20,000 40,000
Turkeys 9,200-19,000 3,700-21,000 13,333
Guinea Fowl 39,800 No data 40,000
Ducks 10,500-46,500 14,700-28,200 20,000
Geese 18,700-19,000 No data 13,333
Quails 85,100 No data 320,000
Pigeons No data No data 160,000
Pheasants No data No data 40,000
Partridges No data No data 160,000
Clearly if another poultry type and existing IED threshold was used as the basis for deriving differentiated thresholds for other species, then the absolute values would differ but the overall pattern would remain the same e.g. if turkeys were used as the basis for calculation then the thresholds for smaller birds such as broilers would be much higher.
3.3.2 Number of installations potentially affected
As described in Sections 2.4 and 3.2.1, relatively limited data has been provided by MSs which would allow for the identification of the numbers of installations that could be affected by the introduction of differentiated thresholds for different poultry species. In addition, the Eurostat data for non layer/broiler poultry farms is not disaggregated by species. However, the Alterra 2007 report for the review of the Directive estimated the numbers of farms that could be affected. In addition, some MSs and other stakeholders have provided estimates of the number of farms that could be affected based on the thresholds proposed in the original IED proposals.
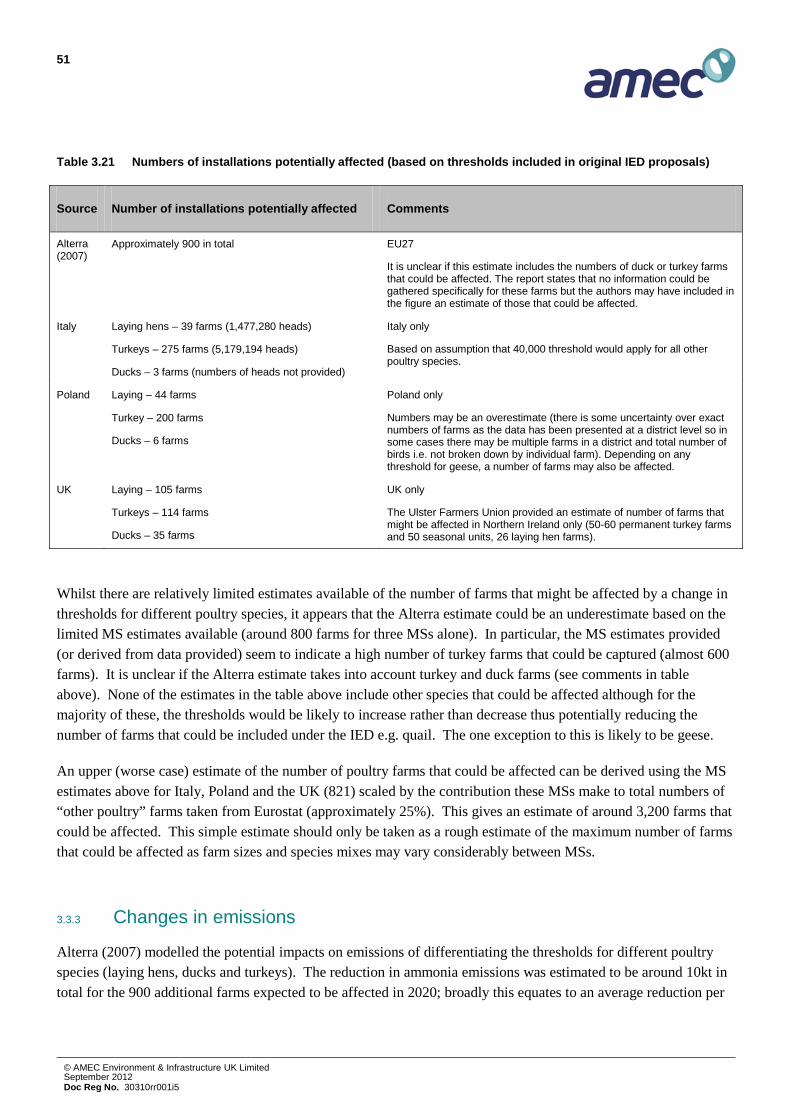
51
© AMEC Environment & Infrastructure UK Limited September 2012 Doc Reg No. 30310rr001i5
Table 3.21 Numbers of installations potentially affected (based on thresholds included in original IED proposals)
Source Number of installations potentially affected Comments
Alterra (2007)
Approximately 900 in total EU27
It is unclear if this estimate includes the numbers of duck or turkey farms that could be affected. The report states that no information could be gathered specifically for these farms but the authors may have included in the figure an estimate of those that could be affected.
Italy Laying hens – 39 farms (1,477,280 heads)
Turkeys – 275 farms (5,179,194 heads)
Ducks – 3 farms (numbers of heads not provided)
Italy only
Based on assumption that 40,000 threshold would apply for all other poultry species.
Poland Laying – 44 farms
Turkey – 200 farms
Ducks – 6 farms
Poland only
Numbers may be an overestimate (there is some uncertainty over exact numbers of farms as the data has been presented at a district level so in some cases there may be multiple farms in a district and total number of birds i.e. not broken down by individual farm). Depending on any threshold for geese, a number of farms may also be affected.
UK Laying – 105 farms
Turkeys – 114 farms
Ducks – 35 farms
UK only
The Ulster Farmers Union provided an estimate of number of farms that might be affected in Northern Ireland only (50-60 permanent turkey farms and 50 seasonal units, 26 laying hen farms).
Whilst there are relatively limited estimates available of the number of farms that might be affected by a change in thresholds for different poultry species, it appears that the Alterra estimate could be an underestimate based on the limited MS estimates available (around 800 farms for three MSs alone). In particular, the MS estimates provided (or derived from data provided) seem to indicate a high number of turkey farms that could be captured (almost 600 farms). It is unclear if the Alterra estimate takes into account turkey and duck farms (see comments in table above). None of the estimates in the table above include other species that could be affected although for the majority of these, the thresholds would be likely to increase rather than decrease thus potentially reducing the number of farms that could be included under the IED e.g. quail. The one exception to this is likely to be geese.
An upper (worse case) estimate of the number of poultry farms that could be affected can be derived using the MS estimates above for Italy, Poland and the UK (821) scaled by the contribution these MSs make to total numbers of “other poultry” farms taken from Eurostat (approximately 25%). This gives an estimate of around 3,200 farms that could be affected. This simple estimate should only be taken as a rough estimate of the maximum number of farms that could be affected as farm sizes and species mixes may vary considerably between MSs.
3.3.3 Changes in emissions
Alterra (2007) modelled the potential impacts on emissions of differentiating the thresholds for different poultry species (laying hens, ducks and turkeys). The reduction in ammonia emissions was estimated to be around 10kt in total for the 900 additional farms expected to be affected in 2020; broadly this equates to an average reduction per

52
© AMEC Environment & Infrastructure UK Limited September 2012 Doc Reg No. 30310rr001i5
farm of around 11t of ammonia per year. Impacts on other pollutants such as CH4 and N2O were estimated to be negligible; dust emissions were not considered. For comparison, the UK IA undertaken during the IED negotiations estimated ammonia emissions to reduce by approximately 4-5t per installation per year as a result of the additional layer, turkey and duck farms being captured under the IED.
Using these unit reductions and the estimates of the numbers of farms that could be affected as described in the previous section, gives us a total reduction of NH3 emissions of around 4kt (900 farms x 4t of NH3 reduced per farm) to 35kt (3,200 farms x 11t) per year.
It should be noted that a number of MSs already regulate poultry installations using a weighted threshold approach so the emission reductions (and costs) may in fact be lower (or zero) for some farms/MSs as they already have to meet certain environmental criteria. Similarly, some aspects of BAT (such as protein feeding strategies) may already be applied by larger installations.
3.3.4 Costs
Any farm brought under the scope of the IED for the first time would need to comply with the requirements of the Directive in terms of operating according to BAT as set out in the BREF (as described in Section 3.2.3) as well as applying for and maintaining an environmental permit.
Compliance costs
IIASA (2007) – as part of the “Integrated measures in agriculture to reduce ammonia emissions” framework contract – estimated the compliance costs for bringing around 900 additional poultry farms under the IED to be about €10 million per year or approximately €11k per installation per year in 2020.
This compares favourably with the estimate developed in the UK IA of the proposed changes to the thresholds with an average annual cost per installation in the UK around €9k.
Administrative costs
Administrative costs for operators can be broken down into two main elements each of which can be further sub-divided:
• Permit application (one-off):
- permit application fees payable to the regulator;
- farmer’s time to prepare the permit and all of the supporting information required (varies depending upon whether or not farmer uses consultants to prepare the application).
53
© AMEC Environment & Infrastructure UK Limited September 2012 Doc Reg No. 30310rr001i5
• Subsistence costs (annual):
- subsistence charge payable to the regulator;
- farmer’s time for record keeping, inventory preparation, staff training and inspections.
For some IPPC sectors it could be assumed that the permit fees and subsistence charges paid by operators would be sufficient to cover regulators’ costs for the processing of the permit and ongoing enforcement. In the UK, however, an audit of the actual costs incurred in processing IPPC permits for newly regulated agriculture installations revealed that their processing costs have actually been approximately 70% higher than the permit fee itself. This has been due to a number of reasons including the fact that detailed ammonia dispersion modelling has been undertaken on behalf of applicants during the initial tranche in 2007. In addition, the Commission’s IED impact assessment highlighted that many regulators do not charge fees or only have partial cost recovery so the price paid is not fully representative of the actual cost. The annual subsistence fee paid by operators should generally be sufficient to cover any ongoing costs.
IIASA (2007) estimated total administrative costs (using UK permit application and subsistence fees) for poultry farms being brought under the IED across the EU to be approximately €4.5 million for application fees (€5k per installation) and a further €2.7 million in administrative costs (€3k per installation). Assuming a permit lifetime of 20 years and discount rate of 4%, the annual average administrative cost per installation using these figures is around €3.4k. However, these estimates do not take into account the administrative cost associated with the time it takes a farmer (or consultants) to prepare the permit application and supporting information as well as for ongoing record keeping etc.
The UK IA of the proposed changes provides a more comprehensive estimate of the potential administrative costs associated with capture under the IED and includes all of the elements set out above. This estimates one-off costs to be around €7.8-12.4k per installation and annual administrative costs of around €4.9-5.8k (annual average cost of €5.5-6.6k based on the same assumptions as above).
Note, that both of these estimates are based on UK permit application fees and subsistence charges which may not be representative of other EU MSs. In addition, administrative costs could be much lower e.g. if general binding rules are applied.
Total costs
The table below summarises the range of potential compliance and administrative costs associated with bringing additional poultry farms under the scope of the Directive. These are based on the low and high estimates of number of farms that could be affected as well as the range of compliance and administrative costs.
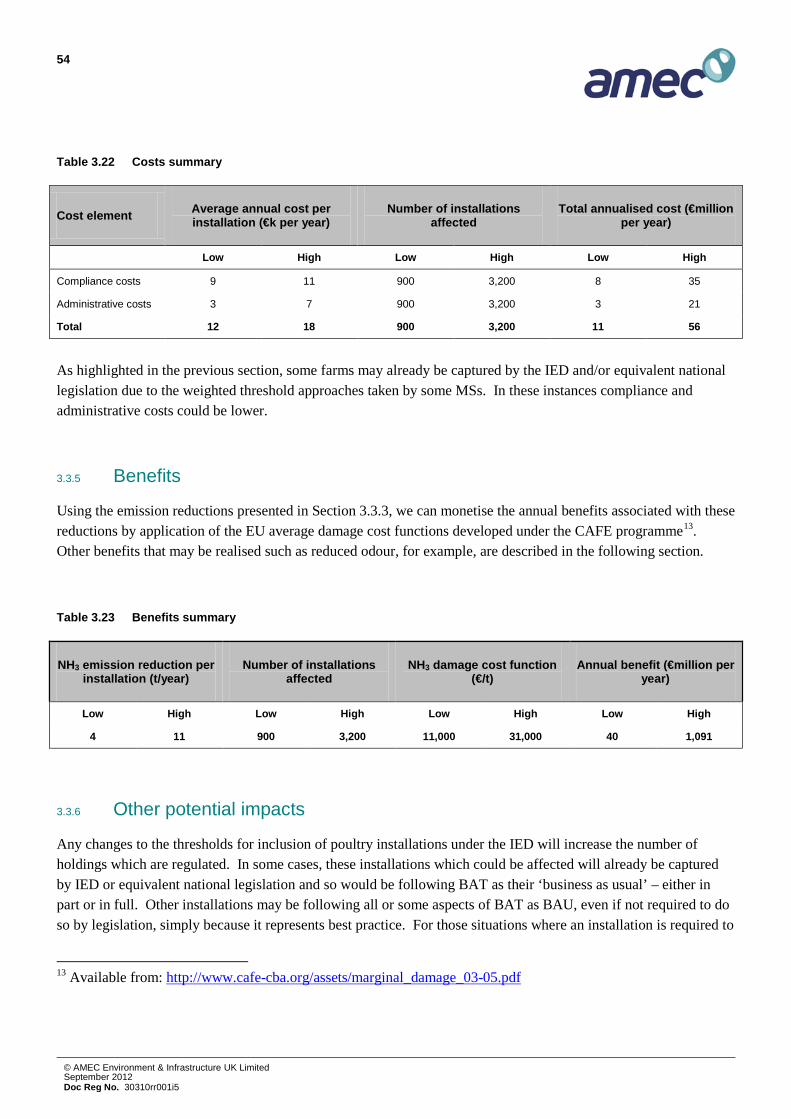
54
© AMEC Environment & Infrastructure UK Limited September 2012 Doc Reg No. 30310rr001i5
Table 3.22 Costs summary
Cost element Average annual cost per installation (€k per year)
Number of installations affected
Total annualised cost (€million per year)
Low High Low High Low High
Compliance costs 9 11 900 3,200 8 35
Administrative costs 3 7 900 3,200 3 21
Total 12 18 900 3,200 11 56
As highlighted in the previous section, some farms may already be captured by the IED and/or equivalent national legislation due to the weighted threshold approaches taken by some MSs. In these instances compliance and administrative costs could be lower.
3.3.5 Benefits
Using the emission reductions presented in Section 3.3.3, we can monetise the annual benefits associated with these reductions by application of the EU average damage cost functions developed under the CAFE programme13. Other benefits that may be realised such as reduced odour, for example, are described in the following section.
Table 3.23 Benefits summary
NH3 emission reduction per installation (t/year)
Number of installations affected
NH3 damage cost function (€/t)
Annual benefit (€million per year)
Low High Low High Low High Low High
4 11 900 3,200 11,000 31,000 40 1,091
3.3.6 Other potential impacts
Any changes to the thresholds for inclusion of poultry installations under the IED will increase the number of holdings which are regulated. In some cases, these installations which could be affected will already be captured by IED or equivalent national legislation and so would be following BAT as their ‘business as usual’ – either in part or in full. Other installations may be following all or some aspects of BAT as BAU, even if not required to do so by legislation, simply because it represents best practice. For those situations where an installation is required to
13 Available from: http://www.cafe-cba.org/assets/marginal_damage_03-05.pdf
55
© AMEC Environment & Infrastructure UK Limited September 2012 Doc Reg No. 30310rr001i5
make changes to its system of operation in order to comply with BAT, there are likely to be a variety of other impacts, as discussed (in qualitative terms) below.
Odour
• good housekeeping/management;
• rapid incorporation of manures into the soil following landspreading operations should reduce odour in the vicinity of the receiving land, as the time available for emissions to arise should be reduced;
• improvements in livestock housing and manure storage to reduce emissions to air of gases should reduce odour in the vicinity of the buildings.
Noise
• There are unlikely to be any impacts with respect to noise pollution.
Heavy Metals
• There are unlikely to be any impacts with respect to pollution from heavy metals.
Socio-economic impacts:
• Employment and labour market
- If IED is to apply to all installations (new and existing), there will be cases where existing installations will be faced with additional capital and operating costs (to modify buildings or improve slurry storage) as well as the administrative burden of falling under a permitting regime. The socio-economic impacts will depend, to some extent, how individual business managers of affected installations respond. Two possible responses are:
- to reduce the scale of operation to below the thresholds
- to go out of business (or at least to cease that particular enterprise) rather than face the additional burdens imposed by the IED regime, or the loss of profits from stock reductions.
- In both these scenarios, jobs could be lost but in the first case these are likely to be marginal (i.e. the effect on the individual business may be small) or, in the case of the second, limited in numbers but significant for the individual unit. It may be possible to limit the impact of demands for additional capital through the provision of an ‘improvement programme’ within the permitting regime with time to implement changes. Indeed, the clarification of the design standards that should be achieved in new build installations to meet environmental regulations may help the progress of applications for large scale developments through the planning process. Another possible consequence of the wider application of new measures affecting landspreading may

56
© AMEC Environment & Infrastructure UK Limited September 2012 Doc Reg No. 30310rr001i5
persuade farmers to place more reliance on contractors, resulting in a reduction in labour demand on farms that may not necessarily result in gains amongst contractors (although their profitability may increase as a result).
• Standards and rights related to job quality
- It is likely that the health and safety of workers at installations brought into using BAT for the first time would improve due to reductions in NH3 emissions.
- Workers may feel that the welfare of animals are improved as a result of improved management measures and so derive greater job satisfaction.
- The measures would facilitate and bring about technological innovation on some affected installations.
• Social inclusion and protection of particular groups
- The regulatory structure imposed by IED is well-established and able to be understood by members of the public with an interest in the process itself or its application to a given installation. The proposed changes in legislation will expand the transparency of this process to more installations (existing or proposed).
• Equality of treatment and opportunities, non-discrimination
- The proposed changes are not expected to have any impacts in terms of equality of treatment and opportunities, non-discrimination.
• Access to social protection, health and social security and educational systems
- The proposed changes are not expected to have any impacts in terms of access to social protection, health and social services and educational systems.
• Public health and safety
- There may be benefits in the control of micro-organisms associated with the introduction of BAT.
• Competitiveness
- Implementation of the proposed measures would introduce a more level playing field within the EU, ensuring that installations with a high potential to pollute are all captured under IED;
- It seems likely that only a very small percentage of the EU’s production capacity would be affected by the proposed extension to the coverage of the IED much of which may already be following some or all aspects of BAT e.g. the number of farms that could be affected represent less than 0.2% of total “other poultry” farms based on Eurostat data. Consequently, it is unlikely that the EU’s competitive position will be affected to any significant degree.
- An increase in the number of installations adopting BAT may yield benefits in the marketability of their produce, as their adherence to a set of objective standards could be publicised.

57
© AMEC Environment & Infrastructure UK Limited September 2012 Doc Reg No. 30310rr001i5
3.4 Summary The table below provides an overview of the indicative costs and benefits that have been estimated for the inclusion of additional poultry installations – laying hen, turkey and duck farms only – based on the thresholds included in the original IED proposals.
Table 3.24 Summary of indicative costs and benefits
Units Low High
Number of installations affected Farms 900 3,200
Total NH3 emission reductions Kilotonnes 4 35
Annual benefit €million per year 61 1,760
Annual cost (compliance and administrative) €million per year 11 56

58
© AMEC Environment & Infrastructure UK Limited September 2012 Doc Reg No. 30310rr001i5

59
© AMEC Environment & Infrastructure UK Limited September 2012 Doc Reg No. 30310rr001i5
4. Data analysis: mixed activities
4.1 Overview This section of the report presents the analysis for the mixed activities task and follows a similar structure to that of the previous chapter:
• Section 4.2 – Baseline definition: this sets out the current situation in terms of numbers of installations, emissions, BAT requirements and existing legislation.
• Section 4.3 – Analysis: this includes a summary of the options considered and their impacts in terms of numbers of installations affected, costs, emission reductions and associated benefits.
As noted in Section 2.4, we have received minimal information from Member States so the following sections are largely based on Eurostat data and are an update of the work undertaken in the previous study.
4.2 Baseline definition
4.2.1 Numbers of installations
As indicated in Table 2.3 very limited data was provided by selected Member States on “mixed activities”. Only one Member State (France) provided any data on numbers of farms included under this category. Therefore, other data sources have been used to define the baseline position in Europe.
The Farm Statistics Survey (FSS) data gives the following breakdown of pig heads and holdings in 2007 in the EU27. Piglet numbers are given here for comparison, but are not discussed further in the later sections of the report as they are not included in the scope of the directive.
Table 4.1 Number of swine heads and holdings in EU27, 2007
Number of heads Number of holdings
Sows over 50kg
Piglets under 20kg
Pigs other Total Sows over 50kg Piglets under 20kg
Pigs other
15,981,150 45,458,780 94,116,940 155,556,870 890,650 1,079,710 2,662,300
Note: Number of holdings are not totalled due to the overlap between categories (e.g. farms with sows and piglets).
The figures on the following page summarise the number of holdings broken down by MS for 2003, 2005 and 2007. Equivalent data for poultry is summarised in Section 3.2.1.

60
© AMEC Environment & Infrastructure UK Limited September 2012 Doc Reg No. 30310rr001i5
Figure 4.1 MS breakdown of number of holdings for 2003, 2005 and 2007 (breeding sows and other pigs)
0
500
1,000
1,500
2,000
2,500
3,000
3,500
Num
ber o
f hea
ds, 1
000s Number of heads, breeding sows
2003
2005
2007
02,0004,0006,0008,000
10,00012,00014,00016,00018,000
Num
ber o
f hea
ds, 1
000s Number of heads, pigs other
2003
2005
2007

61
© AMEC Environment & Infrastructure UK Limited September 2012 Doc Reg No. 30310rr001i5
4.2.2 Environmental impacts
The main environmental impacts from intensive livestock holdings are summarised in Section 3.2.2. Figure 3.3 provides a summary of ammonia emissions from different livestock including pigs and poultry.
4.2.3 BREF BAT requirements for pigs
BAT for poultry is outlined in Section 3.2.3. In the following sections, BAT for pigs is presented based on the BREF adopted in 2003.
Feeding Strategies
As far as nitrogen and consequently nitrates and ammonia outputs are concerned, a basis for BAT is to feed animals with successive diets (phase-feeding) with lower crude protein contents and lower phosphoros contents the fattening animals gain weight.
A crude protein reduction of 1 to 2 % (10 to 20 g/kg of feed) can be achieved depending on the breed/genotype and the current starting point. A total phosphorus reduction of 0.05 to 0.1 % (0.5 to 1 g/kg of feed) can be achieved depending on the breed/genotypes, the use of feed raw materials and the actual starting point by the application of highly digestible inorganic feed phosphates and/or phytase in the feed. The resulting range of dietary crude protein and phosphorus contents is reported in Table 4.2.
Table 4.2 Indicative crude protein and phosphorous levels in BAT-feeds for pigs
Species Phases Crude Protein Content (% in feed)
Total phosphorous content (% in feed)
Remark
Weaner <10kg 19-21 0.75-0.85 The implementation of low-protein animal feeding may cause different types of cost:
• Additional feed cost for optimized low protein compound feeds apply mainly on highly efficient farms.
• Additional costs for handling facilities related to several types of feed on a farm may apply if multi phase feeding is introduced.
• Additional time input of the farmer for improved planning of feed use will often be the main cost in New Member States and the ‘other cattle’ sector
Piglet <25kg 17.5-19.5 0.60-0.70
Fattening pig 25-50kg 15-17 0.45-0.55
50-110kg 14-15 0.38-0.49
Sow Gestation 13-15 0.43-0.51
Lactation 16-17 0.57-0.65

62
© AMEC Environment & Infrastructure UK Limited September 2012 Doc Reg No. 30310rr001i5
Housing systems
Designs to reduce ammonia emissions to air from pig housing systems, as presented in Table 4.3, involve some or all of the following principles:
• reducing emitting manure surfaces;
• removing the manure (slurry) from the pit to an external slurry store;
• applying an additional treatment, such as aeration, to obtain flushing liquid;
• cooling the manure surface; and
• using surfaces (for example, of slats and manure channels) which are smooth and easy to clean.
Table 4.3 Summary of characteristics of BAT for the reduction of emissions from pig housing
Housing system NH3-reduction (%)
Extra investment
Extra annual cost
Energy input (kWh/place/year)
Housing techniques for new installations for mating/gestating sows
Fully- or partly-slatted floor with vacuum system for frequent slurry removal
25-35 No data No data 42.2
Partly-slatted floor and a reduced manure pit 20-40 No data No data 42.2
Housing techniques for new installations for growers/finishers
Fully-slatted floor with vacuum system 25 No data No data 21.1 (I)
20 to 30 (D)
A partly-slatted floor with a reduced manure pit, including slanted walls and a vacuum system, or
a partly-slatted floor with a central, convex solid floor or an inclined solid floor at the front of the pen, a manure gutter with slanted sidewalls and a sloped manure pit
Concrete slats: 60 No data No data 21.1 (I)
20 to 30 (D) Metal slates: 66 No data No data
Techniques for farrowing sows
Fully-slatted iron or plastic floor and with a combination of a water and manure channel
52 No data No data
Fully-slatted floor and flushing system with manure gutters 60 No data No data
Fully-slatted floor and flushing system with manure pan 65 No data No data
Techniques for weaners
A pen or flatdeck with a fully-slatted- or partly-slatted floor with a vacuum system for frequent slurry removal
25 to 35 No data No data
A pen or flatdeck with a fully-slatted floor beneath which there is a concrete sloped floor to separate faeces and urine
30 less less
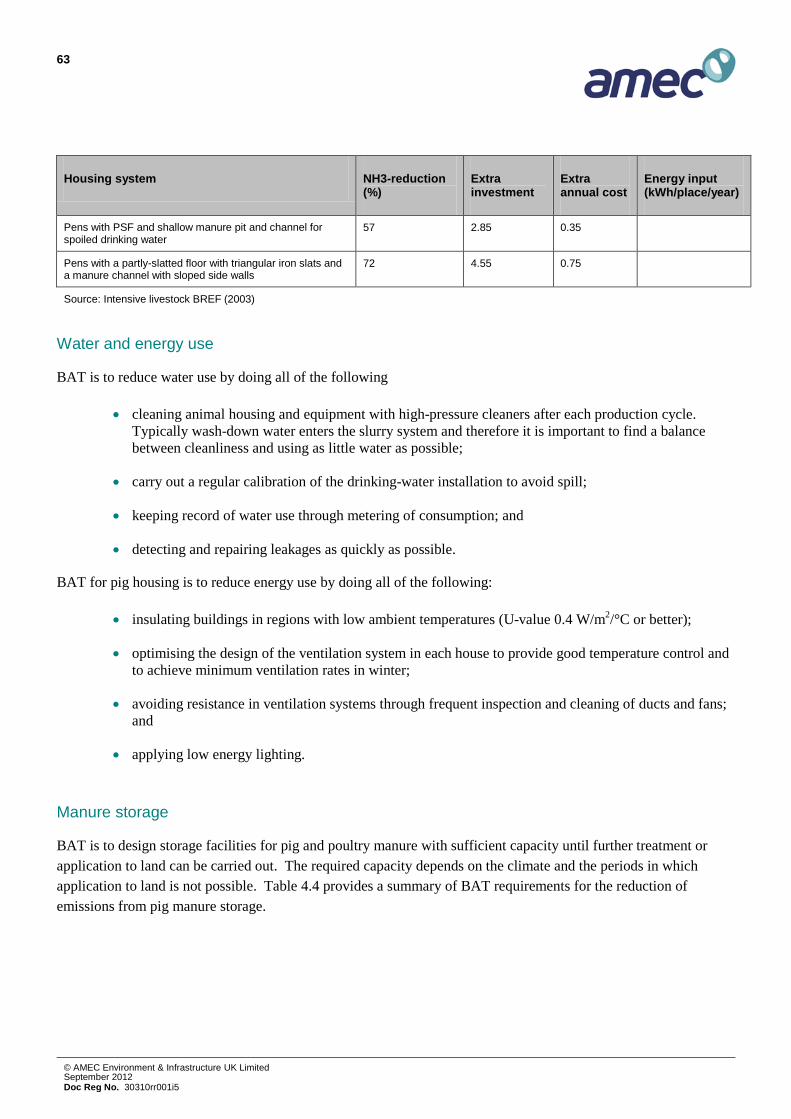
63
© AMEC Environment & Infrastructure UK Limited September 2012 Doc Reg No. 30310rr001i5
Housing system NH3-reduction (%)
Extra investment
Extra annual cost
Energy input (kWh/place/year)
Pens with PSF and shallow manure pit and channel for spoiled drinking water
57 2.85 0.35
Pens with a partly-slatted floor with triangular iron slats and a manure channel with sloped side walls
72 4.55 0.75
Source: Intensive livestock BREF (2003)
Water and energy use
BAT is to reduce water use by doing all of the following
• cleaning animal housing and equipment with high-pressure cleaners after each production cycle. Typically wash-down water enters the slurry system and therefore it is important to find a balance between cleanliness and using as little water as possible;
• carry out a regular calibration of the drinking-water installation to avoid spill;
• keeping record of water use through metering of consumption; and
• detecting and repairing leakages as quickly as possible.
BAT for pig housing is to reduce energy use by doing all of the following:
• insulating buildings in regions with low ambient temperatures (U-value 0.4 W/m2/°C or better);
• optimising the design of the ventilation system in each house to provide good temperature control and to achieve minimum ventilation rates in winter;
• avoiding resistance in ventilation systems through frequent inspection and cleaning of ducts and fans; and
• applying low energy lighting.
Manure storage
BAT is to design storage facilities for pig and poultry manure with sufficient capacity until further treatment or application to land can be carried out. The required capacity depends on the climate and the periods in which application to land is not possible. Table 4.4 provides a summary of BAT requirements for the reduction of emissions from pig manure storage.
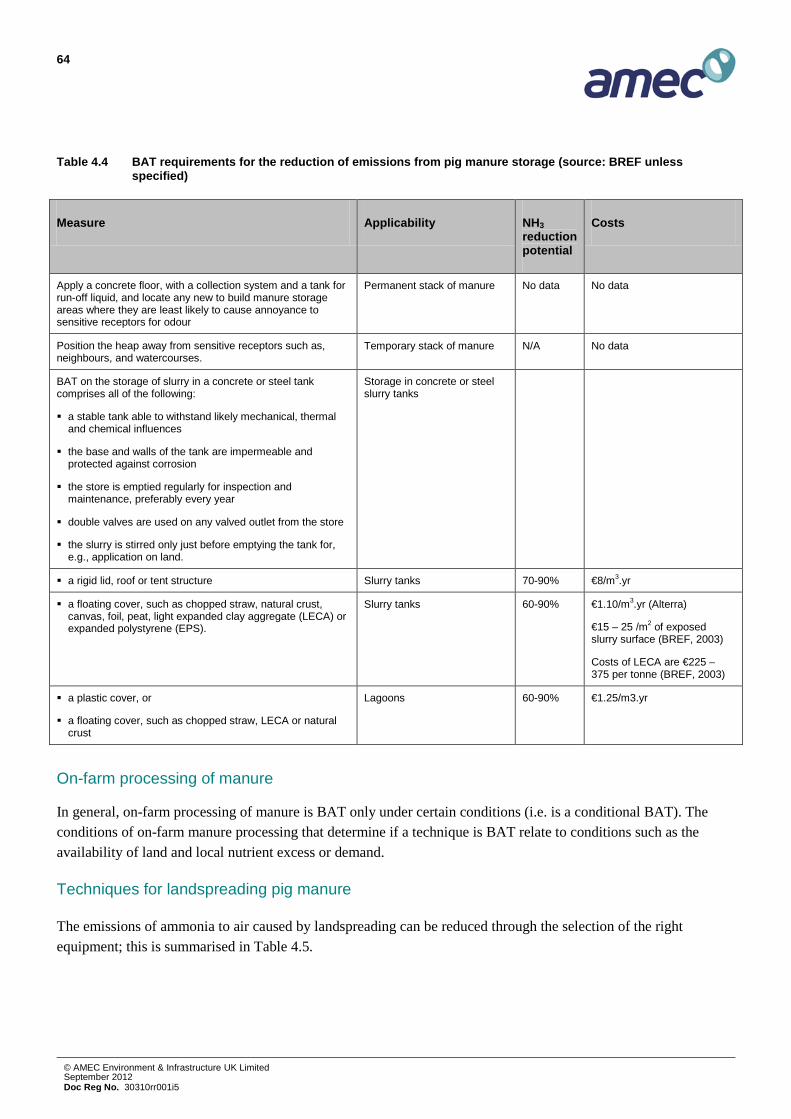
64
© AMEC Environment & Infrastructure UK Limited September 2012 Doc Reg No. 30310rr001i5
Table 4.4 BAT requirements for the reduction of emissions from pig manure storage (source: BREF unless specified)
Measure Applicability NH3 reduction potential
Costs
Apply a concrete floor, with a collection system and a tank for run-off liquid, and locate any new to build manure storage areas where they are least likely to cause annoyance to sensitive receptors for odour
Permanent stack of manure No data No data
Position the heap away from sensitive receptors such as, neighbours, and watercourses.
Temporary stack of manure N/A No data
BAT on the storage of slurry in a concrete or steel tank comprises all of the following:
a stable tank able to withstand likely mechanical, thermal and chemical influences
the base and walls of the tank are impermeable and protected against corrosion
the store is emptied regularly for inspection and maintenance, preferably every year
double valves are used on any valved outlet from the store
the slurry is stirred only just before emptying the tank for, e.g., application on land.
Storage in concrete or steel slurry tanks
a rigid lid, roof or tent structure Slurry tanks 70-90% €8/m3.yr
a floating cover, such as chopped straw, natural crust, canvas, foil, peat, light expanded clay aggregate (LECA) or expanded polystyrene (EPS).
Slurry tanks 60-90% €1.10/m3.yr (Alterra)
€15 – 25 /m2 of exposed slurry surface (BREF, 2003)
Costs of LECA are €225 – 375 per tonne (BREF, 2003)
a plastic cover, or
a floating cover, such as chopped straw, LECA or natural crust
Lagoons 60-90% €1.25/m3.yr
On-farm processing of manure
In general, on-farm processing of manure is BAT only under certain conditions (i.e. is a conditional BAT). The conditions of on-farm manure processing that determine if a technique is BAT relate to conditions such as the availability of land and local nutrient excess or demand.
Techniques for landspreading pig manure
The emissions of ammonia to air caused by landspreading can be reduced through the selection of the right equipment; this is summarised in Table 4.5.

65
© AMEC Environment & Infrastructure UK Limited September 2012 Doc Reg No. 30310rr001i5
Table 4.5 BAT on land-spreading equipment
Land use BAT Emission reduction Type of manure Applicability
Grassland and land with crop height below 30cm
Trailing hose (bandspreading)
30% this may be less if applied on grass height >10cm
Slurry Slope (<15% for tankers; <25% for umbilical systems); not for slurry that is viscous or has a high straw content, size and shape of the field are important
Mainly grassland Trailing shoe (bandspreading)
40 % Slurry Slope (<20% for tankers; <30% for umbilical systems); not viscous slurry, size and shape of the field are important
Grassland Shallow injection (open slot) 60% Slurry Slope <12%, greater limitations for soil type and conditions, not viscous slurry
Mainly grassland, arable land
Deep injection (closed slot) 80% Slurry Slope <12%, greater limitations for soil type and conditions, not viscous slurry
Arable land Bandspreading and incorporation within 4 hours
80% Slurry Incorporation is only applicable for land that can be easily cultivated, in other situations BAT is bandspreading without incorporation
Arable land Incorporation as soon as possible but at least within 12 hours
Within 4 hours: 80%
12 hours: 60-70%
Solid pig manure Only for land that can be easily cultivated
Source: BREF (2003)
4.2.4 Current regulation
National legislation
The table on the following page provides a short overview of which Member States currently have requirements placed upon farms with “mixed activities” in national legislation that may impact on emissions to air, water, climate change or biodiversity as well as planning controls for new units.

66
© AMEC Environment & Infrastructure UK Limited September 2012 Doc Reg No. 30310rr001i5
Table 4.6 National legislation relating to ‘mixed activities’
MS Summary of legislation Source
Denmark Denmark applies a Livestock Unit approach for determining whether an installation is covered by the legislation or not. In 2007 a new Environmental Approval Act for Livestock Holdings was put into force; this includes an approval system that applies to all livestock holdings for more than 75 LU.
Further information is provided in Appendix B.
Consultation
France No specific regulations are in place relating to “mixed activity” farms. Under the existing permit regulations (ICPE Law), farms are considered according to animal equivalence within a given category for pigs or poultry rearing.
Further information is provided in Appendix B.
Consultation
Germany As described in Table 2.3, Germany has a permitting regime which includes pigs, poultry, cattle and horses. In the case of “mixed activity” farms, a weighted approach is applied whereby a % of the threshold for each species is calculated and then summed. If it exceeds 100% then the installation is included.
Further information is provided in Appendix B.
Consultation
Netherlands No information received from Member State on “mixed activities”.
Poland No information received from Member State on “mixed activities”.
Romania According to the proforma, the “mixed activities” criterion is not applicable in Romania; no further details have been provided. Consultation
Spain No relevant legislation. Consultation
UK Legislation includes: Nitrate Pollution Prevention Regulations 2008, Sludge Use in Agriculture -Sewage Sludge Regulations 1989, Hazardous Waste Regulations 2005, Water Resources (Control of Pollution) (Silage, Slurry and Agricultural Fuel Oil) (England) Regulations 2010, Environmental Permitting Regulations 2010 (EPR), Water Resources (Abstraction & Impounding) Regulations 2006, Environmental Impact Assessment (EIA) - Scoping Opinions and Environmental Statement, Town and Country Planning (EIA2) Regulations 2011. However, this is not specific as such to dealing with the issue of “mixed activities”.
Consultation

67
© AMEC Environment & Infrastructure UK Limited September 2012 Doc Reg No. 30310rr001i5
Other legislation
Other relevant legislation is summarised in Section 3.2.4 and Table 3.11 (including details of the revision of the Gothenburg Protocol).
4.3 Data assessment
4.3.1 Overview
The following sections present an updated assessment from that developed in Entec (2009) for the Commission of the numbers of installations that might be affected by the mixed activities criterion. This uses more recent Eurostat data for 2007.
4.3.2 Number of installations potentially affected
In both the previous study and the consultation undertaken for this study, it was discovered that Member States may not necessarily have the information available to determine the number of farms potentially affected within their territory by the mixed activities rule. Information obtained from Member States was used in combination with Eurostat data on the number of farms currently just below the individual species thresholds in order to estimate the number of farms potentially affected.
The analysis considered the number of holdings with individual livestock just below the relevant thresholds from the Directive:
• Pigs - Breeding sows: 500-749
• Pigs - Other pig herd: 1750-1,999
• Poultry - Broiler flock: 35,000-39,999
• Poultry - Laying hen flock: 35,000-39,999.
As it was unknown what proportion of farms had a mixture of livestock within a holding, the previous study undertook a form of uncertainty analysis. This led to an estimate of between 1,000 to 2,500 farms being affected in the EU27 with those farms with a large proportion of breeding sows being the most likely to be affected14.
14 Note, this estimate was based on a lower threshold for laying hens (30,000) as included in the original IED proposals.
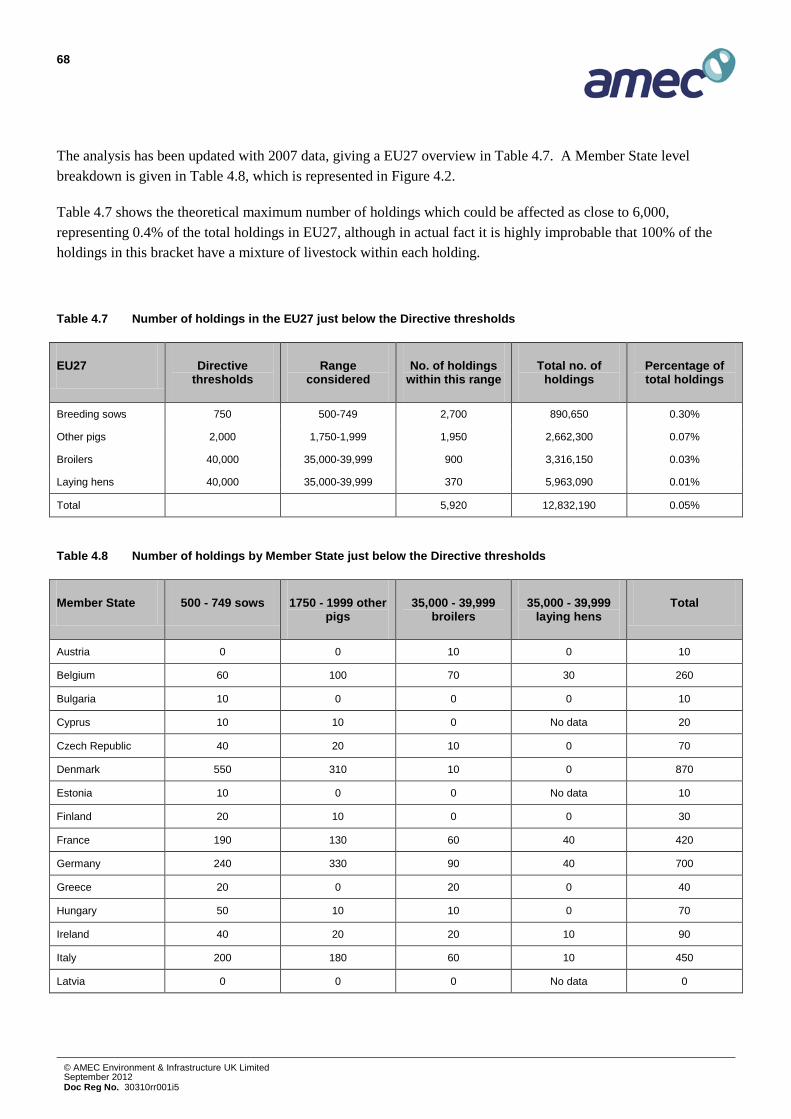
68
© AMEC Environment & Infrastructure UK Limited September 2012 Doc Reg No. 30310rr001i5
The analysis has been updated with 2007 data, giving a EU27 overview in Table 4.7. A Member State level breakdown is given in Table 4.8, which is represented in Figure 4.2.
Table 4.7 shows the theoretical maximum number of holdings which could be affected as close to 6,000, representing 0.4% of the total holdings in EU27, although in actual fact it is highly improbable that 100% of the holdings in this bracket have a mixture of livestock within each holding.
Table 4.7 Number of holdings in the EU27 just below the Directive thresholds
EU27 Directive thresholds
Range considered
No. of holdings within this range
Total no. of holdings
Percentage of total holdings
Breeding sows 750 500-749 2,700 890,650 0.30%
Other pigs 2,000 1,750-1,999 1,950 2,662,300 0.07%
Broilers 40,000 35,000-39,999 900 3,316,150 0.03%
Laying hens 40,000 35,000-39,999 370 5,963,090 0.01%
Total 5,920 12,832,190 0.05%
Table 4.8 Number of holdings by Member State just below the Directive thresholds
Member State 500 - 749 sows 1750 - 1999 other pigs
35,000 - 39,999 broilers
35,000 - 39,999 laying hens
Total
Austria 0 0 10 0 10
Belgium 60 100 70 30 260
Bulgaria 10 0 0 0 10
Cyprus 10 10 0 No data 20
Czech Republic 40 20 10 0 70
Denmark 550 310 10 0 870
Estonia 10 0 0 No data 10
Finland 20 10 0 0 30
France 190 130 60 40 420
Germany 240 330 90 40 700
Greece 20 0 20 0 40
Hungary 50 10 10 0 70
Ireland 40 20 20 10 90
Italy 200 180 60 10 450
Latvia 0 0 0 No data 0
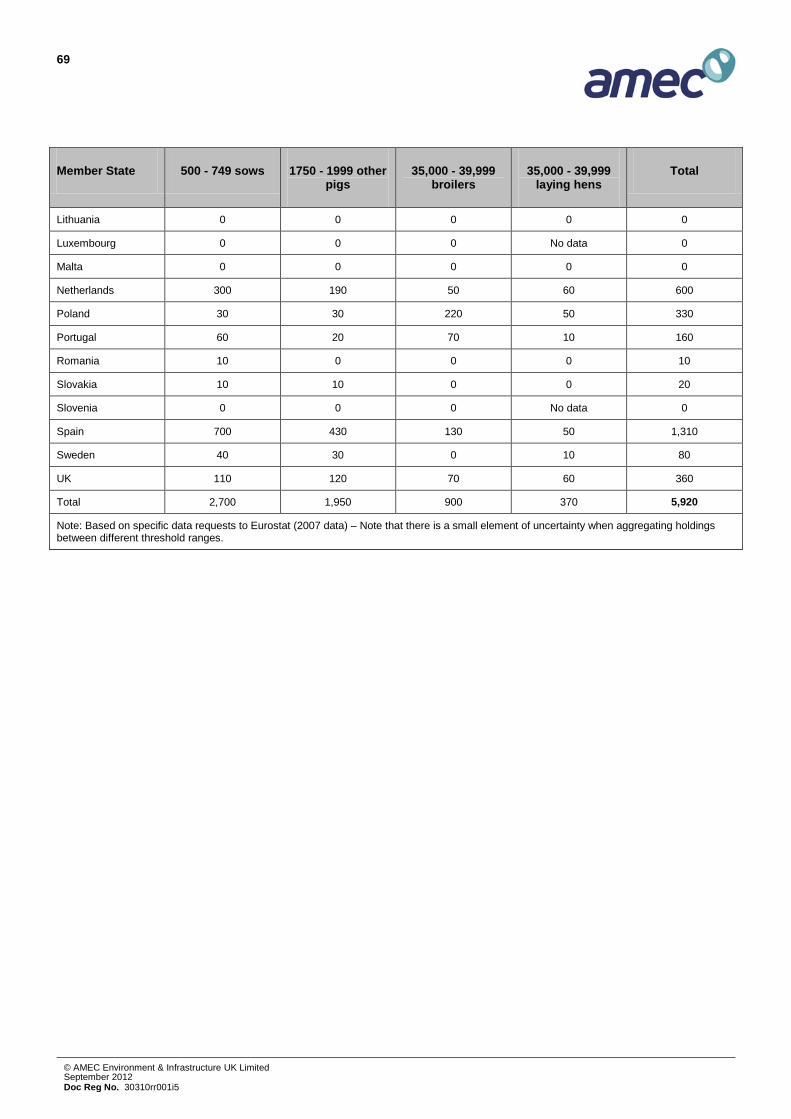
69
© AMEC Environment & Infrastructure UK Limited September 2012 Doc Reg No. 30310rr001i5
Member State 500 - 749 sows 1750 - 1999 other pigs
35,000 - 39,999 broilers
35,000 - 39,999 laying hens
Total
Lithuania 0 0 0 0 0
Luxembourg 0 0 0 No data 0
Malta 0 0 0 0 0
Netherlands 300 190 50 60 600
Poland 30 30 220 50 330
Portugal 60 20 70 10 160
Romania 10 0 0 0 10
Slovakia 10 10 0 0 20
Slovenia 0 0 0 No data 0
Spain 700 430 130 50 1,310
Sweden 40 30 0 10 80
UK 110 120 70 60 360
Total 2,700 1,950 900 370 5,920
Note: Based on specific data requests to Eurostat (2007 data) – Note that there is a small element of uncertainty when aggregating holdings between different threshold ranges.

70
© AMEC Environment & Infrastructure UK Limited September 2012 Doc Reg No. 30310rr001i5
Figure 4.2 Number of holdings just below the Directive thresholds – MS breakdown
0
200
400
600
800
1,000
1,200
Aust
ria
Belg
uim
Bulg
aria
Cyp
rus
Cze
ch R
epub
lic
Den
mar
k
Esto
nia
Finl
and
Fran
ce
Ger
man
y
Gre
ece
Hun
gary
Irela
nd
Italy
Lativ
a
Lith
uani
a
Luxe
mbo
urg
Mal
ta
Net
herla
nds
Pola
nd
Portu
gal
Rom
ania
Slov
akia
Slov
enia
Spai
n
Swed
en UK
Num
ber
of h
oldi
ngs
Member States
500 - 749 sows 1750 - 1999 other pigs 35,000 - 39,999 broilers 35,000 - 39,999 laying hens

71
© AMEC Environment & Infrastructure UK Limited September 2012 Doc Reg No. 30310rr001i5
Table 4.9 shows, for different percentages of the number of total farm holdings within livestock ranges just below the thresholds, the number of installations that might be captured due to the “mixed activities” criterion. For example, if we assume that 20% of all farm holdings just below respective livestock thresholds are holdings with more than one type of relevant livestock (which is covered under the IED) then the number of installations affected by the proposed IED is estimated around 1,200. This is also illustrated in Figure 4.3.
Figure 4.3 Number of holdings potentially affected by the mixed activities criterion
0
1,000
2,000
3,000
4,000
5,000
6,000
10% 20% 30% 40% 50% 60% 70% 80% 90% 100%
Num
ber o
f hol
ding
s af
fect
ed
% of holdings near the threshold
Breeding sows Other pigs Broilers Laying hens

72
© AMEC Environment & Infrastructure UK Limited September 2012 Doc Reg No. 30310rr001i5
Table 4.9 Number of holdings potentially affected by the mixed activities criterion
EU Directive threshold
Range considered
10% 20% 30% 40% 50% 60% 70% 80% 90% 100%
Breeding sows 750 500-749 270 540 810 1,080 1,350 1,620 1,890 2,160 2,430 2,700
Other pigs 2,000 1,750-1,999 195 390 585 780 975 1,170 1,365 1,560 1,755 1,950
Broilers 40,000 35,000-39,999 90 180 270 360 450 540 630 720 810 900
Laying hens 40,000 35,000-39,999 37 74 111 148 185 222 259 296 333 370
Total installations affected 592 1,184 1,776 2,368 2,961 3,553 4,145 4,737 5,329 5,921
73
© AMEC Environment & Infrastructure UK Limited September 2012 Doc Reg No. 30310rr001i5
4.3.3 Changes in emissions
As set out in Section 3.3.3, Alterra (2007) modelled the potential impacts on emissions of differentiating the thresholds for different poultry species (laying hens, ducks and turkeys). The reduction in ammonia emissions for each additional poultry farm was estimated to be around 11t of ammonia per year in 2020. Impacts on other pollutants such as CH4 and N2O were estimated to be negligible.
Additional scenarios considered in IIASA (2007) looked at the costs of lowering the thresholds for pigs. Scenario 2 modelled the impacts of lowering the thresholds for pigs to 1,750 (fattening pigs) and 675 (sows) as well as changes for poultry and the inclusion of cattle. A reduction in NH3 emissions of around 6.5kt per year for pigs only was foreseen. Alterra (2007) estimated an additional 2,320 fattening pig and 858 sow installations to be captured under this scenario; a total of 3,178 farms. Therefore, the average reduction per farm is around 2t of ammonia per year. As for the poultry analysis, impacts on other pollutants such as CH4 and N2O were estimated to be negligible.
Therefore, the emission reductions per farm if a mixed activities approach was applied under the IED could be in the range of 2-11t of NH3 per year depending on the mix of species e.g. a farm with mainly poultry and a small number of pigs would be at the upper end of the scale and vice-versa. Applying these figures to the estimated number of farms that could be affected – assuming between 10-30% of farms below the existing thresholds will be affected – gives us an overall potential emission reduction of 1-20kt of NH3 per year (assuming 592-1,776 installations are affected).
It should be noted that a number of MSs already regulate livestock installations using a weighted threshold approach so the emission reductions (and costs) may in fact be lower (or zero) for some farms/MSs as they already have to meet certain environmental criteria. Similarly, some installations will be following BAT measures as BAU for reasons of efficiency and cost-effectiveness.
4.3.4 Costs
Compliance costs
As set out in Section 3.3.4, IIASA (2007) modelled the compliance costs for bringing around 900 additional poultry farms under the IED to be about €10 million per year or approximately €11k per installation per year. Additional costs for pig farms (scenario 2 as described above) were estimated by IIASA (2007) to be approximately €75 million per year so around €24k per farm per year.
Therefore, the additional compliance cost per farm if a mixed activities approach was applied under the IED could be in the range of €11-24k per year depending on the mix of species e.g. a farm with mainly poultry and a small number of pigs would be at the lower end of the scale and vice-versa. In addition, for those farms already captured under existing national legislation the additional costs could be much lower.

74
© AMEC Environment & Infrastructure UK Limited September 2012 Doc Reg No. 30310rr001i5
Administrative costs
The estimates presented above do not include administrative costs associated with inclusion in a permitting regime. As set out in Section 3.3.4, these are in the order of €3-7k although they could be much lower if general binding rules were to be applied.
Total costs
The table below summarises the range of potential compliance and administrative costs associated with bringing additional pig and poultry farms under the scope of the Directive based on the assumption that 10-30% of farms below the existing thresholds could be affected. These are based on the low and high estimates of number of farms that could be affected as well as the range of compliance and administrative costs.
Table 4.10 Costs summary
Cost element Average annual cost per installation (€k per year)
Number of installations affected
Total annualised cost (€million per year)
Low High Low High Low High
Compliance costs 11 24 592 1,776 7 43
Administrative costs 3 7 592 1,776 2 12
Total 14 31 592 1,776 8 55
Note: Numbers may not sum due to rounding
As highlighted in the previous section, some farms may already be captured by the IED and/or equivalent national legislation due to the weighted threshold approaches taken by some MSs. In these instances compliance and administrative costs would be lower.
4.3.5 Benefits
Using the emission reductions presented in Section 4.3.3, we can monetise the annual benefits associated with these reductions by application of the damage cost functions developed under the CAFE programme. Other benefits that may be realised such as reduced odour, for example, are described in Section 3.3.6.

75
© AMEC Environment & Infrastructure UK Limited September 2012 Doc Reg No. 30310rr001i5
Table 4.11 Benefits summary
NH3 emission reduction per installation (t/year)
Number of installations affected
NH3 damage cost function (€/t)
Annual benefit (€million per year)
Low High Low High Low High Low High
2 11 592 1,776 11,000 50,000 13 606
4.3.6 Practicability of applying rules to calculate thresholds for mixed farms
As the thresholds for pigs and poultry are already set out in Annex I of the IED, the approach for calculating whether or not an installation would be included with the application of the mixed activities criterion could be as follows:
1)( >==∑ n
n
hresholdLivestockTlacesLivestockP
Note, this approach was proposed during the negotiations on the IED itself. Alternative approaches could be based around LSUs or ENEF as described in Section 3.3.1. It is important to note that some MSs already apply a mixed activities approach using one or more of the methods described above for determining whether a farm is captured by the national regulation (e.g. Denmark and Germany – see Table 4.6).
Some comments on the possible approaches and associated issues for dealing with mixed activities are given below.
Considerations common to all approaches
• All approaches suffer from the problem that they rely, to some extent, on a ‘snapshot’ of a constantly changing situation.
• Some installations may already be covered under the IED by virtue of some type(s) of associated processing facilities through a Directly Associated Activity (DAA) such as; feed mills, liquid feed makers, meat processing and anaerobic digesters. Alternatively, they may be captured through national implementation of the IED and/or associated national legislation where a weighted threshold approach is already taken. Consequently, there should be no difficulty for such installations complying with the legislation.
• As noted in earlier reports, not all the EU27 farms that might be affected by the inclusion of the “mixed activities” criterion will have access to capital necessary to ensure compliance. They will also need to consider, if funds are available, whether the margin on the investment warrants the additional investment. This is of particular concern for larger capital investments such as building work. The decision will also need to take into consideration any administration costs of MRV and permitting. Therefore, some installations may be forced to reduce capacity or throughput as they cannot afford the

76
© AMEC Environment & Infrastructure UK Limited September 2012 Doc Reg No. 30310rr001i5
costs of compliance and administrative under IED or to abandon this type of livestock production altogether.
• Operators of holdings with mixed activities may decide to split up their operations into subsidiaries to avoid being captured under IED. It is unclear to what extent this is possible.
Considerations with the ‘Places’ approach
• Existing thresholds used in IPPC and now IED use number of places, and switching to a different system entirely or introducing thresholds based on a different system may create difficulties by inviting comparisons to be made between different systems.
• The ratio of different species may change during the course of the year, and the same ‘livestock places’ may be used by different types of animals at different times of the year.
• ‘Place’ is more of an absolute measure (especially where it can be linked to Directives/Regulations that fix minimum space requirements for relevant species) and so easier to identify which installations would come under IED.
• May capture small scale operators by default – Some farms may have more places than are actually used (and associated equipment, storage and space) (resulting in lower than average numbers of animals below the threshold).
• Disease control measures can mean that many individual units are operated below nominal capacity (as measured by number of places). For example, pigs may be located on multi-site operations or host farms, to minimise the risks of diseases affecting the rest of the farmer’s stock. Also, batches of pigs may be taken for health checks prior to slaughter. The results of these processes mean that their actual occupancy is often far lower than their capacity.
• Similarly, producers with high seasonal peaks (e.g. producers of turkeys for the Christmas trade) may be disproportionately affected. As the Directive thresholds currently relate to places (i.e. reflecting production capacity) it is not concerned with whether the installation is occupied all year round (or exceeds the threshold all year round).
Considerations with the LU approach
• Animals grow older and so take on a higher LU value over time, so any assessment based on LUs is simply a snapshot in time.
• LU values are not ‘absolute’ (there can be significant differences between the size of animals intended for different markets – e.g. light and heavy turkeys).
Considerations with the nitrogen excretion factor approach
• Animals grow older and so excrete more nitrogen over time, so any assessment based on ENEFs is simply a snapshot in time.

77
© AMEC Environment & Infrastructure UK Limited September 2012 Doc Reg No. 30310rr001i5
• There is some evidence to suggest that ENEFs may vary under different circumstances (e.g. different feeding and management systems, even for different geographical areas). This is evident from the range of factors identified during the literature review and consultation with MSs (see Table 3.18).
4.3.7 Summary
The table below provides an overview of the potential costs and benefits that have been estimated for the inclusion of additional mixed activity installations based on the assumption that 10-30% of the farms just below the existing IED thresholds could be affected.
Table 4.12 Summary of costs and benefits
Units Low High
Number of installations affected Farms 592 1,776
Total NH3 emission reductions Kilotonnes 1 20
Annual benefit €million per year 13 606
Annual cost (compliance and administrative) €million per year 8 55
78
© AMEC Environment & Infrastructure UK Limited September 2012 Doc Reg No. 30310rr001i5
5. Conclusions
5.1 Differentiated poultry thresholds The following conclusions can be made in relation to the potential for including differentiated thresholds for different poultry species under the IED based on the review of information and analysis undertaken for this report:
• A number of MSs already regulate different poultry installations through the application of a weighted approach to derive thresholds. There appear to be three main approaches for doing this based on Livestock Units (LU or LSUs), Equivalent Nitrogen Excretion Factors (ENEF) and animal-equivalent (weighted approach based on nitrogen and phosphorus excretion factors as well as other variables).
• Data gathered during this study has revealed significant variation in assumptions for both ENEFs and LSUs between sources for each species e.g. ENEFs for boilers vary from 0.24 to 0.61 kg of nitrogen per place per year. This may be reflective of differences in housing and/or feeding strategies as well as inter- and intra-species differences e.g. some MSs provided details for multiple types of a single species such as ducks. However, whilst there are differences between the figures from different sources (where comparable), it is clear that some species (e.g. turkeys) are potentially more polluting than others when comparing values from a single source. This is to be expected considering the size differences between species as well as variations in feeding and housing strategies. This data has been used to derive indicative thresholds for different poultry species (Table 3.19).
• Relatively limited information has been provided by the MSs consulted during this study on the numbers of farms rearing other (non-chicken) poultry species and the number that could be affected by the application of differentiated thresholds. Based on the limited information provided by three MSs (Italy, Poland and UK) scaled using Eurostat data for the EU27 and modelling by Alterra and IIASA as part of the IPPC Directive review, the estimated number of poultry installations that could be affected is around 900-3,200 installations based on the differentiated thresholds included in the original IED proposal. The upper estimate is based on a small number of MS responses and therefore should only be taken as a rough estimate of the maximum number of farms that could be affected as farm sizes and species mixes may vary considerably between MSs. This is discussed in greater detail in Section 3.3.2.
• Indicative unit (i.e. per farm) NH3 emission reductions, costs and benefits have been derived based on existing literature sources and applied to the estimate of the total number of farms – laying hen, turkey and duck farms only – that could be affected based on the thresholds included in the original IED proposals. This results in an estimate of NH3 emission reductions of around 4-35 kilotonnes per year which have been monetised using CAFE damage cost functions to give indicative benefits of around €40-1,100 million per year. Total annual compliance and administrative costs have been estimated to be in the order of €10-60 million per year although the administrative costs could be much lower if a non-permitting regime (e.g. general binding rules) is applied. The way in which these values have been derived, as well as the associated uncertainties and limitations, is described in Section 3.3.

79
© AMEC Environment & Infrastructure UK Limited September 2012 Doc Reg No. 30310rr001i5
• In addition to reductions in NH3 emissions, there may also be benefits in terms of reduced odour and dust emissions e.g. as a result of improvements in livestock housing. Emissions of other pollutants such as N2O and methane are not expected to change significantly.
• It is important to note that some farms may already be captured by the IED and/or equivalent national legislation due to the weighted threshold approaches taken by some MSs. In these instances emission reductions, compliance and administrative costs and benefits could be lower.
5.2 Mixed activities The following conclusions can be made in relation to the potential for including mixed activities under the IED based on the review of information and analysis undertaken for this report:
• As for poultry, a number of MSs already regulate livestock installations through the application of a weighted approach to derive thresholds. There appear to be three main approaches for doing this based on LU, ENEF and animal-equivalent (weighted approach based on overall pollution potential).
• In both the previous study and the consultation undertaken for this study, it was discovered that Member States do not necessarily have the information available to them to determine the number of farms potentially affected within their territory by the mixed activities rule. Therefore the analysis undertaken for this report is based primarily on data from Eurostat on the number of farms currently just below the individual species thresholds from the IED in order to estimate the number of farms potentially affected. Depending on the % of farms just below the existing thresholds that are assumed to be affected, the number of farms that could be affected ranges from around 600 (10%) to 5,900 (100%). A best estimate of the number affected is 10-30% i.e. around 600 – 1,800. The ways in which these figures have been estimated are described in more detail in Section 4.3.2.
• As for poultry, indicative unit (i.e. per farm) emission reductions, costs and benefits have been derived based on existing literature sources and applied to the best estimate of the total number of farms that could be affected. This results in an estimate of NH3 emission reductions of around 1-20 kilotonnes per year which have been monetised using CAFE damage cost functions to give indicative benefits of around €15-600 million per year. Total annual compliance and administrative costs have been estimated to be in the order of €10-60 million per year although the administrative costs could be much lower if a non-permitting regime (e.g. general binding rules) is applied. These estimates are highly uncertain due to a lack of data on the number of farms that could be affected as well as the changes that they would be required to make. The way in which these values have been derived, as well as the associated uncertainties and limitations, is described in Section 4.3.
• In addition to reductions in NH3 emissions, there may also be benefits in terms of reduced odour and dust emissions e.g. as a result of improvements in livestock housing. Emissions of other pollutants such as N2O and methane are not expected to change significantly.
• It is important to note that some farms may already be captured by the IED and/or equivalent national legislation due to the weighted threshold approaches taken by some MSs. In these instances emission reductions, compliance and administrative costs and benefits could be lower.

80
© AMEC Environment & Infrastructure UK Limited September 2012 Doc Reg No. 30310rr001i5
• There are a number of potential practical issues with applying a mixed activities rule depending upon the way in which it is applied. The simplest approach appears to be that based on the existing thresholds in the Directive. This is discussed in greater detail in Section 4.3.6.

A1
© AMEC Environment & Infrastructure UK Limited September 2012 Doc Reg No. 30310rr001i5
Appendix A Data Proforma

Proforma AMEC Environment & Infrastructure UK Limited 17 Angel Gate, City Road, London EC1V 2SH, United Kingdom Tel +44 (0) 207 843 1400 Fax +44 (0) 207 843 1410
r:\projects\30310 ppaq ec ied reviews\c client\reports\final report\task 3 - poultry & mixed\30310 agricultural proforma 031011 (poultry & mixed).doc
Members of IEEG To
Member State IPPC responsible experts for intensive agriculture Subject Project for the European Commission DG Environment, Ref: Ares (2011) 918813.
Collection and analysis of data to inform certain reviews required under Directive 2010/75/EU on industrial emissions (IED)
Topics 1) Reporting in line with Article 73(3)(a) and (b) on the establishment in
Annex I of differentiated capacity thresholds for the rearing of different poultry specifies; and, capacity thresholds for the simultaneous rearing of different types of animals within the same installation
Response Deadline
30 November 2011
Differentiated Poultry Thresholds
Background Article 73(3)(a) of the IED places an obligation on the European Commission to report “on the establishment in Annex 1 of…differentiated capacity thresholds for the rearing of different poultry species, including the specific case of quail” .
As part of its review of the existing IPPC Directive the Commission collected information on the potential establishment of differentiated capacity thresholds for different poultry species. Annex I of the original IED proposal included disaggregated thresholds for poultry broken down as follows:
• 40,000 places for broilers
• 30,000 places for laying hens
• 24,000 places for ducks
• 11,500 places for turkeys
In addition, the original IED proposal included a provision for other poultry species1 in that a threshold should be calculated on the basis of equivalent nitrogen excretion factors compared to the thresholds specified for chickens, ducks and turkeys. These changes were subsequently removed by the European Parliament and Council during the co-decision process.
Existing data gathered previously will be used for this review, but more up-to-date information is welcome.
1 This included geese, quail, ostrich, guinea fowl, partridges and pigeons.

Page 2
r:\projects\30310 ppaq ec ied reviews\c client\reports\final report\task 3 - poultry & mixed\30310 agricultural proforma 031011 (poultry & mixed).doc
Questions 1. What information does your Member State hold on number of poultry farms linked
with the number of places? How many of these installations are already covered by the IED? Please can you provide any information you have in the most disaggregated form you have available (i.e. farm-by-farm if available). Note the table below which summarises any information we already hold.
Details of information already held
2. What information does your Member State hold on nitrogen excretion factors for different poultry species?
3. What information (in particular, quantitative data) does your Member State hold on the environmental impacts of different sized poultry installations on:
a. Water
b. Air
c. Climate change
d. Biodiversity
4. What are the current requirements placed upon poultry farms in your Member State’s national environment legislation that may impact on emissions to air, water, climate change or biodiversity as well as planning controls for new units?
Please provide information regarding the permit regime and monitoring requirements that are applicable to these farms. Note the table below which summarises any information we already hold.
Details of information already held
5. Are there any voluntary systems (e.g. code of practices) in place affecting this sector?
6. Do you have any other comments on the review?
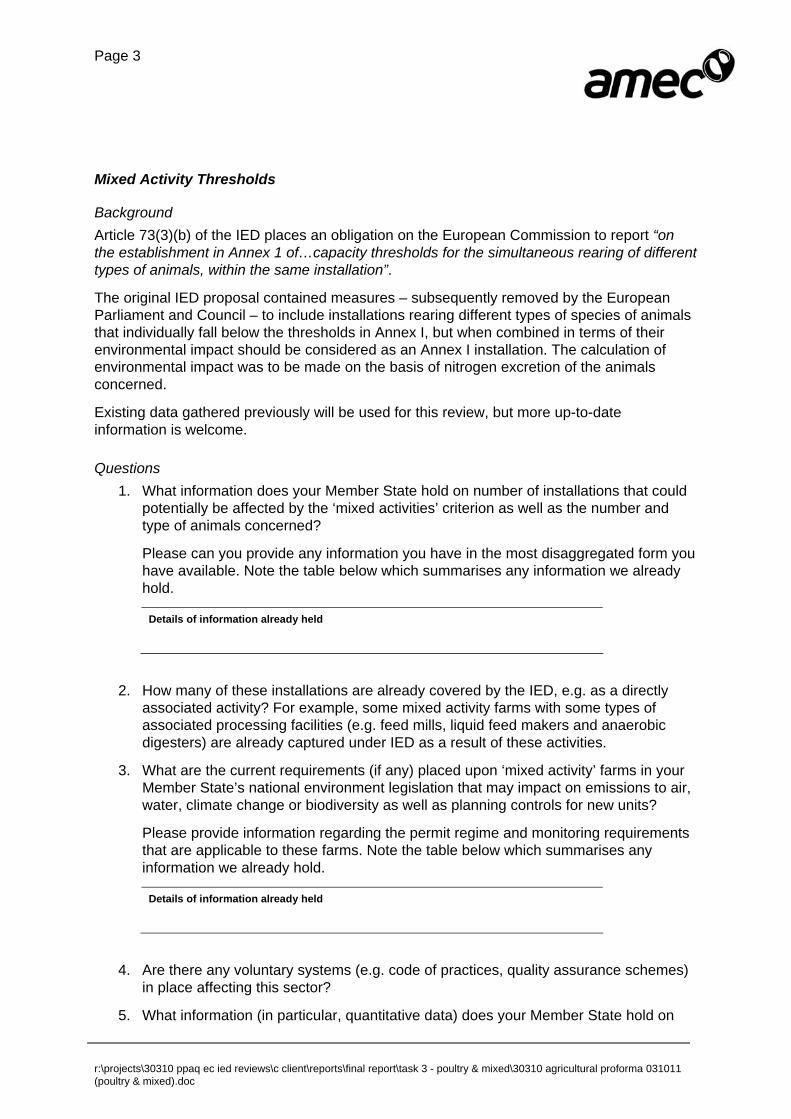
Page 3
r:\projects\30310 ppaq ec ied reviews\c client\reports\final report\task 3 - poultry & mixed\30310 agricultural proforma 031011 (poultry & mixed).doc
Mixed Activity Thresholds
Background Article 73(3)(b) of the IED places an obligation on the European Commission to report “on the establishment in Annex 1 of…capacity thresholds for the simultaneous rearing of different types of animals, within the same installation”.
The original IED proposal contained measures – subsequently removed by the European Parliament and Council – to include installations rearing different types of species of animals that individually fall below the thresholds in Annex I, but when combined in terms of their environmental impact should be considered as an Annex I installation. The calculation of environmental impact was to be made on the basis of nitrogen excretion of the animals concerned.
Existing data gathered previously will be used for this review, but more up-to-date information is welcome.
Questions 1. What information does your Member State hold on number of installations that could
potentially be affected by the ‘mixed activities’ criterion as well as the number and type of animals concerned?
Please can you provide any information you have in the most disaggregated form you have available. Note the table below which summarises any information we already hold.
Details of information already held
2. How many of these installations are already covered by the IED, e.g. as a directly associated activity? For example, some mixed activity farms with some types of associated processing facilities (e.g. feed mills, liquid feed makers and anaerobic digesters) are already captured under IED as a result of these activities.
3. What are the current requirements (if any) placed upon ‘mixed activity’ farms in your Member State’s national environment legislation that may impact on emissions to air, water, climate change or biodiversity as well as planning controls for new units?
Please provide information regarding the permit regime and monitoring requirements that are applicable to these farms. Note the table below which summarises any information we already hold.
Details of information already held
4. Are there any voluntary systems (e.g. code of practices, quality assurance schemes) in place affecting this sector?
5. What information (in particular, quantitative data) does your Member State hold on

Page 4
r:\projects\30310 ppaq ec ied reviews\c client\reports\final report\task 3 - poultry & mixed\30310 agricultural proforma 031011 (poultry & mixed).doc
the environmental impacts of these ‘mixed activity’ installations, including impacts on:
a. Water
b. Air
c. Climate change
d. Biodiversity
6. Do you have any views on the approach included in the original IED proposal for assessing ‘mixed activities’?
7. What practical issues are there of applying a ‘mixed activities’ approach?
8. Do you have any other comments on the review?
Page 5
r:\projects\30310 ppaq ec ied reviews\c client\reports\final report\task 3 - poultry & mixed\30310 agricultural proforma 031011 (poultry & mixed).doc
Responses If you would like to discuss any of the questions in this proforma please contact the person named below.
Ben Grebot AMEC Environment & Infrastructure UK Limited 17 Angel Gate, City Road, London EC1V 2SH, UK Direct +44 (0)20 7843 1414 [email protected]
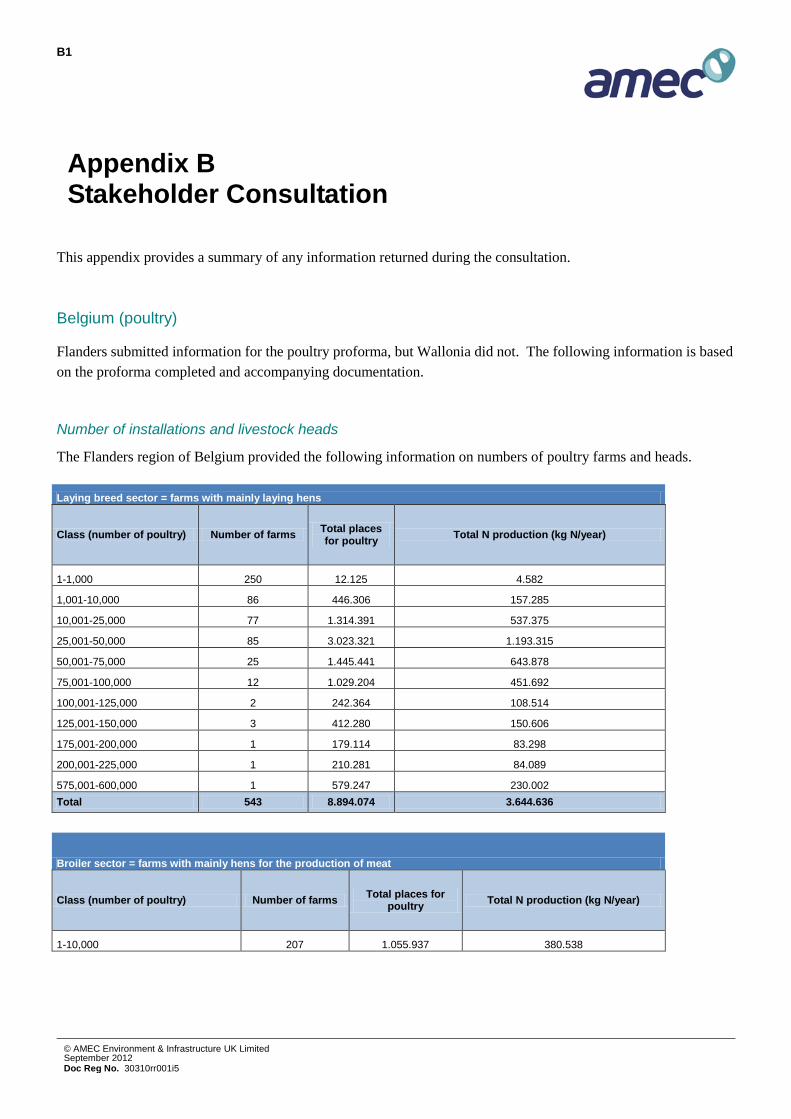
B1
© AMEC Environment & Infrastructure UK Limited September 2012 Doc Reg No. 30310rr001i5
Appendix B Stakeholder Consultation
This appendix provides a summary of any information returned during the consultation.
Belgium (poultry)
Flanders submitted information for the poultry proforma, but Wallonia did not. The following information is based on the proforma completed and accompanying documentation.
Number of installations and livestock heads
The Flanders region of Belgium provided the following information on numbers of poultry farms and heads.
Laying breed sector = farms with mainly laying hens
Class (number of poultry) Number of farms Total places for poultry Total N production (kg N/year)
1-1,000 250 12.125 4.582
1,001-10,000 86 446.306 157.285
10,001-25,000 77 1.314.391 537.375
25,001-50,000 85 3.023.321 1.193.315
50,001-75,000 25 1.445.441 643.878
75,001-100,000 12 1.029.204 451.692
100,001-125,000 2 242.364 108.514
125,001-150,000 3 412.280 150.606
175,001-200,000 1 179.114 83.298
200,001-225,000 1 210.281 84.089
575,001-600,000 1 579.247 230.002 Total 543 8.894.074 3.644.636
Broiler sector = farms with mainly hens for the production of meat
Class (number of poultry) Number of farms Total places for poultry Total N production (kg N/year)
1-10,000 207 1.055.937 380.538

B2
© AMEC Environment & Infrastructure UK Limited September 2012 Doc Reg No. 30310rr001i5
10,001-20,000 228 3.332.222 1.372.152
20,001-30,000 124 3.119.751 1.253.229
30,001-40,000 87 2.947.017 1.141.209
40,001-50,000 57 2.524.515 992.717
50,001-60,000 28 1.505.825 566.071
60,001-70,000 12 785.324 315.739
70,001-80,000 17 1.263.598 494.570
80,001-90,000 3 253.918 109.743
90,001-100,000 1 93.283 47.410
100,001-110,000 3 309.640 110.147
110,001-120,000 1 116.320 47.808
120,001-130,000 1 121.915 45.619
130,001-140,000 1 134.200 55.156
190,001-200,000 1 193.920 79.701
300,001-310,000 1 300.813 107.341 Total 772 18.058.198 7.119.151
Turkeys = farms with mainly turkeys
Class (number of poultry) Number of farms Total places for poultry Total N production (kg N/year)
<1,000 16 1.610 4.961
1,001-5,000 6 20.993 26.165
5,001-10,000 7 55.776 50.310
10,001-15,000 5 62.399 56.284
15,001-20,000 2 38.461 43.758 Grand total 36 179.239 181.477
Laying breed sector = farms with mainly laying hens
Number of farms Total places for poultry Total N production (kg N/year)
Not-IED farms (< 40,000) 476 3.803.341 1.531.890
IED-farms (>40,000) 67 5.090.733 2.112.746
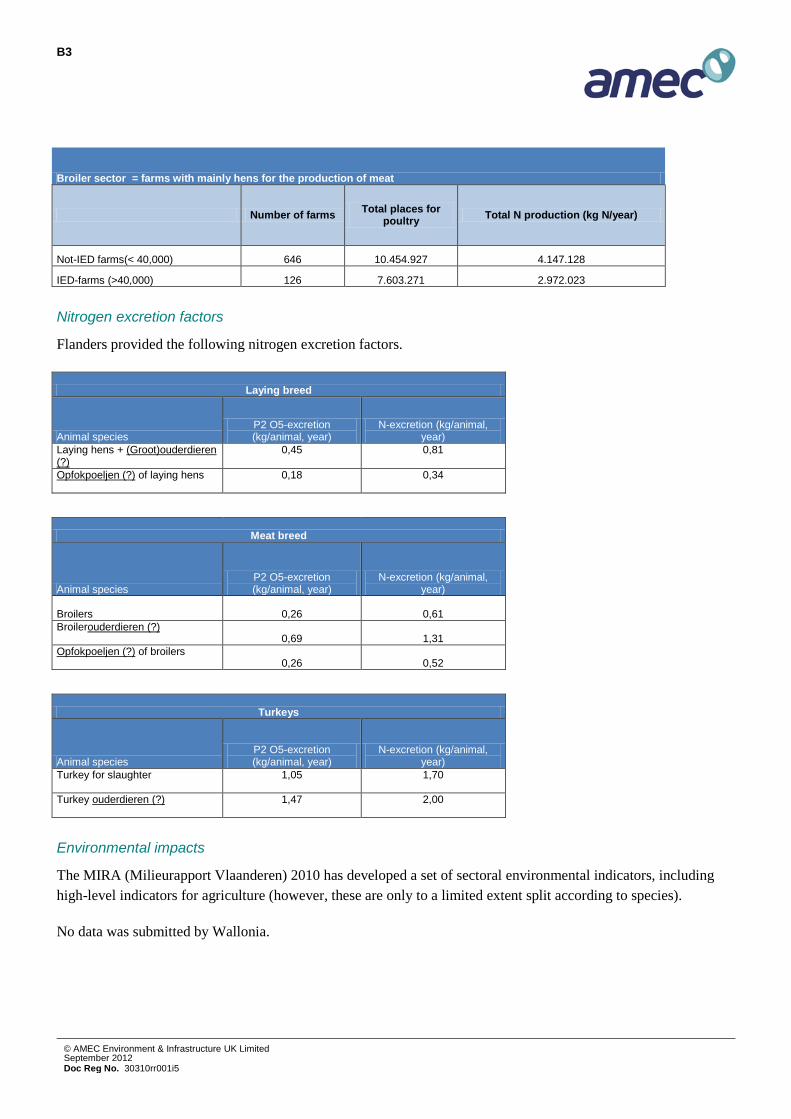
B3
© AMEC Environment & Infrastructure UK Limited September 2012 Doc Reg No. 30310rr001i5
Broiler sector = farms with mainly hens for the production of meat
Number of farms Total places for poultry Total N production (kg N/year)
Not-IED farms(< 40,000) 646 10.454.927 4.147.128
IED-farms (>40,000) 126 7.603.271 2.972.023
Nitrogen excretion factors
Flanders provided the following nitrogen excretion factors.
Laying breed
Animal species P2 O5-excretion (kg/animal, year)
N-excretion (kg/animal, year)
Laying hens + (Groot)ouderdieren (?)
0,45 0,81
Opfokpoeljen (?) of laying hens 0,18 0,34
Meat breed
Animal species P2 O5-excretion (kg/animal, year)
N-excretion (kg/animal, year)
Broilers 0,26 0,61 Broilerouderdieren (?)
0,69 1,31 Opfokpoeljen (?) of broilers
0,26 0,52
Turkeys
Animal species P2 O5-excretion (kg/animal, year)
N-excretion (kg/animal, year)
Turkey for slaughter 1,05 1,70
Turkey ouderdieren (?) 1,47 2,00
Environmental impacts
The MIRA (Milieurapport Vlaanderen) 2010 has developed a set of sectoral environmental indicators, including high-level indicators for agriculture (however, these are only to a limited extent split according to species).
No data was submitted by Wallonia.

B4
© AMEC Environment & Infrastructure UK Limited September 2012 Doc Reg No. 30310rr001i5
National legislation
Flanders presented a summary of relevant legislation, primarily the Title II of VLAREM (Flemish legislation) which covers almost all livestock farms, and contains requirements to limit impacts on air emissions, water emissions, warming effects and biodiversity. There are measures for both existing and new installations. Relevant to livestock are parts 4 and chapter 5.9 of VLAREM II (General environmental conditions and conditions concerning animals) along with the list of stables with low ammonia emissions (Ministerial Decree of 19 of March 2004 concerning the determination of the list of the low ammonia emission stable systems).
In Flanders the threshold for compulsory permitting is very low (in one region a rural area, for instance, permits are required for holdings with 1,000 birds) and, therefore, there are no voluntary systems in place affecting the sector. As the permitting obligation in Flanders is applicable for nearly all installations, all these installations are covered by the environmental regulation. This regulation is imposed in the form of general, sectoral and specific environmental conditions, the latter depending on the installation specific or local circumstances. The regulation and the contained conditions therein are essentially built around the main purpose to constrain the emissions to the different environmental aspects (e.g. air, water, soil, noise, nuisance and risk etc.)
No information was submitted by Wallonia.
Measures and techniques for reducing emissions from poultry farms
In Flanders the Vlaamse Instelling voor Wetenschappelijk Onderzoek (VITO) conducted a BAT-study (BAT for the livestock sector – 2006), containing information regarding the different options for the applicability of BAT.
Flanders submitted information on the ammonia reduction plan it has developed in response to the European regulations concerning ammonia emission ceilings. This is based on four pillars:
1. The obligation to use animal manure emissions on land
2. Adjustment in the composition of the animal feed
3. Adjustment of the stable level
4. Manure processing.
The pillars 1, 2 and 4 were brought in practice and regulated in the framework of the Manure Decree. Pillar 3 is regulated by a VLAREM obligation, where new stables must be built according to one of the techniques described in the list of stables with low ammonia emissions set out in the Ministerial Decree of March 2004.
No data was submitted by Wallonia.

B5
© AMEC Environment & Infrastructure UK Limited September 2012 Doc Reg No. 30310rr001i5
Denmark (mixed activities)
Approach
Denmark applies a Livestock Unit approach for determining whether an installation is covered by the legislation or not. In 2007 a new Environmental Approval Act for Livestock Holdings was put into force; this includes an approval system that applies to all livestock holdings for more than 3 LU/15 LU.
The conversion figures for each species have been revised a number of times and are available at: https://www.retsinformation.dk/Forms/R0710.aspx?id=142174
Emissions
Denmark has also provided its latest emission projections report which includes historic emissions; this is provided in the table below for agriculture.
Table B.1 Historic emissions and projections for agriculture
Source: AARHUS UNIVERSITY – DANISH CENTRE FOR ENVIRONMENT AND ENERGY (2012): PROJECTION OF SO2, NOX, NH3 AND PARTICLE EMISSIONS 2010-2030.

B6
© AMEC Environment & Infrastructure UK Limited September 2012 Doc Reg No. 30310rr001i5
France (poultry and mixed activities)
Number of installations and livestock heads
France supplied the following data on the number of poultry farms covered by the IED split according to the poultry species reared in the farm.
Table B.2 Poultry species reared in IED poultry farms
Poultry species Number of IED poultry farms (66a) rearing at least one poultry species
% of IED farms Number of animals % of animals
Broilers 1 730 49.9% 109 301 182 57.6%
Turkeys 941 27.1% 19 666 592 10.4%
Laying hens 358 10.3% 33 991 380 17.9%
Guinea fowls 227 6.5% 8 283 234 4.4%
Ducks 163 4.7% 3 574 163 1.9%
Partridge 14 0.4% 4 249 500 2.2%
Quails 13 0.4% 1 629 000 0.9%
Pheasant 13 0.4% 9 075 400 4.8%
Geese 4 0.1% 16 470 0.0%
Pigeons 3 0.1% 8 310 0.0%
Ducks for fattening 2 0.1% 38 600 0.0%
Total 3 468 100% 189 833 831 100%
Source: SIGAL, 2011
French IED quail farms are mostly not included in the table as they were, until the recent decision of the European Court of Justice, considered by the French regulation under the IPPC threshold converted into animal equivalents. France has offered to submit further information on quails if this is of interest.
Half of the IED poultry farms rear broilers with an average of 63 000 places of broilers. A few installations rear small poultry species as quails, pigeons or pheasants. In France, most of the poultry farms rear several different species of poultry. Around 40% of the IED installations rear more than one poultry species.

B7
© AMEC Environment & Infrastructure UK Limited September 2012 Doc Reg No. 30310rr001i5
Nitrogen excretion factors
France provided the following nitrogen excretion factors.
Table 5.3 Nitrogen excretion factors according to poultry species
Standard chickens
Laying hens
Quails Turkeys (medium-
sized)
Guinea fowl
Pekin ducks (male)
Muscovy ducks
Geese
Nitrogen excreted by animal (g/animal)
51 713 25 381 87 175 179 336
Source: “Estimation des rejets d’azote, de PHOSPHORE, POTASSIUM, CALCIUM, CUIVRE, ZINC par les élevages agricoles” CORPEN 2006
Environmental impacts
France has not provided data on annual atmospheric emissions of pollutants from poultry farms (PM, N2O, methane and ammonia) as this is currently being developed and is not yet available.
A study is being conducted by the Institut National de la Recherche Agronomique (INRA) on the subject of integrated management of the nitrogen cycle in livestock breeding farms and impacts on air and water. This is looking to synthesize all the current scientific literature on the subject (results currently pending).
National legislation
France submitted information on their legislation based on a system of animal-equivalents, rather than number of places. In this system of equivalences, a hen, a chicken, guinea fowls or pheasant is equivalent to 1 animal-equivalent (AE), a duck is equivalent to 2 AE, a turkey or a goose is equivalent to 3 AE, forced feeding duck is equivalent to 5 AE but a pigeon or a partridge is equivalent to ¼ AE and a quail is equivalent to 1/8 AE. These values are currently being reviewed. The likely revised values are provided in the table below.
Table 5.4 Animal-equivalents according to poultry species
Species Animal-equivalent
Quail 0.125

B8
© AMEC Environment & Infrastructure UK Limited September 2012 Doc Reg No. 30310rr001i5
Species Animal-equivalent
Pigeon, partridge 0.25
Cockerel 0.75
Light-weight chicken 0.85
Hen, standard chicken, chicken under agricultural seal, chicken under organic farming, pullet, laying hen, breeder hen, pheasant, guinea fowl, mallard
1
Heavy-weight chicken 1.15
Duck to be roasted, duck for fattening, breeder duck 2
Light-weight turkey 2.2
Standard turkey, breeder turkey, goose 3
Heavy-weight turkey 3.5
Web-footed birds being force-fed 7
France considers that its system of equivalences between different species is both an appropriate solution for regulating the environmental impact of poultry farms, and a flexible administrative tool enabling the farmer to adapt their system of production without having to put together another full authorization file (as long as the thresholds are not exceeded and the modifications not judged to be substantial by the administrative authority). This flexibility is deemed helpful as the equipment (including housing) needed to rear different poultry species is similar, so that a farmer can switch between species without having to make major modifications. This is particularly the case for quails for which the production is highly seasonal (mostly in Christmas time) and occurs in farms rearing other poultry species the rest of the year.
On this basis, France has recommended using the system of animal- equivalents to integrate different poultry species into the IED.
Additional information
France has also submitted as evidence recent correspondence between Mr Laurent Michel, from the Directorate General of Risk Prevention at the Ministry for Ecology, Sustainable development, Transport and Housing and DG Environment at the Commission.
In a letter dated 20 September 2011, Mr Michel wrote to Mr Janez Potočnik, Commissioner for the Environment, regarding the scheduled review of the specific case of quail under Article 73 before the end of 2011. In 2009, the French authorities had proposed an amendment to the IPPC directive to exclude quail on the basis that its weight is eight times less than that of a chicken. The current provision for quail under Article 73 is a compromise agreement.

B9
© AMEC Environment & Infrastructure UK Limited September 2012 Doc Reg No. 30310rr001i5
Mr Michel asks for information regarding the review, and supplies in an annex a case for using the animal-equivalent approach developed by France, supported by the following table of data. The coefficients were developed on a basis of both nitrogen and phosphate emissions by a committee under the guidance of the Ministeries for Agriculture and Ecology, as technical support for legislation. Mr Michel also adds that a survey was undertaken of equivalent Member State legislation which found that the Netherlands, Denmark, Poland and Sweden have a similar system in place.
He highlights that quails excrete 2-28 times less nitrogen and 2-23 times less phosphates by animal head than other poultry.
Table B.5 Thresholds and pollutant levels of different poultry (based on CORPEN standards)
Standard chickens
Laying hens
Quails Turkeys (medium-
sized)
Guinea fowl
Pekin ducks (male)
Muscovy ducks
Geese
Nitrogen excreted by animal (g/animal) 51 713 25 381 87 175 179 336
Phosphate excreted by animal (g/animal) 25 307 13 238 52 92 107 174
Number of cycles per year 6.15 1 5.9 2.6 3.63 4.9 3.4 2
Nitrogen excreted by place by year (g/place/yr) 313.65 713 147.5 990.6 315.81 857.5 608.6 672
Phosphate excreted by place by year (g/place/yr) 153.75 307 76.7 618.8 188.76 450.8 363.8 348
Spreadable nitrogen by animal (g/animal) 30 349 15 227 52 70 72 171
Spreadable phosphate by animal (g/animal) 25 307 13 238 52 92 107 174
Spreadable nitrogen by place by year 184.5 349 88.5 590.2 188.76 343 244.8 342
Spreadable phosphate by place by year 153.75 307 76.7 618.8 188.76 450.8 363.8 348
Equivalent for 40,000 laying hens 40,000 40,000 320,000 13,333 40,000 20,000 20,000 13,333
Pollution coefficient 0.5 1 0.25 2 0.5 1.5 1 1
The French authorities have indicated that the pollution coefficients above are based on nitrogen and phosphorus emissions whereas the animal equivalents are based on overall emissions to air, water and soil as well as other impacts such as noise and odour.
French poultry farms are covered by the Nitrates directive and Water Framework Directive. Under the planning system, poultry farms are subject to authorisation, requiring a full impact study and public consultation if they have

B10
© AMEC Environment & Infrastructure UK Limited September 2012 Doc Reg No. 30310rr001i5
more than 30 000 ‘equivalent-animals’ of poultry. Holdings with 5,000-30,000 equivalent animals are subject to a declaration process.
The following table summarises the current permitting process.
Table 5.6 Current permitting and planning regime according to size of holding
Holding size Permitting regime Frequency of review Statutory authority
> 40 000 animals Authorized IED Minimum every 3 years State inspectors
> 30 000 equivalent animal Authorized Minimum every 7 years State inspectors
20 001 - 30 000 equivalent animal
Declared under periodic review Minimum every 5 years Certification body
5 000 – 20 000 equivalent animal
Declared If required State inspectors
Mixed activities
France provided the following table of data on the number of farms just under the IED threshold currently covered by the IED as a result of an associated activity.
Table 5.7 Holdings below IED threshold covered by the IED due to associated activities
Livestock description IED poultry farms 66a (2592 farms)
% of 66a farms IED pig farms 66b (534 farms)
% of 66b farms
Poultry > 30 000 equivalent animal 2592 100% 2 0.4%
20 001 - 30 000 equivalent animal
24 0.9% 4 0.7%
5 000 – 20 000 equivalent animal
28 1.1% 4 0.7%
Pig/sow > 450 equivalent animal 59 2.3% 534 100%
50-450 equivalent animal 31 1.2% 6 1.1%
IED 64a - - - -
64b - - - -
64c - - - -
65 - - - -
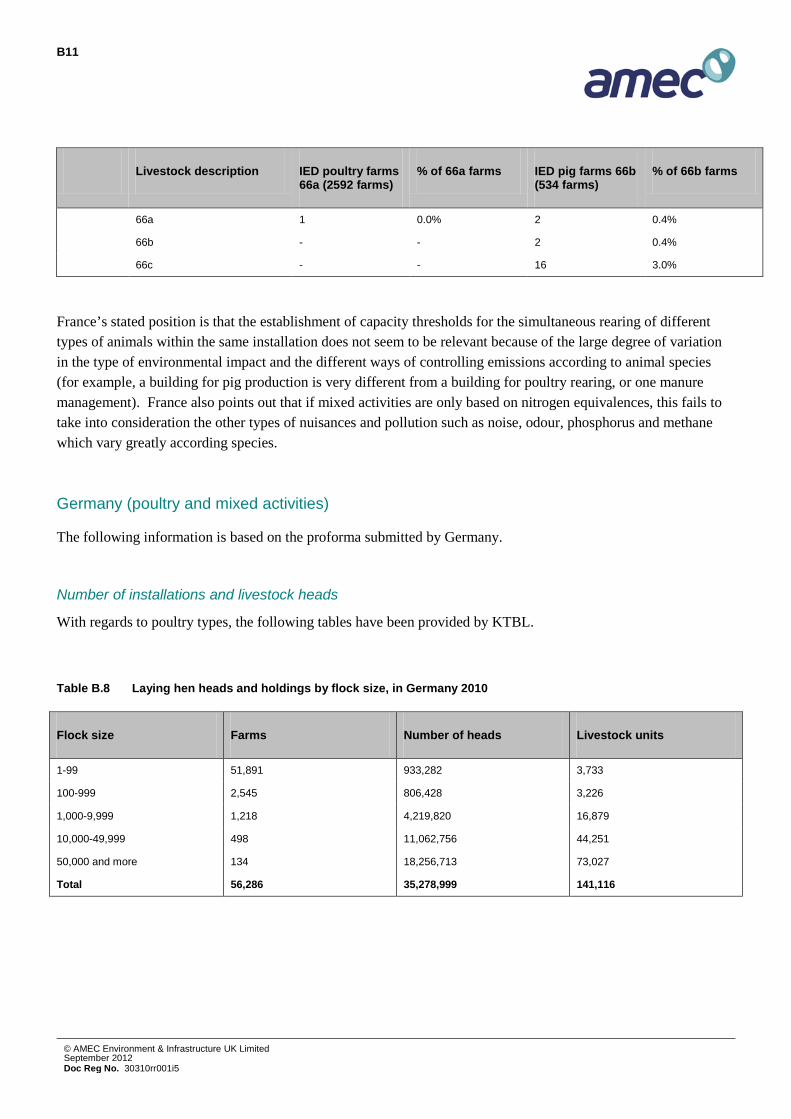
B11
© AMEC Environment & Infrastructure UK Limited September 2012 Doc Reg No. 30310rr001i5
Livestock description IED poultry farms 66a (2592 farms)
% of 66a farms IED pig farms 66b (534 farms)
% of 66b farms
66a 1 0.0% 2 0.4%
66b - - 2 0.4%
66c - - 16 3.0%
France’s stated position is that the establishment of capacity thresholds for the simultaneous rearing of different types of animals within the same installation does not seem to be relevant because of the large degree of variation in the type of environmental impact and the different ways of controlling emissions according to animal species (for example, a building for pig production is very different from a building for poultry rearing, or one manure management). France also points out that if mixed activities are only based on nitrogen equivalences, this fails to take into consideration the other types of nuisances and pollution such as noise, odour, phosphorus and methane which vary greatly according species.
Germany (poultry and mixed activities)
The following information is based on the proforma submitted by Germany.
Number of installations and livestock heads
With regards to poultry types, the following tables have been provided by KTBL.
Table B.8 Laying hen heads and holdings by flock size, in Germany 2010
Flock size Farms Number of heads Livestock units
1-99 51,891 933,282 3,733
100-999 2,545 806,428 3,226
1,000-9,999 1,218 4,219,820 16,879
10,000-49,999 498 11,062,756 44,251
50,000 and more 134 18,256,713 73,027
Total 56,286 35,278,999 141,116

B12
© AMEC Environment & Infrastructure UK Limited September 2012 Doc Reg No. 30310rr001i5

B13
© AMEC Environment & Infrastructure UK Limited September 2012 Doc Reg No. 30310rr001i5
Table B.9 Broiler heads and holdings by flock size, in Germany 2010
Flock size Farms Number of heads Livestock units
1-99 3,134 32,326 129
100-999 306 83,594 334
1,000-9,999 93 366,603 1,466
10,000-49,999 615 18,697,474 74,790
50,000 and more 384 48,351,081 193,404
Total 4,532 67,531,078 270,124
Table B.10 Turkey heads and holdings by flock size, in Germany 2010
Flock size Farms Number of heads Livestock units
1-99 1,148 13,424 54
100-999 107 31,751 127
1,000-9,999 219 1,276,777 5,107
10,000 and more 451 10,022,010 40,088
Total 1,925 11,343,962 45,376
No figures are available for the “mixed activities” criterion.
Nitrogen excretion factors
The following factors were provided:
• Laying hens 0.836 kg N/year
• Broiler 0.614 kg N/year
• Grower 0.32 kg N/year
• Ducks 0.528 kg N/year

B14
© AMEC Environment & Infrastructure UK Limited September 2012 Doc Reg No. 30310rr001i5
• Turkey 2.06 kg N/year broken down by:
- Male turkey 2.31 kg N/year
- Female turkey 1.73 kg N/year
Wider environmental impacts
Only qualitative information is available as impacts are depend on site-specific conditions (size of installation, level of emissions, distance to vulnerable zones as dwelling areas or sensitive ecosystems, meteorological conditions etc.). Impacts are assessed for each single case in permitting processes either according to the Federal Building Code or in the case of larger installations to the “Federal Emission Control Act” (Bundes-Immissionsschutzgesetz – BImSchG15); thresholds for different animal categories are defined in the Table B.11. BImSchG is the transposition of the European IPPC-Directive into German law. In addition, the licensing procedure of the installations may include an environmental impact assessment according to the “Environmental Impact Assessment Act” (UVPG)16 which is the implementation of the European EIA-Directive.
• Water: No impacts housing floors and manure stores etc. have to be constructed such that they are tight.
• Air: The main environmental concerns with respect to the intensive livestock farming sector (livestock installations in general and poultry farms in particular) are related to the emission of odour and ammonia. There is also increasing concern about negative health effects caused by particulate emission and/or bio-aerosols. But in the latter case, until recently statistical evidence of severe adverse health effects has been scant.
• Odour: In order to protect residents against odour annoyances, minimum distance regulations for the assessment of odour and the spatial separation of farms and dwellings or residential areas have been established. These regulations are laid down in the Technical Instructions on Air Quality Control (TA Luft) and in the guidelines on odour abatement in livestock farming published by the Association of German Engineers (VDI 3471-Emission Control Livestock Management Pigs; VDI 3472-Emission Control Livestock Management Hens). Odour assessment is also based on the so-called “Odour Emission Regulation” (Geruchsimmissionsrichtlinie – GIRL) 17. According to GIRL, in the case of existing sources the frequency of odour perception shall be determined over a period of 6 or 12 months by several random field inspections (usually 26 and 52 spot checks respectively) in the surrounding of a source. If new emitting installations are planned, their contribution to odour emissions must be estimated by dispersion modelling. Existing and additional emissions are added up
15 www.bmu.de/english/air_pollution_control/downloads/doc/45372.php
16 www.bmu.de/english/service_downloads/doc/7007.php
17 www.lanuv.nrw.de/luft/gerueche/bewertung.htm#1

B15
© AMEC Environment & Infrastructure UK Limited September 2012 Doc Reg No. 30310rr001i5
and compared with odour emission standards (frequency of odour perception in % of the yearly hours)
18.
• Ammonia: Another focus is laid on the protection of sensitive plants and ecosystems against harmful effects caused by ammonia and nitrogen deposition in the surroundings of livestock installations. The assessment if negative effects are probable is based either on a minimum distance regulation (TA Luft, annexe I) or, in addition; a special case assessment is performed. This special case assessment consists of an estimation of the ammonia emission of the farm investigated, the calculation of dispersion and deposition of ammonia on a local scale and the final assessment of impacts on the basis of emission limit values derived from critical loads.
National legislation
Since the Alterra (2007) report, Germany has banned cages for layer hens. Kleingrupppenhaltung (the German variation of the European enriched cage system) and, to a greater, extent alternative housing systems (aviaries and deep litter/floor house) are now applied.
Table B.11 shows permitting regimes in place in Germany and the relevant thresholds for different species including different poultry types.
Table B.11 Permitting thresholds under different German laws
Species Installation size (by number of animal places) for which permit is required under different German laws
Federal Building Code (BauGB)
Federal Emission Control Act (BImSchG)
Environmental Impact Assessment Act (UVPG)
Without public participation
With public participation
On the basis of a case-to-case pre-assessment
Obligatory
Laying hens < 15 000 15 000 40 000 15 000 60 000
Pullets < 30 000 30 000 40 000 30 000 85 000
Broiler, ducks < 30 000 30 000 40 000 30 000 85 000
Turkeys < 15 000 15 000 40 000 15 000 60 000
Cattle < 600 600 - 600 -
Calves < 500 500 - 500 -
18 www.odournet.com/legislation.html#4

B16
© AMEC Environment & Infrastructure UK Limited September 2012 Doc Reg No. 30310rr001i5
Species Installation size (by number of animal places) for which permit is required under different German laws
Federal Building Code (BauGB)
Federal Emission Control Act (BImSchG)
Environmental Impact Assessment Act (UVPG)
Fattening pigs (>30 kg liveweight)
< 1 500 1 500 2 000 1 500 3 000
Sows (including piglets < 30 kg)
< 560 560 750 560 900
Piglets (separate rearing 10-< 30 kg)
< 4 500 4 500 6 000 4 500 9 000
Furs < 750 750 1 000 750 -
Laying hens < 15 000 15 000 40 000 15 000 60 000
In the case of mixed livestock, a weighted approach is applied whereby a % of the threshold for each species is calculated and then summed. If it exceeds 100% then the installation is included.
Ireland
Whilst Ireland were not consulted as part of the main data collection exercise for the study, they did provide the following comments as part of their response to the July 2012 consultation on the final report:
The composition of the feed used by poultry farms in Ireland is significantly influenced by the processing companies, feed will primarily be formulated based on least cost while meeting the birds requirements. The feed supplied to farms below and above the IPPC Directive threshold will be similar.
Turkey production is very seasonal and therefore a threshold base do places may not take account of the situation where only one batch of turkeys are reared per annum.
While the report does not seek to establish an equivalent threshold for cattle/cows/sheep, however Table 3.15 includes a putative threshold for dairy cows/other cows/sheep/goats. In Ireland for dairy cows/other cows/sheep/goats are only housed for limited periods during the winter (2-5 months for cows, and 0-3 months for sheep/goats (many not housed)).

B17
© AMEC Environment & Infrastructure UK Limited September 2012 Doc Reg No. 30310rr001i5
Italy (poultry)
Number of installations and livestock heads
In 2007 CRPA requested the National Institute of Statistics to provide data on the number of heads that could potentially be involved in the instance of differentiated thresholds for the poultry sector. In Table B.12 the number of farms and animals over and under the actual 40,000 places threshold are shown for the main poultry categories (these are the farms already covered by the IED). In Table B.13 the same data are reported for the differentiated thresholds.
Table B.12 Poultry farms and places
Species > 40,000 places < = 40,000 places Total
Broilers Farms 591 51,625 52,215
Number of places 72,801,727 20,453,455 93,255,182
Laying hens Farms 210 68,943 69,153
Number of places 28,506,761 8,524,411 37,031,173
Turkeys Farms 62 6,562 6,624
Number of places 4,742,649 7,011,855 11,754,504
Guinea fowls Farms 8 3,029 3,038
Number of places 1,066,577 1,000,819 2,067,396
Ducks Farms 1 4,140 4,141
Number of places * * 522,589
Geese Farms 2 3,160 3,162
Number of places * * 253678
Other poultry Farms 76 3,670 3,746
Number of places 9,859,894 2,483,466 12,343,360
Note: data marked * are confidential (art. 9 d.lgs. n. 322/89)
Source: Istat, SPA 2007 – UE

B18
© AMEC Environment & Infrastructure UK Limited September 2012 Doc Reg No. 30310rr001i5
Table B.13 Poultry farms and heads with a threshold of 40000 heads for broilers, guinea fowls, geese and other poultry, 30000 for laying hens, 24000 for ducks, 11500 for turkeys
Species > threshold <= threshold Total
Broilers Farms 591 51,625 52,215
No heads 72,801,727 20,453,455 93,255,182
Laying hens Farms 249 68,904 69,153
No heads 29,984,041 7,047,131 37,031,173
Turkeys Farms 337 6,288 6,624
No heads 9,921,843 1,832,661 11,754,504
Guinea fowls Farms 8 3,029 3,038
No heads 1,066,577 1,000,819 2,067,396
Ducks Farms 4 4,137 4,141
No heads * * 522,589
Geese Farms 2 3,160 3,162
No heads * * 253,678
Other poultry Farms 76 3,670 3,746
No heads 9,859,894 2,483,466 12,343,360
Note: data marked * are confidential (art. 9 d.lgs. n. 322/89)
Source: Istat, SPA 2007 – UE
Nitrogen excretion factors
The standard excretion adopted factors for poultry in Italy were drawn from the results of the interregional study carried out in 2005-2006 (Bonazzi et al., 2006). These values are:
• 0.66 kg of excreted N/animal place/year for laying hens;
• 0.33 kg of excreted N/animal place/year for pullets;
• 0.36 kg of excreted N/animal place/year for broilers;
• 2.13 kg of excreted N/animal place/year for male turkey; and
• 1.03 kg of excreted N/animal place/year for female turkey.
B19
© AMEC Environment & Infrastructure UK Limited September 2012 Doc Reg No. 30310rr001i5
Wider environmental impacts
The environmental impact of poultry farms on air and GHG emissions is assessed in the national inventory as CH4, N2O and NH3 emissions.
The total emissions for the poultry sector (2007) are:
• NH3 = 38.4 ktNH3/y;
• N2O = 5.01 ktN2O/y (3.04 ktN2O/y from manure management and 1.97 ktN2O/y from manure applied to agricultural soils); and
• CH4 = 15.07 ktCH4/y (manure management).
The impacts for different sized installations have not been assessed. No specific assessment on water and biodiversity is available.
National legislation in place for poultry
Mandatory measures to reduce emissions are in place only for surface and underground water bodies’ protection. These measures however can have indirect positive effect on air quality and climate change. As an example, fertilisation plans, mandatory both in vulnerable and non vulnerable zones, oblige farmers to reach in animal manure application to crops 50% of Nitrogen efficiency for slurry and 40% for solid manure. This N efficiency is an obligation for farms with more than 40,000 poultry places, and requires the use of methods of manure application able to reduce emissions to air at least of 30% compared with the traditional surface landspreading method.
The voluntary system adopted is the Good Agricultural Management Code (D.M. 19/04/1999) related to animal waste management and irrigation.
Netherlands (poultry and mixed activities)
The Netherlands did not complete the proforma but instead provided studies conducted during the IPPC review. It is therefore concluded that there has been little change to the agriculture sector in the intervening period.
Poland (poultry and mixed activities)
Poland submitted two tables of data: one summarising number of holdings according to number of places and poultry type (broilers, laying hens, breeding chicken, turkeys, ducks and geese); and the other summarising atmospheric emissions (NH3, N2O, PM10 and TSP) from 201 poultry installations. This data is summarised in
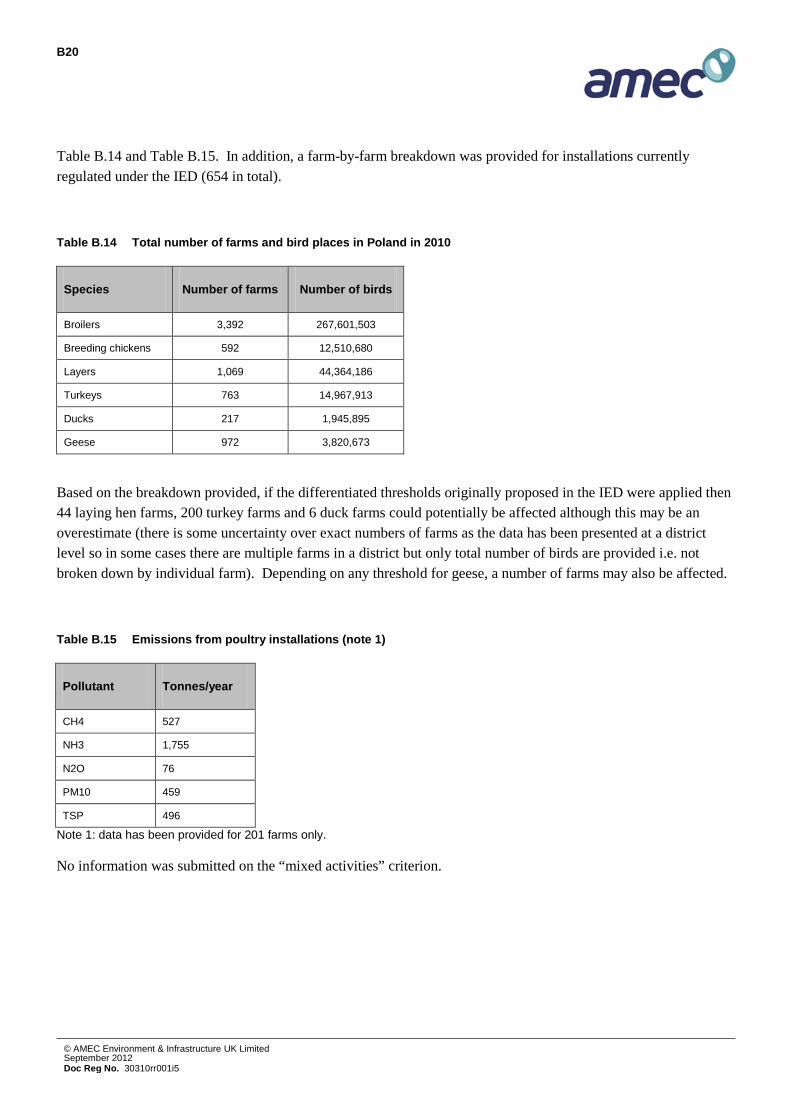
B20
© AMEC Environment & Infrastructure UK Limited September 2012 Doc Reg No. 30310rr001i5
Table B.14 and Table B.15. In addition, a farm-by-farm breakdown was provided for installations currently regulated under the IED (654 in total).
Table B.14 Total number of farms and bird places in Poland in 2010
Species Number of farms Number of birds
Broilers 3,392 267,601,503
Breeding chickens 592 12,510,680
Layers 1,069 44,364,186
Turkeys 763 14,967,913
Ducks 217 1,945,895
Geese 972 3,820,673
Based on the breakdown provided, if the differentiated thresholds originally proposed in the IED were applied then 44 laying hen farms, 200 turkey farms and 6 duck farms could potentially be affected although this may be an overestimate (there is some uncertainty over exact numbers of farms as the data has been presented at a district level so in some cases there are multiple farms in a district but only total number of birds are provided i.e. not broken down by individual farm). Depending on any threshold for geese, a number of farms may also be affected.
Table B.15 Emissions from poultry installations (note 1)
Pollutant Tonnes/year
CH4 527
NH3 1,755
N2O 76
PM10 459
TSP 496
Note 1: data has been provided for 201 farms only.
No information was submitted on the “mixed activities” criterion.

B21
© AMEC Environment & Infrastructure UK Limited September 2012 Doc Reg No. 30310rr001i5
Romania (mixed activities)
According to the proforma, the “mixed activities” criterion is not applicable in Romania; no further details have been provided.
Spain (poultry and mixed activities)
The following information is based on the proforma completed by Spain and accompanying documentation. Separate information was submitted by the Province of Catalonia.
Numbers affected
Spain submitted the following table (Table B.16) detailing poultry numbers and nitrogen excretion rates.
Table B.16 Number of animals and nitrogen excretion rates, Spain
Type of poultry Regime housing
Number of animals
Nitrogen excretion intensive (kg/animal/year)
Manure (t/year/head)
Manure (t/year)
Broilers Intensive 99,034,791.78 0.4213 0.0100 990,348
Layers Intensive 5,836,587 0.6118 0.0100 58,366
0 -18 weeks Replacement layer pullets Intensive 12,425,299 0.1963 0.0150 124,253
18-52.1 weeks
Laying hens – cages Intensive 23,648,788 0.6326 0.0150 236,488
52.1-108 weeks
Laying hens – cages Intensive 12,354,139 0.5153 0.0150 123,541
0-18 weeks Replacement layer pullets
Intensive/ Semi-extensive
448,672 0.1626 0.0150 6,730
18-52.1 weeks
Laying hens-free range 851,053 0.5706 0.0150 12,766
52.1-86.9 weeks
Laying hens-free range 865,296 0.5226 0.0150 12,979
Notes: Spain has created a Working Group composed of different experts and technical professionals and has developed a specific methodology based on IPPC adapted to Spanish conditions in order to calculate the nitrogen excretion rates and the atmospheric emissions of pollutants from livestock, including poultry species.

B22
© AMEC Environment & Infrastructure UK Limited September 2012 Doc Reg No. 30310rr001i5
The following table summarising number of places and farms by poultry type has been provided by the Province of Catalonia.
Table B.17 Number of places and farms by poultry type, Catalonia
Type of poultry Farms Places
Hens and chickens 4,411 Approx. 30 million
turkeys 346 1.5 million
ducks 768
geese 315
swans 3
pheasants 105 81,390
partridge 155 2,541,299
quail 120
ratites 34 949
pigeons 276
painted 23
Birds other than poultry 27
According to the proforma, the incidence of mixed activities farms is negligible, given the high degree of specialization for each livestock species.
Atmospheric emissions of pollutants
Spain submitted the following table summarising atmospheric emissions from agriculture. Further detail (e.g. methodological) is available in the National Inventory Report 2011 submission to the UNFCCC.
Table B.18 Greenhouse gas emissions from agriculture (2009)
Greenhouse gas source CH4 N2O Total % Contribution
CO2-eq (kt)
Agriculture 18,701.24 20,011.47 38,712.71 10.5
Animal husbandry and manure management 18,120.58 2,483.71 20,604.29 5.6
Enteric fermentation 12,528.65 12,528.65 3.4
Manure management 5,591.93 2,483.71 8,075.64 2.2

B23
© AMEC Environment & Infrastructure UK Limited September 2012 Doc Reg No. 30310rr001i5
Total (Gross Emissions) 36,387.22 26,209.49 367,548.42 100
Source: Greenhouse gas emissions inventory. Edition 2011 (1990-2009)
Wider environmental impacts
According to the completed proforma, the majority of poultry farms in Spain have a large number of animals. The management system used reduces significantly the emissions due to the manure collection system and storage during less than 1 week in the farm. The manure is directly transported to composting facilities and, most of them are directly treated well for composting or for mixing it with other organic products to fabricate substrates.
No information was provided by the region of Catalonia.
National legislation
Aside from the IPPC Law (16/2002), the Spanish regional authorities require the farmers to elaborate a manure management plan prior to commencing activities. They have different mechanisms to control the application of manure in agriculture, along with voluntary systems for improved feeding systems and the codes of good practices in the application of manure to agriculture.
It is noted that for laying hens, in most cases, efficient systems of animal feed are adopted and storage times of manure are minimised.
UK (poultry and mixed activities)
The UK did not complete a proforma on poultry or mixed activities but did provide links to relevant documentation and some data. Additional information was also provided by the Ulster Farmers’ Union (UFU) specifically for Northern Ireland.
Numbers of installations and livestock.
The 2011 survey on Land Use, Livestock and Labour on Agricultural Holdings found that the total poultry numbers decreased by 1% in 2011, largely due to the 3% decrease in the number of table chickens (broilers) which now stands at 102 million (see Table B.19). According to Defra, this decrease could be due to increased input costs, especially feed prices. Conversely numbers of breeding and laying fowl increased by 3% to 49 million.

B24
© AMEC Environment & Infrastructure UK Limited September 2012 Doc Reg No. 30310rr001i5
Table B.19 Poultry heads in the UK, 2009-2011 (thousands)
The table below summarises numbers of holdings and livestock numbers by size groups for broilers for 2005 and 2010.
Table B.20 Broiler heads and holdings in the UK, 2005 and 2010
Source: Agriculture in the United Kingdom, 2010
The table below summarises numbers of holdings by farm type in the UK including “mixed” activities (no further detail is provided on the farming types included in this category).

B25
© AMEC Environment & Infrastructure UK Limited September 2012 Doc Reg No. 30310rr001i5
The UFU provided estimates of the numbers of farms that could be brought under the IED if the thresholds for poultry were changed to align with those included in the original IED proposal and a mixed activities approach was adopted based on nitrogen excretion equivalency factors:
• Turkey farms: 50-60 permanent farms and 50 seasonal units.
• Laying hens: approximately 26 units.
Excretion factors
Atmospheric emissions from poultry are reported within the framework of the Kyoto protocol (National Inventory Report, NIR, 2011). The table below shows nitrogen excretion factors for different poultry categories in the UK in 2009 taken from the appendices of the report (A.3.6.2.2).
Table B.21 Nitrogen Excretion Factors, kg N hd-1 year-1 for livestock in the UK, 2009
Poultry type Nitrogen excretion factor, kg N hd-1 year -1
Broilers 0.44
Broiler Breeders 1.03
Layers 0.71
Ducks 1.69
Turkeys 1.81
Growing pullets 0.33
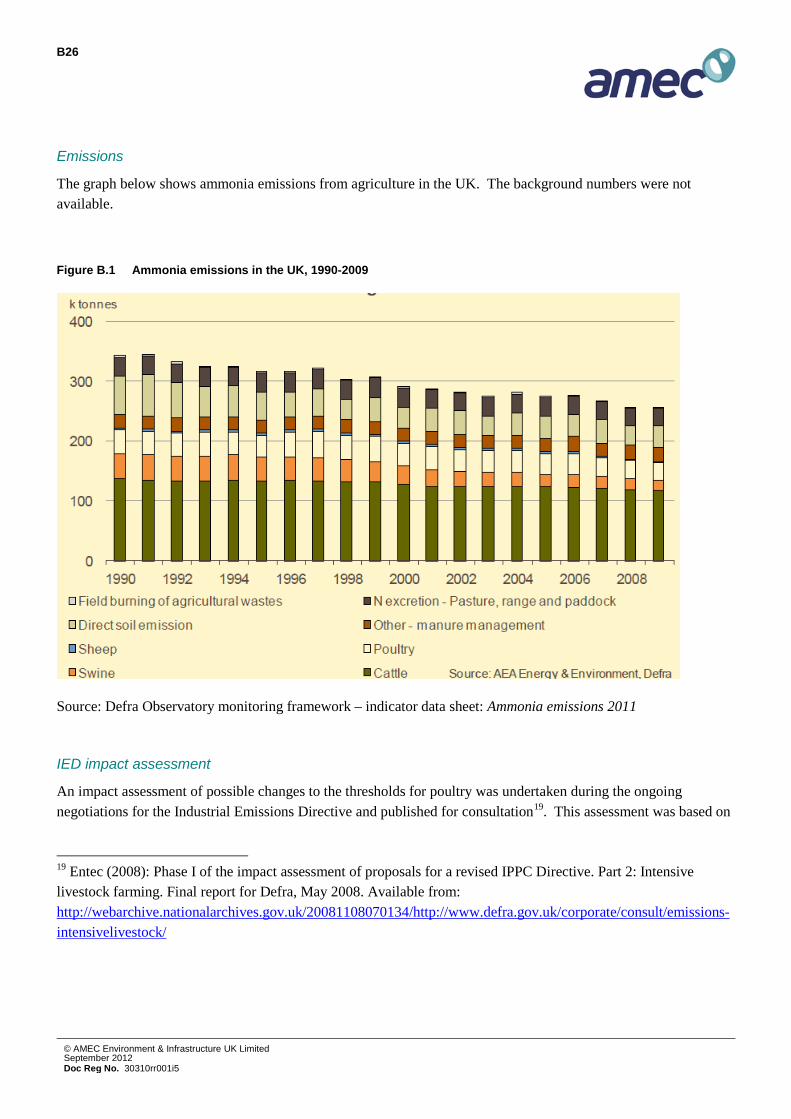
B26
© AMEC Environment & Infrastructure UK Limited September 2012 Doc Reg No. 30310rr001i5
Emissions
The graph below shows ammonia emissions from agriculture in the UK. The background numbers were not available.
Figure B.1 Ammonia emissions in the UK, 1990-2009
Source: Defra Observatory monitoring framework – indicator data sheet: Ammonia emissions 2011
IED impact assessment
An impact assessment of possible changes to the thresholds for poultry was undertaken during the ongoing negotiations for the Industrial Emissions Directive and published for consultation19. This assessment was based on
19 Entec (2008): Phase I of the impact assessment of proposals for a revised IPPC Directive. Part 2: Intensive livestock farming. Final report for Defra, May 2008. Available from: http://webarchive.nationalarchives.gov.uk/20081108070134/http://www.defra.gov.uk/corporate/consult/emissions-intensivelivestock/
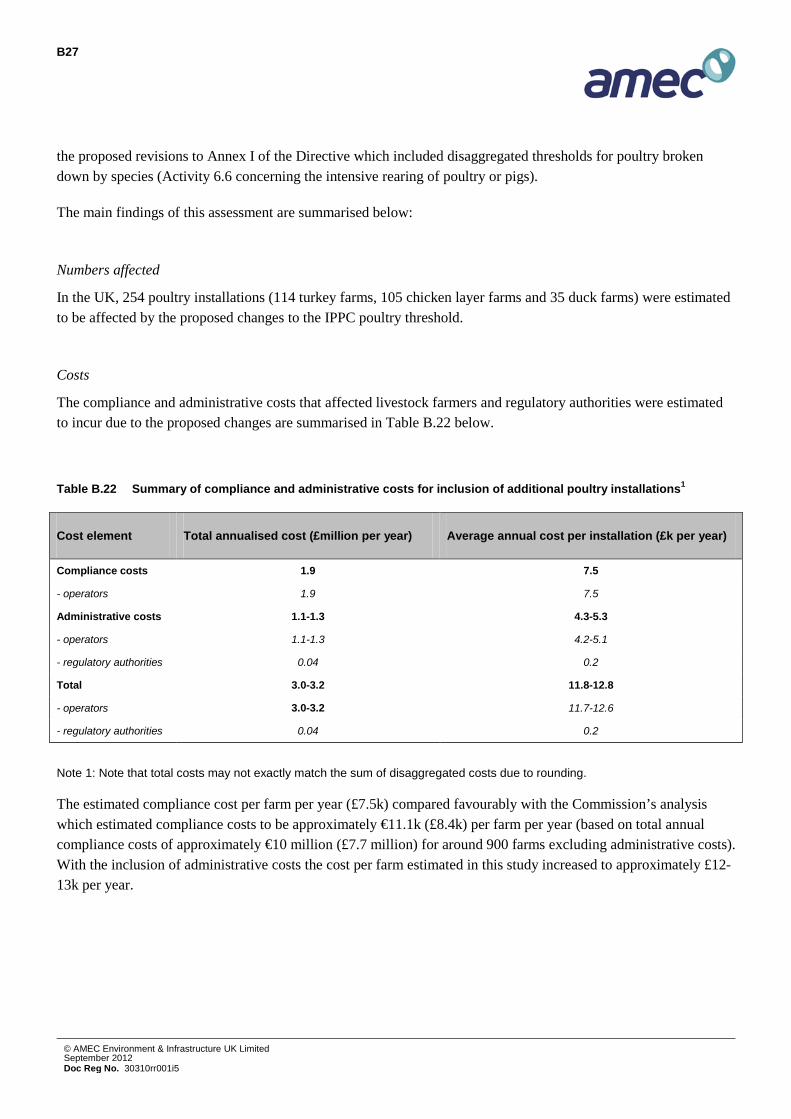
B27
© AMEC Environment & Infrastructure UK Limited September 2012 Doc Reg No. 30310rr001i5
the proposed revisions to Annex I of the Directive which included disaggregated thresholds for poultry broken down by species (Activity 6.6 concerning the intensive rearing of poultry or pigs).
The main findings of this assessment are summarised below:
Numbers affected
In the UK, 254 poultry installations (114 turkey farms, 105 chicken layer farms and 35 duck farms) were estimated to be affected by the proposed changes to the IPPC poultry threshold.
Costs
The compliance and administrative costs that affected livestock farmers and regulatory authorities were estimated to incur due to the proposed changes are summarised in Table B.22 below.
Table B.22 Summary of compliance and administrative costs for inclusion of additional poultry installations1
Cost element Total annualised cost (£million per year) Average annual cost per installation (£k per year)
Compliance costs 1.9 7.5
- operators 1.9 7.5
Administrative costs 1.1-1.3 4.3-5.3
- operators 1.1-1.3 4.2-5.1
- regulatory authorities 0.04 0.2
Total 3.0-3.2 11.8-12.8
- operators 3.0-3.2 11.7-12.6
- regulatory authorities 0.04 0.2
Note 1: Note that total costs may not exactly match the sum of disaggregated costs due to rounding.
The estimated compliance cost per farm per year (£7.5k) compared favourably with the Commission’s analysis which estimated compliance costs to be approximately €11.1k (£8.4k) per farm per year (based on total annual compliance costs of approximately €10 million (£7.7 million) for around 900 farms excluding administrative costs). With the inclusion of administrative costs the cost per farm estimated in this study increased to approximately £12-13k per year.

B28
© AMEC Environment & Infrastructure UK Limited September 2012 Doc Reg No. 30310rr001i5
Benefits
The estimated emission reductions and associated benefits are presented in the table below; benefits were calculated based on the damage cost functions (central estimates) developed by the European Commission under the CAFE programme. The benefits associated with the low and high damage cost estimates are presented in brackets for sensitivity.
Table B.23 Summary of emission reductions and associated benefits from inclusion of additional poultry installations
BAU ammonia emissions from affected installations (kt/year)
Ammonia emission reductions (kt/year) Benefits (damage costs avoided) (£million/year)
3.3 0.8-1.2 Based on CAFE damage cost functions: 21.0-29.4 (10.7-43.9)
The estimated compliance costs and reduction in emissions gave a cost effectiveness of approximately £2,500-3,800 per tonne of ammonia abated. The Commission’s IA presented an abatement cost of €1,000 per tonne of ammonia abated (~£770) although this excluded any administrative costs and assumed a greater reduction in emissions on average per installation (11 tonnes of ammonia reduced per year per installation compared to 4-5 tonnes estimated from the analysis for this study).