european bicycle market 2012 edition industry & … bicycle market... · august 2012 2 contents...
TRANSCRIPT

EUROPEAN BICYCLE MARKET
2012 edition
Industry & Market Profile (2011 statistics)

August 2012
2
CONTENTS
FOREWORD 4 BACKGROUND 5 THE EUROPEAN BICYCLE INDUSTRY 7 THE COLIBI & COLIPED MEMBERS 8
EUROPEAN BICYCLE PRODUCTION 10 BICYCLE PRODUCTION 2000 – 2011 – UNITS 11 2011 BICYCLE PRODUCTION – COUNTRY SHARE 12 2011 BICYCLE PRODUCTION – COUNTRY RANKING 13
2011 EUROPEAN BICYCLE PARTS AND ACCESSORIES PRODUCTION 14 BICYCLE PARTS & ACCESSORIES PRODUCTION – COUNTRY SHARE 15 BICYCLE PARTS & ACCESSORIES PRODUCTION – COUNTRY RANKING 16
EUROPEAN BICYCLE SALES 17 BICYCLE SALES 2000 – 2011 – UNITS 18 2011 BICYCLE SALES – COUNTRY SHARE 19 2011 BICYCLE SALES – COUNTRY RANKING 20 2011 AVERAGE PRICE (in €) PER COUNTRY 21 2011 EPAC SALES – UNITS 22 2011 EPAC SALES – COUNTRY RANKING 23
2011 EUROPEAN BICYCLE INDUSTRY EMPLOYMENT 24 EMPLOYMENT IN THE EUROPEAN BICYCLE AND BICYCLE PARTS & ACCESSORIES INDUSTRIES (EU27) 25 EUROPEAN BICYCLE INDUSTRY EMPLOYMENT (EU 27) 26 EUROPEAN BICYCLE PARTS AND ACCESSORIES INDUSTRY EMPLOYMENT 27
FRANCE/GERMANY/GREAT BRITAIN/ ITALY/THE NETHERLANDS INDUSTRY & MARKET PROFILE 2000-2011 28
FRANCE 29
FRENCH MARKET REPORT 30 FRANCE - BICYCLE PRODUCTION (UNITS) 32 FRANCE - BICYCLE SALES (UNITS) 33 FRANCE - BICYCLE SALES (M€) 34 FRANCE - PARTS & ACCESSORIES PRODUCTION (M€) 35 FRANCE - PARTS AND ACCESSORIES SALES (M€) 36 FRANCE - BICYCLE EMPLOYMENT 37
August 2012
3
GERMANY 38 GERMAN MARKET REPORT 39 GERMANY - BICYCLE PRODUCTION (UNITS) 41 GERMANY - BICYCLE SALES (UNITS) 42 GERMANY - BICYCLE SALES (M€) 43 GERMANY - PARTS & ACCESSORIES PRODUCTION (M€) 44 GERMANY - BICYCLE EMPLOYMENT 45
GREAT BRITAIN 46 GREAT BRITAIN - BICYCLE PRODUCTION (UNITS) 47 GREAT BRITAIN - BICYCLE SALES (UNITS) 48 GREAT BRITAIN - BICYCLE SALES (M€) 49 GREAT BRITAIN - PARTS & ACCESSORIES PRODUCTION (M€) 50 GREAT BRITAIN - BICYCLE EMPLOYMENT 51
ITALY 52 ITALY - BICYCLE PRODUCTION (UNITS) 53 ITALY - BICYCLE SALES (UNITS) 54 ITALY - BICYCLE SALES (M€) 55 ITALY - PARTS & ACCESSORIES PRODUCTION (M€) 56 ITALY - BICYCLE EMPLOYMENT 57
THE NETHERLANDS 58 BICYCLE MARKET IN THE NETHERLANDS 59 THE NETHERLANDS - BICYCLE PRODUCTION (UNITS) 63 THE NETHERLANDS - BICYCLE SALES (UNITS) 64 THE NETHERLANDS - BICYCLE SALES (M€) 65 THE NETHERLANDS - PARTS & ACCESSORIES PRODUCTION (M€) 66 THE NETHERLANDS - BICYCLE EMPLOYMENT 67

August 2012
4
FOREWORD This document is the fourth edition of the European Bicycle Industry & Market Profile, an economic study carried out by COLIBI, the Association of the European Bicycle Industry and COLIPED, the Association of the European Two-Wheeler Parts' & Accessories' Industry. The document is based on figures provided by our member associations and data kindly put at our disposal by non-member countries. It gives an overview of the European bicycle industry’s activities (production and employment), relevant market data (sales) and highlights the economic bicycle activity in the member countries. We wish to extend our sincere thanks to our member associations, the European bicycle manufacturers’ associations, the Chambers of Commerce and Embassies for their valuable and much appreciated contribution in the compilation of this work.
Copyright 2012 COLIBI - COLIPED The information contained in this document may only be reproduced with explicit mention of: Source: COLIBI-COLIPED
COLIBI – COLIPED Boulevard de la Woluwe 46 b16
B – 1200 Brussels Belgium
Tel.: +32 – (0)2 304 48 87 Fax: +32 – (0)2 762 81 71
E-mail: [email protected] [email protected]
Web: www.colibi.com and www.coliped.com
August 2012
5
BACKGROUND
COLIBI is the Association of the European Bicycle Industry; COLIPED is the Association of the European Two-Wheeler Parts' & Accessories' Industry. The aim of the European associations is to promote the common interests of the European bicycle and bicycle parts’ & accessories’ industries. COLIBI and COLIPED are the official spokespartners of the relevant European industry. As such, they keep in regular contact with European policy makers, European bicycle trade and cyclists’ associations, the European standardization body CEN, the industry, mobility experts and the press. COLIBI and COLIPED campaign for:
- the appointment of a European Bicycle Officer within the European Commission. COLIBI & COLIPED launched this idea and presented it to the EC in 2007. Since then, this initiative has been supported by several national and international associations, among them also the ECF and ETRA;
- fair trade and the fight against unfair practices in view of safeguarding the European bicycle industry; - the application of a reduced VAT rate on all bicycle products and services; - a better recognition of the (potential of the) bicycle and cycling in European policies and the
development of a bicycle (cycling) strategy by European policy makers; - the introduction at European level of reliable and comparable statistics related to cycle infrastructure
and use, costs & benefits of cycling, traffic accidents, etc.; - a better and easier access to European funding and financial means; - the introduction in the allocation of European funding of effective criteria that serve sustainability; - an increased cycle usage throughout the EU and beyond; - etc…
The European associations fully support the European (EN) safety standards for bicycles. COLIBI & COLIPED have a Liaison status with CEN TC 333 ‘Cycles’ and are member of the EcoMobility Alliance. The International Transport Forum (ITF) in Leipzig has become the real "Davos" transport meeting of the year. Many Transport Ministers from all over the world annually take part in this event. The presence of bicycles in the Forum is extremely important, as cycling contributions to the C02 emission reduction would otherwise not be taken into account. Indeed, politicians always tend to prefer “up-down” solutions, giving for instance billions to the car industry to try and develop e-cars.

August 2012
6
The e-mobility revolution in the next 10 years should be a "bottom-up" process, focusing first on EPACs which already developed well in the past decade. Next should be the more powerful two-wheelers such as e-bikes, e-mopeds and e-scooters and only much later (10 to 20 years from now) attention should go to electric cars. In fact, the technology of aluminium alloys and carbon composites, as well as the ever lighter and more powerful batteries that we have been developing in the EPAC industry in the last decade, will undeniably be a source of inspiration for the e-moped and even for the e-cars industry. The EU bicycle & EPAC industry has a very important role to play, not only in Europe’s ambition to seriously cut C02 emissions, but also in policies such as public health, environment (energy efficiency, noise pollution, etc.), transport, and many more. Being the largest employer in Europe in the Green Industries, we will do our utmost to continuously stress this role. The European bicycle industry’s participation in the IFT in Leipzig is part of our strong commitment to bring this huge potential of the bicycle and cycling under the attention of both European and local policy makers. To promote the European bicycle industry, COLIPED annually organizes a joint European participation in the Taipei Cycle Show (Taiwan) for European bicycle and bicycle parts’ & accessories’ manufacturers. Initiated in 1993, the joint European booth has known an ever increasing success. In 2012, 34 European exhibitors participated in the joint European COLIPED booth, which occupied a total surface of 873 m². A list with the 2012 participants can be found at www.coliped.com Our members are the national bicycle industry associations in 13 different countries: Austria, Belgium, Bulgaria, Germany, Great Britain, Finland, France, Hungary, Italy, the Netherlands, Poland, Spain and Turkey.

August 2012
7
THE EUROPEAN BICYCLE INDUSTRY
20,000,000 bicycles are sold annually across Europe. This total exceeds that of any other means of mobility (cars, motorcycles etc.). On average, European citizens own more bicycles than any other means of transport. Via their national associations, all major players on the European bicycle market are represented within COLIBI & COLIPED.
The bicycle is: - the most environmentally friendly, energy efficient and sustainable means of mobility; - the cheapest means of mobility (no ownership- motorway or registration taxes, no insurances, no
driving license or parking costs and no high service maintenance costs); - the most healthy and social means of mobility; - the most time-saving and silent mode in urban areas; - the most accessible mode of transport; - simply the best mobility mode in urban areas.
“COLIBI represents the European bicycle producers. The EU bicycle industry is characterized by its modern automation, its use of high-tech materials such as carbon fibers, special alloys and very light metals. Without any doubt, the high quality of the EU produced bicycles stimulates cycle usage and enhances the whole cycling movement and cycling culture in Europe. For our customers it is important that the production of mainly medium to high-end bicycles is realized near the European home market. This way, deliveries can be more flexible as the produced series can be smaller and lead times can be shorter. The EU bicycle industry is spread over the whole EU territory, with 250 small and medium-sized bicycle producers. Thanks to the regionalism of our ‘green’ industry, C02 emissions caused by the transport of the bicycles are reduced to almost zero! The EU bicycle industry is seen as the best and most innovative in the world. By continuously striving to improve the quality of our products by R&D and by making further investments, this image can only be strengthened”.
René TAKENS –COLIBI President
“Since many years, COLIPED promotes the European bicycle parts' industry. Our presence at the Taipei Cycle Show with our joint European booth contributes to the diffusion of the European bicycle parts worldwide. The last years have been extremely difficult for all industries, but we are very proud to say that the European bicycle parts' industry is keeping its leading position and this is the result of continuous innovation, great knowledge of sophisticated technologies and huge investments in design and R&D. The close co-operation with the cycling sport movement (which we confirmed by joining the WFSGI), our strong commitment to listen carefully to the needs of consumers, and our convinced devotion to all bicycle advocacy movements are the inspiring policies which we will adopt more and more in future years. For this reason COLIPED, together with COLIBI, has been taking part in the International Transport Forum in Leipzig. We will be dedicating time and resources to these very important initiatives which will shape the world of tomorrow at transport/mobility level”.
Moreno FIORAVANTI – COLIPED President

August 2012
8
THE COLIBI & COLIPED MEMBERS
Austria FFÖ Wiedner Hauptstrasse 63 Postfach 337 A – 1045 Wien
Tel. +43 - 1 50 105 4805 Fax +43 - 1 50 105 289
E-mail: [email protected] Web: www.wko.at/fahrzeuge
Belgium AGORIA Diamant Building Bd A. Reyers 80 B – 1030 Brussels
Tel. +32 – (0)2 706 79 69 Fax +32 – (0)2 706 79 76
E-mail: [email protected] Web: www.agoria.be
Bulgaria ABPB Dim. Nestonov Blvd. BL. 120 BG – 1612 Sofia
Tel. +359 - 2 812 70 60 Fax +359 - 2 812 70 61
E-mail: [email protected] Web: www.abpb-bg.com
Germany Z.I.V. Königsteiner Strasse 20A D – 65812 Bad Soden/Ts.
Tel. +49 - (0)6196-5077 0 Fax +49 - (0)6196-5077 20
E-mail: [email protected] Web: www.ziv-zweirad.de
Great Britain BAGB 3, The Quadrant GB – Coventry CV1 2DY
Tel. +44-2476-55 38 38 Fax +44-2476-22 83 66
E-mail: [email protected] Web: www.ba-gb.com
Finland Technology Industries of Finland Vehicle Manuf. Branch Group / Bicycle Manufacturers’ Section Etelaranta 10, POB 10 FIN – 00131 Helsinki
Tel. +358-919 231 Fax +358 962 44 62
E-mail: [email protected] Web: www.techind.fi
France CNPC “Tous à Vélo !” 3 rue Jules Guesde F – 92300 Levallois Perret
Tel. +33-1 47 31 56 25 Fax +33-1 47 31 56 32
E-mail: [email protected] Web: www.tousavelo.com

August 2012
9
Hungary MKKSZ P/a Accell Hunland Kft. 5091 Tószeg HU - Parkoló tér 1.
Tel. +36 - 56 586 505 Fax +36 - 56 586 484
E-mail: [email protected]
Italy ANCMA Via A. Da Recanate 1 I – 20124 Milan
Tel. +39 – 02 677 35 11 Fax +39 – 02 6698 20 72
E-mail: [email protected] Web: www.ancma.it
Poland Polskie Stowarzyszenie Rowerowe Ul. Fabryczna 6 PL - 98-300 Wielun
Tel. +48 – (0)43 843 42 93 Fax +48 – (0)43 843 42 93
E-mail: [email protected] Web: www.polskiestowarzyszenierowerowe.pl
The Netherlands RAI-Vereniging Postbus 74800 NL – 1070 DM Amsterdam
Tel. +31 - (0)20-504 49 49 Fax +31 - (0)20-504 49 98
E-mail: [email protected] Web: www.raivereniging.nl
Spain AMBE C/ El Pla, 106 E – 08980 Sant Feliu de Llobregat - Barcelona
Tel. +34 - 629 33 46 62
E-mail: [email protected] Web: www.asociacionambe.es
Turkey BISED Organize Sanayi Bölgesi 3.kisim Ahmet Tütüncüoðlu Cad. - NO:1 TR - Manisa
Tel. +90-236-213 0045 Fax + 90-236-213 0050
E-mail: [email protected]

August 2012
10
EUROPEAN BICYCLE PRODUCTION

August 2012
11
EUROPEAN BICYCLE PRODUCTION (EU 27) (1,000 units) 2000 – 2011
0
2,000
4,000
6,000
8,000
10,000
12,000
14,000
16,000
2000 2001 2002 2003 2004 2005 2006 2007 2008 2009 2010 2011
14,531
13,009
12,272
12,82813,232 13,218 13,320
13,086 13,246
12,178 12,24111,758
Year 2000 2001 2002 2003 2004 2005 2006 2007 2008 2009 2010 2011
Bicycle Production (x 1,000) 14,531 13,009 12,272 12,828 13,232 13,218 13,320 13,086 13,246 12,178 12,241 11,758
Evolution year/year-1 (%) -10.47 -5.67 4.53 3.15 -0.11 0.77 -1.76 1.22 -8.06 0.52 -3.95

August 2012
12
2011 EUROPEAN BICYCLE PRODUCTION (EU 27) (1,000 units)
ITALY20%
GERMANY19%
THE NETHERLANDS10%
POLAND8%
PORTUGAL7%
FRANCE8%
BULGARIA5%
ROMANIA4%
CZECH REPUBLIC3%
HUNGARY3%
SLOVAKIA3% LITHUANIA
3%SPAIN
2%
OTHERS6%
Country
Ita
ly
Ge
rma
ny
Th
e N
eth
erl
an
ds
Fra
nc
e
Po
lan
d
Po
rtu
ga
l
Bu
lga
ria
Ro
ma
nia
Hu
ng
ary
Cze
ch
Re
pu
bli
c
Lit
hu
an
ia
Slo
va
kia
Sp
ain
Au
str
ia
Gre
ec
e
Sw
ed
en
Be
lgiu
m
De
nm
ark
Gre
at
Bri
tain
Fin
lan
d
Slo
ve
nia
Ire
lan
d
Cy
pru
s
Es
ton
ia
La
tvia
Lu
xem
bo
urg
Malt
a
EU
27
Bicycle Production (x 1,000) 2,310 2,288 1,200 900 892 782 642 422 387 361 326 306 275 150 133 129 109 70 40 31 5 0 0 0 0 0 0 11,758
Country share % 19.65 19.46 10.21 7.65 7.59 6.65 5.46 3.59 3.29 3.07 2.77 2.60 2.34 1.28 1.13 1.10 0.93 0.60 0.34 0.26 0.04 0.00 0.00 0.00 0.00 0.00 0.00 100

August 2012
13
2011 EUROPEAN BICYCLE PRODUCTION (EU 27)
COUNTRY RANKING (1,000 units)
0
500
1,000
1,500
2,000
2,500
2,310 2,288
1,200
900 892
782
642
422387 361
326306
275
150 133 129109
7040 31 5
Country
Italy
Germ
an
y
Th
e N
eth
erl
an
ds
Fra
nce
Po
lan
d
Po
rtu
gal
Bu
lgari
a
Ro
man
ia
Hu
ng
ary
Czech
Rep
ub
lic
Lit
hu
an
ia
Slo
vakia
Sp
ain
Au
str
ia
Gre
ece
Sw
ed
en
Belg
ium
Den
mark
Gre
at
Bri
tain
Fin
lan
d
Slo
ven
ia
Irela
nd
Cyp
rus
Esto
nia
Latv
ia
Lu
xem
bo
urg
Malt
a
EU
27
Bicycle Production (x 1,000) 2,310 2,288 1,200 900 892 782 642 422 387 361 326 306 275 150 133 129 109 70 40 31 5 0 0 0 0 0 0 11,758
Ranking 1 2 3 4 5 6 7 8 9 10 11 12 13 14 15 16 17 18 19 20 21 22

August 2012
14
EUROPEAN BICYCLE PARTS AND ACCESSORIES PRODUCTION

August 2012
15
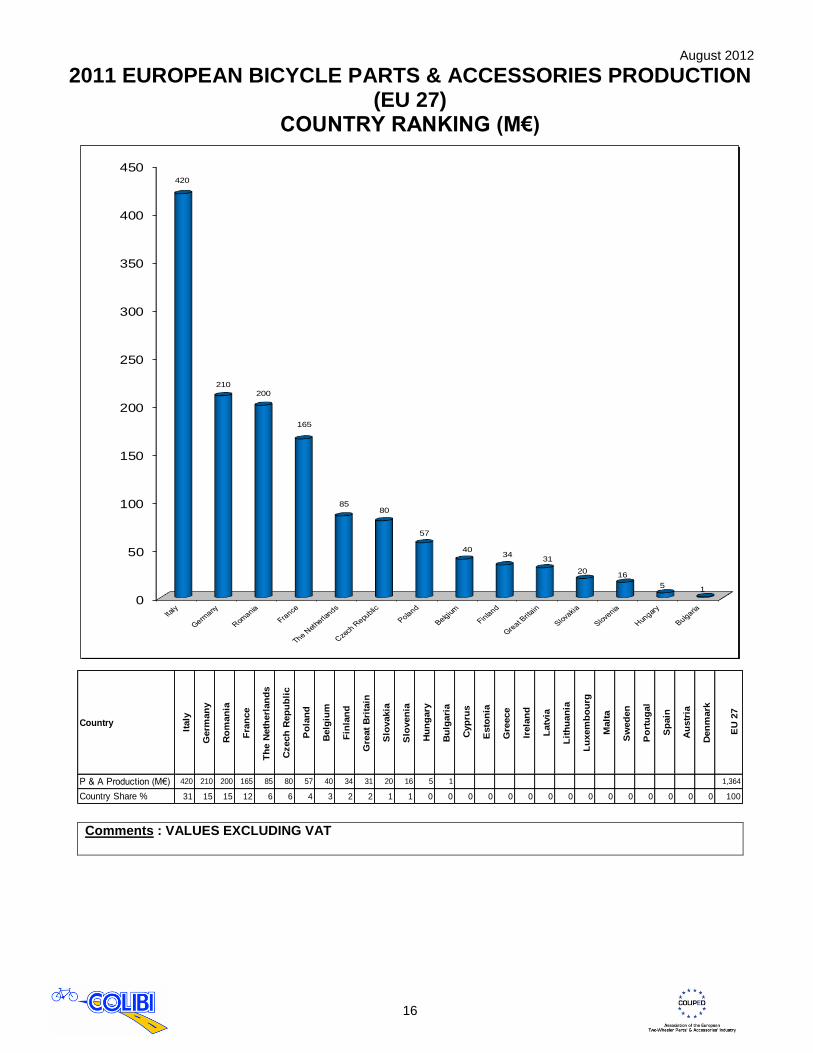
2011 EUROPEAN BICYCLE PARTS & ACCESSORIES PRODUCTION
(M€) - EU 27
ITALY32%
GERMANY16%
ROMANIA15%
FRANCE12%
THE NETHERLANDS6%
CZECH REPUBLIC6%
POLAND4%
BELGIUM3%
GREAT-BRITAIN2%
OTHERS3%
Country
Italy
Germ
an
y
Ro
man
ia
Fra
nce
Th
e N
eth
erl
an
ds
Czech
Rep
ub
lic
Po
lan
d
Belg
ium
Fin
lan
d
Gre
at
Bri
tain
Slo
vakia
Slo
ven
ia
Hu
ng
ary
Bu
lgari
a
Cyp
rus
Esto
nia
Gre
ece
Irela
nd
Latv
ia
Lit
hu
an
ia
Lu
xem
bo
urg
Malt
a
Sw
ed
en
Po
rtu
gal
Sp
ain
Au
str
ia
Den
mark
EU
27
P & A Production (M€) 420 210 200 165 85 80 57 40 34 31 20 16 5 1 1,364
Country Share % 31 15 15 12 6 6 4 3 2 2 1 1 0 0 0 0 0 0 0 0 0 0 0 0 0 0 0 100
Comments : VALUES EXCLUDING VAT
August 2012
16
2011 EUROPEAN BICYCLE PARTS & ACCESSORIES PRODUCTION (EU 27)
COUNTRY RANKING (M€)
0
50
100
150
200
250
300
350
400
450420
210
200
165
8580
57
4034
31
2016
51
Country
Italy
Germ
an
y
Ro
man
ia
Fra
nce
Th
e N
eth
erl
an
ds
Czech
Rep
ub
lic
Po
lan
d
Belg
ium
Fin
lan
d
Gre
at
Bri
tain
Slo
vakia
Slo
ven
ia
Hu
ng
ary
Bu
lgari
a
Cyp
rus
Esto
nia
Gre
ece
Irela
nd
Latv
ia
Lit
hu
an
ia
Lu
xem
bo
urg
Malt
a
Sw
ed
en
Po
rtu
gal
Sp
ain
Au
str
ia
Den
mark
EU
27
P & A Production (M€) 420 210 200 165 85 80 57 40 34 31 20 16 5 1 1,364
Country Share % 31 15 15 12 6 6 4 3 2 2 1 1 0 0 0 0 0 0 0 0 0 0 0 0 0 0 0 100
Comments : VALUES EXCLUDING VAT

August 2012
17
EUROPEAN BICYCLE SALES

August 2012
18
EUROPEAN BICYCLE SALES (EU 27) (1,000 units) 2000 - 2011
0
5,000
10,000
15,000
20,000
25,000
2000 2001 2002 2003 2004 2005 2006 2007 2008 2009 2010 2011
18,945
17,745 17,840
20,206 20,32220,912 21,033
21,344
20,20619,582
20,46120,039
Year 2000 2001 2002 2003 2004 2005 2006 2007 2008 2009 2010 2011
Bicycle Sales (x 1,000) 18,945 17,745 17,840 20,206 20,322 20,912 21,033 21,344 20,206 19,582 20,461 20,039
Evolution (%) -6.33 0.54 13.26 0.57 2.90 0.58 1.48 -5.33 -3.09 4.49 -2.06

August 2012
19
2011 EUROPEAN BICYCLE SALES (EU 27) (1,000 units)
GERMANY
20%
GREAT BRITAIN18%
FRANCE
16%
ITALY9%
THE NETHERLANDS
6%
SPAIN
4%
POLAND3%
DENMARK
3%
SWEDEN3%
BELGIUM
2%
AUSTRIA2%
PORTUGAL
2%
GREECE2%
CZECH
REPUBLIC
2%
FINLAND2%
ROMANIA
2%OTHERS
6%
Country
Germ
an
y
Gre
at
Bri
tain
Fra
nce
Italy
Th
e N
eth
erl
an
ds
Sp
ain
Po
lan
d
Den
mark
Sw
ed
en
Belg
ium
Au
str
ia
Po
rtu
gal
Gre
ece
Czech
Rep
ub
lic
Fin
lan
d
Ro
man
ia
Hu
ng
ary
Slo
vakia
Slo
ven
ia
Irela
nd
Lit
hu
an
ia
Bu
lgari
a
Esto
nia
Latv
ia
Cyp
rus
Malt
a
Lu
xem
bo
urg
EU
27
Bicycle Sales (x 1,000) 4,050 3,580 3,200 1,750 1,171 780 610 550 520 468 405 320 325 345 330 375 240 300 250 95 115 103 65 35 35 12 10 20,039
Country share (%) 20 18 16 9 6 4 3 3 3 2 2 2 2 2 2 2 1 1 1 0 1 1 0 0 0 0 0 100
Comments : SALES = SALES TO CONSUMERS
August 2012
20
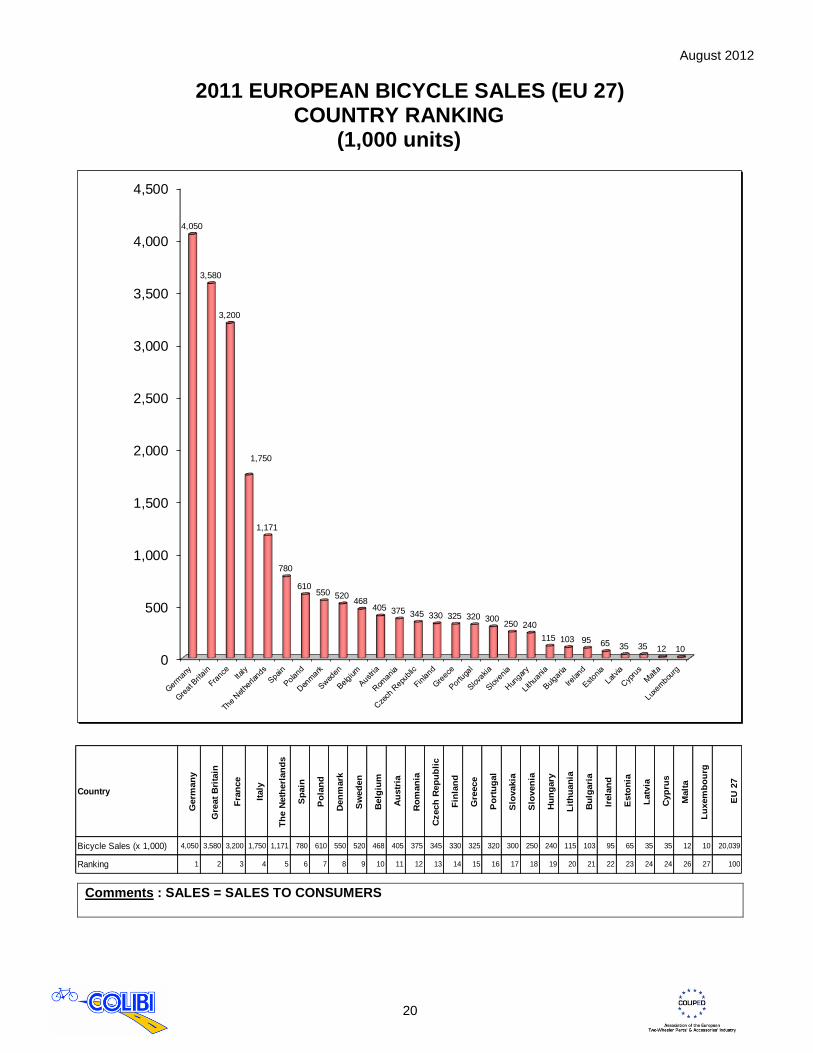
2011 EUROPEAN BICYCLE SALES (EU 27) COUNTRY RANKING
(1,000 units)
0
500
1,000
1,500
2,000
2,500
3,000
3,500
4,000
4,500
4,050
3,580
3,200
1,750
1,171
780
610550 520
468405 375 345 330 325 320 300
250 240
115 103 95 65 35 35 12 10
Country
Germ
an
y
Gre
at
Bri
tain
Fra
nce
Italy
Th
e N
eth
erl
an
ds
Sp
ain
Po
lan
d
Den
mark
Sw
ed
en
Belg
ium
Au
str
ia
Ro
man
ia
Czech
Rep
ub
lic
Fin
lan
d
Gre
ece
Po
rtu
gal
Slo
vakia
Slo
ven
ia
Hu
ng
ary
Lit
hu
an
ia
Bu
lgari
a
Irela
nd
Esto
nia
Latv
ia
Cyp
rus
Malt
a
Lu
xem
bo
urg
EU
27
Bicycle Sales (x 1,000) 4,050 3,580 3,200 1,750 1,171 780 610 550 520 468 405 375 345 330 325 320 300 250 240 115 103 95 65 35 35 12 10 20,039
Ranking 1 2 3 4 5 6 7 8 9 10 11 12 13 14 15 16 17 18 19 20 21 22 23 24 24 26 27 100
Comments : SALES = SALES TO CONSUMERS

August 2012
21
2011 EUROPEAN BICYCLE SALES (EU 27) AVERAGE PRICE/COUNTRY (€)
0
100
200
300
400
500
600
700
800
746
495
420 420
410400
380
300
280 275 270 265250
210
190
140130 130
120 120110 110
100 100 100 10085
Country
Th
e N
eth
erl
an
ds
Germ
an
y
Au
str
ia *
Den
mark
*
Belg
ium
*
Lu
xem
bo
urg
*
Sw
ed
en
*
Fin
lan
d *
Gre
at
Bri
tain
Gre
ece *
Italy
Fra
nce
Sp
ain
*
Po
lan
d *
Irela
nd
*
Po
rtu
gal
*
Czech
Rep
ub
lic *
Hu
ng
ary
*
Malt
a *
Ro
man
ia *
Slo
vakia
*
Slo
ven
ia *
Lit
hu
an
ia *
Cycp
us *
Esto
nia
*
Latv
ia *
Bu
lgari
a
EU
27
Average price (€) 746 495 420 420 410 400 380 300 280 275 270 265 250 210 190 140 130 130 120 120 110 110 100 100 100 100 85
Comments : AVERAGE PRICES INCLUDE VAT

August 2012
22
2011 EUROPEAN EPAC SALES (EU 27) (1,000 units)
GERMANY34%
THE NETHERLANDS29%
ITALY8%
FRANCE7%
DENMARK5%
GREAT BRITAIN5%
AUSTRIA3%
SPAIN3%
SWEDEN3%
OTHERS3%
Country
Germ
an
y
Th
e N
eth
erl
an
ds
Italy
Fra
nce
Au
str
ia
Den
mark
Gre
at
Bri
tain
Sp
ain
Sw
ed
en
Po
rtu
gal
Belg
ium
Fin
lan
d
Czech
Rep
ub
lic
Hu
ng
ary
Irela
nd
Gre
ece
Lu
xem
bo
urg
Lit
hu
an
ia
Bu
lgari
a
Po
lan
d
Ro
man
ia
Slo
vakia
Slo
ven
ia
Cyp
rus
Esto
nia
Latv
ia
Malt
a
EU
27
EPAC Sales (x 1,000) 310 178 50 40 35 30 20 20 15 5 5 3 2 1 1 1 1 716
Country share % 43.28 24.85 6.98 5.58 4.89 4.19 2.79 2.79 2.09 0.70 0.70 0.42 0.28 0.18 0.14 0.07 0.07 0.00 0.00 0.00 0.00 0.00 0.00 0.00 0.00 0.00 0.00 100
Comments : EPAC = Electric Power-Assisted Cycle

August 2012
23
2011 EUROPEAN EPAC SALES (EU 27)
COUNTRY RANKING (1,000 units)
0
50
100
150
200
250
300
350
310
178
50
4035
30
20 2015
5 5 3 2 1 1 1 1
Country
Germ
an
y
Th
e N
eth
erl
an
ds
Italy
Fra
nce
Au
str
ia
Den
mark
Gre
at
Bri
tain
Sp
ain
Sw
ed
en
Po
rtu
gal
Belg
ium
Fin
lan
d
Czech
Rep
ub
lic
Hu
ng
ary
Irela
nd
Gre
ece
Lu
xem
bo
urg
Lit
hu
an
ia
Bu
lgari
a
Po
lan
d
Ro
man
ia
Slo
vakia
Slo
ven
ia
Cyp
rus
Esto
nia
Latv
ia
Malt
a
EU
27
EPAC Sales (x 1,000) 310 178 50 40 35 30 20 20 15 5 5 3 2 1 1 1 1 716
Ranking 1 2 3 4 5 6 7 7 9 10 10 12 13 14 14 16 16 100
Comments : EPAC = Electric Power-Assisted Cycle
August 2012
24
2011 EUROPEAN BICYCLE INDUSTRY EMPLOYMENT

August 2012
25
2011 EMPLOYMENT IN THE EUROPEAN BICYCLE AND BICYCLE PARTS & ACCESSORIES INDUSTRIES (EU27)
0
500
1,000
1,500
2,000
2,500
3,000
3,500
4,000
3,650
3,174
2,264
2,050
1,444
1,200 1,190
1,020940
532380 370 370 320
190 180 160 105 90 80 80
Country
Germ
an
y
Italy
Th
e N
eth
erl
an
ds
Fra
nce
Po
lan
d
Ro
man
ia
Po
rtu
gal
Bu
lgari
a
Czech
Rep
ub
lic
Hu
ng
ary
Au
str
ia
Slo
vakia
Belg
ium
Gre
at
Bri
tain
Lit
hu
an
ia
Sp
ain
Gre
ece
Fin
lan
d
Sw
ed
en
Slo
ven
ia
Den
mark
Cyp
rus
Esto
nia
Irela
nd
Latv
ia
Lu
xem
bo
urg
Malt
a
EU
27
Bicycle Employment 2,450 1,574 1,764 1,150 1,074 400 690 1,010 460 482 300 280 220 250 190 180 160 60 90 10 80 0 0 0 0 0 0 12,874
Parts & Accessories Employment 1,200 1,600 500 900 370 800 500 10 480 50 80 90 150 70 0 0 0 45 0 70 0 0 0 0 0 0 0 6,915
Total 3,650 3,174 2,264 2,050 1,444 1,200 1,190 1,020 940 532 380 370 370 320 190 180 160 105 90 80 80 0 0 0 0 0 0 19,789

August 2012
26
2011 EUROPEAN BICYCLE INDUSTRY EMPLOYMENT (EU 27)
0
500
1,000
1,500
2,000
2,500 2,450
1,764
1,574
1,1501,074
1,010
690
482 460400
300280 250 220 190 180 160
90 80 6010
Country
Germ
an
y
Th
e N
eth
erl
an
ds
Italy
Fra
nce
Po
lan
d
Bu
lgari
a
Po
rtu
gal
Hu
ng
ary
Czech
Rep
ub
lic
Ro
man
ia
Au
str
ia
Slo
vakia
Gre
at
Bri
tain
Belg
ium
Lit
hu
an
ia
Sp
ain
Gre
ece
Sw
ed
en
Den
mark
Fin
lan
d
Slo
ven
ia
Cyp
rus
Esto
nia
Irela
nd
Latv
ia
Lu
xem
bo
urg
Malt
a
EU
Bicycle Industry Employment 2,450 1,764 1,574 1,150 1,074 1,010 690 482 460 400 300 280 250 220 190 180 160 90 80 60 10 0 0 0 0 0 0 12,874
Ranking 1 2 3 4 5 6 7 8 9 9 11 12 13 14 15 16 17 18 19 20 21 22

August 2012
27
2011 EUROPEAN BICYCLE PARTS AND ACCESSORIES INDUSTRY EMPLOYMENT (EU 27)
0
200
400
600
800
1,000
1,200
1,400
1,600
1,600
1,200
900
800
500 500 480
370
150
90 80 70 70 50 4510
Country
Italy
Germ
an
y
Fra
nce
Ro
man
ia
Th
e N
eth
erl
an
ds
Po
rtu
gal
Czech
Rep
ub
lic
Po
lan
d
Belg
ium
Slo
vakia
Au
str
ia
Slo
ven
ia
Gre
at
Bri
tain
Hu
ng
ary
Fin
lan
d
Bu
lgari
a
Sp
ain
Den
mark
Cyp
rus
Esto
nia
Gre
ece
Irela
nd
Latv
ia
Lit
hu
an
ia
Lu
xem
bo
urg
Malt
a
Sw
ed
en
EU
27
P & A Industry Employment 1,600 1,200 900 800 500 500 480 370 150 90 80 70 70 50 45 10 0 0 0 0 0 0 0 0 0 0 0 6,915
Ranking 1 2 3 4 5 5 7 8 9 10 11 12 12 14 15 16 17 17 17 17 17 17 17 17 17 17 17

August 2012
28
FRANCE/GERMANY/GREAT BRITAIN/ ITALY/THE NETHERLANDS
Industry & Market Profile 2000-2011
August 2012
29
France
August 2012
30
2011 FRENCH CYCLE MARKET:
Expansion is coming back ! The 2011 cycle sales (bicycles + components & accessories) represent a turnover of 1.347 M€. After a decrease of -3.4% in 2010, the bicycle market enjoyed a growth of 5.2% in 2011. 3,197,200 bicycles were sold in 2011, for a total value of 846 M€. Sales increased by +5.5% in volume and by +6.5% in value, compared to 2010.
ATB (adults and junior) represent 47% of the total with 1,487,800 units.
Junior Bikes (except ATB): 570,900 units.
Hybrids: 416,700 units.
City and Folding Bikes: 248,600 units.
Racing bikes: 175,600 units.
Kids’ Bikes: 129,400 units.
BMX: 131,200 units.
37,000 EPACs were sold in 2011, compared to 38,000 in 2010. (EPAC = Electric Power-Assisted Cycle)
The MOBILITY Bicycle market (city bikes, folding bikes and EPACs) continues its growth and represents 26% of the sales (17% in 2000). The LEISURE Bicycle market (ATB, Hybrids and Junior bikes) is decreasing but keeps the highest market share with 62% (73% in 2000). The SPORTS Bicycle market (Racing bikes, ATB and BMX for competition) is stable with a 12% share of the total sales. The value of the after sales market components and accessories amounts to 500.7 M€ (+3% vs 2010).
The distribution networks activity (Bicycles + Components & Accessories) is divided as follows:
Specialist dealers represent 51% of the total sales’ value. Sports Chains hold 39% of the total sales’ value. Mass Merchants hold 10% of the total sales’ value.
Only for the bicycle market:
Specialist dealers represent 54% of the total sales’ value. Sports Chains hold 37% of the total sales’ value. Mass Merchants hold 9 % of the total sales’ value.
The bicycle park is estimated at 25,000,000 units. Around 40% of the French population owns a bicycle.
August 2012
31
One of the main restraints of bicycle riding and purchasing development is the numbers of thefts, especially in big cities. 400,000 bicycles are stolen every year in France, i.e. more than 1,000/day. 150,000 bicycles are found again by the police, but they are not returned to their owners due to a lack of identification (only 2% gets their bike back: 3,000 to 400,000).
- 9 bicycles out of 10 are badly secured against theft;
- 1 bicycle out of 4 is parked without being attached;
- 3 bicycles out of 4 are badly attached. 1 theft out of 2 occurred in residential buildings.
- 2% gets their bike back (8,000);
- 23% refuse to buy a new bike (92,000);
- 50% replace it by a second-hand bicycle (200,000);
- 10% replace it by a new bicycle but with a value less than 230€ (40,000);
- 15% replace it by a new bicycle with a value of more than 230€ (60,000). 16,000 vélibs out of a park of 25,000 vélibs (bicycle sharing system) were vandalized between 2007 and 2009. 8,000 vélibs were stolen or lost in the same period. Since 2009, the Paris City Hall has not published the figures.
**********
The French Cycle Manufacturers and Traders Council is the meeting point of all professional cycle actors in France: bicycle manufacturers, cycle components and accessories producers, distributors of bicycles, brand equipments and accessories and all actors in favour of the promotion of the bicycle.

August 2012
32
FRANCE - BICYCLE PRODUCTION
(1,000 units) 2000 - 2011
0
200
400
600
800
1,000
1,200
1,400
1,600
1,800
2,000
2000 2001 2002 2003 2004 2005 2006 2007 2008 2009 2010 2011
1,910
1,525
1,424
1,492
1,728 1,720
1,2861,248
1,130
879916 900
Year 2000 2001 2002 2003 2004 2005 2006 2007 2008 2009 2010 2011
Bicycle Production (x 1,000) 1,910 1,525 1,424 1,492 1,728 1,720 1,286 1,248 1,130 879 916 900
Evolution year/year-1 (%) -20.16 -6.62 4.78 15.82 -0.46 -25.23 -2.95 -9.46 -22.21 4.21 -1.75

August 2012
33
FRANCE - BICYCLE SALES (1,000 units) 2000 - 2011
0
500
1,000
1,500
2,000
2,500
3,000
3,500
4,000
2000 2001 2002 2003 2004 2005 2006 2007 2008 2009 2010 2011
3,338
2,952 2,986
3,528 3,518
3,764
3,465 3,4663,336
3,1323,031
3,200
Year 2000 2001 2002 2003 2004 2005 2006 2007 2008 2009 2010 2011
Bicycle Production (x 1,000) 1,910 1,525 1,424 1,492 1,728 1,720 1,286 1,248 1,130 879 916 900
Evolution year/year-1 (%) -20.16 -6.62 4.78 15.82 -0.46 -25.23 -2.95 -9.46 -22.21 4.21 -1.75
Comments : SALES = SALES TO CONSUMERS

August 2012
34
FRANCE - BICYCLE SALES (M€) 2000 - 2011
0
100
200
300
400
500
600
700
800
900
2000 2001 2002 2003 2004 2005 2006 2007 2008 2009 2010 2011
654
708732
857 851869
794
842 850819
794
846
Year 2000 2001 2002 2003 2004 2005 2006 2007 2008 2009 2010 2011
Bicycle Sales (M€) 654 708 732 857 851 869 794 842 850 819 794 846
Evolution year/year-1 (%) 8.26 3.39 17.08 -0.70 2.12 -8.63 6.05 0.95 -3.65 -3.05 6.55
Comments : SALES = SALES TO CONSUMERS INCLUDING VAT

August 2012
35
FRANCE - PARTS & ACCESSORIES PRODUCTION
(M€) 2000 - 2011
0
20
40
60
80
100
120
140
160
180
2000 2001 2002 2003 2004 2005 2006 2007 2008 2009 2010 2011
139
120 118
130
140
150 150
157
150
140
150
165
Year 2000 2001 2002 2003 2004 2005 2006 2007 2008 2009 2010 2011
P & A Production (M€) 139 120 118 130 140 150 150 157 150 140 150 165
Evolution year/year-1 (%) -13.67 -1.67 10.17 7.69 7.14 0.00 4.67 -4.46 -6.67 7.14 10.00
Comments : VALUES EXCLUDING VAT

August 2012
36
FRANCE - PARTS AND ACCESSORIES SALES (M€) 2000 – 2011
0
100
200
300
400
500
600
2000 2001 2002 2003 2004 2005 2006 2007 2008 2009 2010 2011
260
349
444
493
519532 525
553536
506
486501
Year 2000 2001 2002 2003 2004 2005 2006 2007 2008 2009 2010 2011
P & A Sales (M€) 260 349 444 493 519 532 525 553 536 506 486 501
Evolution year/year-1 (%) 34.23 27.22 11.04 5.27 2.50 -1.32 5.33 -3.07 -5.60 -3.95 3.09
Comments : SALES = SALES TO CONSUMERS INCLUDING VAT

August 2012
37
FRANCE - BICYCLE EMPLOYMENT 2000 - 2011
0
500
1,000
1,500
2,000
2,500
3,000
3,500
2000 2001 2002 2003 2004 2005 2006 2007 2008 2009 2010 2011
3,249
2,794
2,630
2,4002,300 2,300
2,2502,130 2,090 2,050
2,0002,050
0
200
400
600
800
1,000
1,200
1,400
1,600
1,800
2,000
2000 2001 2002 2003 2004 2005 2006 2007 2008 2009 2010 2011
1,910
1,555
1,450 1,4501,400 1,400
1,350
1,2001,150 1,150
1,1001,150
Bicycle Employment
0
200
400
600
800
1,000
1,200
1,400
2000 2001 2002 2003 2004 2005 2006 2007 2008 2009 2010 2011
1,339
1,239
1,180
950
900 900 900930 940
900 900 900
Parts & Accessories Employment
Year 2000 2001 2002 2003 2004 2005 2006 2007 2008 2009 2010 2011
Bicycle Employment 1,910 1,555 1,450 1,450 1,400 1,400 1,350 1,200 1,150 1,150 1,100 1,150
P & A Employment 1,339 1,239 1,180 950 900 900 900 930 940 900 900 900
Total 3,249 2,794 2,630 2,400 2,300 2,300 2,250 2,130 2,090 2,050 2,000 2,050

August 2012
38
Germany

August 2012
39
German Market Report Bicycles and bicycle parts in 2011
The German bicycle and bicycle parts’ industry had a successful year 2011. About 4.05 million bicycles and electric bikes were sold in 2011 by the trade, an increase of 1.1% compared to 2010. With an average price of € 495.00, the selling price per bike (EPACs included) increased again and brings the industry a higher turnover. In 2011, more than 50,000 employees in the German bicycle industry generated a total turnover of about 4 billion Euro. Especially the retail value of bicycles and electric bikes increased – a plus of 8.8% to just under 2 billion Euro. Responsible for this increase are mainly the higher value of the e-bikes and the general increasing quality awareness of the consumers. In 2010, around 200,000 e-bikes were sold in Germany. In 2011, this figure rose to 310,000 pieces, representing 8% of the total market. Especially the developments in the battery and motor technologies, the fresh design and the changing mobility behavior of the Germans make that the ZIV expect more than 900,000 e-bikes traveling around between Flensburg and Garmisch. The most popular bicycles are still the city and trekking bikes.

August 2012
40
Especially in the everyday mobility, for commuting, shopping and leisure, bicycles know a steadily growing importance. It shouldn’t come as a surprise that the 2011 bicycle park in Germany has risen by 1 million units to a total of 70 million pieces. The share of fully-equipped bicycles is higher than 80%, which confirms the trend for the everyday bike use. Quality, service and advice are very important for the German customer. For both bicycle and equipment, the specialist shop plays a major role. Nearly 70% of all sales were handled by the stationary stores in 2011 and this clearly demonstrates the quality awareness of consumers. This high quality awareness is also reflected in the share of bicycles imported into Germany, with 52.8% of all imports coming from Europe. Zweirad-Industrie-Verband e.V. (ZIV) The German two-wheeler industry association (ZIV) is the national advocacy and service provider for the German and international bicycle industry. The ZIV has around 80 member companies.
**********

August 2012
41
GERMANY - BICYCLE PRODUCTION (1,000 units) 2000 - 2011
0
500
1,000
1,500
2,000
2,500
3,000
3,500
2000 2001 2002 2003 2004 2005 2006 2007 2008 2009 2010 2011
3,400
3,0003,045
3,203
2,940
2,714
2,490
2,400 2,418
2,248 2,2292,288
Year 2000 2001 2002 2003 2004 2005 2006 2007 2008 2009 2010 2011
Bicycle Production (x 1,000) 3,400 3,000 3,045 3,203 2,940 2,714 2,490 2,400 2,418 2,248 2,229 2,288
Evolution year/year-1 (%) -11.76 1.50 5.19 -8.21 -7.69 -8.25 -3.61 0.75 -7.03 -0.85 1.78

August 2012
42
GERMANY - BICYCLE SALES (1,000 units) 2000 - 2011
0
1,000
2,000
3,000
4,000
5,000
6,000
2000 2001 2002 2003 2004 2005 2006 2007 2008 2009 2010 2011
5,120
4,7004,600
4,9004,700 4,750
4,4254,600
4,350
4,050 4,010 4,050
Year 2000 2001 2002 2003 2004 2005 2006 2007 2008 2009 2010 2011
Bicycle Sales (x 1,000) 5,120 4,700 4,600 4,900 4,700 4,750 4,425 4,600 4,350 4,050 4,010 4,050
Evolution year/year-1 (%) -8.20 -2.13 6.52 -4.08 1.06 -6.84 3.95 -5.43 -6.90 -0.99 1.00
Comments : SALES = SALES TO CONSUMERS
August 2012
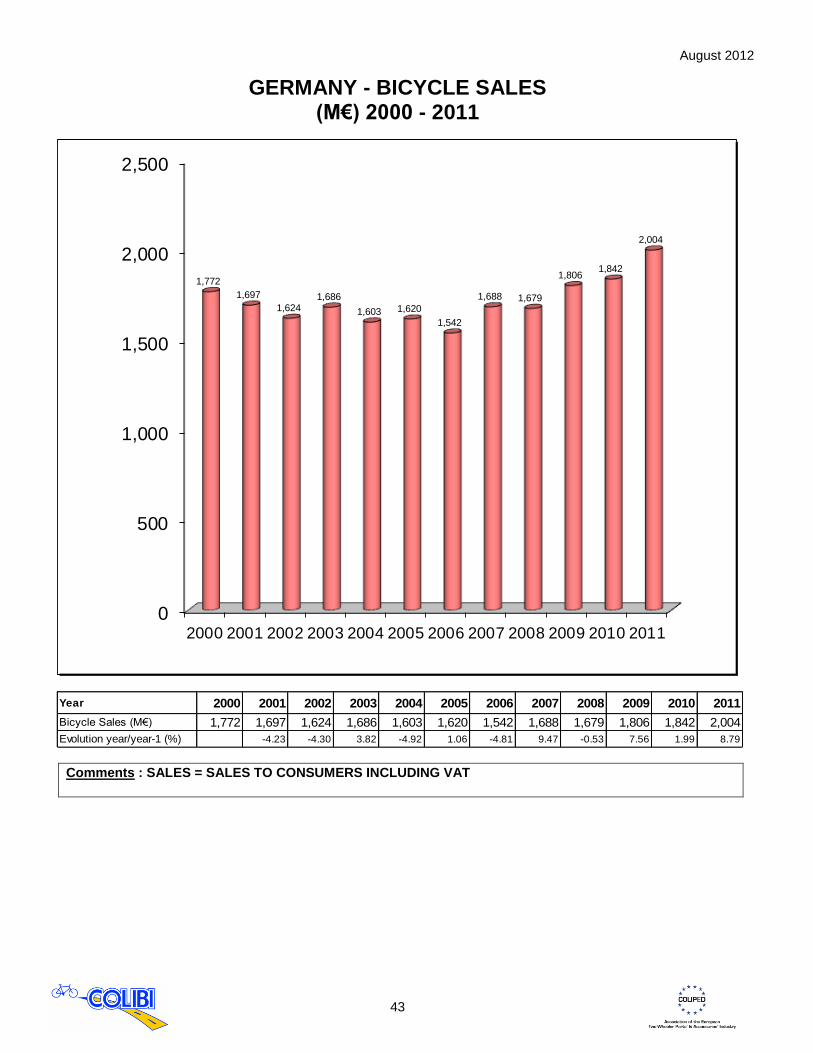
43
GERMANY - BICYCLE SALES (M€) 2000 - 2011
0
500
1,000
1,500
2,000
2,500
2000 2001 2002 2003 2004 2005 2006 2007 2008 2009 2010 2011
1,772
1,697
1,6241,686
1,603 1,620
1,542
1,688 1,679
1,8061,842
2,004
Year 2000 2001 2002 2003 2004 2005 2006 2007 2008 2009 2010 2011
Bicycle Sales (M€) 1,772 1,697 1,624 1,686 1,603 1,620 1,542 1,688 1,679 1,806 1,842 2,004
Evolution year/year-1 (%) -4.23 -4.30 3.82 -4.92 1.06 -4.81 9.47 -0.53 7.56 1.99 8.79
Comments : SALES = SALES TO CONSUMERS INCLUDING VAT

August 2012
44
GERMANY - PARTS & ACCESSORIES PRODUCTION (M€) 2000 - 2011
Year 2000 2001 2002 2003 2004 2005 2006 2007 2008 2009 2010 2011
P & A Production (M€) 199 179 171 165 163 152 161 186 191 180 183 210
Evolution year/year-1 (%) -10.05 -4.47 -3.51 -1.21 -6.75 5.92 15.53 2.69 -5.76 1.67 14.75
Comments : VALUES EXCLUDING VAT

August 2012
45
GERMANY - BICYCLE EMPLOYMENT 2000 - 2011
0
1,000
2,000
3,000
4,000
5,000
6,000
2000 2001 2002 2003 2004 2005 2006 2007 2008 2009 2010 2011
5,050
4,700
4,450 4,4504,250
4,150 4,1003,900
3,7003,550 3,550
3,650
0
200
400
600
800
1,000
1,200
2000 2001 2002 2003 2004 2005 2006 2007 2008 2009 2010 2011
950 950 950 950 950 950
1,1001,1001,1001,1001,100
1,200Parts & Accessories Employment
Year 2000 2001 2002 2003 2004 2005 2006 2007 2008 2009 2010 2011
Bicycle Employment 4,100 3,750 3,500 3,500 3,300 3,200 3,000 2,800 2,600 2,450 2,450 2,450
P & A Employment 950 950 950 950 950 950 1,100 1,100 1,100 1,100 1,100 1,200
Total 5,050 4,700 4,450 4,450 4,250 4,150 4,100 3,900 3,700 3,550 3,550 3,650

August 2012
46
Great Britain
August 2012
47
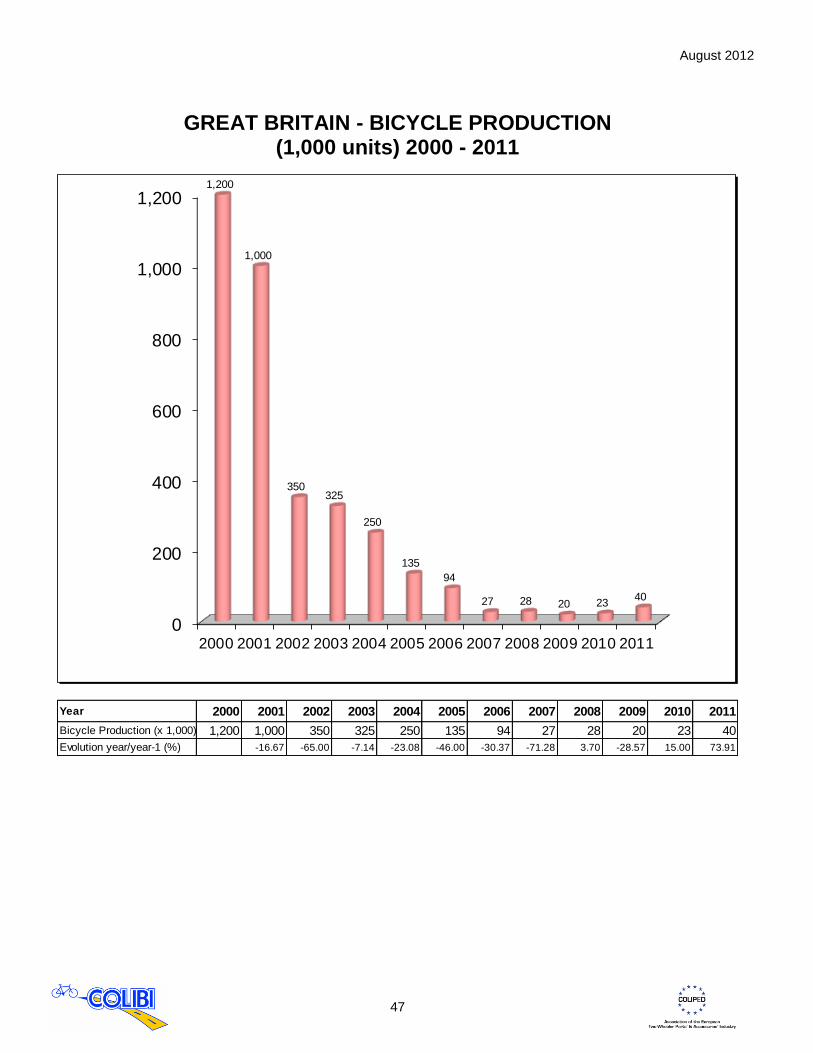
GREAT BRITAIN - BICYCLE PRODUCTION (1,000 units) 2000 - 2011
0
200
400
600
800
1,000
1,200
2000 2001 2002 2003 2004 2005 2006 2007 2008 2009 2010 2011
1,200
1,000
350325
250
135
94
27 28 20 2340
Year 2000 2001 2002 2003 2004 2005 2006 2007 2008 2009 2010 2011
Bicycle Production (x 1,000) 1,200 1,000 350 325 250 135 94 27 28 20 23 40
Evolution year/year-1 (%) -16.67 -65.00 -7.14 -23.08 -46.00 -30.37 -71.28 3.70 -28.57 15.00 73.91

August 2012
48
GREAT BRITAIN - BICYCLE SALES (1,000 units) 2000 - 2011
0
500
1,000
1,500
2,000
2,500
3,000
3,500
4,000
2000 2001 2002 2003 2004 2005 2006 2007 2008 2009 2010 2011
2,3002,400
2,300
3,727
3,905
3,800
3,920
3,771
3,3113,400
3,6403,580
Year 2000 2001 2002 2003 2004 2005 2006 2007 2008 2009 2010 2011
Bicycle Sales (x 1,000) 2,300 2,400 2,300 3,727 3,905 3,800 3,920 3,771 3,311 3,400 3,640 3,580
Evolution year/year-1 (%) 4.35 -4.17 62.04 4.78 -2.69 3.16 -3.80 -12.20 2.69 7.06 -1.65
Comments : SALES = SALES TO CONSUMERS

August 2012
49
GREAT BRITAIN - BICYCLE SALES (M€) 2000 - 2011
0
200
400
600
800
1,000
1,200
2003 2004 2005 2006 2007 2008 2009 2010 2011
600
708 695
800
725
834 839
1,1701,151
Year 2000 2001 2002 2003 2004 2005 2006 2007 2008 2009 2010 2011
Bicycle Sales (M€) 430 380 320 600 708 695 800 725 834 839 1,170 1,151
Evolution year/year-1 (%) -11.63 -15.79 87.50 18.00 -1.84 15.11 -9.38 15.03 0.60 39.45 -1.62
Comments : SALES = SALES TO CONSUMERS INCLUDING VAT

August 2012
50
GREAT BRITAIN - PARTS & ACCESSORIES PRODUCTION (M€) 2000 - 2011
0
5
10
15
20
25
30
35
2000 2001 2002 2003 2004 2005 2006 2007 2008 2009 2010 2011
15 15 15
1112 12
15 15
17 17
3031
Year 2000 2001 2002 2003 2004 2005 2006 2007 2008 2009 2010 2011
P & A Production (M€) 15 15 15 11 12 12 15 15 17 17 30 31
Evolution year/year-1 (%) 0.00 0.00 -26.67 9.09 0.00 25.00 0.00 13.33 0.00 76.47 3.33
Comments : VALUES EXCLUDING VAT
August 2012
51
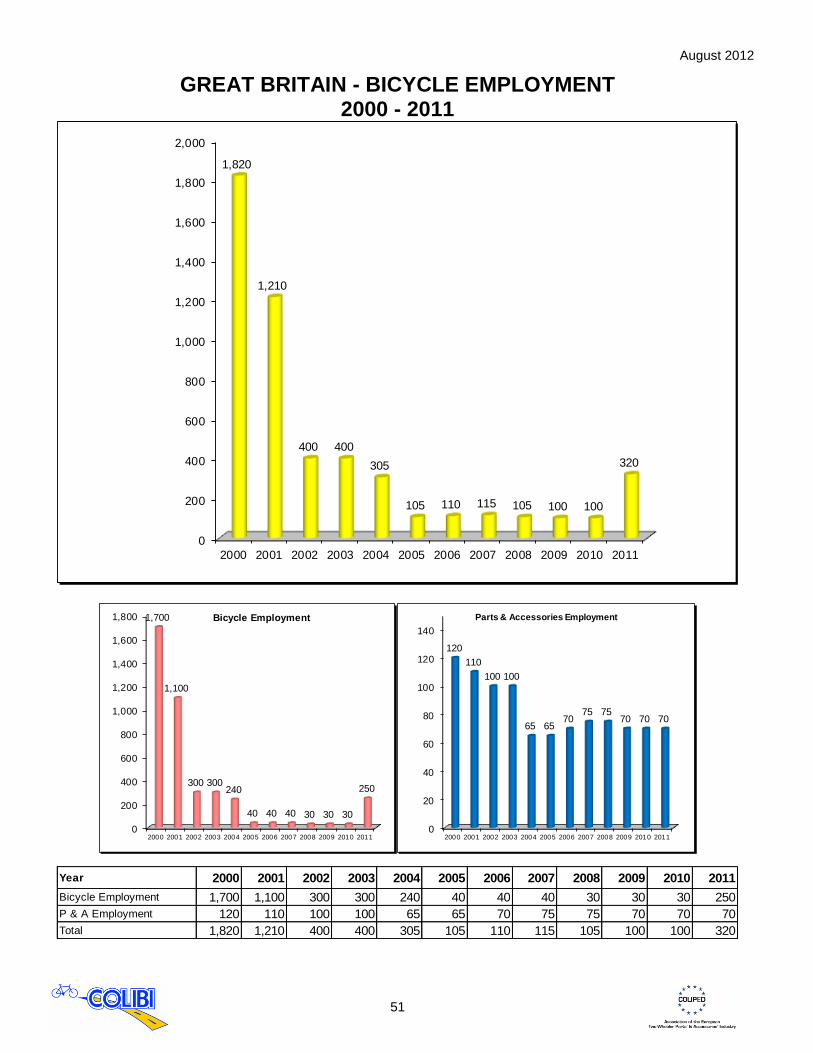
GREAT BRITAIN - BICYCLE EMPLOYMENT 2000 - 2011
0
200
400
600
800
1,000
1,200
1,400
1,600
1,800
2,000
2000 2001 2002 2003 2004 2005 2006 2007 2008 2009 2010 2011
1,820
1,210
400 400
305
105 110 115 105 100 100
320
0
200
400
600
800
1,000
1,200
1,400
1,600
1,800
2000 2001 2002 2003 2004 2005 2006 2007 2008 2009 2010 2011
1,700
1,100
300 300240
40 40 40 30 30 30
250
Bicycle Employment
0
20
40
60
80
100
120
140
2000 2001 2002 2003 2004 2005 2006 2007 2008 2009 2010 2011
120
110
100 100
65 6570
75 7570 70 70
Parts & Accessories Employment
Year 2000 2001 2002 2003 2004 2005 2006 2007 2008 2009 2010 2011
Bicycle Employment 1,700 1,100 300 300 240 40 40 40 30 30 30 250
P & A Employment 120 110 100 100 65 65 70 75 75 70 70 70
Total 1,820 1,210 400 400 305 105 110 115 105 100 100 320

August 2012
52
Italy

August 2012
53
ITALY - BICYCLE PRODUCTION (1,000 units) 2000 - 2011
0
500
1,000
1,500
2,000
2,500
3,000
3,500
2000 2001 2002 2003 2004 2005 2006 2007 2008 2009 2010 2011
3,250
2,650
2,350
2,5502,600
2,400 2,4182,520
2,380
2,5852,489
2,310
Year 2000 2001 2002 2003 2004 2005 2006 2007 2008 2009 2010 2011
Bicycle Production (x 1,000) 3,250 2,650 2,350 2,550 2,600 2,400 2,418 2,520 2,380 2,585 2,489 2,310
Evolution year/year-1 (%) -18.46 -11.32 8.51 1.96 -7.69 0.75 4.22 -5.56 8.61 -3.71 -7.19

August 2012
54
ITALY - BICYCLE SALES (1,000 units) 2000 - 2011
0
200
400
600
800
1,000
1,200
1,400
1,600
1,800
2,000
2000 2001 2002 2003 2004 2005 2006 2007 2008 2009 2010 2011
1,7221,684
1,3841,418
1,666
1,877
1,943
1,998
1,780
1,927
1,7711,750
Year 2000 2001 2002 2003 2004 2005 2006 2007 2008 2009 2010 2011
Bicycle Sales (x 1,000) 1,722 1,684 1,384 1,418 1,666 1,877 1,943 1,998 1,780 1,927 1,771 1,750
Evolution year/year-1 (%) -2.21 -17.81 2.46 17.49 12.67 3.52 2.83 -10.91 8.26 -8.10 -1.19
Comments : SALES = SALES TO CONSUMERS

August 2012
55
ITALY - BICYCLE SALES (M€) 2000 - 2011
0
100
200
300
400
500
600
2000 2001 2002 2003 2004 2005 2006 2007 2008 2009 2010 2011
520
442
302 306
331
360375
478
516
539
460 455
Year 2000 2001 2002 2003 2004 2005 2006 2007 2008 2009 2010 2011
Bicycle Sales (M€) 520 442 302 306 331 360 375 478 516 539 460 455
Evolution year/year-1 (%) -15.00 -31.67 1.32 8.17 8.76 4.17 27.47 7.95 4.46 -14.66 -1.09
Comments : SALES = SALES TO CONSUMERS INCLUDING VAT

August 2012
56
ITALY - PARTS & ACCESSORIES PRODUCTION (M€) 2000 - 2011
0
100
200
300
400
500
600
700
2000 2001 2002 2003 2004 2005 2006 2007 2008 2009 2010 2011
560
594575
561 560 555 550
610
559
466
442
420
Year 2000 2001 2002 2003 2004 2005 2006 2007 2008 2009 2010 2011
P & A Production (M€) 560 594 575 561 560 555 550 610 559 466 442 420
Evolution year/year-1 (%) 6.07 -3.20 -2.43 -0.18 -0.89 -0.90 10.91 -8.36 -16.64 -5.15 -4.98
Comments : VALUES EXCLUDING VAT

August 2012
57
ITALY - BICYCLE EMPLOYMENT 2000 - 2011
0
1,000
2,000
3,000
4,000
5,000
6,000
7,000
2000 2001 2002 2003 2004 2005 2006 2007 2008 2009 2010 2011
6,200
5,520
5,0805,240
5,030
4,3204,150
3,9003,740
3,6203,450
3,174
0
1,000
2,000
3,000
4,000
5,000
6,000
7,000
2000 2001 2002 2003 2004 2005 2006 2007 2008 2009 2010 2011
6,200
5,520
5,0805,240
5,030
4,3204,150
3,9003,740
3,6203,450
3,174
Bicycle Employment
0
500
1,000
1,500
2,000
2,500
3,000
3,500
4,000
2000 2001 2002 2003 2004 2005 2006 2007 2008 2009 2010 2011
3,600
3,400
3,200 3,200
2,950
2,400
2,200
2,0001,900
1,800 1,750
1,600
Parts & Accessories Employment
Year 2000 2001 2002 2003 2004 2005 2006 2007 2008 2009 2010 2011
Bicycle Employment 2,600 2,120 1,880 2,040 2,080 1,920 1,950 1,900 1,840 1,820 1,700 1,574
P & A Employment 3,600 3,400 3,200 3,200 2,950 2,400 2,200 2,000 1,900 1,800 1,750 1,600
Total 6,200 5,520 5,080 5,240 5,030 4,320 4,150 3,900 3,740 3,620 3,450 3,174
August 2012
58
The Netherlands

August 2012
59
BICYCLE MARKET IN THE NETHERLANDS 2011
The Dutch are still cycling a lot. In 2011, more than 1,171,000 new bicycles have been sold. Of course the economic crisis and a decrease of consumer trust have influenced sales. Nevertheless, only 3.6% less bicycles were sold in 2011, compared to 2010. The decrease in turnover was 1.3%. Consumers were willing to spend more money on a new bike, as quality was an important aspect when purchasing a bicycle. The average price of a new bicycle is 746.00 Euro. The average price of a new bicycle bought at the professional retailer has increased by 4.4% to 960.00 Euro. The EPAC is still growing in popularity. This kind of bicycle shows an increase in volume of 7%, which means that 178,000 EPACs were sold in 2011. The market share in numbers is 15%. In terms of turnover, the EPAC has a market share of 39%. Consumers gain knowledge of this type of transport and they want solid advice, service and guarantee. On average, consumers spent 1,918.00 Euro when buying a new EPAC. All the other segments have shown a decrease. In numbers, the city bike still has the highest market share with 55%. In 2011, 69% of the purchases have been done at the IBD (independent bicycle dealer). Compared with 2010, this is a slight decrease of 2%.
Bicycle market in The Netherlands - 2011
Sales of new bicycles by category (x 1,000) 2010 2011 % +/-
Total 1.215 1.171 -3.6
City bike 655 640 -2.4
Hybrid / tracking bike 118 107 -9.5
EPAC 166 178 7.0
Children / Juvenile 164 152 -7.4
Other 111 95 -14.8
Market share by category (in %) 2010 2011 pnt +/-
Total 100. 00 100.00
City bike 53.90 54.60 0.7
Hybrid / tracking bike 9.70 9.10 -0.6
EPAC 13.70 15.20 1.5
Children / Juvenile 13.50 13.00 -0.5
Other 9.10 8.10 -1.1
Average price by category (in €) 2010 2011 % +/-
Total 728 746 2.4
City bike 547 541 -1.2
Hybrid / tracking bike 797 836 4.8
EPAC 1923 1918 -0.2
Children / Juvenile 206 200 -2.8
Other 704 702 -0.3

August 2012
60

August 2012
61

August 2012
62
Mobility in the Netherlands by bicycle and by motive – 2010
Distance travelled per displacement
Distance pp per
day
Travel duration per displacement
Travel duration pp
per day Motives km km minutes minutes
To and from work 4.57 0.51 18.28 2.04 Business visits 4.17 0.02 19.63 0.10 Services/personal care 2.88 0.05 14.27 0.27 Shopping 2.18 0.36 12.19 1.99 Education/Course 3.18 0.42 14.94 1.97 Visits 2.80 0.20 13.72 0.96 Sport and recreation 3.79 0.48 19.01 2.41 Walking 11.81 0.20 67.38 1.14 Other motives 2.44 0.12 12.58 0.60
Total 3.40 2.35 16.58 11.49
Source: CBS
Number of domestic cycling holidays
2008/2009 2009/2010 2010/2011
Number of domestic cycling holidays 1,056,000 983,000 987,000 % of the total of domestic holidays 31% 31% 30%
Source: Fietsplatform
**********

August 2012
63
THE NETHERLANDS - BICYCLE PRODUCTION (1,000 units) 2000 - 2011
0
200
400
600
800
1,000
1,200
2000 2001 2002 2003 2004 2005 2006 2007 2008 2009 2010 2011
1,159
1,0461,082
1,045
882 894
967 972
1,129
1,200 1,200 1,200
Year 2000 2001 2002 2003 2004 2005 2006 2007 2008 2009 2010 2011
Bicycle Production (x 1,000) 1,159 1,046 1,082 1,045 882 894 967 972 1,129 1,200 1,200 1,200
Evolution year/year-1 (%) -9.75 3.44 -3.42 -15.60 1.36 8.17 0.52 16.15 6.29 0.00 0.00

August 2012
64
THE NETHERLANDS - BICYCLE SALES (1,000 units) 2000 - 2011
0
200
400
600
800
1,000
1,200
1,400
1,600
2000 2001 2002 2003 2004 2005 2006 2007 2008 2009 2010 2011
1,517
1,365
1,324 1,324
1,250 1,239
1,323
1,400 1,388
1,281
1,213
1,171
Year 2000 2001 2002 2003 2004 2005 2006 2007 2008 2009 2010 2011
Bicycle Sales (x 1,000) 1,517 1,365 1,324 1,324 1,250 1,239 1,323 1,400 1,388 1,281 1,213 1,171
Evolution year/year-1 (%) -10.02 -3.00 0.00 -5.59 -0.88 6.78 5.82 -0.86 -7.71 -5.31 -3.46
Comments : SALES = SALES TO CONSUMERS
August 2012
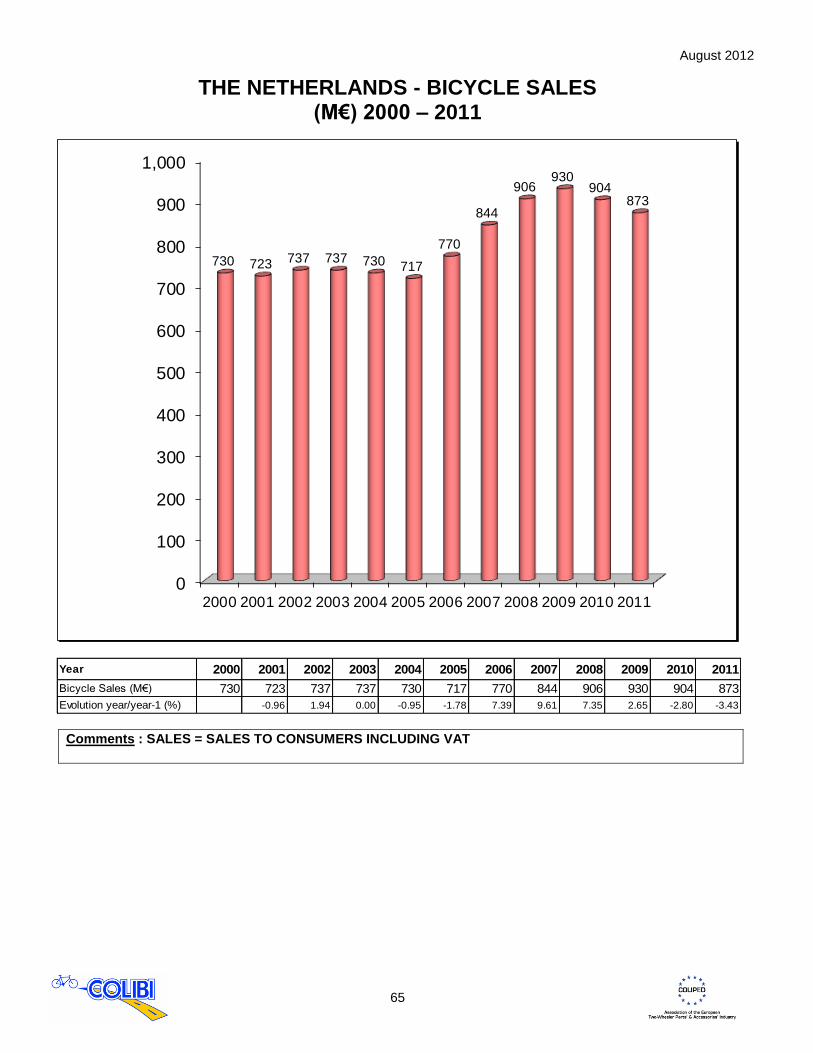
65
THE NETHERLANDS - BICYCLE SALES (M€) 2000 – 2011
0
100
200
300
400
500
600
700
800
900
1,000
2000 2001 2002 2003 2004 2005 2006 2007 2008 2009 2010 2011
730 723 737 737 730 717
770
844
906930
904873
Year 2000 2001 2002 2003 2004 2005 2006 2007 2008 2009 2010 2011
Bicycle Sales (M€) 730 723 737 737 730 717 770 844 906 930 904 873
Evolution year/year-1 (%) -0.96 1.94 0.00 -0.95 -1.78 7.39 9.61 7.35 2.65 -2.80 -3.43
Comments : SALES = SALES TO CONSUMERS INCLUDING VAT
August 2012
66
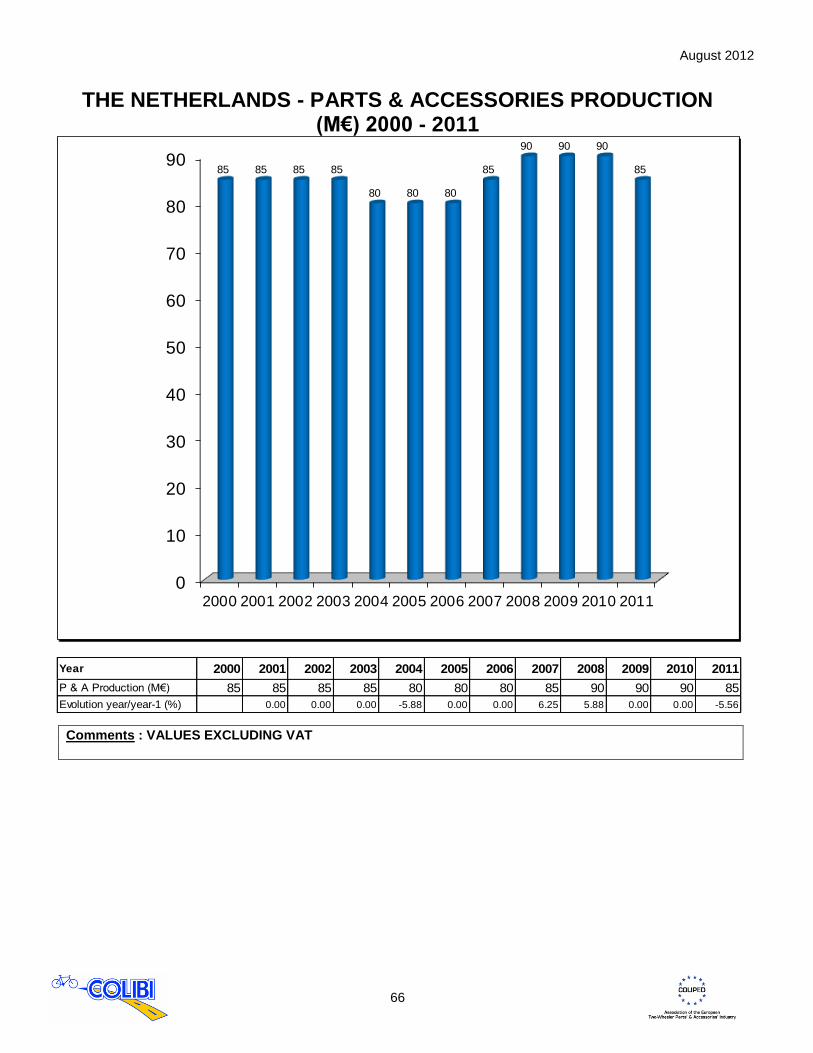
THE NETHERLANDS - PARTS & ACCESSORIES PRODUCTION
(M€) 2000 - 2011
0
10
20
30
40
50
60
70
80
90
2000 2001 2002 2003 2004 2005 2006 2007 2008 2009 2010 2011
85 85 85 85
80 80 80
85
90 90 90
85
Year 2000 2001 2002 2003 2004 2005 2006 2007 2008 2009 2010 2011
P & A Production (M€) 85 85 85 85 80 80 80 85 90 90 90 85
Evolution year/year-1 (%) 0.00 0.00 0.00 -5.88 0.00 0.00 6.25 5.88 0.00 0.00 -5.56
Comments : VALUES EXCLUDING VAT

August 2012
67
THE NETHERLANDS - BICYCLE EMPLOYMENT 2000 - 2011
0
500
1,000
1,500
2,000
2,500
3,000
2000 2001 2002 2003 2004 2005 2006 2007 2008 2009 2010 2011
2,2642,220 2,232 2,232 2,200
2,1002,000
2,550 2,550 2,550
2,400
2,264
0
200
400
600
800
1,000
1,200
1,400
1,600
1,800
2,000
2000 2001 2002 2003 2004 2005 2006 2007 2008 2009 2010 2011
1,6501,612 1,630 1,630
1,600
1,500
1,400
1,950 1,950 1,950
1,850
1,764
Bicycle Employment
0
100
200
300
400
500
600
700
200020012002200320042005200620072008200920102011
614 608 602 602 600 600 600 600 600 600
550
500
Parts & Accessories Employment
Year 2000 2001 2002 2003 2004 2005 2006 2007 2008 2009 2010 2011
Bicycle Employment 1,650 1,612 1,630 1,630 1,600 1,500 1,400 1,950 1,950 1,950 1,850 1,764
P & A Employment 614 608 602 602 600 600 600 600 600 600 550 500
Total 2,264 2,220 2,232 2,232 2,200 2,100 2,000 2,550 2,550 2,550 2,400 2,264