europe: energy: oil & gas - e&p
TRANSCRIPT
May 30, 2011
Europe: Energy: Oil & Gas - E&P
Equity Research
5 themes and 17 companies to generate alpha in an industry in transformation
E&P - seek exposure to five key themes
We highlight five themes that we believe will
drive share price performance in the E&P sector;
high-impact, frontier exploration; unconventional
gas; unconventional liquids; explorers with a
strong core value; and NOC-driven M&A. We
highlight 17 companies that we believe provide
the most attractive exposure to these themes.
Frontier exploration increasingly attractive
We highlight five E&P stocks with high re-rating
potential from exploration in new basins. We
expect the majors and NOCs to show increasing
appetite for these types of assets after a decade of
poor exploration performance.
Unconventional gas in deficit markets
Increasing gas prices and new technical advances
benefit unconventional gas producers in countries
fighting for less dependency on foreign gas
imports. Stocks we believe will benefit from this
theme include Conviction Buy Aurelian.
Unconventional liquids
Technological progress being made in established
unconventional liquid/oil shale plays in the US
could be levered to new basins and countries; we
highlight two stocks that should benefit from this
trend, including Conviction Buy Panoro.
Balanced exploration
We identify five stocks with high-impact
exploration supported by core values that mitigate
downside risk of exploration failure. Bowleven
and Rockhopper (Conviction Buys) screen well.
NOC-driven M&A
We see NOCs as the most price-insensitive buyers
and believe that high materiality and exposure to
new technologies drive such activity.
Rating changes
We upgrade Noreco and Maurel and Prom to Buy
(from Neutral). We upgrade DNO and Encore Oil
to Neutral (Sell). We downgrade Salamander, Det
Norske and Coastal Energy to Neutral (Buy), and
downgrade Premier to Sell (Neutral).
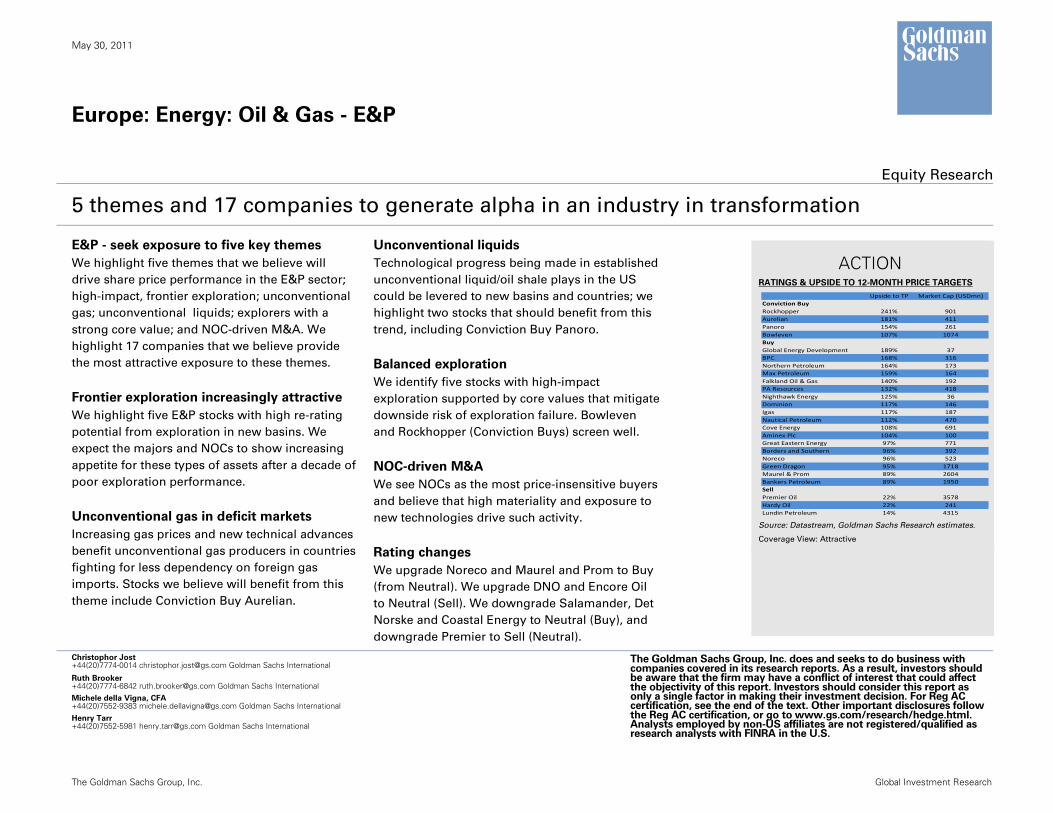
ACTION
RATINGS & UPSIDE TO 12-MONTH PRICE TARGETS
Source: Datastream, Goldman Sachs Research estimates.
Coverage View: Attractive
Christophor Jost +44(20)7774-0014 [email protected] Goldman Sachs International
The Goldman Sachs Group, Inc. does and seeks to do business with companies covered in its research reports. As a result, investors should be aware that the firm may have a conflict of interest that could affect the objectivity of this report. Investors should consider this report as only a single factor in making their investment decision. For Reg AC certification, see the end of the text. Other important disclosures follow the Reg AC certification, or go to www.gs.com/research/hedge.html. Analysts employed by non-US affiliates are not registered/qualified as research analysts with FINRA in the U.S.
Ruth Brooker +44(20)7774-6842 [email protected] Goldman Sachs International Michele della Vigna, CFA +44(20)7552-9383 [email protected] Goldman Sachs International
Henry Tarr +44(20)7552-5981 [email protected] Goldman Sachs International
The Goldman Sachs Group, Inc. Global Investment Research
Upside to TP Market Cap (USDmn)Conviction BuyRockhopper 241% 901Aurelian 181% 411Panoro 154% 261Bowleven 107% 1074BuyGlobal Energy Development 189% 37BPC 168% 316Northern Petroleum 164% 173Max Petroleum 159% 164Falkland Oil & Gas 140% 192PA Resources 132% 418Nighthawk Energy 125% 36Dominion 117% 146Igas 117% 187Nautical Petroleum 112% 470Cove Energy 108% 691Aminex Plc 104% 100Great Eastern Energy 97% 771Borders and Southern 96% 392Noreco 96% 523Green Dragon 95% 1718Maurel & Prom 89% 2604Bankers Petroleum 89% 1950SellPremier Oil 22% 3578Hardy Oil 22% 241Lundin Petroleum 14% 4315
May 30, 2011 Europe: Energy: Oil & Gas - E&P
Goldman Sachs Global Investment Research 2
Table of contents
Five themes to play in the E&P sector 3
Frontier exploration set to be a major theme in late 2011/early 2012. Industry appetite for frontier exploration provides additional benefits for explorers. 5
Rising gas prices, energy security and production ramp-ups to drive outperformance in unconventional gas 10
Unconventional liquids – de-risking of assets and potential M&A the key driver 15
Free exploration options remain a compelling investment case 18
M&A – Materiality and technical access a further potential driver of NOC activity 19
Thematic summary for E&P universe 21
Oil price sensitivity and the E&Ps; higher fiscal risk, but lower commercial thresholds; maintaining US$100/bl in our valuations 22
E&P screens; updating target prices and ratings 27
Medium-term exploration & balanced explorers still top performing exploration screens 34
Portfolio update for the E&Ps 38
North Sea performance weak on tax change; Falklands and Kurdistan remain weak 40
Maurel & Prom (MAUP.PA): Core value and ‘free’ exploration exposure; up to Buy 43
Noreco (NOR.OL): Core value combined with ‘free’ Norwegian exploration option; Buy 44
Premier Oil (PMO.L): Company’s strengths already in the price, down to Sell. 45
DNO international (DNO.OL): Underperformance & political de-risking of KRG, Neutral 46
Salamander Energy (SMDR.L): Downgrading to Neutral after recent outperformance 48
Det Norske (DETNOR.OL): Downgrading to Neutral following outperformance 50
Coastal Energy (CEO.L): Removing from Buy List, better upside elsewhere; Neutral 52
Encore Oil (EO.L): Underperformance and Cladhan reaction overdone; up to Neutral 54
Prices in this report are as of the close of May 25, 2011 unless stated otherwise.
May 30, 2011 Europe: Energy: Oil & Gas - E&P
Goldman Sachs Global Investment Research 3
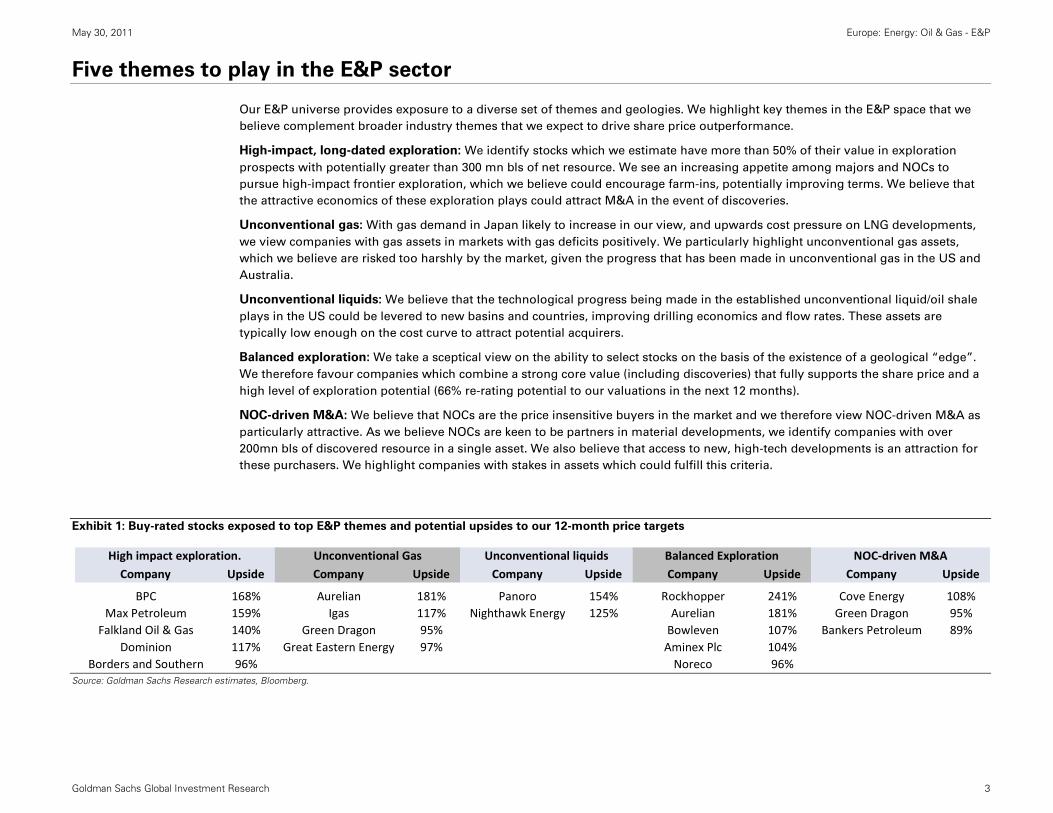
Five themes to play in the E&P sector
Our E&P universe provides exposure to a diverse set of themes and geologies. We highlight key themes in the E&P space that we
believe complement broader industry themes that we expect to drive share price outperformance.
High-impact, long-dated exploration: We identify stocks which we estimate have more than 50% of their value in exploration
prospects with potentially greater than 300 mn bls of net resource. We see an increasing appetite among majors and NOCs to
pursue high-impact frontier exploration, which we believe could encourage farm-ins, potentially improving terms. We believe that
the attractive economics of these exploration plays could attract M&A in the event of discoveries.
Unconventional gas: With gas demand in Japan likely to increase in our view, and upwards cost pressure on LNG developments,
we view companies with gas assets in markets with gas deficits positively. We particularly highlight unconventional gas assets,
which we believe are risked too harshly by the market, given the progress that has been made in unconventional gas in the US and
Australia.
Unconventional liquids: We believe that the technological progress being made in the established unconventional liquid/oil shale
plays in the US could be levered to new basins and countries, improving drilling economics and flow rates. These assets are
typically low enough on the cost curve to attract potential acquirers.
Balanced exploration: We take a sceptical view on the ability to select stocks on the basis of the existence of a geological “edge”.
We therefore favour companies which combine a strong core value (including discoveries) that fully supports the share price and a
high level of exploration potential (66% re-rating potential to our valuations in the next 12 months).
NOC-driven M&A: We believe that NOCs are the price insensitive buyers in the market and we therefore view NOC-driven M&A as
particularly attractive. As we believe NOCs are keen to be partners in material developments, we identify companies with over
200mn bls of discovered resource in a single asset. We also believe that access to new, high-tech developments is an attraction for
these purchasers. We highlight companies with stakes in assets which could fulfill this criteria.
Exhibit 1: Buy-rated stocks exposed to top E&P themes and potential upsides to our 12-month price targets
Source: Goldman Sachs Research estimates, Bloomberg.
Company Upside Company Upside Company Upside Company Upside Company Upside
BPC 168% Aurelian 181% Panoro 154% Rockhopper 241% Cove Energy 108%Max Petroleum 159% Igas 117% Nighthawk Energy 125% Aurelian 181% Green Dragon 95%
Falkland Oil & Gas 140% Green Dragon 95% Bowleven 107% Bankers Petroleum 89%Dominion 117% Great Eastern Energy 97% Aminex Plc 104%
Borders and Southern 96% Noreco 96%
Balanced Exploration NOC‐driven M&AHigh impact exploration. Unconventional Gas Unconventional liquids
May 30, 2011 Europe: Energy: Oil & Gas - E&P
Goldman Sachs Global Investment Research 4
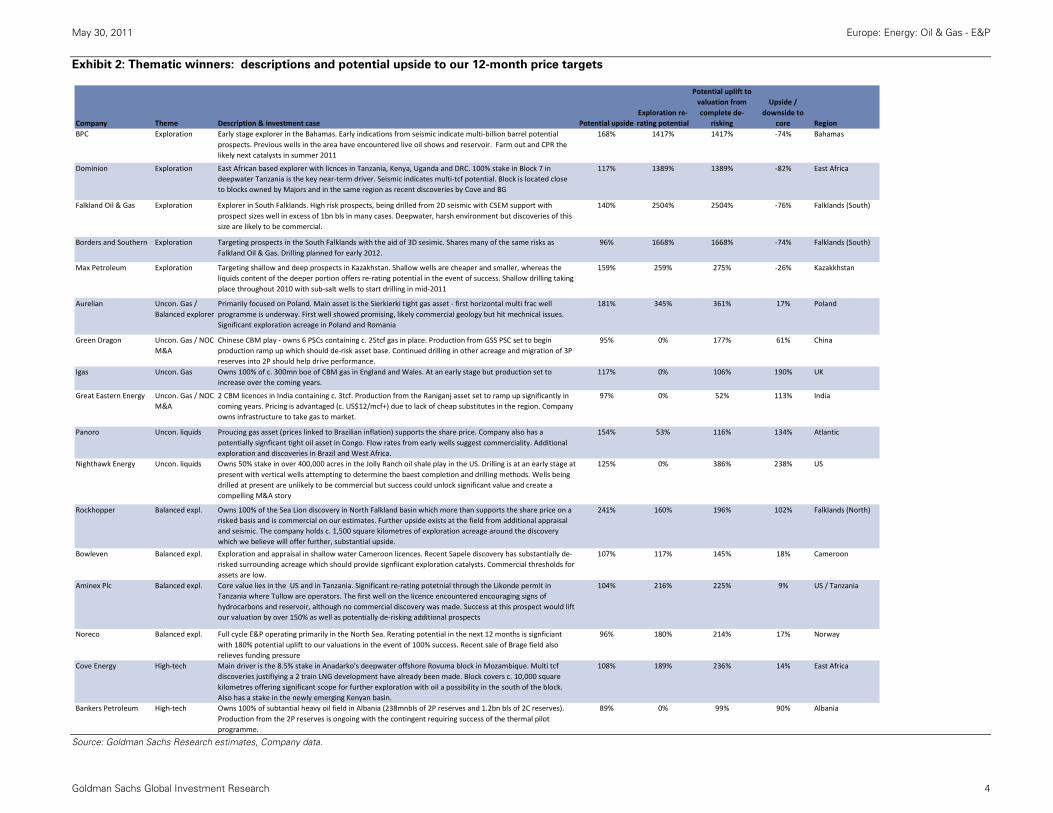
Exhibit 2: Thematic winners: descriptions and potential upside to our 12-month price targets
Source: Goldman Sachs Research estimates, Company data.
Company Theme Description & investment case Potential upsideExploration re‐rating potential
Potential uplift to valuation from complete de‐
risking
Upside / downside to
core RegionBPC Exploration Early stage explorer in the Bahamas. Early indications from seismic indicate multi‐billion barrel potential
prospects. Previous wells in the area have encountered live oil shows and reservoir. Farm out and CPR the likely next catalysts in summer 2011
168% 1417% 1417% ‐74% Bahamas
Dominion Exploration East African based explorer with licnces in Tanzania, Kenya, Uganda and DRC. 100% stake in Block 7 in deepwater Tanzania is the key near‐term driver. Seismic indicates multi‐tcf potential. Block is located close to blocks owned by Majors and in the same region as recent discoveries by Cove and BG
117% 1389% 1389% ‐82% East Africa
Falkland Oil & Gas Exploration Explorer in South Falklands. High risk prospects, being drilled from 2D seismic with CSEM support with prospect sizes well in excess of 1bn bls in many cases. Deepwater, harsh environment but discoveries of this size are likely to be commercial.
140% 2504% 2504% ‐76% Falklands (South)
Borders and Southern Exploration Targeting prospects in the South Falklands with the aid of 3D sesimic. Shares many of the same risks as Falkland Oil & Gas. Drilling planned for early 2012.
96% 1668% 1668% ‐74% Falklands (South)
Max Petroleum Exploration Targeting shallow and deep prospects in Kazakhstan. Shallow wells are cheaper and smaller, whereas the liquids content of the deeper portion offers re‐rating potential in the event of success. Shallow drilling taking place throughout 2010 with sub‐salt wells to start drilling in mid‐2011
159% 259% 275% ‐26% Kazakkhstan
Aurelian Uncon. Gas / Balanced explorer
Primarily focused on Poland. Main asset is the Sierkierki tight gas asset ‐ first horizontal multi frac well programme is underway. First well showed promising, likely commercial geology but hit mechnical issues. Significant exploration acreage in Poland and Romania
181% 345% 361% 17% Poland
Green Dragon Uncon. Gas / NOC M&A
Chinese CBM play ‐ owns 6 PSCs containing c. 25tcf gas in place. Production from GSS PSC set to begin production ramp up which should de‐risk asset base. Continued drilling in other acreage and migration of 3P reserves into 2P should help drive performance.
95% 0% 177% 61% China
Igas Uncon. Gas Owns 100% of c. 300mn boe of CBM gas in England and Wales. At an early stage but production set to increase over the coming years.
117% 0% 106% 190% UK
Great Eastern Energy Uncon. Gas / NOC M&A
2 CBM licences in India containing c. 3tcf. Production from the Raniganj asset set to ramp up significantly in coming years. Pricing is advantaged (c. US$12/mcf+) due to lack of cheap substitutes in the region. Company owns infrastructure to take gas to market.
97% 0% 52% 113% India
Panoro Uncon. liquids Proucing gas asset (prices linked to Brazilian inflation) supports the share price. Company also has a potentially signficant tight oil asset in Congo. Flow rates from early wells suggest commerciality. Additional exploration and discoveries in Brazil and West Africa.
154% 53% 116% 134% Atlantic
Nighthawk Energy Uncon. liquids Owns 50% stake in over 400,000 acres in the Jolly Ranch oil shale play in the US. Drilling is at an early stage at present with vertical wells attempting to determine the baest completion and drilling methods. Wells being drilled at present are unlikely to be commercial but success could unlock significant value and create a compelling M&A story
125% 0% 386% 238% US
Rockhopper Balanced expl. Owns 100% of the Sea Lion discovery in North Falkland basin which more than supports the share price on a risked basis and is commercial on our estimates. Further upside exists at the field from additional appraisal and seismic. The company holds c. 1,500 square kilometres of exploration acreage around the discovery which we believe will offer further, substantial upside.
241% 160% 196% 102% Falklands (North)
Bowleven Balanced expl. Exploration and appraisal in shallow water Cameroon licences. Recent Sapele discovery has substantially de‐risked surrounding acreage which should provide signfiicant exploration catalysts. Commercial thresholds for assets are low.
107% 117% 145% 18% Cameroon
Aminex Plc Balanced expl. Core value lies in the US and in Tanzania. Significant re‐rating potetnial through the Likonde permit in Tanzania where Tullow are operators. The first well on the licence encountered encouraging signs of hydrocarbons and reservoir, although no commercial discovery was made. Success at this prospect would lift our valuation by over 150% as well as potentially de‐risking additional prospects
104% 216% 225% 9% US / Tanzania
Noreco Balanced expl. Full cycle E&P operating primarily in the North Sea. Rerating potential in the next 12 months is signficiant with 180% potential uplift to our valuations in the event of 100% success. Recent sale of Brage field also relieves funding pressure
96% 180% 214% 17% Norway
Cove Energy High‐tech Main driver is the 8.5% stake in Anadarko's deepwater offshore Rovuma block in Mozambique. Multi tcf discoveries justifiying a 2 train LNG development have already been made. Block covers c. 10,000 square kilometres offering significant scope for further exploration with oil a possibility in the south of the block. Also has a stake in the newly emerging Kenyan basin.
108% 189% 236% 14% East Africa
Bankers Petroleum High‐tech Owns 100% of subtantial heavy oil field in Albania (238mnbls of 2P reserves and 1.2bn bls of 2C reserves). Production from the 2P reserves is ongoing with the contingent requiring success of the thermal pilot programme.
89% 0% 99% 90% Albania
May 30, 2011 Europe: Energy: Oil & Gas - E&P
Goldman Sachs Global Investment Research 5
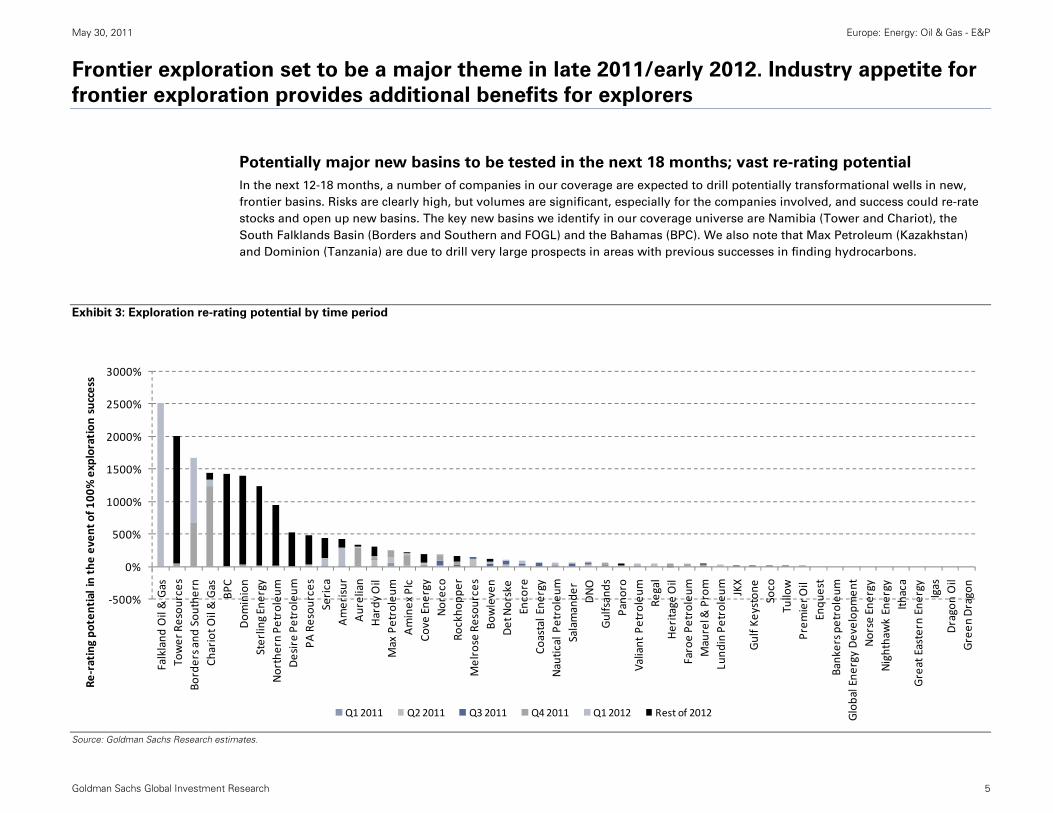
Frontier exploration set to be a major theme in late 2011/early 2012. Industry appetite for
frontier exploration provides additional benefits for explorers
Potentially major new basins to be tested in the next 18 months; vast re-rating potential
In the next 12-18 months, a number of companies in our coverage are expected to drill potentially transformational wells in new,
frontier basins. Risks are clearly high, but volumes are significant, especially for the companies involved, and success could re-rate
stocks and open up new basins. The key new basins we identify in our coverage universe are Namibia (Tower and Chariot), the
South Falklands Basin (Borders and Southern and FOGL) and the Bahamas (BPC). We also note that Max Petroleum (Kazakhstan)
and Dominion (Tanzania) are due to drill very large prospects in areas with previous successes in finding hydrocarbons.
Exhibit 3: Exploration re-rating potential by time period
Source: Goldman Sachs Research estimates.
‐500%
0%
500%
1000%
1500%
2000%
2500%
3000%
Falkland
Oil & Gas
Tower Resou
rces
Borders and
Sou
thern
Chariot O
il & Gas
BPC
Dom
inion
Sterling Energy
Northern Pe
troleu
mDesire Pe
troleu
mPA
Resou
rces
Serica
Amerisur
Aurelian
Hardy
Oil
Max Petroleum
Aminex
Plc
Cove
Ene
rgy
Noreco
Rockho
pper
Melrose Resou
rces
Bowleven
Det Norske
Encore
Coastal Ene
rgy
Nautical Petroleum
Salamande
r DNO
Gulfsands
Pano
roValiant Petroleum
Regal
Heritage
Oil
Faroe Pe
troleu
mMaurel &
Prom
Lund
in Petroleum JKX
Gulf K
eyston
eSoco
Tullow
Prem
ier O
il Enqu
est
Bankers p
etroleum
Global Ene
rgy Develop
men
tNorse Ene
rgy
Nighthawk Energy
Ithaca
Great Eastern Ene
rgy
Igas
Dragon Oil
Green
Dragon
Re‐rating po
tential in the even
t of 1
00% exploration
success
Q1 2011 Q2 2011 Q3 2011 Q4 2011 Q1 2012 Rest of 2012

May 30, 2011 Europe: Energy: Oil & Gas - E&P
Goldman Sachs Global Investment Research 6
High-impact explorers offer access to geographically diverse basins
The companies we have highlighted as providing exposure to this frontier, high-impact exploration theme are testing different
basins in a number of different regions of the world (Exhibit 5). While risks are high on these exploration wells, the re-rating
potential is substantial – we estimate average upside of almost 1,500% in the event of success for our winners.
Where appropriate, we assume farm-outs to provide funding for these potentially expensive, high-risk wells. While we assume that
farm-outs are typically dilutive from a valuation perspective, we believe that a likely increase in appetite from larger companies for
access to high-impact exploration should increase competition, thereby potentially allowing farm-outs to take place on attractive
terms, as well as providing additional credibility and additional clarity to the timing catalyst. Any such trend would be an upside risk
to our valuation of these companies.
Exhibit 4: High-impact explorer metrics and re-rating potential Assuming GS estimates of farm-outs where appropriate
Exhibit 5: High-impact explorers are testing a number of new basins High-impact explorers by location
Source: Goldman Sachs Research estimates.
Source: Company data.
Company Location of main activityMarket cap (US$mn)
Existing discovered reserves
Potential gross resource to be drilled in next 12
months
Potential gross resource to be drilled beyond 12 months
Total potential net resource Average CoS
Potential upflit to valuation in event
of successUpside to de‐
risked valuationFalkland Oil & Gas Falklands 192 0 3200 0 1920 4% 2504% 6682%Borders and Southern Falklands 392 0 2040 0 2040 5% 1668% 3599%BPC Bahamas 316 0 0 4305 1291 6% 1417% 3988%Dominion Tanzania 146 0 80 1641 745 13% 1389% 3292%Max Petroleum Kazakhstan 164 60 1262 0 1262 28% 259% 1324%
Average 242 12 1316 1189 1452 11% 1447% 3777%
Chariot Oil & Gas Namibia 612 0 5081 667 2663 9% 1441% 2842%Sterling Energy Cameroon, Madagascar 159 0 0 1950 1387 17% 1229% 1062%Tower Resources Namibia, Uganda 106 0 40 4366 675 9% 1997% 4177%Desire Petroleum Falklands 63 0 637 230 700 10% 611% 955%Hardy Oil India 241 0 1844 1147 299 40% 305% 517%
Average 236 0 1521 1672 1145 17% 1117% 1911%
Winners
Others
Bahamas Petroleum Company
Falkland Oil & Gas, Borders &Southern, Desire Petroleum
Max Petroleum
Dominion Petroleum
Chariot Oil & GasTower Resources
Hardy Oil & Gas
Sterling Energy
May 30, 2011 Europe: Energy: Oil & Gas - E&P
Goldman Sachs Global Investment Research 7
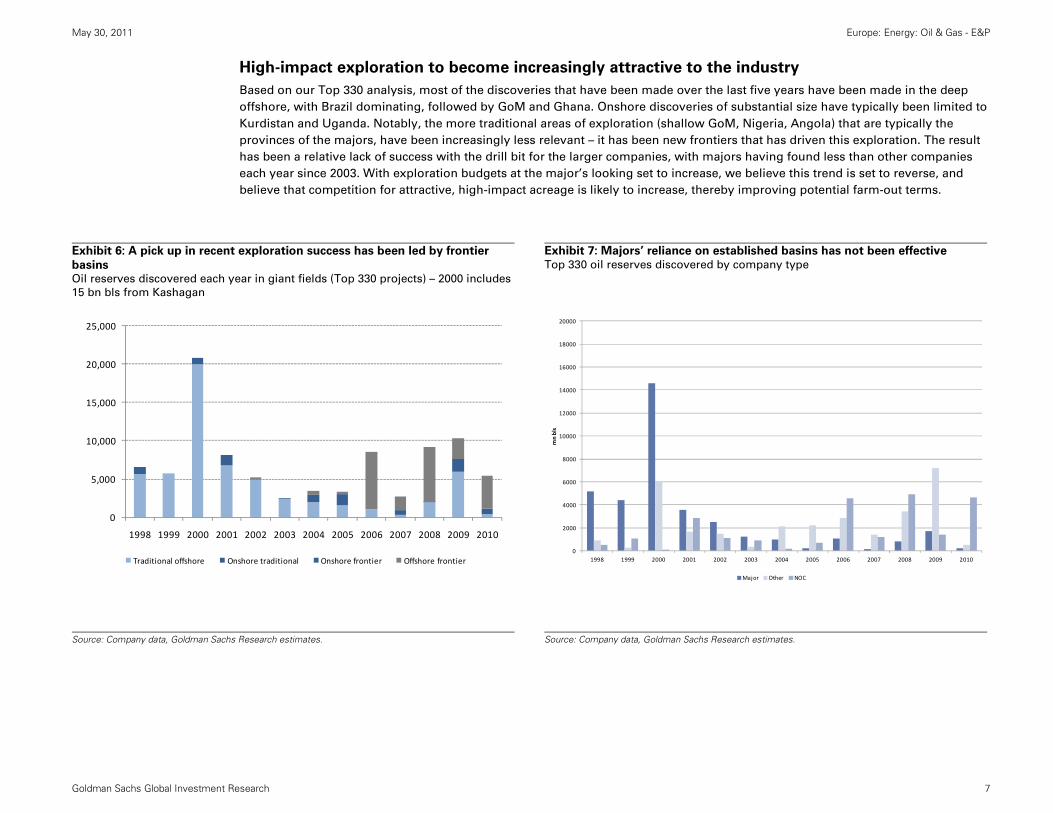
High-impact exploration to become increasingly attractive to the industry
Based on our Top 330 analysis, most of the discoveries that have been made over the last five years have been made in the deep
offshore, with Brazil dominating, followed by GoM and Ghana. Onshore discoveries of substantial size have typically been limited to
Kurdistan and Uganda. Notably, the more traditional areas of exploration (shallow GoM, Nigeria, Angola) that are typically the
provinces of the majors, have been increasingly less relevant – it has been new frontiers that has driven this exploration. The result
has been a relative lack of success with the drill bit for the larger companies, with majors having found less than other companies
each year since 2003. With exploration budgets at the major’s looking set to increase, we believe this trend is set to reverse, and
believe that competition for attractive, high-impact acreage is likely to increase, thereby improving potential farm-out terms.
Exhibit 6: A pick up in recent exploration success has been led by frontier
basins Oil reserves discovered each year in giant fields (Top 330 projects) – 2000 includes
15 bn bls from Kashagan
Exhibit 7: Majors’ reliance on established basins has not been effective Top 330 oil reserves discovered by company type
Source: Company data, Goldman Sachs Research estimates.
Source: Company data, Goldman Sachs Research estimates.
0
5,000
10,000
15,000
20,000
25,000
1998 1999 2000 2001 2002 2003 2004 2005 2006 2007 2008 2009 2010
Traditional offshore Onshore traditional Onshore frontier Offshore frontier0
2000
4000
6000
8000
10000
12000
14000
16000
18000
20000
1998 1999 2000 2001 2002 2003 2004 2005 2006 2007 2008 2009 2010mn bls
Major Other NOC

May 30, 2011 Europe: Energy: Oil & Gas - E&P
Goldman Sachs Global Investment Research 8
Frontier exploration is well placed on the cost curve – another incentive for the majors
We believe that aside from the potentially material volumes that reward frontier exploration, there are compelling economic reasons
supporting the attractiveness of frontier exploration - namely the position that these fields hold on the cost curve. On our oil cost
curve, we find that the majority of those projects (which break-even at low oil prices and generate significant returns) are fields that
have been discovered in frontier territories (i.e. Brazil, Ghana, Uganda, Vietnam).
We believe this will become increasingly important in the future: in the last year, with the addition of new discoveries in attractive,
frontier fiscal regimes, and the growing importance of unconventional liquids in the production mix, the breakeven cost required to
achieve production from our Top 330 universe has dropped substantially. As a result, portfolios located at the top of the cost curve
(heavy oil, deepwater Angola etc.) will become increasingly marginalized in our view. Consequently, we view exposure to low cost
assets as a positive and would expect the attractiveness of such assets to increase for majors looking to grow production in the
short to medium term.
We note that a risk to the value of frontier exploration is the tendency for advantageous fiscal regimes to eventually be renegotiated.
As a result, we believe that it is possible that economics in frontier areas may worsen at some point in the future, but we believe
that this is unlikely to happen until substantial levels of production have been achieved.
Exhibit 8: Frontier exploration sits low on the cost curve Frontier exploration shaded grey
Exhibit 9: The cost curve has shifted down since last year, marginalising
some majors’ portfolios Breakeven of non-producing oil assets: Top 330 vs. Top 280
Source: Company data, Goldman Sachs Research estimates.
Source: Company data, Goldman Sachs Research estimates.
20
30
40
50
60
70
80
90
100
0 2,000 4,000 6,000 8,000 10,000 12,000 14,000 16,000 18,000 20,000
Commercial breakeven
(US$/bl)
Cumulative peak oil production (kb/d)
Kashagan US$121/blPrirazlom US$110/blNasr US$109/bl
Novoportovskoye US$107.50/blYurubchenko‐Tahomskoye US$101.50/bl
Uganda, Blocks 1, 2 & 3
Franco
Waimea
Florim TweneboaTupi Northeast
TGTAruana
Shaikan
Guara South
Jubilee
Jidong Nanpu
Iara Surrounding Area
GuaraMKB Pipeline
Kizomba Satellites
IaraCalifornia Shale
Upper Zakum expansion
Lula & CernambiTempa Rossa
Abare WestAkri Bijeel
Caesar Tonga
Vesuvio
Block 15‐06
Granite WashGumusut
Eagle Ford
El Merk
Delaware Basin HorizontalPeregrino
Mars B
Egina
Carioca
Bonga SW Aparo
Block 18 West
Pazflor
FreedomAppomattox
Lucapa
Knotty Head
NabiyeKodiak
Wahoo
Umm al‐Lulu
Itaipu
Block 17 CLOVJack / St Malo
Clair Ridge
AmalShenandoah
VitoGrouse
Kirby
Usan
RosebankCarmon Creek
Leismer
Perdido
Bakken Shale
Kaskida
Buckskin
Narrows Lake
Big FootTiber
Block 32 Phase 1Block 31 SE
BosiBlock 31 NE Sunrise
Block 31 WestHebron
LuciusPike
Point Thomson liquids
Block 32 Phase 2Nsiko
Kearl Lake
Mariner BressayGoliatThickwood
Dover
Firebag
MacKay River Expansion
Waha (North Gialo & NC‐98)Greater Thornbury Area
Cascade & Chinook
Stones
Amal SteamPapa Terra
Lower ZakumMembro Siri
Al Ghubar
MTPS
Harweel
Ofon 2
Carabobo 1
BS‐4
Pearl GTL
Junin 5Ugnu
Fort HillsRusskoye
Northern LightsSuzunskoye & TagulskoyeJoslynSAS expansion
Frontier
‐
10
20
30
40
50
60
70
80
90
100
0 2,000 4,000 6,000 8,000 10,000 12,000 14,000 16,000 18,000 20,000
Breakeven (US$/bl)
Cumulative Peak Production (kbls/d)
Top 330Top 280
May 30, 2011 Europe: Energy: Oil & Gas - E&P
Goldman Sachs Global Investment Research 9
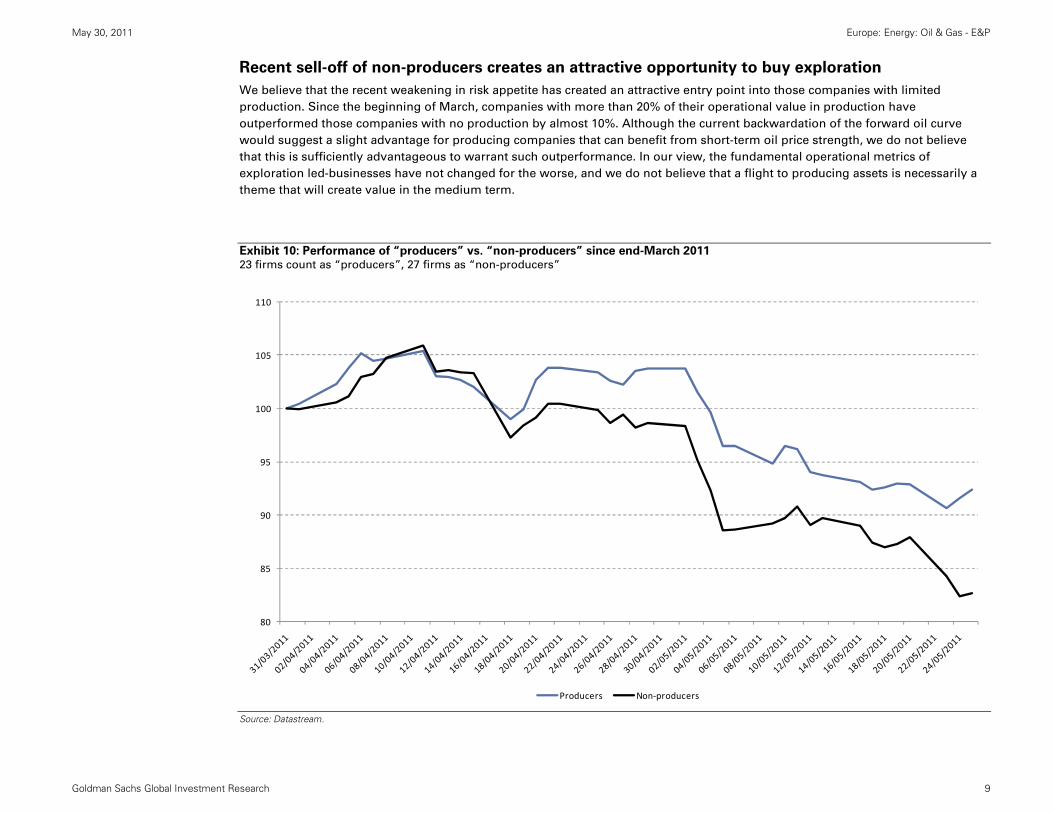
Recent sell-off of non-producers creates an attractive opportunity to buy exploration
We believe that the recent weakening in risk appetite has created an attractive entry point into those companies with limited
production. Since the beginning of March, companies with more than 20% of their operational value in production have
outperformed those companies with no production by almost 10%. Although the current backwardation of the forward oil curve
would suggest a slight advantage for producing companies that can benefit from short-term oil price strength, we do not believe
that this is sufficiently advantageous to warrant such outperformance. In our view, the fundamental operational metrics of
exploration led-businesses have not changed for the worse, and we do not believe that a flight to producing assets is necessarily a
theme that will create value in the medium term.
Exhibit 10: Performance of “producers” vs. “non-producers” since end-March 2011 23 firms count as “producers”, 27 firms as “non-producers”
Source: Datastream.
80
85
90
95
100
105
110
Producers Non‐producers
May 30, 2011 Europe: Energy: Oil & Gas - E&P
Goldman Sachs Global Investment Research 10
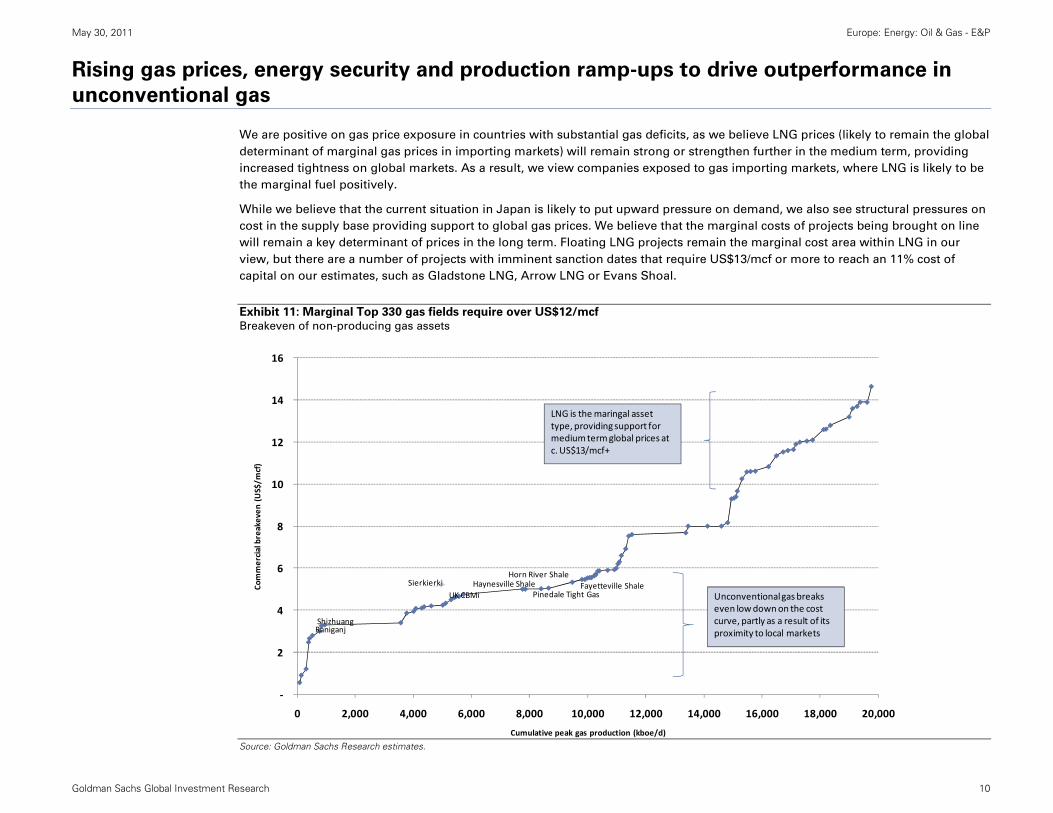
Rising gas prices, energy security and production ramp-ups to drive outperformance in
unconventional gas
We are positive on gas price exposure in countries with substantial gas deficits, as we believe LNG prices (likely to remain the global
determinant of marginal gas prices in importing markets) will remain strong or strengthen further in the medium term, providing
increased tightness on global markets. As a result, we view companies exposed to gas importing markets, where LNG is likely to be
the marginal fuel positively.
While we believe that the current situation in Japan is likely to put upward pressure on demand, we also see structural pressures on
cost in the supply base providing support to global gas prices. We believe that the marginal costs of projects being brought on line
will remain a key determinant of prices in the long term. Floating LNG projects remain the marginal cost area within LNG in our
view, but there are a number of projects with imminent sanction dates that require US$13/mcf or more to reach an 11% cost of
capital on our estimates, such as Gladstone LNG, Arrow LNG or Evans Shoal.
Exhibit 11: Marginal Top 330 gas fields require over US$12/mcf
Breakeven of non-producing gas assets
Source: Goldman Sachs Research estimates.
‐
2
4
6
8
10
12
14
16
0 2,000 4,000 6,000 8,000 10,000 12,000 14,000 16,000 18,000 20,000
Commercial breakeven
(US$/m
cf)
Cumulative peak gas production (kboe/d)
Shizhuang
Haynesville ShalePinedale Tight Gas
Horn River ShaleFayetteville Shale
LNG is the maringal asset type, providing support for medium term global prices at c. US$13/mcf+
Raniganj
SierkierkiUK CBMi Unconventional gas breaks
even low down on the cost curve, partly as a result of its proximity to local markets
May 30, 2011 Europe: Energy: Oil & Gas - E&P
Goldman Sachs Global Investment Research 11
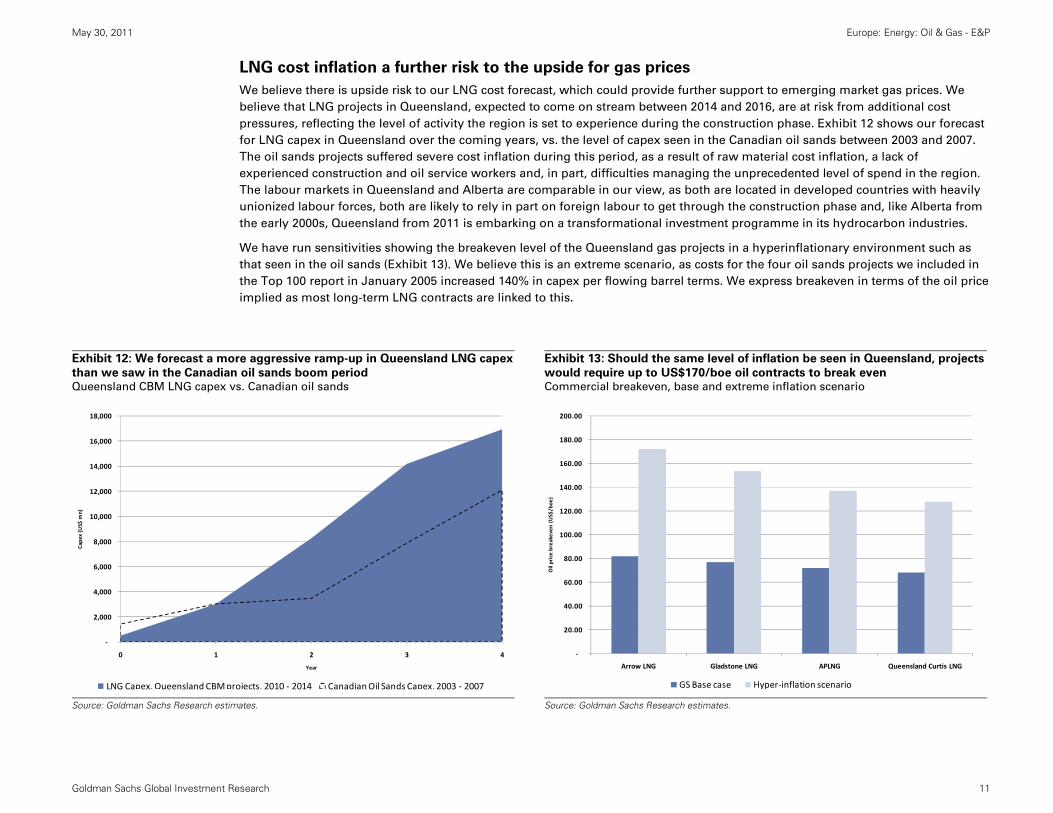
LNG cost inflation a further risk to the upside for gas prices
We believe there is upside risk to our LNG cost forecast, which could provide further support to emerging market gas prices. We
believe that LNG projects in Queensland, expected to come on stream between 2014 and 2016, are at risk from additional cost
pressures, reflecting the level of activity the region is set to experience during the construction phase. Exhibit 12 shows our forecast
for LNG capex in Queensland over the coming years, vs. the level of capex seen in the Canadian oil sands between 2003 and 2007.
The oil sands projects suffered severe cost inflation during this period, as a result of raw material cost inflation, a lack of
experienced construction and oil service workers and, in part, difficulties managing the unprecedented level of spend in the region.
The labour markets in Queensland and Alberta are comparable in our view, as both are located in developed countries with heavily
unionized labour forces, both are likely to rely in part on foreign labour to get through the construction phase and, like Alberta from
the early 2000s, Queensland from 2011 is embarking on a transformational investment programme in its hydrocarbon industries.
We have run sensitivities showing the breakeven level of the Queensland gas projects in a hyperinflationary environment such as
that seen in the oil sands (Exhibit 13). We believe this is an extreme scenario, as costs for the four oil sands projects we included in
the Top 100 report in January 2005 increased 140% in capex per flowing barrel terms. We express breakeven in terms of the oil price
implied as most long-term LNG contracts are linked to this.
Exhibit 12: We forecast a more aggressive ramp-up in Queensland LNG capex
than we saw in the Canadian oil sands boom period Queensland CBM LNG capex vs. Canadian oil sands
Exhibit 13: Should the same level of inflation be seen in Queensland, projects
would require up to US$170/boe oil contracts to break even Commercial breakeven, base and extreme inflation scenario
Source: Goldman Sachs Research estimates.
Source: Goldman Sachs Research estimates.
‐
2,000
4,000
6,000
8,000
10,000
12,000
14,000
16,000
18,000
0 1 2 3 4
Cape
x (US$
mn)
Year
LNG Capex, Queensland CBM projects, 2010 ‐ 2014 Canadian Oil Sands Capex, 2003 ‐ 2007
‐
20.00
40.00
60.00
80.00
100.00
120.00
140.00
160.00
180.00
200.00
Arrow LNG Gladstone LNG APLNG Queensland Curtis LNG
Oil price breakeven (US$/boe
)
GS Base case Hyper‐inflation scenario

May 30, 2011 Europe: Energy: Oil & Gas - E&P
Goldman Sachs Global Investment Research 12
Gas price leverage hard to come by in the E&P universe
Obtaining exposure to this theme is not as easy as one may think in the E&P universe, with oil by far the most important commodity
as a driver of the universe. Gas as a commodity represents only 17% of the operational value of the E&P companies under our
coverage. Exposure is, however, significant for certain stocks. We would highlight Great Eastern (North East India), IGas (UK), Green
Dragon (China), JKX (Ukraine), Dominion (LNG), Cove (LNG), Northern Petroleum (Netherlands), Aurealian (Poland) and Hardy
(India) as stocks with significant gas exposure to markets where a net deficit exists. Although companies such as Panoro, Premier
and Salamander have significant exposure to gas, we note that prices are fixed for significant portions of their volumes.
We have identified companies with over 40% of their value in markets with gas deficits, and where prices are not fixed by contracts
or the government, and show the impact on our valuations of a 25% increase in gas prices. We note that a 25% increase to our gas
price assumptions would not take prices above the US$13/mcf we see as the marginal cost for Queensland LNG projects apart from
in the case of Great Eastern, where competing fuels are LPG / fuel oil more than LNG.
Exhibit 14: Exposure to gas in attractive locations is not a common theme
among European E&Ps Gas price exposure by value
Exhibit 15: Potential increase to valuation from a 25% increase in gas prices
in deficit markets Revised gas prices take Poland to c.US$12/mcf, the UK to US$12.5/mcf, India (KG
basin) to US$10/mcf, Chinese bucket price after downstream / midstream margins
to US$13/mcf
Source: Goldman Sachs Research estimates.
Source: Goldman Sachs Research estimates.
0%
20%
40%
60%
80%
100%
120%
Great Eastern Ene
rgy
Igas
Green
Dragon
JKX
Hardy
Oil
Regal
Cove
Ene
rgy
Dom
inion
Aurelian
Northern Pe
troleu
mMelrose Resou
rces
Pano
roSalamande
r Prem
ier O
il Aminex
Plc
Ithaca
Serica
Heritage
Oil
PA Resou
rces
Noreco
Chariot O
il & Gas
Faroe Pe
troleu
mTower Resou
rces
Encore
Dragon Oil
Tullow
Coastal Ene
rgy
Nautical Petroleum
Lund
in Petroleum
Det Norske
Valiant Petroleum
Maurel &
Prom
Nighthawk Energy
Sterling Energy
Gulfsands
Enqu
est
Rockho
pper
DNO
Norse Ene
rgy
Bowleven
Bankers p
etroleum
Borders and
Sou
thern
Amerisur
Desire Pe
troleu
mFalkland
Oil & Gas
Global Ene
rgy …
Gulf K
eyston
eMax Petroleum BPC
Soco
% of value
attribu
te to gas by
region
Western Europe gas Emerging market gas LNG Eastern Europe gas
0%
5%
10%
15%
20%
25%
30%
35%
40%
Regal Great Eastern Energy
Igas Green Dragon Aurelian JKX Northern Petroleum Hardy Oil
Upside to valuation
from a 25%
increase in
gas prices
May 30, 2011 Europe: Energy: Oil & Gas - E&P
Goldman Sachs Global Investment Research 13
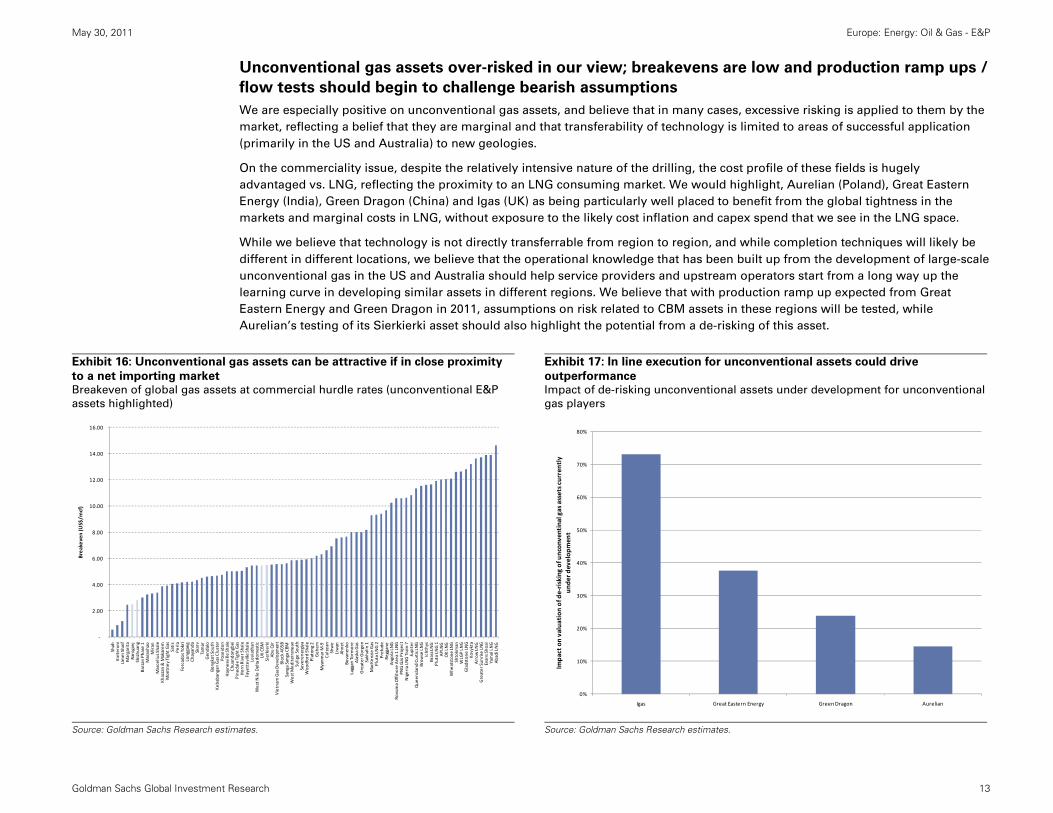
Unconventional gas assets over-risked in our view; breakevens are low and production ramp ups /
flow tests should begin to challenge bearish assumptions
We are especially positive on unconventional gas assets, and believe that in many cases, excessive risking is applied to them by the
market, reflecting a belief that they are marginal and that transferability of technology is limited to areas of successful application
(primarily in the US and Australia) to new geologies.
On the commerciality issue, despite the relatively intensive nature of the drilling, the cost profile of these fields is hugely
advantaged vs. LNG, reflecting the proximity to an LNG consuming market. We would highlight, Aurelian (Poland), Great Eastern
Energy (India), Green Dragon (China) and Igas (UK) as being particularly well placed to benefit from the global tightness in the
markets and marginal costs in LNG, without exposure to the likely cost inflation and capex spend that we see in the LNG space.
While we believe that technology is not directly transferrable from region to region, and while completion techniques will likely be
different in different locations, we believe that the operational knowledge that has been built up from the development of large-scale
unconventional gas in the US and Australia should help service providers and upstream operators start from a long way up the
learning curve in developing similar assets in different regions. We believe that with production ramp up expected from Great
Eastern Energy and Green Dragon in 2011, assumptions on risk related to CBM assets in these regions will be tested, while
Aurelian’s testing of its Sierkierki asset should also highlight the potential from a de-risking of this asset.
Exhibit 16: Unconventional gas assets can be attractive if in close proximity
to a net importing market Breakeven of global gas assets at commercial hurdle rates (unconventional E&P
assets highlighted)
Exhibit 17: In line execution for unconventional assets could drive
outperformance Impact of de-risking unconventional assets under development for unconventional
gas players
Source: Goldman Sachs Research estimates.
Source: Goldman Sachs Research estimates.
‐
2.00
4.00
6.00
8.00
10.00
12.00
14.00
16.00
Shah
Kinteroni
Umm Shaif
Margarita
Raniganj
Shizhu
ang
Barzan
Phase 1
Maranhao
Miran
Marcellu
s Shale
Khazzan & Makarem
Mon
tney
Tight Gas
Satis
Perla
Forcados Yokri
Longgang
Chayanda
Skarv
Tamar
Gen
dalo
Bongkot Sou
thKe
babangan
Gas Cluster
Poseidon
Hayne
sville Shale
Chuand
ongbei
Pine
dale Tight Gas
Horn River Shale
Fayetteville Shale
Leviathan
West N
ile Delta dom
estic
UK CB
MSierkierki
Abu Qir
Vietnam Gas Development
Block 40
5BSanga Sanga CB
MWest M
editerranean
Sulige South
Severenergiya
Woo
dford Shale
Platon
g 2
Geh
emMyanm
ar M
‐9Cu
lzean
Shwe
Liwan
Ahne
tBo
vane
nko
Laggan
Tormore
Alaska Gas
Greater Gorgon
Sakhalin 1
MacKe
nzie Gas
Pluto LN
G 2
Prelud
eRe
ggane
Angola LNG
Rovuma Offsho
re Area 1 LN
GPN
G Gas Project
Nigeria LNG Train 7
Jupiter
Que
ensland Cu
rtis LN
GBrow
se LNG
Ichthys
Brass LNG
Pluto LN
G 1
APLN
GOK LN
GWhe
atston
e LN
GShtokm
anWLG
P LN
GGladstone
LNG
Kovykta
Arrow LNG
Greater Sun
rise LNG
Evans Sho
alYamal LNG
Abadi LNG
Brea
keven (US$
/mcf)
0%
10%
20%
30%
40%
50%
60%
70%
80%
Igas Great Eastern Energy Green Dragon Aurelian
Impact on
valua
tion
of d
e‐risking of u
ncon
ventinal gas assets currently
und
er develop
men
t
May 30, 2011 Europe: Energy: Oil & Gas - E&P
Goldman Sachs Global Investment Research 14
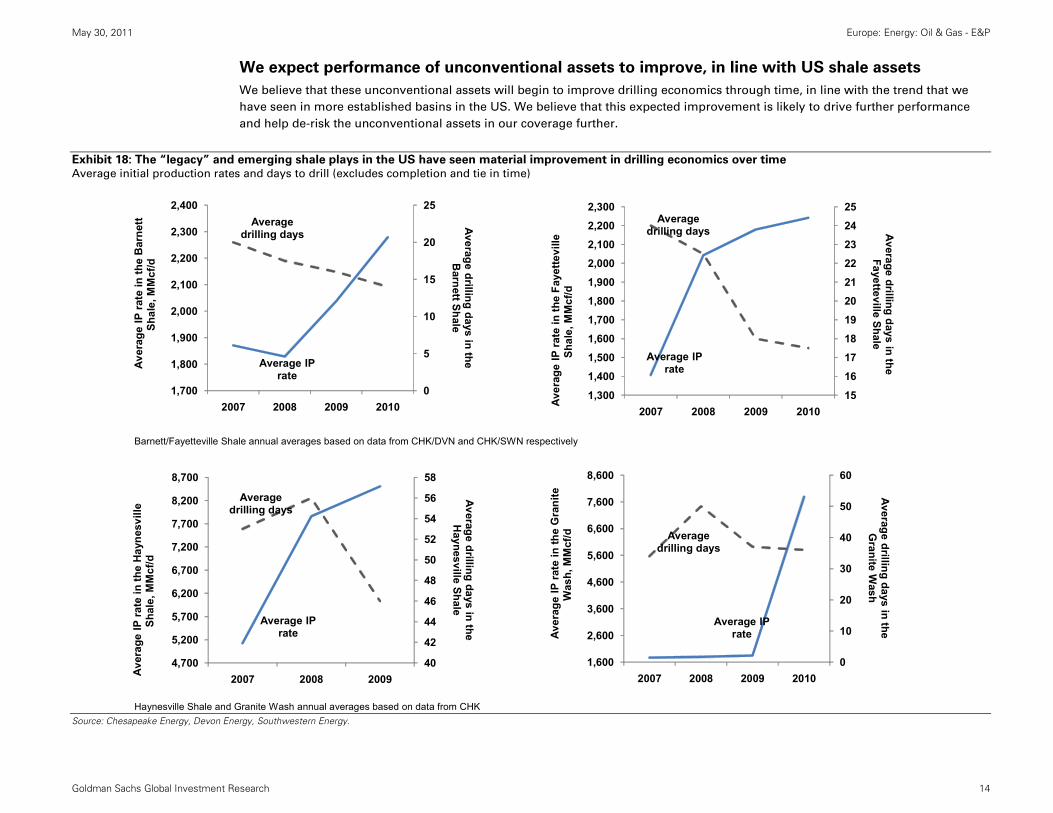
We expect performance of unconventional assets to improve, in line with US shale assets
We believe that these unconventional assets will begin to improve drilling economics through time, in line with the trend that we
have seen in more established basins in the US. We believe that this expected improvement is likely to drive further performance
and help de-risk the unconventional assets in our coverage further.
Exhibit 18: The “legacy” and emerging shale plays in the US have seen material improvement in drilling economics over time Average initial production rates and days to drill (excludes completion and tie in time)
Source: Chesapeake Energy, Devon Energy, Southwestern Energy.
Barnett/Fayetteville Shale annual averages based on data from CHK/DVN and CHK/SWN respectively
Haynesville Shale and Granite Wash annual averages based on data from CHK
Average IP rate
Average drilling days
0
5
10
15
20
25
1,700
1,800
1,900
2,000
2,100
2,200
2,300
2,400
2007 2008 2009 2010
Average drilling days in the B
arnett Shale
Aver
age
IP ra
te in
the
Bar
nett
Shal
e, M
Mcf
/d
Average IP rate
Average drilling days
40
42
44
46
48
50
52
54
56
58
4,700
5,200
5,700
6,200
6,700
7,200
7,700
8,200
8,700
2007 2008 2009
Average drilling days in the H
aynesville Shale
Ave
rage
IP ra
te in
the
Hay
nesv
ille
Shal
e, M
Mcf
/d
Average IP rate
Average drilling days
15
16
17
18
19
20
21
22
23
24
25
1,300
1,400
1,500
1,600
1,700
1,800
1,900
2,000
2,100
2,200
2,300
2007 2008 2009 2010
Average drilling days in the
Fayetteville Shale
Aver
age
IP ra
te in
the
Faye
ttevi
lle
Shal
e, M
Mcf
/d
Average IP rate
Average drilling days
0
10
20
30
40
50
60
1,600
2,600
3,600
4,600
5,600
6,600
7,600
8,600
2007 2008 2009 2010
Average drilling days in the G
ranite Wash
Aver
age
IP ra
te in
the
Gra
nite
W
ash,
MM
cf/d
May 30, 2011 Europe: Energy: Oil & Gas - E&P
Goldman Sachs Global Investment Research 15
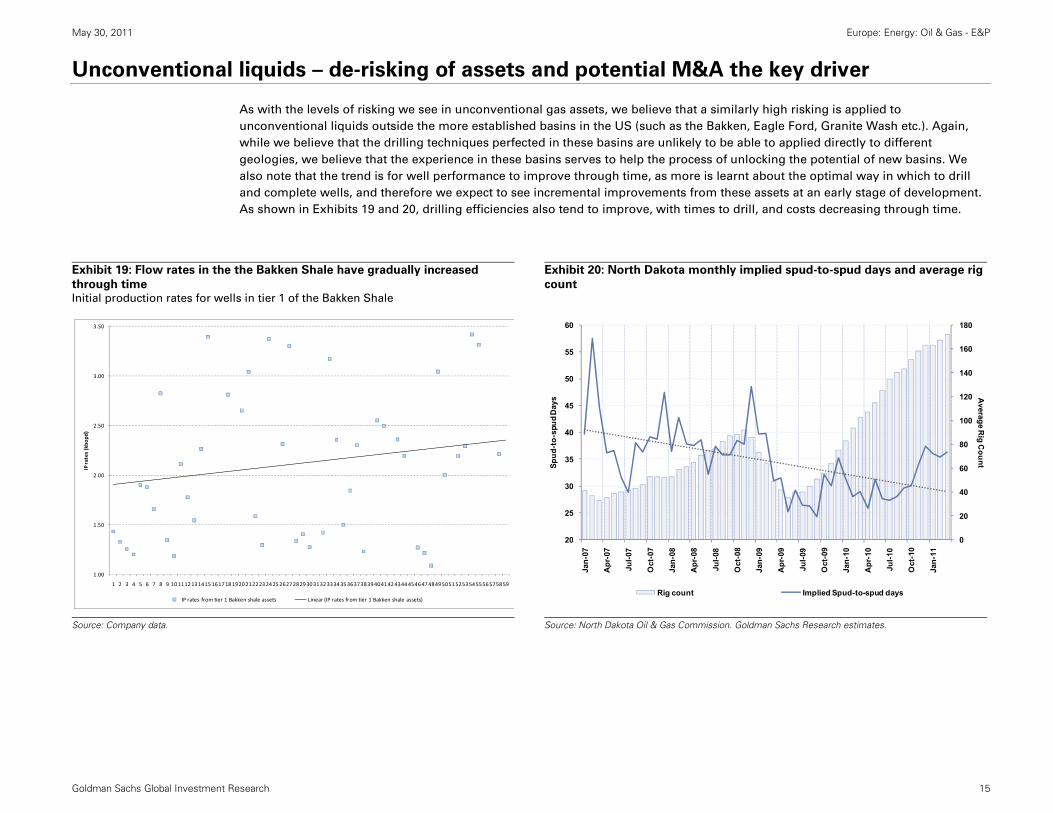
Unconventional liquids – de-risking of assets and potential M&A the key driver
As with the levels of risking we see in unconventional gas assets, we believe that a similarly high risking is applied to
unconventional liquids outside the more established basins in the US (such as the Bakken, Eagle Ford, Granite Wash etc.). Again,
while we believe that the drilling techniques perfected in these basins are unlikely to be able to applied directly to different
geologies, we believe that the experience in these basins serves to help the process of unlocking the potential of new basins. We
also note that the trend is for well performance to improve through time, as more is learnt about the optimal way in which to drill
and complete wells, and therefore we expect to see incremental improvements from these assets at an early stage of development.
As shown in Exhibits 19 and 20, drilling efficiencies also tend to improve, with times to drill, and costs decreasing through time.
Exhibit 19: Flow rates in the the Bakken Shale have gradually increased
through time Initial production rates for wells in tier 1 of the Bakken Shale
Exhibit 20: North Dakota monthly implied spud-to-spud days and average rig
count
Source: Company data.
Source: North Dakota Oil & Gas Commission. Goldman Sachs Research estimates.
1.00
1.50
2.00
2.50
3.00
3.50
1 2 3 4 5 6 7 8 9 1011121314151617181920212223242526272829303132333435363738394041424344454647484950515253545556575859
IP rates (kbo
pd)
IP rates from tier 1 Bakken shale assets Linear (IP rates from tier 1 Bakken shale assets)
0
20
40
60
80
100
120
140
160
180
20
25
30
35
40
45
50
55
60
Jan-
07
Apr
-07
Jul-0
7
Oct
-07
Jan-
08
Apr
-08
Jul-0
8
Oct
-08
Jan-
09
Apr
-09
Jul-0
9
Oct
-09
Jan-
10
Apr
-10
Jul-1
0
Oct
-10
Jan-
11
Average R
ig CountSp
ud-t
o-sp
ud D
ays
Rig count Implied Spud-to-spud days

May 30, 2011 Europe: Energy: Oil & Gas - E&P
Goldman Sachs Global Investment Research 16
Flow rates and costs key to unlocking value
We highlight Panoro (with its low permeability MKB asset in Congo) and Nighthawk (with its oil shale Jolly Ranch play in the US) as
companies with exposure to unconventional liquids assets at an early stage of development. We believe that a de-risking of these
assets could result in substantial upside from current levels. While we note that risk remains around these assets (especially for
Nighthawk, which has only drilled one well to date that we would consider commercial), we believe that the heavy risk factors that
we apply to these assets account for this uncertainty.
We believe there is significant further upside to be realized from both these assets from:
A de-risking of the assets as drilling continues;
The potential to improve flow rates;
The potential for drilling efficiencies to improve and, subsequently, for costs to come down.
In the event of de-risking these plays, we see significant re-rating potential for both Panoro and Nighthawk (Exhibit 22). We see the
key to de-risking these unconventional assets and determining value as the flow rates that can be achieved by the wells.
Exhibit 21: Assumed flow rates per well
Exhibit 22: Increased flow rates, more efficient drilling and de-risking of
unconventional liquid assets have the potential to re-rate Panoro and
Nighthawk Potential uplift to valuation as percentage of market cap
Source: Company data, Goldman Sachs Research estimates.
Source: Goldman Sachs Research estimates.
0.00
0.01
0.02
0.03
0.04
0.05
0.06
0.07
0.08
0.00
0.10
0.20
0.30
0.40
0.50
0.60
1 2 3 4 5 6 7 8 9 10
kbop
d
kbop
d
Assumed MKB flow rates (Panoro ‐ LHS) Assumed Jol ly ranch vertical flow rates (Nighthawk ‐ RHS)
‐100%
100%
300%
500%
700%
900%
1100%
0%
20%
40%
60%
80%
100%
120%
De‐risking 50% higher IP rate (no risking changes) Drop in costs by 50%
Potential value
add
ed as % of m
arket cap (Nighthawk)
Panoro (LHS) Nighthawk (RHS)
100% de‐risking IP rates 50% higher Costs 50% down
May 30, 2011 Europe: Energy: Oil & Gas - E&P
Goldman Sachs Global Investment Research 17
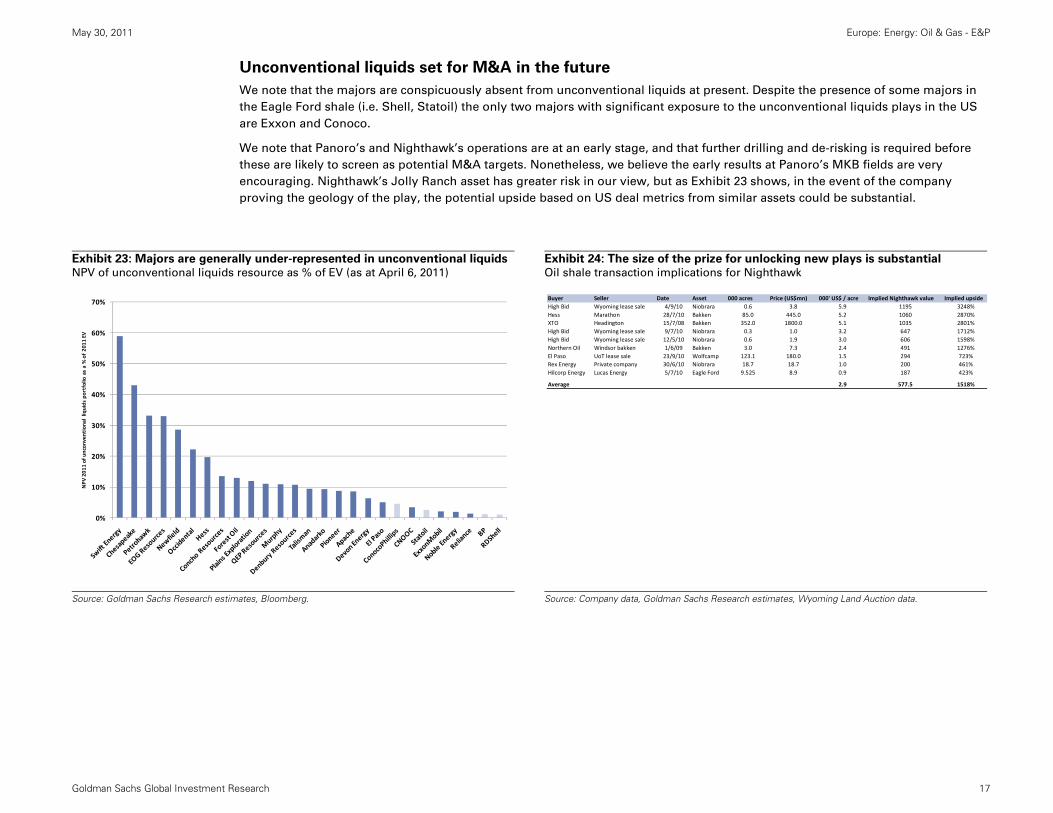
Unconventional liquids set for M&A in the future
We note that the majors are conspicuously absent from unconventional liquids at present. Despite the presence of some majors in
the Eagle Ford shale (i.e. Shell, Statoil) the only two majors with significant exposure to the unconventional liquids plays in the US
are Exxon and Conoco.
We note that Panoro’s and Nighthawk’s operations are at an early stage, and that further drilling and de-risking is required before
these are likely to screen as potential M&A targets. Nonetheless, we believe the early results at Panoro’s MKB fields are very
encouraging. Nighthawk’s Jolly Ranch asset has greater risk in our view, but as Exhibit 23 shows, in the event of the company
proving the geology of the play, the potential upside based on US deal metrics from similar assets could be substantial.
Exhibit 23: Majors are generally under-represented in unconventional liquidsNPV of unconventional liquids resource as % of EV (as at April 6, 2011)
Exhibit 24: The size of the prize for unlocking new plays is substantial Oil shale transaction implications for Nighthawk
Source: Goldman Sachs Research estimates, Bloomberg.
Source: Company data, Goldman Sachs Research estimates, Wyoming Land Auction data.
0%
10%
20%
30%
40%
50%
60%
70%
NPV
201
1 of uncon
ventional liquids portfolio as a % of 20
11 EV
Buyer Seller Date Asset 000 acres Price (US$mn) 000' US$ / acre Implied Nighthawk value Implied upsideHigh Bid Wyoming lease sale 4/9/10 Niobrara 0.6 3.8 5.9 1195 3248%Hess Marathon 28/7/10 Bakken 85.0 445.0 5.2 1060 2870%XTO Headington 15/7/08 Bakken 352.0 1800.0 5.1 1035 2801%High Bid Wyoming lease sale 9/7/10 Niobrara 0.3 1.0 3.2 647 1712%High Bid Wyoming lease sale 12/5/10 Niobrara 0.6 1.9 3.0 606 1598%Northern Oil Windsor bakken 1/6/09 Bakken 3.0 7.3 2.4 491 1276%El Paso UoT lease sale 23/9/10 Wolfcamp 123.1 180.0 1.5 294 723%Rex Energy Private company 30/6/10 Niobrara 18.7 18.7 1.0 200 461%Hilcorp Energy Lucas Energy 5/7/10 Eagle Ford 9.525 8.9 0.9 187 423%
Average 2.9 577.5 1518%
May 30, 2011 Europe: Energy: Oil & Gas - E&P
Goldman Sachs Global Investment Research 18
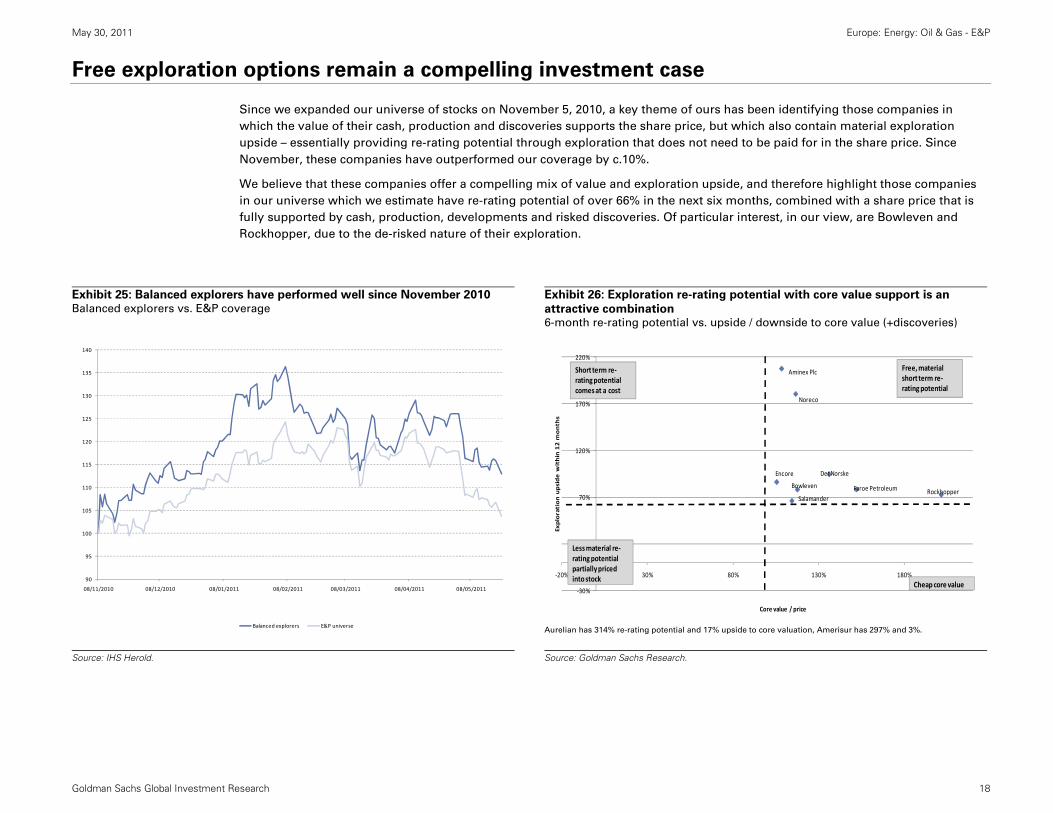
Free exploration options remain a compelling investment case
Since we expanded our universe of stocks on November 5, 2010, a key theme of ours has been identifying those companies in
which the value of their cash, production and discoveries supports the share price, but which also contain material exploration
upside – essentially providing re-rating potential through exploration that does not need to be paid for in the share price. Since
November, these companies have outperformed our coverage by c.10%.
We believe that these companies offer a compelling mix of value and exploration upside, and therefore highlight those companies
in our universe which we estimate have re-rating potential of over 66% in the next six months, combined with a share price that is
fully supported by cash, production, developments and risked discoveries. Of particular interest, in our view, are Bowleven and
Rockhopper, due to the de-risked nature of their exploration.
Exhibit 25: Balanced explorers have performed well since November 2010 Balanced explorers vs. E&P coverage
Exhibit 26: Exploration re-rating potential with core value support is an
attractive combination 6-month re-rating potential vs. upside / downside to core value (+discoveries)
Aurelian has 314% re-rating potential and 17% upside to core valuation, Amerisur has 297% and 3%.
Source: IHS Herold.
Source: Goldman Sachs Research.
90
95
100
105
110
115
120
125
130
135
140
08/11/2010 08/12/2010 08/01/2011 08/02/2011 08/03/2011 08/04/2011 08/05/2011
Balanced explorers E&P universe
‐30%
20%
70%
120%
170%
220%
‐20% 30% 80% 130% 180%
Exploration upside w
ithin 12 m
onths
Core value / price
Free, material short term re‐rating potential
Short term re‐rating potential comes at a cost
Less material re‐ratingpotential partially priced into stock
Cheap core value
Aminex Plc
Faroe PetroleumBowleven
Noreco
Det Norske
Salamander Rockhopper
Encore
May 30, 2011 Europe: Energy: Oil & Gas - E&P
Goldman Sachs Global Investment Research 19
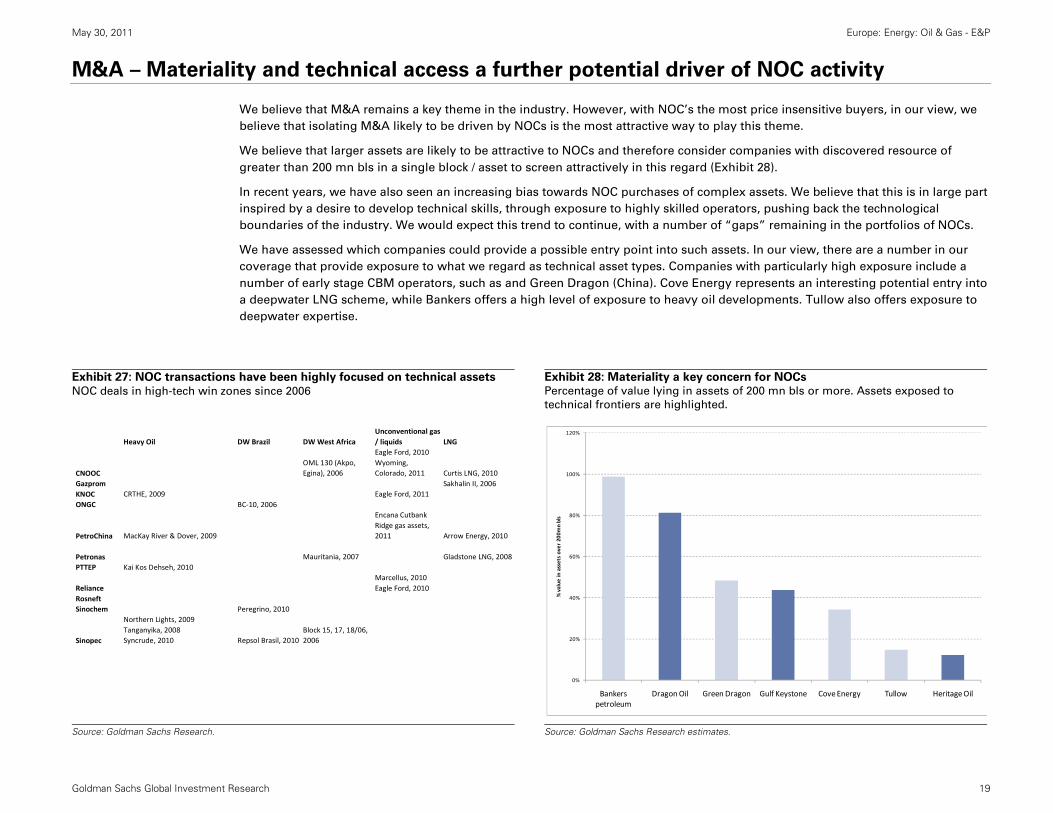
M&A – Materiality and technical access a further potential driver of NOC activity
We believe that M&A remains a key theme in the industry. However, with NOC’s the most price insensitive buyers, in our view, we
believe that isolating M&A likely to be driven by NOCs is the most attractive way to play this theme.
We believe that larger assets are likely to be attractive to NOCs and therefore consider companies with discovered resource of
greater than 200 mn bls in a single block / asset to screen attractively in this regard (Exhibit 28).
In recent years, we have also seen an increasing bias towards NOC purchases of complex assets. We believe that this is in large part
inspired by a desire to develop technical skills, through exposure to highly skilled operators, pushing back the technological
boundaries of the industry. We would expect this trend to continue, with a number of “gaps” remaining in the portfolios of NOCs.
We have assessed which companies could provide a possible entry point into such assets. In our view, there are a number in our
coverage that provide exposure to what we regard as technical asset types. Companies with particularly high exposure include a
number of early stage CBM operators, such as and Green Dragon (China). Cove Energy represents an interesting potential entry into
a deepwater LNG scheme, while Bankers offers a high level of exposure to heavy oil developments. Tullow also offers exposure to
deepwater expertise.
Exhibit 27: NOC transactions have been highly focused on technical assets
NOC deals in high-tech win zones since 2006
Exhibit 28: Materiality a key concern for NOCs Percentage of value lying in assets of 200 mn bls or more. Assets exposed to
technical frontiers are highlighted.
Source: Goldman Sachs Research.
Source: Goldman Sachs Research estimates.
Heavy Oil DW Brazil DW West AfricaUnconventional gas / liquids LNG
CNOOCOML 130 (Akpo, Egina), 2006
Eagle Ford, 2010Wyoming, Colorado, 2011 Curtis LNG, 2010
Gazprom Sakhalin II, 2006KNOC CRTHE, 2009 Eagle Ford, 2011ONGC BC‐10, 2006
PetroChina MacKay River & Dover, 2009
Encana Cutbank Ridge gas assets, 2011 Arrow Energy, 2010
Petronas Mauritania, 2007 Gladstone LNG, 2008PTTEP Kai Kos Dehseh, 2010
RelianceMarcellus, 2010Eagle Ford, 2010
RosneftSinochem Peregrino, 2010
Sinopec
Northern Lights, 2009Tanganyika, 2008Syncrude, 2010 Repsol Brasil, 2010
Block 15, 17, 18/06, 2006
0%
20%
40%
60%
80%
100%
120%
Bankers petroleum
Dragon Oil Green Dragon Gulf Keystone Cove Energy Tullow Heritage Oil
% value
in assets over 200
mn bls

May 30, 2011 Europe: Energy: Oil & Gas - E&P
Goldman Sachs Global Investment Research 20
NOC interest could be a material value driver
We are especially attracted towards M&A that could potentially involve NOCs as we note that recent deals involving NOCs as the
acquirers have been done at significantly higher prices than those that have attracted IOC attention. We believe that this is a
function of the IOCs typically looking to buy assets at commercial costs of capital (to generate value), while the NOCs’ deal
rationales are often more strategic. Exhibit 29 shows the discount rates implied by recent deals, with NOC’s paying discount rates of
8% or lower in order to secure assets.
Exhibit 30 shows the re-rating potential from those companies that we believe could attract NOC attention either as a result of the
large materiality, or as a result of the technical nature of the asset if we use an 8% discount rate to value those assets we view as
attractive.
Exhibit 29: NOC acquisitions have been more price insensitive driving
potentially greater returns Implied discount rates of recent deals
Exhibit 30: Deals done at NOC costs of capital could see significant upside to
current valuations Highlighted companies screen attractively for both materiality and technical
access
Source: IHS Herold.
Source: Goldman Sachs Research.
0.00%
2.00%
4.00%
6.00%
8.00%
10.00%
12.00%
14.00%
16.00%
18.00%
Peregrino Athabasca Oil Sands
Corporation assets
Dana * Block 32 -Marathon
stake
Jack/St Malo Mariner** Uganda, blocks 1 & 3
(ENI & Heritage)
Dragon
Dis
coun
t rat
e im
plie
d by
dea
l at l
ong
run
oil p
rice
NOC acquirersIOC acquirers
NOC acquirer but with controlling stake
* Excluding exploration value** Assuming 80% development risking
Average WACC for sector per GS valuations
0%
10%
20%
30%
40%
50%
60%
70%
80%
90%
Cove Energy Dragon Oil Gulf Keystone Green Dragon Bankers petroleum Heritage Oil Tullow
Uplift to
valaution
at NOC valuations
May 30, 2011 Europe: Energy: Oil & Gas - E&P
Goldman Sachs Global Investment Research 21
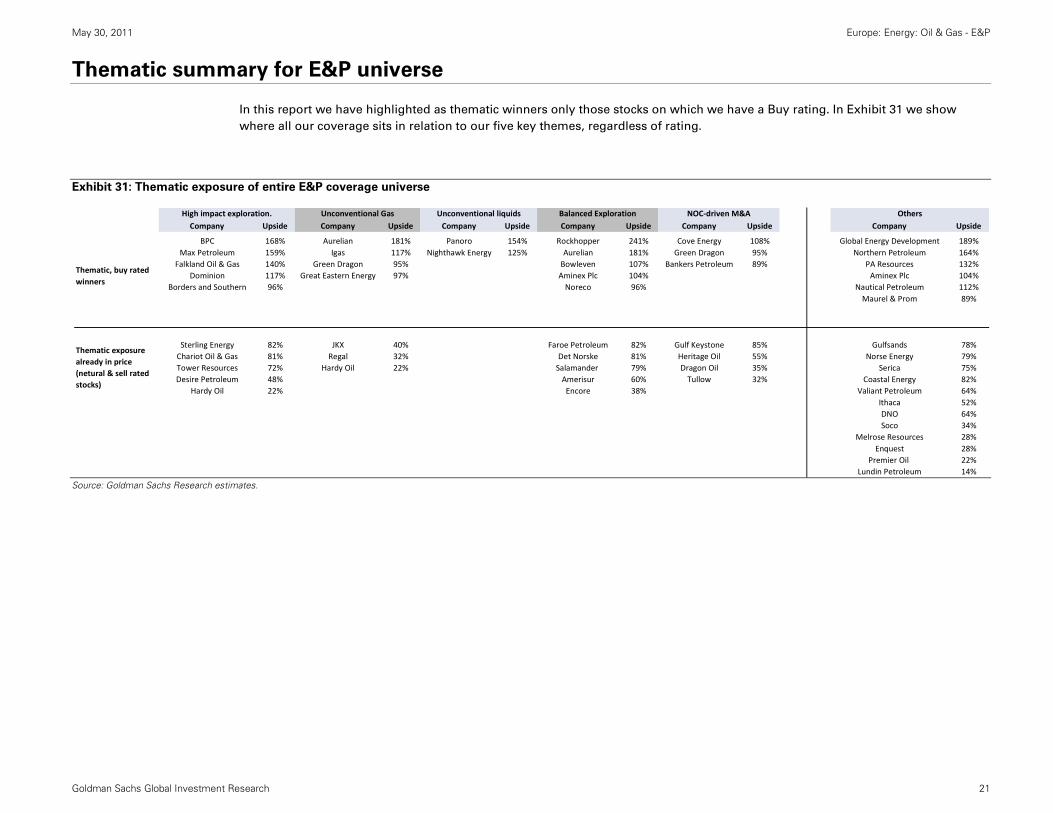
Thematic summary for E&P universe
In this report we have highlighted as thematic winners only those stocks on which we have a Buy rating. In Exhibit 31 we show
where all our coverage sits in relation to our five key themes, regardless of rating.
Exhibit 31: Thematic exposure of entire E&P coverage universe
Source: Goldman Sachs Research estimates.
Company Upside Company Upside Company Upside Company Upside Company Upside Company Upside
BPC 168% Aurelian 181% Panoro 154% Rockhopper 241% Cove Energy 108% Global Energy Development 189%Max Petroleum 159% Igas 117% Nighthawk Energy 125% Aurelian 181% Green Dragon 95% Northern Petroleum 164%
Falkland Oil & Gas 140% Green Dragon 95% Bowleven 107% Bankers Petroleum 89% PA Resources 132%Dominion 117% Great Eastern Energy 97% Aminex Plc 104% Aminex Plc 104%
Borders and Southern 96% Noreco 96% Nautical Petroleum 112%Maurel & Prom 89%
Sterling Energy 82% JKX 40% Faroe Petroleum 82% Gulf Keystone 85% Gulfsands 78%Chariot Oil & Gas 81% Regal 32% Det Norske 81% Heritage Oil 55% Norse Energy 79%Tower Resources 72% Hardy Oil 22% Salamander 79% Dragon Oil 35% Serica 75%Desire Petroleum 48% Amerisur 60% Tullow 32% Coastal Energy 82%
Hardy Oil 22% Encore 38% Valiant Petroleum 64%Ithaca 52%DNO 64%Soco 34%
Melrose Resources 28%Enquest 28%
Premier Oil 22%Lundin Petroleum 14%
Balanced Exploration NOC‐driven M&A Others
Thematic, buy rated winners
Thematic exposure already in price (netural & sell rated stocks)
High impact exploration. Unconventional Gas Unconventional liquids
May 30, 2011 Europe: Energy: Oil & Gas - E&P
Goldman Sachs Global Investment Research 22
Oil price sensitivity and the E&Ps; higher fiscal risk, but lower commercial thresholds;
maintaining US$100/bl in our valuations
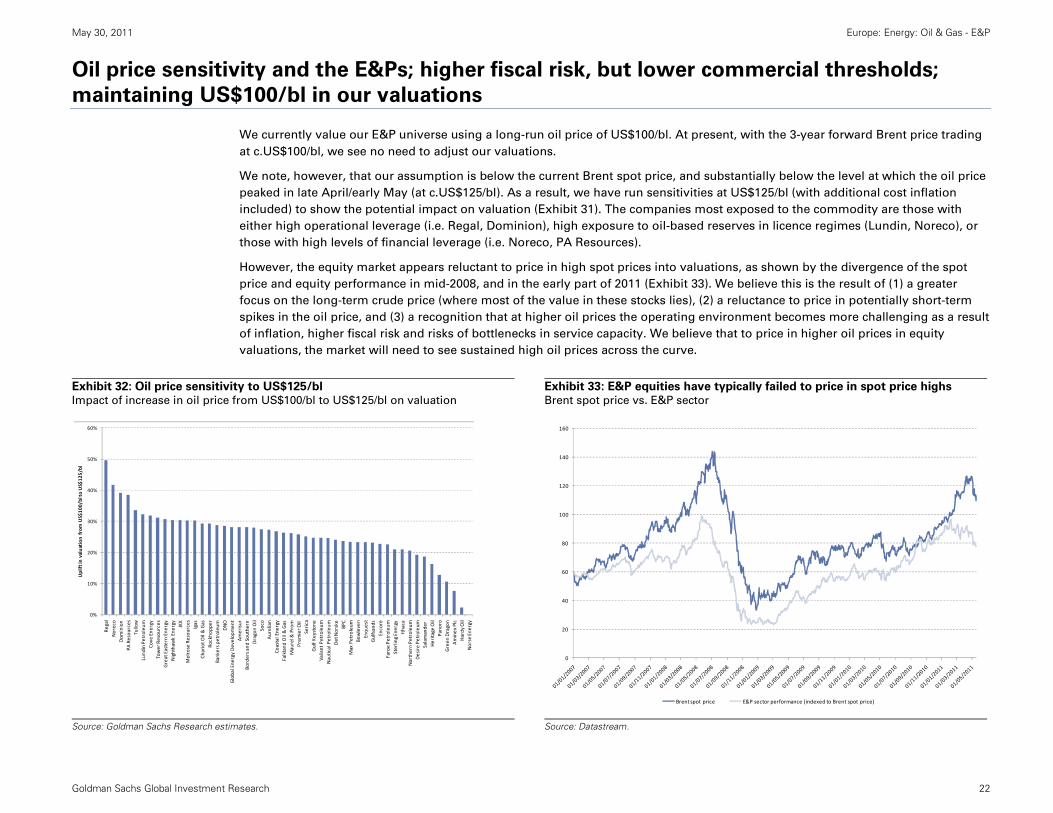
We currently value our E&P universe using a long-run oil price of US$100/bl. At present, with the 3-year forward Brent price trading
at c.US$100/bl, we see no need to adjust our valuations.
We note, however, that our assumption is below the current Brent spot price, and substantially below the level at which the oil price
peaked in late April/early May (at c.US$125/bl). As a result, we have run sensitivities at US$125/bl (with additional cost inflation
included) to show the potential impact on valuation (Exhibit 31). The companies most exposed to the commodity are those with
either high operational leverage (i.e. Regal, Dominion), high exposure to oil-based reserves in licence regimes (Lundin, Noreco), or
those with high levels of financial leverage (i.e. Noreco, PA Resources).
However, the equity market appears reluctant to price in high spot prices into valuations, as shown by the divergence of the spot
price and equity performance in mid-2008, and in the early part of 2011 (Exhibit 33). We believe this is the result of (1) a greater
focus on the long-term crude price (where most of the value in these stocks lies), (2) a reluctance to price in potentially short-term
spikes in the oil price, and (3) a recognition that at higher oil prices the operating environment becomes more challenging as a result
of inflation, higher fiscal risk and risks of bottlenecks in service capacity. We believe that to price in higher oil prices in equity
valuations, the market will need to see sustained high oil prices across the curve.
Exhibit 32: Oil price sensitivity to US$125/bl Impact of increase in oil price from US$100/bl to US$125/bl on valuation
Exhibit 33: E&P equities have typically failed to price in spot price highs Brent spot price vs. E&P sector
Source: Goldman Sachs Research estimates.
Source: Datastream.
0%
10%
20%
30%
40%
50%
60%
Regal
Noreco
Dom
inion
PA Resou
rces
Tullow
Lund
in Petroleum
Cove
Ene
rgy
Tower Resou
rces
Great Eastern Ene
rgy
Nighthawk Energy JKX
Melrose Resou
rces
Igas
Chariot O
il & Gas
Rockho
pper
Bankers p
etroleum DNO
Global Ene
rgy Develop
men
tAmerisur
Borders and
Sou
thern
Dragon Oil
Soco
Aurelian
Coastal Ene
rgy
Falkland
Oil & Gas
Maurel &
Prom
Prem
ier O
il Serica
Gulf K
eyston
eValiant Petroleum
Nautical Petroleum
Det Norske
BPC
Max Petroleum
Bowleve
nEnqu
est
Gulfsan
dsEncore
Faroe Pe
troleu
mSterling Energy
Ithaca
Northern Pe
troleu
mDesire Pe
troleu
mSalamande
r Heritage
Oil
Pano
roGreen
Dragon
Aminex
Plc
Hardy
Oil
Norse Ene
rgy
Uplift in valuation
from US$10
0/bl to
US$12
5/bl
0
20
40
60
80
100
120
140
160
Brent spot price E&P sector performance (indexed to Brent spot price)

May 30, 2011 Europe: Energy: Oil & Gas - E&P
Goldman Sachs Global Investment Research 23
Oil prices and commerciality - fiscal risk increases under higher oil prices
Higher oil prices do not necessarily result in higher valuations as they can also cause countries to adjust their fiscal regimes to
effectively tax away outsized returns gained through access to a country’s hydrocarbons. We believe that three factors are worthy of
consideration in assessing whether a country is at risk of adjusting its fiscal terms:
High returns for producers in the country. Countries need to ensure that companies continue activities and therefore low
returns are likely to reduce the likelihood of fiscal changes;
A low existing tax rate. If a government’s fiscal take is already high, a relatively large proportion of profits will go to the
government in any case and the possible delta by which to move the tax take is more limited
Assets are already producing. We believe there is less incentive to avoid changing the fiscal terms as oil companies in the
country will have already sunk substantial costs and will be less able to simply halt development. Most frontier areas remain at
lower tax rates until production begins (with Israel’s recent tax rise being a notable exception).
We show in Exhibits 33 and 34 the returns vs. tax take at US$85/bl (the 5-year forward price through most of 2009/2010) and at
US$110/bl. We believe in a sustained high oil price environment, tax rates in many countries to the right of the line in Exhibit 35 will
be at risk of change, although those countries with an immature or emerging industry may be reluctant to make changes to fiscal
regimes until production has been established.
Exhibit 34: High P/Is and low tax rates put outsized returns at risk Country tax rates vs. PIs for pre-sanction and under development projects
Exhibit 35: Higher oil price may lead to further tax increases Country tax rates vs. PI at US$110/bl
Source: Goldman Sachs Research estimates.
Source: Goldman Sachs Research estimates.
20%
30%
40%
50%
60%
70%
80%
90%
100%
1.00x 1.50x 2.00x 2.50x 3.00x 3.50x
Ove
rall
tax
take
PI ratio
Low returns and / or high existing tax rates limit chance
of fiscal renegotiation
High returns and relatively low existing tax rates increase risk of fiscal renegotiation
Algeria
Angola
Australia
Bolivia
Brazil
Canada
China
Congo
Egypt
Ghana
Indonesia
Iraq
Israel
Italy
Kazakhstan
LibyaMalaysia
Mozambique
Myanmar
Nigeria
Norway
Oman
Papua New Guinea
Peru
Qatar
Russia
Thailand
UAE
Uganda
UK
US
Venezuela
Vietnam
Israel - Top 280
UK - Top 280
20%
30%
40%
50%
60%
70%
80%
90%
100%
1.00x 1.50x 2.00x 2.50x 3.00x 3.50x
Ove
rall
tax
take
@ U
S$1
10/b
l
PI ratio @ US$110/bl
Low returns and / or high existing tax rates limit
chance of fiscal renegotiation
High returns and relatively low existing tax rates increase risk of fiscal
renegotiation
Algeria
Angola
Australia
Bolivia
Brazil
Canada
China
Congo
Egypt
Ghana
Indonesia
Iraq
Israel
Italy
KazakhstanLibya
Malaysia
Mozambique
Myanmar
Nigeria
Norway
Oman
Papua New Guinea
Peru
QatarRussia
Thailand
UAE
UK
US
VenezuelaVietnam
Uganda:PI 3.52x,
73%
May 30, 2011 Europe: Energy: Oil & Gas - E&P
Goldman Sachs Global Investment Research 24
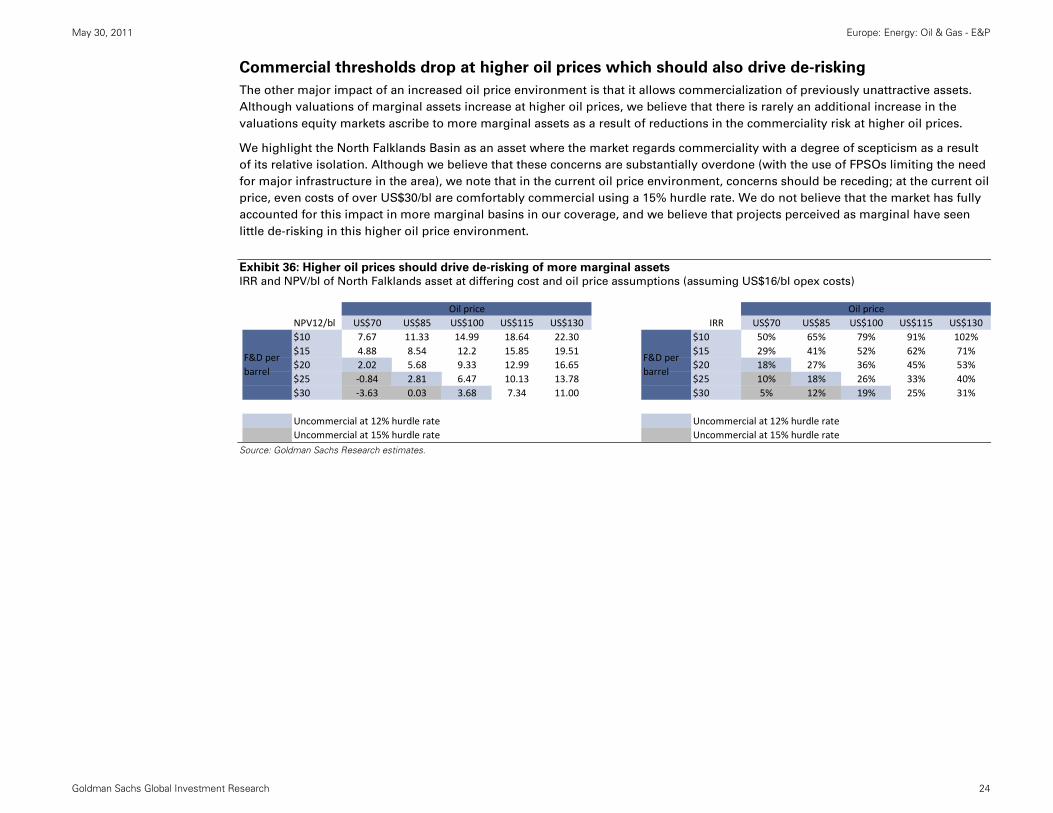
Commercial thresholds drop at higher oil prices which should also drive de-risking
The other major impact of an increased oil price environment is that it allows commercialization of previously unattractive assets.
Although valuations of marginal assets increase at higher oil prices, we believe that there is rarely an additional increase in the
valuations equity markets ascribe to more marginal assets as a result of reductions in the commerciality risk at higher oil prices.
We highlight the North Falklands Basin as an asset where the market regards commerciality with a degree of scepticism as a result
of its relative isolation. Although we believe that these concerns are substantially overdone (with the use of FPSOs limiting the need
for major infrastructure in the area), we note that in the current oil price environment, concerns should be receding; at the current oil
price, even costs of over US$30/bl are comfortably commercial using a 15% hurdle rate. We do not believe that the market has fully
accounted for this impact in more marginal basins in our coverage, and we believe that projects perceived as marginal have seen
little de-risking in this higher oil price environment.
Exhibit 36: Higher oil prices should drive de-risking of more marginal assets IRR and NPV/bl of North Falklands asset at differing cost and oil price assumptions (assuming US$16/bl opex costs)
Source: Goldman Sachs Research estimates.
NPV12/bl US$70 US$85 US$100 US$115 US$130 IRR US$70 US$85 US$100 US$115 US$130$10 7.67 11.33 14.99 18.64 22.30 $10 50% 65% 79% 91% 102%$15 4.88 8.54 12.2 15.85 19.51 $15 29% 41% 52% 62% 71%$20 2.02 5.68 9.33 12.99 16.65 $20 18% 27% 36% 45% 53%$25 ‐0.84 2.81 6.47 10.13 13.78 $25 10% 18% 26% 33% 40%$30 ‐3.63 0.03 3.68 7.34 11.00 $30 5% 12% 19% 25% 31%
Uncommercial at 12% hurdle rate Uncommercial at 12% hurdle rateUncommercial at 15% hurdle rate Uncommercial at 15% hurdle rate
Oil price Oil price
F&D per barrel
F&D per barrel

May 30, 2011 Europe: Energy: Oil & Gas - E&P
Goldman Sachs Global Investment Research 25
Adjustment to long-term exploration discount
We previously applied a 50% discount to medium-term drilling catalysts, reflecting uncertainties with long-dated catalysts (timing of
drilling, resource updates following additional seismic, lack of CPRs, etc.). Following further analysis of the performance of stocks
into drilling campaigns, we note that performance into a major catalyst is far from uniform, with many stocks outperforming up to
two years before the campaign. Catalysts, such as the booking of rigs, CPRs etc., however continue to drive shares. As a result, we
remove the blanket discount we had previously used and replace it with asset-specific discounts to account for specific uncertainties
in the build up to drilling. We also apply these discounts to high-impact exploration prospects being drilled in the next 12 months,
where these prospects represent greater than 50% of a company’s valuation. We now adjust our chances of success for the
following:
Lack of 3D seismic over prospects, 15% discount to chance of success (CoS);
Lack of CPR, 20% discount to CoS;
Lack of rig booked, 10% discount to CoS.
Exhibit 37: Chariot Oil has outperformed steadily into drilling in Namibia…
Chariot Oil’s share price performance vs. E&P universe
Exhibit 38: …while much of Desire’s outperformance came over 12 months
before Desire’s share price performance vs. E&P universe
Source: Datastream.
Source: Datastream.
‐100%
0%
100%
200%
300%
400%
500%
600%
700%
800%
900%
Seismic acquired (no sizes)
Increase in prospective resources
CPR (small decrease in prospective resource)
Nimrod structure identified
‐100%
‐50%
0%
50%
100%
150%
200%
250%
Farm in partner announced
Liz well dryRig booked
May 30, 2011 Europe: Energy: Oil & Gas - E&P
Goldman Sachs Global Investment Research 26
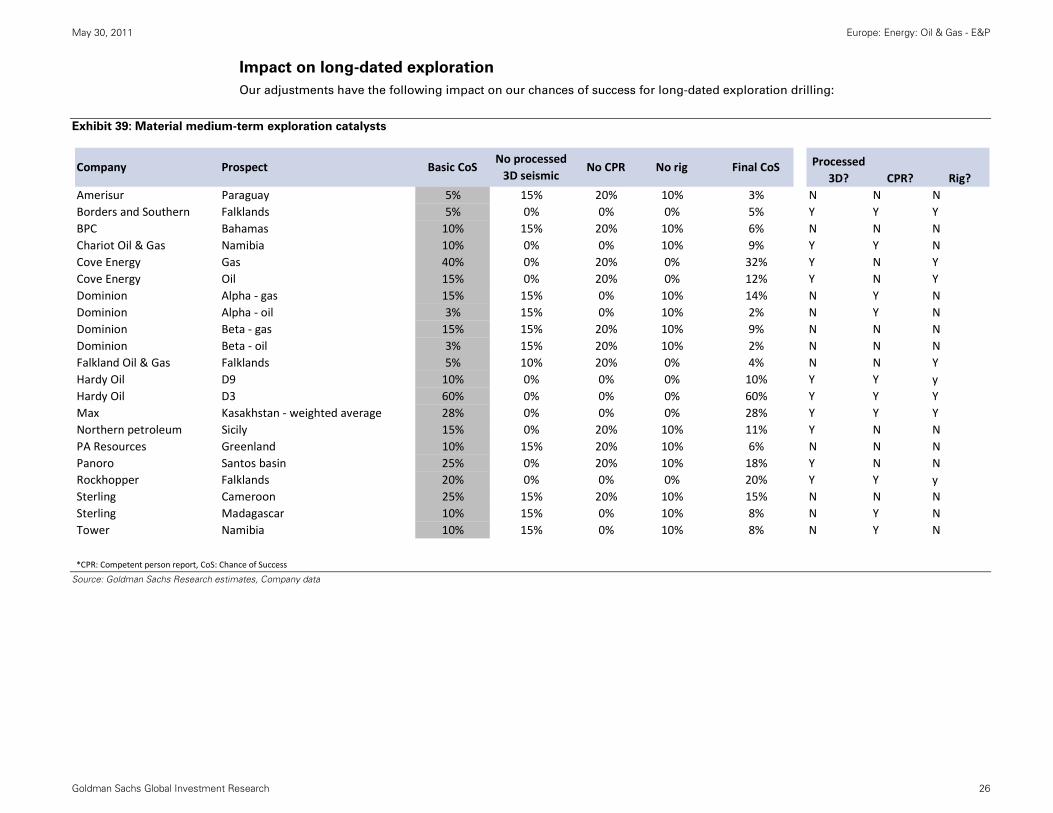
Impact on long-dated exploration
Our adjustments have the following impact on our chances of success for long-dated exploration drilling:
Exhibit 39: Material medium-term exploration catalysts
Source: Goldman Sachs Research estimates, Company data
Company Prospect Basic CoSNo processed 3D seismic
No CPR No rig Final CoS Processed 3D? CPR? Rig?
Amerisur Paraguay 5% 15% 20% 10% 3% N N NBorders and Southern Falklands 5% 0% 0% 0% 5% Y Y YBPC Bahamas 10% 15% 20% 10% 6% N N NChariot Oil & Gas Namibia 10% 0% 0% 10% 9% Y Y NCove Energy Gas 40% 0% 20% 0% 32% Y N YCove Energy Oil 15% 0% 20% 0% 12% Y N YDominion Alpha ‐ gas 15% 15% 0% 10% 14% N Y NDominion Alpha ‐ oil 3% 15% 0% 10% 2% N Y NDominion Beta ‐ gas 15% 15% 20% 10% 9% N N NDominion Beta ‐ oil 3% 15% 20% 10% 2% N N NFalkland Oil & Gas Falklands 5% 10% 20% 0% 4% N N YHardy Oil D9 10% 0% 0% 0% 10% Y Y yHardy Oil D3 60% 0% 0% 0% 60% Y Y YMax Kasakhstan ‐ weighted average 28% 0% 0% 0% 28% Y Y YNorthern petroleum Sicily 15% 0% 20% 10% 11% Y N NPA Resources Greenland 10% 15% 20% 10% 6% N N NPanoro Santos basin 25% 0% 20% 10% 18% Y N NRockhopper Falklands 20% 0% 0% 0% 20% Y Y ySterling Cameroon 25% 15% 20% 10% 15% N N NSterling Madagascar 10% 15% 0% 10% 8% N Y NTower Namibia 10% 15% 0% 10% 8% N Y N
*CPR: Competent person report, CoS: Chance of Success
May 30, 2011 Europe: Energy: Oil & Gas - E&P
Goldman Sachs Global Investment Research 27
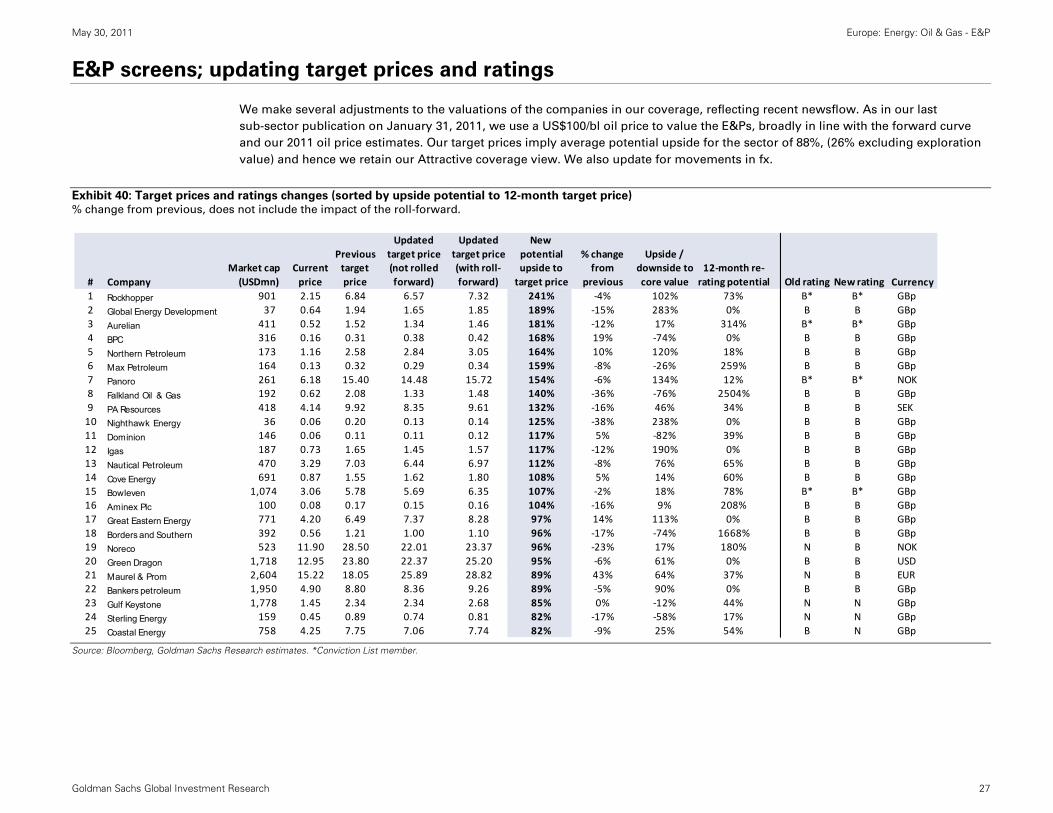
E&P screens; updating target prices and ratings
We make several adjustments to the valuations of the companies in our coverage, reflecting recent newsflow. As in our last
sub-sector publication on January 31, 2011, we use a US$100/bl oil price to value the E&Ps, broadly in line with the forward curve
and our 2011 oil price estimates. Our target prices imply average potential upside for the sector of 88%, (26% excluding exploration
value) and hence we retain our Attractive coverage view. We also update for movements in fx.
Exhibit 40: Target prices and ratings changes (sorted by upside potential to 12-month target price) % change from previous, does not include the impact of the roll-forward.
Source: Bloomberg, Goldman Sachs Research estimates. *Conviction List member.
# CompanyMarket cap (USDmn)
Current price
Previous target price
Updated target price (not rolled forward)
Updated target price (with roll‐forward)
New potential upside to target price
% change from
previous
Upside / downside to core value
12‐month re‐rating potential Old rating New rating Currency
1 Rockhopper 901 2.15 6.84 6.57 7.32 241% ‐4% 102% 73% B* B* GBp2 Global Energy Development 37 0.64 1.94 1.65 1.85 189% ‐15% 283% 0% B B GBp3 Aurelian 411 0.52 1.52 1.34 1.46 181% ‐12% 17% 314% B* B* GBp4 BPC 316 0.16 0.31 0.38 0.42 168% 19% ‐74% 0% B B GBp5 Northern Petroleum 173 1.16 2.58 2.84 3.05 164% 10% 120% 18% B B GBp6 Max Petroleum 164 0.13 0.32 0.29 0.34 159% ‐8% ‐26% 259% B B GBp7 Panoro 261 6.18 15.40 14.48 15.72 154% ‐6% 134% 12% B* B* NOK8 Falkland Oil & Gas 192 0.62 2.08 1.33 1.48 140% ‐36% ‐76% 2504% B B GBp9 PA Resources 418 4.14 9.92 8.35 9.61 132% ‐16% 46% 34% B B SEK10 Nighthawk Energy 36 0.06 0.20 0.13 0.14 125% ‐38% 238% 0% B B GBp11 Dominion 146 0.06 0.11 0.11 0.12 117% 5% ‐82% 39% B B GBp12 Igas 187 0.73 1.65 1.45 1.57 117% ‐12% 190% 0% B B GBp13 Nautical Petroleum 470 3.29 7.03 6.44 6.97 112% ‐8% 76% 65% B B GBp14 Cove Energy 691 0.87 1.55 1.62 1.80 108% 5% 14% 60% B B GBp15 Bowleven 1,074 3.06 5.78 5.69 6.35 107% ‐2% 18% 78% B* B* GBp16 Aminex Plc 100 0.08 0.17 0.15 0.16 104% ‐16% 9% 208% B B GBp17 Great Eastern Energy 771 4.20 6.49 7.37 8.28 97% 14% 113% 0% B B GBp18 Borders and Southern 392 0.56 1.21 1.00 1.10 96% ‐17% ‐74% 1668% B B GBp19 Noreco 523 11.90 28.50 22.01 23.37 96% ‐23% 17% 180% N B NOK20 Green Dragon 1,718 12.95 23.80 22.37 25.20 95% ‐6% 61% 0% B B USD21 Maurel & Prom 2,604 15.22 18.05 25.89 28.82 89% 43% 64% 37% N B EUR22 Bankers petroleum 1,950 4.90 8.80 8.36 9.26 89% ‐5% 90% 0% B B GBp23 Gulf Keystone 1,778 1.45 2.34 2.34 2.68 85% 0% ‐12% 44% N N GBp24 Sterling Energy 159 0.45 0.89 0.74 0.81 82% ‐17% ‐58% 17% N N GBp25 Coastal Energy 758 4.25 7.75 7.06 7.74 82% ‐9% 25% 54% B N GBp

May 30, 2011 Europe: Energy: Oil & Gas - E&P
Goldman Sachs Global Investment Research 28
Exhibit 40 cont'd: Target price and ratings changes (sorted by upside potential to 12-month target price)
Source: Bloomberg, Goldman Sachs Research estimates. *Conviction List member.
Material changes to 12-month target prices and rationale
We discuss the rationale for our target price changes in excess of 10% below: We make revisions to our assumed farm-out terms
following discussions with management teams, and now typically assume a 33% stake retention in return for a 1-2 well carry. We
also roll forward our valuation, making 2011 our new front year.
Aurelian – increasing of risking at Sierkierki from 70% to 65% chance of success following mechanical issues with the Trzek 2
well.
Amerisur – removal of long-dated drilling discount
Aminex – dilution from placing and updating US reserves following recent guidance.
Borders and Southern – adjustment of chances of success for South Falklands prospects in line with new methodology.
# CompanyMarket cap (USDmn)
Current price
Previous target price
Updated target price (not rolled forward)
Updated target price (with roll‐forward)
New potential upside to target price
% change from
previous
Upside / downside to core value
12‐month re‐rating potential Old rating New rating Currency
26 Faroe Petroleum 479 1.39 2.59 2.40 2.52 82% ‐7% 52% 78% N N GBp27 Det Norske 612 30.60 54.70 52.40 55.46 81% ‐4% 36% 95% B N NOK28 Chariot Oil & Gas 612 2.08 3.84 3.37 3.76 81% ‐12% ‐69% 1331% N N GBp29 Norse Energy 86 0.64 2.06 1.08 1.15 79% ‐48% 92% 0% N N NOK30 Salamander 702 2.80 4.65 4.60 5.00 79% ‐1% 15% 66% B N GBp31 Gulfsands 513 2.59 4.78 4.22 4.63 78% ‐12% 49% 60% N N GBp32 Serica 78 0.27 0.61 0.43 0.48 75% ‐30% ‐4% 127% N N GBp33 Tower Resources 106 0.06 0.07 0.09 0.10 72% 21% ‐95% 53% N N GBp34 Valiant Petroleum 343 5.32 10.06 8.03 8.75 64% ‐20% 51% 47% N N GBp35 DNO 1,201 7.02 9.70 10.50 11.49 64% 8% 10% 60% S N NOK36 Amerisur 357 0.24 0.28 0.36 0.38 60% 27% 3% 297% N N GBp37 Heritage Oil 1,115 2.38 4.20 3.54 3.69 55% ‐16% 5% 55% N N GBp38 Ithaca 545 1.31 1.99 1.87 1.99 52% ‐6% 58% 0% N N GBp39 Desire Petroleum 63 0.11 0.53 0.15 0.17 48% ‐71% ‐52% 84% N N GBp40 JKX 808 2.89 4.02 3.70 4.05 40% ‐8% ‐11% 46% N N GBp41 Encore 328 0.70 1.33 0.88 0.96 38% ‐34% 6% 86% S N GBp42 Dragon Oil 4,416 5.26 6.96 6.77 7.08 35% ‐3% 27% 1% N N GBp43 Soco 2,120 3.83 5.08 4.80 5.11 34% ‐6% 7% 6% N N GBp44 Regal 229 0.44 0.42 0.52 0.58 32% 24% ‐6% 0% N N GBp45 Tullow 18,684 12.92 17.03 16.22 17.03 32% ‐5% ‐24% 40% N N GBp46 Melrose Resources 457 2.45 3.19 2.81 3.14 28% ‐12% ‐18% 147% N N GBp47 Enquest 1,718 1.32 1.77 1.52 1.69 28% ‐14% 27% 0% N N GBp48 Hardy Oil 241 2.06 1.73 2.32 2.52 22% 34% ‐52% 158% S S GBp49 Premier Oil 3,578 4.72 5.97 5.54 5.74 22% ‐7% 8% 28% N S GBp50 Lundin Petroleum 4,315 84.15 80.00 90.72 96.00 14% 13% ‐12% 57% S S SEK
May 30, 2011 Europe: Energy: Oil & Gas - E&P
Goldman Sachs Global Investment Research 29
BPC – increase of prospect sizes to 4.3 bn bls for two prospects based on preliminary seismic data and a removal of our
medium-term drilling discount. Partly offset by an increase in WACC to 14% to reflect concerns over ability to drill before US
elections and potential delays to drilling and a reduction in assumed block retention post farm-out to 30% (from 50%).
Chariot – greater retention of Southern blocks following placement, offset by adjustment of chance of success to account for
lack of rig under new methodology and revised farm-out terms for Northern blocks (now assuming 33% retention for two well
programme, vs. 50% before).
Coastal Energy – reserves downgrade at the Bua Ban asset largely offset by recent drilling success.
Cove Energy – updating exploration timeline. Removing long-term drilling discount on prospects, but adjusting chances of
success for medium-term exploration in line with new methodlogy.
Desire – dry well at Ninky.
Det Norske – dry wells at Gulris and Dovregrubben.
DNO – de-risking of KRG contracts following exports and release of oil export payments from Baghdad to contractors.
Encore – UK tax adjustment and adjustment to Cladhan volumes following unsuccessful appraisal well reduce target price.
Downwards effect is partially offset by an increase in assumed volumes in and around Catcher.
Enquest – adjustment for increase in UK tax.
Faroe Petroleum – adjustment for increase in UK tax.
Great Eastern Energy – increase in estimated ramp up and production plateau per well.
Gulfsands – increase in political risking for Syria (to 75% chance of success from 100%) following political unrest. We also
update for results at Twaiba, Yousefieh South and KHE-101.
Hardy Oil – increase in Indian gas price assumptions (to US$8/mcf in the long term) following recent news of partial price
liberalization for D6 block.
Heritage Oil – increased risking and delays to Malta drilling catalysts due to Libyan conflict likely impacting negotiations on
border dispute.
Igas – adjustment for increased UK tax.
Ithaca – adjustment for increased UK tax.
Lundin – Increasing of assumed volumes in Alvheim and surrounding area. We now assume a P50 volume for Alvheim of
300mn boe (ahead of current guidance).
Maurel & Prom – updating for 2011 exploration programme and reserves upgrade in Gabon.

May 30, 2011 Europe: Energy: Oil & Gas - E&P
Goldman Sachs Global Investment Research 30
Melrose – adjustments to reserves following year-end and operational update, especially related to the shrinking of Kaliakra.
Adjustments to exploration programme, with Mansoura exploration prospects removed.
Nautical – adjustment for increased UK tax. Partially offset by increase in assumed volumes in and around Catcher and the
purchase of an additional stake in the Kraken field.
Nighthawk – increased risking on Jolly Ranch to 25% chance of success following well updates that show flow rates remain
below our assumed rate required for the project to be commercial for recently completed wells. We do not believe that the
recent reserves report was sufficiently wide-ranging to justify a downgrade to our estimates of the potential resource.
Norse Energy – increased political risking to New York shale gas assets following recent Chesapeake spill incident.
Northern Petroleum – Removal of medium-term drilling discount.
Noreco – dry well at Ronaldo, failure of Oselvar/Enoch divestment, un-commercial find at Svaneogle and sale of Brage.
PA Resources – further downgrade of our reserves assumptions at Azurite and more conservative assumptions on potential
farm-out terms in Greenland (now assuming retention of c. one-third of block for a two well carry, in line with the rest of our
coverage).
Premier Oil – UK tax adjustment, dry hole at Cherry, downgrade of Ca Rong Do reserves all reduce valuation. Partially offset by
higher assumed volumes in and around Catcher.
Regal – De-risking of asset following partial takeover on assumptions of increased funding capabilities.
Salamander – reducing chances of success at Dao Ruang to 20% following a disappointing first well and adjustments to our
modeling of the SRB tax in Thailand, offset by increases in Bualuang reserves.
Serica – adjustments for increased UK tax, further Kambuna reserves downgrade and increased risking at Columbus following
delay of expected sanction.
Sterling Energy– removal of medium-term drilling discount offset by adjustment to assumed farm-out terms in Cameroon to
bring in line with rest of sector (33% retention for two well carry). We also make adjustments to assumptions for the Sangaw
North well, de-risking our gas case and increasing the risk on the oil case following the company’s recent update.
Tower Resources – removal of medium-term drilling discount.
Valiant Petroleum – UK tax adjustment, downgrade of assumed reserves potential at Tybalt (to 13mn bls), adjustment of
assumptions on farm out at Handcross (now assuming retention of one-third of asset vs. half previously).
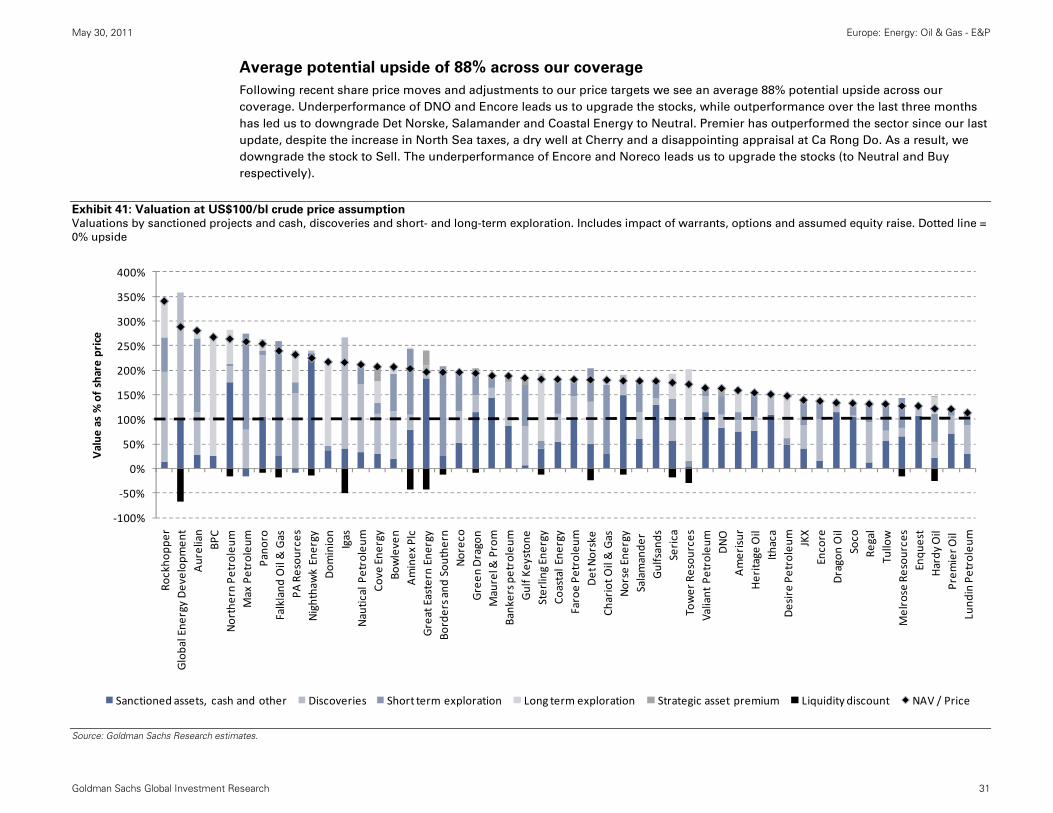
May 30, 2011 Europe: Energy: Oil & Gas - E&P
Goldman Sachs Global Investment Research 31
Average potential upside of 88% across our coverage
Following recent share price moves and adjustments to our price targets we see an average 88% potential upside across our
coverage. Underperformance of DNO and Encore leads us to upgrade the stocks, while outperformance over the last three months
has led us to downgrade Det Norske, Salamander and Coastal Energy to Neutral. Premier has outperformed the sector since our last
update, despite the increase in North Sea taxes, a dry well at Cherry and a disappointing appraisal at Ca Rong Do. As a result, we
downgrade the stock to Sell. The underperformance of Encore and Noreco leads us to upgrade the stocks (to Neutral and Buy
respectively).
Exhibit 41: Valuation at US$100/bl crude price assumption Valuations by sanctioned projects and cash, discoveries and short- and long-term exploration. Includes impact of warrants, options and assumed equity raise. Dotted line =
0% upside
Source: Goldman Sachs Research estimates.
‐100%
‐50%
0%
50%
100%
150%
200%
250%
300%
350%
400%
Rockho
pper
Global Ene
rgy Develop
men
tAurelian
BPC
Northern Pe
troleu
mMax Petroleum
Pano
roFalkland
Oil & Gas
PA Resou
rces
Nighthawk Energy
Dom
inion
Igas
Nautical Petroleum
Cove
Ene
rgy
Bowleven
Aminex
Plc
Great Eastern Ene
rgy
Borders and
Sou
thern
Noreco
Green
Dragon
Maurel &
Prom
Bankers p
etroleum
Gulf K
eyston
eSterling Energy
Coastal Ene
rgy
Faroe Pe
troleu
mDet Norske
Chariot O
il & Gas
Norse Ene
rgy
Salamande
r Gulfsands
Serica
Tower Resou
rces
Valiant Petroleum
DNO
Amerisur
Heritage
Oil
Ithaca
Desire Pe
troleu
mJKX
Encore
Dragon Oil
Soco
Regal
Tullow
Melrose Resou
rces
Enqu
est
Hardy
Oil
Prem
ier O
il Lund
in Petroleum
Value
as % of share price
Sanctioned assets, cash and other Discoveries Short term exploration Long term exploration Strategic asset premium Liquidity discount NAV / Price

May 30, 2011 Europe: Energy: Oil & Gas - E&P
Goldman Sachs Global Investment Research 32
Recent de-risking in equities has led to underperformance vs. the long-dated crude price;
producers have been more insulated
Since our last subsector update on January 31, 2011, the E&P universe has underperformed the Brent price by c.10%. We believe
that this has been driven by a weakening risk appetite among investors, which has driven up equity risk premia. However, we
maintain our belief that tangible, dollar-based assets are not the right assets to be selling during periods of instability, and we would
expect the sector to ultimately revert back to levels implied by the long run crude price. As a result, we remain positive on the
subsector.
Another impact of this reduced appetite for risk has been a favouring of companies with production over companies without. Since
the end of March, companies with over 20% of their value in producing assets (GS estimates) have outperformed those with less by
almost 10%. We believe that this has created an attractive entry point into the non-producers, especially given the thematic
advantages that we believe the high-impact explorers will increasingly enjoy.
Exhibit 42: Equities have underperformed the crude price since our last
subsector update
Exhibit 43: Producers have outperformed explorers
23 companies classed as “producers”, 27 classed as “non-producers”
Source: Datastream.
Source: Datastream.
80
90
100
110
120
130
140
E&Ps Brent price
80
85
90
95
100
105
110
Producers Non‐producers

May 30, 2011 Europe: Energy: Oil & Gas - E&P
Goldman Sachs Global Investment Research 33
Subsector trading at discount to core value + discoveries at US $100/bl
Our estimates suggest that assuming a long run oil price of US$100/bl the core value (including risked discoveries) of the sector is
currently pricing in average upside of 26% to current share prices. This has increased from a 6% premium since our last subsector
update – a result of the weakness in the sector that has taken place during the period and a result of rolling forward our numbers to
make 2011 our front year. Given the re-rating potential we see in a number of stocks in the universe and that we are using a long-
run oil price close to the current 3-year forward price, we regard the risk / reward in the sector as attractive and believe that the
drops in share prices as a result of de-risking has been overdone.
Exhibit 44: Average 26% upside to core value is attractive in our view
Upside/downside excluding liquidity/funding adjustments
Source: Goldman Sachs Research estimates, Bloomberg.
‐150%
‐100%
‐50%
0%
50%
100%
150%
200%
250%
300%
350%
Global Ene
rgy Develop
men
tNighthawk Energy Igas
Pano
roNorthern Pe
troleu
mGreat Eastern Ene
rgy
Rockho
pper
Norse Ene
rgy
Bankers p
etroleum
Nautical Petroleum
Maurel &
Prom
Green
Dragon
Ithaca
Faroe Pe
troleu
mValiant Petroleum
Gulfsands
PA Resou
rces
Det N
orske
Dragon
Oil
Enqu
est
Coastal Ene
rgy
Bowleven
Noreco
Aurelian
Salamande
r Co
ve Ene
rgy
DNO
Aminex
Plc
Prem
ier O
il Soco
Encore
Heritage
Oil
Amerisu
rSerica
Regal
JKX
Lund
in Petroleum
Melrose Resou
rces
Gulf K
eyston
eTullow
Max Petroleum
Desire Pe
troleu
mHardy
Oil
Chariot O
il & Gas
Sterling Energy
Borders and
Sou
thern
BPC
Falkland
Oil & Gas
Dominion
Tower Resou
rces
Upside to co
re value
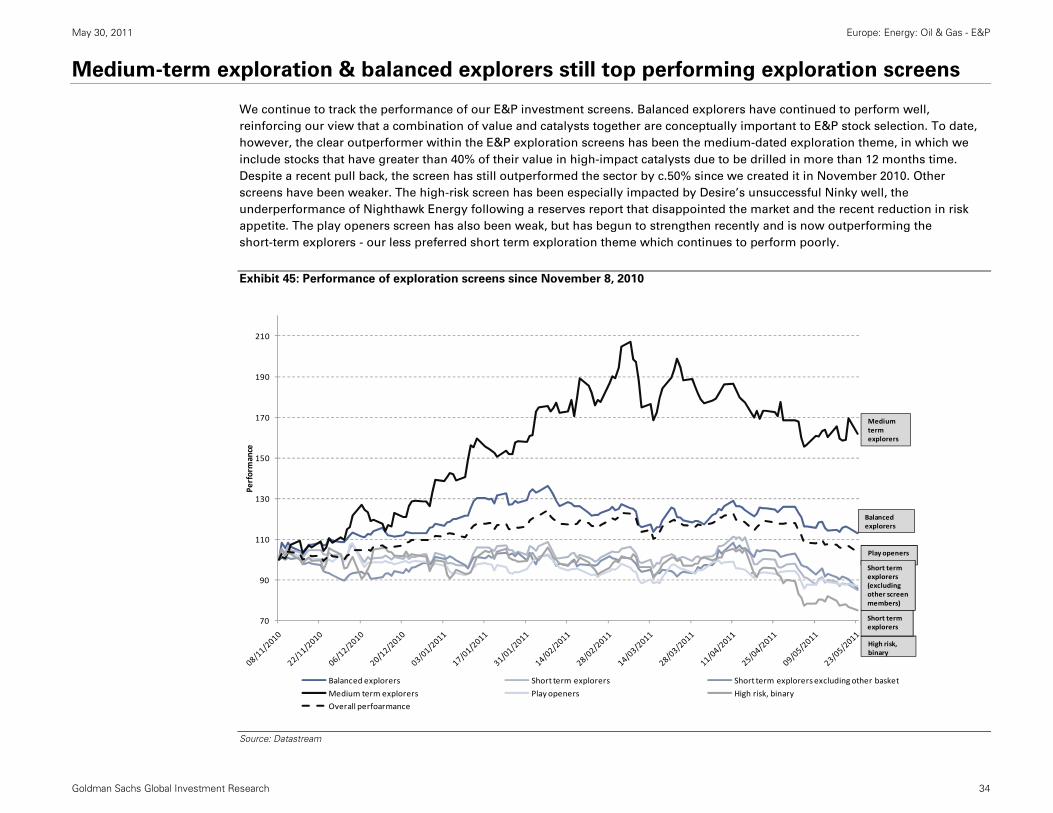
May 30, 2011 Europe: Energy: Oil & Gas - E&P
Goldman Sachs Global Investment Research 34
Medium-term exploration & balanced explorers still top performing exploration screens
We continue to track the performance of our E&P investment screens. Balanced explorers have continued to perform well,
reinforcing our view that a combination of value and catalysts together are conceptually important to E&P stock selection. To date,
however, the clear outperformer within the E&P exploration screens has been the medium-dated exploration theme, in which we
include stocks that have greater than 40% of their value in high-impact catalysts due to be drilled in more than 12 months time.
Despite a recent pull back, the screen has still outperformed the sector by c.50% since we created it in November 2010. Other
screens have been weaker. The high-risk screen has been especially impacted by Desire’s unsuccessful Ninky well, the
underperformance of Nighthawk Energy following a reserves report that disappointed the market and the recent reduction in risk
appetite. The play openers screen has also been weak, but has begun to strengthen recently and is now outperforming the
short-term explorers - our less preferred short term exploration theme which continues to perform poorly.
Exhibit 45: Performance of exploration screens since November 8, 2010
Source: Datastream
70
90
110
130
150
170
190
210
Performance
Balanced explorers Short term explorers Short term explorers excluding other basket
Medium term explorers Play openers High risk, binary
Overall perfoarmance
Balancedexplorers
Medium term explorers
High risk, binary
Play openers
Short termexplorers (excludingother screen members)
Short termexplorers
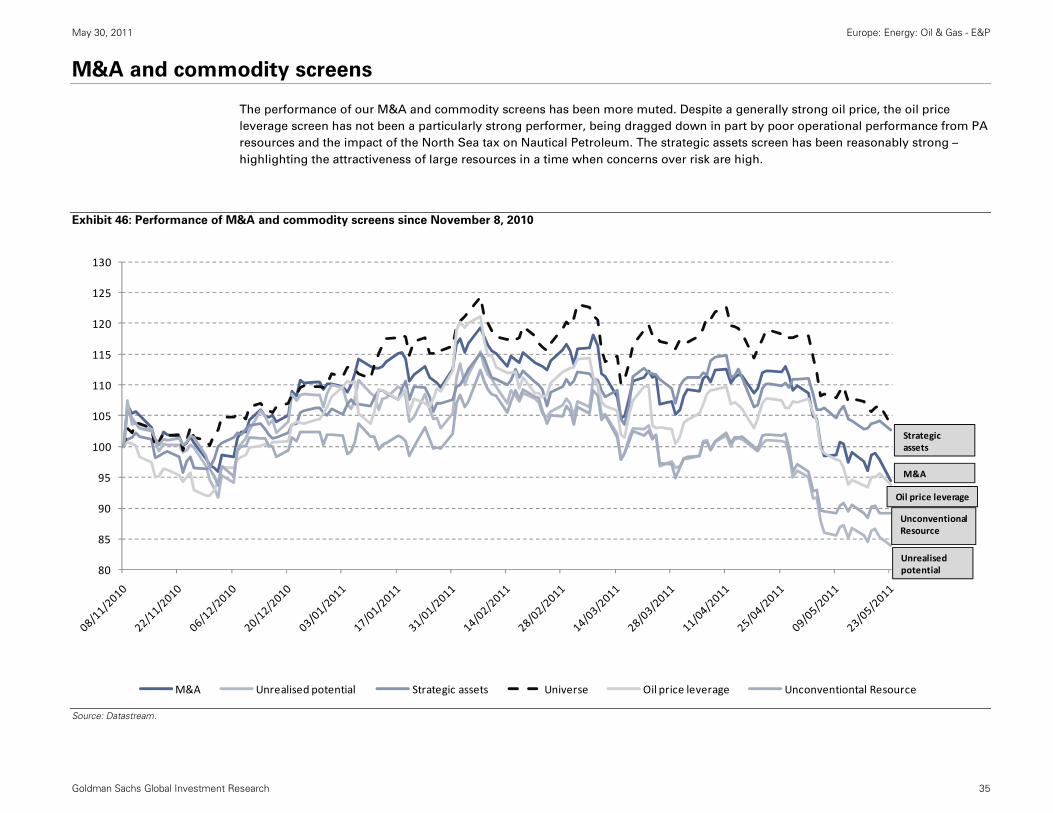
May 30, 2011 Europe: Energy: Oil & Gas - E&P
Goldman Sachs Global Investment Research 35
M&A and commodity screens
The performance of our M&A and commodity screens has been more muted. Despite a generally strong oil price, the oil price
leverage screen has not been a particularly strong performer, being dragged down in part by poor operational performance from PA
resources and the impact of the North Sea tax on Nautical Petroleum. The strategic assets screen has been reasonably strong –
highlighting the attractiveness of large resources in a time when concerns over risk are high.
Exhibit 46: Performance of M&A and commodity screens since November 8, 2010
Source: Datastream.
80
85
90
95
100
105
110
115
120
125
130
M&A Unrealised potential Strategic assets Universe Oil price leverage Unconventiontal Resource
Unrealised potential
Oil price leverage
M&A
UnconventionalResource
Strategic assets
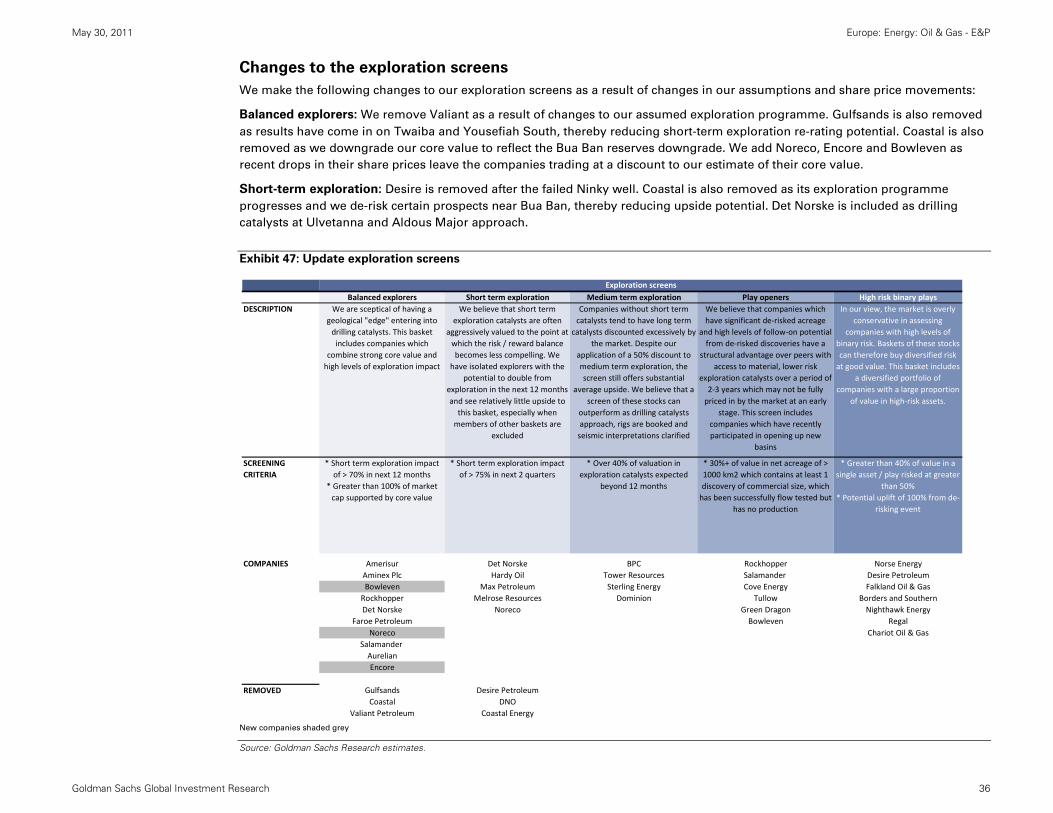
May 30, 2011 Europe: Energy: Oil & Gas - E&P
Goldman Sachs Global Investment Research 36
Changes to the exploration screens
We make the following changes to our exploration screens as a result of changes in our assumptions and share price movements:
Balanced explorers: We remove Valiant as a result of changes to our assumed exploration programme. Gulfsands is also removed
as results have come in on Twaiba and Yousefiah South, thereby reducing short-term exploration re-rating potential. Coastal is also
removed as we downgrade our core value to reflect the Bua Ban reserves downgrade. We add Noreco, Encore and Bowleven as
recent drops in their share prices leave the companies trading at a discount to our estimate of their core value.
Short-term exploration: Desire is removed after the failed Ninky well. Coastal is also removed as its exploration programme
progresses and we de-risk certain prospects near Bua Ban, thereby reducing upside potential. Det Norske is included as drilling
catalysts at Ulvetanna and Aldous Major approach.
Exhibit 47: Update exploration screens
New companies shaded grey
Source: Goldman Sachs Research estimates.
Balanced explorers Short term exploration Medium term exploration Play openers High risk binary playsDESCRIPTION We are sceptical of having a
geological "edge" entering into drilling catalysts. This basket includes companies which
combine strong core value and high levels of exploration impact
We believe that short term exploration catalysts are often
aggressively valued to the point at which the risk / reward balance becomes less compelling. We
have isolated explorers with the potential to double from
exploration in the next 12 months and see relatively little upside to this basket, especially when members of other baskets are
excluded
Companies without short term catalysts tend to have long term
catalysts discounted excessively by the market. Despite our
application of a 50% discount to medium term exploration, the screen still offers substantial
average upside. We believe that a screen of these stocks can
outperform as drilling catalysts approach, rigs are booked and seismic interpretations clarified
We believe that companies which have significant de‐risked acreage
and high levels of follow‐on potential from de‐risked discoveries have a
structural advantage over peers with access to material, lower risk
exploration catalysts over a period of 2‐3 years which may not be fully priced in by the market at an early
stage. This screen includes companies which have recently participated in opening up new
basins
In our view, the market is overly conservative in assessing
companies with high levels of binary risk. Baskets of these stocks can therefore buy diversified risk at good value. This basket includes
a diversified portfolio of companies with a large proportion
of value in high‐risk assets.
SCREENING CRITERIA
* Short term exploration impact of > 70% in next 12 months
* Greater than 100% of market cap supported by core value
* Short term exploration impact of > 75% in next 2 quarters
* Over 40% of valuation in exploration catalysts expected
beyond 12 months
* 30%+ of value in net acreage of > 1000 km2 which contains at least 1 discovery of commercial size, which has been successfully flow tested but
has no production
* Greater than 40% of value in a single asset / play risked at greater
than 50%* Potential uplift of 100% from de‐
risking event
Amerisur Det Norske BPC Rockhopper Norse EnergyAminex Plc Hardy Oil Tower Resources Salamander Desire PetroleumBowleven Max Petroleum Sterling Energy Cove Energy Falkland Oil & GasRockhopper Melrose Resources Dominion Tullow Borders and SouthernDet Norske Noreco Green Dragon Nighthawk Energy
Faroe Petroleum Bowleven RegalNoreco Chariot Oil & Gas
Salamander AurelianEncore
Gulfsands Desire PetroleumCoastal DNO
Valiant Petroleum Coastal Energy
REMOVED
COMPANIES
Exploration screens
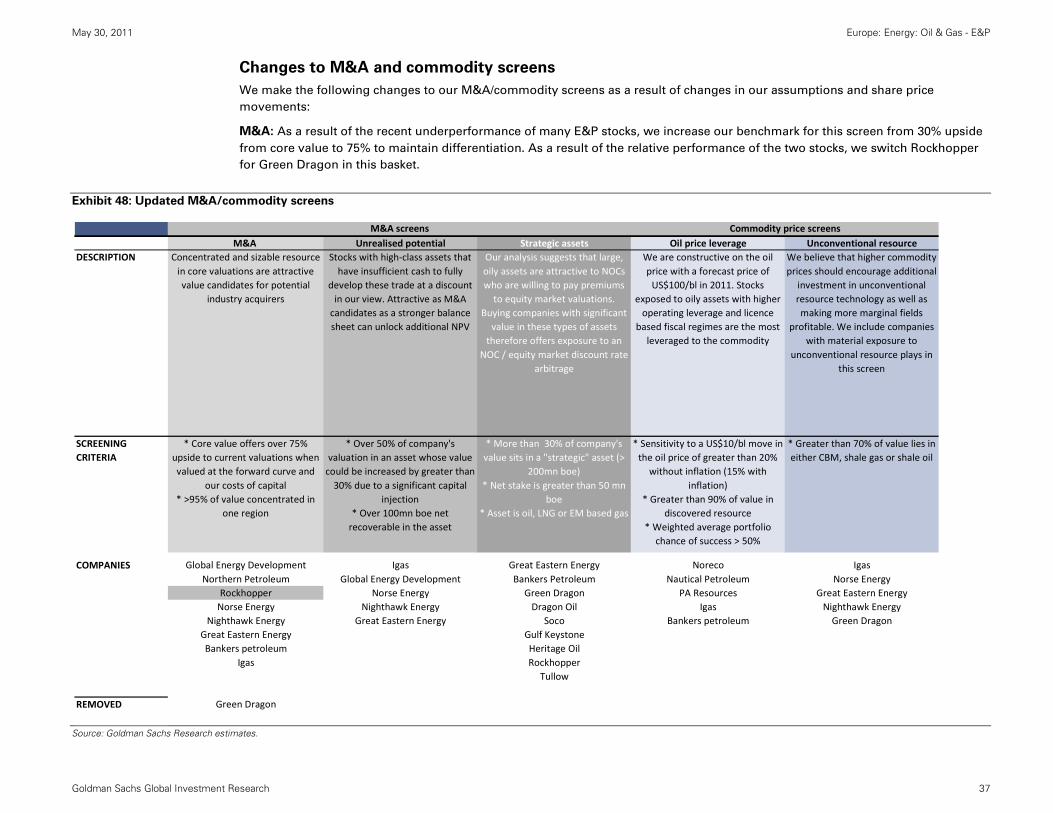
May 30, 2011 Europe: Energy: Oil & Gas - E&P
Goldman Sachs Global Investment Research 37
Changes to M&A and commodity screens
We make the following changes to our M&A/commodity screens as a result of changes in our assumptions and share price
movements:
M&A: As a result of the recent underperformance of many E&P stocks, we increase our benchmark for this screen from 30% upside
from core value to 75% to maintain differentiation. As a result of the relative performance of the two stocks, we switch Rockhopper
for Green Dragon in this basket.
Exhibit 48: Updated M&A/commodity screens
Source: Goldman Sachs Research estimates.
M&A Unrealised potential Strategic assets Oil price leverage Unconventional resourceDESCRIPTION Concentrated and sizable resource
in core valuations are attractive value candidates for potential
industry acquirers
Stocks with high‐class assets that have insufficient cash to fully
develop these trade at a discount in our view. Attractive as M&A candidates as a stronger balance sheet can unlock additional NPV
Our analysis suggests that large, oily assets are attractive to NOCs who are willing to pay premiums to equity market valuations.
Buying companies with significant value in these types of assets therefore offers exposure to an
NOC / equity market discount rate arbitrage
We are constructive on the oil price with a forecast price of US$100/bl in 2011. Stocks
exposed to oily assets with higher operating leverage and licence
based fiscal regimes are the most leveraged to the commodity
We believe that higher commodity prices should encourage additional
investment in unconventional resource technology as well as making more marginal fields
profitable. We include companies with material exposure to
unconventional resource plays in this screen
SCREENING CRITERIA
* Core value offers over 75% upside to current valuations when valued at the forward curve and
our costs of capital* >95% of value concentrated in
one region
* Over 50% of company's valuation in an asset whose value could be increased by greater than 30% due to a significant capital
injection* Over 100mn boe net recoverable in the asset
* More than 30% of company's value sits in a "strategic" asset (>
200mn boe)* Net stake is greater than 50 mn
boe * Asset is oil, LNG or EM based gas
* Sensitivity to a US$10/bl move in the oil price of greater than 20%
without inflation (15% with inflation)
* Greater than 90% of value in discovered resource
* Weighted average portfolio chance of success > 50%
* Greater than 70% of value lies in either CBM, shale gas or shale oil
Global Energy Development Igas Great Eastern Energy Noreco IgasNorthern Petroleum Global Energy Development Bankers Petroleum Nautical Petroleum Norse Energy
Rockhopper Norse Energy Green Dragon PA Resources Great Eastern EnergyNorse Energy Nighthawk Energy Dragon Oil Igas Nighthawk Energy
Nighthawk Energy Great Eastern Energy Soco Bankers petroleum Green DragonGreat Eastern Energy Gulf KeystoneBankers petroleum Heritage Oil
Igas RockhopperTullow
Green Dragon
Commodity price screens
REMOVED
COMPANIES
M&A screens
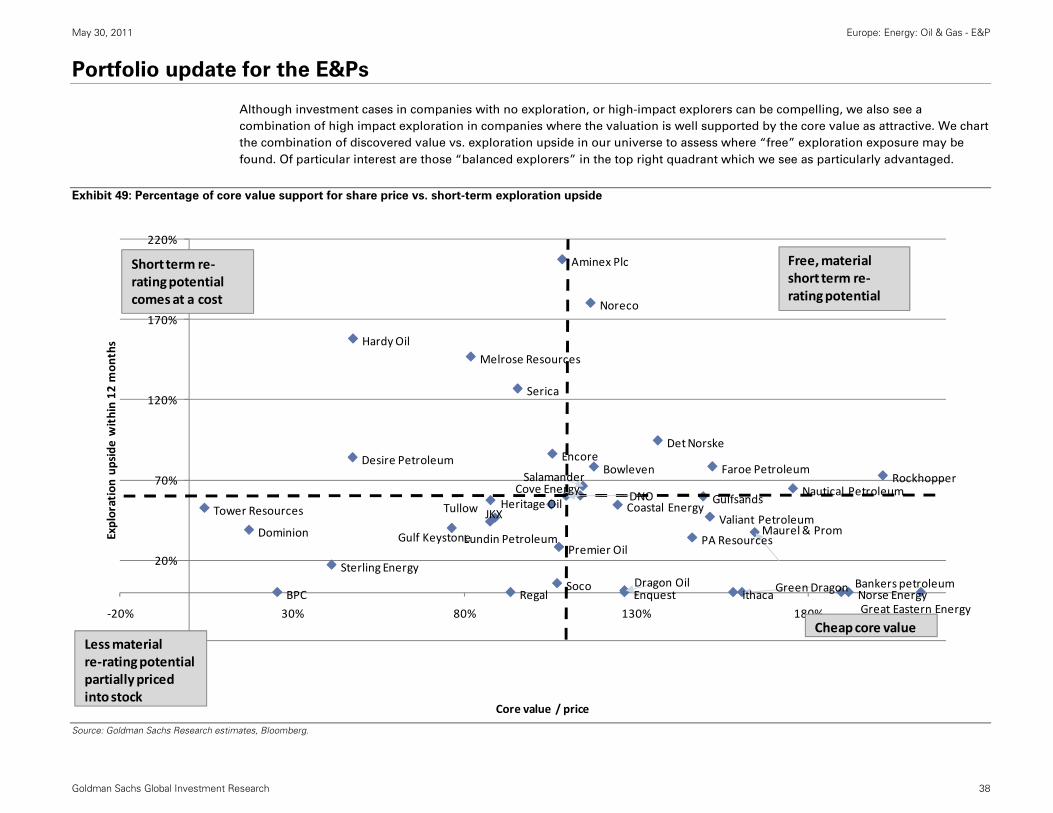
May 30, 2011 Europe: Energy: Oil & Gas - E&P
Goldman Sachs Global Investment Research 38
Portfolio update for the E&Ps
Although investment cases in companies with no exploration, or high-impact explorers can be compelling, we also see a
combination of high impact exploration in companies where the valuation is well supported by the core value as attractive. We chart
the combination of discovered value vs. exploration upside in our universe to assess where “free” exploration exposure may be
found. Of particular interest are those “balanced explorers” in the top right quadrant which we see as particularly advantaged.
Exhibit 49: Percentage of core value support for share price vs. short-term exploration upside
Source: Goldman Sachs Research estimates, Bloomberg.
‐30%
20%
70%
120%
170%
220%
‐20% 30% 80% 130% 180%
Exploration up
side
within 12
mon
ths
Core value / price
Free, material short term re‐rating potential
Short term re‐rating potential comes at a cost
Less material re‐ratingpotential partially priced into stock
Cheap core value
Aminex Plc
Desire Petroleum
Gulfsands
Dominion
Faroe PetroleumBowleven
Gulf Keystone
Hardy Oil
Noreco
PA Resources
Rockhopper
Sterling Energy
Tower Resources
Melrose Resources
Norse Energy
Serica
DNOJKX
Regal Enquest
Det Norske
Nautical Petroleum
Valiant Petroleum
Ithaca
Cove Energy
Great Eastern Energy
Bankers petroleumBPC
Coastal Energy
Soco
Encore
Dragon Oil
Heritage Oil
Premier Oil
Salamander
Tullow
Lundin Petroleum
Green Dragon
Maurel & Prom
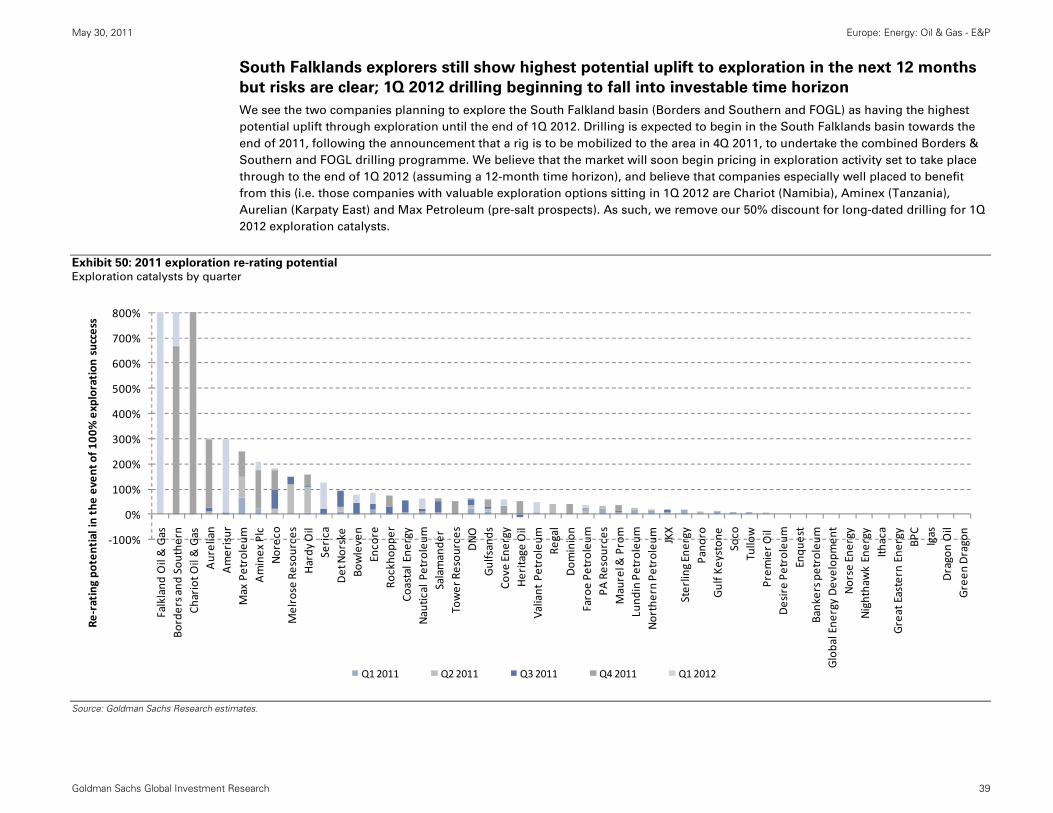
May 30, 2011 Europe: Energy: Oil & Gas - E&P
Goldman Sachs Global Investment Research 39
South Falklands explorers still show highest potential uplift to exploration in the next 12 months
but risks are clear; 1Q 2012 drilling beginning to fall into investable time horizon
We see the two companies planning to explore the South Falkland basin (Borders and Southern and FOGL) as having the highest
potential uplift through exploration until the end of 1Q 2012. Drilling is expected to begin in the South Falklands basin towards the
end of 2011, following the announcement that a rig is to be mobilized to the area in 4Q 2011, to undertake the combined Borders &
Southern and FOGL drilling programme. We believe that the market will soon begin pricing in exploration activity set to take place
through to the end of 1Q 2012 (assuming a 12-month time horizon), and believe that companies especially well placed to benefit
from this (i.e. those companies with valuable exploration options sitting in 1Q 2012 are Chariot (Namibia), Aminex (Tanzania),
Aurelian (Karpaty East) and Max Petroleum (pre-salt prospects). As such, we remove our 50% discount for long-dated drilling for 1Q
2012 exploration catalysts.
Exhibit 50: 2011 exploration re-rating potential Exploration catalysts by quarter
Source: Goldman Sachs Research estimates.
‐100%
0%
100%
200%
300%
400%
500%
600%
700%
800%
Falkland
Oil & Gas
Borders and
Sou
thern
Chariot O
il & Gas
Aurelian
Amerisur
Max Petroleum
Aminex
Plc
Noreco
Melrose Resou
rces
Hardy
Oil
Serica
Det Norske
Bowleven
Encore
Rockho
pper
Coastal Ene
rgy
Nautical Petroleum
Salamande
r Tower Resou
rces
DNO
Gulfsands
Cove
Ene
rgy
Heritage
Oil
Valiant Petroleum
Regal
Dom
inion
Faroe Pe
troleu
mPA
Resou
rces
Maurel &
Prom
Lund
in Petroleum
Northern Pe
troleu
m JKX
Sterling Energy
Pano
roGulf K
eyston
eSoco
Tullow
Prem
ier O
il Desire Pe
troleu
mEnqu
est
Bankers p
etroleum
Global Ene
rgy Develop
men
tNorse Ene
rgy
Nighthawk Energy
Ithaca
Great Eastern Ene
rgy
BPC
Igas
Dragon Oil
Green
Dragon
Re‐rating po
tential in the even
t of 1
00% exploration
success
Q1 2011 Q2 2011 Q3 2011 Q4 2011 Q1 2012

May 30, 2011 Europe: Energy: Oil & Gas - E&P
Goldman Sachs Global Investment Research 40
North Sea performance weak on tax change; Falklands and Kurdistan remain weak
We continue to track the performance of the regions. Since our last sector update (January 31, 2011), the Kurdistan and Falkland
regions have remained weak. Desire’s disappointing Ninky well result has impacted the Falklands basin significantly. Stocks
exposed to the UK’S North Sea have been particularly weak, following the UK budget ruling on increased tax to be paid in oil price
environments above US$75/bl.
Ukraine has been the best performer, driven by continuing good performance from Regal. Nambia’s approaching drilling catalysts
have also helped strong performance, despite some concerns over resource nationalism following reports of changes to future
mining contracts.
Exhibit 51: Regional performance since November 8, 2010
Source: Datastream.
60.0
80.0
100.0
120.0
140.0
160.0
180.0
200.0
220.0
240.0
Falklands Kurdistan North Sea Ukraine East Africa West Africa Norway Namibia
West Africa
East Africa
Ukraine
Norway
UK North Sea
Falklands
Kurdistan
Namibia
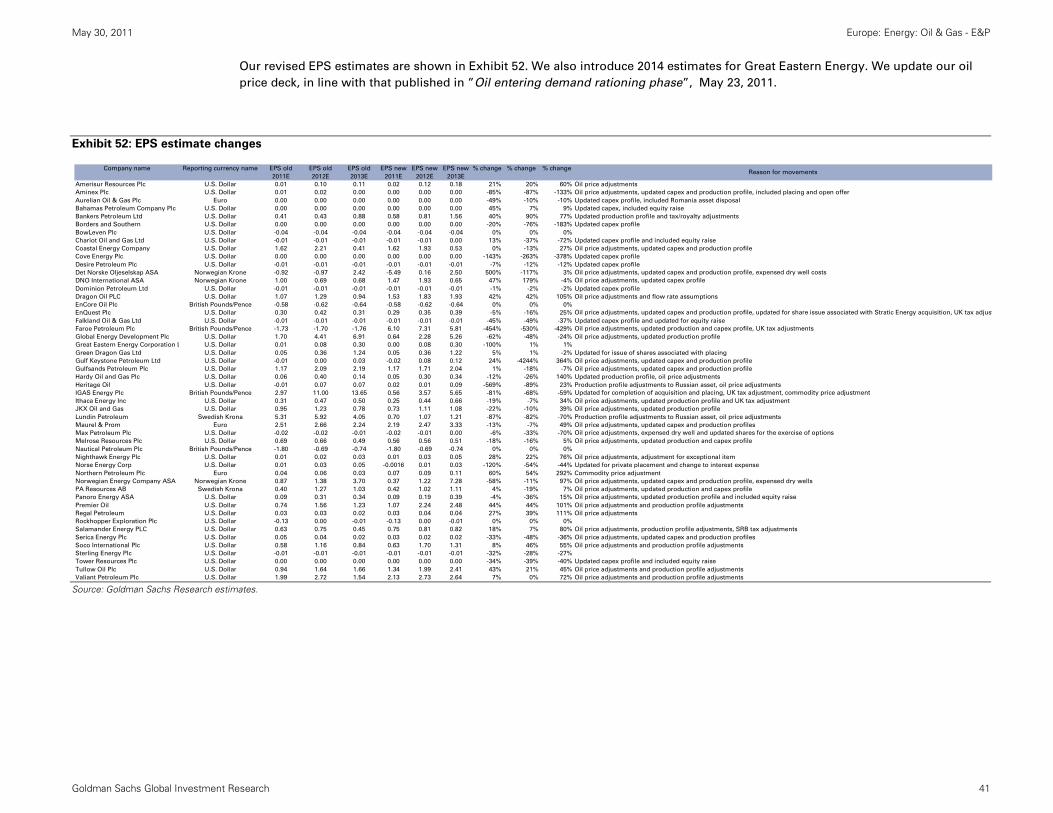
May 30, 2011 Europe: Energy: Oil & Gas - E&P
Goldman Sachs Global Investment Research 41
Our revised EPS estimates are shown in Exhibit 52. We also introduce 2014 estimates for Great Eastern Energy. We update our oil
price deck, in line with that published in ”Oil entering demand rationing phase”, May 23, 2011.
Exhibit 52: EPS estimate changes
Source: Goldman Sachs Research estimates.
Company name Reporting currency name EPS old EPS old EPS old EPS new EPS new EPS new % change % change % change
2011E 2012E 2013E 2011E 2012E 2013E
Amerisur Resources Plc U.S. Dollar 0.01 0.10 0.11 0.02 0.12 0.18 21% 20% 60% Oil price adjustments
Aminex Plc U.S. Dollar 0.01 0.02 0.00 0.00 0.00 0.00 -85% -87% -133% Oil price adjustments, updated capex and production profile, included placing and open offer
Aurelian Oil & Gas Plc Euro 0.00 0.00 0.00 0.00 0.00 0.00 -49% -10% -10% Updated capex profile, included Romania asset disposal
Bahamas Petroleum Company Plc U.S. Dollar 0.00 0.00 0.00 0.00 0.00 0.00 45% 7% 9% Updated capex, included equity raise
Bankers Petroleum Ltd U.S. Dollar 0.41 0.43 0.88 0.58 0.81 1.56 40% 90% 77% Updated production profile and tax/royalty adjustments
Borders and Southern U.S. Dollar 0.00 0.00 0.00 0.00 0.00 0.00 -20% -76% -183% Updated capex profile
BowLeven Plc U.S. Dollar -0.04 -0.04 -0.04 -0.04 -0.04 -0.04 0% 0% 0%
Chariot Oil and Gas Ltd U.S. Dollar -0.01 -0.01 -0.01 -0.01 -0.01 0.00 13% -37% -72% Updated capex profile and included equity raise
Coastal Energy Company U.S. Dollar 1.62 2.21 0.41 1.62 1.93 0.53 0% -13% 27% Oil price adjustments, updated capex and production profile
Cove Energy Plc U.S. Dollar 0.00 0.00 0.00 0.00 0.00 0.00 -143% -263% -378% Updated capex profile
Desire Petroleum Plc U.S. Dollar -0.01 -0.01 -0.01 -0.01 -0.01 -0.01 -7% -12% -12% Updated capex profile
Det Norske Oljeselskap ASA Norwegian Krone -0.92 -0.97 2.42 -5.49 0.16 2.50 500% -117% 3% Oil price adjustments, updated capex and production profile, expensed dry well costs
DNO International ASA Norwegian Krone 1.00 0.69 0.68 1.47 1.93 0.65 47% 179% -4% Oil price adjustments, updated capex profile
Dominion Petroleum Ltd U.S. Dollar -0.01 -0.01 -0.01 -0.01 -0.01 -0.01 -1% -2% -2% Updated capex profile
Dragon Oil PLC U.S. Dollar 1.07 1.29 0.94 1.53 1.83 1.93 42% 42% 105% Oil price adjustments and flow rate assumptions
EnCore Oil Plc British Pounds/Pence -0.58 -0.62 -0.64 -0.58 -0.62 -0.64 0% 0% 0%
EnQuest Plc U.S. Dollar 0.30 0.42 0.31 0.29 0.35 0.39 -5% -16% 25% Oil price adjustments, updated capex and production profile, updated for share issue associated with Stratic Energy acquisition, UK tax adjust
Falkland Oil & Gas Ltd U.S. Dollar -0.01 -0.01 -0.01 -0.01 -0.01 -0.01 -45% -49% -37% Updated capex profile and updated for equity raise
Faroe Petroleum Plc British Pounds/Pence -1.73 -1.70 -1.76 6.10 7.31 5.81 -454% -530% -429% Oil price adjustments, updated production and capex profile, UK tax adjustments
Global Energy Development Plc U.S. Dollar 1.70 4.41 6.91 0.64 2.28 5.26 -62% -48% -24% Oil price adjustments, updated production profile
Great Eastern Energy Corporation L U.S. Dollar 0.01 0.08 0.30 0.00 0.08 0.30 -100% 1% 1%
Green Dragon Gas Ltd U.S. Dollar 0.05 0.36 1.24 0.05 0.36 1.22 5% 1% -2% Updated for issue of shares associated with placing
Gulf Keystone Petroleum Ltd U.S. Dollar -0.01 0.00 0.03 -0.02 0.08 0.12 24% -4244% 364% Oil price adjustments, updated capex and production profile
Gulfsands Petroleum Plc U.S. Dollar 1.17 2.09 2.19 1.17 1.71 2.04 1% -18% -7% Oil price adjustments, updated capex and production profile
Hardy Oil and Gas Plc U.S. Dollar 0.06 0.40 0.14 0.05 0.30 0.34 -12% -26% 140% Updated production profile, oil price adjustments
Heritage Oil U.S. Dollar -0.01 0.07 0.07 0.02 0.01 0.09 -569% -89% 23% Production profile adjustments to Russian asset, oil price adjustments
IGAS Energy Plc British Pounds/Pence 2.97 11.00 13.65 0.56 3.57 5.65 -81% -68% -59% Updated for completion of acquisition and placing, UK tax adjustment, commodity price adjustment
Ithaca Energy Inc U.S. Dollar 0.31 0.47 0.50 0.25 0.44 0.66 -19% -7% 34% Oil price adjustments, updated production profile and UK tax adjustment
JKX Oil and Gas U.S. Dollar 0.95 1.23 0.78 0.73 1.11 1.08 -22% -10% 39% Oil price adjustments, updated production profile
Lundin Petroleum Swedish Krona 5.31 5.92 4.05 0.70 1.07 1.21 -87% -82% -70% Production profile adjustments to Russian asset, oil price adjustments
Maurel & Prom Euro 2.51 2.66 2.24 2.19 2.47 3.33 -13% -7% 49% Oil price adjustments, updated capex and production profiles
Max Petroleum Plc U.S. Dollar -0.02 -0.02 -0.01 -0.02 -0.01 0.00 -6% -33% -70% Oil price adjustments, expensed dry well and updated shares for the exercise of options
Melrose Resources Plc U.S. Dollar 0.69 0.66 0.49 0.56 0.56 0.51 -18% -16% 5% Oil price adjustments, updated production and capex profile
Nautical Petroleum Plc British Pounds/Pence -1.80 -0.69 -0.74 -1.80 -0.69 -0.74 0% 0% 0%
Nighthawk Energy Plc U.S. Dollar 0.01 0.02 0.03 0.01 0.03 0.05 28% 22% 76% Oil price adjustments, adjustment for exceptional item
Norse Energy Corp U.S. Dollar 0.01 0.03 0.05 -0.0016 0.01 0.03 -120% -54% -44% Updated for private placement and change to interest expense
Northern Petroleum Plc Euro 0.04 0.06 0.03 0.07 0.09 0.11 60% 54% 292% Commodity price adjustment
Norwegian Energy Company ASA Norwegian Krone 0.87 1.38 3.70 0.37 1.22 7.28 -58% -11% 97% Oil price adjustments, updated capex and production profile, expensed dry wells
PA Resources AB Swedish Krona 0.40 1.27 1.03 0.42 1.02 1.11 4% -19% 7% Oil price adjustments, updated production and capex profile
Panoro Energy ASA U.S. Dollar 0.09 0.31 0.34 0.09 0.19 0.39 -4% -36% 15% Oil price adjustments, updated production profile and included equity raise
Premier Oil U.S. Dollar 0.74 1.56 1.23 1.07 2.24 2.48 44% 44% 101% Oil price adjustments and production profile adjustments
Regal Petroleum U.S. Dollar 0.03 0.03 0.02 0.03 0.04 0.04 27% 39% 111% Oil price adjustments
Rockhopper Exploration Plc U.S. Dollar -0.13 0.00 -0.01 -0.13 0.00 -0.01 0% 0% 0%
Salamander Energy PLC U.S. Dollar 0.63 0.75 0.45 0.75 0.81 0.82 18% 7% 80% Oil price adjustments, production profile adjustments, SRB tax adjustments
Serica Energy Plc U.S. Dollar 0.05 0.04 0.02 0.03 0.02 0.02 -33% -48% -36% Oil price adjustments, updated capex and production profiles
Soco International Plc U.S. Dollar 0.58 1.16 0.84 0.63 1.70 1.31 8% 46% 55% Oil price adjustments and production profile adjustments
Sterling Energy Plc U.S. Dollar -0.01 -0.01 -0.01 -0.01 -0.01 -0.01 -32% -28% -27%
Tower Resources Plc U.S. Dollar 0.00 0.00 0.00 0.00 0.00 0.00 -34% -39% -40% Updated capex profile and included equity raise
Tullow Oil Plc U.S. Dollar 0.94 1.64 1.66 1.34 1.99 2.41 43% 21% 45% Oil price adjustments and production profile adjustments
Valiant Petroleum Plc U.S. Dollar 1.99 2.72 1.54 2.13 2.73 2.64 7% 0% 72% Oil price adjustments and production profile adjustments
Reason for movements
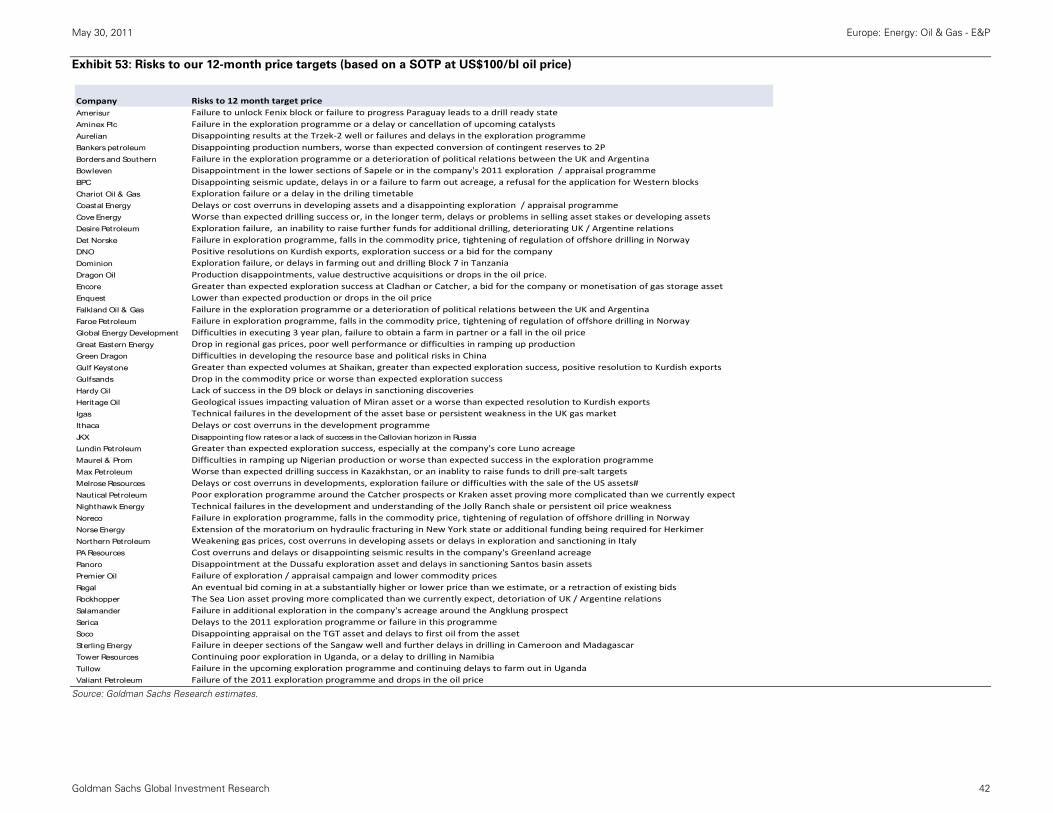
May 30, 2011 Europe: Energy: Oil & Gas - E&P
Goldman Sachs Global Investment Research 42
Exhibit 53: Risks to our 12-month price targets (based on a SOTP at US$100/bl oil price)
Source: Goldman Sachs Research estimates.
Company Risks to 12 month target priceAmerisur Failure to unlock Fenix block or failure to progress Paraguay leads to a drill ready stateAminex Plc Failure in the exploration programme or a delay or cancellation of upcoming catalystsAurelian Disappointing results at the Trzek‐2 well or failures and delays in the exploration programmeBankers petroleum Disappointing production numbers, worse than expected conversion of contingent reserves to 2PBorders and Southern Failure in the exploration programme or a deterioration of political relations between the UK and ArgentinaBowleven Disappointment in the lower sections of Sapele or in the company's 2011 exploration / appraisal programmeBPC Disappointing seismic update, delays in or a failure to farm out acreage, a refusal for the application for Western blocksChariot Oil & Gas Exploration failure or a delay in the driling timetableCoastal Energy Delays or cost overruns in developing assets and a disappointing exploration / appraisal programmeCove Energy Worse than expected drilling success or, in the longer term, delays or problems in selling asset stakes or developing assetsDesire Petroleum Exploration failure, an inability to raise further funds for additional drilling, deteriorating UK / Argentine relationsDet Norske Failure in exploration programme, falls in the commodity price, tightening of regulation of offshore drilling in NorwayDNO Positive resolutions on Kurdish exports, exploration success or a bid for the companyDominion Exploration failure, or delays in farming out and drilling Block 7 in TanzaniaDragon Oil Production disappointments, value destructive acquisitions or drops in the oil price.Encore Greater than expected exploration success at Cladhan or Catcher, a bid for the company or monetisation of gas storage assetEnquest Lower than expected production or drops in the oil priceFalkland Oil & Gas Failure in the exploration programme or a deterioration of political relations between the UK and ArgentinaFaroe Petroleum Failure in exploration programme, falls in the commodity price, tightening of regulation of offshore drilling in NorwayGlobal Energy Development Difficulties in executing 3 year plan, failure to obtain a farm in partner or a fall in the oil priceGreat Eastern Energy Drop in regional gas prices, poor well performance or difficulties in ramping up productionGreen Dragon Difficulties in developing the resource base and political risks in ChinaGulf Keystone Greater than expected volumes at Shaikan, greater than expected exploration success, positive resolution to Kurdish exportsGulfsands Drop in the commodity price or worse than expected exploration successHardy Oil Lack of success in the D9 block or delays in sanctioning discoveriesHeritage Oil Geological issues impacting valuation of Miran asset or a worse than expected resolution to Kurdish exportsIgas Technical failures in the development of the asset base or persistent weakness in the UK gas marketIthaca Delays or cost overruns in the development programmeJKX Disappoint ing flow rates or a lack of success in the Callovian horizon in RussiaLundin Petroleum Greater than expected exploration success, especially at the company's core Luno acreageMaurel & Prom Difficulties in ramping up Nigerian production or worse than expected success in the exploration programmeMax Petroleum Worse than expected drilling success in Kazakhstan, or an inablity to raise funds to drill pre‐salt targetsMelrose Resources Delays or cost overruns in developments, exploration failure or difficulties with the sale of the US assets#Nautical Petroleum Poor exploration programme around the Catcher prospects or Kraken asset proving more complicated than we currently expectNighthawk Energy Technical failures in the development and understanding of the Jolly Ranch shale or persistent oil price weaknessNoreco Failure in exploration programme, falls in the commodity price, tightening of regulation of offshore drilling in NorwayNorse Energy Extension of the moratorium on hydraulic fracturing in New York state or additional funding being required for HerkimerNorthern Petroleum Weakening gas prices, cost overruns in developing assets or delays in exploration and sanctioning in ItalyPA Resources Cost overruns and delays or disappointing seismic results in the company's Greenland acreagePanoro Disappointment at the Dussafu exploration asset and delays in sanctioning Santos basin assetsPremier Oil Failure of exploration / appraisal campaign and lower commodity pricesRegal An eventual bid coming in at a substantially higher or lower price than we estimate, or a retraction of existing bidsRockhopper The Sea Lion asset proving more complicated than we currently expect, detoriation of UK / Argentine relationsSalamander Failure in additional exploration in the company's acreage around the Angklung prospectSerica Delays to the 2011 exploration programme or failure in this programmeSoco Disappointing appraisal on the TGT asset and delays to first oil from the assetSterling Energy Failure in deeper sections of the Sangaw well and further delays in drilling in Cameroon and MadagascarTower Resources Continuing poor exploration in Uganda, or a delay to drilling in NamibiaTullow Failure in the upcoming exploration programme and continuing delays to farm out in UgandaValiant Petroleum Failure of the 2011 exploration programme and drops in the oil price
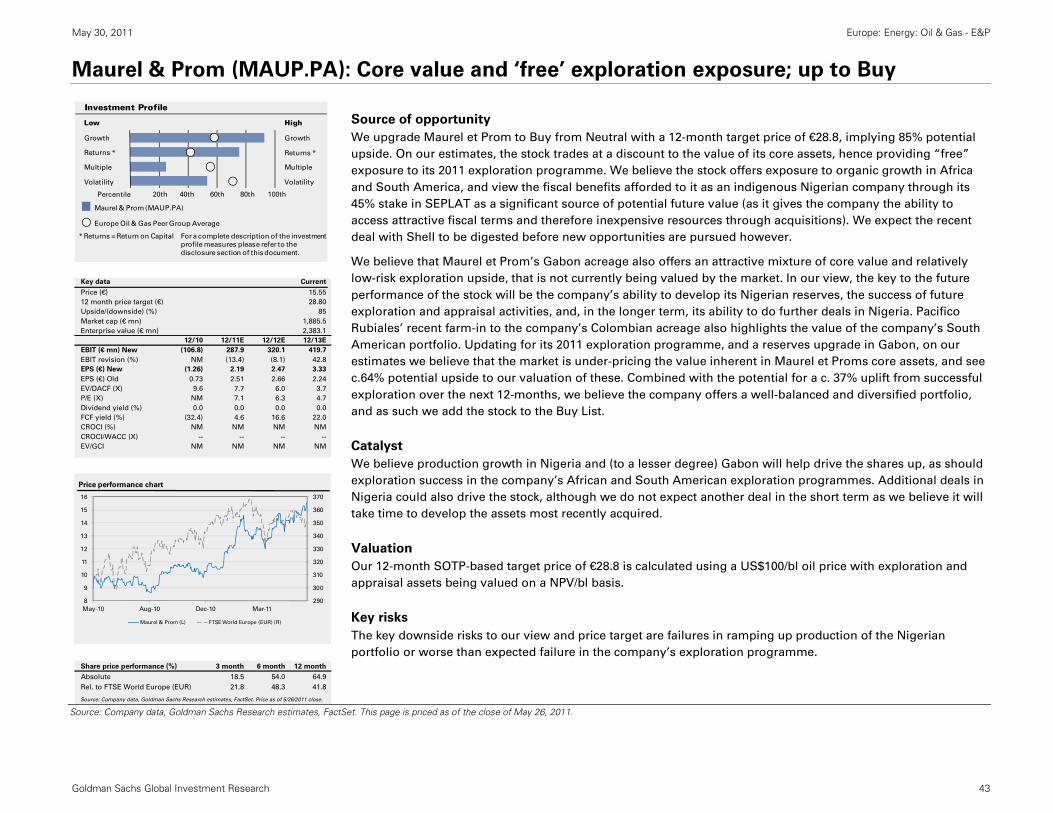
May 30, 2011 Europe: Energy: Oil & Gas - E&P
Goldman Sachs Global Investment Research 43
Maurel & Prom (MAUP.PA): Core value and ‘free’ exploration exposure; up to Buy
Source of opportunity
We upgrade Maurel et Prom to Buy from Neutral with a 12-month target price of €28.8, implying 85% potential
upside. On our estimates, the stock trades at a discount to the value of its core assets, hence providing “free”
exposure to its 2011 exploration programme. We believe the stock offers exposure to organic growth in Africa
and South America, and view the fiscal benefits afforded to it as an indigenous Nigerian company through its
45% stake in SEPLAT as a significant source of potential future value (as it gives the company the ability to
access attractive fiscal terms and therefore inexpensive resources through acquisitions). We expect the recent
deal with Shell to be digested before new opportunities are pursued however.
We believe that Maurel et Prom’s Gabon acreage also offers an attractive mixture of core value and relatively
low-risk exploration upside, that is not currently being valued by the market. In our view, the key to the future
performance of the stock will be the company’s ability to develop its Nigerian reserves, the success of future
exploration and appraisal activities, and, in the longer term, its ability to do further deals in Nigeria. Pacifico
Rubiales’ recent farm-in to the company’s Colombian acreage also highlights the value of the company’s South
American portfolio. Updating for its 2011 exploration programme, and a reserves upgrade in Gabon, on our
estimates we believe that the market is under-pricing the value inherent in Maurel et Proms core assets, and see
c.64% potential upside to our valuation of these. Combined with the potential for a c. 37% uplift from successful
exploration over the next 12-months, we believe the company offers a well-balanced and diversified portfolio,
and as such we add the stock to the Buy List.
Catalyst
We believe production growth in Nigeria and (to a lesser degree) Gabon will help drive the shares up, as should
exploration success in the company’s African and South American exploration programmes. Additional deals in
Nigeria could also drive the stock, although we do not expect another deal in the short term as we believe it will
take time to develop the assets most recently acquired.
Valuation
Our 12-month SOTP-based target price of €28.8 is calculated using a US$100/bl oil price with exploration and
appraisal assets being valued on a NPV/bl basis.
Key risks
The key downside risks to our view and price target are failures in ramping up production of the Nigerian
portfolio or worse than expected failure in the company’s exploration programme.
Source: Company data, Goldman Sachs Research estimates, FactSet. This page is priced as of the close of May 26, 2011.
Growth
Returns *
Multiple
Volatility Volatility
Multiple
Returns *
Growth
Investment Profile
Low High
Percentile 20th 40th 60th 80th 100th
* Returns = Return on Capital For a complete description of the investment
profile measures please refer to the
disclosure section of this document.
Maurel & Prom (MAUP.PA)
Europe Oil & Gas Peer Group Average
Key data Current
Price (€) 15.55
12 month price target (€) 28.80
Upside/(downside) (%) 85
Market cap (€ mn) 1,885.5
Enterprise value (€ mn) 2,383.1
12/10 12/11E 12/12E 12/13E
EBIT (€ mn) New (106.8) 287.9 320.1 419.7
EBIT revision (%) NM (13.4) (8.1) 42.8
EPS (€) New (1.26) 2.19 2.47 3.33
EPS (€) Old 0.73 2.51 2.66 2.24
EV/DACF (X) 9.6 7.7 6.0 3.7
P/E (X) NM 7.1 6.3 4.7
Dividend yield (%) 0.0 0.0 0.0 0.0
FCF yield (%) (32.4) 4.6 16.6 22.0
CROCI (%) NM NM NM NM
CROCI/WACC (X) -- -- -- --
EV/GCI NM NM NM NM
290
300
310
320
330
340
350
360
370
8
9
10
11
12
13
14
15
16
May-10 Aug-10 Dec-10 Mar-11
Price performance chart
Maurel & Prom (L) FTSE World Europe (EUR) (R)
Share price performance (%) 3 month 6 month 12 month
Absolute 18.5 54.0 64.9
Rel. to FTSE World Europe (EUR) 21.8 48.3 41.8
Source: Company data, Goldman Sachs Research estimates, FactSet. Price as of 5/26/2011 close.
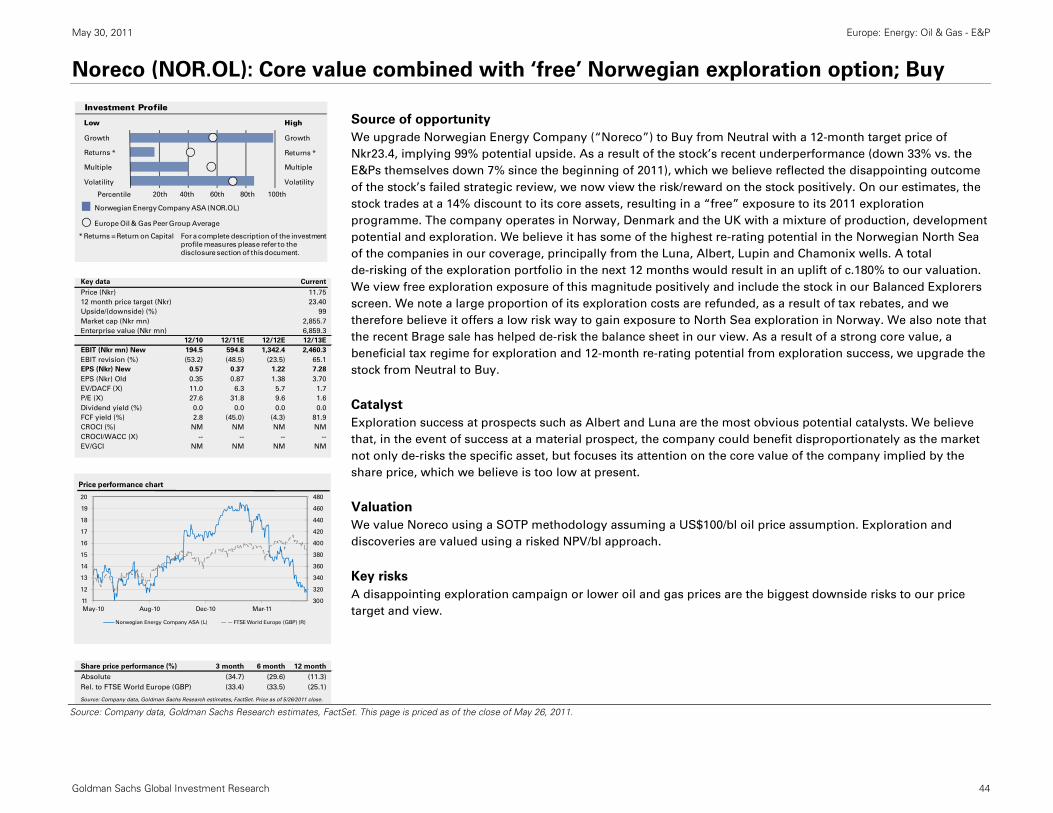
May 30, 2011 Europe: Energy: Oil & Gas - E&P
Goldman Sachs Global Investment Research 44
Noreco (NOR.OL): Core value combined with ‘free’ Norwegian exploration option; Buy
Source of opportunity
We upgrade Norwegian Energy Company (“Noreco”) to Buy from Neutral with a 12-month target price of
Nkr23.4, implying 99% potential upside. As a result of the stock’s recent underperformance (down 33% vs. the
E&Ps themselves down 7% since the beginning of 2011), which we believe reflected the disappointing outcome
of the stock’s failed strategic review, we now view the risk/reward on the stock positively. On our estimates, the
stock trades at a 14% discount to its core assets, resulting in a “free” exposure to its 2011 exploration
programme. The company operates in Norway, Denmark and the UK with a mixture of production, development
potential and exploration. We believe it has some of the highest re-rating potential in the Norwegian North Sea
of the companies in our coverage, principally from the Luna, Albert, Lupin and Chamonix wells. A total
de-risking of the exploration portfolio in the next 12 months would result in an uplift of c.180% to our valuation.
We view free exploration exposure of this magnitude positively and include the stock in our Balanced Explorers
screen. We note a large proportion of its exploration costs are refunded, as a result of tax rebates, and we
therefore believe it offers a low risk way to gain exposure to North Sea exploration in Norway. We also note that
the recent Brage sale has helped de-risk the balance sheet in our view. As a result of a strong core value, a
beneficial tax regime for exploration and 12-month re-rating potential from exploration success, we upgrade the
stock from Neutral to Buy.
Catalyst
Exploration success at prospects such as Albert and Luna are the most obvious potential catalysts. We believe
that, in the event of success at a material prospect, the company could benefit disproportionately as the market
not only de-risks the specific asset, but focuses its attention on the core value of the company implied by the
share price, which we believe is too low at present.
Valuation
We value Noreco using a SOTP methodology assuming a US$100/bl oil price assumption. Exploration and
discoveries are valued using a risked NPV/bl approach.
Key risks
A disappointing exploration campaign or lower oil and gas prices are the biggest downside risks to our price
target and view.
Source: Company data, Goldman Sachs Research estimates, FactSet. This page is priced as of the close of May 26, 2011.
Growth
Returns *
Multiple
Volatility Volatility
Multiple
Returns *
Growth
Investment Profile
Low High
Percentile 20th 40th 60th 80th 100th
* Returns = Return on Capital For a complete description of the investment
profile measures please refer to the
disclosure section of this document.
Norwegian Energy Company ASA (NOR.OL)
Europe Oil & Gas Peer Group Average
Key data Current
Price (Nkr) 11.75
12 month price target (Nkr) 23.40
Upside/(downside) (%) 99
Market cap (Nkr mn) 2,855.7
Enterprise value (Nkr mn) 6,859.3
12/10 12/11E 12/12E 12/13E
EBIT (Nkr mn) New 194.5 594.8 1,342.4 2,460.3
EBIT revision (%) (53.2) (48.5) (23.5) 65.1
EPS (Nkr) New 0.57 0.37 1.22 7.28
EPS (Nkr) Old 0.35 0.87 1.38 3.70
EV/DACF (X) 11.0 6.3 5.7 1.7
P/E (X) 27.6 31.8 9.6 1.6
Dividend yield (%) 0.0 0.0 0.0 0.0
FCF yield (%) 2.8 (45.0) (4.3) 81.9
CROCI (%) NM NM NM NM
CROCI/WACC (X) -- -- -- --
EV/GCI NM NM NM NM
300
320
340
360
380
400
420
440
460
480
11
12
13
14
15
16
17
18
19
20
May-10 Aug-10 Dec-10 Mar-11
Price performance chart
Norwegian Energy Company ASA (L) FTSE World Europe (GBP) (R)
Share price performance (%) 3 month 6 month 12 month
Absolute (34.7) (29.6) (11.3)
Rel. to FTSE World Europe (GBP) (33.4) (33.5) (25.1)
Source: Company data, Goldman Sachs Research estimates, FactSet. Price as of 5/26/2011 close.
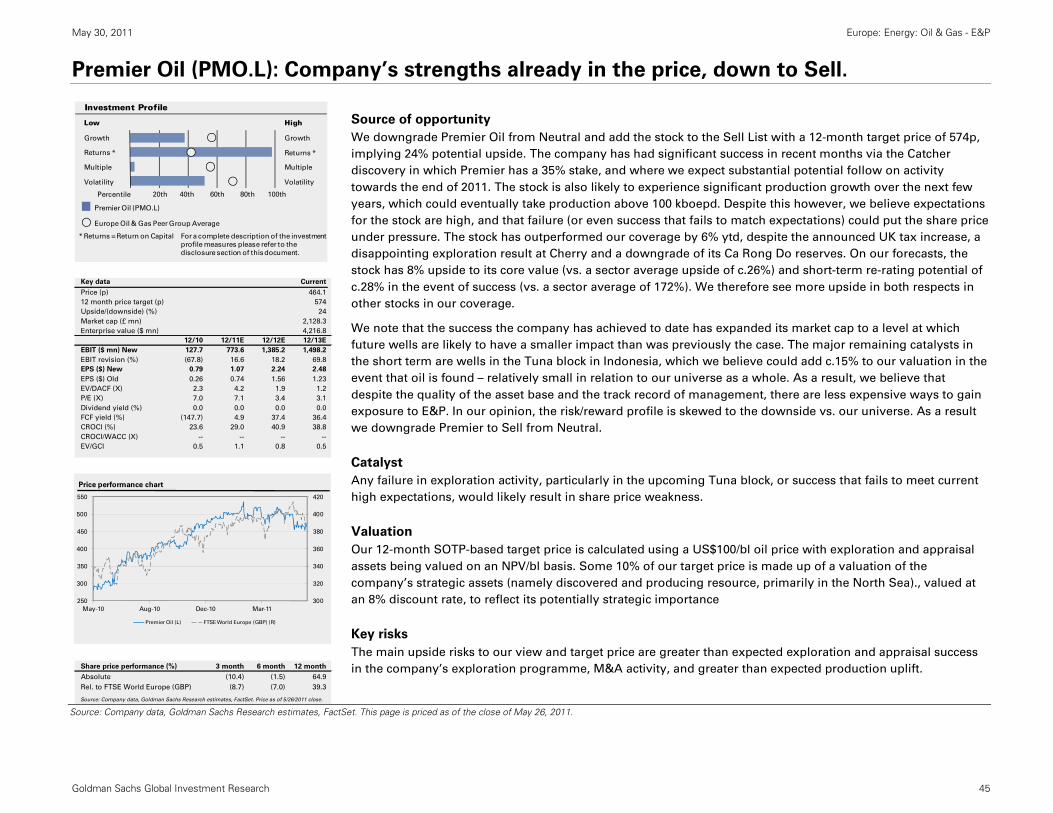
May 30, 2011 Europe: Energy: Oil & Gas - E&P
Goldman Sachs Global Investment Research 45
Premier Oil (PMO.L): Company’s strengths already in the price, down to Sell.
Source of opportunity
We downgrade Premier Oil from Neutral and add the stock to the Sell List with a 12-month target price of 574p,
implying 24% potential upside. The company has had significant success in recent months via the Catcher
discovery in which Premier has a 35% stake, and where we expect substantial potential follow on activity
towards the end of 2011. The stock is also likely to experience significant production growth over the next few
years, which could eventually take production above 100 kboepd. Despite this however, we believe expectations
for the stock are high, and that failure (or even success that fails to match expectations) could put the share price
under pressure. The stock has outperformed our coverage by 6% ytd, despite the announced UK tax increase, a
disappointing exploration result at Cherry and a downgrade of its Ca Rong Do reserves. On our forecasts, the
stock has 8% upside to its core value (vs. a sector average upside of c.26%) and short-term re-rating potential of
c.28% in the event of success (vs. a sector average of 172%). We therefore see more upside in both respects in
other stocks in our coverage.
We note that the success the company has achieved to date has expanded its market cap to a level at which
future wells are likely to have a smaller impact than was previously the case. The major remaining catalysts in
the short term are wells in the Tuna block in Indonesia, which we believe could add c.15% to our valuation in the
event that oil is found – relatively small in relation to our universe as a whole. As a result, we believe that
despite the quality of the asset base and the track record of management, there are less expensive ways to gain
exposure to E&P. In our opinion, the risk/reward profile is skewed to the downside vs. our universe. As a result
we downgrade Premier to Sell from Neutral.
Catalyst
Any failure in exploration activity, particularly in the upcoming Tuna block, or success that fails to meet current
high expectations, would likely result in share price weakness.
Valuation
Our 12-month SOTP-based target price is calculated using a US$100/bl oil price with exploration and appraisal
assets being valued on an NPV/bl basis. Some 10% of our target price is made up of a valuation of the
company’s strategic assets (namely discovered and producing resource, primarily in the North Sea)., valued at
an 8% discount rate, to reflect its potentially strategic importance
Key risks
The main upside risks to our view and target price are greater than expected exploration and appraisal success
in the company’s exploration programme, M&A activity, and greater than expected production uplift.
Source: Company data, Goldman Sachs Research estimates, FactSet. This page is priced as of the close of May 26, 2011.
Growth
Returns *
Multiple
Volatility Volatility
Multiple
Returns *
Growth
Investment Profile
Low High
Percentile 20th 40th 60th 80th 100th
* Returns = Return on Capital For a complete description of the investment
profile measures please refer to the
disclosure section of this document.
Premier Oil (PMO.L)
Europe Oil & Gas Peer Group Average
Key data Current
Price (p) 464.1
12 month price target (p) 574
Upside/(downside) (%) 24
Market cap (£ mn) 2,128.3
Enterprise value ($ mn) 4,216.8
12/10 12/11E 12/12E 12/13E
EBIT ($ mn) New 127.7 773.6 1,385.2 1,498.2
EBIT revision (%) (67.8) 16.6 18.2 69.8
EPS ($) New 0.79 1.07 2.24 2.48
EPS ($) Old 0.26 0.74 1.56 1.23
EV/DACF (X) 2.3 4.2 1.9 1.2
P/E (X) 7.0 7.1 3.4 3.1
Dividend yield (%) 0.0 0.0 0.0 0.0
FCF yield (%) (147.7) 4.9 37.4 36.4
CROCI (%) 23.6 29.0 40.9 38.8
CROCI/WACC (X) -- -- -- --
EV/GCI 0.5 1.1 0.8 0.5
300
320
340
360
380
400
420
250
300
350
400
450
500
550
May-10 Aug-10 Dec-10 Mar-11
Price performance chart
Premier Oil (L) FTSE World Europe (GBP) (R)
Share price performance (%) 3 month 6 month 12 month
Absolute (10.4) (1.5) 64.9
Rel. to FTSE World Europe (GBP) (8.7) (7.0) 39.3
Source: Company data, Goldman Sachs Research estimates, FactSet. Price as of 5/26/2011 close.
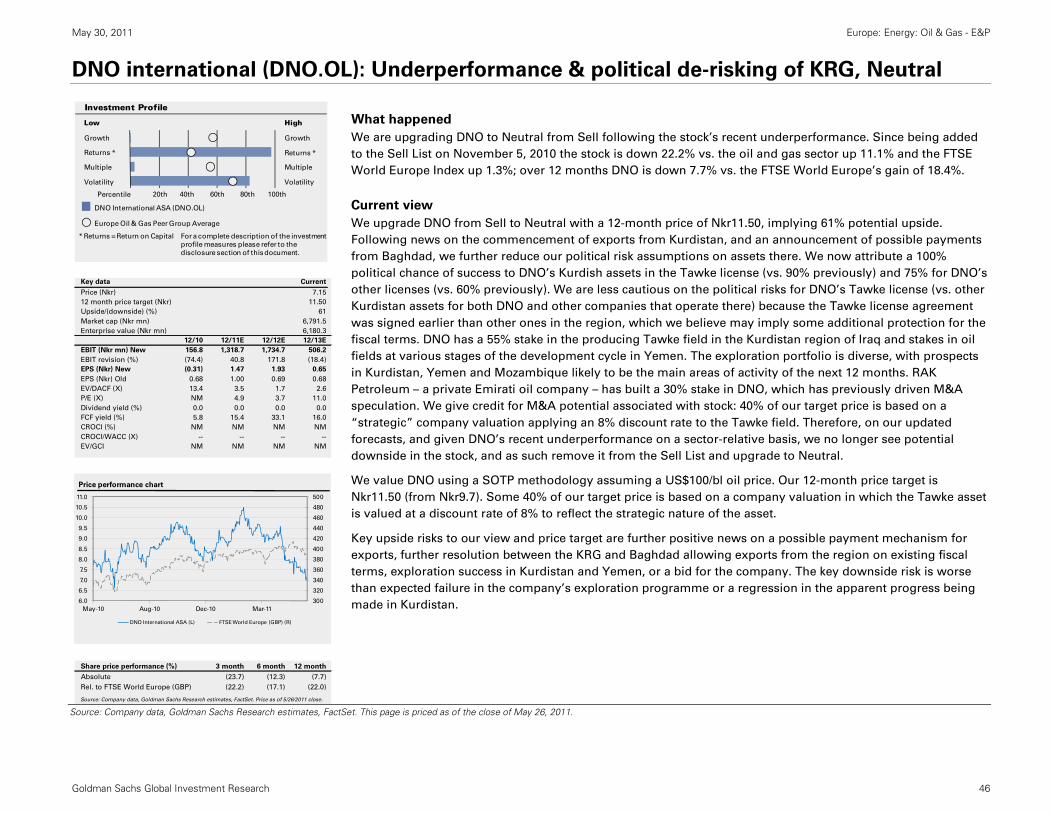
May 30, 2011 Europe: Energy: Oil & Gas - E&P
Goldman Sachs Global Investment Research 46
DNO international (DNO.OL): Underperformance & political de-risking of KRG, Neutral
What happened
We are upgrading DNO to Neutral from Sell following the stock’s recent underperformance. Since being added
to the Sell List on November 5, 2010 the stock is down 22.2% vs. the oil and gas sector up 11.1% and the FTSE
World Europe Index up 1.3%; over 12 months DNO is down 7.7% vs. the FTSE World Europe’s gain of 18.4%.
Current view
We upgrade DNO from Sell to Neutral with a 12-month price of Nkr11.50, implying 61% potential upside.
Following news on the commencement of exports from Kurdistan, and an announcement of possible payments
from Baghdad, we further reduce our political risk assumptions on assets there. We now attribute a 100%
political chance of success to DNO’s Kurdish assets in the Tawke license (vs. 90% previously) and 75% for DNO’s
other licenses (vs. 60% previously). We are less cautious on the political risks for DNO’s Tawke license (vs. other
Kurdistan assets for both DNO and other companies that operate there) because the Tawke license agreement
was signed earlier than other ones in the region, which we believe may imply some additional protection for the
fiscal terms. DNO has a 55% stake in the producing Tawke field in the Kurdistan region of Iraq and stakes in oil
fields at various stages of the development cycle in Yemen. The exploration portfolio is diverse, with prospects
in Kurdistan, Yemen and Mozambique likely to be the main areas of activity of the next 12 months. RAK
Petroleum – a private Emirati oil company – has built a 30% stake in DNO, which has previously driven M&A
speculation. We give credit for M&A potential associated with stock: 40% of our target price is based on a
“strategic” company valuation applying an 8% discount rate to the Tawke field. Therefore, on our updated
forecasts, and given DNO’s recent underperformance on a sector-relative basis, we no longer see potential
downside in the stock, and as such remove it from the Sell List and upgrade to Neutral.
We value DNO using a SOTP methodology assuming a US$100/bl oil price. Our 12-month price target is
Nkr11.50 (from Nkr9.7). Some 40% of our target price is based on a company valuation in which the Tawke asset
is valued at a discount rate of 8% to reflect the strategic nature of the asset.
Key upside risks to our view and price target are further positive news on a possible payment mechanism for
exports, further resolution between the KRG and Baghdad allowing exports from the region on existing fiscal
terms, exploration success in Kurdistan and Yemen, or a bid for the company. The key downside risk is worse
than expected failure in the company’s exploration programme or a regression in the apparent progress being
made in Kurdistan.
Source: Company data, Goldman Sachs Research estimates, FactSet. This page is priced as of the close of May 26, 2011.
Growth
Returns *
Multiple
Volatility Volatility
Multiple
Returns *
Growth
Investment Profile
Low High
Percentile 20th 40th 60th 80th 100th
* Returns = Return on Capital For a complete description of the investment
profile measures please refer to the
disclosure section of this document.
DNO International ASA (DNO.OL)
Europe Oil & Gas Peer Group Average
Key data Current
Price (Nkr) 7.15
12 month price target (Nkr) 11.50
Upside/(downside) (%) 61
Market cap (Nkr mn) 6,791.5
Enterprise value (Nkr mn) 6,180.3
12/10 12/11E 12/12E 12/13E
EBIT (Nkr mn) New 156.8 1,318.7 1,734.7 506.2
EBIT revision (%) (74.4) 40.8 171.8 (18.4)
EPS (Nkr) New (0.31) 1.47 1.93 0.65
EPS (Nkr) Old 0.68 1.00 0.69 0.68
EV/DACF (X) 13.4 3.5 1.7 2.6
P/E (X) NM 4.9 3.7 11.0
Dividend yield (%) 0.0 0.0 0.0 0.0
FCF yield (%) 5.8 15.4 33.1 16.0
CROCI (%) NM NM NM NM
CROCI/WACC (X) -- -- -- --
EV/GCI NM NM NM NM
300
320
340
360
380
400
420
440
460
480
500
6.0
6.5
7.0
7.5
8.0
8.5
9.0
9.5
10.0
10.5
11.0
May-10 Aug-10 Dec-10 Mar-11
Price performance chart
DNO International ASA (L) FTSE World Europe (GBP) (R)
Share price performance (%) 3 month 6 month 12 month
Absolute (23.7) (12.3) (7.7)
Rel. to FTSE World Europe (GBP) (22.2) (17.1) (22.0)
Source: Company data, Goldman Sachs Research estimates, FactSet. Price as of 5/26/2011 close.
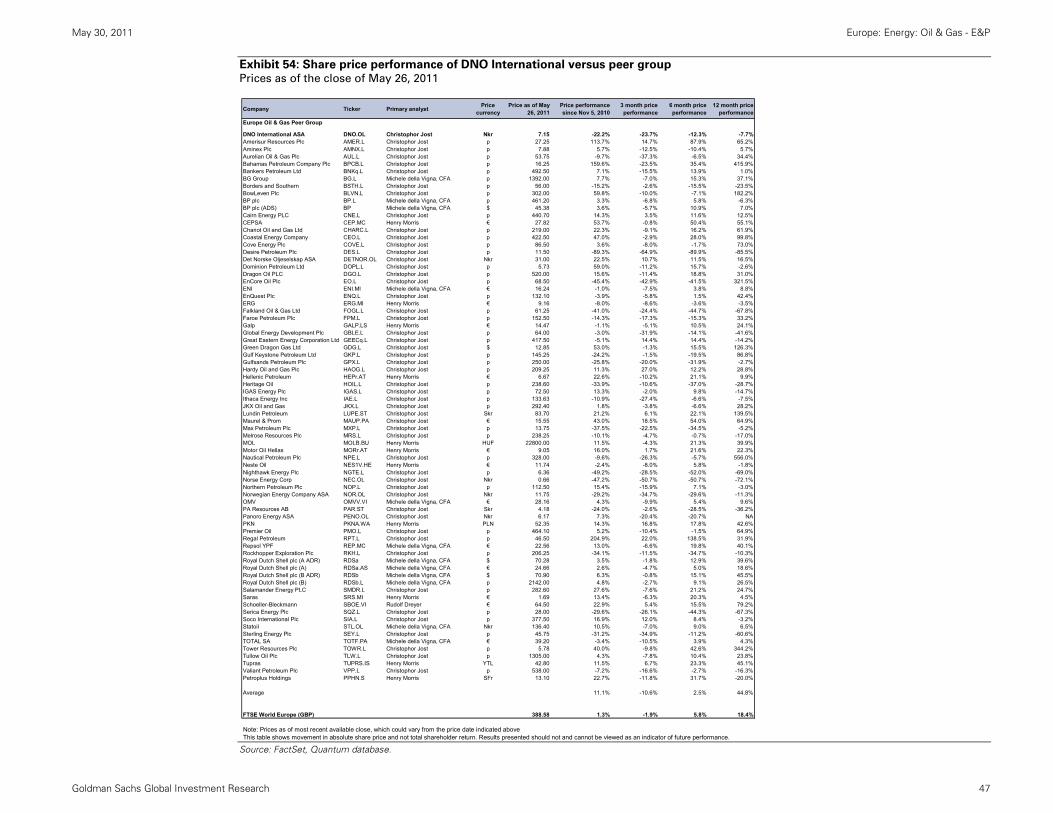
May 30, 2011 Europe: Energy: Oil & Gas - E&P
Goldman Sachs Global Investment Research 47
Exhibit 54: Share price performance of DNO International versus peer group Prices as of the close of May 26, 2011
Source: FactSet, Quantum database.
Company Ticker Primary analyst Price currency
Price as of May 26, 2011
Price performance since Nov 5, 2010
3 month price performance
6 month price performance
12 month price performance
Europe Oil & Gas Peer Group DNO International ASA DNO.OL Christophor Jost Nkr 7.15 -22.2% -23.7% -12.3% -7.7%Amerisur Resources Plc AMER.L Christophor Jost p 27.25 113.7% 14.7% 87.9% 65.2%Aminex Plc AMNX.L Christophor Jost p 7.88 5.7% -12.5% -10.4% 5.7%Aurelian Oil & Gas Plc AUL.L Christophor Jost p 53.75 -9.7% -37.3% -6.5% 34.4%Bahamas Petroleum Company Plc BPCB.L Christophor Jost p 16.25 159.6% -23.5% 35.4% 415.9%Bankers Petroleum Ltd BNKq.L Christophor Jost p 492.50 7.1% -15.5% 13.9% 1.0%BG Group BG.L Michele della Vigna, CFA p 1392.00 7.7% -7.0% 15.3% 37.1%Borders and Southern BSTH.L Christophor Jost p 56.00 -15.2% -2.6% -15.5% -23.5%BowLeven Plc BLVN.L Christophor Jost p 302.00 59.8% -10.0% -7.1% 182.2%BP plc BP.L Michele della Vigna, CFA p 461.20 3.3% -6.8% 5.8% -6.3%BP plc (ADS) BP Michele della Vigna, CFA $ 45.38 3.6% -5.7% 10.9% 7.0%Cairn Energy PLC CNE.L Christophor Jost p 440.70 14.3% 3.5% 11.6% 12.5%CEPSA CEP.MC Henry Morris € 27.82 53.7% -0.8% 50.4% 55.1%Chariot Oil and Gas Ltd CHARC.L Christophor Jost p 219.00 22.3% -9.1% 16.2% 61.9%Coastal Energy Company CEO.L Christophor Jost p 422.50 47.0% -2.9% 28.0% 99.8%Cove Energy Plc COVE.L Christophor Jost p 86.50 3.6% -8.0% -1.7% 73.0%Desire Petroleum Plc DES.L Christophor Jost p 11.50 -89.3% -64.9% -89.9% -85.5%Det Norske Oljeselskap ASA DETNOR.OL Christophor Jost Nkr 31.00 22.5% 10.7% 11.5% 16.5%Dominion Petroleum Ltd DOPL.L Christophor Jost p 5.73 59.0% -11.2% 15.7% -2.6%Dragon Oil PLC DGO.L Christophor Jost p 520.00 15.6% -11.4% 18.8% 31.0%EnCore Oil Plc EO.L Christophor Jost p 68.50 -45.4% -42.9% -41.5% 321.5%ENI ENI.MI Michele della Vigna, CFA € 16.24 -1.0% -7.5% 3.8% 8.8%EnQuest Plc ENQ.L Christophor Jost p 132.10 -3.9% -5.8% 1.5% 42.4%ERG ERG.MI Henry Morris € 9.16 -8.0% -8.6% -3.6% -3.5%Falkland Oil & Gas Ltd FOGL.L Christophor Jost p 61.25 -41.0% -24.4% -44.7% -67.8%Faroe Petroleum Plc FPM.L Christophor Jost p 152.50 -14.3% -17.3% -15.3% 33.2%Galp GALP.LS Henry Morris € 14.47 -1.1% -5.1% 10.5% 24.1%Global Energy Development Plc GBLE.L Christophor Jost p 64.00 -3.0% -31.9% -14.1% -41.6%Great Eastern Energy Corporation Ltd GEECq.L Christophor Jost p 417.50 -5.1% 14.4% 14.4% -14.2%Green Dragon Gas Ltd GDG.L Christophor Jost $ 12.85 53.0% -1.3% 15.5% 126.3%Gulf Keystone Petroleum Ltd GKP.L Christophor Jost p 145.25 -24.2% -1.5% -19.5% 86.8%Gulfsands Petroleum Plc GPX.L Christophor Jost p 250.00 -25.8% -20.0% -31.9% -2.7%Hardy Oil and Gas Plc HAOG.L Christophor Jost p 209.25 11.3% 27.0% 12.2% 28.8%Hellenic Petroleum HEPr.AT Henry Morris € 6.67 22.6% -10.2% 21.1% 9.9%Heritage Oil HOIL.L Christophor Jost p 238.60 -33.9% -10.6% -37.0% -28.7%IGAS Energy Plc IGAS.L Christophor Jost p 72.50 13.3% -2.0% 9.8% -14.7%Ithaca Energy Inc IAE.L Christophor Jost p 133.63 -10.9% -27.4% -6.6% -7.5%JKX Oil and Gas JKX.L Christophor Jost p 292.40 1.8% -3.8% -6.6% 28.2%Lundin Petroleum LUPE.ST Christophor Jost Skr 83.70 21.2% 6.1% 22.1% 139.5%Maurel & Prom MAUP.PA Christophor Jost € 15.55 43.0% 18.5% 54.0% 64.9%Max Petroleum Plc MXP.L Christophor Jost p 13.75 -37.5% -22.5% -34.5% -5.2%Melrose Resources Plc MRS.L Christophor Jost p 238.25 -10.1% -4.7% -0.7% -17.0%MOL MOLB.BU Henry Morris HUF 22800.00 11.5% -4.3% 21.3% 39.9%Motor Oil Hellas MORr.AT Henry Morris € 9.05 16.0% 1.7% 21.6% 22.3%Nautical Petroleum Plc NPE.L Christophor Jost p 328.00 -9.6% -26.3% -5.7% 556.0%Neste Oil NES1V.HE Henry Morris € 11.74 -2.4% -8.0% 5.8% -1.8%Nighthawk Energy Plc NGTE.L Christophor Jost p 6.36 -49.2% -28.5% -52.0% -69.0%Norse Energy Corp NEC.OL Christophor Jost Nkr 0.66 -47.2% -50.7% -50.7% -72.1%Northern Petroleum Plc NOP.L Christophor Jost p 112.50 15.4% -15.9% 7.1% -3.0%Norwegian Energy Company ASA NOR.OL Christophor Jost Nkr 11.75 -29.2% -34.7% -29.6% -11.3%OMV OMVV.VI Michele della Vigna, CFA € 28.16 4.3% -9.9% 5.4% 9.6%PA Resources AB PAR.ST Christophor Jost Skr 4.18 -24.0% -2.6% -28.5% -36.2%Panoro Energy ASA PENO.OL Christophor Jost Nkr 6.17 7.3% -20.4% -20.7% NAPKN PKNA.WA Henry Morris PLN 52.35 14.3% 16.8% 17.8% 42.6%Premier Oil PMO.L Christophor Jost p 464.10 5.2% -10.4% -1.5% 64.9%Regal Petroleum RPT.L Christophor Jost p 46.50 204.9% 22.0% 138.5% 31.9%Repsol YPF REP.MC Michele della Vigna, CFA € 22.56 13.0% -6.6% 19.8% 40.1%Rockhopper Exploration Plc RKH.L Christophor Jost p 206.25 -34.1% -11.5% -34.7% -10.3%Royal Dutch Shell plc (A ADR) RDSa Michele della Vigna, CFA $ 70.28 3.5% -1.8% 12.9% 39.6%Royal Dutch Shell plc (A) RDSa.AS Michele della Vigna, CFA € 24.66 2.6% -4.7% 5.0% 18.6%Royal Dutch Shell plc (B ADR) RDSb Michele della Vigna, CFA $ 70.90 6.3% -0.8% 15.1% 45.5%Royal Dutch Shell plc (B) RDSb.L Michele della Vigna, CFA p 2142.00 4.8% -2.7% 9.1% 26.5%Salamander Energy PLC SMDR.L Christophor Jost p 282.60 27.6% -7.6% 21.2% 24.7%Saras SRS.MI Henry Morris € 1.69 13.4% -6.3% 20.3% 4.5%Schoeller-Bleckmann SBOE.VI Rudolf Dreyer € 64.50 22.9% 5.4% 15.5% 79.2%Serica Energy Plc SQZ.L Christophor Jost p 28.00 -29.6% -26.1% -44.3% -67.3%Soco International Plc SIA.L Christophor Jost p 377.50 16.9% 12.0% 8.4% -3.2%Statoil STL.OL Michele della Vigna, CFA Nkr 136.40 10.5% -7.0% 9.0% 6.5%Sterling Energy Plc SEY.L Christophor Jost p 45.75 -31.2% -34.9% -11.2% -60.6%TOTAL SA TOTF.PA Michele della Vigna, CFA € 39.20 -3.4% -10.5% 3.9% 4.3%Tower Resources Plc TOWR.L Christophor Jost p 5.78 40.0% -9.8% 42.6% 344.2%Tullow Oil Plc TLW.L Christophor Jost p 1305.00 4.3% -7.8% 10.4% 23.8%Tupras TUPRS.IS Henry Morris YTL 42.80 11.5% 6.7% 23.3% 45.1%Valiant Petroleum Plc VPP.L Christophor Jost p 538.00 -7.2% -16.6% -2.7% -16.3%Petroplus Holdings PPHN.S Henry Morris SFr 13.10 22.7% -11.8% 31.7% -20.0%
Average 11.1% -10.6% 2.5% 44.8%
FTSE World Europe (GBP) 388.58 1.3% -1.9% 5.8% 18.4%
Note: Prices as of most recent available close, which could vary from the price date indicated aboveThis table shows movement in absolute share price and not total shareholder return. Results presented should not and cannot be viewed as an indicator of future performance.
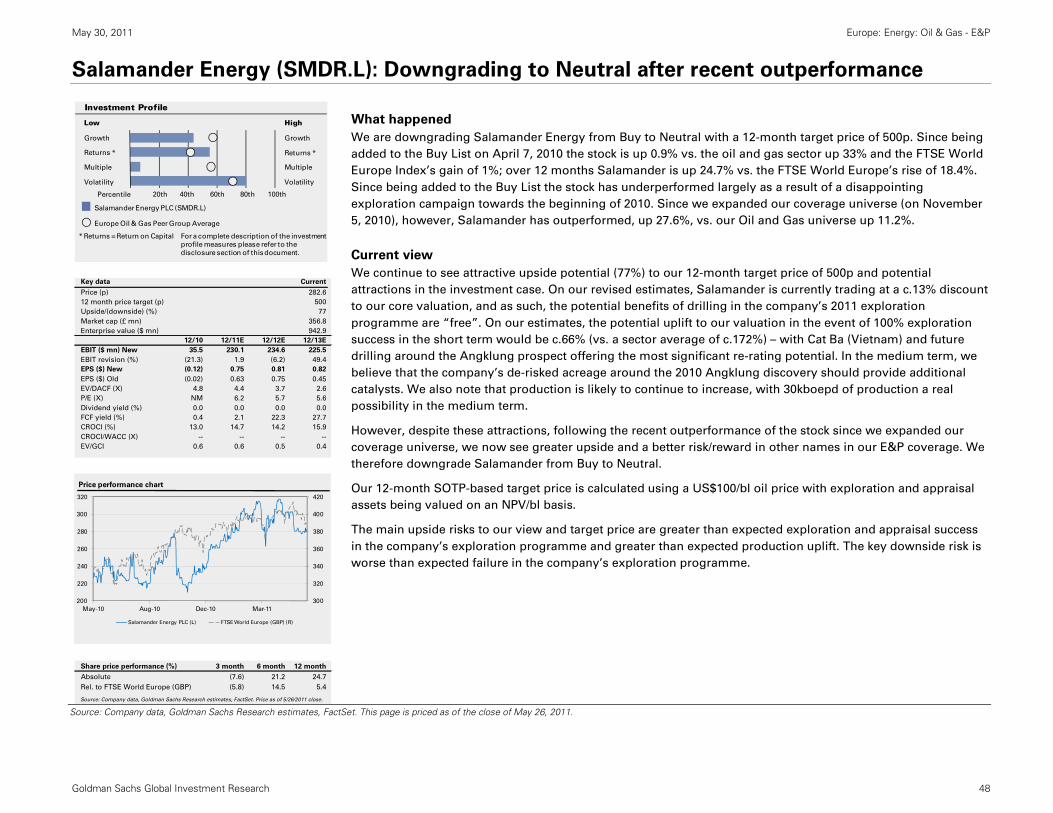
May 30, 2011 Europe: Energy: Oil & Gas - E&P
Goldman Sachs Global Investment Research 48
Salamander Energy (SMDR.L): Downgrading to Neutral after recent outperformance
What happened
We are downgrading Salamander Energy from Buy to Neutral with a 12-month target price of 500p. Since being
added to the Buy List on April 7, 2010 the stock is up 0.9% vs. the oil and gas sector up 33% and the FTSE World
Europe Index’s gain of 1%; over 12 months Salamander is up 24.7% vs. the FTSE World Europe’s rise of 18.4%.
Since being added to the Buy List the stock has underperformed largely as a result of a disappointing
exploration campaign towards the beginning of 2010. Since we expanded our coverage universe (on November
5, 2010), however, Salamander has outperformed, up 27.6%, vs. our Oil and Gas universe up 11.2%.
Current view
We continue to see attractive upside potential (77%) to our 12-month target price of 500p and potential
attractions in the investment case. On our revised estimates, Salamander is currently trading at a c.13% discount
to our core valuation, and as such, the potential benefits of drilling in the company’s 2011 exploration
programme are “free”. On our estimates, the potential uplift to our valuation in the event of 100% exploration
success in the short term would be c.66% (vs. a sector average of c.172%) – with Cat Ba (Vietnam) and future
drilling around the Angklung prospect offering the most significant re-rating potential. In the medium term, we
believe that the company’s de-risked acreage around the 2010 Angklung discovery should provide additional
catalysts. We also note that production is likely to continue to increase, with 30kboepd of production a real
possibility in the medium term.
However, despite these attractions, following the recent outperformance of the stock since we expanded our
coverage universe, we now see greater upside and a better risk/reward in other names in our E&P coverage. We
therefore downgrade Salamander from Buy to Neutral.
Our 12-month SOTP-based target price is calculated using a US$100/bl oil price with exploration and appraisal
assets being valued on an NPV/bl basis.
The main upside risks to our view and target price are greater than expected exploration and appraisal success
in the company’s exploration programme and greater than expected production uplift. The key downside risk is
worse than expected failure in the company’s exploration programme.
Source: Company data, Goldman Sachs Research estimates, FactSet. This page is priced as of the close of May 26, 2011.
Growth
Returns *
Multiple
Volatility Volatility
Multiple
Returns *
Growth
Investment Profile
Low High
Percentile 20th 40th 60th 80th 100th
* Returns = Return on Capital For a complete description of the investment
profile measures please refer to the
disclosure section of this document.
Salamander Energy PLC (SMDR.L)
Europe Oil & Gas Peer Group Average
Key data Current
Price (p) 282.6
12 month price target (p) 500
Upside/(downside) (%) 77
Market cap (£ mn) 356.8
Enterprise value ($ mn) 942.9
12/10 12/11E 12/12E 12/13E
EBIT ($ mn) New 35.5 230.1 234.6 225.5
EBIT revision (%) (21.3) 1.9 (6.2) 49.4
EPS ($) New (0.12) 0.75 0.81 0.82
EPS ($) Old (0.02) 0.63 0.75 0.45
EV/DACF (X) 4.8 4.4 3.7 2.6
P/E (X) NM 6.2 5.7 5.6
Dividend yield (%) 0.0 0.0 0.0 0.0
FCF yield (%) 0.4 2.1 22.3 27.7
CROCI (%) 13.0 14.7 14.2 15.9
CROCI/WACC (X) -- -- -- --
EV/GCI 0.6 0.6 0.5 0.4
300
320
340
360
380
400
420
200
220
240
260
280
300
320
May-10 Aug-10 Dec-10 Mar-11
Price performance chart
Salamander Energy PLC (L) FTSE World Europe (GBP) (R)
Share price performance (%) 3 month 6 month 12 month
Absolute (7.6) 21.2 24.7
Rel. to FTSE World Europe (GBP) (5.8) 14.5 5.4
Source: Company data, Goldman Sachs Research estimates, FactSet. Price as of 5/26/2011 close.

May 30, 2011 Europe: Energy: Oil & Gas - E&P
Goldman Sachs Global Investment Research 49
Exhibit 55: Share price performance of Salamander Energy versus peer group Prices as of the close of May 26, 2011
Source: FactSet, Quantum database.
Company Ticker Primary analyst Price currency
Price as of May 26, 2011
Price performance since Apr 7, 2010
3 month price performance
6 month price performance
12 month price performance
Europe Oil & Gas Peer Group Salamander Energy PLC SMDR.L Christophor Jost p 282.60 0.9% -7.6% 21.2% 24.7%Amerisur Resources Plc AMER.L Christophor Jost p 27.25 62.7% 14.7% 87.9% 65.2%Aminex Plc AMNX.L Christophor Jost p 7.88 -31.4% -12.5% -10.4% 5.7%Aurelian Oil & Gas Plc AUL.L Christophor Jost p 53.75 17.5% -37.3% -6.5% 34.4%Bahamas Petroleum Company Plc BPCB.L Christophor Jost p 16.25 291.6% -23.5% 35.4% 415.9%Bankers Petroleum Ltd BNKq.L Christophor Jost p 492.50 -18.6% -15.5% 13.9% 1.0%BG Group BG.L Michele della Vigna, CFA p 1392.00 19.7% -7.0% 15.3% 37.1%Borders and Southern BSTH.L Christophor Jost p 56.00 0.9% -2.6% -15.5% -23.5%BowLeven Plc BLVN.L Christophor Jost p 302.00 125.4% -10.0% -7.1% 182.2%BP plc BP.L Michele della Vigna, CFA p 461.20 -28.2% -6.8% 5.8% -6.3%BP plc (ADS) BP Michele della Vigna, CFA $ 45.38 -22.8% -5.7% 10.9% 7.0%Cairn Energy PLC CNE.L Christophor Jost p 440.70 3.2% 3.5% 11.6% 12.5%CEPSA CEP.MC Henry Morris € 27.82 34.1% -0.8% 50.4% 55.1%Chariot Oil and Gas Ltd CHARC.L Christophor Jost p 219.00 265.0% -9.1% 16.2% 61.9%Coastal Energy Company CEO.L Christophor Jost p 422.50 36.3% -2.9% 28.0% 99.8%Cove Energy Plc COVE.L Christophor Jost p 86.50 61.7% -8.0% -1.7% 73.0%Desire Petroleum Plc DES.L Christophor Jost p 11.50 -74.4% -64.9% -89.9% -85.5%Det Norske Oljeselskap ASA DETNOR.OL Christophor Jost Nkr 31.00 1.3% 10.7% 11.5% 16.5%DNO International ASA DNO.OL Christophor Jost Nkr 7.15 -8.0% -23.7% -12.3% -7.7%Dominion Petroleum Ltd DOPL.L Christophor Jost p 5.73 -10.2% -11.2% 15.7% -2.6%Dragon Oil PLC DGO.L Christophor Jost p 520.00 4.4% -11.4% 18.8% 31.0%EnCore Oil Plc EO.L Christophor Jost p 68.50 321.5% -42.9% -41.5% 321.5%ENI ENI.MI Michele della Vigna, CFA € 16.24 -6.4% -7.5% 3.8% 8.8%EnQuest Plc ENQ.L Christophor Jost p 132.10 32.2% -5.8% 1.5% 42.4%ERG ERG.MI Henry Morris € 9.16 -13.8% -8.6% -3.6% -3.5%Falkland Oil & Gas Ltd FOGL.L Christophor Jost p 61.25 -54.8% -24.4% -44.7% -67.8%Faroe Petroleum Plc FPM.L Christophor Jost p 152.50 26.6% -17.3% -15.3% 33.2%Galp GALP.LS Henry Morris € 14.47 10.5% -5.1% 10.5% 24.1%Global Energy Development Plc GBLE.L Christophor Jost p 64.00 -37.6% -31.9% -14.1% -41.6%Great Eastern Energy Corporation Ltd GEECq.L Christophor Jost p 417.50 -18.1% 14.4% 14.4% -14.2%Green Dragon Gas Ltd GDG.L Christophor Jost $ 12.85 95.6% -1.3% 15.5% 126.3%Gulf Keystone Petroleum Ltd GKP.L Christophor Jost p 145.25 64.1% -1.5% -19.5% 86.8%Gulfsands Petroleum Plc GPX.L Christophor Jost p 250.00 -25.4% -20.0% -31.9% -2.7%Hardy Oil and Gas Plc HAOG.L Christophor Jost p 209.25 -3.6% 27.0% 12.2% 28.8%Hellenic Petroleum HEPr.AT Henry Morris € 6.67 -16.0% -10.2% 21.1% 9.9%Heritage Oil HOIL.L Christophor Jost p 238.60 -40.8% -10.6% -37.0% -28.7%IGAS Energy Plc IGAS.L Christophor Jost p 72.50 -18.1% -2.0% 9.8% -14.7%Ithaca Energy Inc IAE.L Christophor Jost p 133.63 -5.6% -27.4% -6.6% -7.5%JKX Oil and Gas JKX.L Christophor Jost p 292.40 1.2% -3.8% -6.6% 28.2%Lundin Petroleum LUPE.ST Christophor Jost Skr 83.70 67.1% 6.1% 22.1% 139.5%Maurel & Prom MAUP.PA Christophor Jost € 15.55 23.2% 18.5% 54.0% 64.9%Max Petroleum Plc MXP.L Christophor Jost p 13.75 -34.5% -22.5% -34.5% -5.2%Melrose Resources Plc MRS.L Christophor Jost p 238.25 -21.9% -4.7% -0.7% -17.0%MOL MOLB.BU Henry Morris HUF 22800.00 8.1% -4.3% 21.3% 39.9%Motor Oil Hellas MORr.AT Henry Morris € 9.05 -8.6% 1.7% 21.6% 22.3%Nautical Petroleum Plc NPE.L Christophor Jost p 328.00 583.3% -26.3% -5.7% 556.0%Neste Oil NES1V.HE Henry Morris € 11.74 -13.4% -8.0% 5.8% -1.8%Nighthawk Energy Plc NGTE.L Christophor Jost p 6.36 -74.1% -28.5% -52.0% -69.0%Norse Energy Corp NEC.OL Christophor Jost Nkr 0.66 -78.3% -50.7% -50.7% -72.1%Northern Petroleum Plc NOP.L Christophor Jost p 112.50 -10.0% -15.9% 7.1% -3.0%Norwegian Energy Company ASA NOR.OL Christophor Jost Nkr 11.75 -39.4% -34.7% -29.6% -11.3%OMV OMVV.VI Michele della Vigna, CFA € 28.16 -6.4% -9.9% 5.4% 9.6%PA Resources AB PAR.ST Christophor Jost Skr 4.18 -67.4% -2.6% -28.5% -36.2%Panoro Energy ASA PENO.OL Christophor Jost Nkr 6.17 NA -20.4% -20.7% NAPKN PKNA.WA Henry Morris PLN 52.35 35.5% 16.8% 17.8% 42.6%Premier Oil PMO.L Christophor Jost p 464.10 42.6% -10.4% -1.5% 64.9%Regal Petroleum RPT.L Christophor Jost p 46.50 -33.6% 22.0% 138.5% 31.9%Repsol YPF REP.MC Michele della Vigna, CFA € 22.56 24.0% -6.6% 19.8% 40.1%Rockhopper Exploration Plc RKH.L Christophor Jost p 206.25 252.6% -11.5% -34.7% -10.3%Royal Dutch Shell plc (A ADR) RDSa Michele della Vigna, CFA $ 70.28 19.5% -1.8% 12.9% 39.6%Royal Dutch Shell plc (A) RDSa.AS Michele della Vigna, CFA € 24.66 11.7% -4.7% 5.0% 18.6%Royal Dutch Shell plc (B ADR) RDSb Michele della Vigna, CFA $ 70.90 25.6% -0.8% 15.1% 45.5%Royal Dutch Shell plc (B) RDSb.L Michele della Vigna, CFA p 2142.00 15.5% -2.7% 9.1% 26.5%Saras SRS.MI Henry Morris € 1.69 -18.3% -6.3% 20.3% 4.5%Schoeller-Bleckmann SBOE.VI Rudolf Dreyer € 64.50 51.8% 5.4% 15.5% 79.2%Serica Energy Plc SQZ.L Christophor Jost p 28.00 -69.2% -26.1% -44.3% -67.3%Soco International Plc SIA.L Christophor Jost p 377.50 -11.9% 12.0% 8.4% -3.2%Statoil STL.OL Michele della Vigna, CFA Nkr 136.40 -3.5% -7.0% 9.0% 6.5%Sterling Energy Plc SEY.L Christophor Jost p 45.75 -67.3% -34.9% -11.2% -60.6%TOTAL SA TOTF.PA Michele della Vigna, CFA € 39.20 -10.7% -10.5% 3.9% 4.3%Tower Resources Plc TOWR.L Christophor Jost p 5.78 344.2% -9.8% 42.6% 344.2%Tullow Oil Plc TLW.L Christophor Jost p 1305.00 -0.2% -7.8% 10.4% 23.8%Tupras TUPRS.IS Henry Morris YTL 42.80 31.7% 6.7% 23.3% 45.1%Valiant Petroleum Plc VPP.L Christophor Jost p 538.00 -13.9% -16.6% -2.7% -16.3%Petroplus Holdings PPHN.S Henry Morris SFr 13.10 -37.9% -11.8% 31.7% -20.0%
Average 33.0% -10.5% 2.5% 45.3%
FTSE World Europe (GBP) 388.58 1.0% -1.9% 5.8% 18.4%
Note: Prices as of most recent available close, which could vary from the price date indicated aboveThis table shows movement in absolute share price and not total shareholder return. Results presented should not and cannot be viewed as an indicator of future performance.
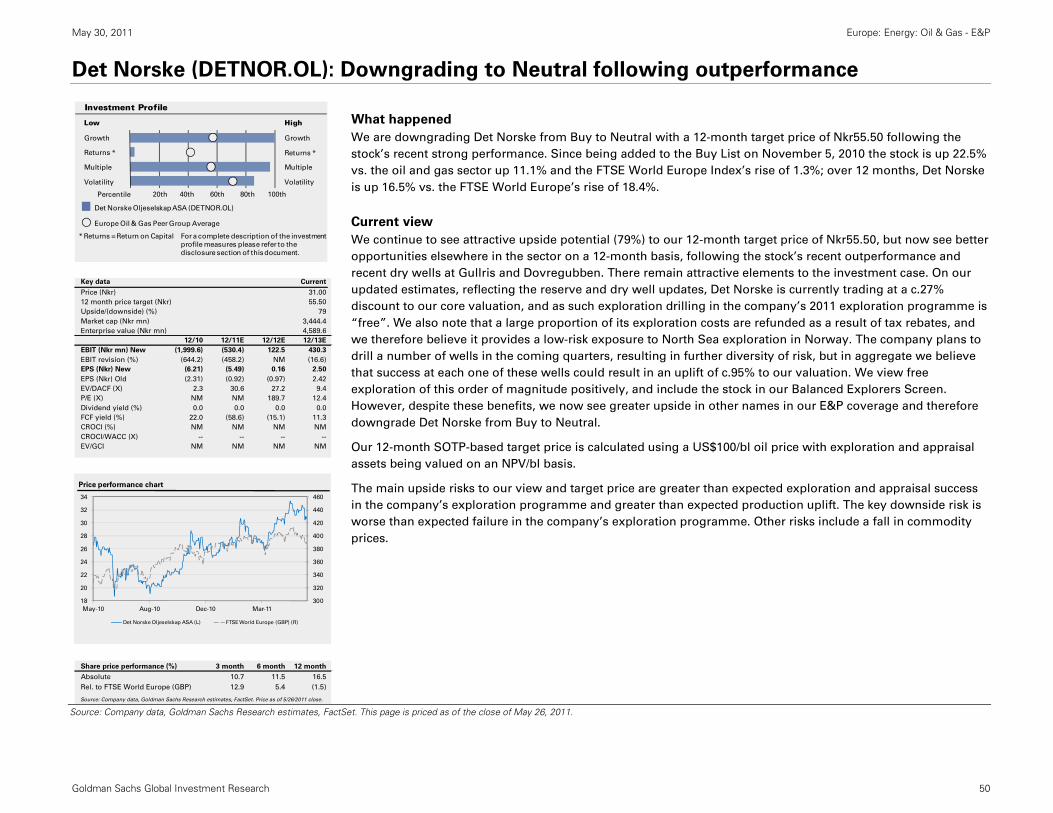
May 30, 2011 Europe: Energy: Oil & Gas - E&P
Goldman Sachs Global Investment Research 50
Det Norske (DETNOR.OL): Downgrading to Neutral following outperformance
What happened
We are downgrading Det Norske from Buy to Neutral with a 12-month target price of Nkr55.50 following the
stock’s recent strong performance. Since being added to the Buy List on November 5, 2010 the stock is up 22.5%
vs. the oil and gas sector up 11.1% and the FTSE World Europe Index’s rise of 1.3%; over 12 months, Det Norske
is up 16.5% vs. the FTSE World Europe’s rise of 18.4%.
Current view
We continue to see attractive upside potential (79%) to our 12-month target price of Nkr55.50, but now see better
opportunities elsewhere in the sector on a 12-month basis, following the stock’s recent outperformance and
recent dry wells at Gullris and Dovregubben. There remain attractive elements to the investment case. On our
updated estimates, reflecting the reserve and dry well updates, Det Norske is currently trading at a c.27%
discount to our core valuation, and as such exploration drilling in the company’s 2011 exploration programme is
“free”. We also note that a large proportion of its exploration costs are refunded as a result of tax rebates, and
we therefore believe it provides a low-risk exposure to North Sea exploration in Norway. The company plans to
drill a number of wells in the coming quarters, resulting in further diversity of risk, but in aggregate we believe
that success at each one of these wells could result in an uplift of c.95% to our valuation. We view free
exploration of this order of magnitude positively, and include the stock in our Balanced Explorers Screen.
However, despite these benefits, we now see greater upside in other names in our E&P coverage and therefore
downgrade Det Norske from Buy to Neutral.
Our 12-month SOTP-based target price is calculated using a US$100/bl oil price with exploration and appraisal
assets being valued on an NPV/bl basis.
The main upside risks to our view and target price are greater than expected exploration and appraisal success
in the company’s exploration programme and greater than expected production uplift. The key downside risk is
worse than expected failure in the company’s exploration programme. Other risks include a fall in commodity
prices.
Source: Company data, Goldman Sachs Research estimates, FactSet. This page is priced as of the close of May 26, 2011.
Growth
Returns *
Multiple
Volatility Volatility
Multiple
Returns *
Growth
Investment Profile
Low High
Percentile 20th 40th 60th 80th 100th
* Returns = Return on Capital For a complete description of the investment
profile measures please refer to the
disclosure section of this document.
Det Norske Oljeselskap ASA (DETNOR.OL)
Europe Oil & Gas Peer Group Average
Key data Current
Price (Nkr) 31.00
12 month price target (Nkr) 55.50
Upside/(downside) (%) 79
Market cap (Nkr mn) 3,444.4
Enterprise value (Nkr mn) 4,589.6
12/10 12/11E 12/12E 12/13E
EBIT (Nkr mn) New (1,999.6) (530.4) 122.5 430.3
EBIT revision (%) (644.2) (458.2) NM (16.6)
EPS (Nkr) New (6.21) (5.49) 0.16 2.50
EPS (Nkr) Old (2.31) (0.92) (0.97) 2.42
EV/DACF (X) 2.3 30.6 27.2 9.4
P/E (X) NM NM 189.7 12.4
Dividend yield (%) 0.0 0.0 0.0 0.0
FCF yield (%) 22.0 (58.6) (15.1) 11.3
CROCI (%) NM NM NM NM
CROCI/WACC (X) -- -- -- --
EV/GCI NM NM NM NM
300
320
340
360
380
400
420
440
460
18
20
22
24
26
28
30
32
34
May-10 Aug-10 Dec-10 Mar-11
Price performance chart
Det Norske Oljeselskap ASA (L) FTSE World Europe (GBP) (R)
Share price performance (%) 3 month 6 month 12 month
Absolute 10.7 11.5 16.5
Rel. to FTSE World Europe (GBP) 12.9 5.4 (1.5)
Source: Company data, Goldman Sachs Research estimates, FactSet. Price as of 5/26/2011 close.
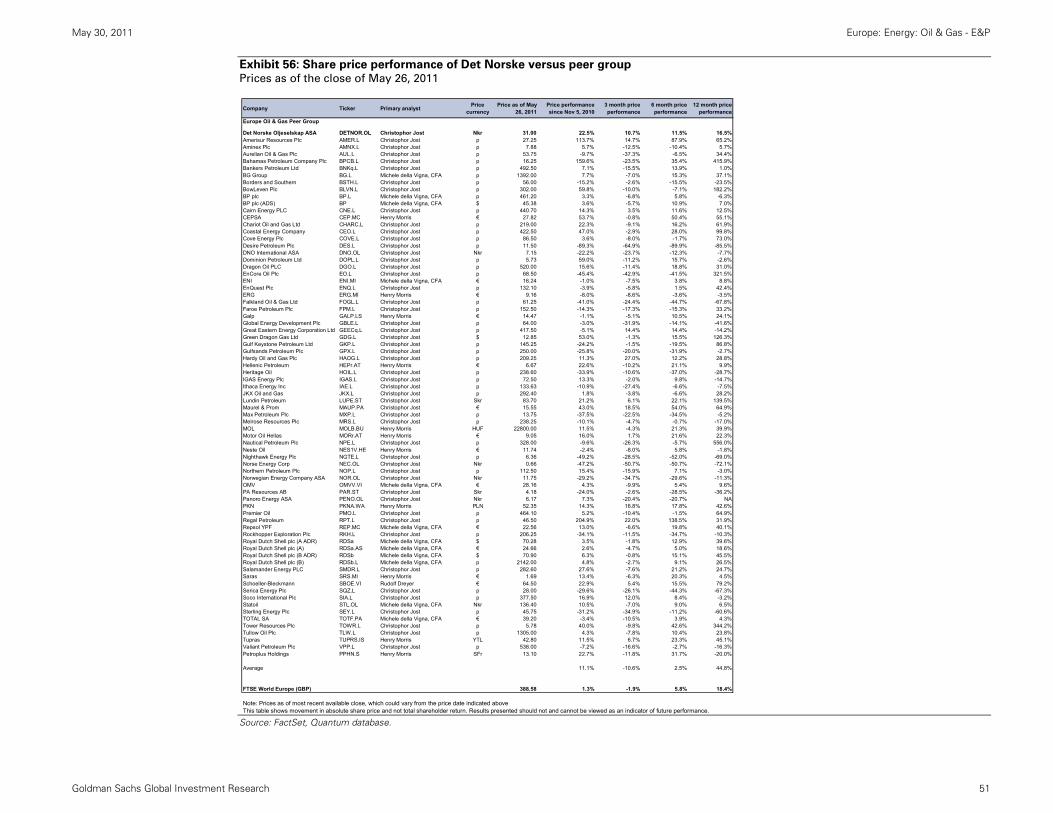
May 30, 2011 Europe: Energy: Oil & Gas - E&P
Goldman Sachs Global Investment Research 51
Exhibit 56: Share price performance of Det Norske versus peer group Prices as of the close of May 26, 2011
Source: FactSet, Quantum database.
Company Ticker Primary analyst Price currency
Price as of May 26, 2011
Price performance since Nov 5, 2010
3 month price performance
6 month price performance
12 month price performance
Europe Oil & Gas Peer Group Det Norske Oljeselskap ASA DETNOR.OL Christophor Jost Nkr 31.00 22.5% 10.7% 11.5% 16.5%Amerisur Resources Plc AMER.L Christophor Jost p 27.25 113.7% 14.7% 87.9% 65.2%Aminex Plc AMNX.L Christophor Jost p 7.88 5.7% -12.5% -10.4% 5.7%Aurelian Oil & Gas Plc AUL.L Christophor Jost p 53.75 -9.7% -37.3% -6.5% 34.4%Bahamas Petroleum Company Plc BPCB.L Christophor Jost p 16.25 159.6% -23.5% 35.4% 415.9%Bankers Petroleum Ltd BNKq.L Christophor Jost p 492.50 7.1% -15.5% 13.9% 1.0%BG Group BG.L Michele della Vigna, CFA p 1392.00 7.7% -7.0% 15.3% 37.1%Borders and Southern BSTH.L Christophor Jost p 56.00 -15.2% -2.6% -15.5% -23.5%BowLeven Plc BLVN.L Christophor Jost p 302.00 59.8% -10.0% -7.1% 182.2%BP plc BP.L Michele della Vigna, CFA p 461.20 3.3% -6.8% 5.8% -6.3%BP plc (ADS) BP Michele della Vigna, CFA $ 45.38 3.6% -5.7% 10.9% 7.0%Cairn Energy PLC CNE.L Christophor Jost p 440.70 14.3% 3.5% 11.6% 12.5%CEPSA CEP.MC Henry Morris € 27.82 53.7% -0.8% 50.4% 55.1%Chariot Oil and Gas Ltd CHARC.L Christophor Jost p 219.00 22.3% -9.1% 16.2% 61.9%Coastal Energy Company CEO.L Christophor Jost p 422.50 47.0% -2.9% 28.0% 99.8%Cove Energy Plc COVE.L Christophor Jost p 86.50 3.6% -8.0% -1.7% 73.0%Desire Petroleum Plc DES.L Christophor Jost p 11.50 -89.3% -64.9% -89.9% -85.5%DNO International ASA DNO.OL Christophor Jost Nkr 7.15 -22.2% -23.7% -12.3% -7.7%Dominion Petroleum Ltd DOPL.L Christophor Jost p 5.73 59.0% -11.2% 15.7% -2.6%Dragon Oil PLC DGO.L Christophor Jost p 520.00 15.6% -11.4% 18.8% 31.0%EnCore Oil Plc EO.L Christophor Jost p 68.50 -45.4% -42.9% -41.5% 321.5%ENI ENI.MI Michele della Vigna, CFA € 16.24 -1.0% -7.5% 3.8% 8.8%EnQuest Plc ENQ.L Christophor Jost p 132.10 -3.9% -5.8% 1.5% 42.4%ERG ERG.MI Henry Morris € 9.16 -8.0% -8.6% -3.6% -3.5%Falkland Oil & Gas Ltd FOGL.L Christophor Jost p 61.25 -41.0% -24.4% -44.7% -67.8%Faroe Petroleum Plc FPM.L Christophor Jost p 152.50 -14.3% -17.3% -15.3% 33.2%Galp GALP.LS Henry Morris € 14.47 -1.1% -5.1% 10.5% 24.1%Global Energy Development Plc GBLE.L Christophor Jost p 64.00 -3.0% -31.9% -14.1% -41.6%Great Eastern Energy Corporation Ltd GEECq.L Christophor Jost p 417.50 -5.1% 14.4% 14.4% -14.2%Green Dragon Gas Ltd GDG.L Christophor Jost $ 12.85 53.0% -1.3% 15.5% 126.3%Gulf Keystone Petroleum Ltd GKP.L Christophor Jost p 145.25 -24.2% -1.5% -19.5% 86.8%Gulfsands Petroleum Plc GPX.L Christophor Jost p 250.00 -25.8% -20.0% -31.9% -2.7%Hardy Oil and Gas Plc HAOG.L Christophor Jost p 209.25 11.3% 27.0% 12.2% 28.8%Hellenic Petroleum HEPr.AT Henry Morris € 6.67 22.6% -10.2% 21.1% 9.9%Heritage Oil HOIL.L Christophor Jost p 238.60 -33.9% -10.6% -37.0% -28.7%IGAS Energy Plc IGAS.L Christophor Jost p 72.50 13.3% -2.0% 9.8% -14.7%Ithaca Energy Inc IAE.L Christophor Jost p 133.63 -10.9% -27.4% -6.6% -7.5%JKX Oil and Gas JKX.L Christophor Jost p 292.40 1.8% -3.8% -6.6% 28.2%Lundin Petroleum LUPE.ST Christophor Jost Skr 83.70 21.2% 6.1% 22.1% 139.5%Maurel & Prom MAUP.PA Christophor Jost € 15.55 43.0% 18.5% 54.0% 64.9%Max Petroleum Plc MXP.L Christophor Jost p 13.75 -37.5% -22.5% -34.5% -5.2%Melrose Resources Plc MRS.L Christophor Jost p 238.25 -10.1% -4.7% -0.7% -17.0%MOL MOLB.BU Henry Morris HUF 22800.00 11.5% -4.3% 21.3% 39.9%Motor Oil Hellas MORr.AT Henry Morris € 9.05 16.0% 1.7% 21.6% 22.3%Nautical Petroleum Plc NPE.L Christophor Jost p 328.00 -9.6% -26.3% -5.7% 556.0%Neste Oil NES1V.HE Henry Morris € 11.74 -2.4% -8.0% 5.8% -1.8%Nighthawk Energy Plc NGTE.L Christophor Jost p 6.36 -49.2% -28.5% -52.0% -69.0%Norse Energy Corp NEC.OL Christophor Jost Nkr 0.66 -47.2% -50.7% -50.7% -72.1%Northern Petroleum Plc NOP.L Christophor Jost p 112.50 15.4% -15.9% 7.1% -3.0%Norwegian Energy Company ASA NOR.OL Christophor Jost Nkr 11.75 -29.2% -34.7% -29.6% -11.3%OMV OMVV.VI Michele della Vigna, CFA € 28.16 4.3% -9.9% 5.4% 9.6%PA Resources AB PAR.ST Christophor Jost Skr 4.18 -24.0% -2.6% -28.5% -36.2%Panoro Energy ASA PENO.OL Christophor Jost Nkr 6.17 7.3% -20.4% -20.7% NAPKN PKNA.WA Henry Morris PLN 52.35 14.3% 16.8% 17.8% 42.6%Premier Oil PMO.L Christophor Jost p 464.10 5.2% -10.4% -1.5% 64.9%Regal Petroleum RPT.L Christophor Jost p 46.50 204.9% 22.0% 138.5% 31.9%Repsol YPF REP.MC Michele della Vigna, CFA € 22.56 13.0% -6.6% 19.8% 40.1%Rockhopper Exploration Plc RKH.L Christophor Jost p 206.25 -34.1% -11.5% -34.7% -10.3%Royal Dutch Shell plc (A ADR) RDSa Michele della Vigna, CFA $ 70.28 3.5% -1.8% 12.9% 39.6%Royal Dutch Shell plc (A) RDSa.AS Michele della Vigna, CFA € 24.66 2.6% -4.7% 5.0% 18.6%Royal Dutch Shell plc (B ADR) RDSb Michele della Vigna, CFA $ 70.90 6.3% -0.8% 15.1% 45.5%Royal Dutch Shell plc (B) RDSb.L Michele della Vigna, CFA p 2142.00 4.8% -2.7% 9.1% 26.5%Salamander Energy PLC SMDR.L Christophor Jost p 282.60 27.6% -7.6% 21.2% 24.7%Saras SRS.MI Henry Morris € 1.69 13.4% -6.3% 20.3% 4.5%Schoeller-Bleckmann SBOE.VI Rudolf Dreyer € 64.50 22.9% 5.4% 15.5% 79.2%Serica Energy Plc SQZ.L Christophor Jost p 28.00 -29.6% -26.1% -44.3% -67.3%Soco International Plc SIA.L Christophor Jost p 377.50 16.9% 12.0% 8.4% -3.2%Statoil STL.OL Michele della Vigna, CFA Nkr 136.40 10.5% -7.0% 9.0% 6.5%Sterling Energy Plc SEY.L Christophor Jost p 45.75 -31.2% -34.9% -11.2% -60.6%TOTAL SA TOTF.PA Michele della Vigna, CFA € 39.20 -3.4% -10.5% 3.9% 4.3%Tower Resources Plc TOWR.L Christophor Jost p 5.78 40.0% -9.8% 42.6% 344.2%Tullow Oil Plc TLW.L Christophor Jost p 1305.00 4.3% -7.8% 10.4% 23.8%Tupras TUPRS.IS Henry Morris YTL 42.80 11.5% 6.7% 23.3% 45.1%Valiant Petroleum Plc VPP.L Christophor Jost p 538.00 -7.2% -16.6% -2.7% -16.3%Petroplus Holdings PPHN.S Henry Morris SFr 13.10 22.7% -11.8% 31.7% -20.0%
Average 11.1% -10.6% 2.5% 44.8%
FTSE World Europe (GBP) 388.58 1.3% -1.9% 5.8% 18.4%
Note: Prices as of most recent available close, which could vary from the price date indicated aboveThis table shows movement in absolute share price and not total shareholder return. Results presented should not and cannot be viewed as an indicator of future performance.
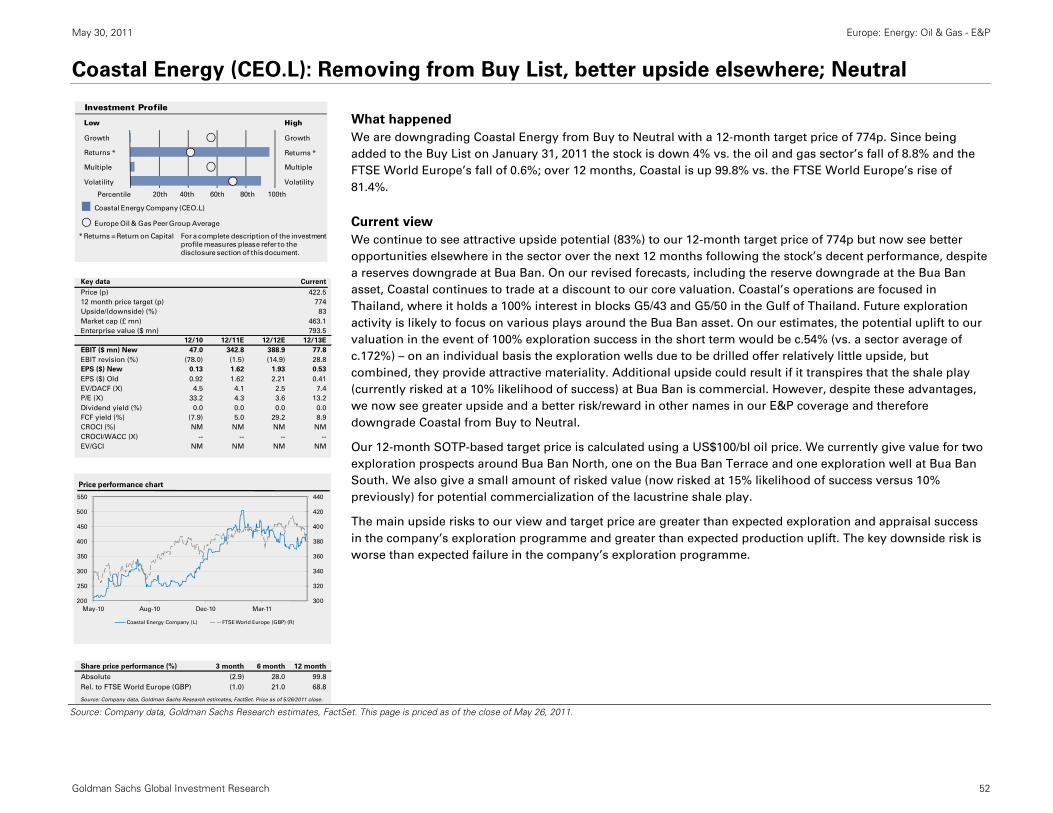
May 30, 2011 Europe: Energy: Oil & Gas - E&P
Goldman Sachs Global Investment Research 52
Coastal Energy (CEO.L): Removing from Buy List, better upside elsewhere; Neutral
What happened
We are downgrading Coastal Energy from Buy to Neutral with a 12-month target price of 774p. Since being
added to the Buy List on January 31, 2011 the stock is down 4% vs. the oil and gas sector’s fall of 8.8% and the
FTSE World Europe’s fall of 0.6%; over 12 months, Coastal is up 99.8% vs. the FTSE World Europe’s rise of
81.4%.
Current view
We continue to see attractive upside potential (83%) to our 12-month target price of 774p but now see better
opportunities elsewhere in the sector over the next 12 months following the stock’s decent performance, despite
a reserves downgrade at Bua Ban. On our revised forecasts, including the reserve downgrade at the Bua Ban
asset, Coastal continues to trade at a discount to our core valuation. Coastal’s operations are focused in
Thailand, where it holds a 100% interest in blocks G5/43 and G5/50 in the Gulf of Thailand. Future exploration
activity is likely to focus on various plays around the Bua Ban asset. On our estimates, the potential uplift to our
valuation in the event of 100% exploration success in the short term would be c.54% (vs. a sector average of
c.172%) – on an individual basis the exploration wells due to be drilled offer relatively little upside, but
combined, they provide attractive materiality. Additional upside could result if it transpires that the shale play
(currently risked at a 10% likelihood of success) at Bua Ban is commercial. However, despite these advantages,
we now see greater upside and a better risk/reward in other names in our E&P coverage and therefore
downgrade Coastal from Buy to Neutral.
Our 12-month SOTP-based target price is calculated using a US$100/bl oil price. We currently give value for two
exploration prospects around Bua Ban North, one on the Bua Ban Terrace and one exploration well at Bua Ban
South. We also give a small amount of risked value (now risked at 15% likelihood of success versus 10%
previously) for potential commercialization of the lacustrine shale play.
The main upside risks to our view and target price are greater than expected exploration and appraisal success
in the company’s exploration programme and greater than expected production uplift. The key downside risk is
worse than expected failure in the company’s exploration programme.
Source: Company data, Goldman Sachs Research estimates, FactSet. This page is priced as of the close of May 26, 2011.
Growth
Returns *
Multiple
Volatility Volatility
Multiple
Returns *
Growth
Investment Profile
Low High
Percentile 20th 40th 60th 80th 100th
* Returns = Return on Capital For a complete description of the investment
profile measures please refer to the
disclosure section of this document.
Coastal Energy Company (CEO.L)
Europe Oil & Gas Peer Group Average
Key data Current
Price (p) 422.5
12 month price target (p) 774
Upside/(downside) (%) 83
Market cap (£ mn) 463.1
Enterprise value ($ mn) 793.5
12/10 12/11E 12/12E 12/13E
EBIT ($ mn) New 47.0 342.8 388.9 77.8
EBIT revision (%) (78.0) (1.5) (14.9) 28.8
EPS ($) New 0.13 1.62 1.93 0.53
EPS ($) Old 0.92 1.62 2.21 0.41
EV/DACF (X) 4.5 4.1 2.5 7.4
P/E (X) 33.2 4.3 3.6 13.2
Dividend yield (%) 0.0 0.0 0.0 0.0
FCF yield (%) (7.9) 5.0 29.2 8.9
CROCI (%) NM NM NM NM
CROCI/WACC (X) -- -- -- --
EV/GCI NM NM NM NM
300
320
340
360
380
400
420
440
200
250
300
350
400
450
500
550
May-10 Aug-10 Dec-10 Mar-11
Price performance chart
Coastal Energy Company (L) FTSE World Europe (GBP) (R)
Share price performance (%) 3 month 6 month 12 month
Absolute (2.9) 28.0 99.8
Rel. to FTSE World Europe (GBP) (1.0) 21.0 68.8
Source: Company data, Goldman Sachs Research estimates, FactSet. Price as of 5/26/2011 close.
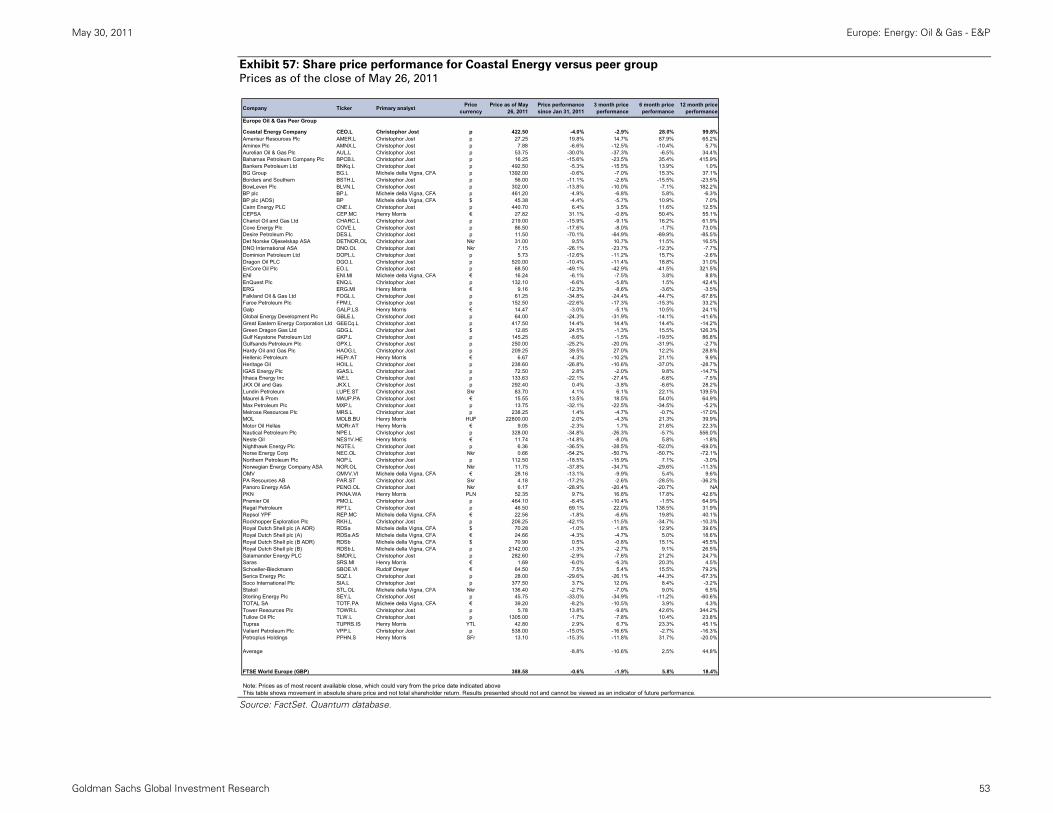
May 30, 2011 Europe: Energy: Oil & Gas - E&P
Goldman Sachs Global Investment Research 53
Exhibit 57: Share price performance for Coastal Energy versus peer group Prices as of the close of May 26, 2011
Source: FactSet. Quantum database.
Company Ticker Primary analyst Price currency
Price as of May 26, 2011
Price performance since Jan 31, 2011
3 month price performance
6 month price performance
12 month price performance
Europe Oil & Gas Peer Group Coastal Energy Company CEO.L Christophor Jost p 422.50 -4.0% -2.9% 28.0% 99.8%Amerisur Resources Plc AMER.L Christophor Jost p 27.25 19.8% 14.7% 87.9% 65.2%Aminex Plc AMNX.L Christophor Jost p 7.88 -6.6% -12.5% -10.4% 5.7%Aurelian Oil & Gas Plc AUL.L Christophor Jost p 53.75 -30.0% -37.3% -6.5% 34.4%Bahamas Petroleum Company Plc BPCB.L Christophor Jost p 16.25 -15.6% -23.5% 35.4% 415.9%Bankers Petroleum Ltd BNKq.L Christophor Jost p 492.50 -5.3% -15.5% 13.9% 1.0%BG Group BG.L Michele della Vigna, CFA p 1392.00 -0.6% -7.0% 15.3% 37.1%Borders and Southern BSTH.L Christophor Jost p 56.00 -11.1% -2.6% -15.5% -23.5%BowLeven Plc BLVN.L Christophor Jost p 302.00 -13.8% -10.0% -7.1% 182.2%BP plc BP.L Michele della Vigna, CFA p 461.20 -4.9% -6.8% 5.8% -6.3%BP plc (ADS) BP Michele della Vigna, CFA $ 45.38 -4.4% -5.7% 10.9% 7.0%Cairn Energy PLC CNE.L Christophor Jost p 440.70 6.4% 3.5% 11.6% 12.5%CEPSA CEP.MC Henry Morris € 27.82 31.1% -0.8% 50.4% 55.1%Chariot Oil and Gas Ltd CHARC.L Christophor Jost p 219.00 -15.9% -9.1% 16.2% 61.9%Cove Energy Plc COVE.L Christophor Jost p 86.50 -17.6% -8.0% -1.7% 73.0%Desire Petroleum Plc DES.L Christophor Jost p 11.50 -70.1% -64.9% -89.9% -85.5%Det Norske Oljeselskap ASA DETNOR.OL Christophor Jost Nkr 31.00 9.5% 10.7% 11.5% 16.5%DNO International ASA DNO.OL Christophor Jost Nkr 7.15 -26.1% -23.7% -12.3% -7.7%Dominion Petroleum Ltd DOPL.L Christophor Jost p 5.73 -12.6% -11.2% 15.7% -2.6%Dragon Oil PLC DGO.L Christophor Jost p 520.00 -10.4% -11.4% 18.8% 31.0%EnCore Oil Plc EO.L Christophor Jost p 68.50 -49.1% -42.9% -41.5% 321.5%ENI ENI.MI Michele della Vigna, CFA € 16.24 -6.1% -7.5% 3.8% 8.8%EnQuest Plc ENQ.L Christophor Jost p 132.10 -6.6% -5.8% 1.5% 42.4%ERG ERG.MI Henry Morris € 9.16 -12.3% -8.6% -3.6% -3.5%Falkland Oil & Gas Ltd FOGL.L Christophor Jost p 61.25 -34.8% -24.4% -44.7% -67.8%Faroe Petroleum Plc FPM.L Christophor Jost p 152.50 -22.6% -17.3% -15.3% 33.2%Galp GALP.LS Henry Morris € 14.47 -3.0% -5.1% 10.5% 24.1%Global Energy Development Plc GBLE.L Christophor Jost p 64.00 -24.3% -31.9% -14.1% -41.6%Great Eastern Energy Corporation Ltd GEECq.L Christophor Jost p 417.50 14.4% 14.4% 14.4% -14.2%Green Dragon Gas Ltd GDG.L Christophor Jost $ 12.85 24.5% -1.3% 15.5% 126.3%Gulf Keystone Petroleum Ltd GKP.L Christophor Jost p 145.25 -8.6% -1.5% -19.5% 86.8%Gulfsands Petroleum Plc GPX.L Christophor Jost p 250.00 -25.2% -20.0% -31.9% -2.7%Hardy Oil and Gas Plc HAOG.L Christophor Jost p 209.25 39.5% 27.0% 12.2% 28.8%Hellenic Petroleum HEPr.AT Henry Morris € 6.67 -4.3% -10.2% 21.1% 9.9%Heritage Oil HOIL.L Christophor Jost p 238.60 -26.8% -10.6% -37.0% -28.7%IGAS Energy Plc IGAS.L Christophor Jost p 72.50 2.8% -2.0% 9.8% -14.7%Ithaca Energy Inc IAE.L Christophor Jost p 133.63 -22.1% -27.4% -6.6% -7.5%JKX Oil and Gas JKX.L Christophor Jost p 292.40 0.4% -3.8% -6.6% 28.2%Lundin Petroleum LUPE.ST Christophor Jost Skr 83.70 4.1% 6.1% 22.1% 139.5%Maurel & Prom MAUP.PA Christophor Jost € 15.55 13.5% 18.5% 54.0% 64.9%Max Petroleum Plc MXP.L Christophor Jost p 13.75 -32.1% -22.5% -34.5% -5.2%Melrose Resources Plc MRS.L Christophor Jost p 238.25 1.4% -4.7% -0.7% -17.0%MOL MOLB.BU Henry Morris HUF 22800.00 2.0% -4.3% 21.3% 39.9%Motor Oil Hellas MORr.AT Henry Morris € 9.05 -2.3% 1.7% 21.6% 22.3%Nautical Petroleum Plc NPE.L Christophor Jost p 328.00 -34.8% -26.3% -5.7% 556.0%Neste Oil NES1V.HE Henry Morris € 11.74 -14.8% -8.0% 5.8% -1.8%Nighthawk Energy Plc NGTE.L Christophor Jost p 6.36 -36.5% -28.5% -52.0% -69.0%Norse Energy Corp NEC.OL Christophor Jost Nkr 0.66 -54.2% -50.7% -50.7% -72.1%Northern Petroleum Plc NOP.L Christophor Jost p 112.50 -18.5% -15.9% 7.1% -3.0%Norwegian Energy Company ASA NOR.OL Christophor Jost Nkr 11.75 -37.8% -34.7% -29.6% -11.3%OMV OMVV.VI Michele della Vigna, CFA € 28.16 -13.1% -9.9% 5.4% 9.6%PA Resources AB PAR.ST Christophor Jost Skr 4.18 -17.2% -2.6% -28.5% -36.2%Panoro Energy ASA PENO.OL Christophor Jost Nkr 6.17 -28.9% -20.4% -20.7% NAPKN PKNA.WA Henry Morris PLN 52.35 9.7% 16.8% 17.8% 42.6%Premier Oil PMO.L Christophor Jost p 464.10 -8.4% -10.4% -1.5% 64.9%Regal Petroleum RPT.L Christophor Jost p 46.50 69.1% 22.0% 138.5% 31.9%Repsol YPF REP.MC Michele della Vigna, CFA € 22.56 -1.8% -6.6% 19.8% 40.1%Rockhopper Exploration Plc RKH.L Christophor Jost p 206.25 -42.1% -11.5% -34.7% -10.3%Royal Dutch Shell plc (A ADR) RDSa Michele della Vigna, CFA $ 70.28 -1.0% -1.8% 12.9% 39.6%Royal Dutch Shell plc (A) RDSa.AS Michele della Vigna, CFA € 24.66 -4.3% -4.7% 5.0% 18.6%Royal Dutch Shell plc (B ADR) RDSb Michele della Vigna, CFA $ 70.90 0.5% -0.8% 15.1% 45.5%Royal Dutch Shell plc (B) RDSb.L Michele della Vigna, CFA p 2142.00 -1.3% -2.7% 9.1% 26.5%Salamander Energy PLC SMDR.L Christophor Jost p 282.60 -2.9% -7.6% 21.2% 24.7%Saras SRS.MI Henry Morris € 1.69 -6.0% -6.3% 20.3% 4.5%Schoeller-Bleckmann SBOE.VI Rudolf Dreyer € 64.50 7.5% 5.4% 15.5% 79.2%Serica Energy Plc SQZ.L Christophor Jost p 28.00 -29.6% -26.1% -44.3% -67.3%Soco International Plc SIA.L Christophor Jost p 377.50 3.7% 12.0% 8.4% -3.2%Statoil STL.OL Michele della Vigna, CFA Nkr 136.40 -2.7% -7.0% 9.0% 6.5%Sterling Energy Plc SEY.L Christophor Jost p 45.75 -33.0% -34.9% -11.2% -60.6%TOTAL SA TOTF.PA Michele della Vigna, CFA € 39.20 -8.2% -10.5% 3.9% 4.3%Tower Resources Plc TOWR.L Christophor Jost p 5.78 13.8% -9.8% 42.6% 344.2%Tullow Oil Plc TLW.L Christophor Jost p 1305.00 -1.7% -7.8% 10.4% 23.8%Tupras TUPRS.IS Henry Morris YTL 42.80 2.9% 6.7% 23.3% 45.1%Valiant Petroleum Plc VPP.L Christophor Jost p 538.00 -15.0% -16.6% -2.7% -16.3%Petroplus Holdings PPHN.S Henry Morris SFr 13.10 -15.3% -11.8% 31.7% -20.0%
Average -8.8% -10.6% 2.5% 44.8%
FTSE World Europe (GBP) 388.58 -0.6% -1.9% 5.8% 18.4%
Note: Prices as of most recent available close, which could vary from the price date indicated aboveThis table shows movement in absolute share price and not total shareholder return. Results presented should not and cannot be viewed as an indicator of future performance.
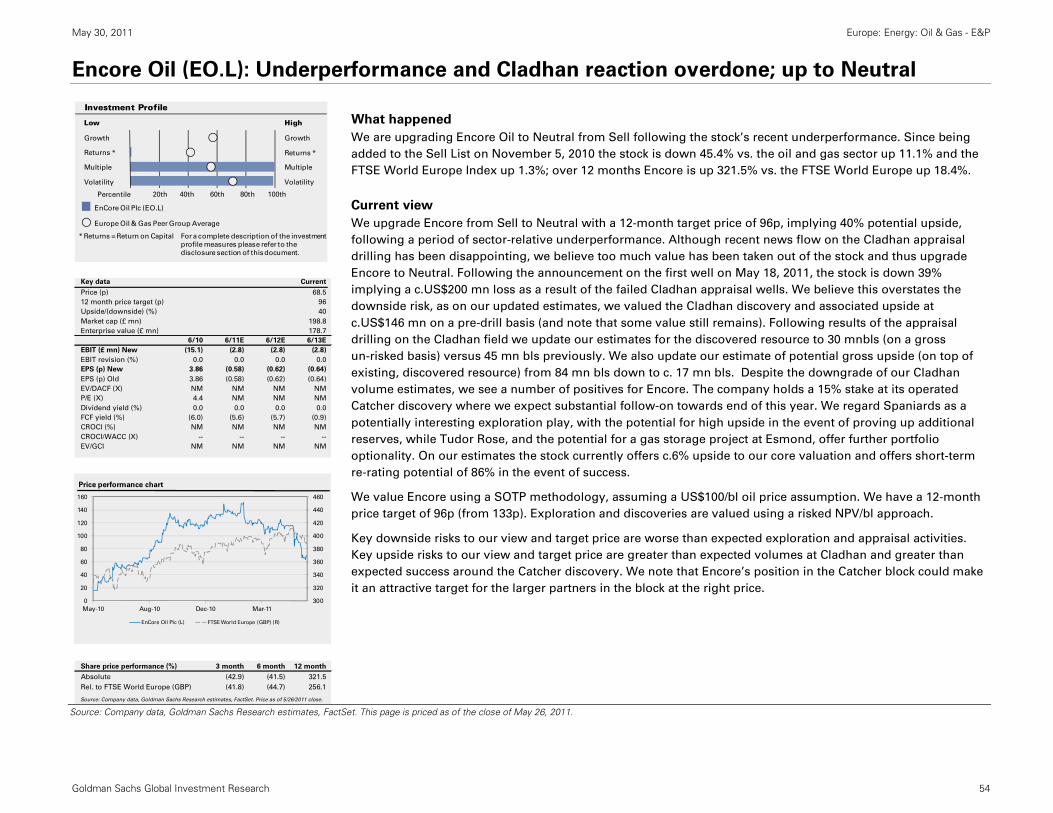
May 30, 2011 Europe: Energy: Oil & Gas - E&P
Goldman Sachs Global Investment Research 54
Encore Oil (EO.L): Underperformance and Cladhan reaction overdone; up to Neutral
What happened
We are upgrading Encore Oil to Neutral from Sell following the stock’s recent underperformance. Since being
added to the Sell List on November 5, 2010 the stock is down 45.4% vs. the oil and gas sector up 11.1% and the
FTSE World Europe Index up 1.3%; over 12 months Encore is up 321.5% vs. the FTSE World Europe up 18.4%.
Current view
We upgrade Encore from Sell to Neutral with a 12-month target price of 96p, implying 40% potential upside,
following a period of sector-relative underperformance. Although recent news flow on the Cladhan appraisal
drilling has been disappointing, we believe too much value has been taken out of the stock and thus upgrade
Encore to Neutral. Following the announcement on the first well on May 18, 2011, the stock is down 39%
implying a c.US$200 mn loss as a result of the failed Cladhan appraisal wells. We believe this overstates the
downside risk, as on our updated estimates, we valued the Cladhan discovery and associated upside at
c.US$146 mn on a pre-drill basis (and note that some value still remains). Following results of the appraisal
drilling on the Cladhan field we update our estimates for the discovered resource to 30 mnbls (on a gross
un-risked basis) versus 45 mn bls previously. We also update our estimate of potential gross upside (on top of
existing, discovered resource) from 84 mn bls down to c. 17 mn bls. Despite the downgrade of our Cladhan
volume estimates, we see a number of positives for Encore. The company holds a 15% stake at its operated
Catcher discovery where we expect substantial follow-on towards end of this year. We regard Spaniards as a
potentially interesting exploration play, with the potential for high upside in the event of proving up additional
reserves, while Tudor Rose, and the potential for a gas storage project at Esmond, offer further portfolio
optionality. On our estimates the stock currently offers c.6% upside to our core valuation and offers short-term
re-rating potential of 86% in the event of success.
We value Encore using a SOTP methodology, assuming a US$100/bl oil price assumption. We have a 12-month
price target of 96p (from 133p). Exploration and discoveries are valued using a risked NPV/bl approach.
Key downside risks to our view and target price are worse than expected exploration and appraisal activities.
Key upside risks to our view and target price are greater than expected volumes at Cladhan and greater than
expected success around the Catcher discovery. We note that Encore’s position in the Catcher block could make
it an attractive target for the larger partners in the block at the right price.
Source: Company data, Goldman Sachs Research estimates, FactSet. This page is priced as of the close of May 26, 2011.
Growth
Returns *
Multiple
Volatility Volatility
Multiple
Returns *
Growth
Investment Profile
Low High
Percentile 20th 40th 60th 80th 100th
* Returns = Return on Capital For a complete description of the investment
profile measures please refer to the
disclosure section of this document.
EnCore Oil Plc (EO.L)
Europe Oil & Gas Peer Group Average
Key data Current
Price (p) 68.5
12 month price target (p) 96
Upside/(downside) (%) 40
Market cap (£ mn) 198.8
Enterprise value (£ mn) 178.7
6/10 6/11E 6/12E 6/13E
EBIT (£ mn) New (15.1) (2.8) (2.8) (2.8)
EBIT revision (%) 0.0 0.0 0.0 0.0
EPS (p) New 3.86 (0.58) (0.62) (0.64)
EPS (p) Old 3.86 (0.58) (0.62) (0.64)
EV/DACF (X) NM NM NM NM
P/E (X) 4.4 NM NM NM
Dividend yield (%) 0.0 0.0 0.0 0.0
FCF yield (%) (6.0) (5.6) (5.7) (0.9)
CROCI (%) NM NM NM NM
CROCI/WACC (X) -- -- -- --
EV/GCI NM NM NM NM
300
320
340
360
380
400
420
440
460
0
20
40
60
80
100
120
140
160
May-10 Aug-10 Dec-10 Mar-11
Price performance chart
EnCore Oil Plc (L) FTSE World Europe (GBP) (R)
Share price performance (%) 3 month 6 month 12 month
Absolute (42.9) (41.5) 321.5
Rel. to FTSE World Europe (GBP) (41.8) (44.7) 256.1
Source: Company data, Goldman Sachs Research estimates, FactSet. Price as of 5/26/2011 close.

May 30, 2011 Europe: Energy: Oil & Gas - E&P
Goldman Sachs Global Investment Research 55
Exhibit 58: Share price performance for Encore Oil versus peer group Prices as of the close of May 26, 2011
Source: FactSet. Quantum database.
Company Ticker Primary analyst Price currency
Price as of May 26, 2011
Price performance since Nov 5, 2010
3 month price performance
6 month price performance
12 month price performance
Europe Oil & Gas Peer Group EnCore Oil Plc EO.L Christophor Jost p 68.50 -45.4% -42.9% -41.5% 321.5%Amerisur Resources Plc AMER.L Christophor Jost p 27.25 113.7% 14.7% 87.9% 65.2%Aminex Plc AMNX.L Christophor Jost p 7.88 5.7% -12.5% -10.4% 5.7%Aurelian Oil & Gas Plc AUL.L Christophor Jost p 53.75 -9.7% -37.3% -6.5% 34.4%Bahamas Petroleum Company Plc BPCB.L Christophor Jost p 16.25 159.6% -23.5% 35.4% 415.9%Bankers Petroleum Ltd BNKq.L Christophor Jost p 492.50 7.1% -15.5% 13.9% 1.0%BG Group BG.L Michele della Vigna, CFA p 1392.00 7.7% -7.0% 15.3% 37.1%Borders and Southern BSTH.L Christophor Jost p 56.00 -15.2% -2.6% -15.5% -23.5%BowLeven Plc BLVN.L Christophor Jost p 302.00 59.8% -10.0% -7.1% 182.2%BP plc BP.L Michele della Vigna, CFA p 461.20 3.3% -6.8% 5.8% -6.3%BP plc (ADS) BP Michele della Vigna, CFA $ 45.38 3.6% -5.7% 10.9% 7.0%Cairn Energy PLC CNE.L Christophor Jost p 440.70 14.3% 3.5% 11.6% 12.5%CEPSA CEP.MC Henry Morris € 27.82 53.7% -0.8% 50.4% 55.1%Chariot Oil and Gas Ltd CHARC.L Christophor Jost p 219.00 22.3% -9.1% 16.2% 61.9%Coastal Energy Company CEO.L Christophor Jost p 422.50 47.0% -2.9% 28.0% 99.8%Cove Energy Plc COVE.L Christophor Jost p 86.50 3.6% -8.0% -1.7% 73.0%Desire Petroleum Plc DES.L Christophor Jost p 11.50 -89.3% -64.9% -89.9% -85.5%Det Norske Oljeselskap ASA DETNOR.OL Christophor Jost Nkr 31.00 22.5% 10.7% 11.5% 16.5%DNO International ASA DNO.OL Christophor Jost Nkr 7.15 -22.2% -23.7% -12.3% -7.7%Dominion Petroleum Ltd DOPL.L Christophor Jost p 5.73 59.0% -11.2% 15.7% -2.6%Dragon Oil PLC DGO.L Christophor Jost p 520.00 15.6% -11.4% 18.8% 31.0%ENI ENI.MI Michele della Vigna, CFA € 16.24 -1.0% -7.5% 3.8% 8.8%EnQuest Plc ENQ.L Christophor Jost p 132.10 -3.9% -5.8% 1.5% 42.4%ERG ERG.MI Henry Morris € 9.16 -8.0% -8.6% -3.6% -3.5%Falkland Oil & Gas Ltd FOGL.L Christophor Jost p 61.25 -41.0% -24.4% -44.7% -67.8%Faroe Petroleum Plc FPM.L Christophor Jost p 152.50 -14.3% -17.3% -15.3% 33.2%Galp GALP.LS Henry Morris € 14.47 -1.1% -5.1% 10.5% 24.1%Global Energy Development Plc GBLE.L Christophor Jost p 64.00 -3.0% -31.9% -14.1% -41.6%Great Eastern Energy Corporation Ltd GEECq.L Christophor Jost p 417.50 -5.1% 14.4% 14.4% -14.2%Green Dragon Gas Ltd GDG.L Christophor Jost $ 12.85 53.0% -1.3% 15.5% 126.3%Gulf Keystone Petroleum Ltd GKP.L Christophor Jost p 145.25 -24.2% -1.5% -19.5% 86.8%Gulfsands Petroleum Plc GPX.L Christophor Jost p 250.00 -25.8% -20.0% -31.9% -2.7%Hardy Oil and Gas Plc HAOG.L Christophor Jost p 209.25 11.3% 27.0% 12.2% 28.8%Hellenic Petroleum HEPr.AT Henry Morris € 6.67 22.6% -10.2% 21.1% 9.9%Heritage Oil HOIL.L Christophor Jost p 238.60 -33.9% -10.6% -37.0% -28.7%IGAS Energy Plc IGAS.L Christophor Jost p 72.50 13.3% -2.0% 9.8% -14.7%Ithaca Energy Inc IAE.L Christophor Jost p 133.63 -10.9% -27.4% -6.6% -7.5%JKX Oil and Gas JKX.L Christophor Jost p 292.40 1.8% -3.8% -6.6% 28.2%Lundin Petroleum LUPE.ST Christophor Jost Skr 83.70 21.2% 6.1% 22.1% 139.5%Maurel & Prom MAUP.PA Christophor Jost € 15.55 43.0% 18.5% 54.0% 64.9%Max Petroleum Plc MXP.L Christophor Jost p 13.75 -37.5% -22.5% -34.5% -5.2%Melrose Resources Plc MRS.L Christophor Jost p 238.25 -10.1% -4.7% -0.7% -17.0%MOL MOLB.BU Henry Morris HUF 22800.00 11.5% -4.3% 21.3% 39.9%Motor Oil Hellas MORr.AT Henry Morris € 9.05 16.0% 1.7% 21.6% 22.3%Nautical Petroleum Plc NPE.L Christophor Jost p 328.00 -9.6% -26.3% -5.7% 556.0%Neste Oil NES1V.HE Henry Morris € 11.74 -2.4% -8.0% 5.8% -1.8%Nighthawk Energy Plc NGTE.L Christophor Jost p 6.36 -49.2% -28.5% -52.0% -69.0%Norse Energy Corp NEC.OL Christophor Jost Nkr 0.66 -47.2% -50.7% -50.7% -72.1%Northern Petroleum Plc NOP.L Christophor Jost p 112.50 15.4% -15.9% 7.1% -3.0%Norwegian Energy Company ASA NOR.OL Christophor Jost Nkr 11.75 -29.2% -34.7% -29.6% -11.3%OMV OMVV.VI Michele della Vigna, CFA € 28.16 4.3% -9.9% 5.4% 9.6%PA Resources AB PAR.ST Christophor Jost Skr 4.18 -24.0% -2.6% -28.5% -36.2%Panoro Energy ASA PENO.OL Christophor Jost Nkr 6.17 7.3% -20.4% -20.7% NAPetroplus Holdings PPHN.S Henry Morris SFr 13.10 22.7% -11.8% 31.7% -20.0%PKN PKNA.WA Henry Morris PLN 52.35 14.3% 16.8% 17.8% 42.6%Premier Oil PMO.L Christophor Jost p 464.10 5.2% -10.4% -1.5% 64.9%Regal Petroleum RPT.L Christophor Jost p 46.50 204.9% 22.0% 138.5% 31.9%Repsol YPF REP.MC Michele della Vigna, CFA € 22.56 13.0% -6.6% 19.8% 40.1%Rockhopper Exploration Plc RKH.L Christophor Jost p 206.25 -34.1% -11.5% -34.7% -10.3%Royal Dutch Shell plc (A ADR) RDSa Michele della Vigna, CFA $ 70.28 3.5% -1.8% 12.9% 39.6%Royal Dutch Shell plc (A) RDSa.AS Michele della Vigna, CFA € 24.66 2.6% -4.7% 5.0% 18.6%Royal Dutch Shell plc (B ADR) RDSb Michele della Vigna, CFA $ 70.90 6.3% -0.8% 15.1% 45.5%Royal Dutch Shell plc (B) RDSb.L Michele della Vigna, CFA p 2142.00 4.8% -2.7% 9.1% 26.5%Salamander Energy PLC SMDR.L Christophor Jost p 282.60 27.6% -7.6% 21.2% 24.7%Saras SRS.MI Henry Morris € 1.69 13.4% -6.3% 20.3% 4.5%Schoeller-Bleckmann SBOE.VI Rudolf Dreyer € 64.50 22.9% 5.4% 15.5% 79.2%Serica Energy Plc SQZ.L Christophor Jost p 28.00 -29.6% -26.1% -44.3% -67.3%Soco International Plc SIA.L Christophor Jost p 377.50 16.9% 12.0% 8.4% -3.2%Statoil STL.OL Michele della Vigna, CFA Nkr 136.40 10.5% -7.0% 9.0% 6.5%Sterling Energy Plc SEY.L Christophor Jost p 45.75 -31.2% -34.9% -11.2% -60.6%TOTAL SA TOTF.PA Michele della Vigna, CFA € 39.20 -3.4% -10.5% 3.9% 4.3%Tower Resources Plc TOWR.L Christophor Jost p 5.78 40.0% -9.8% 42.6% 344.2%Tullow Oil Plc TLW.L Christophor Jost p 1305.00 4.3% -7.8% 10.4% 23.8%Tupras TUPRS.IS Henry Morris YTL 42.80 11.5% 6.7% 23.3% 45.1%Valiant Petroleum Plc VPP.L Christophor Jost p 538.00 -7.2% -16.6% -2.7% -16.3%
Average 11.1% -10.6% 2.5% 44.8%
FTSE World Europe (GBP) 388.58 1.3% -1.9% 5.8% 18.4%Index performance in stock price currency 388.58 1.3% -1.9% 5.8% 18.4%
Note: Prices as of most recent available close, which could vary from the price date indicated aboveThis table shows movement in absolute share price and not total shareholder return. Results presented should not and cannot be viewed as an indicator of future performance.
May 30, 2011 Europe: Energy: Oil & Gas - E&P
Goldman Sachs Global Investment Research 56
Financial Advisory disclosures
Goldman Sachs is acting as financial advisor to another party in an announced strategic transaction which may be material to
Tullow Oil Plc.

May 30, 2011 Europe: Energy: Oil & Gas - E&P
Goldman Sachs Global Investment Research 57
Reg AC
We, Christophor Jost and Ruth Brooker, hereby certify that all of the views expressed in this report accurately reflect our personal views about the subject company or companies and its or their
securities. We also certify that no part of our compensation was, is or will be, directly or indirectly, related to the specific recommendations or views expressed in this report.
Investment Profile
The Goldman Sachs Investment Profile provides investment context for a security by comparing key attributes of that security to its peer group and market. The four key attributes depicted are: growth,
returns, multiple and volatility. Growth, returns and multiple are indexed based on composites of several methodologies to determine the stocks percentile ranking within the region's coverage
universe.
The precise calculation of each metric may vary depending on the fiscal year, industry and region but the standard approach is as follows:
Growth is a composite of next year's estimate over current year's estimate, e.g. EPS, EBITDA, Revenue. Return is a year one prospective aggregate of various return on capital measures, e.g. CROCI,
ROACE, and ROE. Multiple is a composite of one-year forward valuation ratios, e.g. P/E, dividend yield, EV/FCF, EV/EBITDA, EV/DACF, Price/Book. Volatility is measured as trailing twelve-month
volatility adjusted for dividends.
Quantum
Quantum is Goldman Sachs' proprietary database providing access to detailed financial statement histories, forecasts and ratios. It can be used for in-depth analysis of a single company, or to make
comparisons between companies in different sectors and markets.
GS SUSTAIN
GS SUSTAIN is a global investment strategy aimed at long-term, long-only performance with a low turnover of ideas. The GS SUSTAIN focus list includes leaders our analysis shows to be well
positioned to deliver long term outperformance through sustained competitive advantage and superior returns on capital relative to their global industry peers. Leaders are identified based on
quantifiable analysis of three aspects of corporate performance: cash return on cash invested, industry positioning and management quality (the effectiveness of companies' management of the
environmental, social and governance issues facing their industry).
Disclosures
Coverage group(s) of stocks by primary analyst(s)
Compendium report: please see disclosures at http://www.gs.com/research/hedge.html. Disclosures applicable to the companies included in this compendium can be found in the latest relevant
published research.
Company-specific regulatory disclosures
Compendium report: please see disclosures at http://www.gs.com/research/hedge.html. Disclosures applicable to the companies included in this compendium can be found in the latest relevant
published research.
May 30, 2011 Europe: Energy: Oil & Gas - E&P
Goldman Sachs Global Investment Research 58
Distribution of ratings/investment banking relationships
Goldman Sachs Investment Research global coverage universe
Rating Distribution Investment Banking Relationships
Buy Hold Sell Buy Hold Sell
Global 32% 53% 15% 49% 41% 40%
As of April 1, 2011, Goldman Sachs Global Investment Research had investment ratings on 3,191 equity securities. Goldman Sachs assigns stocks as Buys and Sells on various regional Investment
Lists; stocks not so assigned are deemed Neutral. Such assignments equate to Buy, Hold and Sell for the purposes of the above disclosure required by NASD/NYSE rules. See 'Ratings, Coverage
groups and views and related definitions' below.
Price target and rating history chart(s)
Compendium report: please see disclosures at http://www.gs.com/research/hedge.html. Disclosures applicable to the companies included in this compendium can be found in the latest relevant
published research.
Regulatory disclosures
Disclosures required by United States laws and regulations
See company-specific regulatory disclosures above for any of the following disclosures required as to companies referred to in this report: manager or co-manager in a pending transaction; 1% or
other ownership; compensation for certain services; types of client relationships; managed/co-managed public offerings in prior periods; directorships; for equity securities, market making and/or
specialist role. Goldman Sachs usually makes a market in fixed income securities of issuers discussed in this report and usually deals as a principal in these securities.
The following are additional required disclosures: Ownership and material conflicts of interest: Goldman Sachs policy prohibits its analysts, professionals reporting to analysts and members of their
households from owning securities of any company in the analyst's area of coverage. Analyst compensation: Analysts are paid in part based on the profitability of Goldman Sachs, which includes
investment banking revenues. Analyst as officer or director: Goldman Sachs policy prohibits its analysts, persons reporting to analysts or members of their households from serving as an officer,
director, advisory board member or employee of any company in the analyst's area of coverage. Non-U.S. Analysts: Non-U.S. analysts may not be associated persons of Goldman Sachs & Co. and
therefore may not be subject to NASD Rule 2711/NYSE Rules 472 restrictions on communications with subject company, public appearances and trading securities held by the analysts.
Distribution of ratings: See the distribution of ratings disclosure above. Price chart: See the price chart, with changes of ratings and price targets in prior periods, above, or, if electronic format or if
with respect to multiple companies which are the subject of this report, on the Goldman Sachs website at http://www.gs.com/research/hedge.html.
Additional disclosures required under the laws and regulations of jurisdictions other than the United States
The following disclosures are those required by the jurisdiction indicated, except to the extent already made above pursuant to United States laws and regulations. Australia: This research, and any
access to it, is intended only for "wholesale clients" within the meaning of the Australian Corporations Act. Canada: Goldman Sachs & Co. has approved of, and agreed to take responsibility for, this
research in Canada if and to the extent it relates to equity securities of Canadian issuers. Analysts may conduct site visits but are prohibited from accepting payment or reimbursement by the company
of travel expenses for such visits. Hong Kong: Further information on the securities of covered companies referred to in this research may be obtained on request from Goldman Sachs (Asia) L.L.C.
India: Further information on the subject company or companies referred to in this research may be obtained from Goldman Sachs (India) Securities Private Limited; Japan: See below. Korea: Further
information on the subject company or companies referred to in this research may be obtained from Goldman Sachs (Asia) L.L.C., Seoul Branch. Russia: Research reports distributed in the Russian
Federation are not advertising as defined in the Russian legislation, but are information and analysis not having product promotion as their main purpose and do not provide appraisal within the
meaning of the Russian legislation on appraisal activity. Singapore: Further information on the covered companies referred to in this research may be obtained from Goldman Sachs (Singapore) Pte.
(Company Number: 198602165W). Taiwan: This material is for reference only and must not be reprinted without permission. Investors should carefully consider their own investment risk. Investment
results are the responsibility of the individual investor. United Kingdom: Persons who would be categorized as retail clients in the United Kingdom, as such term is defined in the rules of the Financial
Services Authority, should read this research in conjunction with prior Goldman Sachs research on the covered companies referred to herein and should refer to the risk warnings that have been sent
to them by Goldman Sachs International. A copy of these risks warnings, and a glossary of certain financial terms used in this report, are available from Goldman Sachs International on request.
Brazil: Disclosure information in relation to CVM Instruction 483 is available at http://www.gs.com/worldwide/brazil/gir/index.html. Where applicable, the Brazil-registered analyst primarily responsible
for the content of this research report, as defined in Article 16 of CVM Instruction 483, is the first author named at the beginning of this report, unless indicated otherwise at the end of the text.
European Union: Disclosure information in relation to Article 4 (1) (d) and Article 6 (2) of the European Commission Directive 2003/126/EC is available at
http://www.gs.com/client_services/global_investment_research/europeanpolicy.html which states the European Policy for Managing Conflicts of Interest in Connection with Investment Research.
Japan: Goldman Sachs Japan Co., Ltd. is a Financial Instrument Dealer under the Financial Instrument and Exchange Law, registered with the Kanto Financial Bureau (Registration No. 69), and is a
member of Japan Securities Dealers Association (JSDA) and Financial Futures Association of Japan (FFAJ). Sales and purchase of equities are subject to commission pre-determined with clients plus
consumption tax. See company-specific disclosures as to any applicable disclosures required by Japanese stock exchanges, the Japanese Securities Dealers Association or the Japanese Securities
Finance Company.
May 30, 2011 Europe: Energy: Oil & Gas - E&P
Goldman Sachs Global Investment Research 59
Ratings, coverage groups and views and related definitions
Buy (B), Neutral (N), Sell (S) -Analysts recommend stocks as Buys or Sells for inclusion on various regional Investment Lists. Being assigned a Buy or Sell on an Investment List is determined by a
stock's return potential relative to its coverage group as described below. Any stock not assigned as a Buy or a Sell on an Investment List is deemed Neutral. Each regional Investment Review
Committee manages various regional Investment Lists to a global guideline of 25%-35% of stocks as Buy and 10%-15% of stocks as Sell; however, the distribution of Buys and Sells in any particular
coverage group may vary as determined by the regional Investment Review Committee. Regional Conviction Buy and Sell lists represent investment recommendations focused on either the size of the
potential return or the likelihood of the realization of the return.
Return potential represents the price differential between the current share price and the price target expected during the time horizon associated with the price target. Price targets are required for
all covered stocks. The return potential, price target and associated time horizon are stated in each report adding or reiterating an Investment List membership.
Coverage groups and views: A list of all stocks in each coverage group is available by primary analyst, stock and coverage group at http://www.gs.com/research/hedge.html. The analyst assigns one
of the following coverage views which represents the analyst's investment outlook on the coverage group relative to the group's historical fundamentals and/or valuation. Attractive (A). The
investment outlook over the following 12 months is favorable relative to the coverage group's historical fundamentals and/or valuation. Neutral (N). The investment outlook over the following 12
months is neutral relative to the coverage group's historical fundamentals and/or valuation. Cautious (C). The investment outlook over the following 12 months is unfavorable relative to the coverage
group's historical fundamentals and/or valuation.
Not Rated (NR). The investment rating and target price have been removed pursuant to Goldman Sachs policy when Goldman Sachs is acting in an advisory capacity in a merger or strategic
transaction involving this company and in certain other circumstances. Rating Suspended (RS). Goldman Sachs Research has suspended the investment rating and price target for this stock, because
there is not a sufficient fundamental basis for determining, or there are legal, regulatory or policy constraints around publishing, an investment rating or target. The previous investment rating and
price target, if any, are no longer in effect for this stock and should not be relied upon. Coverage Suspended (CS). Goldman Sachs has suspended coverage of this company. Not Covered (NC). Goldman Sachs does not cover this company. Not Available or Not Applicable (NA). The information is not available for display or is not applicable. Not Meaningful (NM). The information is not
meaningful and is therefore excluded.
Global product; distributing entities
The Global Investment Research Division of Goldman Sachs produces and distributes research products for clients of Goldman Sachs, and pursuant to certain contractual arrangements, on a global
basis. Analysts based in Goldman Sachs offices around the world produce equity research on industries and companies, and research on macroeconomics, currencies, commodities and portfolio
strategy. This research is disseminated in Australia by Goldman Sachs & Partners Australia Pty Ltd (ABN 21 006 797 897) on behalf of Goldman Sachs; in Canada by Goldman Sachs & Co. regarding
Canadian equities and by Goldman Sachs & Co. (all other research); in Hong Kong by Goldman Sachs (Asia) L.L.C.; in India by Goldman Sachs (India) Securities Private Ltd.; in Japan by Goldman
Sachs Japan Co., Ltd.; in the Republic of Korea by Goldman Sachs (Asia) L.L.C., Seoul Branch; in New Zealand by Goldman Sachs & Partners New Zealand Limited on behalf of Goldman Sachs; in
Russia by OOO Goldman Sachs; in Singapore by Goldman Sachs (Singapore) Pte. (Company Number: 198602165W); and in the United States of America by Goldman Sachs & Co. Goldman Sachs
International has approved this research in connection with its distribution in the United Kingdom and European Union.
European Union: Goldman Sachs International, authorized and regulated by the Financial Services Authority, has approved this research in connection with its distribution in the European Union and
United Kingdom; Goldman Sachs & Co. oHG, regulated by the Bundesanstalt für Finanzdienstleistungsaufsicht, may also distribute research in Germany.
General disclosures
This research is for our clients only. Other than disclosures relating to Goldman Sachs, this research is based on current public information that we consider reliable, but we do not represent it is
accurate or complete, and it should not be relied on as such. We seek to update our research as appropriate, but various regulations may prevent us from doing so. Other than certain industry reports
published on a periodic basis, the large majority of reports are published at irregular intervals as appropriate in the analyst's judgment.
Goldman Sachs conducts a global full-service, integrated investment banking, investment management, and brokerage business. We have investment banking and other business relationships with a
substantial percentage of the companies covered by our Global Investment Research Division. Goldman Sachs & Co., the United States broker dealer, is a member of SIPC (http://www.sipc.org).
Our salespeople, traders, and other professionals may provide oral or written market commentary or trading strategies to our clients and our proprietary trading desks that reflect opinions that are
contrary to the opinions expressed in this research. Our asset management area, our proprietary trading desks and investing businesses may make investment decisions that are inconsistent with the
recommendations or views expressed in this research.
We and our affiliates, officers, directors, and employees, excluding equity and credit analysts, will from time to time have long or short positions in, act as principal in, and buy or sell, the securities or
derivatives, if any, referred to in this research.
This research is not an offer to sell or the solicitation of an offer to buy any security in any jurisdiction where such an offer or solicitation would be illegal. It does not constitute a personal
recommendation or take into account the particular investment objectives, financial situations, or needs of individual clients. Clients should consider whether any advice or recommendation in this
research is suitable for their particular circumstances and, if appropriate, seek professional advice, including tax advice. The price and value of investments referred to in this research and the income
from them may fluctuate. Past performance is not a guide to future performance, future returns are not guaranteed, and a loss of original capital may occur. Fluctuations in exchange rates could have
adverse effects on the value or price of, or income derived from, certain investments.
Certain transactions, including those involving futures, options, and other derivatives, give rise to substantial risk and are not suitable for all investors. Investors should review current options
disclosure documents which are available from Goldman Sachs sales representatives or at http://www.theocc.com/about/publications/character-risks.jsp. Transactions cost may be significant in option
strategies calling for multiple purchase and sales of options such as spreads. Supporting documentation will be supplied upon request.
May 30, 2011 Europe: Energy: Oil & Gas - E&P
Goldman Sachs Global Investment Research 60
All research reports are disseminated and available to all clients simultaneously through electronic publication to our internal client websites. Not all research content is redistributed to our clients or
available to third-party aggregators, nor is Goldman Sachs responsible for the redistribution of our research by third party aggregators. For all research available on a particular stock, please contact
your sales representative or go to http://360.gs.com.
Disclosure information is also available at http://www.gs.com/research/hedge.html or from Research Compliance, 200 West Street, New York, NY 10282.
Copyright 2011 Goldman Sachs.
No part of this material may be (i) copied, photocopied or duplicated in any form by any means or (ii) redistributed without the prior written consent of The Goldman Sachs Group, Inc.