eurochem group international accounting standard … · 2018-05-15 · consolidated interim...
TRANSCRIPT

EUROCHEM GROUP INTERNATIONAL ACCOUNTING STANDARD No. 34 CONSOLIDATED CONDENSED INTERIM (THREE MONTHS) FINANCIAL INFORMATION AND REVIEW REPORT 31 MARCH 2018
Contents Independent Auditor’s Report on the Review of the Consolidated Condensed Interim Financial Information as of and for the three months ended 31 March 2018 Consolidated Interim Statement of Financial Position as at 31 March 2018 ................................................ 1 Consolidated Interim Statement of Profit or Loss and Other Comprehensive Income for the three months ended 31 March 2018 .................................................................................................. 2 Consolidated Interim Statement of Cash Flows for the three months ended 31 March 2018 ...................... 3 Consolidated Interim Statement of Changes in Equity for the three months ended 31 March 2018 ............ 4 Notes to the Consolidated Condensed Interim Financial Information 1 The EuroСhem Group and its operations ........................................................................................... 5 2 Basis of preparation, significant accounting policies and adoption of new or revised standards ....... 5 3 New or revised standards and interpretations .................................................................................... 6 4 Fair value of financial instruments ...................................................................................................... 7 5 Segment information ........................................................................................................................... 9 6 Property, plant and equipment .......................................................................................................... 11 7 Investment in associates and joint ventures ..................................................................................... 12 8 Inventories ......................................................................................................................................... 14 9 Trade receivables, prepayments, other receivables and other current assets ................................. 14 10 Originated loans ................................................................................................................................ 15 11 Cash and cash equivalents, fixed-term deposits and restricted cash ............................................... 15 12 Bank borrowings and other loans received ....................................................................................... 16 13 Project finance .................................................................................................................................. 18 14 Bonds issued ..................................................................................................................................... 19 15 Derivative financial assets and liabilities ........................................................................................... 20 16 Sales ................................................................................................................................................. 22 17 Cost of sales ..................................................................................................................................... 22 18 Distribution costs ............................................................................................................................... 23 19 General and administrative expenses ............................................................................................... 23 20 Other operating income and expenses ............................................................................................. 23 21 Other financial gain and loss ............................................................................................................. 24 22 Income tax ......................................................................................................................................... 24 23 Earnings per share ............................................................................................................................ 24 24 Balances and transactions with related parties................................................................................. 25 25 Contingencies, commitments and operating risks ............................................................................ 26

EuroChem Group AG Zug
Review Report to the Board of Directors on the consolidated condensed interim financial information as of and for the three months period ended 31 March 2018

PricewaterhouseCoopers AG, Grafenauweg 8, Postfach, CH-6302 Zug, Switzerland Telefon: +41 58 792 68 00, Telefax: +41 58 792 68 10, www.pwc.ch
PricewaterhouseCoopers AG is a member of the global PricewaterhouseCoopers network of firms, each of which is a separate and independent legal entity.
Report on the Review of consolidated condensed interim financial information to the Board of Directors of EuroChem Group AG Zug
Introduction We have reviewed the accompanying consolidated condensed interim financial information (statement of financial position, statement of profit or loss and other comprehensive income, statement of cash flows, statement of changes in equity and notes) of EuroChem Group AG as of and for the three months period ended 31 March 2018. The Board of Directors is responsible for the preparation and presentation of this consolidated condensed interim financial information in accordance with International Accounting Standard 34 “Interim Financial Reporting”. Our responsibility is to express a conclusion on this consoli-dated condensed interim financial information based on our review.
Scope of Review We conducted our review in accordance with International Standard on Review Engagements 2410, “Re-view of interim financial information performed by the independent auditor of the entity”. A review of in-terim financial information consists of making inquiries, primarily of persons responsible for financial and accounting matters, and applying analytical and other review procedures. A review is substantially less in scope than an audit conducted in accordance with International Standards on Auditing and conse-quently does not enable us to obtain assurance that we would become aware of all significant matters that might be identified in an audit. Accordingly, we do not express an audit opinion.
Conclusion Based on our review, nothing has come to our attention that causes us to believe that the accompanying consolidated condensed interim financial information have not been prepared, in all material respects, in accordance with International Accounting Standard 34 “Interim Financial Reporting”.
PricewaterhouseCoopers AG
Joanne Burgener Audit Expert Auditor in charge
Christopher Vohrer Audit Expert
Zug, 15 May 2018
Enclosure: Consolidated condensed interim financial information (statement of financial position, statement of profit or loss and other comprehensive income, statement of cash flows, statement of changes in equity and notes) as of and for the three months period ended 31 March 2018.

EuroСhem Group Consolidated Interim Statement of Financial Position as at 31 March 2018 (all amounts are presented in thousands of US dollars, unless otherwise stated)
The accompanying notes on pages 5 to 27 are an integral part of this consolidated condensed interim financial information.
1
Note
31 March 2018
31 December 2017, adjusted
1 January 2017, adjusted
ASSETS Non-current assets:
Property, plant and equipment 6 7,234,843 6,918,004 5,297,313 Mineral rights 379,603 372,809 455,488 Goodwill 526,977 516,830 468,223 Intangible assets 137,132 142,924 163,625 Investment in associates and joint ventures 7 39,237 43,152 36,500 Originated loans 10 6,786 51,046 53,178 Restricted cash 11 25,181 22,345 18,170 Derivative financial assets 15 21,347 7,189 - Deferred income tax assets 62,781 55,360 112,517 Other non-current assets 61,538 52,199 83,690 Total non-current assets 8,495,425 8,181,858 6,688,704
Current assets: Inventories 8 856,240 781,622 713,919 Trade receivables 9 356,312 288,959 267,786 Prepayments, other receivables and other current assets 9 308,221 326,637 315,185 Income tax receivable 27,300 58,999 32,133 Originated loans 10 - - 412 Derivative financial assets 15 21,334 18,955 13,602 Restricted cash 11 17,591 20,101 45,994 Fixed-term deposits 11 151 151 294 Cash and cash equivalents 11 286,553 228,613 285,605 Total current assets 1,873,702 1,724,037 1,674,930
TOTAL ASSETS 10,369,127 9,905,895 8,363,634
LIABILITIES AND EQUITY Equity attributable to owners of the parent: Share capital 111 111 111 Cumulative currency translation differences (1,264,956) (1,347,833) (1,749,745) Retained earnings and other reserves 5,637,934 5,442,999 4,993,073 4,373,089 4,095,277 3,243,439
Non-controlling interests 166 165 1,371 Total equity 4,373,255 4,095,442 3,244,810
Non-current liabilities: Bank borrowings and other loans received 12 1,180,040 1,110,205 1,305,671 Project finance 13 1,007,994 959,373 573,022 Bonds issued 14 1,516,310 1,512,413 824,848 Derivative financial liabilities 15 - - 75,209 Deferred income tax liabilities 237,968 231,259 214,290 Other non-current liabilities and deferred income 197,589 192,401 166,456 Total non-current liabilities 4,139,901 4,005,651 3,159,496
Current liabilities: Bank borrowings and other loans received 12 764,867 770,405 1,075,418 Project finance 13 33,328 - - Bonds issued 14 87,613 87,091 323,856 Derivative financial liabilities 15 62,726 61,821 703 Trade payables 508,544 513,004 284,549 Other accounts payable and accrued expenses 349,871 334,519 221,396 Income tax payable 15,096 10,909 18,912 Other taxes payable 33,926 27,053 34,494 Total current liabilities 1,855,971 1,804,802 1,959,328
Total liabilities 5,995,872 5,810,453 5,118,824
TOTAL LIABILITIES AND EQUITY 10,369,127 9,905,895 8,363,634

EuroСhem Group Consolidated Interim Statement of Profit or Loss and Other Comprehensive Income for the three months ended 31 March 2018 (all amounts are presented in thousands of US dollars, unless otherwise stated)
The accompanying notes on pages 5 to 27 are an integral part of this consolidated condensed interim financial information.
2
Three months ended
Note 31 March 2018 31 March 2017
Sales 16 1,356,869 1,336,463 Cost of sales 17 (860,699) (807,074) Gross profit 496,170 529,389
Distribution costs 18 (181,573) (180,563) General and administrative expenses 19 (56,499) (50,725) Other operating income/(expenses), net 20 (2,769) (18,760) Operating profit 255,329 279,341 Share of profit/(loss) from associates and joint ventures, net 401 (995) Interest income 2,114 3,478 Interest expense (33,440) (33,142) Financial foreign exchange gain/(loss), net (15,692) 50,185 Other financial gain/(loss), net 21 25,214 11,184 Profit before taxation 233,926 310,051
Income tax expense 22 (38,996) (102,790) Profit 194,930 207,261
Other comprehensive income/(loss) that may be reclassified to profit or loss in subsequent periods Currency translation differences 81,865 423,402 Share of other comprehensive income/(loss) of associates and joint ventures, net 7 1,018 (1,564) Total other comprehensive income that may be reclassified to profit or loss in subsequent periods 82,883 421,838
Total comprehensive income 277,813 629,099
Profit/(loss) attributable to: Owners of the parent 194,935 207,328 Non-controlling interests (5) (67) 194,930 207,261 Total comprehensive income/(loss) attributable to: Owners of the parent 277,812 629,056 Non-controlling interests 1 43 277,813 629,099
Earnings per share – basic and diluted 23 194.94 207.33
EuroСhem Group Consolidated Interim Statement of Cash Flows for the three months ended 31 March 2018 (all amounts are presented in thousands of US dollars, unless otherwise stated)
The accompanying notes on pages 5 to 27 are an integral part of this consolidated condensed interim financial information.
3
Three months ended
Note 31 March 2018 31 March 2017
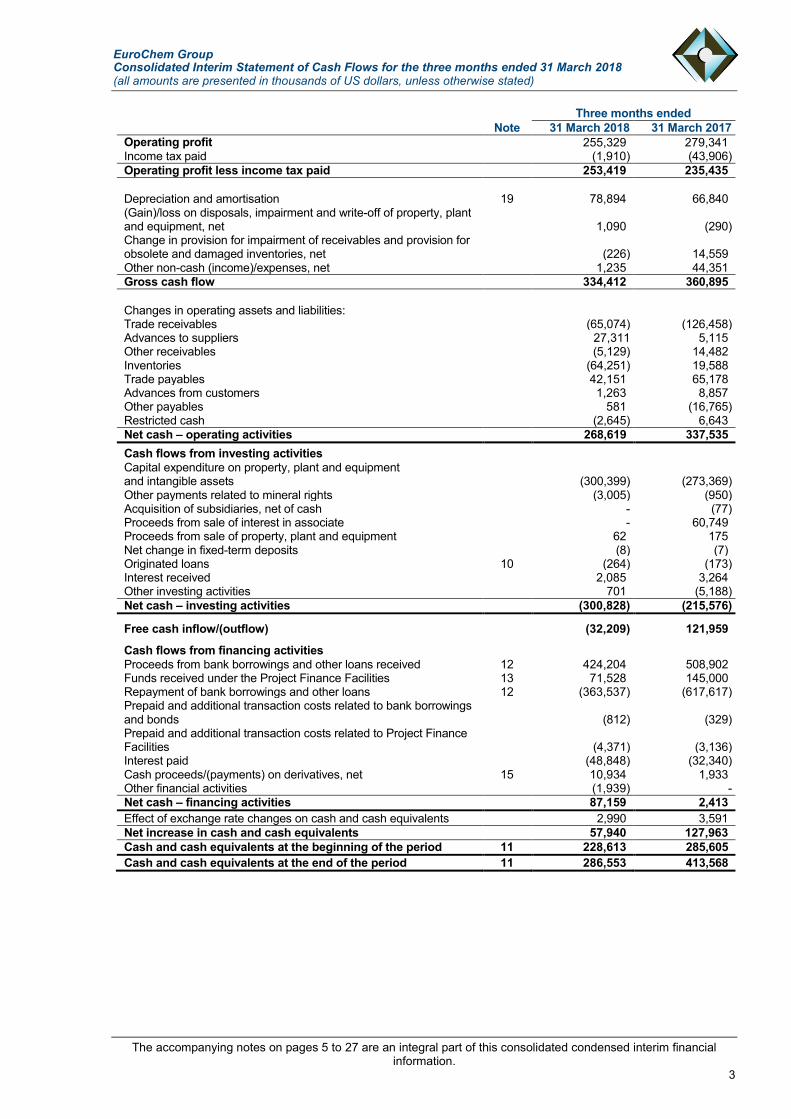
Operating profit 255,329 279,341 Income tax paid (1,910) (43,906) Operating profit less income tax paid 253,419 235,435 Depreciation and amortisation 19 78,894 66,840 (Gain)/loss on disposals, impairment and write-off of property, plant and equipment, net 1,090 (290) Change in provision for impairment of receivables and provision for obsolete and damaged inventories, net (226) 14,559 Other non-cash (income)/expenses, net 1,235 44,351 Gross cash flow 334,412 360,895 Changes in operating assets and liabilities: Trade receivables (65,074) (126,458) Advances to suppliers 27,311 5,115 Other receivables (5,129) 14,482 Inventories (64,251) 19,588 Trade payables 42,151 65,178 Advances from customers 1,263 8,857 Other payables 581 (16,765) Restricted cash (2,645) 6,643 Net cash – operating activities 268,619 337,535
Cash flows from investing activities Capital expenditure on property, plant and equipment and intangible assets (300,399) (273,369) Other payments related to mineral rights (3,005) (950) Acquisition of subsidiaries, net of cash - (77) Proceeds from sale of interest in associate - 60,749 Proceeds from sale of property, plant and equipment 62 175 Net change in fixed-term deposits (8) (7) Originated loans 10 (264) (173) Interest received 2,085 3,264 Other investing activities 701 (5,188) Net cash – investing activities (300,828) (215,576)
Free cash inflow/(outflow) (32,209) 121,959
Cash flows from financing activities Proceeds from bank borrowings and other loans received 12 424,204 508,902 Funds received under the Project Finance Facilities 13 71,528 145,000 Repayment of bank borrowings and other loans 12 (363,537) (617,617) Prepaid and additional transaction costs related to bank borrowings and bonds (812) (329) Prepaid and additional transaction costs related to Project Finance Facilities (4,371) (3,136) Interest paid (48,848) (32,340) Cash proceeds/(payments) on derivatives, net 15 10,934 1,933 Other financial activities (1,939) - Net cash – financing activities 87,159 2,413
Effect of exchange rate changes on cash and cash equivalents 2,990 3,591 Net increase in cash and cash equivalents 57,940 127,963
Cash and cash equivalents at the beginning of the period 11 228,613 285,605
Cash and cash equivalents at the end of the period 11 286,553 413,568

EuroСhem Group Consolidated Interim Statement of Changes in Equity for the three months ended 31 March 2018 (all amounts are presented in thousands of US dollars, unless otherwise stated)
The accompanying notes on pages 5 to 27 are an integral part of this consolidated condensed interim financial information.
4
Attributable to owners of the parent
Non-controlling
interests Total
equity Share
capital
Cumulative currency
translation differences
Retained earnings
and other reserves Total
Balance at 31 December 2016 as previously reported 111 (1,749,745) 4,966,855 3,217,221 1,371 3,218,592
Adjustment due to change in accounting policyfor transportation expenses (Note 2) - - 26,218 26,218 - 26,218 Balance at 1 January 2017, adjusted 111 (1,749,745) 4,993,073 3,243,439 1,371 3,244,810
Comprehensive income/(loss) Profit/(loss) - - 207,328 207,328 (67) 207,261 Other comprehensive income/(loss) Currency translation differences - 423,292 - 423,292 110 423,402 Share of other comprehensive income/(loss) of associate and joint ventures, net - (1,564) - (1,564) - (1,564) Total other comprehensive income - 421,728 - 421,728 110 421,838 Total comprehensive income - 421,728 207,328 629,056 43 629,099
Balance at 31 March 2017 111 (1,328,017) 5,200,401 3,872,495 1,414 3,873,909
Balance at 31 December 2017 as previously reported 111 (1,347,833) 5,419,931 4,072,209 165 4,072,374 Adjustment due to change in accounting policy for transportation expenses (Note 2) - - 26,218 26,218 - 26,218
Adjustment due to adoption of IFRS 9 (Note 2) - - (3,150) (3,150) - (3,150) Balance at 1 January 2018, adjusted 111 (1,347,833) 5,442,999 4,095,277 165 4,095,442
Comprehensive income/(loss) Profit/(loss) - - 194,935 194,935 (5) 194,930
Other comprehensive income/(loss) Currency translation differences - 81,859 - 81,859 6 81,865
Share of other comprehensive income/(loss) of associate and joint ventures, net - 1,018 - 1,018 - 1,018
Total other comprehensive income - 82,877 - 82,877 6 82,883 Total comprehensive income - 82,877 194,935 277,812 1 277,813 Balance at 31 March 2018 111 (1,264,956) 5,637,934 4,373,089 166 4,373,255
EuroСhem Group Notes to the Consolidated Condensed Interim Financial Information for the three months ended 31 March 2018 (all amounts are presented in thousands of US dollars, unless otherwise stated)
5
1 The EuroСhem Group and its operations
The EuroСhem Group comprises the parent entity, EuroСhem Group AG (the “Company”) and its subsidiaries (collectively the “Group” or “EuroChem Group”). The Company was incorporated under the laws of Switzerland on 16 July 2014 and has its registered office at: Baarerstrasse, 37, 6300, Zug, Switzerland.
A company that holds business interests beneficially for Mr. Andrey Melnichenko indirectly owns 100% of AIM Capital SE, registered in the Republic of Cyprus (31 December 2017: 100%), which in turn owns 90% (31 December 2017: 90%) of the share capital of EuroСhem Group AG, the remaining 10% of the Company were held indirectly by Mr. Dmitry Strezhnev (31 December 2017: 10%)
The Group’s principal activity is the production of mineral fertilizers (nitrogen- and phosphate-based) as well as mineral extraction (apatite, phosphate rock, iron-ore and baddeleyite), and the operation of a distribution network. The Group is developing potassium salts deposits and recently began producing potassium fertilizers. The Group’s main production facilities are located in Russia, Lithuania, Belgium, Kazakhstan and China (the joint venture’s production facilities). The Group’s distribution assets are located globally across Europe, Russia, North and Latin America, Central and South East Asia.
2 Basis of preparation, significant accounting policies and adoption of new or revised standards
Basis of presentation. This consolidated condensed interim financial information for the three months ended 31 March 2018 has been prepared in accordance with IAS 34, “Interim Financial Reporting”; it supplements the annual consolidated financial statements for the year ended 31 December 2017 prepared in accordance with International Financial Reporting Standards.
The principal accounting policies and significant judgments and estimates applied therein are consistent with those of the consolidated financial statements for the year ended 31 December 2017, except for the changes in accounting policies and the adoption of new and amended standards that became effective on 1 January 2018 as described below.
Accounting policy. Effective 1 January 2018, the Group applies changes in accounting policy for transportation expenses which are to be capitalised as a part of inventory until the moment of sale. This change in approach is driven by the global expansion of the Group’s distribution network and the increasing share of sales to the final end users of its products. The impact of the change on the Group’s consolidated financial statements is disclosed below.
Adoption of new and amended standards. The Group adopted the following new and amended standards effective 1 January 2018:
IFRS 9, Financial Instruments. The standard requires the financial assets to be classified in the following measurement categories: those to be measured subsequently at amortised cost, those to be measured at fair value through profit or loss, and those to be measured at fair value through other comprehensive income. The initial application of the standard did not result in any reclassifications of the Group’s financial instruments or any material changes in their measurement, therefore, the opening retained earnings were not adjusted. The standard also introduces expected credit losses impairment model, which means that anticipated as opposed to incurred credit losses will be recognised resulting in earlier recognition of impairment. The Group used an exemption in IFRS 9 allowing not to restate prior periods presented as a result of adoption of the new measurement requirements, but rather recognise any differences in the retained earnings as at 1 January 2018. The impact of the initial recognition of the model on the Group’s consolidated financial statements is disclosed below;
IFRS 15, Revenue from Contracts with Customers. The standard outlines the principles an entity must apply to measure and recognise revenue and the related cash flows. As the majority of the Group’s revenue is derived from arrangements in which the transfer of control coincides with the fulfilment of the performance obligations, the changes in respect of the timing and amount of revenue recognised do not have a material impact on the Group’s consolidated financial statements.

EuroСhem Group Notes to the Consolidated Condensed Interim Financial Information for the three months ended 31 March 2018 (all amounts are presented in thousands of US dollars, unless otherwise stated)
6
2 Basis of preparation, significant accounting policies and adoption of new or revised standards (continued)
At 1 January 2017, the effect of changes in accounting policy was as follows:
Balance at 31 December 2016, as previously
reported Adjustment, accounting
policy Balance at 1 January
2017, adjusted
Inventories/finished goods 678,754 35,165 713,919 Deferred income tax assets 121,464 (8,947) 112,517 Retained earnings and other reserves 4,966,855 26,218 4,993,073
At 1 January 2018, the effect of changes in accounting policy and adoption of the new standard was as follows:
Balance at 31 December 2017, as previously
reported
Adjustment, accounting
policy Adjustment,
IFRS 9
Balance at 1 January 2018,
adjusted
Trade receivables/ provision for impairment 293,101 - (4,142) 288,959
Inventories 746,457 35,165 - 781,622
Deferred income tax assets 63,315 (8,947) 992 55,360
Retained earnings and other reserves 5,419,931 26,218 (3,150) 5,442,999
The adjusted consolidated interim statement of financial position as of 1 January 2017 is presented in this consolidated condensed interim financial information as a result of the above changes.
At 31 March 2018, the official exchange rates were: US$ 1 = RUB 57.2649, US$ 1 = EUR 0.8116 (31 December 2017: US$ 1 = RUB 57.6002, US$ 1 = EUR 0.8364). Average rates for the three months ended 31 March 2018 were: US$ 1 = RUB 56.8803, US$ 1 = EUR 0.8141 (three months ended 31 March 2017: US$ 1 = RUB 58.8366, US$ 1 = EUR 0.9392).
3 New or revised standards and interpretations
Other new amendments and improvements to standards set out below became effective 1 January 2018 and did not have any impact or did not have a material impact on the Group’s consolidated financial statements:
Amendments to IFRS 10 and IAS 28 regarding the sale or contribution of assets between an investor and its associate or joint venture;
Amendments to IFRS 2, Share-based Payment;
Amendments to IFRS 4, Applying IFRS 9 Financial instruments with IFRS 4, Insurance contracts;
Annual Improvements to IFRSs 2014-2016 cycle – amendments to IFRS 1 and IAS 28;
IFRIC 22, Foreign Currency Transactions and Advance Consideration;
Amendments to IAS 40, Transfers of Investment property.
A number of new standards, amendments to standards and interpretations are not yet effective as at 31 March 2018, and have not been early adopted by the Group:
IFRS 16, Leases. The Group is currently assessing the impact of the standard on its consolidated financial statements;
IFRS 17, Insurance contracts;
IFRIC 23, Uncertainty over Income Tax Treatments;
Amendments to IFRS 9, Prepayment Features with Negative Compensation;
Amendments to IAS 28, Long-term Interests in Associates and Joint Ventures;

EuroСhem Group Notes to the Consolidated Condensed Interim Financial Information for the three months ended 31 March 2018 (all amounts are presented in thousands of US dollars, unless otherwise stated)
7
3 New or revised standards and interpretations (continued)
Annual improvements to IFRSs 2015-2017 cycle;
Amendments to IAS 19, Plan Amendment, Curtailment or Settlement.
Unless otherwise described above, the new standards, amendments to standards and interpretations are expected to have no impact or to have a non-material impact on the Group’s consolidated financial statements.
4 Fair value of financial instruments
Financial instruments measured subsequently at fair value. The fair values of derivative financial instruments carried at fair value through profit or loss, which typically include foreign exchange forward contracts, cross currency interest rate swaps, commodity swaps etc., are based on recurring mark-to-market valuations provided by the financial institutions which deal in these financial instruments. The fair value of derivative financial assets and liabilities were included in level 2 of the fair value hierarchy.
Financial liabilities measured subsequently at amortised cost. The fair value of loans and borrowings, project finance and issued bonds at 31 March 2018 and 31 December 2017 are disclosed in Notes 12, 13 and 14. The fair value of other financial liabilities carried at amortised cost approximates their carrying values.
The Group’s financial assets and liabilities were as follows:
31 March
2018 31 December
2017
Financial assets
Non-current financial assets
Restricted cash 25,181 22,345 Originated loans 6,786 51,046 Derivative financial assets 21,347 7,189 Other non-current assets including:
Long-term other receivables 2,514 2,514 Interest receivable - 698 Other asset 8,328 -
Total non-current financial assets 64,156 83,792
Current financial assets
Restricted cash 17,591 20,101 Trade receivables 356,312 288,959 Derivative financial assets 21,334 18,955 Other receivables and other current assets including:
Other receivables 4,209 3,316 Collateral held by banks to secure derivative transactions 644 672 Interest receivable 322 272
Fixed-term deposits 151 151 Cash and cash equivalents 286,553 228,613 Total current financial assets 687,116 561,039
Total financial assets 751,272 644,831

EuroСhem Group Notes to the Consolidated Condensed Interim Financial Information for the three months ended 31 March 2018 (all amounts are presented in thousands of US dollars, unless otherwise stated)
8
4 Fair value of financial instruments (continued)
31 March
2018 31 December
2017
Financial liabilities
Non-current financial liabilities Bank borrowings and other loans received 1,180,040 1,110,205
Bonds issued 1,516,310 1,512,413 Project finance 1,007,994 959,373 Other non-current liabilities including:
Contingent liability related to business combination 128,250 123,001 Long-term portion of deferred payables related to acquisition of additional interest in subsidiary 1,500 3,000 Long-term portion of deferred payables related to mineral rights acquisition 11,930 11,785
Total non-current financial liabilities 3,846,024 3,719,777
Current financial liabilities Bank borrowings and other loans received 764,867 770,405
Project finance 33,328 - Bonds issued 87,613 87,091 Derivative financial liabilities 62,726 61,821 Trade payables 508,544 513,004 Other accounts payable and accrued expenses including:
Interest payable 43,470 29,604 Payable for acquisition of associate 3,313 3,229 Short-term portion of deferred payables related to business combinations and acquisition of additional interest in subsidiary 4,697 4,697 Short-term portion of deferred payables related to mineral rights acquisition 1,885 1,875
Total current financial liabilities 1,510,443 1,471,726
Total financial liabilities 5,356,467 5,191,503
As required by the amendment of IAS 7 the Group presents the reconciliation of movements in liabilities arising from financing activities:
Bank borrowings
and other loans
received Bonds issued
Project finance
Interest payable Total
Balance at 1 January 2018 1,880,610 1,599,504 959,373 29,604 4,469,091
Cash flows Proceeds from bank borrowings and other
loans received 424,204 - - - 424,204
Funds received under the Project Finance Facilities - - 71,528 - 71,528
Repayment of bank borrowings and other loans (363,537) - - - (363,537)
Prepaid and additional transaction costs (790) (22) (4,371) - (5,183)
Interest paid - - - (48,848) (48,848)
Non-cash flows
Interest expenses accrued - - - 62,708 62,708
Amortisation of transaction costs 771 912 4,716 - 6,399
Financial foreign exchange gain/(loss), net 3,302 (3,011) 4,911 134 5,336
Currency translation difference, net 347 6,540 5,165 (128) 11,924
Balance at 31 March 2018 1,944,907 1,603,923 1,041,322 43,470 4,633,622

EuroСhem Group Notes to the Consolidated Condensed Interim Financial Information for the three months ended 31 March 2018 (all amounts are presented in thousands of US dollars, unless otherwise stated)
9
5 Segment information
The Group has a vertically integrated business model conducted by four operating divisions, representing reportable segments, which are Mining, Fertilizers, Logistics and Sales:
Mining division encompasses the extraction of ores to obtain apatite, baddeleyite and iron-ore concentrates, phosphorite; with a recent start of the potash production at the Verkhnekamskoe deposit and the development of the second potassium salts deposit (potash) at the Gremyachinskoe deposit;
Fertilizers division includes the production of mineral fertilizers (nitrogen, phosphate and complex) and industrial products;
Logistics division covers all supply chain operations including transportation services, purchase and delivery of raw materials and finished goods, as well as freight forwarding and other logistics services;
Sales division is responsible for the sale of the complete range of products produced by the Group as well as third-party products through the Group’s global distribution network spanning across Europe, Russia, North and Latin America, Central and South East Asia;
Effective 1 January 2018, Oil & Gas division was removed from the Group’s corporate structure, reflecting its focus on its core fertilizer business. The operating results of this division for the three months ended 31 March 2017 include results of the company that was engaged in production of hydrocarbons and sold in the end of 2017.
Activities not assigned to a particular division are reported in “Other”. These include certain service activities, central management and other items. Аll intersegment transactions and unrealised profit in inventory from intragroup sales are eliminated through “Elimination”.
The review of financial reports of the Group, evaluation of the operating results and allocation of resources between the operating divisions are performed by the Management Board (considered to be the chief operating decision maker in the Group). The development and approval of strategies, market and risk analysis, investment focus, technological process changes are undertaken mostly in accordance with the operating divisions. Budgets and financial reports are prepared in a standard format according to the IFRS accounting policy adopted by the Group. Sales between divisions are carried out on an arm’s length basis.
The Management Board assesses the performance of the operating divisions based on, among other factors, a measure of EBITDA (profit before taxation adjusted by interest expense, depreciation and amortisation, financial foreign exchange gain or loss, other non-cash and one-off items, excluding profit attributed to non-controlling interests), allocated by division according to internal rules. Since the EBITDA term is not a standard IFRS measure, EuroChem Group’s definition of EBITDA may differ from that of other companies.
The division results for the three months ended 31 March 2018 were:
External sales Internal sales Total sales EBITDA
Mining 4,506 146,818 151,324 56,577 Fertilizers 12,974 837,597 850,571 213,338 Logistics 13,462 49,607 63,069 26,664 Sales 1,325,530 2,875 1,328,405 64,140 Other 397 3,292 3,689 (16,230) Elimination - (1,040,189) (1,040,189) (6,632) Total 1,356,869 - 1,356,869 337,857

EuroСhem Group Notes to the Consolidated Condensed Interim Financial Information for the three months ended 31 March 2018 (all amounts are presented in thousands of US dollars, unless otherwise stated)
10
5 Segment information (continued)
The division results for the three months ended 31 March 2017 were: External sales Internal sales Total sales EBITDA
Mining 2,827 186,014 188,841 101,087 Oil&Gas 8,115 13,189 21,304 3,631 Fertilizers 13,913 718,775 732,688 182,146 Logistics 11,115 45,778 56,893 23,606 Sales 1,299,323 3,560 1,302,883 44,759 Other 1,170 17,375 18,545 (15,381) Elimination - (984,691) (984,691) 9,401 Total 1,336,463 - 1,336,463 349,249
A reconciliation of EBITDA to profit before taxation is provided below: Three months ended
Note 31 March 2018 31 March 2017
EBITDA 337,857 349,249
Depreciation and amortisation 19 (78,894) (66,840) (Impairment)/reversal of impairment/(write-off) of idle property, plant and equipment 17,20 (160) 694 Non-recurring income/(expenses), net 20 (954) (1,212) Interest expense (33,440) (33,142) Financial foreign exchange gain/(loss), net (15,692) 50,185 Other financial gain/(loss), net 21 25,214 11,184 Non-controlling interests (5) (67) Profit before taxation 233,926 310,051
The main Group’s manufacturing facilities are based in Russia, Lithuania, Belgium, Kazakhstan and China (joint venture’s production facilities).
The analysis of Group sales by region was: Three months ended
31 March 2018 31 March 2017 Europe 470,072 472,099 Russia 269,807 258,263 Latin America 196,413 163,407 North America 174,252 189,556 Asia Pacific 136,886 134,344 CIS* 84,209 84,468 Africa 25,230 34,326 Total sales 1,356,869 1,336,463
* including associate states
The sales are allocated to regions based on the destination country. During the three months ended 31 March 2018, the Group had sales in excess of 10% to Russia and the United States of America, representing 19.9% and 12.0% of total revenues, respectively (three months ended 31 March 2017: sales to Russia and the United States of America, representing 19.3% and 13.5% of the total revenues, respectively).
During the three months ended 31 March 2018 and 31 March 2017, there were no sales in excess of 10% to one customer.

EuroСhem Group Notes to the Consolidated Condensed Interim Financial Information for the three months ended 31 March 2018 (all amounts are presented in thousands of US dollars, unless otherwise stated)
11
6 Property, plant and equipment
Movements in the carrying amount of property, plant and equipment were:
Note 2018 2017
Carrying amount at 1 January 6,918,004 5,297,313 Including advances given to construction companies and suppliers of property, plant and equipment 435,692 549,481
Additions 343,547 309,779 Including changes in advances given (6,646) (21,378) Additions through business combination - 1,322 Disposals (992) (579) Depreciation charge for the period (81,617) (66,494) (Impairment)/reversal of impairment/(write-off) of idle property, plant and equipment 17, 20 (160) 694 Currency translation differences 56,061 391,064 Carrying amount at 31 March 7,234,843 5,933,099
Including advances given to construction companies and suppliers of property, plant and equipment 431,796 570,773
Borrowing costs capitalised
During the three months ended 31 March 2018, borrowing costs totalling US$ 35,667 thousand were capitalised in property, plant and equipment at an average interest rate of 5.53% p.a. (three months ended 31 March 2017: US$ 19,108 thousand capitalised at an average interest rate of 4.58% p.a.).
Payables to suppliers of property, plant and equipment and construction companies
As at 31 March 2018, trade payables included payables to suppliers of property, plant and equipment and construction companies amounting to US$ 121,085 thousand (31 December 2017: US$ 174,748 thousand), including payables with irrevocable documentary letter of credit opened in the amount of US$ 35,555 thousand (31 December 2017: US$ 38,083 thousand) with a deferred term of payment under the contract with a construction company.
EuroСhem Group Notes to the Consolidated Condensed Interim Financial Information for the three months ended 31 March 2018 (all amounts are presented in thousands of US dollars, unless otherwise stated)
12
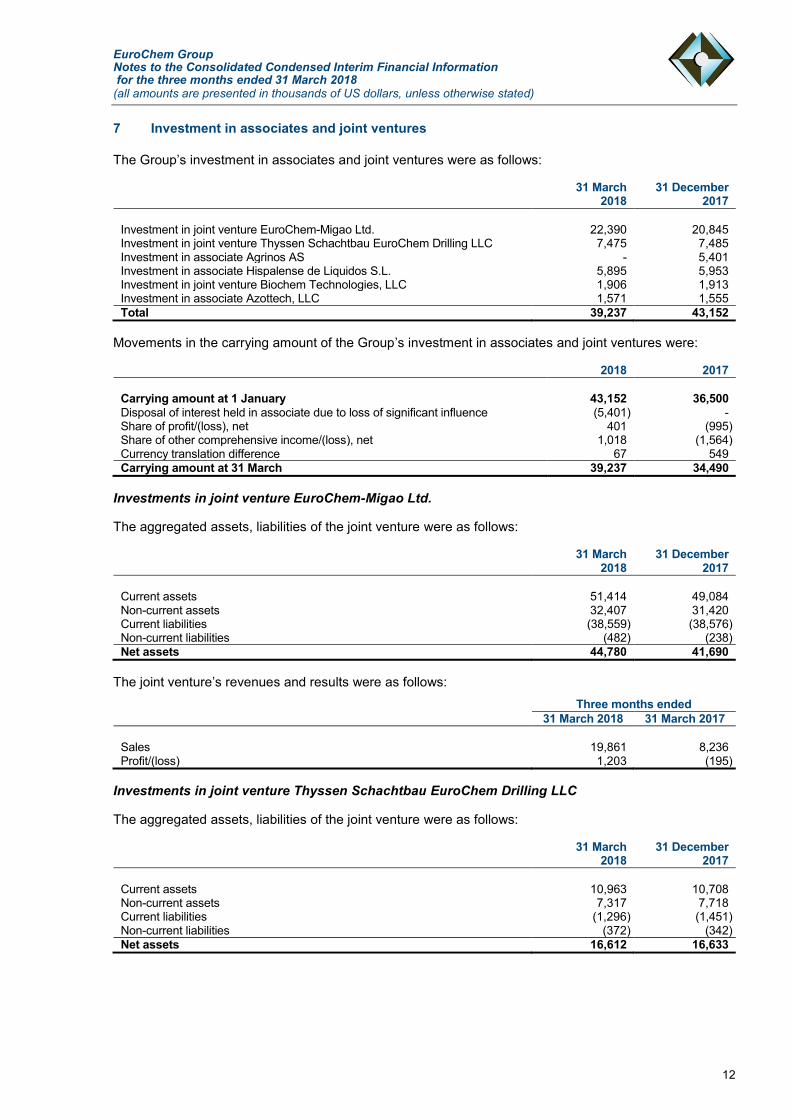
7 Investment in associates and joint ventures
The Group’s investment in associates and joint ventures were as follows:
31 March
2018 31 December
2017
Investment in joint venture EuroChem-Migao Ltd. 22,390 20,845 Investment in joint venture Thyssen Schachtbau EuroChem Drilling LLC 7,475 7,485 Investment in associate Agrinos AS - 5,401 Investment in associate Hispalense de Liquidos S.L. 5,895 5,953 Investment in joint venture Biochem Technologies, LLC 1,906 1,913 Investment in associate Azottech, LLC 1,571 1,555 Total 39,237 43,152
Movements in the carrying amount of the Group’s investment in associates and joint ventures were:
2018 2017
Carrying amount at 1 January 43,152 36,500
Disposal of interest held in associate due to loss of significant influence (5,401) - Share of profit/(loss), net 401 (995) Share of other comprehensive income/(loss), net 1,018 (1,564) Currency translation difference 67 549 Carrying amount at 31 March 39,237 34,490
Investments in joint venture EuroChem-Migao Ltd.
The aggregated assets, liabilities of the joint venture were as follows:
31 March 2018
31 December 2017
Current assets 51,414 49,084 Non-current assets 32,407 31,420 Current liabilities (38,559) (38,576) Non-current liabilities (482) (238) Net assets 44,780 41,690
The joint venture’s revenues and results were as follows: Three months ended
31 March 2018 31 March 2017
Sales 19,861 8,236 Profit/(loss) 1,203 (195)
Investments in joint venture Thyssen Schachtbau EuroChem Drilling LLC
The aggregated assets, liabilities of the joint venture were as follows:
31 March
2018 31 December
2017
Current assets 10,963 10,708 Non-current assets 7,317 7,718 Current liabilities (1,296) (1,451) Non-current liabilities (372) (342) Net assets 16,612 16,633

EuroСhem Group Notes to the Consolidated Condensed Interim Financial Information for the three months ended 31 March 2018 (all amounts are presented in thousands of US dollars, unless otherwise stated)
13
7 Investment in associates and joint ventures (continued)
The joint venture’s revenue and result were as follows:
Three months ended
31 March 2018 31 March 2017
Sales 1,895 1,790 Loss (120) (470)
Investments in joint venture Biochem Technologies LLC.
The aggregated assets, liabilities of the joint venture were as follows: 31 March 2018 31 December 2017
Current assets 342 461 Non-current assets 82 47 Current liabilities (77) (42) Non-current liabilities (786) (694) Net assets (439) (228)
The joint venture’s revenues and results were as follows:
Three months ended
31 March 2018*
Sales 7 Loss (82)
* no comparatives available as the interest in the company was acquired in April 2017
Interest in associate Agrinos AS
Effective 1 January 2018, the Group’s total minority ownership does not have significant influence over this company. As a result, the investment in Agrinos AS is no more accounted for as investment in associate and recognised as a financial instrument and presented within Other non-current asset in the consolidated interim statement of financial position as at 31 March 2018.
Investments in associate Hispalense de Liquidos S.L.
The aggregated assets, liabilities of the associate were as follows:
31 March
2018 31 December
2017
Current assets 8,576 7,964 Non-current assets 5,979 5,851 Current liabilities (7,605) (6,143) Non-current liabilities (2,069) (2,675) Net assets 4,881 4,997
The associate’s revenues and results were as follows:
* no comparatives available as the interest in the company was acquired in June 2017
Three months ended
31 March 2018
Sales 3,537 Loss (226)

EuroСhem Group Notes to the Consolidated Condensed Interim Financial Information for the three months ended 31 March 2018 (all amounts are presented in thousands of US dollars, unless otherwise stated)
14
7 Investment in associates and joint ventures (continued)
Investments in associate Azottech LLC.
The aggregated assets, liabilities of the associate were as follows:
31 March
2018 31 December
2017
Current assets 3,738 3,607 Non-current assets 1,801 1,753 Current liabilities (1,426) (1,296) Non-current liabilities (1) (4) Net assets 4,112 4,060
The associate’s revenues and results were as follows:
Three months ended
31 March 2018
Sales 3,451 Profit 8
* no comparatives available as the interest in the company was acquired in December 2017.
8 Inventories
31 March
2018 31 December
2017, adjusted
Finished goods 529,359 465,967 Materials 193,170 184,245 Catalysts 78,782 80,329 Work in progress 62,995 59,366 Less: provision for obsolete and damaged inventories (8,066) (8,285) Total inventories 856,240 781,622
9 Trade receivables, prepayments, other receivables and other current assets
31 March
2018 31 December
2017, adjusted
Trade receivables Trade receivables denominated in US$ 179,368 184,312 Trade receivables denominated in EUR 76,083 57,624 Trade receivables denominated in RUB 75,662 31,171 Trade receivables denominated in other currencies 33,402 24,211 Less: provision for impairment (8,203) (8,359) Total trade receivables 356,312 288,959 Prepayments, other receivables and other current assets Advances to suppliers 107,606 133,052 VAT recoverable and receivable 153,961 165,713 Other taxes receivable 18,576 13,434 Other receivables and other current assets 39,139 25,552 Collateral held by banks to secure derivative transactions 644 672 Interest receivable 322 272 Less: provision for impairment (12,027) (12,058) Total prepayments, other receivables and other current assets 308,221 326,637 Total trade receivables, prepayments, other receivables and other current assets 664,533 615,596

EuroСhem Group Notes to the Consolidated Condensed Interim Financial Information for the three months ended 31 March 2018 (all amounts are presented in thousands of US dollars, unless otherwise stated)
15
10 Originated loans
Note Interest rate
2018* Interest rate
2017* 31 March
2018 31 December
2017
Non-current originated loans Unsecured US$-denominated loans to related party which is entity under common control with Group 24 - 2.4% - 43,501 Unsecured US$ denominated loan to 3-rd in 2018/ associate in 2017 24 9.0% 9.0% 3,000 4,024 Unsecured US$ denominated loan to 3-rd party 5.0% 5.0% 3,000 3,000 Secured RUB-denominated loan to joint venture 11.95% 11.95% 786 521 Total non-current originated loans 6,786 51,046
* Contractual interest rate as at 31 March 2018 and 31 December 2017, respectively.
Movements in Group’s originated loans were as follows: Note 2018 2017
Balance as at 1 January 51,046 53,590
Originated loan to joint venture 264 - Originated loan to 3-rd party - 173 Intragroup elimination of loans provided to asset holder before acquisition (43,501) - Conversion of loans into interest in share capital in 3-rd party (1,024) - Foreign exchange gain/(loss), net - (3,892) Currency translation differences 1 3,927 Balance as at 31 March 6,786 53,798
11 Cash and cash equivalents, fixed-term deposits and restricted cash
31 March
2018 31 December
2017
Cash on hand* 1,165 1,798 Bank balances denominated in US$ 92,443 80,898 Bank balances denominated in RUB 8,016 11,174 Bank balances denominated in EUR 64,781 48,726 Bank balances denominated in other currencies 13,794 9,016 Term deposits denominated in US$ 2,353 42 Term deposits denominated in RUB 74,289 26,479 Term deposits denominated in other currencies 29,712 50,480 Total cash and cash equivalents 286,553 228,613
Fixed-term deposits in different currencies 151 151 Total fixed-term deposits 151 151
Current restricted cash 17,591 20,101 Non-current restricted cash 25,181 22,345 Total restricted cash 42,772 42,446
* Includes cash on hand denominated in different currencies.
Term deposits as at 31 March 2018 and 31 December 2017 were held to meet short term cash needs and had various original maturities but could be withdrawn on request without any restrictions.
Fixed-term deposits have various original maturities and can be withdrawn with an early notification and/or with a penalty accrued or interest income forfeited.
At 31 March 2018, non-current restricted cash consisted of US$ 22,534 thousand (31 December 2017: US$ 19,733 thousand) held in a debt service reserve account as required by the Usolsky Project Finance Facility Agreement (Note 13) and US$ 2,647 thousand (31 December 2017: US$ 2,612 thousand) held in bank accounts as security deposits for third parties.

EuroСhem Group Notes to the Consolidated Condensed Interim Financial Information for the three months ended 31 March 2018 (all amounts are presented in thousands of US dollars, unless otherwise stated)
16
11 Cash and cash equivalents, fixed-term deposits and restricted cash (continued)
At 31 March 2018, current restricted cash consisted of US$ 15,578 thousand received under targeted loan agreements with a state development fund (31 December 2017: US$ 18,166 thousand) and of US$ 2,013 thousand held at banks under regulatory requirements for state contracts (31 December 2017: US$ 1,935 thousand).
12 Bank borrowings and other loans received
Currency and rate Interest rate
2018* Interest rate
2017* 31 March
2018 31 December
2017
Current loans and borrowings Short-term unsecured bank loans
US$ with floating rate 3.52% - 6.06% 3.18% - 5.51% 105,846 114,559 US$ with fixed rate 2.75% 2.75% 50,000 50,000 RUB with fixed rate 8.56% - 8.90% 8.56% - 8.90% 601,489 597,988
Current portion of unsecured long-term bank loans
RUB with fixed rate 11.05% 11.05% 5,340 5,309 ARS with fixed rate 18.0% - 19.5% 18.0%-19.5% 8 11
Current portion of secured long-term bank loans
BRL with floating rate 9.90% 10.15% 107 107 BRL with fixed rate 2.94% - 12.17% 2.94% - 12.17% 2,590 2,598
Less: short-term portion of transaction costs (513) (167) Total current loans and borrowings
764,867 770,405
Currency and rate Interest rate
2018* Interest rate
2017* 31 March
2018 31 December
2017
Non-current loans and borrowings
Long-term unsecured bank loans US$ with floating rate 3.94% 3.60% - 3.85% 750,000 1,080,000 US$ with fixed rate 3.45% - 3.85% - 400,000 -
Loan-term unsecured targeted loans RUB with fixed rate 5.0% 5.0% 26,194 26,042
Long-term portion of unsecured bank loans ARS with fixed rate 19.0%-22.0% 19.0%-22.0% 12 16
Long-term portion of secured bank loans BRL with floating rate 9.90% 10.65% 18 44 BRL with fixed rate 2.94%-12.17% 2.94%-12.17% 14,056 14,667
Less: long-term portion of transaction costs (10,240) (10,564) Total non-current loans and borrowings 1,180,040 1,110,205 Total loans and borrowings
1,944,907 1,880,610
* Contractual interest rate on 31 March 2018 and 31 December 2017, respectively.

EuroСhem Group Notes to the Consolidated Condensed Interim Financial Information for the three months ended 31 March 2018 (all amounts are presented in thousands of US dollars, unless otherwise stated)
17
12 Bank borrowings and other loans received (continued)
Movements in the Group’s bank borrowings and other loans received were as follows:
Currency 2018 2017
Balance as at 1 January 1,880,610 2,381,089
Bank loans received US$ 424,204 508,902 Bank loan acquired in a business combination EUR - 6,555 Bank loans repaid US$ (363,153) (610,000) Loan repaid EUR - (6,555) Bank loans repaid BRL (377) (1,062) Bank loans repaid ARS (7) - Capitalisation and amortisation of transaction costs, net (19) 1,242 Foreign exchange (gain)/loss, net 3,302 (501) Currency translation differences, net 347 1,536 Balance as at 31 March 1,944,907 2,281,206
The Group’s bank borrowings and other loans received mature:
31 March
2018 31 December
2017
- within 1 year 764,867 770,405 - between 1 and 2 years 542,144 82,438 - between 2 and 5 years 632,102 1,021,632 - more than 5 years 5,794 6,135 Total bank borrowings and other loans received 1,944,907 1,880,610
According to IFRS 7, Financial Instruments: Disclosures, an entity shall disclose the fair value of financial liabilities. The fair value of short-term bank borrowings and borrowings bearing floating interest rates is not materially different from their carrying amounts.
The fair value of the long-term borrowings bearing a fixed interest rate is estimated based on expected cash flows discounted at a prevailing market interest rate. As at 31 March 2018 the total fair value of long-term loans with fixed interest rates was less than their carrying amount by US$ 1,689 thousand (31 December 2017: the fair value of long-term loans was less than their carrying amount by US$ 3,830 thousand).
Under the terms of the loan agreements, the Group is required to comply with a number of covenants and restrictions, including the maintenance of certain financial ratios and financial indebtedness and cross-default provisions. The Group was in compliance with covenants during the periods and as at 31 March 2018 and 31 December 2017.
Interest rates and outstanding amounts of major loans and borrowings
In 2017, the Group signed a 1-year uncommitted facility agreement with a Russian bank, the funds through this facility may be obtained in multiple currencies with a credit limit up to US$ 550 million. As at 31 March 2018, the outstanding amount was RUB 14,250 million (31 December 2017: RUB 14,250 million).
In 2017, the Group signed a US$ 750 million unsecured credit facility bearing a floating interest rate and maturing in September 2022. As at 31 March 2018, the outstanding amount was US$ 750 million (31 December 2017: US$ 750 million). In April 2018, US$ 200 million of the disbursed amount was repaid.
In 2016, the Group signed a RUB 20 billion 3-year revolving uncommitted credit agreement, bearing a fixed interest rate. As at 31 March 2018, the outstanding amount was RUB 20 billion (31 December 2017: RUB 20 billion).
In 2014, the Group signed an uncommitted revolving credit facility with a Russian bank. The funds through this facility may be obtained in multiple currencies. As at 31 March 2018, the outstanding amount was US$ 400 million (31 December 2017: US$ 330 million).
EuroСhem Group Notes to the Consolidated Condensed Interim Financial Information for the three months ended 31 March 2018 (all amounts are presented in thousands of US dollars, unless otherwise stated)
18
12 Bank borrowings and other loans received (continued)
Undrawn facilities
As at 31 March 2018, the below facilities had no outstanding balances and are available to the Group:
US$ 200 million committed revolving credit facility bearing a floating or fixed interest rate, signed in March 2018, maturing in April 2021. The drawdown was made in full amount in April 2018;
US$ 125 million uncommitted revolving credit facility bearing a floating interest rate, signed in April 2016, maturing in April 2019;
RUB 10 billion committed revolving fixed-interest rate credit agreement, signed in December 2017, maturing in December 2018 (31 December 2017: nil).
Collaterals and pledges
As at 31 March 2018, loans of a Brazilian subsidiary totaling US$ 16,771 thousands were collaterised by property, plant and equipment with the carrying value of US$ 29,700 thousand (31 December 2017: loans of US$ 17,416 thousand were collaterised by property, plant and equipment with the carrying value of US$ 30,748 thousand).
As at 31 March 2018 and 31 December 2017, all other bank borrowings and loans received listed in Note 12 were not secured.
13 Project finance
Due to the non-recourse nature of the Project Finance facilities they are excluded from financial covenant calculations in accordance with the Group’s various debt, project, finance, legal and other documents and are presented as a separate line “Project finance” in the consolidated statement of financial position.
Usolsky potash project. In 2014, the Group signed a US$ 750 million Non-recourse Project Finance Facility Agreement (“Project Financing” or the “facility”) maturing at the end of 2022 with a floating interest rate based on 3-month Libor for financing the Usolsky potash project located in the Perm region of Russia.
As at 31 March 2018, the outstanding balance was US$ 730,249 thousand shown net of transaction costs of US$ 19,752 thousand (31 December 2017: US$ 732,255 thousand shown net of transaction costs of US$ 17,745 thousand). The contractual interest rate as at 31 March 2018 was 5.79 % p.a. (31 December 2017: 5.17% p.a.).
The facility matures:
31 March 2018 31 December
2017
- less than 1 year 33,328 - - between 1 and 2 years 158,317 142,875 - between 2 and 5 years 538,604 589,380 Total 730,249 732,255
The fair value of this facility was not materially different from its carrying amount.
As at 31 March 2018, in compliance with terms of the facility agreement the Group held US$ 22,534 thousand on a debt service reserve account (31 December 2017: US$ 19,733 thousand) (Note 11).
EuroСhem Group Notes to the Consolidated Condensed Interim Financial Information for the three months ended 31 March 2018 (all amounts are presented in thousands of US dollars, unless otherwise stated)
19
13 Project finance (continued)
As at 31 March 2018 and 31 December 2017, under the terms of the Project Finance Facility Agreement 100% of the shares in EuroChem Usolsky Mining S.à r.l., the project owner and wholly-owned subsidiary of the Group, were pledged as collateral. The carrying value of the total assets of the company pledged under the facility related to the project amounted to US$ 1,900,933 thousand (31 December 2017: US$ 1,839,401 thousand).
During the three months ended 31 March 2018, the EBITDA of subsidiaries under the Usolsky potash project was negative of US$ 2,839 thousand (three months ended 31 March 2017: the EBITDA of US$ 3,499 thousand was positive solely due to foreign exchange impact).
Ammonia project in Kingisepp. In 2015, the Group signed a EUR 557 million Non-recourse 13.5-year Project Finance Facility with a floating interest rate based on 3-month Euribor to finance the construction of an ammonia plant in Kingisepp, Russia.
During the three months ended 31 March 2018, the Group received funds under the facility of EUR 58,354 thousand (US$ 71,528 thousand) (three months ended 31 March 2017: nil).
As at 31 March 2018, the outstanding balance was US$ 311,073 thousand shown net of transaction costs of US$ 113,660 thousand (31 December 2017: US$ 227,118 thousand shown net of transaction costs of US$ 115,232 thousand). The contractual interest rate as at 31 March 2018 was 1.3% p.a. (31 December 2017: 1.3% p.a.).
The facility matures:
31 March
2018 31 December
2017
- between 1 and 2 years 15,153 364 - between 2 and 5 years 101,985 76,589 - more than 5 years 193,935 150,165 Total 311,073 227,118
The fair value of this facility was not materially different from its carrying amount.
As at 31 March 2018 and 31 December 2017, under the terms of the facility agreement 100% of the shares in EuroСhem-NorthWest JSC, the project owner and wholly-owned subsidiary of the Group, were pledged as collateral. The carrying value of the total assets of the company pledged under the Facility related to the project amounted to US$ 972,569 thousand as at 31 March 2018 (31 December 2017: US$ 895,680 thousand).
During the three months ended 31 March 2018 and 31 March 2017, the EBITDA of the subsidiary under the Ammonia project was negative of US$ 812 thousand and of US$ 111 thousand, respectively.
14 Bonds issued
Currency Rate Coupon rate, p.a.
31 March 2018 31 December 2017
Maturity Fair
value Carrying amount
Fair value
Carrying amount
Current bonds
RUB Fixed 12.40% 2018 88,536 87,314 90,017 86,805 RUB Fixed 8.25% 2018 309 312 310 310 Less: transaction costs - (13) - (24) Total current bonds issued 88,845 87,613 90,327 87,091 Non-current bonds US$ Fixed 3.80% 2020 497,965 500,000 502,145 500,000 US$ Fixed 3.95% 2021 497,260 500,000 502,760 500,000 RUB Fixed 10.60% 2019 272,418 261,941 269,661 260,416 RUB Fixed 8.75% 2020 269,799 261,941 266,666 260,416 Less: transaction costs - (7,572) - (8,419) Total non-current bonds issued 1,537,442 1,516,310 1,541,232 1,512,413 Total bonds issued 1,626,287 1,603,923 1,631,559 1,599,504

EuroСhem Group Notes to the Consolidated Condensed Interim Financial Information for the three months ended 31 March 2018 (all amounts are presented in thousands of US dollars, unless otherwise stated)
20
14 Bonds issued (continued)
US$-denominated bonds and RUB-denominated bonds were listed on the Irish Stock Exchange and the Moscow Exchange, respectively. The fair value of the bonds was determined with reference to their market quotations or executable prices.
15 Derivative financial assets and liabilities
At 31 March 2018, net derivative financial assets and liabilities were:
Assets Liabilities
Non- current Current
Non- current Current
Commodity swaps - - - 15
RUB/US$ deliverable forward contracts with a nominal amount of RUB 1,845 million - 1,138 - 30 RUB/US$ non-deliverable forward contracts with a nominal amount of RUB 13,000 million - 1,580 - 471 EUR/US$ non-deliverable forward contracts with a nominal amount of EUR 117.5 million 4,620 377 - - BRL/US$ non-deliverable forward contracts with a nominal amount of US$ 25 million - 498 - - RUB/US$ contingent premium put option contracts with a nominal amount of US$ 249 million - - - 3,511 Cross currency interest rate swaps 16,727 17,741 - 58,699 Total 21,347 21,334 - 62,726
At 31 December 2017, net derivative financial assets and liabilities were:
Assets Liabilities
Non- current Current
Non- current Current
Commodity swaps - - - 30
RUB/US$ deliverable forward contracts with a nominal amount of RUB 2,470 million - 954 - - RUB/US$ non-deliverable forward contracts with a nominal amount of RUB 5,500 million - 2,530 - - EUR/US$ non-deliverable forward contracts with a nominal amount of EUR 67 million 645 - - - Cross currency interest rate swaps 6,544 15,471 - 61,791 Total 7,189 18,955 - 61,821
Movements in the carrying amount of derivative financial assets/(liabilities) were:
1 January
2018
Gain/(loss) from changes
of fair value, net
Cash (proceeds)/
payments on derivatives, net 31 March 2018
Operating activities 3,454 (589) (4,174) (1,309)
Commodity swaps (30) 15 - (15) Foreign exchange deliverable and non-deliverable forward contracts, net 3,484 2,907 (4,174) 2,217 Contingent premium put option contracts - (3,511) - (3,511) Financing activities (39,131) 31,329 (10,934) (18,736)
Foreign exchange non-deliverable forward contracts, net 645 4,850 - 5,495 Cross currency interest rate swaps, net (39,776) 26,479 (10,934) (24,231) Total derivative financial assets and liabilities, net (35,677) 30,740 (15,108) (20,045)

EuroСhem Group Notes to the Consolidated Condensed Interim Financial Information for the three months ended 31 March 2018 (all amounts are presented in thousands of US dollars, unless otherwise stated)
21
15 Derivative financial assets and liabilities (continued)
Changes in the fair value of derivatives, which are entered into for the purpose of mitigating risks linked to cash flows from operating activities of the Group, are recognised in “Other operating income/(expenses), net” (Note 20), foreign currency derivative contracts and contingent premium put option contracts are recognised in “Foreign exchange gain/(loss) from operating activities, net” and commodity swaps are recognised in “Other operating income/(expenses), net”.
Changes in the fair value of derivatives, which are entered into for the purpose of hedging the financing and investing cash flows, are recognised in “Other financial gain/(loss), net” (Note 21).
Foreign exchange non-deliverable forward contracts
Outstanding at the beginning of the year, RUB/US$ non-deliverable forward contracts with total notional amount of RUB 4,500 million matured in the period from January to March 2018.
In January 2018, the Group signed EUR/US$ non-deliverable forward contracts with total notional amount of EUR 50.5 million, which mature in the period from May 2020 to February 2021.
In the period from February to March 2018, the Group signed RUB/US$ non-deliverable forward contracts with total notional amount of RUB 12,000 million, which mature in the period from May to December 2018.
Foreign exchange deliverable forward contracts
Outstanding at the beginning of the year, RUB/US$ deliverable forward contract with a notional amount of RUB 750 million matured in March 2018.
In March 2018, the Group signed a RUB/US$ deliverable forward contract with a notional amount of RUB 125 million, maturing in August 2018.
Put option contracts
In the period from January to March 2018, the Group signed contingent premium RUB/US$ put option contracts with total notional amount of US$ 249 million, maturing in the period from July to October 2018.

EuroСhem Group Notes to the Consolidated Condensed Interim Financial Information for the three months ended 31 March 2018 (all amounts are presented in thousands of US dollars, unless otherwise stated)
22
16 Sales
The external sales by product group were:
Three months ended
31 March 2018 31 March 2017
Sales volume (thousand
metric tonnes)
Sales (thousand
US$)
Sales volume (thousand
metric tonnes)
Sales (thousand
US$)
Nitrogen products 2,104 502,424 2,244 495,097
Nitrogen fertilizers 2,101 501,799 2,239 494,445 Other products 3 625 5 652 Phosphate and complex fertilizers 1,359 545,936 1,434 501,178
Phosphate fertilizers 591 250,076 588 213,495 Complex fertilizers 671 254,479 762 256,759 Feed phosphates 97 41,381 84 30,924 Other fertilizers 55 19,513 68 20,619
Iron ore concentrate 1,422 97,262 1,665 135,337
Apatite and baddeleyite concentrates - 8,698 - 10,186
Apatite concentrate 7 1,281 28 3,478 Baddeleyite concentrate 2 7,417 2 6,708 Industrial products - 140,757 - 124,578
Wood Processing 142 52,383 132 46,830 Organic base chemicals 45 33,190 54 31,638 Explosives 138 33,350 107 26,430 Other products - 21,834 - 19,680 Hydrocarbons - - 23 7,682
Other sales - 42,279 - 41,786
Logistic services - 13,048 - 10,684 Other products - 13,901 - 17,907 Other services - 15,330 - 13,195 Total sales 1,356,869 1,336,463
17 Cost of sales
The components of cost of sales were: Three months ended
31 March 2018 31 March 2017
Raw materials 324,036 253,938 Goods for resale 296,531 261,673 Other materials 49,063 43,979 Energy 49,034 43,458 Utilities and fuel 23,670 20,876 Labour, including contributions to social funds 64,090 60,558 Depreciation and amortisation 65,469 55,571 Repairs and maintenance 10,405 10,012 Production overheads 18,650 14,802 Property tax, rent payments for land and related taxes 3,805 12,717 Impairment /(reversal of impairment)/write-off of idle property, plant and equipment, net 24 (694) Provision/(reversal of provision) for obsolete and damaged inventories, net (5) 406 Changes in work in progress and finished goods (46,421) 25,801 Other costs/(compensations), net 2,348 3,977 Total cost of sales 860,699 807,074

EuroСhem Group Notes to the Consolidated Condensed Interim Financial Information for the three months ended 31 March 2018 (all amounts are presented in thousands of US dollars, unless otherwise stated)
23
18 Distribution costs
Distribution costs were: Three months ended
31 March 2018 31 March 2017 Transportation 131,835 128,490 Labour, including contributions to social funds 23,265 18,031 Depreciation and amortisation 10,399 7,932 Repairs and maintenance 1,657 1,299 Provision/(reversal of provision) for impairment of receivables, net 1 14,282 Other costs 14,416 10,529 Total distribution costs 181,573 180,563
19 General and administrative expenses
General and administrative expenses were: Three months ended
31 March 2018 31 March 2017 Labour, including contributions to social funds 35,793 29,346 Depreciation and amortisation 3,026 3,337 Audit, consulting and legal services 3,129 4,093 Rent 1,936 1,835 Bank charges 875 1,017 Social expenditure 714 754 Repairs and maintenance 522 671 Provision/(reversal of provision) for impairment of receivables, net (222) (129) Other expenses 10,726 9,801 Total general and administrative expenses 56,499 50,725
The total depreciation and amortisation expenses included in the consolidated interim statement of profit or loss and other comprehensive income amounted to US$ 78,894 thousand (three months ended 31 March 2017: US$ 66,840 thousand).
The total labour costs (including social expenses) included in the consolidated interim statement of profit or loss and other comprehensive income amounted to US$ 123,148 thousand (three months ended 31 March 2017: US$ 107,935 thousand).
20 Other operating income and expenses
The components of other operating (income) and expenses were:
Three months ended
31 March 2018 31 March 2017
Sponsorship 2,615 3,943 (Gain)/loss on disposal of property, plant and equipment and intangible assets, net 1,707 759 Foreign exchange (gain)/loss from operating activities, net 2,003 11,924 Impairment /(reversal of impairment)/write off of idle property plant and equipment, net 136 - (Gain)/loss on sales and purchases of foreign currencies, net (836) (423) Non-recurring (income)/expenses, net 954 1,212 Other operating (income)/expenses, net (3,810) 1,345 Total other operating (income)/expenses, net 2,769 18,760

EuroСhem Group Notes to the Consolidated Condensed Interim Financial Information for the three months ended 31 March 2018 (all amounts are presented in thousands of US dollars, unless otherwise stated)
24
21 Other financial gain and loss
The components of other financial (gain) and loss were:
Three months ended
Note 31 March 2018 31 March 2017
Changes in fair value of cross currency interest rate swaps 15 (26,479) (17,030) Changes in fair value of foreign exchange non-deliverable forward contracts 15 (4,850) - Unwinding of liability from contingent consideration related to business combination 5,057 4,438 Unwinding of discount on deferred payables 160 373 Unwinding of discount on land restoration obligation 504 441 Other financial (gain)/loss, net 394 594 Total other financial (gain)/loss, net (25,214) (11,184)
22 Income tax
Three months ended
31 March 2018 31 March 2017
Income tax expense – current 39,517 61,735 Deferred income tax – origination and reversal of temporary differences, net (204) 7,636 Prior periods adjustments for income tax (317) 135 Reassessment of deferred tax assets/ liabilities due to change in the tax rate - 33,284 Income tax expense 38,996 102,790
The Group companies are subject to tax rates depending on the country of domicile.
Subsidiaries located in Russia applied a tax rate of 20.0% on taxable profits during the three months ended 31 March 2018 (three months ended 31 March 2017: 20.0%). Reduced income tax rates are applied at several subsidiaries within a range from 15.5% to 19.3% according to regional tax law and agreements with regional authorities (three months ended 31 March 2017: within a range from 15.5% to 19.3%) and at two potash project subsidiaries within a range of 0% and 5% under special investment contracts with Russian authorities (three months ended 31 March 2017: within a range from 0% and 5%).
Subsidiaries located in Europe, North and Latin Americas and Asia are subject to the income tax rates ranging from 7.8% to 35% (three months ended 31 March 2017: 7.8% to 39.5%).
Starting 1 January 2018, income tax rates in the USA and Belgium were decreased to 26.5% and 29.58%, respectively, following changes in tax legislation in December 2017 (three months ended 31 March 2017: income tax rates in the USA and Belgium were 39.5% and 33.99%, respectively). Starting 1 January 2020, the tax rate in Belgium will decrease to 25%.
Taxes on income in the interim periods are accrued using the tax rate that would be applicable to expected total annual earnings.
23 Earnings per share
Basic earnings per share are calculated by dividing the profit attributable to equity holders of the Company by the weighted average number of ordinary shares in issue during the period. The Company has no dilutive potential ordinary shares and, therefore, the diluted earnings per share equals the basic earnings per share.
Three months ended
31 March 2018 31 March 2017
Profit for the period attributable to owners of the parent 194,935 207,328 Weighted average number of ordinary shares outstanding 1,000 1,000 Earnings per share – basic and diluted 194.94 207.33
EuroСhem Group Notes to the Consolidated Condensed Interim Financial Information for the three months ended 31 March 2018 (all amounts are presented in thousands of US dollars, unless otherwise stated)
25
24 Balances and transactions with related parties
The Group’s related parties are considered to include the ultimate beneficiaries, affiliates and entities under common ownership and control within the Group and/or entities having common principal ultimate beneficiaries. The relationships with those related parties with whom the Group entered into significant transactions or had significant balances outstanding are detailed below:
Financial statements caption Nature of relationship 31 March 2018 31 December
2017
Statement of financial position Assets Non-current originated loans (Note 10) Associates - 4,024 Non-current originated loans (Note 10) Other related parties* - 43,501 Trade receivables Joint ventures 1,048 1,018 Liabilities Liability from contingent consideration related to business combination Other related parties 128,250 123,001 Trade payables Joint ventures 748 1,784 Trade payables Other related parties* 851 1,277
Three months ended
Financial statements caption Nature of relationship 31 March 2018 31 March 2017
Statement of profit or loss and other comprehensive income Sales Joint ventures 1,193 1,170 Sales Other related parties* 2.896 1,853 Distribution costs Other related parties* (1,584) (5,485)
Three months ended
Financial statements caption Nature of relationship 31 March 2018 31 March 2017
Statement of cash flows Increase/(decrease) in trade payables Other related parties* (440) 1,081 Capital expenditure on property, plant and equipment and other intangible assets Joint ventures (1,531) (1,790) Proceeds from sale of interest in associate Other related parties* - 60,749
Other related parties are represented by the companies under common control with the Group and/or by the company ultimately controlled by one of Group’s shareholders.
In the first quarter 2018, the Group acquired from the parent company of the Group, AIM Capital S.E., a company owning a land plot for a project to construct a nitrogen fertilizer plant. The company is located in the USA. The Group treats this transaction as an asset acquisition.
Management compensation. The total key management personnel compensation amounted to US$ 5,090 thousand and US$ 3,847 thousand for the three months ended 31 March 2018 and 31 March 2017, respectively. This compensation relates to eight individuals (seven individuals in January 2017 and March 2018) who are members of the Management Board, for their services in full time positions. Compensation is made up of an annual fixed remuneration plus a performance bonus accrual.

EuroСhem Group Notes to the Consolidated Condensed Interim Financial Information for the three months ended 31 March 2018 (all amounts are presented in thousands of US dollars, unless otherwise stated)
26
25 Contingencies, commitments and operating risks
i Capital expenditure commitments
As at 31 March 2018, the Group had contractual commitments for capital expenditures of US$ 782,635 thousand (31 December 2017: US$ 846,280 thousand), including amounts denominated in RUB of US$ 324,750 thousand and in EUR of US$ 302,999 thousand, which will represent cash outflows in the next 5 years according to the contractual terms.
US$ 204,241 thousand and US$ 222,950 thousand of the total amount relate to the development of potassium salt deposits and the construction of mining facilities at the Gremyachinskoe and Verkhnekamskoe potash licence areas, respectively (31 December 2017: US$ 184,809 thousand and US$ 253,578 thousand, respectively).
US$ 175,086 thousand of the total amount relates to the construction of the Ammonia Plant at Kingisepp, Russia (31 December 2017: US$ 212,928 thousand).
ii Tax legislation
Management of the Group believes that its interpretation of the tax legislation is appropriate and the Group’s tax position will be sustained.
Given the scale and international nature of the Group’s business, intra-group transfer pricing and issues such as controlled foreign corporations’ legislation, beneficial ownership, permanent establishment and tax residence issues, are inherent tax risks just as they are for other international businesses. Changes in tax laws or their application with respect to tax matters in the countries where the Group has subsidiaries could increase the Group’s effective tax rate.
The majority of the Group’s production subsidiaries are located in Russia and are required to comply with Russian tax, currency and customs legislation. The Russian tax authorities may be taking a more assertive position in their interpretation of the legislation and assessments than the Management of the Group, and it is possible that transactions and activities that have not been challenged in the past may be challenged. Fiscal periods remain open to review by the authorities in respect of taxes for three calendar years preceding the year of review with possible extension of this period under certain circumstances.
Where management believes that it is probable that certain tax positions taken by the Group may not be sustained if challenged by the tax authorities, the Group recognizes provisions for related taxes, interest and penalties. There were no such provisions recorded by the Group at 31 March 2018 and 31 December 2017.
iii Insurance policies
The Group obtains risk insurance cover as mandated by statutory requirements. The Group also holds voluntary insurance policies covering directors’ and officers’ liability (D&O insurance), general third party and product liability, physical property damage and business interruption insurance at major production plants, as well as insurance policies related to trade operations, including export shipments, and credit insurance of certain trade debtors.
The Group also carries voluntary life and accident insurance for employees.
As part of the Verkhnekamskoe potash project the Group has insured construction risks of all mining and surface facilities related to this project including third party liability during construction works. The insurance covers the risks of destruction and damage related to all facilities including those previously constructed starting from November 2014 to July 2020, including two year guarantee period. As a part of the Ammonia project at Kingisepp, the Group has insured construction risks of all facilities related to this project.
EuroСhem Group Notes to the Consolidated Condensed Interim Financial Information for the three months ended 31 March 2018 (all amounts are presented in thousands of US dollars, unless otherwise stated)
27
25 Contingencies, commitments and operating risks (continued)
iv Environmental matters
The Group’s plants and operations are subject to numerous national, state and local environmental laws and regulations. The Group’s management regularly evaluates its obligations under these laws and regulations and believes that the Group’s plants and operations are in compliance with environmental laws and regulations. The estimated cost of known environmental obligations has been provided for in this consolidated condensed interim financial information in accordance with the Group’s accounting policies.
The environmental laws and regulations are essentially complex and tend to change over time. The scope, extent and speed of this change may vary substantially in different jurisdictions. Accordingly, the Group’s management system provides for ongoing monitoring of the key trends in applicable environmental laws and regulations. Though it is inherently difficult to estimate precisely all costs associated with current and newly proposed environmental requirements, the Group’s management does not expect these costs to have a material effect on the Group’s financial position or liquidity.
v Legal proceedings
During the reporting period, the Group was involved in a number of court proceedings (both as a plaintiff and a defendant) arising in the ordinary course of business. In the opinion of management, there are no current legal proceedings or other claims outstanding which could have a material effect on the results of operations or the financial position of the Group.
vi Operating environment of the Group
The Group operates in the fertilizer industry with production assets in Russia, Lithuania, Belgium, Kazakhstan, China and sales networks in Europe, Russia, the CIS, North and Latin America, Central and South East Asia. The highly competitive nature of the market makes prices of the Group’s key products relatively volatile.
Possible deteriorating economic conditions may have an impact on management’s cash flow forecasts and assessment of the impairment of financial and non-financial assets. Debtors of the Group may also become adversely affected by the financial and economic environment, which could in turn impact their ability to repay amounts owed or fulfil obligations undertaken.
Management is unable to predict all developments which could have an impact on the industry and the wider economy and consequently what effect, if any, they could have on the future financial position of the Group. Management believes all necessary measures are being taken to support the sustainability and growth of the Group’s business in the current circumstances.
Under the terms of valid licences for the exploration and development of mineral resource deposits, the Group is required to comply with a number of conditions, including preparation of design documentation, commencement of the construction of mining facilities and commencement of the extraction of mineral resources by certain dates. If the Group fails to materially comply with the terms of the licence agreements there are circumstances whereby the licences can be revoked. Management of the Group believes that the Group faces no material regulatory risks in relation to the validity and operation of any of its licences.
Effective October 2017, certain companies of the Group in Russia and Ukraine are subject to temporary suspension of foreign economic activities in Ukraine. The Group is taking measures to both cancel the sanctions and implementing compliance controls to best international practices.